AFREC REPORT- COVID-19 and its impact on African Oil ...
23
The impact of COVID-19 on African Oil Sector A special report by AFREC on the implications on African Countries May 2020
Transcript of AFREC REPORT- COVID-19 and its impact on African Oil ...

The impact of COVID-19 on African Oil Sector
A special report by AFREC on the implications
on African Countries
May 2020

2
Index Summary and recommendations Page 3
Introduction Page 4
Historic oil production, trade and demand in Africa Page 4
COVID-19 and the global economy Page 8
COVID-19 and the global oil industry Page 9
Impact of COVID-19 on Oil Prices Page 10
Response of global oil producers Page 10
Implications for African oil producers Page 11
Implications for African petroleum product importers Page 12
Financial implications for African oil producers Page 13
Selected Country case studies Page 16
Outlook to 2021 and beyond Page 18
Recommendations to consider Page 19
Contacts Page 22
References Page 23
Tables
Table 1: Regional shares of oil production and use, and Transport use as share of total oil consumption 2018
Page 5
Table 2: Estimated reduction in oil output in 2020 for African oil producers as part of the DoC agreement of 12 April 2020
Page 11
Table 3: Historic oil prices ($/barrel) Page 21
Table 4: Average 2020 Oil price variants used for analysis ($/barrel) Page 21
Table 5: Estimated oil value loss in 2020 compared to 2019 by country and oil price ($million)
Page 21

3
SUMMARY AND RECOMMENDATIONS The Coronavirus (COVID-19) is bringing unprecedented changes to the world. Its impact
and the necessary response of governments will mean that the next one to two years at
least will be very challenging for economic and social development in all countries of the
world. One of the sectors that will see significant challenges is the oil sector, globally and
in Africa.
For African crude oil exporting countries, the expected fall in demand means that exports
of crude oil in 2020 will be down by at least 10% on average compared to recent years.
Prices are also expected to fall. At $40/barrel or lower, the value of African oil exports
could fall to levels last seen 20 years ago. These lower prices coupled with reduced
output could see Africa’s larger oil producers facing $20 billion or more of lost oil value in
2020. For consuming countries, the low per capita consumption of oil for transportation
in many African countries will not significantly gain from lower prices which limited by low
demand and a very likely limitation on storage.
The evolving situation provides a further opportunity for countries with an oil sector to
explore:
• How economies can be diversified away from an reliance on oil;
• How to maximise the local value added of the whole oil chain including exploring
the merits of:
o Investment in refining facilities;
o Increasing cross boarder trading between African countries and
investment in its relevant infrastructure; and
o Reducing oil demand in the power sector by expanding renewables.
All countries can take this opportunity to explore how to improve the efficiency of oil
consumption; where possible, take the advantage of lower prices to see if fuel subsidies
can be reduced or eliminated; and strengthen National Energy Information Systems to
support decision making and investment at the national level.

4
INTRODUCTION COVID-19 is having a dramatic impact on all countries of the world. It is causing the tragic
loss of many lives, affecting the way many people live and work and causing social and
economic change that is likely to have implications for many years to come.
Government’s actions to deal with the pandemic are changing all parts of the economy
and life and one sector seeing dramatic change is the oil sector.
This report looks at the impact of the Covid 19 pandemic on production, revenue and
demand across Africa. It does so by first examining the sector in Africa, before looking at
the global economic situation and the response taken across the oil sector. It then
considers the impact for Africa as a whole and for specific regions and example countries.
It concludes with some possible opportunities as well as some challenges for the future.
The report uses high-level analysis to illustrate the potential impact of what might happen
to oil production and consumption in Africa in 2020 and beyond. It does not make specific
detailed predictions of what will happen in individual countries, nor will the identified
actions and opportunities apply to all countries. The actions and recommendations
proposed in this report need to be studied in details at a country level. The report aims to
raise awareness to help facilitate the correct choice of action in all countries, now and in
the longer term.
HISTORIC OIL PRODUCTION, TRADE AND DEMAND IN AFRICA Africa has been producing oil for over 70 years and its output is still important globally.
African countries currently account for around 9% of the total global output of Crude oil,
down from the share of over 12% at the end of the last decade and the peak of over 13%
in the late 1960’s. Crude oil is produced in 20 African countries across all the five regions
of Africa. However, this output is concentrated in five countries namely: Algeria; Angola;
Nigeria; Egypt; and Libya, who between them account for over 80% of Africa’s oil
production.

5
Chart 1: Africa’s share of global crude oil production
Data source: OPEC
Africa is a large and diverse continent of 55 countries, so the oil situation varies by country
and region as indicted in the table 1 below. The majority of oil production occurs in the
Central, North and Western regions, whilst the main consuming regions are the North,
South and West. Specifically the West and the Eastern regions have nearly twice the
proportion of consumption compared to refinery output and as a result, those two regions
have the highest shares of petroleum product imports as a share of petroleum demand,
at over 85%.
Across Africa, although 16 countries have refineries, the majority of African produced
crude oil (75%) is exported and the majority of petroleum products used in Africa are
imported. Indeed, Africa is alone in continents of the world as a net exporter of crude oil,
but a net importer of petroleum products.
Table 1: Regional shares of oil production and use, and Transport use as share of total oil consumption 2018
Region Crude oil
production
Refinery
output
Final consumpti
on of oil products
Oil consumpti
on in Industry
Oil consumpt
ion in transport
Transport use as
share of total oil
consumption
Central 35.4% 6.3% 4.6% 6.8% 4.7% 72% Eastern 2.9% 4.9% 9.9% 14.1% 10.5% 74% Norther
n 34.3% 57.6% 43.0% 42.9% 39.2% 64%
Southern
0.1% 22.2% 19.8% 19.1% 19.2% 68%
Western 27.3% 9.1% 22.6% 17.1% 25.7% 82% Data Source: AFREC: Africa Energy Database
0.0%
2.0%
4.0%
6.0%
8.0%
10.0%
12.0%
14.0%
16.0%
1960
1962
1964
1966
1968
1970
1972
1974
1976
1978
1980
1982
1984
1986
1988
1990
1992
1994
1996
1998
2000
2002
2004
2006
2008
2010
2012
2014
2016
2018

6
Three countries provide an illustration of the importance of oil to some African countries.
The IMF reported that in 2018 the petroleum sector accounted for over 50% of gross
domestic product (GDP) of Equatorial Guinea, 80% of government revenue and more
than 94% of exports, with crude oil exports alone, $3.2 billion, accounting for 65% of
exports. In the Republic of Congo, Government data shows that the petroleum industry
accounted for an estimated 60% of the State budget, whilst in Algeria, which is also a
significant gas producer, Algeria.com has reported 95% of exports, 52% of budget
revenues and 25% of GDP are from hydrocarbons.
Chart 2: Oil production and demand in Africa
Data Source: AFREC: Africa Energy Database
Oil production across Africa reached a peak to date in 2010, with just under 500 million
tonnes produced, however, over the past ten years, production has fallen to around 400
million tonnes in 2019. Over this period, the demand for petroleum products increased
significantly, rising by 60% over the past 10 years. Therefore, with refinery output
remaining constant at around 100 million tonnes, African countries are increasing their
imports of petroleum products as shown in chart 3.
Chart 3: Africa's trade volume in crude oil and petroleum products
Data Source: AFREC: Africa Energy Database
0
100000
200000
300000
400000
500000
600000
2000 2001 2002 2003 2004 2005 2006 2007 2008 2009 2010 2011 2012 2013 2014 2015 2016 2017 2018P
2019P
1000
tonn
es
Crude oil production Refinary output Product demand
-100000
0
100000
200000
300000
400000
2000200120022003200420052006200720082009201020112012201320142015201620172018P
2019P
1000
tonn
es
Crude oil net exports Product net imports Net exports of crude oil and products

7
Chart 4 shows the estimated revenue of export sales, the cost of imports and the net
value (i.e. net export revenue – net import costs) of oil trade and thus provides an
assessment of the value of oil trade to African countries. It is an approximation, calculated
by applying annual average prices (as set out on page 22) to the trade volumes.
The calculated net value peaked at just over $275 billion in 2008, before falling as crude
production (as thus exports) fell, before rising again to around $230 billion as oil prices
rose in 2012. Subsequently oil production has levelled off at a lower rate and since 2018
prices have fallen, which combined with increased product import demand, has led to the
net value falling to just over $50 billion in 2019.
Chart 4 Value of African Oil Trade
Africa’s energy situation differs from other continents given its very high use of biofuels,
mainly biomass (charcoal and firewood), which accounts for over 50% of final energy
consumption in Africa (chart 5). As a result, other fuels contribute far less to final energy
consumption in Africa than they do globally. For example, oil accounts for 29% of final
energy consumed in Africa compared to the IEA’s figure of 41% globally. Chart 5: Final Energy Consumption, Africa, 2017
Data Source: AFREC: Africa Energy Balances
-50000
0
50000
100000
150000
200000
250000
300000
2000200120022003200420052006200720082009201020112012201320142015201620172018P
2019P
$ m
illio
n
Crude oil net exports Product net imports Net value
2%29%
6%9%
54%
Coal Oil Natural gas Electricity Biofuels/waste

8
Just under 17 % of the global population lives in Africa. However, Africa accounts for
around 9% of global final oil consumption, 4% of global oil use for transport and 3% of
industry use of oil. This is reflected in chart 6, which shows per capita consumption of oil
in Africa being around half the global level overall and about a quarter for transport.
However, one area where Africa has a higher share than seen globally is petroleum
product use for electricity generation, which is close to 9% in Africa, compared to around
3% globally.
Chart 6: Per capita consumption (toe/person) 2017
Data source: AFREC: Africa Energy Balances, IEA Key World Energy Statistics
COVID-19 AND THE GLOBAL ECONOMY
To help save lives and reduce the impact on the health service, many governments
across the world have taken unprecedented action to restrict the movement of people.
Measures taken include closing shops, restaurants, cinemas, stopping sporting activity,
encouraging people to work from home where they can and temporarily halting many
forms of manufacturing. This action, whilst needed, has resulted in a significant impact
on the economy at a national and global level.
The IMF has suggested that the global GDP could fall by 3% in 2020, compared to
estimates of around 2% growth before the outbreak of the pandemic. Evidence of the
economic impact is now appearing with countries providing estimates of GDP during the
first quarter of 2020. The US, the world's largest economy, fell at an annual rate of 4.8%
in Q1 2020, according to official figures from the US Bureau of Economic Analysis, in a
period that only saw restrictions at the end of the period. France, where restrictions have
been in place since mid-March has reported a fall of 5.6% in Q1 2020 and in China,
where restrictions were in place for much of the first quarter of 2020, the economy shrank
by 6.8% in that period.
00.10.20.30.40.50.60.7
Transport consumption Oil TFC Oil TPES Oil
World Africa

9
The transport sector has been specifically hit by the measures taken, with more than
hundred countries implementing some form of travel restrictions. Data from Flightradar24
indicates that globally around 75,000 fewer commercial flights were flying a day in April,
which is around 75% below the normal level. Travel within countries is also being
severely reduced. Currently data are limited to understand this impact, but the UK
government has published data showing that car travel was down around 60% during
April, but at times was 70% lower than normal, whilst rail and metro use in the UK were
also down in April by more than 95%.
COVID-19 AND THE GLOBAL OIL INDUSTRY Oil demand is much correlated with economic growth, as is illustrated by chart 71 below.
As the economy shrinks so too does oil demand as is seen in the early 1980s, 1990s,
and more significantly in the 2007 – 2009 financial crisis period. Therefore, as action to
address the COVID-19 pandemic creates an economic slowdown, oil demand will fall,
but given the additional action taken to reduce all transport use, the fall in oil demand that
will happen over the next year or so will be very significant.
Chart 7: Annual percentage change in world oil demand and constant price GDP
Data source OPEC, World Bank
The size of the decline in oil demand is estimated by the IEA as 9.3 mb/d in its April Oil
Market Report and as 6.9 md/d by OPEC in its April Monthly Oil Market Report (MOMR).
The actual fall will only be known once official statistics are available during 2021. What
is clear is that the fall, and from these estimates it could be around 10%, will be the
biggest decline in global oil demand ever seen and will be larger than the total reduction
1 The two series have a correlation coefficient of 0.997 which is close to prefect positive correlation
-3.0%
-2.0%
-1.0%
0.0%
1.0%
2.0%
3.0%
4.0%
5.0%
1981
1982
1983
1984
1985
1986
1987
1988
1989
1990
1991
1992
1993
1994
1995
1996
1997
1998
1999
2000
2001
2002
2003
2004
2005
2006
2007
2008
2009
2010
2011
2012
2013
2014
2015
2016
2017
2018
GDP (constant price US$ 2010) World oil demand

10
in demand seen throughout the financial crisis of 2007 -2009. For African crude oil
exporting countries a 10% fall in global demand will mean that their exports of crude oil
will be down by around 10% on average in 2020, especially as the majority of crude
exports are for markets outside Africa where use and hence the fall in demand will be the
greatest.
IMPACT OF COVID-19 ON OIL PRICES Oil prices (Brent crude price is used here) were averaging around $64/barrel in 2019,
down just over $6 on 2018 levels. In 2020, prices initially began to fall as the cooperation
between Saudi Arabia and Russia on production levels ceased, but then started to fall
dramatically as the full impact of the economic slowdown and reduced demand for oil
became evident. Average prices fell to $30 in March and further to $25 in April. The
outlook for the rest of the year and beyond is very uncertain and much will depend on
how the pandemic develops and the extent to which economies can restart, but also on
the action, described below that oil producers are taking. However, an average oil price
for 2020 of $40 or even below is quite possible.
Chart 8: Brent Crude Price
Data source: World Bank
RESPONSE OF GLOBAL OIL PRODUCERS In an effort to alleviate the current global oil market imbalance, OPEC and non-OPEC
countries participating in the Declaration of Cooperation (DoC – sometimes known as
OPEC+)2 convened two extraordinary Ministerial Meetings, on 9 and 12 April 2020.
2 African participants included the OPEC members as well as Sudan and South Sudan. More information on the DoC is available from www.opec.org/opec_web/en/publications/4580.htm
0102030405060708090
Jan-
18Fe
b-18
Mar
-18
Apr-
18M
ay-1
8Ju
n-18
Jul-1
8Au
g-18
Sep-
18O
ct-1
8No
v-18
Dec-
18Ja
n-19
Feb-
19M
ar-1
9Ap
r-19
May
-19
Jun-
19Ju
l-19
Aug-
19Se
p-19
Oct
-19
Nov-
19De
c-19
Jan-
20Fe
b-20
Mar
-20
Apr-
20
$/ba
rrel
11
During these meetings, countries present, committed to achieve a stable oil market and
agreed to reduce their overall crude oil production downwards by 9.7 mb/d, starting on 1
May 2020, for an initial period of two months. Following this, they agreed there would be
a downward adjustment of 7.7 mb/d until the end of the year and by 5.8 mb/d until 30
April 2022. To put this agreement in context, the previous reduction agreed at a meeting
on 6th December 2019 was for a reduction of 1.7 mb/d.
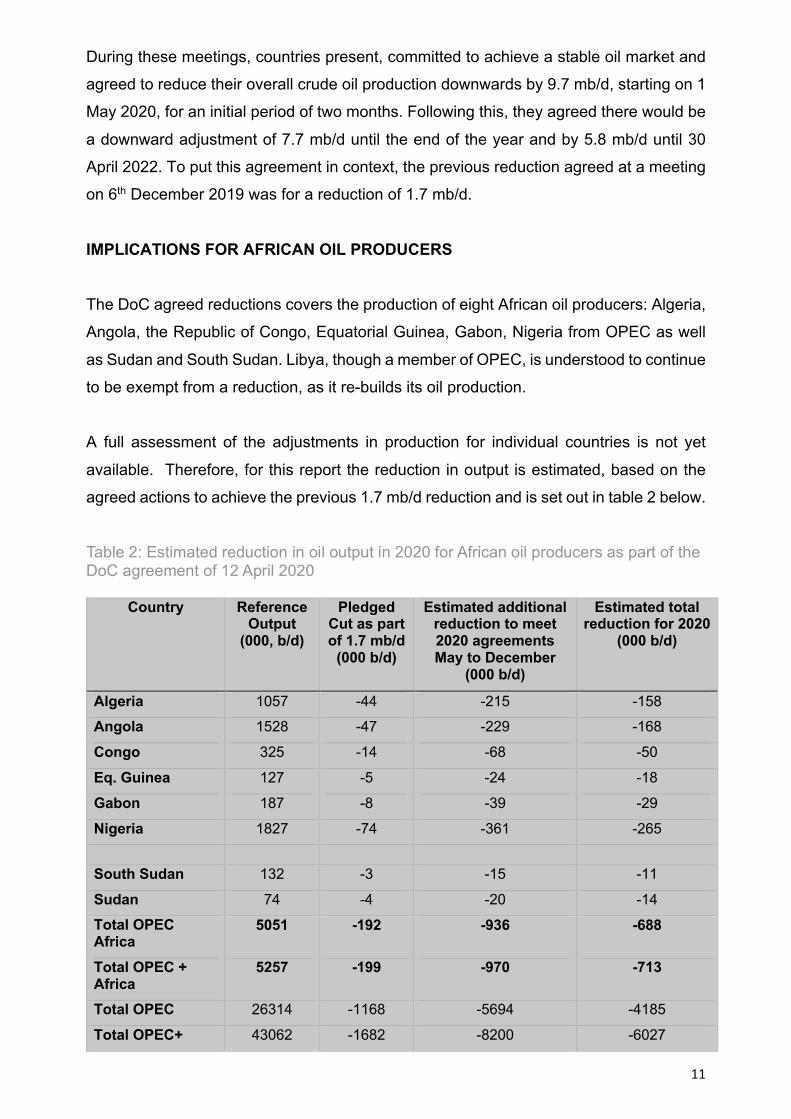
IMPLICATIONS FOR AFRICAN OIL PRODUCERS The DoC agreed reductions covers the production of eight African oil producers: Algeria,
Angola, the Republic of Congo, Equatorial Guinea, Gabon, Nigeria from OPEC as well
as Sudan and South Sudan. Libya, though a member of OPEC, is understood to continue
to be exempt from a reduction, as it re-builds its oil production.
A full assessment of the adjustments in production for individual countries is not yet
available. Therefore, for this report the reduction in output is estimated, based on the
agreed actions to achieve the previous 1.7 mb/d reduction and is set out in table 2 below.
Table 2: Estimated reduction in oil output in 2020 for African oil producers as part of the DoC agreement of 12 April 2020
Country Reference Output
(000, b/d)
Pledged Cut as part of 1.7 mb/d
(000 b/d)
Estimated additional reduction to meet 2020 agreements May to December
(000 b/d)
Estimated total reduction for 2020
(000 b/d)
Algeria 1057 -44 -215 -158
Angola 1528 -47 -229 -168
Congo 325 -14 -68 -50
Eq. Guinea 127 -5 -24 -18
Gabon 187 -8 -39 -29
Nigeria 1827 -74 -361 -265
South Sudan 132 -3 -15 -11
Sudan 74 -4 -20 -14
Total OPEC Africa
5051 -192 -936 -688
Total OPEC + Africa
5257 -199 -970 -713
Total OPEC 26314 -1168 -5694 -4185
Total OPEC+ 43062 -1682 -8200 -6027

12
Based on these estimates, output from African countries who are part of the DoC
agreement will fall by 13.6%3 during 2020. Over the whole of 2020, the reductions equate
to a fall in production of slightly over 260 million barrels of oil or around 35 million tonnes,
around 9% of all of Africa’s oil output in 2018.
African countries participating in the DoC account for around 80% of Africa’s total oil
production. For the others it is less clear what action they will take. Demand will be lower,
as noted by around 10%, so countries who can may seek to reduce output to preserve
value of the oil. Additionally in some countries, there may be production issues if workers
cannot get to sites or supplies are not available, which could also affect main producer
countries.
Data in the AFREC’s Africa Energy database showed a provisional growth for all
countries from 2018 to 2019. Given the global situation, any growth in 2020 would be
extremely unlikely, if not impossible, and a return to the production levels seen in 2018
is more likely. That is the assumption taken here for African producers not part of the
DoC, which together with the action of DoC countries is consistent with the assumed 10%
decline in exports.
IMPLICATIONS FOR AFRICAN PETROLEUM PRODUCT IMPORTERS AFREC’s African Energy Database shows that in 2019 all African countries with the
exception of Algeria, Cote d'Ivoire, Congo and Niger were net importers of petroleum
products. As the prices of petroleum products fall in line with the price of crude there will
be a small financial gain for importers. However, should global refinery output fall, for
example maintenance work if brought forward whilst prices are low or of low prices lead
to bringing forward planned closure, then product prices may well see smaller falls.
The extent to which countries can take advantage of lower prices will depend on the level
of oil demand in the country and how that is impacted by measures to reduce the impact
of COVID-19 and the country’s ability to stock products, which for most countries will be
limited.
3 The calculated country percentage reductions have been applied to oil production data from the AFREC’s Africa Energy Database for calculations in the rest of the report, taking 2018 (as a firmer figure) as the base.

13
Given the low use of oil in final consumption in most African countries, demand may not
fall by the 10% predicted globally due to COVID-19 as perhaps there is less non-essential
use of oil (for example transport for leisure). This point is reflected in the April OPEC
MOMR that anticipates a 3% fall of demand in Africa in 2020, which is the figure used in
this report for the fall in petroleum product demand and thus imports for 2020.
FINANCIAL IMPLICATIONS FOR AFRICAN OIL PRODUCERS IN 2020 Assessing the possible financial implications of the reduced demand and associated
output requires an oil price for 2020. The average price for 2020 is unknown so this report
uses three annual average prices per barrel for 2020: $55, $40 and $30. These prices
are not predictions of what the average price will be, but aim to give a range of scenarios
to help decision makers.
Taking an average of $40/bbl for crude oil and related average product price of $49/bbl
(see page 22); chart 9 below extends the data shown in chart 4 to 2020 by applying a
$40/bbl price estimate to the calculated export and import figures as described above.
Chart 10 then shows some possible variations using $55, $40 and $30/bbl for the average
crude oil price in 2020 and associated prices for petroleum products. At $40/bbl the net
value of exports to African countries would around $31 billion, which would be is its lowest
value for the past 20 years. This level would be less than half the level seen in 2018, and
just over one tenth of the peak value seen in 2008.
Chart 9: Value of African Oil Trade, including 2020 estimate
-50000
0
50000
100000
150000
200000
250000
300000
20002001
20022003
20042005
20062007
20082009
20102011
20122013
20142015
20162017
2018 P2019 P
2020E
$ m
illio
n
Crude oil net exports Product net imports Net value

14
Chart 10: Value of African Oil Trade, 2017 to 2020 for 3 oil price scenarios for 2020
The analysis above is in current terms, but the situation perhaps becomes starker in real
terms as shown in Chart 11 for export vales. At $40/bbl the real value of African crude oil
exports in 2020 is estimated, in constant 2010 prices, at around $67 billion, which is 40%
lower than in 2019, nearly 60% lower than the average of the past 20 years and a quarter
of the peak value seen in 2008.
Chart 11: Net crude oil export revenue at constant 2010 prices under a $40 scenario for 2020
All African oil producers will see a significant downward revenue impact in 2020. This is
illustrated in chart 12, which show the estimated loss of oil value by country calculated
as the value of oil produced in 2019 less the value produced in 2020 for different annual
average oil prices in 2020. The chart is shown in two parts to reflect the size of production.
Country level data are presented in table 5 on page 23.
020000400006000080000
100000120000140000160000
2017 2018 P 2019 P 2020 E Crude$55, Product
Ave $69
2020 E Crude$40, product
ave $49
2020 E Crude$30, product
Ave $31
$mill
ion
Value of Crude oil net exports Costs of Product net imports Net "revenue"
0
50000
100000
150000
200000
250000
300000
20002001
20022003
20042005
20062007
20082009
20102011
20122013
20142015
20162017
2018 P2019 P
2020E
$ m
illio
n

15
Of course, this will not be the direct loss to the country, as revenues received by countries
will depend on actual exports, the tax and operating framework in each country, the mix
of national and international businesses operating in the country and the variation in
production costs amongst many other variables. Likewise, this analysis uses average
prices rather than specific ones as would be possible at a country level. However, it aims
to provide an estimate of revenue that will not be generated from exports or be available
for governments for direct receipt, taxation or royalty payments.
Should oil prices could be 40/bbl or lower, this assessment indicates that Algeria, Angola
and Nigeria could each be facing $20 billion or more lost oil value in 2020. Of this around
$3 billion is likely to be lost export revenue, the actual realisation of the rest will depend
on individual country laws, regulations and taxes.
Chart 12a Estimated oil value loss in 2020 compared to 2019, by oil price, larger oil producers
Chart 12b Estimated oil value loss in 2020 compared to 2019, by oil price, other oil producers
-
5,000
10,000
15,000
20,000
25,000
30,000
35,000
Algeria/Algérie Angola/Angola Egypt/Egypte Libya/Libye Nigeria/Nigéria
$ m
illio
n
$55 $40 $30
- 500
1,000 1,500 2,000 2,500 3,000 3,500 4,000
Cameroon/C
amero…
Chad/Tc
had
Congo/C
ongo
Eq. G
uinea/G
uinée…
Gabon/G
abon
Ghana/G
hana
South Su
dan/Su
d…
Sudan
/Soudan
Other
$ m
illio
n
$55 $40 $30

16
Few other estimates of the financial impact have been produced for countries. However,
the Africa Centre for Energy Policy (ACEP) has predicted a significant fall in the
Government of Ghana’s projected revenue for the year 2020 of $824 million with prices
of $40 compared to planned price of $63, which is close to the estimate provided here.
SELECTED COUNTRY CASE STUDIES
Significant oil based economies - Equatorial Guinea Given the analysis above, oil-producing countries will face a significant loss of revenue
in 2020. This will be felt more for countries where oil is a major part of the economy and
especially where all reliance in on crude oil production and exports. One example country
for which 2020 and beyond will be a very difficult period is Equatorial Guinea.
Equatorial Guinea is the largest oil producer in Africa without its own refinery, and so
relies on crude production and exports for all of its oil based revenue. As noted on page
5 the oil industry accounted for at least around half of gross domestic product (GDP) and
the majority of exports. The AFDB have reported that real GDP is estimated to have
shrunk by 4.1% in 2019 after falling by 6.1% in 2018 due to reduced activity and prices
in the oil sector. As such a potential value of oil loss of up to $2.5 billion (see table 5 page
23) reflecting lower output and lower prices, will be very significant and could see GDP
being back (in real terms) to levels of 15 years ago. That full amount is unlikely to be
directly lost, but, assuming Equatorial Guinea’s exports see no further reduction than the
expected overall 10% fall it would see a direct loss of around $300 million in export
revenue. In the short-term, there will be limited opportunity to avoid a serious economic
decline in 2020. However, where possible, countries like Equatorial Guinea with
economies largely based around oil should continue to look at ways of diversifying their
economy.
More mixed economies, with some oil/product output – Zambia Countries that have a very limited opportunity to reduce the impact of the economic
downturn will be few, but perhaps those with refining capacity that are not also significant
oil producers and thus exporters might just do so in a limited way. Senegal is one example
and Zambia another.
Zambia imports crude oil to the Indeni refinery for processing which, with imports,
provides fuel for local demand, with a small amount of product being exported. Chart 13
indicates that there may be scope, if economically viable, for a limited increase (to levels

17
used in 2010 and 2012) in throughput in the country’s refinery. If viable, this would
increase the ability to purchase cheap crude oil and create product for internal use (and
thus reduce import needs) or perhaps less likely export and thus create some limited
additional value for the country. For countries that can, looking to maximise operation of
their own refineries to keep more of the value added in country may create some small
benefit.
Chart 13: Refinery operations Indeni refinery, Zambia
Data Source: Compendium of Environmental Statistics, Zambia Statistical Agency and Zambia Energy Regulatory Board The need to look at enhancing domestic refining has been reflected in the policies of
major oil exporters, for example in Nigeria where imports of products account for the
majority of local consumption The Federal Government of Nigeria has launched initiatives
to support the establishment of private mini (modular) refineries. One of the initiatives is”
Big Win 4” of the “7 Big Wins” Initiative (2015 – 2019) which focuses on expansion of
domestic refining capacity and rehabilitation of existing refineries. In addition the National
Gas Policy which was approved by the Federal Executive Council in June 2017 coupled
with the National Petroleum policy of the 19th July 2017 aim to provide the framework for
creation of a strong refining hub in Nigeria.
Non-oil economies - African small Island States The majority of Africa countries, 35, have no petroleum industry and simply import
product for final consumption. As shown above (chart 6) oil consumption per capita use
for transportation is low in many African countries so any gain from lower prices will be
limited by low demand and a very likely limitation on storage.
Around 20 countries have oil-fired electricity generation as their main source of power or
the largest (and only) source of fossil fuel used for electricity generation (the main
exception is in Southern Africa, where coal is the major fossil fuel). These countries will
0
200
400
600
800
2004 2005 2006 2007 2008 2009 2010 2011 2012 2013 2014 2015 2016 2017
Kton
nes
Inputs Output
18
see a reduction in the cost of imported fuel, but to some the full price fall may not be
realised due to additional transports costa and associated margins. One specific
example of this is the smaller Island States of Africa, where the shipping and distribution
costs may mean that they do not receive the full lower price fall seen elsewhere.
Islands states, whose economies are based on tourism, will face a very challenging time
in 2020, for example in the Seychelles over half of GDP and a quarter of jobs are linked
to tourism. However, they also have abundant renewable resources that could be
developed to reduce dependence on oil as part of the country’s energy transition.
Looking to explore this now, when oil prices are lower may seem counterintuitive, but
against an average oil price of the past decade of around $80/bbl the situation may
change. Therefore, if any revenue saved from oil purchases at lower prices can be used
to explore alternative sources of fuel for generation it could help islands, or countries in
Africa relying on oil-fired generation, to cope better in the future, when at some point oil
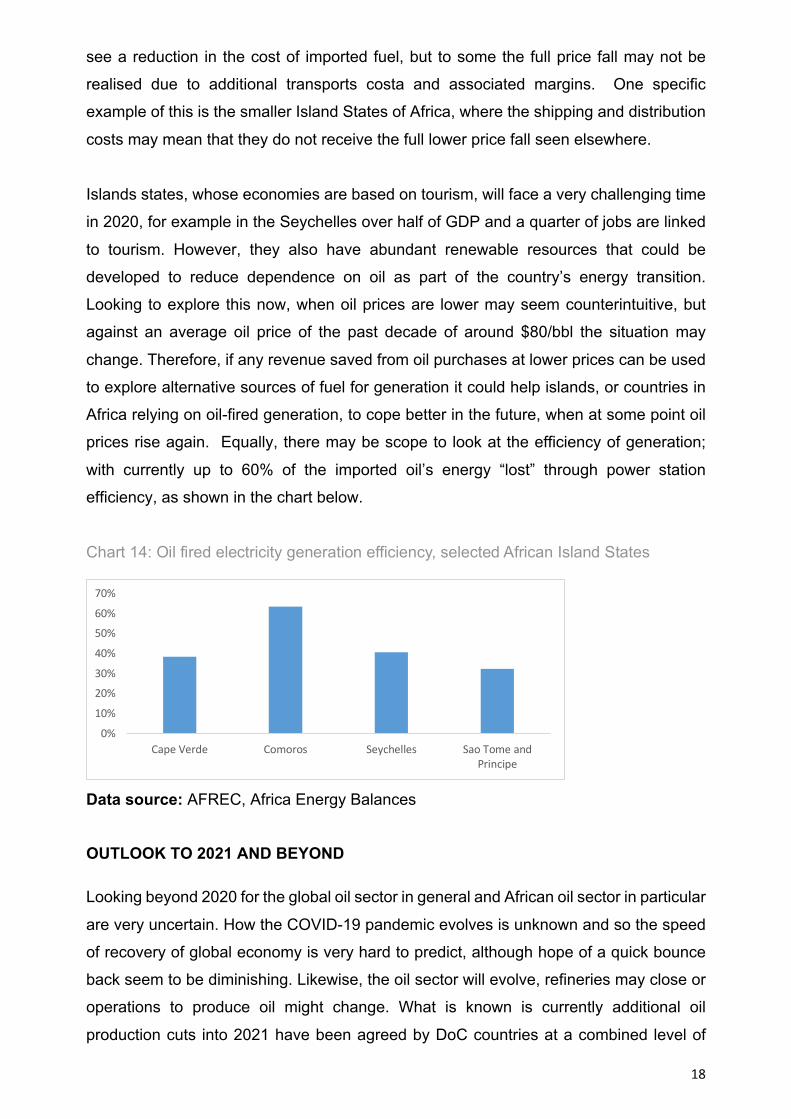
prices rise again. Equally, there may be scope to look at the efficiency of generation;
with currently up to 60% of the imported oil’s energy “lost” through power station
efficiency, as shown in the chart below.
Chart 14: Oil fired electricity generation efficiency, selected African Island States
Data source: AFREC, Africa Energy Balances
OUTLOOK TO 2021 AND BEYOND
Looking beyond 2020 for the global oil sector in general and African oil sector in particular
are very uncertain. How the COVID-19 pandemic evolves is unknown and so the speed
of recovery of global economy is very hard to predict, although hope of a quick bounce
back seem to be diminishing. Likewise, the oil sector will evolve, refineries may close or
operations to produce oil might change. What is known is currently additional oil
production cuts into 2021 have been agreed by DoC countries at a combined level of
0%
10%
20%
30%
40%
50%
60%
70%
Cape Verde Comoros Seychelles Sao Tome andPrincipe

19
5.8mb/d, whilst smaller than the 2020 output reductions, is still over 3 times the
adjustment to rebalance the market as was agreed before COVID-19.
It therefore looks likely that 2021 will be very different from 2019, but understanding how
and what that means at a continental or country level is complex. Countries that actively
choose to explore options and assess how they are equipped to deal with the challenges
may ultimately be those who recover and develop in the best way.
RECOMMENDATIONS The next one to two years will be very challenging for all countries of the world. However,
the situation may provide an opportunity for change. The evolving situation provides a
further opportunity for countries with an oil sector to explore such as:
• How economies can be diversified away from an reliance on oil;
• How to maximise the local value added of the whole oil chain by exploring where
relevant
o investment in refining facilities;
o increasing cross boarder trading and investment in its relevant
infrastructure; and
o reducing oil demand in the power sector by expanding renewables.
These points are perhaps more suited to some countries rather than all. However, there
are two points that should apply to all countries.
• The first is to continue (or start) efforts to improve energy efficiency of the use of
petroleum products (and indeed more generally). With nearly all African country
being net importers of finished product, measures to improve the efficiency of use
and thus recue import demand and lower the purchasing fuel will provide benefits.
• The second is to explore the possibility to reduce or remove oil products subsidies
and oil based electricity generated taking the opportunity of lower prices, which
may continue beyond 2021. The Department of Petroleum Resources of Nigeria
reflected upon the situation in its 2018 Annual report, noting, “The pump prices of
these products except Automotive Gas Oil (Diesel) are subsidized by the
government. It is believed that the Federal Government of Nigeria spends over
200 billion Naira every year to subsidized petroleum products. These monies
would have been used to provide infrastructure or provide better quality education
or health facilities”.

20
It is also recommended that the African countries should strengthen or, if needed,
establish a dedicated National Energy Information System in order to collect and analysis
the energy data and energy efficiency indicators for all sectors. This will support decision
making and investment at the national level to meet the aspirations of the agenda 2063
of African Union and the sustainable development goals (SDG) of the United Nations
as per the African charter of statistics adopted by the Heads of State and Government
of the African Union summit held in Addis Ababa, Ethiopia, in February 2009.

21
TABLES Oil prices Table 3: Historic oil prices ($/barrel)
2000 2001 2002 2003 2004 2005 2006 2007 2008 2009 Crude oil (Brent)
18.1 29.2 26.1 26.4 39.9 55.2 65.5 74.4 104.2 61.4
Average product import price
35.4 30.9 29.9 36.2 49.0 69.2 81.1 88.6 117.6 71.1
2010 2011 2012 2013 2014 2015 2016 2017 2018 2019 Crude oil (Brent)
81.4 112.4 113.5 111.4 103.4 52.3 44.3 55.2 71.5 64.0
Average product import price
90.4 124.5 129.7 125.1 114.7 70.6 56.8 68.6 84.9 77.4
Crude oil is Brent, CIF basis. Product prices are a weighted average based on African imports of petroleum products. Sources: EIA, World Bank, IEA
Table 4: Average 2020 Oil price variants used for analysis ($/barrel)
Crude oil 55 40 30 Average product import price 68.6 49.0 30.9
Table 5: Estimated oil value loss in 2020 compared to 2019 by country and oil price
($million)
Oil Price $55 $40 $30 Algeria/Algérie 11,994 18,954 23,594 Angola/Angola 13,198 22,104 28,041 Egypt/Egypte 2,919 6,824 9,428 Libya/Libye 2,068 4,457 6,050 Nigeria/Nigéria 13,229 22,537 28,743 Cameroon/Cameroun 425 964 1,323 Chad/Tchad 620 1,369 1,868 Congo/Congo 1,750 2,959 3,764 Eq. Guinea/Guinée Eq.
1,466 2,535 3,248
Gabon/Gabon 1,360 2,307 2,938 Ghana/Ghana 362 883 1,230 South Sudan/Sud Soudan
789 1,421 1,842
Sudan/Soudan 781 1,242 1,549 Other 536 1,294 1,800 Total 51,496 89,850 115,420

22
The report has been produced to help African countries understand the situation, which
may assist them in taking action. It is a summary report and more detailed analysis will
be needed at individual country level, to help this the report uses freely available data
and sources to assist country level analysis.
The report uses AFREC’s Africa Energy Database as the main source of information for
Africa. This reflects the work underway across African countries to enhance their energy
data. This work needs to continue under AFREC’s African Energy Information System
(AEIS) programme and be supported by governments to ensure that all African countries
have the data they need to plan and respond to national and international events.
Comments on the report are welcome and can be sent to:
Thanks go to the statisticians in all African countries working to produce the energy data
that we based this report on and colleagues across African institutions for their
comments. Any mistakes or misinterpretation, are of course unintended by AFREC.
About the African Energy Commission (AFREC) AFREC is a specialized agency of the African Union (AU), under the Commission for
Infrastructure and Energy that is in charge of coordinating, harmonizing, protecting,
conserving, rational exploitation, commercializing and integrating energy resources on
the African continent.
AFREC was created by African Heads of States and Governments’ decision of 37th
Summit of the Organization of African Unity (OAU) in 2001 in Lusaka, Zambia and was
launched by the African Union Ministers in charge of energy in 2008 in Algiers, Algeria.
Some of AFREC’s mandates include the following among other energy related issues as
stated on the AFREC convention: (1) Developing policies, strategies, research and plans
based on Member states, sub-regional, regional and continental development priorities
and recommend their implementation; (2) Designing, creating and updating an energy
continental database and facilitate the rapid dissemination of information and exchange
of information among Member States, sub-regional, regional and continental institutions;
(3)Providing technical support, mobilize financial and technical support, while providing
capacity building to the Member States, sub-regional, regional and continental institution
in the energy sector.

23
REFERENCES
Africa Centre for Energy Policy (ACEP) https://s3.amazonaws.com/new-acep-static1/publications/ACEP_Implications+of+low+oil+price+on+oil+producing+countries.pdf AFDB www.afdb.org/en/countries/central-africa/equatorial-guinea/equatorial-guinea-economic-outlook Africa Energy Balances: https://afrec-energy.org/publications/afrec-africa-energy-balance-2019-en.pdf Africa Energy Database: https://afrec-energy.org/publications/afrec-africa-energy-database-2019-en-fr.pdf Alergia.com www.algeria.com/business/economy/ BBC news https://www.bbc.com/news Bloomberg https://www.bloomberg.com/graphics/opec-production-targets/ Department of Petroleum Resources - 2018 Nigerian Oil and Gas Annual Report https://www.dpr.gov.ng/ Flightradar24 www.flightradar24.com/data/statistics IEA: Key World Energy Statistics https://www.iea.org/events/key-world-energy-statistics-2019 IEA: Oil Market Report – online summary https://www.iea.org/reports/oil-market-report-april-2020 IMF https://www.imf.org/en/Publications/CR/Issues/2019/12/20/Republic-of-Equatorial-Guinea-Request-for-an-Extended-Arrangement-Under-the-Extended-Fund-48904 https://www.imf.org/en/Publications/WEO/Issues/2020/04/14/weo-april-2020 OPEC: Annual Statistical Bulletin https://asb.opec.org/ OPEC Monthly Oil Market Report (MOMR) www.opec.org/opec_web/en/publications/338.htm World Bank https://data.worldbank.org/indicator/ www.worldbank.org/en/country/algeria/publication/economic-brief-july-2016 www.indexmundi.com/commodities/?commodity=crude-oil&months=60