AFrameworkforObjectRecognitioninConstructionUsing … · I also thank Mr. Bob Simmons and Ms. Kelly...
125
A Framework for Object Recognition in Construction Using Building Information Modeling and High Frame Rate 3D Imaging Alan M. Lytle Dissertation submitted to the Faculty of the Virginia Polytechnic Institute and State University in partial fulfillment of the requirements for the degree of Doctor of Philosophy in Civil and Environmental Engineering Sunil Sinha, Chair Yvan J. Beliveau Tanyel M. T. Bulbul Mani Golparvar-Fard April 15, 2011 Blacksburg, Virginia Keywords: Building Information Modeling, BIM, Industry Foundation Classes, IFC, 3D Imaging, Object Recognition Copyright 2011, Alan M. Lytle
Transcript of AFrameworkforObjectRecognitioninConstructionUsing … · I also thank Mr. Bob Simmons and Ms. Kelly...

A Framework for Object Recognition in Construction UsingBuilding Information Modeling and High Frame Rate 3D Imaging
Alan M. Lytle
Dissertation submitted to the Faculty of theVirginia Polytechnic Institute and State University
in partial fulfillment of the requirements for the degree of
Doctor of Philosophyin
Civil and Environmental Engineering
Sunil Sinha, ChairYvan J. Beliveau
Tanyel M. T. BulbulMani Golparvar-Fard
April 15, 2011Blacksburg, Virginia
Keywords: Building Information Modeling, BIM, Industry Foundation Classes, IFC,3D Imaging, Object Recognition
Copyright 2011, Alan M. Lytle
A Framework for Object Recognition in Construction UsingBuilding Information Modeling and High Frame Rate 3D Imaging
Alan M. Lytle
(ABSTRACT)
Object recognition systems require baseline information upon which to compare sensed datato enable a recognition task. The ability to integrate a diverse set of object recognitiondata for different components in a Building Information Model (BIM) will enable manyautonomous systems to access and use these data in an on-demand learning capacity, andwill accelerate the integration of object recognition systems in the construction environment.This research presents a new framework for linking feature descriptors to a BIM to supportconstruction object recognition. The proposed framework is based upon the Property andExternal Reference Resource schemas within the IFC 2x3 TC1 architecture. Within thisframework a new Property Set (Pset ObjectRecognition) is suggested which provides anon-demand capability to access available feature descriptor information either embedded inthe IFC model or referenced in an external model database. The Property Set is extensible,and can be modified and adjusted as required for future research and field implementation.With this framework multiple sets of feature descriptors associated with different sensingmodalities and different algorithms can all be aggregated into one Property Set and assignedto either object types or object instances.

This work is dedicated to my best friend and loving wife — Andie.
iii

Acknowledgements
First and foremost the efforts of Dr.Mike Vorster of Virginia Tech were the bedrock of thisresearch effort. He allowed me to explore options and craft a unique research approachduring my employment at the National Institute of Standards and Technology (NIST). Thisresearch would not have been possible without his initial mentorship.
I am indebted to my dissertation committee members: Dr. Sunil Sinha, Dr.Yvan Beliveau,Dr.Mani Golparvar-Fard and Dr.Tanyel Bulbul. They expertly guided me to a singularcontribution in the field, and patiently supported the requirements of working full-timewhile completing my research and dissertation during off-hours. Ms. Lindy Cranwell wentabove and beyond in her role as Graduate Programs Coordinator.
My colleagues at NIST provided significant assistance during the course of this research.Ms.Gerry Cheok and Dr.Kamel Saidi provided guidance and information regarding thetesting and evaluation of 3D imaging systems. Dr.Marek Franaszek, Dr. Itai Katz, Dr. TsaiHong and Dr.Roger Eastman provided assistance regarding object recognition and pointcloud analysis. Mr.Robert Lipman’s expertise in information modeling with CIS/2 andIFC was crucial. I would also like to thank Dr. Jon Martin and Dr. Shyam Sunder for theoverall support provided by NIST. More important than the technical and material assistancethough was the continued friendship, encouragement, and inspiration this team provided.
I thank Zachary Lytle for lending his critical expertise in the Java programming language.I also thank Mr. Bob Simmons and Ms. Kelly Luttrell of ConXtech for providing the scalemodel column used for the target object.
During the last year of this dissertation research I left NIST for the private sector at NorthropGrumman Corporation (NGC). I would not have been able to complete this research withoutthe support and encouragement of my new colleagues at NGC. The leadership supportprovided by Mr.David Perry and Mr.Tom Jones was vital. Mr.Mark Myers kept me movingforward.
Most of all I would like to thank my wife Andie, and my children Nick, Drew and Allie. Theirlove, support and understanding made this journey possible. My work was their sacrifice,and for that sacrifice I am eternally grateful.
iv
Contents
1 Introduction 1
1.1 Vision . . . . . . . . . . . . . . . . . . . . . . . . . . . . . . . . . . . . . . . 1
1.2 Background . . . . . . . . . . . . . . . . . . . . . . . . . . . . . . . . . . . . 2
1.2.1 NIST/AISC Steel Construction Workshop . . . . . . . . . . . . . . . 3
1.2.2 CII - Leveraging Technology to Improve ConstructionProductivity . . . . . . . . . . . . . . . . . . . . . . . . . . . . . . . . 5
1.2.3 The NRC Construction Productivity Report . . . . . . . . . . . . . . 7
1.2.4 Summary . . . . . . . . . . . . . . . . . . . . . . . . . . . . . . . . . 8
1.3 Motivation . . . . . . . . . . . . . . . . . . . . . . . . . . . . . . . . . . . . . 8
1.4 Statement of the Problem . . . . . . . . . . . . . . . . . . . . . . . . . . . . 11
1.5 Research Goal and Objectives . . . . . . . . . . . . . . . . . . . . . . . . . . 12
1.6 Document Overview . . . . . . . . . . . . . . . . . . . . . . . . . . . . . . . 13
2 Literature Review 14
2.1 BIM . . . . . . . . . . . . . . . . . . . . . . . . . . . . . . . . . . . . . . . . 15
2.1.1 The Need for Interoperability . . . . . . . . . . . . . . . . . . . . . . 15
2.1.2 What is a BIM? . . . . . . . . . . . . . . . . . . . . . . . . . . . . . . 15
2.1.3 Product Data Models . . . . . . . . . . . . . . . . . . . . . . . . . . . 17
2.2 3D Imaging . . . . . . . . . . . . . . . . . . . . . . . . . . . . . . . . . . . . 22
2.2.1 Introduction . . . . . . . . . . . . . . . . . . . . . . . . . . . . . . . . 22
2.2.2 3D Imaging in Construction . . . . . . . . . . . . . . . . . . . . . . . 25
2.3 Object Recognition . . . . . . . . . . . . . . . . . . . . . . . . . . . . . . . . 30
v

2.3.1 Introduction . . . . . . . . . . . . . . . . . . . . . . . . . . . . . . . . 30
2.3.2 Image Processing . . . . . . . . . . . . . . . . . . . . . . . . . . . . . 33
2.3.3 Image Analysis . . . . . . . . . . . . . . . . . . . . . . . . . . . . . . 39
2.3.4 Image Understanding . . . . . . . . . . . . . . . . . . . . . . . . . . . 43
2.3.5 The Challenge of Real-Time . . . . . . . . . . . . . . . . . . . . . . . 46
2.4 Construction Automation: Object Recognition with BIM and 3D Imaging . . 49
2.4.1 Construction Object Recognition . . . . . . . . . . . . . . . . . . . . 49
2.4.2 Construction Equipment Control . . . . . . . . . . . . . . . . . . . . 53
2.5 Summary . . . . . . . . . . . . . . . . . . . . . . . . . . . . . . . . . . . . . 59
3 Statement of the Problem 64
3.1 Existing State of Research and Practice . . . . . . . . . . . . . . . . . . . . . 65
3.2 Research Problem . . . . . . . . . . . . . . . . . . . . . . . . . . . . . . . . . 66
3.3 Assumptions and Constraints . . . . . . . . . . . . . . . . . . . . . . . . . . 67
4 Approach 70
4.1 The IFC Object Recognition Framework . . . . . . . . . . . . . . . . . . . . 70
4.1.1 Property Resources . . . . . . . . . . . . . . . . . . . . . . . . . . . . 71
4.1.2 Property Sets . . . . . . . . . . . . . . . . . . . . . . . . . . . . . . . 72
4.1.3 Proposed Object Recognition Property Set . . . . . . . . . . . . . . . 74
4.2 Implementation . . . . . . . . . . . . . . . . . . . . . . . . . . . . . . . . . . 76
4.2.1 Sensor System . . . . . . . . . . . . . . . . . . . . . . . . . . . . . . . 76
4.2.2 Target Object . . . . . . . . . . . . . . . . . . . . . . . . . . . . . . . 84
4.2.3 Object Detection Methodology . . . . . . . . . . . . . . . . . . . . . 86
4.3 Demonstration . . . . . . . . . . . . . . . . . . . . . . . . . . . . . . . . . . 90
4.3.1 Architecture . . . . . . . . . . . . . . . . . . . . . . . . . . . . . . . . 90
4.3.2 SIFT Training . . . . . . . . . . . . . . . . . . . . . . . . . . . . . . . 91
4.3.3 Object Recognition Property Set . . . . . . . . . . . . . . . . . . . . 92
4.3.4 Object Detection Testing . . . . . . . . . . . . . . . . . . . . . . . . . 95
vi
4.4 Results . . . . . . . . . . . . . . . . . . . . . . . . . . . . . . . . . . . . . . . 96
4.4.1 Sensor Range Testing . . . . . . . . . . . . . . . . . . . . . . . . . . . 96
4.4.2 Object Detection Testing . . . . . . . . . . . . . . . . . . . . . . . . . 97
5 Conclusions 101
5.1 Findings . . . . . . . . . . . . . . . . . . . . . . . . . . . . . . . . . . . . . . 101
5.2 Contribution . . . . . . . . . . . . . . . . . . . . . . . . . . . . . . . . . . . . 102
5.3 Recommendations . . . . . . . . . . . . . . . . . . . . . . . . . . . . . . . . . 102
vii
List of Figures
1.1 Sensor-guided steel erection with the NIST RoboCrane. . . . . . . . . . . . 10
2.1 The IFC2x3 architecture. . . . . . . . . . . . . . . . . . . . . . . . . . . . . . 21
2.2 The processes of object recognition. . . . . . . . . . . . . . . . . . . . . . . . 32
2.3 Transforming an image to actionable information. . . . . . . . . . . . . . . . 34
2.4 Image processing. . . . . . . . . . . . . . . . . . . . . . . . . . . . . . . . . . 35
2.5 Image analysis. . . . . . . . . . . . . . . . . . . . . . . . . . . . . . . . . . . 39
2.6 Image understanding. . . . . . . . . . . . . . . . . . . . . . . . . . . . . . . . 44
4.1 The IFC2x3 TC1 property resource schema. . . . . . . . . . . . . . . . . . . 72
4.2 The IFC2x3 TC1 property set schema. . . . . . . . . . . . . . . . . . . . . . 74
4.3 The proposed object recognition property set. . . . . . . . . . . . . . . . . . 77
4.4 The Pset ObjectRecognition schema. . . . . . . . . . . . . . . . . . . . . 78
4.5 The Mesa Imaging AG SwissRanger 4000. . . . . . . . . . . . . . . . . . . . 80
4.6 The SR4000 sensor interface software. . . . . . . . . . . . . . . . . . . . . . 81
4.7 Sensor testing. . . . . . . . . . . . . . . . . . . . . . . . . . . . . . . . . . . 83
4.8 Target segmentation. . . . . . . . . . . . . . . . . . . . . . . . . . . . . . . 83
4.9 The sensor interface mixed pixel filter. . . . . . . . . . . . . . . . . . . . . . 85
4.10 The target object. . . . . . . . . . . . . . . . . . . . . . . . . . . . . . . . . 86
4.11 Object detection sequence (A) . . . . . . . . . . . . . . . . . . . . . . . . . . 88
4.12 Object detection sequence (B) . . . . . . . . . . . . . . . . . . . . . . . . . . 88
4.13 Object detection sequence (C) . . . . . . . . . . . . . . . . . . . . . . . . . . 89
viii

4.14 Object detection sequence (D) . . . . . . . . . . . . . . . . . . . . . . . . . . 89
4.15 Object detection sequence (E) . . . . . . . . . . . . . . . . . . . . . . . . . . 90
4.16 The implementation architecture. . . . . . . . . . . . . . . . . . . . . . . . . 92
4.17 Training the SIFT descriptors. . . . . . . . . . . . . . . . . . . . . . . . . . . 93
4.18 The proposed object recognition property set. . . . . . . . . . . . . . . . . . 94
4.19 Testing the detection implementation. . . . . . . . . . . . . . . . . . . . . . . 96
4.20 SR4000 range uncertainty testing. . . . . . . . . . . . . . . . . . . . . . . . . 99
4.21 Object detection evaluation criteria. . . . . . . . . . . . . . . . . . . . . . . . 100
ix

List of Tables
1.1 Technologies needed by the steel construction industry (in rank order). . . . 5
1.2 Top challenges facing the steel construction industry (in rank order). . . . . 5
1.3 Characterizations of beneficial equipment technology changes. . . . . . . . . 6
1.4 NRC top five opportunities for breakthrough improvements. . . . . . . . . . 7
1.5 Design requirements for a construction 3D imaging system. . . . . . . . . . . 11
2.1 Design requirements of the IFC object model architecture. . . . . . . . . . . 20
2.2 Construction object recognition with 3D imaging and BIM . . . . . . . . . . 60
2.3 Construction equipment control with 3D imaging and BIM . . . . . . . . . . 61
2.4 Approaches used for object recognition. . . . . . . . . . . . . . . . . . . . . . 63
4.1 Property resource entities - IfcSimpleProperty. . . . . . . . . . . . . . . . 73
4.2 Definition of P setColumnCommon. . . . . . . . . . . . . . . . . . . . . . . . . 75
4.3 Definition of P setObjectRecognition. . . . . . . . . . . . . . . . . . . . . 79
4.4 Specifications for the Mesa Imaging AG SwissRanger 4000. . . . . . . . . . . 80
4.5 Sensor interface software design requirements. . . . . . . . . . . . . . . . . . 81
4.6 Implemented P setObjectRecognition. . . . . . . . . . . . . . . . . . . . . 93
4.7 Object detection results. . . . . . . . . . . . . . . . . . . . . . . . . . . . . . 98
x

Chapter 1
Introduction
1.1 Vision
An equipment operator is using a large-scale robotic manipulator under supervisory control
to perform an assembly task of an engineered construction component. Prior to the physical
move, the assembly task is simulated to verify initial conditions including equipment load
constraints, start and final move locations, and a final check of the move trajectory. This
simulated run is a final backup check to the continual planning and re-planning cycle per-
formed for the overall site as delivery loads and laydown, equipment locations and health
status, human worker locations, and construction progress is continually updated in the Site
World Model (SWM). The Building Information Model (BIM) is the primary reference for
the SWM. It contains the as-designed specifications for the final build with each part identi-
fied and geo-referenced in the site coordinates. The overall build sequence is mapped within
the BIM, and meta-data for each part is accessible, including shape, weight, grip points,
assembly locations, connection mechanisms, and identification features. The latter informa-
tion is accessed and used by object recognition software agents supporting progress tracking
1
Alan M. Lytle Chapter 1. Introduction 2
systems and automated construction equipment. These identification features are provided
either by component manufacturers, third-party solution providers or the open source com-
munity, and enable an on-demand learning capability for autonomous systems supporting
the construction effort.
1.2 Background
The construction industry represents approximately 5% of the U.S. Gross Domestic Product
per annum [REF], and is critical to creating the required infrastructure to support continued
economic growth and improve quality of life standards. In the U.S., the construction industry
is also one of the largest sector employers in the national economy. Improving construction
productivity at task, project, and industry levels would have a significant national benefit
that transcends the industrial sector alone. Empirical evidence shows that the use of au-
tomation and integration technologies improves construction productivity (Chapman, 2000;
CII, 2008). Improvements in equipment technology (e.g., power, ergonomics, functionality)
have demonstrably improved productivity (Goodrum and Haas, 2004; Tatum et al., 2006),
as has the development of improved construction materials (Chapman and Butry, 2008).
Leading industry groups such as the Construction Industry Institute (CII) and the Con-
struction Users Roundtable (CURT) identified the need for integrating and automating con-
struction processes. CII made achieving Fully Integrated and Automated Project Processes
(FIAPP) a top priority, and in cooperation with the National Institute of Standards and
Technology (NIST) formed the Fully Integrated and Automated Technology (FIATECH)
consortium (Fowell, 2000). FIATECH is a non-profit organization of facility owners, opera-
tors, contractors, suppliers, government agencies and government and academic research or-
ganizations whose primary mission is the fast-track development and deployment of technolo-

Alan M. Lytle Chapter 1. Introduction 3
gies to substantially improve how capital projects and facilities are designed, engineered, built
and maintained. To support this goal FIATECH members developed a research roadmap,
with elements roughly corresponding to project lifecycle phases. In the Intelligent and Au-
tomated Construction Job Site element, it is envisioned that future
Construction sites will become more intelligent and integrated as materials,
components, tools, equipment, and people become elements of a fully sensed and
monitored environment. Location and status of all materials, equipment, per-
sonnel, and other resources will be continuously tracked on site, thus enabling a
pull environment where needed resources are delivered on demand. Automation
of construction processes will augment manual labor for hazardous and labor-
intensive tasks such as welding and high-steel work. Construction job sites will
be wirelessly networked with sensors and communications technologies that en-
able technology and knowledge-enabled construction workers to perform their jobs
quickly and correctly (FIATECH, 2004).
Robust field-automation on dynamic and cluttered construction sites will require advanced
capabilities in construction equipment automation, site metrology, 3D imaging, construction
object identification and tracking, data exchange, site status visualization, and design data
integration for autonomous system behavior planning.
1.2.1 NIST/AISC Steel Construction Workshop
In 2002, NIST and the American Institute of Steel Construction (AISC) co-sponsored a
workshop to investigate the development of new technologies to facilitate automating the
steel construction process. Desired outcomes included both a clear definition of issues and
constraints as well as the identification of candidate breakthrough technologies. Workshop

Alan M. Lytle Chapter 1. Introduction 4
participants included steel producers, fabricators, designers, and erectors, as well as con-
struction robotics and automation researchers. In their opening remarks, Ricles and Schlafly
(Lytle and Saidi, 2004) described the need:
Except for the fact that rivets have been replaced by bolting and welding,
the procedure for erecting building structures has changed very little over the
past 80 years. Field work requires workers to perform complicated and strenuous
tasks in a highly dangerous environment. Workers are often required to position
themselves at great heights, in difficult positions, and then must guide and secure
heavy structural members. In most cases, a construction crane is involved and it
is not unusual for these erection activities to take place out of the crane operators
sight.
Decreasing fabrication and erection time for steel frame buildings, while in-
creasing the safety of workmen during construction are issues that must be ad-
dressed, and provides the motivation for automated construction.
The primary deliverables from the workshop were two ranked lists: (a) the most promising
technologies that could benefit the steel construction industry, and (b) the most significant
challenges facing the steel construction industry. These lists are provided in Tables 1.1 and
1.2.
In reviewing the listed challenges and technologies, it is apparent that the ability to identify
and locate steel members and subassembly components would be an enabling capability for
both steel fabrication and erection. Unlike the high volume, low variability production lines
commonly associated with highly automated manufacturing, steel fabrication can be char-
acterized as low volume and high variability. Even in fabrication shops that have dedicated

Alan M. Lytle Chapter 1. Introduction 5
Table 1.1: Technologies needed by the steel construction industry (in rank order).
New connection systems3D/4D CAD and data interchangeAutomated weldingMaterial handlingMaterial tracking
Table 1.2: Top challenges facing the steel construction industry (in rank order).
Reduce time from design to erectionIntroduction and acceptance of new connection technologyReduce overall time to constructNeed to optimize man-hours/tonEfficient supply chain management
CNC equipment to manufacture required subassembly components (e.g. beam drill lines,
plate punching and thermal cutting stations, etc.), the final assembly of those components
is primarily a human endeavor. Automated welding, a mainstay in the automobile indus-
try, is not typically used in steel fabrication. Steel erection on the job site is likewise a
labor-intensive and dangerous process, and technologies that would enable new connection
methods and other human-assistive technologies during steel erection would be a top priority.
1.2.2 CII - Leveraging Technology to Improve Construction
Productivity
The Construction Industry Institute conducted a research study to provide recommenda-
tions, guidelines, and procedures for effectively leveraging technology to improve construc-
tion productivity (CII, 2008). The project included a historical review, the development of a
predictive model, and a pilot case study to better understand the expected impacts of tech-
Alan M. Lytle Chapter 1. Introduction 6
nology implementation. The historical review examined labor productivity changes when
factored for improvements in the functional range of construction equipment, reductions in
unit weight of selected materials, and the automation and integration of project information
systems. Researchers noted labor productivity gains of 30%–45% when factored for these
types of new technologies. A highly successful pilot study was conducted demonstrating the
effectiveness of combining RFID tags and GPS systems to improve material tracking, which
demonstrably increased both workface and laydown yard productivity. The predictive model
was developed based upon an analysis of the jobsite implementation of 28 technologies, and
was used to develop a list of promising technologies. The results from the pilot test also
provided field test data for the predictive model.
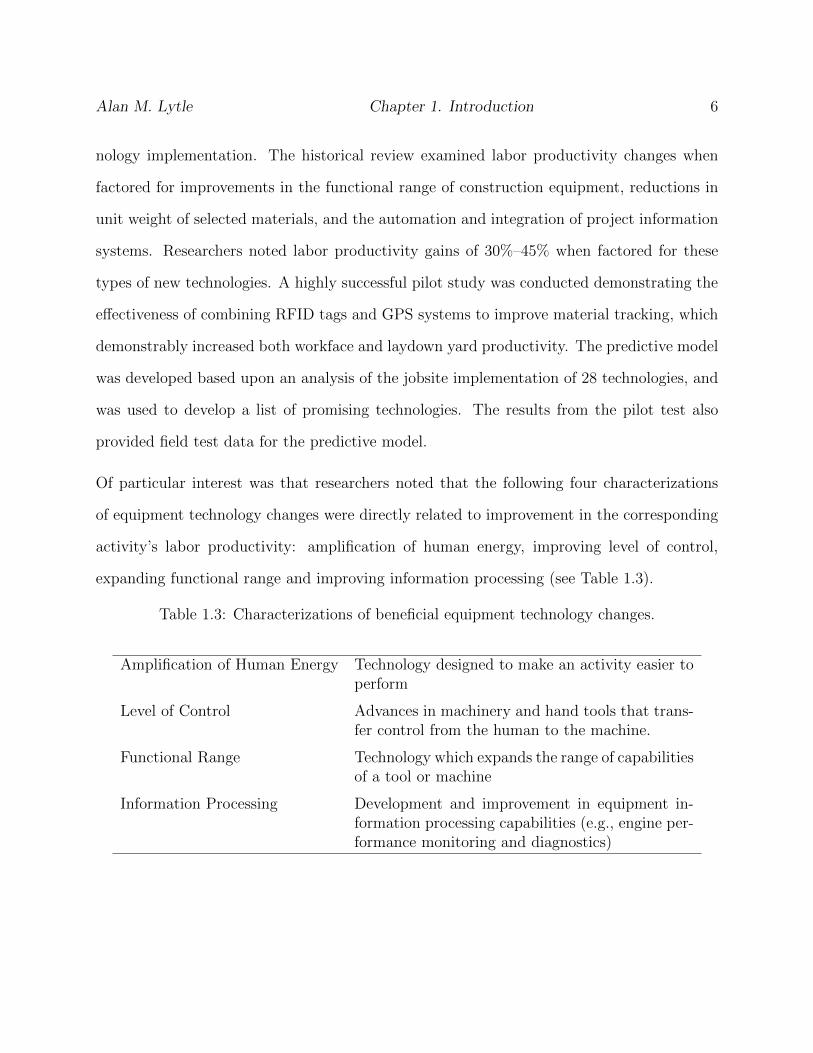
Of particular interest was that researchers noted that the following four characterizations
of equipment technology changes were directly related to improvement in the corresponding
activity’s labor productivity: amplification of human energy, improving level of control,
expanding functional range and improving information processing (see Table 1.3).
Table 1.3: Characterizations of beneficial equipment technology changes.
Amplification of Human Energy Technology designed to make an activity easier toperform
Level of Control Advances in machinery and hand tools that trans-fer control from the human to the machine.
Functional Range Technology which expands the range of capabilitiesof a tool or machine
Information Processing Development and improvement in equipment in-formation processing capabilities (e.g., engine per-formance monitoring and diagnostics)

Alan M. Lytle Chapter 1. Introduction 7
1.2.3 The NRC Construction Productivity Report
In 2008, The National Research Council convened an ad hoc committee to document oppor-
tunities for significant improvement in the productivity and competitiveness of the capital
facilities sector of the U.S. construction industry over the next 20 years (NRC, 2009). The
committee conducted a workshop of industry experts to identify and prioritize technolo-
gies, processes, and deployment activities that have the greatest potential to meet those
opportunities. Table 1.4 provides the committee’s top five Opportunities for Breakthrough
Improvements.
Table 1.4: NRC top five opportunities for breakthrough improvements.
Widespread deployment and use of interoperable technology applications, also calledBuilding Information Modeling (BIM).
Improved job-site efficiency through more effective interfacing of people, processes,materials, equipment, and information.
Greater use of prefabrication, preassembly, modularization, and off-site fabricationtechniques processes.
Innovative, widespread use of demonstration installations.
Effective performance measurement to drive efficiency and support innovation.
The committee identified interoperable technology applications as those that provide the abil-
ity to manage and communicate electronic data between stakeholders (e.g., owners, clients,
contractors, etc.) and project functional units (e.g., design, engineering, construction, etc.).
Examples of interoperability tools included CAD, 3D and 4D visualization, laser scanning
and materials tracking.
The committee also emphasized the use of automated equipment and information technolo-
gies could significantly cut waste, improve job-site safety, and improve the quality of projects.
Examples of uses for automated equipment included excavation, earthmoving, concrete place-
Alan M. Lytle Chapter 1. Introduction 8
ment and pipe installation. Examples of information technologies included RFID tags for
asset and material tracking and PDA’s for capturing field data.
1.2.4 Summary
The NIST/AISC Automation in Steel Construction workshop, the CII Construction Pro-
ductivity study, and the NRC Construction Productivity Report identified similar aspects of
targeted improvements expected to yield benefit for improving productivity on steel construc-
tion projects. The NIST/AISC workshop recommended new connection technology to sup-
port easier assembly, improvements in 3D/4D CAD and data interchange, and automation
to support welding, material handling, and material tracking. Each of these recommended
technology improvements are consistent with the first two opportunities for breakthrough
improvements stated in the NRC report: (1) widespread deployment and use of interoperable
technology applications (i.e., BIM), and (2) improved job-site efficiency through more effec-
tive interfacing of people, processes, materials, equipment, and information. The CII study
further clarified those aspect of equipment technology changes expected to yield substantial
benefit. These changes included: amplification of human energy, improving level of control,
expanding functional range and improving information processing.
1.3 Motivation
Stone et al. (1999) indicate that a goal of construction automation would be to enable an
engineer to manage and control construction operations remotely through the use of tele-
operation, tele-robotics, or full autonomous operation. Key enablers described for this goal
include: (1) remote tracking of materials; (2) remote tracking of equipment; (3) remote as-
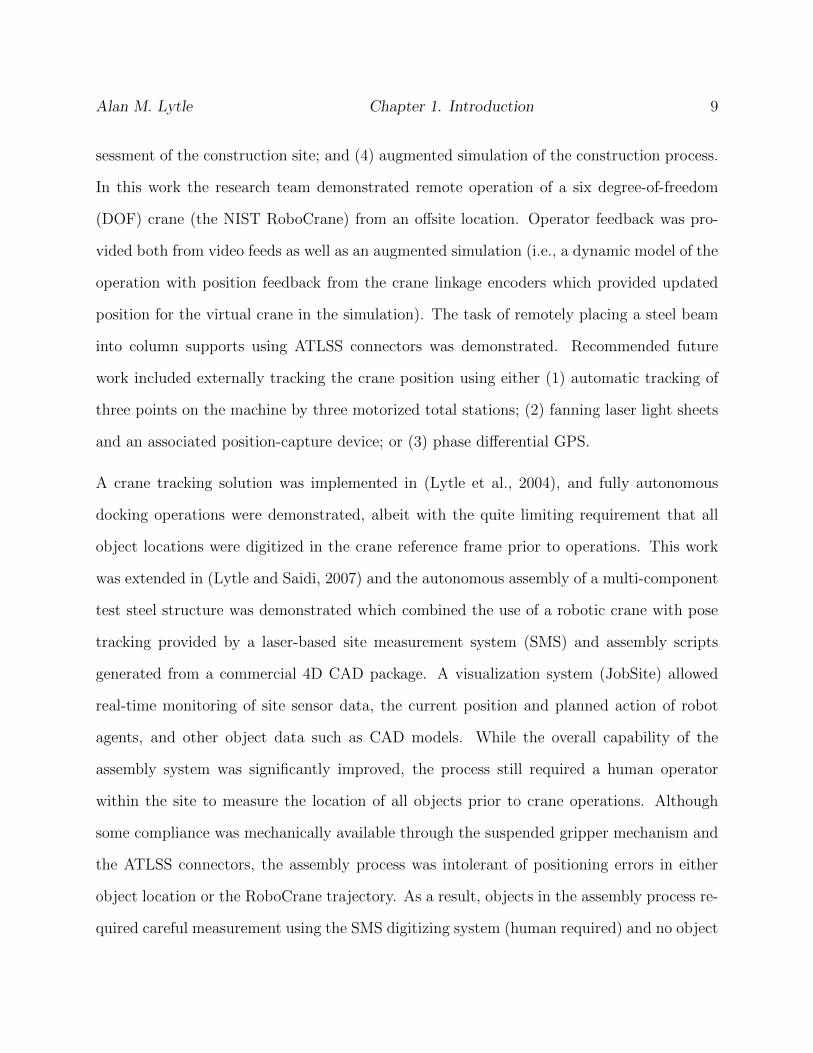
Alan M. Lytle Chapter 1. Introduction 9
sessment of the construction site; and (4) augmented simulation of the construction process.
In this work the research team demonstrated remote operation of a six degree-of-freedom
(DOF) crane (the NIST RoboCrane) from an offsite location. Operator feedback was pro-
vided both from video feeds as well as an augmented simulation (i.e., a dynamic model of the
operation with position feedback from the crane linkage encoders which provided updated
position for the virtual crane in the simulation). The task of remotely placing a steel beam
into column supports using ATLSS connectors was demonstrated. Recommended future
work included externally tracking the crane position using either (1) automatic tracking of
three points on the machine by three motorized total stations; (2) fanning laser light sheets
and an associated position-capture device; or (3) phase differential GPS.
A crane tracking solution was implemented in (Lytle et al., 2004), and fully autonomous
docking operations were demonstrated, albeit with the quite limiting requirement that all
object locations were digitized in the crane reference frame prior to operations. This work
was extended in (Lytle and Saidi, 2007) and the autonomous assembly of a multi-component
test steel structure was demonstrated which combined the use of a robotic crane with pose
tracking provided by a laser-based site measurement system (SMS) and assembly scripts
generated from a commercial 4D CAD package. A visualization system (JobSite) allowed
real-time monitoring of site sensor data, the current position and planned action of robot
agents, and other object data such as CAD models. While the overall capability of the
assembly system was significantly improved, the process still required a human operator
within the site to measure the location of all objects prior to crane operations. Although
some compliance was mechanically available through the suspended gripper mechanism and
the ATLSS connectors, the assembly process was intolerant of positioning errors in either
object location or the RoboCrane trajectory. As a result, objects in the assembly process re-
quired careful measurement using the SMS digitizing system (human required) and no object

Alan M. Lytle Chapter 1. Introduction 10
(a) The NIST RoboCrane transporting the testbeam to the dock position
(b) A conceptual rendering of 3D imaging-baseddocking control
Figure 1.1: Sensor-guided steel erection with the NIST RoboCrane.
movement was allowed following registration. There were no sensors either on the crane or
within the operating environment that would enable any reaction to dynamic changes within
the work site without human intervention. This would represent a significant limitation in
a more dynamic and fluid work environment, such as a real construction site.
An approach for overcoming this limitation is to fit the crane with exteroperceptive sensors
capable of recognizing target objects and providing real-time guidance during pick and place
operations. Fig. 1.1 depicts the NIST RoboCrane during an autonomous docking evolution
and a conceptual rendering of 3D imaging-based docking control.
Drawing on research experience in construction site monitoring and autonomous mobility,
Stone et al. (2004) describe the ultimate construction site sensor as a laser-based 3D imaging
system having the characteristics specified in Table 1.5.
While no sensor currently meets these combined specifications, systems are now commercially
available which enable high frame rate data capture, albeit at higher range uncertainty and
lower angular resolution than desired. Unlike the more common laser scanning instruments

Alan M. Lytle Chapter 1. Introduction 11
Table 1.5: Design requirements for a construction 3D imaging system.
Illumination Source: eyesafeField of View (FOV): 60◦ × 60◦
Range Uncertainty: ±1mm for r < 15m±3mm for 15m < r < 100m
Angular Resolution: < 0.03◦
Frame Rate: > 10HzSize: ≈ Coffee CupCost: < $1000
currently found on construction sites, these focal plane array (FPA) range cameras, or flash
LIDAR/LADAR1 systems, do not require a scanning mechanism. Instead, flash systems use
a broad field illumination source and an FPA detector, such that the entire range image is
acquired in one transmission. It is important to note that these commercial sensors are not
yet ready for deployment in a true construction setting. Chief among the limitations is a
susceptibility to variations in ambient lighting, particularly bright sunlight. It is anticipated
that at some future point low cost, hardened, high frame rate range cameras will be readily
available. Additional research is needed to develop methods for incorporating these new
sensors in crane control applications.
1.4 Statement of the Problem
Fundamental to the introduction of flexible automation techniques in construction will be
the ability to recognize targeted construction objects. This ability will support numerous
tasks including progress tracking, material locating, and automated piece movement and
1If the illumination source is a laser (common for longer range military applications) then the sensor isoften referred to as flash LADAR (laser detection and ranging). If the illumination source is not a laser(e.g., an LED), then the sensor is often termed either a range camera or a flash LIDAR (light detection andranging).

Alan M. Lytle Chapter 1. Introduction 12
assembly. Object recognition systems require baseline information upon which to compare
sensed data to enable a recognition task. The existing BIM structure does not support the
storage and retrieval of these types of baseline information beyond shape, expected location,
and material. This limitation restricts the widespread use of diverse object recognition
techniques in the construction environment. The ability to integrate a diverse set of object
recognition data for different components in the BIM will enable many autonomous systems
to access and use these data in an on-demand learning capacity, and will accelerate the
integration of object recognition systems in the construction environment.
1.5 Research Goal and Objectives
The principal goal of this research is to provide a new framework for using a building informa-
tion model (BIM) to support object recognition in construction. Specifically, this framework
will support the storage and retrieval of feature descriptor information to enable engineered
construction component detection from 3D image data. A secondary goal is the exploration
of a new class of sensor (high frame rate 3D imaging sensors) for construction object recog-
nition. Though not part of this initial research, the motivating application is automated
manufactured component placement in a steel fabrication and/or erection scenario.
The principal and secondary goals will be met through answering the following questions:
1. How can Industry Foundation Classes (IFC) be used to encapsulate necessary feature
descriptor information to support object recognition of an engineered construction
component?
2. How can high frame rate 3D imaging system data be used to recognize and track
construction objects (i.e., structural steel)?

Alan M. Lytle Chapter 1. Introduction 13
3. What is an appropriate framework for using a Building Information Model to support
a construction object recognition task?
The following specific objectives will provide both the framework and the path for answering
the research questions:
1. Develop a method for construction object recognition using IFC and range camera
data.
2. Demonstrate a framework for using a BIM to support construction object recognition.
This research will yield a number of benefits. The primary benefit is opening a new pathway
for construction automation. Related benefits include new methods for using BIM to support
construction object recognition, and developing methods and inspiring research into a new
class of sensors for general construction equipment control. Beneficiaries are expected to
be construction researchers and construction equipment manufacturers. A tertiary though
relevant benefit is the general introduction of advanced, exciting, high-tech equipment to
the construction industry. Construction is generally perceived as a low-tech and undesirable
occupation, and any efforts to reverse that view are beneficial to the industry as a whole.
1.6 Document Overview
This dissertation is organized into five chapters. Chapter 2 provides a broad overview of
the current state of knowledge and practice with respect to the use of Building Information
Models, 3D imaging-based object recognition and construction equipment control. Chapters
3 and 4 clarify the problem statement and the research approach. Findings, contributions
and recommendations for future research are provided in Chapter 5.

Chapter 2
Literature Review
Fundamental to the introduction of flexible automation techniques in construction will be
the ability to recognize targeted construction objects. This ability will support numerous
tasks including progress tracking, material locating, and automated piece movement and
assembly. Object recognition systems require baseline information upon which to compare
sensed data to enable a recognition task. The existing BIM structure does not support the
storage and retrieval of these types of baseline information beyond shape, expected location,
and material. This limitation restricts the widespread use of diverse object recognition
techniques in the construction environment. The ability to integrate a diverse set of object
recognition data for different components in the Building Information Model (BIM) will
enable many autonomous systems to access and use these data in an on-demand learning
capacity, and will accelerate the integration of object recognition systems in the construction
environment.
This chapter provides a broad overview of existing research related to the topics of BIM, 3D
imaging and object recognition.
14

Alan M. Lytle Chapter 2. Literature Review 15
2.1 BIM
2.1.1 The Need for Interoperability
Interoperability is defined as “... the ability to manage and communicate electronic product
and project data between collaborating firms’ and within individual companies’ design, con-
struction, maintenance, and business process systems.” 1 The lack of interoperability in the
construction sector is a significant drain on the productivity and efficiency of the construc-
tion industry. A NIST study estimated the cost burden on the industry in 2002 at $15.8B
(Gallaher et al., 2004). The NRC recommended the widespread deployment and use of in-
teroperable technology applications — identified as Building Information Modeling — as the
top opportunity for breakthrough improvement in construction productivity. Those inter-
operable technology applications provide the ability to manage and communicate electronic
data between stakeholders (e.g., owners, clients, contractors, etc.) and project functional
units (e.g., design, engineering, construction, etc.) (NRC, 2009).
2.1.2 What is a BIM?
The National Building Information Standard (NBIMS) defines a BIM as a
“... digital representation of physical and functional characteristics of a fa-
cility. As such, it serves as a shared knowledge resource for information about a
facility forming a reliable basis for decisions during its life cycle from inception
onward.”(NIBS, 2007).
1This definition from Gallaher et al. (2004).

Alan M. Lytle Chapter 2. Literature Review 16
The General Services Administration, an early proponent of BIM technologies, provides a
more detailed definition:
Building Information Modeling is the development and use of a multi-faceted
computer software data model to not only document a building design, but to
simulate the construction and operation of a new capital facility or a recapitalized
(modernized) facility. The resulting Building Information Model is a data-rich,
object-based, intelligent and parametric digital representation of the facility, from
which views appropriate to various users’ needs can be extracted and analyzed to
generate feedback and improvement of the facility design. (GSA, 2009a)
A broader view is that BIM defines a new process rather than simply a new product. The
parametric extension of 3D CAD modeling data in an object-oriented, hierarchical framework
provides a building product model. This product data model contains information about
object characteristics and relationships to other objections. Since objects are now defined
by rules and inter-relationships, it is possible to ripple redesign information throughout the
digital framework so that the impact of property changes of one object can be more easily
recognized and evaluated. The processes of developing multiple sets of drawings as a building
moves from concept to construction becomes moot, because those drawings can be readily
extracted from the BIM as the design matures. Multiple parties can access these data as the
design develops, providing an exchange process that improves stakeholder communication
and better supports the design-build methodology through clash detection, constructability
studies, and schedule analysis. The information contained in the product model supports
higher-level analysis such as energy use, lighting, acoustics, etc., and can be used for facility
management, operational studies, and a host of other requirements to support life-cycle
operations up to and including decommissioning. Eastman et al. (2008) is the primary
Alan M. Lytle Chapter 2. Literature Review 17
reference for an introduction to BIM, an understanding of tools and methods to support
BIM, and a review of expected and realized benefits for various stakeholders.
2.1.3 Product Data Models
There are two main open-standard protocols which provide object-based product data models
to support BIM. These are the CIMSteel Integration Standard version 2 (CIS/2) and Industry
Foundation Classes (IFC). Both of these protocols have as a foundation the Standard for
the Exchange of Product Model Data (STEP) — ISO 10303.
STEP
The Standard for the Exchange of Product Model Data (STEP) — ISO 10303 — was ini-
tiated as an answer to the growing need to exchange object-based digital information of
manufactured components. Prior to STEP, Computer Aided Design / Computer Aided
Manufacturing (CAD/CAM) data were stored and transferred between stakeholders primar-
ily using file formats which supported shape and other geometric data only. The addition
of product data (e.g., material, surface finish, assembly instructions, sub-component inter-
relationships, etc.) to this exchange necessitated a new mechanism which went well-beyond
the capabilities of file translators. In 1984, an international effort commenced under the
cognizance of the ISO technical committee TC 184, Automation systems and integration,
sub-committee SC 4, Industrial data. The overall objective of STEP is to completely and un-
ambiguously define a product in a manner that is both independent of any specific computer
system and is suitable for use over the entire product lifecycle (SCRA, 2006).
The standard spans a wide variety of product types and lifecycle processes from numerous
domains. Due to the complexity and scope of the effort, the standard is subdivided into

Alan M. Lytle Chapter 2. Literature Review 18
parts with each part itself being a balloted standard. There are over 950 parts, separated
into the following functional areas: description methods, implementation methods, confor-
mance testing, integrated resources, abstract test suites, application protocols, application
constructions, and application modules. The application protocols (AP) are used to specify
the product information for a particular domain or application. Examples include AP203
Configuration controlled 3D designs of mechanical parts and assemblies, and AP225 Building
Elements Using Explicit Shape Representation.
Product information is represented using the EXPRESS data modeling language, which
was also developed as part of the standard and is described in ISO 10303-11 Description
methods: The EXPRESS language reference manual. EXPRESS is a machine-readable,
entity-attribute-relationship product data model which is used in many activities outside of
STEP (e.g., Industry Foundation Classes). EXPRESS-G, also specified in ISO 10303-11, is
a graphical version of the language enabling diagram-based object-oriented data modeling.
As of this writing there are 695 published standards from TC184/SC4 (ISO, 2011). A source
of information for ISO 10303 is the STEP Application Handbook (SCRA, 2006). The ISO
website is www.iso.org. A search for TC184/SC4 will yield the subcommittee. Of note the
standards are available by purchase only. The definitive reference for EXPRESS is (Schenck
and Wilson, 1994).
CIS/2
The CIMSteel project (Computer Integrated Manufacturing for Construction Steelwork)
was a pan-European effort to develop a framework for digital information exchange in the
structural steel domain. Development of the CIMSteel Integration Standard (CIS) was a
primary output of the program. The initial CIS was published in 1995 with an expanded

Alan M. Lytle Chapter 2. Literature Review 19
second version (CIS/2) in 2000. The current release of the standard is available on the CIS/2
website. The CIS/2 standard was chosen by the American Institute of Steel Construction
to improve steel construction by reducing design and fabrication cost while simultaneously
shortening design, fabrication and construction timelines. The AISC, in cooperation with
AEC software industry, federal research laboratories (e.g., NIST), and academic institutions,
led the effort to create a robust user base and support software implementation. CIS/2 is
now widely used throughout the Steel Construction industry, and efforts to harmonize CIS/2
implementations with IFC to support BIM are ongoing. The CIS/2 standard is available at
www.cis2.org. Starting points for CIS/2 include the sites hosted by Georgia Tech (Georgia
Tech, 2011) and NIST (NIST, 2011). An informative overview of CIS/2 is provided in
(Khemlani, 2005).
Industry Foundation Classes
The product data model most used for BIM implementation is the Industry Foundation
Classes (IFC). The IFC is a neutral, standardized, object-oriented product data model de-
signed for exchange of information between AEC stakeholders. The development of IFC
started in 1994 under an initiative led by Autodesk, Inc. to develop a set of object classes
to support integrated application development. The initial Autodesk consortium grew to an
international organization now known as buildingSMART (formerly International Alliance
for Interoperability). The goal of buildingSMART is to develop and maintain international
standards for openBIM including process, data dictionary, and data model information. The
IFC are the data model implementation.
The IFC schema is fundamentally based upon class definitions (entities) with defined and
extensible attributes and relationships. Table 2.1 provides the basic design requirements for
the IFC object model architecture (IAI, 1999).

Alan M. Lytle Chapter 2. Literature Review 20
Table 2.1: Design requirements of the IFC object model architecture.
Provide a modular structure to the modelProvide a framework for sharing information between different disciplinesEase the continued maintenance and development of the modelEnable information modelers to reuse model componentsEnable software authors to reuse software componentsFacilitate the provision of better upward compatibility between model release
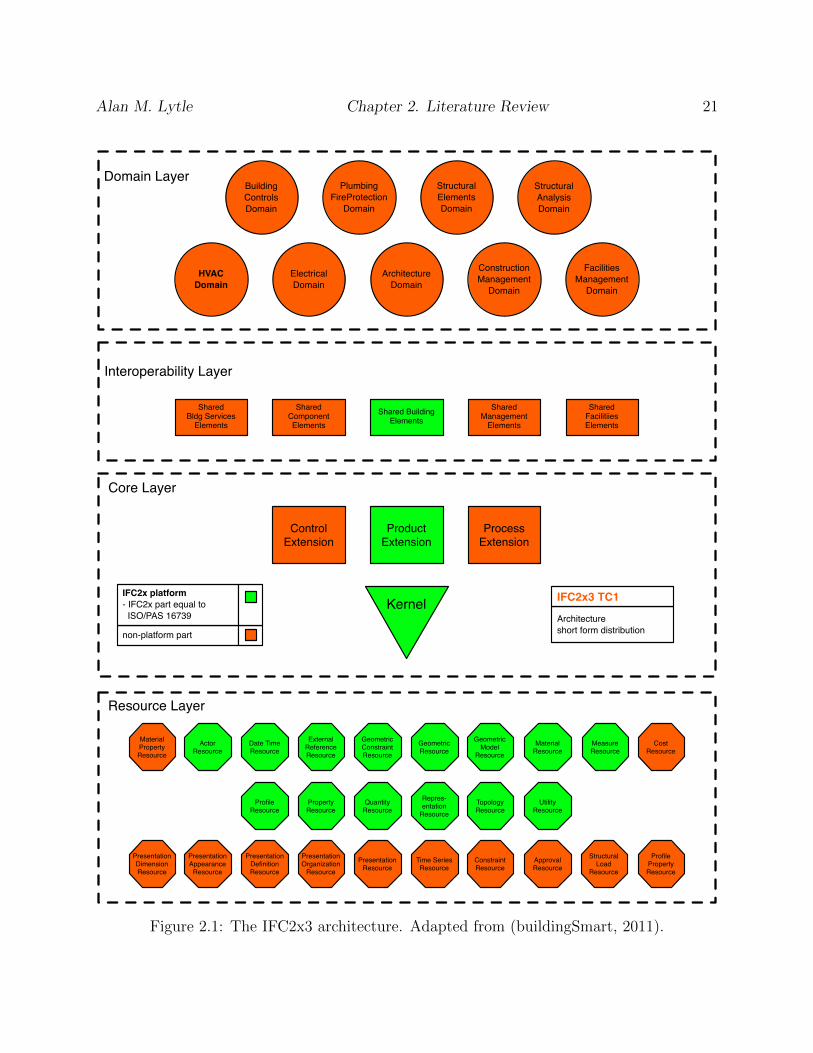
These design requirements are met via a four-layer architecture which consists of a Resource
Layer, a Core Layer, an Interoperability Layer, and a Domain Layer (see Fig. 2.1). The
Resource Layer provides general classes (entities) which can be used by any of the other
higher-level layers. These classes describe such items as Geometry, Material, Measurement,
Property and Cost. The Core Layer contains the Kernel and three specific extensions. Core
classes can be referenced by either the Interoperability Layer or the Domain Layer. The
Core Layer defines the basic structure of the IFC object model with the Kernel defining the
concepts of objects, relationships, type definitions, attributes and roles. The Core Extensions
apply the generic concepts maintained in the Kernel to specific AEC/FM Control, Product
and Process classes. The Interoperability Layer defines shared resources accessible to the
Domain Layer. The intent of the Interoperability layer is to provide modular classes which
can be used by more than one Domain model. Finally, the Domain Layer provides AEC/FM
domain- or process-specific model detail (Eastman et al., 2008; IAI, 1999).
The IFC is described using the EXPRESS data modeling language and are commonly ex-
changed using an ISO 10303-21 compliant text file. As of this writing the current version of
the IFC is IFC2x Edition 3 Technical Corrigendum 1 [IFC2x3 TC1]. IFC2x Edition 4 is in the
development cycle and is at currently at Release Candidate 2 [IFC2x4 RC2] (buildingSmart,
2011).
Alan M. Lytle Chapter 2. Literature Review 21
PresentationDimensionResource
PresentationDefinitionResource
PresentationResource
ConstraintResource
StructuralLoad
Resource
ProfilePropertyResource
PresentationAppearance
Resource
PresentationOrganization
ResourceTime SeriesResource
ApprovalResource
ProfileResource
QuantityResource
TopologyResource
PropertyResource
Repres-entation
ResourceUtility
Resource
Date TimeResource
GeometricConstraintResource
MaterialResource
ExternalReferenceResource
GeometricResource
MeasureResource
ActorResource
GeometricModel
Resource
MaterialPropertyResource
CostResource
Kernel
ProductExtension
ProcessExtension
ControlExtension
Shared BuildingElements
Shared Management
Elements
Shared FacilitiiesElements
Shared ComponentElements
Shared Bldg Services
Elements
Architecture Domain
ConstructionManagement
Domain
FacilitiesManagement
Domain
ElectricalDomain
HVACDomain
BuildingControlsDomain
PlumbingFireProtection
Domain
StructuralElementsDomain
StructuralAnalysisDomain
Domain Layer
Interoperability Layer
Core Layer
Resource Layer
Architectureshort form distribution
IFC2x3 TC1
non-platform part
IFC2x platform- IFC2x part equal to ISO/PAS 16739
Figure 2.1: The IFC2x3 architecture. Adapted from (buildingSmart, 2011).
Alan M. Lytle Chapter 2. Literature Review 22
2.2 3D Imaging
2.2.1 Introduction
3D imaging refers to the practice of using 3D imaging systems to measure or to capture
existing conditions in the built or natural environment. Historically this type of measurement
was conducted with single-point measurement systems such as total stations, or camera-based
systems that relied on photogrammetric techniques. Both approaches provided only limited
3D information, were slow, and typically required substantial post processing to provide
useful information to the end customer. The advent of active emission optical systems over
the last decade has revolutionized 3D data collection in the construction industry.
A 3D Imaging system is defined by the ASTM E57 3D Imaging standards committee 2 “. . . a
non-contact measurement instrument used to produce a 3D representation (e.g., a point
cloud) of an object or a site (ASTM, 2009).” These instruments are generally categorized as
laser scanners, optical range cameras, or triangulation-based systems. The terms LADAR
(for Laser Detection and Ranging, also Laser Radar) and LIDAR (Light Detection and
Ranging) are prevalent. Generally the term LADAR is typically used in defense-related
research (e.g., missile guidance, ATR) and robotics research. The term LIDAR is most often
associated with the remote sensing community. 3D imaging in the construction industry is
also commonly referred to as laser scanning.
3D imaging system configurations vary widely but in general all systems involve the use
of an emitted optical signal, a system to point the emitted signal throughout the systems
field of view, and an optical receiver element to detect and process the returned signal.
The optical signal is normally generated from a laser, a laser diode, or an LED, and the
2ASTM E57 3D Imaging Systems was formed in 2006 to develop open, consensus-based standards for the3D imaging community. The author chaired this committee from its inception in 2006 to 2010.

Alan M. Lytle Chapter 2. Literature Review 23
typical pointing system is either a mechanical scanning (e.g., rotating polygonal mirror) or
beam-steering system (e.g., acousto-optic, electro-optic). The time between the emission and
return is measured either by pulse time-of-flight or phase comparison, and that measurement
converts to a range along the line-of-sight (LOS) of the beam. The direction of the beam
is known in both azimuth and elevation angles in relation to the measurement instrument.
Those three bits of information — range, azimuth angle, and elevation angle — define a
unique point in space which can be expressed in either spherical (r, θ,φ) or Cartesian (x, y, z)
coordinates. As the beam is moved throughout the instrument’s field-of-view numerous 3D
points are collected. Instruments can collect anywhere from thousands to millions of data
points during a single scan. This collection of points is known as a point cloud. In addition
to spatial information, instruments can (depending upon configuration) provide returned
signal strength, color, time stamp, identification, polarization, and multiple range return
information for each measured point.
Of particular importance is that these instruments are non-contact measurement devices
that can measure non-cooperative targets. A specialized target such as a retroreflector is
not required. Different classes of systems are available which can measure up to a range
of several meters or kilometers. Typical pulse time-of-flight (TOF) systems used in the
construction industry measure up to several hundred meters. In indoor applications where
even higher point density is desired (e.g., process plants), phase-based systems are typically
employed which have shorter range (< 100m) but faster scan acquisition times.
In contrast to scanning systems, optical range cameras do not require a pointing mechanism.
These systems either use a single pulse, which is shaped by optics into a broad spatial output,
or use multiple emitters. The returned pulse is then focused onto a focal plane array and
sampled to generate the 3D image. Since the output of these systems is typically a 2D matrix
of range values, this output is often referred to as a range image. These systems are known

Alan M. Lytle Chapter 2. Literature Review 24
in the literature as range cameras, TOF cameras, flash LADAR (if the emitter is a laser), or
flash LIDAR. Advantages of these types of 3D imaging systems are higher frame rates, fast
image formation, and smaller form factors due to the elimination of scanning mechanisms.
Disadvantages include a smaller field of view and lower resolution (number of pixel elements)
in the 3D image as compared to scanning mechanisms.
For most instruments, datasets are collected in the instrument’s local coordinate frame.
Since these systems are LOS, measurements from numerous locations are usually required
to measure shadowed object surfaces. This shadowing can occur either because a forefront
object occludes a more distant object surface, or simply because a LOS instrument cannot
measure a back-facing surface on an object. To compensate for this limitation, measurements
are taken from numerous locations. Tying these separate datasets to a common reference
frame is referred to as registration, which is defined as “. . . the process of determining and
applying to two or more datasets the transformations that locate each dataset in a common
coordinate system so that the datasets are aligned relative to each other (ASTM, 2009).”
Registering two or more point clouds can be done using the point clouds themselves (cloud-
to-cloud); using targets or survey points that are common to both data sets (target-to-target);
point cloud to a generated surface (cloud-to-surface); and between two surfaces (surface-to-
surface). Features other than surfaces (e.g., lines, primitives, etc.) can also be generated
within the point clouds and used for registration.
Early surveys of 3D imaging technology are found in (Jarvis, 1983) and (Besl, 1988). An early
evaluation of 3D imaging system performance with a focus on mobile robot applications is in
(Hebert and Krotkov, 1991). A review of the past 20 years of 3D imaging system development
is provided in (Blais, 2004). An overall assessment of the 3D imaging technology with a focus
on systems for real-time control of autonomous systems is provided in (Stone et al., 2004).

Alan M. Lytle Chapter 2. Literature Review 25
2.2.2 3D Imaging in Construction
Current use of 3D imaging systems on construction sites primarily involves high resolution
imaging of existing structural or terrestrial conditions. These images are used for various ap-
plications such as the creation of detailed as-builts of process plants undergoing modification
to rapid surveying of highways and open-pit mines. Process applications include schedule
monitoring, project sequencing, and fabrication control. 3D imaging systems enable the
capture of existing conditions more completely and with a higher level of detail than most
manual methods. The construction sector accounts for approximately 80% of the market
for 3D imaging systems, where the ability to rapidly capture and assess existing conditions
is providing work process improvements in such areas as increased bid accuracy, reduced
installation errors and rework, and better quality control of fabricated materials. From case
studies it is estimated that although the direct cost savings of 3D imaging over conventional
surveying is small (10%− 20%) compared to the total cost of the project, the ability to pro-
vide substantially more data in shorter time provides up to (5%− 10%) savings of the total
project through such means as rework reduction and schedule shortening. Other reported
benefits include increased accuracy and reduced variance in engineering and construction
bids, improved responsiveness to project changes, increased worker safety, quality control,
and 3D visualization of complex or complicated conditions (Greaves, 2006). For example
the General Services Administration (GSA) is using 3D imaging as a key component of their
National 3D-4D-BIM Program to examine and support 3D, 4D and BIM technologies in their
projects. GSA expects to “. . . better meet customer, design, construction, and program re-
quirements through the . . . power of visualization, coordination, simulation, and optimization
from 3D, 4D, and BIM computer technologies (GSA, 2009a).” Applications include his-
torical documentation; facility condition documentation; construction as-built development;
and BIM development. As part of this project, GSA commissioned the development of a

Alan M. Lytle Chapter 2. Literature Review 26
3D imaging guide for project managers that is a good introductory source (GSA, 2009b). A
detailed examination of the process of using 3D imaging for capturing the built environment
is provided in (Arayici, 2007).
Jacobs (2006) reviews uses of 3D imaging in capital construction projects with a focus on
construction and fabrication. Specific uses cited include:
• Quality assurance (QA)
• Designing temporary structures
• Quantity surveys
• Path planning
• Pile and crane locations
• Construction and demolition sequencing
• Design verification
• Deformation monitoring
• Litigation protection
• Construction craft training
• Clearance evaluations for assembly personnel and tooling
Other examples and findings in the literature are noted in the remainder of this section.
Lindfors et al. (1999) provided a survey of metrology instruments available for the AEC
industry. This review included relatively new (at that time) instrumentation such as laser-
based spatial measurement and imaging systems. The authors presented the potential for
LIDAR and LADAR technology to capture as-built information on construction sites.
Alan M. Lytle Chapter 2. Literature Review 27
Cheok et al. (2000) introduced several key concepts related to the use of 3D imaging and
construction monitoring. The specific goals of the work were to examine methods to make
required construction measurements faster, cheaper and with minimal interruption to con-
struction operations. In particular, the authors sought to develop techniques for real-time
assessment and documentation of 3D as-built models of the construction process. The tech-
nology chosen was 3D imaging, and the specific task examined was the measurement of cut
and fill operations. This capability was examined both in a laboratory setting as well as
during actual construction operations at NIST. The authors introduced the concept of a
temporal project database, where time-stamps associated with the specific site scans provide
time-specific updates to construction status. Mesh surfaces were created from the registered
point clouds and volume changes were calculated by comparing prior surfaces to the current.
Comparison to design also provided cut-and-fill maps. Implicit in this operation is also the
ability to compare current status to design.
Shih (2002) examined the application of 3D image data to represent an on-going construc-
tion process through geometric approaches. Whereas Cheok et al. (2000) had principally
focused on the use of comparative surfaces; Shih examined more complicated construction
sites and incorporated an analysis of structural objects with texture mapping to highlight
surface attributes. Of particular importance was the introduction of simplified volumetric
representations (e.g., bounding boxes) to represent more complicated structure for tasks such
as interference checks.
Shih and Wang (2004) introduced the use of 3D imaging for monitoring construction site
work processes. The specific application was the comparison of 3D image data with 4D
models of a campus building under construction. The capability of differencing schedule
progress and actual progress was demonstrated, and the use of 3D image data for actual
control of the construction process was suggested. Recommendations included the use of
Alan M. Lytle Chapter 2. Literature Review 28
multiple scanners, permanent visible reference targets for registration, and scheduling scan
data collection as part of the construction plan. The need for linking point cloud data to
the reference database was also indicated.
A method for the use of 3D imaging for quality control in active construction projects was
presented in (Akinci et al., 2006). This research — ASDMCon (Advanced Sensor-based
Defect Management on Construction Sites) — focused on early defect detection during the
construction phase to eliminate costly rework in later stages of the project. Their approach
combined the used of as-planned 3D design information stored in a commercially-available
CAD package with periodic imaging of the construction sites. Case studies of four different
projects including a footbridge, warehouse, office building, and parking garage were pre-
sented. The primary contribution of this work was the development of a formal method
for approaching automated, sensor-based construction QA/QC. Important phases such as
inspection goal identification, inspection planning, understanding sensor limitations and pre-
planning both the timing and location of measurement tasks, (based on an understanding of
sensor limitations), and deviation/defect detection were presented. Of note, the study used
relatively low resolution scanning equipment that did not support sufficient imaging of small
details, (e.g., anchor bolt locations), but did demonstrate the ability to assess the placement
of major components such as columns and beams as well as details such as wall thickness,
etc. Congestion of the job site and presence of temporary installs, construction equipment,
and short-term material laydown were cited as significant challenges to the use of 3D imag-
ing for defect detection. In short, these challenges necessitated on-site re-planning of the
data collection effort. Although not explicitly stated, these challenges indicate the need for
including inspection plans in the overall construction planning, much as crane placement is
currently evaluated in larger projects. An automated method for scan planning based upon
inspection goals and the design information was developed as part of this project, and this
Alan M. Lytle Chapter 2. Literature Review 29
technique significantly improved the data collection efforts. More information on the scan
planning approach is provided in (Latimer et al., 2004).
Jaselskis et al. (2005) examined the use of 3D imaging in transportation projects and con-
cluded the technology was effective for volume measurement, determining road surface ele-
vations, and analyzing bridge beam camber. Pilot tests were conducted at an intersection
including a railroad bridge, a section of highway including a pair of bridges, new concrete
pavement, bridge beams on an unfinished bridge structure, a stockpile, and a borrow pit.
The primary challenge cited was the significant learning curve in use of the hardware and
software. Measurement of new concrete pavement smoothness was one application that was
not successful due to the measurement accuracy requirements and the uncertainty associated
with the system under test. The use of 3D imaging in transportation projects is a growing
field due to the fast data collection which can reduce traffic impact and improve safety of
work crews. Development of standards and specifications for the use of laser scanning in
transportation (in this case Caltrans) projects is provided in (Hiremagalur et al., 2007).
Kiziltas et al. (2008) report on lessons from four case studies on the use of laser scanning
which is included in a larger technology assessment. These included condition assessment of
a bridge, quality control during construction of a transportation system and operations and
maintenance of a facility, and documenting historic elements of a building prior to restora-
tion. Capturing detailed and accurate geometric data was technically feasible and generally
met requirements of the end-users. Operation was compared to total station data collection,
and although the scanner employed was less accurate than the total station, the ability to
capture significantly more data in equivalent time enabled capabilities that were not possi-
ble with the total station such as surface generation and solid modeling. One notable issue
was the collection of data on a dynamic construction site, which required careful planning
to minimize the impact of clutter and moving objects on the collected images. Capturing
Alan M. Lytle Chapter 2. Literature Review 30
smaller details such as those needed for historic preservation documentation necessitated
shorter scan ranges and higher point density settings in order to observe required features.
Also noted were adverse effects of variation in target reflectivity, sometimes generating obvi-
ously incorrect or even missing data for highly reflective objects (e.g., glass, polished metal).
The mixed-pixel effect was also noted as a challenge. 3 Processing the point cloud data (reg-
istration, outlier identification and rejection, segmentation, primitive fitting, etc.) requires
a significant amount of time and system expertise. 3D imaging provides the construction
industry with access to enormous amounts of geometric data. Extracting usable information
(e.g., modeling, direct takeoffs from point cloud data, etc.) remains primarily a manual op-
eration, which is time-consuming, expensive, requires sophisticated training, and limits the
rapid availability of information for immediate use during site operations. Understanding
the uncertainty associated with 3D imaging systems and how that impacts the uncertainty
of the deliverable remains an open question. Developing standard test methods to quantify
system performance and provide uniform techniques for uncertainty traceability is a primary
goal of the ASTM E57 3D Imaging standards committee (Cheok et al., 2008).
2.3 Object Recognition
2.3.1 Introduction
Object recognition is the branch of computer vision research that focuses on methods and
metrics for finding entities within images. The term image refers to a 2D matrix of scalar
3Mixed-pixels (sometimes also referred to as phantom pixels) are a phenomenon encountered with bothphase- and pulse TOF 3D imaging systems. Although one imagines a laser source as an infinitesimally smallray, the laser spot footprint has a discernible size that generally increases with range. When this footprintonly partially intersects an object (e.g., on an edge), the remaining photons continue to travel and canbe reflected by a second surface. Depending upon the relative distance between the two surfaces and theintegration time of the system, these offset returns will be combined and result in data points somewherebetween the two surfaces, yielding data points where no physical surface reflections existed.
Alan M. Lytle Chapter 2. Literature Review 31
values representing either gray-scale intensity or color data; a 2D matrix of range data (i.e.,
a 2.5D range image or depth-map); or a full 3D image which may or may not also contain
color, intensity, or other scene parameters. There is variation in the use of the terminology,
but in general object recognition involves identifying and locating a specified object instance.
This differs from object detection, where the goal is to find a more generalized object class.
The distinction between detection and recognition is exemplified in the terminology for face
recognition research. Face detection is the process of finding human faces (class) in an image,
and face recognition is the identification of a specific face from a database of existing faces.
A detection process generally includes a coarse locating function, which is improved during
recognition with the use of a higher fidelity model of the recognized entity. The observed
location may be refined while transitioning from detection to recognition with the use of a
higher fidelity model of the recognized entity.
Fisher (1989) defined model-based object recognition as follows:
Three-dimensional object recognition is the identification of a model struc-
ture with a set of image data, such that geometrically consistent model-to-data
correspondences are established and the object’s three-dimensional scene position
is known. All model features should be fully accounted for by having consistent
image evidence either supporting their presence or explaining their absence.
Trucco and Verri (1998) divide the model-based recognition tasks into two subtasks: (1)
identifying the models in the database that match the image data, and (2) locating the
matched 3D object by determining the rotation and translation parameters.
A general survey of early efforts in 3D object recognition is provided in (Besl and Jain, 1985).
Arman and Aggarwal (1990, 1993) review model-based object recognition for range imagery
with specific emphasis on range image segmentation, representation (surface, discontinuity,

Alan M. Lytle Chapter 2. Literature Review 32
and volumetric-based), object modeling schemes and matching strategies. Reviews of object
recognition techniques with emphasis on freeform objects are provided in (Campbell and
Flynn, 2001; Mian et al., 2005a). Yilmaz et al. (2006) provide a comprehensive survey
paper on object tracking using recognition techniques. Computer vision text in wide use
include (Forsyth and Ponce, 2002; Shapiro and Stockman, 2001; Trucco and Verri, 1998).
The Springer Handbook of Robotics (Khatib and Siciliano, 2008) also has several chapters
applicable to this domain. Of particular use are 3-D Vision and Recognition (Daniilidis and
Eklundh, 2008), Sensing and Estimation (Christensen and Hager, 2008), Visual Servoing
and Visual Tracking (Chaumette and Hutchison, 2008), Multisensor Data Fusion (Durrant-
Whyte and Henderson, 2008), and Range Sensors (Fisher and Konolige, 2008).
For the purpose of discussion we will break the object recognition process into three distinct
phases: image processing, image analysis, and image understanding as shown in Fig. 2.2. 4
Image Processing
Image AnalysisImage
Understanding
Figure 2.2: The processes of object recognition.
An image processing task is used to modify an input image to a more usable format in an
analysis task. The output of an image processing task is also an image. Image processing
includes functions such as histogram equalization, contrast stretching, image enhancement,
spatial transformations, morphological operations, edge detection, distance transforms, etc.
An image analysis task takes as input a raw or processed image, and generates data from
that input. These data can be basic information about the image such as average intensity,
4There is not a universally accepted framework for discussing object recognition. This framework wasinspired by (Rosenfeld, 2001).

Alan M. Lytle Chapter 2. Literature Review 33
or higher-level information such as identifying image features or segmenting regions of in-
terest. Operations of interest for image analysis include feature detection (e.g., point, line,
corner, surface, etc.), segmentation (k-means, region growing, etc.), and descriptor gener-
ation (shape, boundary, regions, etc.). An image understanding task generates actionable
information from image analysis data. Image data input could be the descriptors from the
segmented range image data. The image understanding function would then perform the
model database search for object identification, and then the model-to-image alignment to
determine the object location. The output of the image understanding task would be the
pose of the identified object for use in calculating necessary control commands for moving
the crane. Examples of other image understanding tasks include mapping and navigation for
mobile robots, face recognition for security applications, and gesture recognition for human-
computer interaction. The transformation of an image to actionable information is shown
in Fig. 2.3.
The generalized goal of the image processing and analysis tasks is to transform the raw
image into an internal representation. This internal representation is then matched against
the known model base in an image understanding process and the position and orientation
(pose) of the recognized object is calculated.
2.3.2 Image Processing
As previously described an image processing task is used to modify an input image to a
more usable format for an analysis task. The unifying theme in this framework is that the
output of a processing task is also an image. 5 The input image may be raw sensor data,
a previously processed image, or a synthetic image created from the object database. This
5This definition is by no means universally accepted and its use is not meant to imply otherwise. Analternative approach is to categorize image processing and image analysis as presented in this report aslow-level and high-level image processing, respectively.

Alan M. Lytle Chapter 2. Literature Review 34
Image Processing
Image Analysis
Image Understanding
Image Image
Data
Information
Image
Data
Figure 2.3: Transforming an image to actionable information.
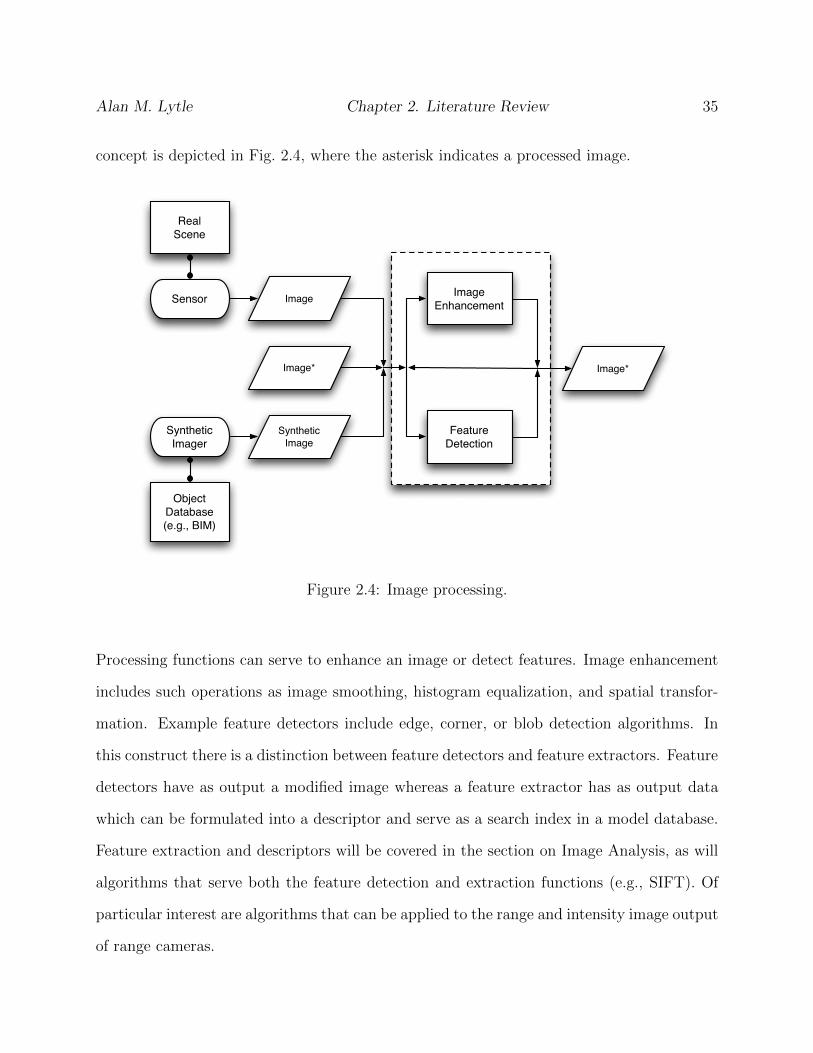
Alan M. Lytle Chapter 2. Literature Review 35
concept is depicted in Fig. 2.4, where the asterisk indicates a processed image.
Real
Scene
Object
Database
(e.g., BIM)
Sensor
Synthetic
Imager
Image*
Image
Enhancement
Feature
Detection
Image
Synthetic
Image
Image*
Figure 2.4: Image processing.
Processing functions can serve to enhance an image or detect features. Image enhancement
includes such operations as image smoothing, histogram equalization, and spatial transfor-
mation. Example feature detectors include edge, corner, or blob detection algorithms. In
this construct there is a distinction between feature detectors and feature extractors. Feature
detectors have as output a modified image whereas a feature extractor has as output data
which can be formulated into a descriptor and serve as a search index in a model database.
Feature extraction and descriptors will be covered in the section on Image Analysis, as will
algorithms that serve both the feature detection and extraction functions (e.g., SIFT). Of
particular interest are algorithms that can be applied to the range and intensity image output
of range cameras.
Alan M. Lytle Chapter 2. Literature Review 36
Image enhancement operations are performed to modify an image for better performance in a
subsequent processing step. These operations include filtering for noise removal or equalizing
the distribution of pixel values. Examples of image enhancement operations follow:
Mean filter A mean filter is a linear filter image smoothing operation used primarily for
noise removal. The filter replaces each image pixel with an average found in a neigh-
borhood around the pixel.
Gaussian smoothing A Gaussian smoothing operation is similar to a median filter but
the kernel elements are weighted representative of a 2D Gaussian distribution.
Median filter A median filter is a non-linear image smoothing operation used primary for
noise removal. The concept behind a median filter is simple — replace each pixel
with the median of the pixels found in a certain neighborhood around the pixel. A
larger neighborhood results in more image smoothing. A variation on this approach
is a weighted median filter, where certain positions in the neighborhood have stronger
influence on the resulting value. Median filters are generally used to smooth image
noise while preserving discontinuities.
Histogram equalization Histogram equalization is used to adjust the probability density
function of pixel values (e.g., intensity) to increase the image contrast. In general this
process redistributes the pixel values to approach a uniform distribution of possible
values.
Morphological operators Morphological operators are used to enhance specific aspects of
the underlying shape or form of pixel values to improve recognition. These operations
are generally performed on binary images, but they can also be used on intensity
images. Different kernels, called structuring elements, affect different types of changes
Alan M. Lytle Chapter 2. Literature Review 37
on the input image. In general, an erosion operation will shrink an image element
whereas a dilation will expand an image element. Sequencing an erosion followed by a
dilation is an opening operation, while the reverse is known as closing.
Bilateral filtering Bilateral filtering is a technique to smooth image surfaces while preserv-
ing edges. Tomasi and Manduchi (1998) achieve this by convolving with both a spatial
and an intensity Gaussian to achieve smoothing of none-edge surfaces. This technique
can be applied to 3D meshes (Fleishman et al., 2003) and is expected to be of use to
either smooth noisy range images from the range camera, or to smooth intensity image
surfaces and maintain edges for segmentation masks for the range data.
In feature detection, one desires to identify meaningful and repeatedly detectable parts of an
image. For model-based object recognition, these features must somehow provide mapping
back to the encoded object model. Preferably, the selected features are not affected by
image variations such as scale and rotation transforms, lighting changes, and partial object
occlusion. These types of features are known as invariant features. Some examples of low-
level feature detectors include edge, interest point, and blob detectors.
Edge Edge detection is the process of identifying boundary points within an image that
arise due to discontinuities in the original scene. These discontinuities may result from
an object boundary, depth changes, texture or color differences, or material reflectance
changes. To perform edge detection, one looks for image locations where the change in
pixel values exceeds some threshold over a specified pixel distance. Edges are generally
detected where either the first derivative of the image exceeds this specified value or
where the second derivative has a zero crossing. These first and second derivatives
are obtained with gradient and Laplacian operators, or by convolving the image with
kernels that approximate those operations. The primary challenge with edge detection

Alan M. Lytle Chapter 2. Literature Review 38
is recognition of true edges while suppressing noise responses.
Standard edge detection algorithms6 include those by Canny, Sobel, Prewitt, and
Roberts. Pioneering work in edge detection theory was provided by Marr and Hildreth.
There has also been much work to extend 2D edge detection to 3D, but standard 2D
algorithms work for range camera data that is presented as a range image. An im-
portant pre-processing step for range edge detection is eliminating mixed pixels. An
evaluation of mixed pixel detection algorithms is provided in (Tang et al., 2007). As
previously discussed bilateral filtering may be a useful pre-processing step to smooth
noisy image surfaces while preserving edges prior to edge detection. The output of an
edge detection operation is an edge image or edge map.
Point Interest points are specific locations within an image that can be readily and repeat-
edly detected. Sample point detectors include Moravec (Moravec, 1979), Harris corner
(Harris and Stephens, 1988), and affine invariant (Mikolajczyk and Schmid, 2004). A
survey of interest point detectors is provided in (Schmid et al., 2000). There are many
more interest point detectors. Those that include development of a descriptor are
discussed in the section on Image Analysis.
Blob Blob detection is used to generate regions of interest within an image. There are
numerous algorithms for blob detection, but the most notable for the range camera
application is the Maximally Stable Extremal Regions (MSER) approach (Matas et al.,
2004), which was evaluated as the most effective region detector (Mikolajczyk et al.,
2005).
6These algorithms are discussed extensively in Computer Vision texts.

Alan M. Lytle Chapter 2. Literature Review 39
2.3.3 Image Analysis
An image analysis task takes as input a raw or processed image, and generates data from
that input. These data can be basic information about the image such as average inten-
sity, or higher-level information such as identifying image features or segmenting regions of
interest. Operations of interest for image analysis include feature extraction (e.g., point,
line, corner, surface, etc.), segmentation (e.g., k-means, region growing, etc.), and descrip-
tor generation (e.g., shape, point signature, spin image, etc.). Features and descriptors can
be local or global. Local features have been shown more effective in object recognition of
partially occluded objects and in clutter-filled scenes. The goal is to extract features that
are meaningful and easily detected, and from those features generate descriptors that can
be used to search the model database and enable object recognition. A generalized image
analysis flow chart is shown in Fig. 2.5.
DescriptorImage*
Observed
Object
Model
Feature
Extraction
Segmentation
Figure 2.5: Image analysis.

Alan M. Lytle Chapter 2. Literature Review 40
Segmentation
Segmentation is the partitioning of an image into similar regions. Numerous segmentation
algorithms exist. Of particular interest are k-means, region growing, connected components,
and graph partitioning.
K-means is a data-clustering algorithm that segments a given data set into k clusters by
minimizing the variance of data elements assigned to each bin. Generally k is user-specified,
but there are implementations where k is also calculated. In segmenting an image, a mea-
surement value is chosen for evaluation. Depending on the type of image the measurement
value might be intensity, color, texture, range, derivatives of those data or any other prop-
erty a pixel may have. Those pixels are then partitioned into k clusters either randomly or
heuristically, and then a mean of each cluster is computed. Each pixel is then re-grouped
in the cluster whose distance metric is closest to the pixels value. Each cluster’s mean is
re-computed and again the pixels are grouped. The process continues until reaching a point
where the number of pixels reassigned during an iteration is either zero or below an assigned
threshold. The quality of the algorithm depends on the initial clustering and is guaranteed
to terminate but not yield a global optimum.
Region growing is a segmentation algorithm that starts with seeded pixels, and then adds
neighboring pixels to those seeded region sets that are within a feature metric distance (e.g.,
within an intensity-level tolerance). There are unseeded versions of the algorithm. Region
growing algorithms are highly dependent upon the similarity metric used, which is in turn
dependent upon the application.
Connected components is a segmentation algorithm that is similar to region growing but
employs a graph-based technique for segmentation. The basic premise of connected com-
ponents is to form regions that contain pixels of the same value. Best results are obtained
Alan M. Lytle Chapter 2. Literature Review 41
with a binary image. Connected components will yield labeled segments that are both the
same in intensity and space whereas an algorithm such as k- means yields those similar in
intensity. The algorithm starts by first considering each pixel in the binary image as a node
in a graph. The object is to find groups of neighboring pixels that have the same intensity.
This first starts by taking each foreground pixel (intensity of 1) and looking at either the
four or eight immediate neighbors to determine if they are the same value. Each neighbor of
the same value is given a region label. This process repeats until there are no more neighbors
with the same value.
Graph partitioning examines each pixel as a node and the distance to neighboring pixels
as edges. The image is segmented by removing edges connecting segments that exceed a
distance metric. This approach should be particularly useful for segmenting the 2.5D range
images.
Feature Extraction / Descriptors
Descriptors are methods used to create searchable indexes of image features. A good de-
scriptor is unique, rapidly generated, compact, invariant, and efficient to match. Numerous
representations schemes exist for object recognition. Surveys are available in (Arman and
Aggarwal, 1993; Campbell and Flynn, 2001; Mian et al., 2005b; Zhang and Lu, 2004). In
general one can categorize descriptors as global or local, where global descriptors charac-
terize the object by its whole image and local descriptors identify and characterize specific
portions of the object image.
Some of the earliest descriptor efforts focused on finding classifications for shape. Besl and
Jain (1985, 1986) focused on a surface perception approach to 3D object recognition by com-
bining the signs of mean and Gaussian curvature calculated for surface patches at specific
Alan M. Lytle Chapter 2. Literature Review 42
interest points. Surface patches were classified either as peaks, flats, pits, minimals, ridges,
saddle ridges, valleys, or saddle valleys. Other global approaches include generalized cylin-
ders (Binford, 1971, 1987), tripod operators (Pipitone and Adams, 1993), surface normals,
and Gaussian spheres.
Local descriptors have proven more useful for object recognition within cluttered scenes and
with partially occluded objects. A review of local descriptors is provided in (Mikolajczyk
and Schmid, 2005). Two highly cited descriptors are Spin Images and SIFT.
A spin image (Johnson and Hebert, 1997) is a 2D histogram in cylindrical coordinates. The
coordinate frame’s principal axis is along the normal vector of the plane created from the
vertex (interest point) and its surface neighbors. This interest point and associated vector
constitute an oriented point. All points within a distance d of this vertex are mapped
according to the radial distance from the normal vector and the position above or below the
normal plane. This can be visualized as sweeping a plane around the normal vector and
collecting the intersected points. This approach has shown to be robust for free-form object
recognition (Johnson and Hebert, 1999) but is not suitable for real-time applications. The
approach is also susceptible to image noise. Although developed for surfaces, the spin image
approach has been extended to point clouds (Frome et al., 2004).
The Scale-Invariant Feature Transform (SIFT) (Lowe, 1999, 2004) is a feature detector which
identifies keypoints in an image with an associated region (known as an oriented disk) with
assigned scale and orientation. These features are identified by first generating a scale space
using Gaussian smoothing and resolution reduction and then differencing the scale images.
Keypoints are generated for extrema regions in a neighborhood. Low contrast and edge-
based keypoints are rejected, and then orientations for each point are assigned from the
histograms of the gradients in a interest point’s neighborhood. SIFT descriptors compactly
encode each feature into a 128-element vector, and have been shown to be one of the most
Alan M. Lytle Chapter 2. Literature Review 43
effective descriptors.
The use of SIFT feature detection in the intensity image of a range camera which is then
used in the corresponding range image to identify the 3D location of those pixels was shown
by (Zhou et al., 2007). A SIFT tutorial and sample Matlab code is available at (Vedaldi and
Fulkerson, 2008).
2.3.4 Image Understanding
As defined in this report image understanding tasks generate actionable information from
image analysis data. For the task of tracking a steel beam for automated assembly, we are
principally interested in object recognition — i.e., identification and location of targeted
construction objects. Input data are generally descriptors and segmented image data used
for matching and/or fitting. The image understanding function executes the model database
search for object identification, and then the model-to-image (or image-to-model) alignment
to determine the object location. The outputs of the image understanding task would be (1)
whether or not the target object exists in the image, and (2) if the target object is identified
then provide the object’s pose for calculating necessary control commands for moving the
crane. Examples of other image understanding tasks include mapping and navigation for
mobile robots, face recognition for security applications, and gesture recognition for human-
computer interaction.
This section will describe common matching and alignment methods. A generalized image
understanding flow chart is shown in Fig. 2.6.
Matching and alignment approaches include hypothesize-and-test: e.g., RANSAC-DARCES
(Chen et al., 1999), 3DPO (Bolles and Horaud, 1986), geometric hashing (Lamdan and
Wolfson, 1988), and iterative model fitting, e.g., ICP (Besl and McKay, 1992). For the task
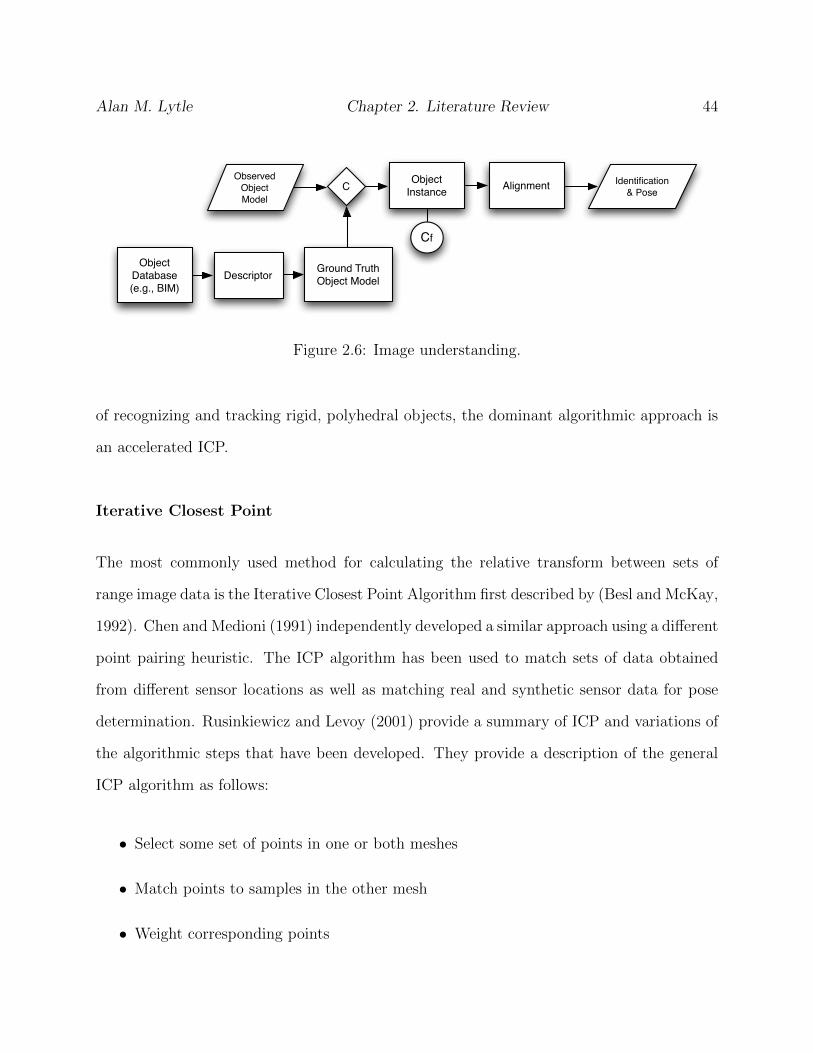
Alan M. Lytle Chapter 2. Literature Review 44
C
Ground Truth
Object Model
AlignmentObject
Instance
Cf
Object
Database
(e.g., BIM)
Descriptor
Observed
Object
Model
Identification
& Pose
Figure 2.6: Image understanding.
of recognizing and tracking rigid, polyhedral objects, the dominant algorithmic approach is
an accelerated ICP.
Iterative Closest Point
The most commonly used method for calculating the relative transform between sets of
range image data is the Iterative Closest Point Algorithm first described by (Besl and McKay,
1992). Chen and Medioni (1991) independently developed a similar approach using a different
point pairing heuristic. The ICP algorithm has been used to match sets of data obtained
from different sensor locations as well as matching real and synthetic sensor data for pose
determination. Rusinkiewicz and Levoy (2001) provide a summary of ICP and variations of
the algorithmic steps that have been developed. They provide a description of the general
ICP algorithm as follows:
• Select some set of points in one or both meshes
• Match points to samples in the other mesh
• Weight corresponding points
Alan M. Lytle Chapter 2. Literature Review 45
• Reject certain corresponding points based on individual or set-based pair review
• Assign an error metric from the point pairs
• Minimize the error metric.
In addition to a breakdown of the ICP flow path, the authors describe numerous variations
developed for each of the steps, and provide performance comparisons among many of them.
A fast ICP algorithm is described which combines optimally performing variants, and is
reported to align meshes in tens of milliseconds.
Rusinkiewicz et al. (2002) describe the implementation of the fast ICP variant previously
developed and applied to real-time 3D model acquisition. The system presented combines
a 60 Hz structured-light scanning system and a graphical interface which shows the model
creation in real-time. A user is able to hold and rotate a small object in front of the
scanner and watch as the point clouds are acquired and registered, filling gaps as they
appear. The system demonstrated the capability of real-time ICP, though the algorithms
suitability for low-resolution, noisy data was not discussed. Also, the use of a black glove
and a black background made removal of outlier data trivial, and is not available in typical
robotic applications. Reported drawbacks of ICP include the need for a good initial guess
of alignment and its susceptibility to noise.
In addition to registering two range images ICP is commonly used to align models to image
data (pose determination) (Simon et al., 1994; Wunsch and Hirzinger, 1996). Other variations
include Iterative Closest X where X can be lines, patches, or other geometric primitives (Li
and Griffiths, 2000); or a modification of the distance metric to include a feature-metric (Lu
et al., 2006; Sharp et al., 2002).
Alan M. Lytle Chapter 2. Literature Review 46
2.3.5 The Challenge of Real-Time
As stated previously the object recognition literature is vast, and while computational effi-
ciency is a general goal, not all approaches are relevant for real-time applications. Object
tracking surveys are provided in (Lepetit and Fua 2005; Porikli 2006; Yilmaz et al. 2006).
As described in Chapter 1 the initial motivation for this work was to provide onboard sensing
capability for an autonomous or semi-autonomous crane control application using the NIST
RoboCrane. For this application, the design requirement would be better characterized as
soft real-time, meaning that there is an operational deadline but the system (in this case the
crane controller) can handle periodic lateness of delivered information. The RoboCrane con-
troller was built using the NIST 4D/RCS Reference Model Architecture (Albus et al. 2002;
Lytle et al. 2008), and this provides general guidance on information requirements. For
low-level planning, the hierarchical controller is built upon the following planning horizons:
1. Servo: 50ms with output every 5ms;
2. Primitive: 500ms with replanning every 50ms; and
3. Subsystem: 5 s with replanning every 500ms.
The servo level is designed for direct actuator control, the primitive level provides steering
and velocity input, and the subsystem level provides immediate vicinity obstacle-free path
calculation.
For the control application envisioned the planning horizon is 0.5 s (primitive level), which
equates to a re-planning rate of 50ms or 20Hz. The range camera of interest has a nominal
frame rate of up to 54Hz, though in practice 20Hz for both range and intensity image
delivery is a more reasonable number. We are therefore interested in object recognition
algorithms that have a computational speed of 20Hz or greater. Of note, 4D/RCS was
Alan M. Lytle Chapter 2. Literature Review 47
designed for unmanned driving at highway speeds and the crane operates at significantly
reduced velocities. For a ball-park reference value it is expected that 2Hz or greater tracking
rate would suffice for initial experiments.
Notable related research follows:
Simon et al. (1994) presented one of the earliest real-time tracking implementations using
range sensors. Their implementation used a triangulated mesh (model data) matched and
aligned to sensor data using and enhanced ICP algorithm and achieved a 10Hz update rate.
Pose estimation at 1% of object size (translation) and 1◦ rotation were demonstrated.
Zheng et al. (2001) present a pulsed (flash) LADAR object-recognition system which fit
10 pixel × 20 pixel range images to a template generated from a laser physics based simu-
lation. The algorithm used a projection based filter to trim the candidate pool, and then
used both pixel matching (shape) and silhouette matching (boundary) for recognition. The
system was trained using synthetic image data for seven military vehicle targets. Each tar-
get set was comprised of templates of horizontal viewing angles and each 5◦ of aspect angle.
Tests run on 276 real 10 pixel × 20 pixel images cued by a human provided a 90% match
rate. The physics package simulated an anticipated military LADAR vice modeling an ex-
isting one. Test images were not generated with a real 10 pixel × 20 pixel pulse LADAR.
Computational requirements were not discussed, nor was there any indication of the ability
of the algorithm to isolate the correct aspect angle of the recognized target.
Jurie and Dhome (2002) present an appearance-based approach to track planar and 3D
objects in image sequences at video rates. The specific contribution is the use of an error
metric between the predicted and reference pattern to trim the search space for the current
object in the image.

Alan M. Lytle Chapter 2. Literature Review 48
Stevens et al. (2002) present an Automated Target Acquisition (ATA) algorithm for missile
seekers using flash LADAR and pulse millimeter wave radar (PMMW). Using LADAR data,
they segmented the potential targets based on variations in reflectance and range from the
surrounding image data. No shape analysis was conducted; rather any image area which
met a threshold for variation was a potential target.
Koenig (2007) reports the use of a range camera (SR-3000) for a real-time visual servoing
task — in this case performing human detection and tracking for human-robot interaction.
The approach used a connected-components algorithm to first segment point data, and then
used an SVM which was trained on a human profile as described by data after the connected
components operation. Frame-to-frame human tracking was performed using a Kalman
filter, with control input to the robot based upon a proportional derivative (PD) controller.
Researchers achieved 15Hz human tracking on a Pentium Core 2 Duo 2.0GHz processor
with one gigabyte of ram. Limitations reported included few people in the scene and full
view of subjects (i.e., no partial occlusion).
Kim and Kweon (2005) demonstrate 3D object recognition and tracking from 2D images
using Zernike moments generated at Harris point features. These are manually correlated
with 3D model points to initialize the tracking function.
Nuchter et al. (2004) use a General Ada Boost learning algorithm to construct a cascade of
classifiers which are created using simple feature detectors similar to Haar basis functions.
Authors report real-time recognition of office chairs from fused CCD and range image data
collected from a mobile robot.
Blais et al. (2001) demonstrated real-time tracking of circular targets using a galvanometer-
based 3D imaging using a Lissajous scanning pattern and processing and tracking in the
scanner inverse spherical coordinate system. The targeted application was equipment place-
Alan M. Lytle Chapter 2. Literature Review 49
ment and docking on the International Space Station.
Yoon et al. (2005) used an edge gradient in comparison with a target wire frame with
predictions from an extended Kalman filter. The pose estimation was calculated at near
video frame rates but the edge extraction process limited the system to approximately 2Hz–
3Hz. Pose tracking at video rates was demonstrated.
2.4 Construction Automation: Object Recognition with
BIM and 3D Imaging
Both BIM and 3D imaging are enabling technologies for a diverse set of construction au-
tomation systems. This section will examine potential applications of BIM and 3D imaging
in construction automation, with specific emphasis on construction object recognition and
future support of construction equipment control.
2.4.1 Construction Object Recognition
The primary application areas for construction object recognition are reconstructing building
models, quality assurance, and progress monitoring (Lukins and Trucco, 2007). Numerous
researchers have explored the use of camera, stereo, and video sensors to assess the status
of construction operations and to inform either automated planning, QA/QC systems or
human operators (Brilakis and Soibelman, 2006; Choi et al., 2008; Kim et al., 2008; Memon
et al., 2007; Zhang et al., 2009; Zhu et al., 2010). Navon (2007) provides a review of the
need for automation in progress monitoring and cites as motivating factors the high labor
requirements for data collection, low quality of manually collected data, resulting infrequent
project control, and lack of real-time input for corrective measures. Tang et al. (2010)
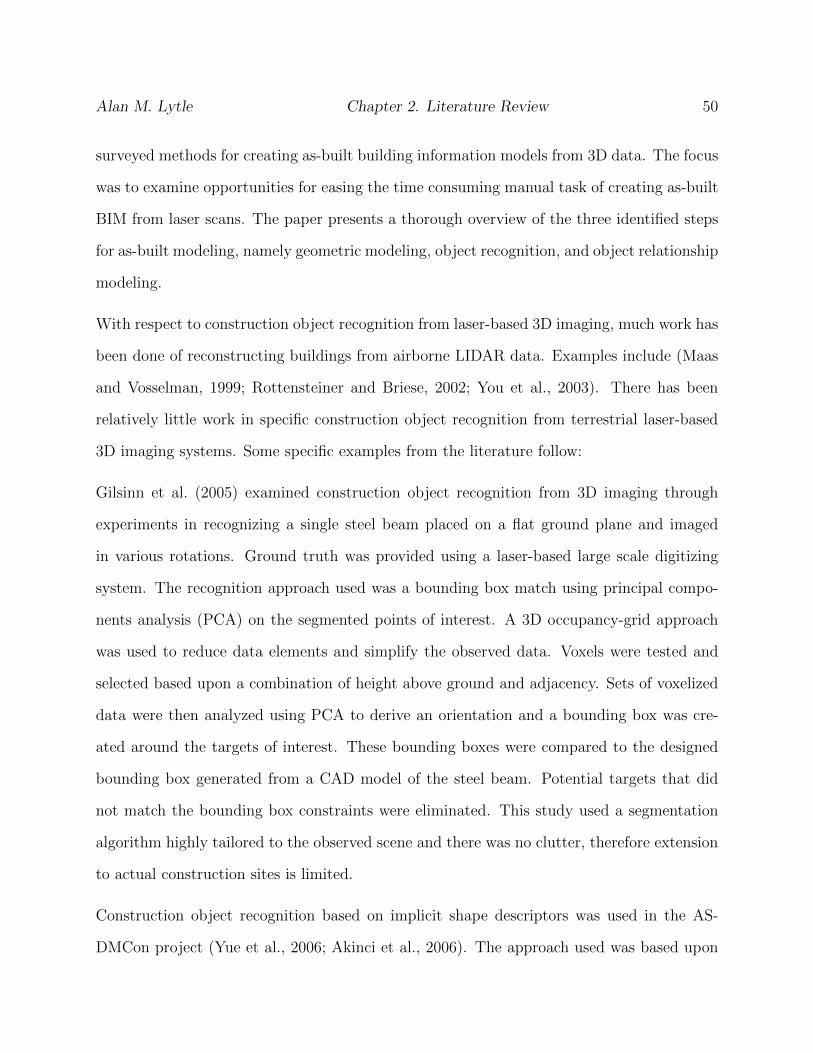
Alan M. Lytle Chapter 2. Literature Review 50
surveyed methods for creating as-built building information models from 3D data. The focus
was to examine opportunities for easing the time consuming manual task of creating as-built
BIM from laser scans. The paper presents a thorough overview of the three identified steps
for as-built modeling, namely geometric modeling, object recognition, and object relationship
modeling.
With respect to construction object recognition from laser-based 3D imaging, much work has
been done of reconstructing buildings from airborne LIDAR data. Examples include (Maas
and Vosselman, 1999; Rottensteiner and Briese, 2002; You et al., 2003). There has been
relatively little work in specific construction object recognition from terrestrial laser-based
3D imaging systems. Some specific examples from the literature follow:
Gilsinn et al. (2005) examined construction object recognition from 3D imaging through
experiments in recognizing a single steel beam placed on a flat ground plane and imaged
in various rotations. Ground truth was provided using a laser-based large scale digitizing
system. The recognition approach used was a bounding box match using principal compo-
nents analysis (PCA) on the segmented points of interest. A 3D occupancy-grid approach
was used to reduce data elements and simplify the observed data. Voxels were tested and
selected based upon a combination of height above ground and adjacency. Sets of voxelized
data were then analyzed using PCA to derive an orientation and a bounding box was cre-
ated around the targets of interest. These bounding boxes were compared to the designed
bounding box generated from a CAD model of the steel beam. Potential targets that did
not match the bounding box constraints were eliminated. This study used a segmentation
algorithm highly tailored to the observed scene and there was no clutter, therefore extension
to actual construction sites is limited.
Construction object recognition based on implicit shape descriptors was used in the AS-
DMCon project (Yue et al., 2006; Akinci et al., 2006). The approach used was based upon
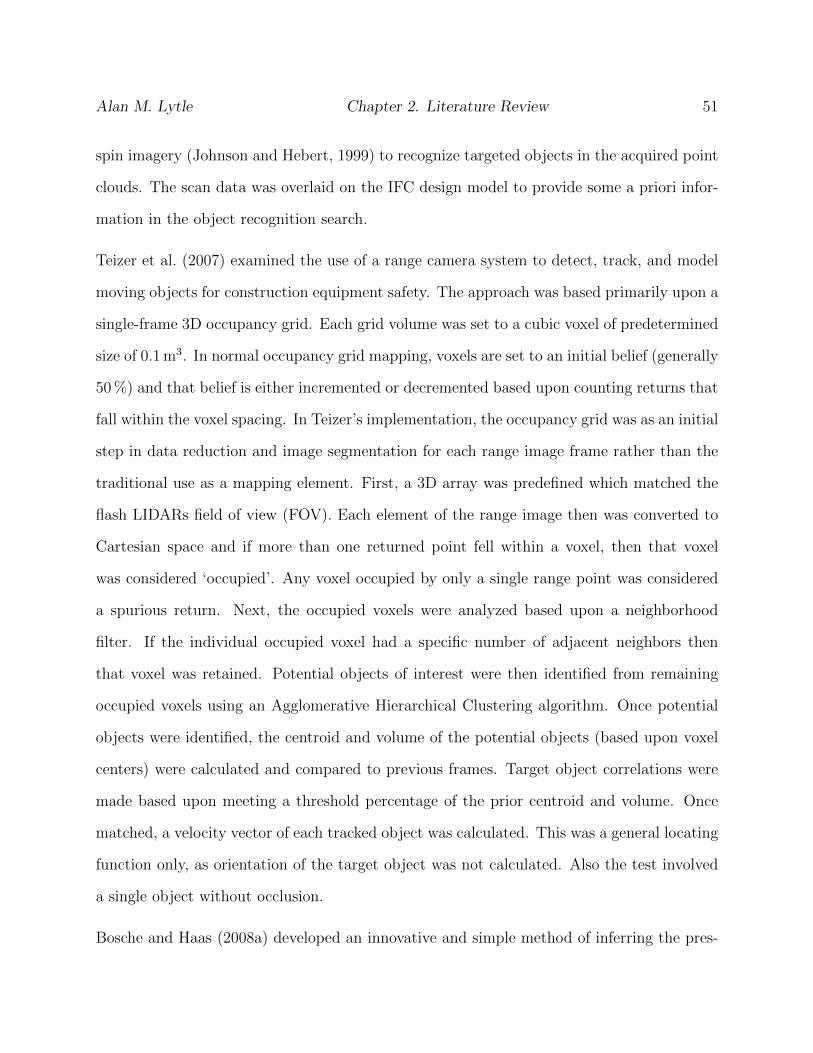
Alan M. Lytle Chapter 2. Literature Review 51
spin imagery (Johnson and Hebert, 1999) to recognize targeted objects in the acquired point
clouds. The scan data was overlaid on the IFC design model to provide some a priori infor-
mation in the object recognition search.
Teizer et al. (2007) examined the use of a range camera system to detect, track, and model
moving objects for construction equipment safety. The approach was based primarily upon a
single-frame 3D occupancy grid. Each grid volume was set to a cubic voxel of predetermined
size of 0.1m3. In normal occupancy grid mapping, voxels are set to an initial belief (generally
50%) and that belief is either incremented or decremented based upon counting returns that
fall within the voxel spacing. In Teizer’s implementation, the occupancy grid was as an initial
step in data reduction and image segmentation for each range image frame rather than the
traditional use as a mapping element. First, a 3D array was predefined which matched the
flash LIDARs field of view (FOV). Each element of the range image then was converted to
Cartesian space and if more than one returned point fell within a voxel, then that voxel
was considered ‘occupied’. Any voxel occupied by only a single range point was considered
a spurious return. Next, the occupied voxels were analyzed based upon a neighborhood
filter. If the individual occupied voxel had a specific number of adjacent neighbors then
that voxel was retained. Potential objects of interest were then identified from remaining
occupied voxels using an Agglomerative Hierarchical Clustering algorithm. Once potential
objects were identified, the centroid and volume of the potential objects (based upon voxel
centers) were calculated and compared to previous frames. Target object correlations were
made based upon meeting a threshold percentage of the prior centroid and volume. Once
matched, a velocity vector of each tracked object was calculated. This was a general locating
function only, as orientation of the target object was not calculated. Also the test involved
a single object without occlusion.
Bosche and Haas (2008a) developed an innovative and simple method of inferring the pres-

Alan M. Lytle Chapter 2. Literature Review 52
ence of model objects in range images. Their approach centered on the comparison of a 3D
image of a construction scene with a simulated scan of a 4D building model using similar scan
parameters. The simulated scan provided a priori knowledge of expected sensor information
such as location and number of returned surface points from a particular model element.
This information was compared to the actual scan data, and model elements were deemed
to be present if the comparison of actual returned points and virtual expected points met a
particular threshold. The presence of particular model elements was then used to provide a
generalized assessment of construction progress as compared to the 4D plan. The approach
was successfully demonstrated in a steel construction project. Bosche (2010) extended this
approach to use a comparison of observed to expected surface normals to improve the object
inference algorithm. Further research on including actual uncertainty models of 3D imagers
and using additional sensed information such as RGB data is recommended.
Son and Kim (2010) proposed a methodology for component progress tracking using 3D
data generated from color stereo vision. A rectified 2D image frame was segmented using
HSI colorspace and the resulting positive image mask was overlaid on the 3D range image
to segment the points of interest. A complete 3D model of the scale structure was obtained
through an ICP registration of the different image data sets. The full 3D point cloud was
then compared to an STL-format model to determine which of the individual components
in the model were present in the acquired image. A threshold based on number of points
(similar to (Bosche and Haas, 2008b)) was used to determine whether or not a component
was present.
Golparvar-Fard et al. (2011) developed a methodology for construction progress monitoring
that leverages the large number of photographs (photologs) that are already taken on con-
struction sites for production documentation. Correlation between different photographs is
determined using an interest point detector (SIFT) and then the camera positions for the
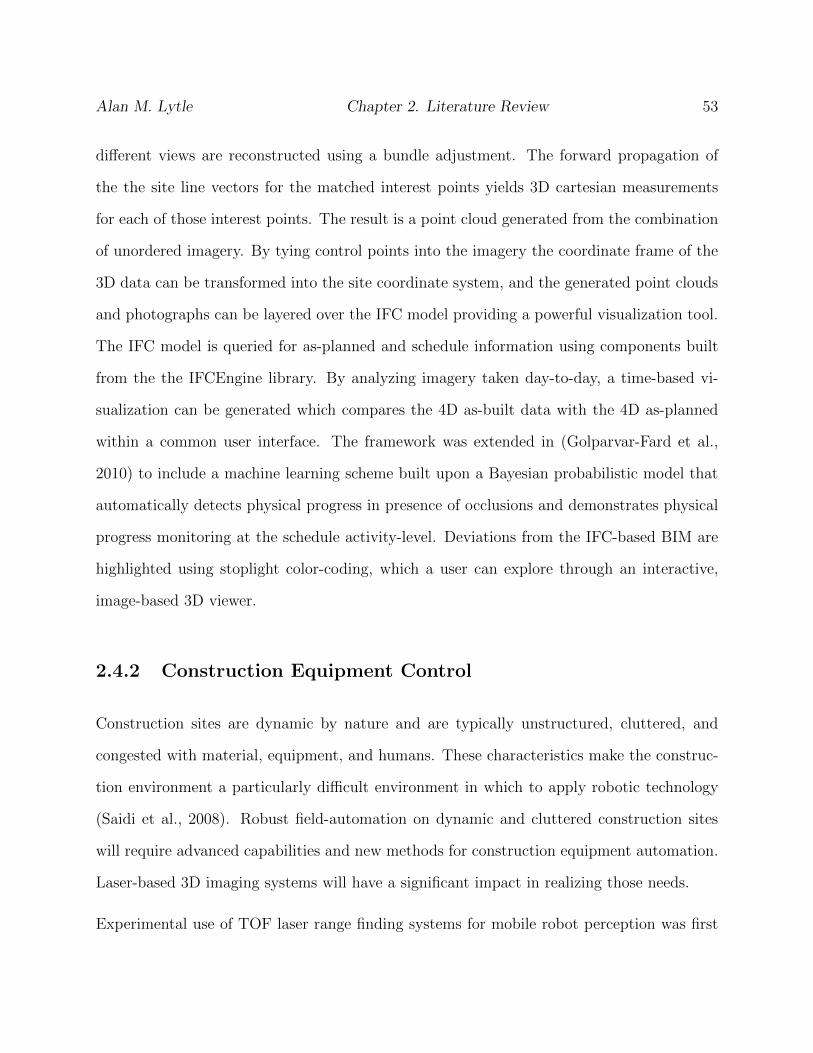
Alan M. Lytle Chapter 2. Literature Review 53
different views are reconstructed using a bundle adjustment. The forward propagation of
the the site line vectors for the matched interest points yields 3D cartesian measurements
for each of those interest points. The result is a point cloud generated from the combination
of unordered imagery. By tying control points into the imagery the coordinate frame of the
3D data can be transformed into the site coordinate system, and the generated point clouds
and photographs can be layered over the IFC model providing a powerful visualization tool.
The IFC model is queried for as-planned and schedule information using components built
from the the IFCEngine library. By analyzing imagery taken day-to-day, a time-based vi-
sualization can be generated which compares the 4D as-built data with the 4D as-planned
within a common user interface. The framework was extended in (Golparvar-Fard et al.,
2010) to include a machine learning scheme built upon a Bayesian probabilistic model that
automatically detects physical progress in presence of occlusions and demonstrates physical
progress monitoring at the schedule activity-level. Deviations from the IFC-based BIM are
highlighted using stoplight color-coding, which a user can explore through an interactive,
image-based 3D viewer.
2.4.2 Construction Equipment Control
Construction sites are dynamic by nature and are typically unstructured, cluttered, and
congested with material, equipment, and humans. These characteristics make the construc-
tion environment a particularly difficult environment in which to apply robotic technology
(Saidi et al., 2008). Robust field-automation on dynamic and cluttered construction sites
will require advanced capabilities and new methods for construction equipment automation.
Laser-based 3D imaging systems will have a significant impact in realizing those needs.
Experimental use of TOF laser range finding systems for mobile robot perception was first
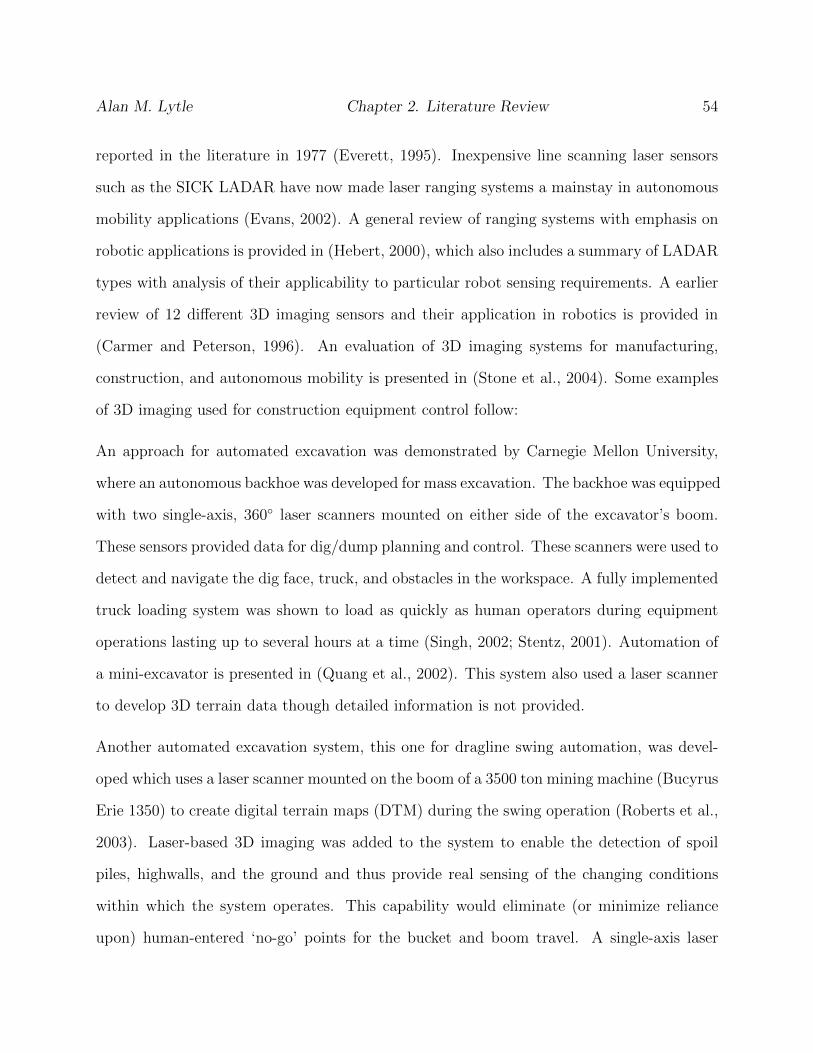
Alan M. Lytle Chapter 2. Literature Review 54
reported in the literature in 1977 (Everett, 1995). Inexpensive line scanning laser sensors
such as the SICK LADAR have now made laser ranging systems a mainstay in autonomous
mobility applications (Evans, 2002). A general review of ranging systems with emphasis on
robotic applications is provided in (Hebert, 2000), which also includes a summary of LADAR
types with analysis of their applicability to particular robot sensing requirements. A earlier
review of 12 different 3D imaging sensors and their application in robotics is provided in
(Carmer and Peterson, 1996). An evaluation of 3D imaging systems for manufacturing,
construction, and autonomous mobility is presented in (Stone et al., 2004). Some examples
of 3D imaging used for construction equipment control follow:
An approach for automated excavation was demonstrated by Carnegie Mellon University,
where an autonomous backhoe was developed for mass excavation. The backhoe was equipped
with two single-axis, 360◦ laser scanners mounted on either side of the excavator’s boom.
These sensors provided data for dig/dump planning and control. These scanners were used to
detect and navigate the dig face, truck, and obstacles in the workspace. A fully implemented
truck loading system was shown to load as quickly as human operators during equipment
operations lasting up to several hours at a time (Singh, 2002; Stentz, 2001). Automation of
a mini-excavator is presented in (Quang et al., 2002). This system also used a laser scanner
to develop 3D terrain data though detailed information is not provided.
Another automated excavation system, this one for dragline swing automation, was devel-
oped which uses a laser scanner mounted on the boom of a 3500 ton mining machine (Bucyrus
Erie 1350) to create digital terrain maps (DTM) during the swing operation (Roberts et al.,
2003). Laser-based 3D imaging was added to the system to enable the detection of spoil
piles, highwalls, and the ground and thus provide real sensing of the changing conditions
within which the system operates. This capability would eliminate (or minimize reliance
upon) human-entered ‘no-go’ points for the bucket and boom travel. A single-axis laser

Alan M. Lytle Chapter 2. Literature Review 55
scanner was mounted on the boom tip of the crane with the laser plane oriented along the
boom. As the boom moved through the work volume, 3D image data was collected and used
to develop a DTM of the work site. Integration of the 3D information for dragline operations
planning was not yet implemented. Future work also included development of an operator
interface, integration of multiple DTMs as the dragline changes position over a shift, and
procedures for filtering non-relavent information (e.g., the bucket) from the data collected.
Dunbabin and Corke (2006) explored automating rope shovels for mining operations, and
used a laser mapping system which provided information for automatically planning bank
engagement for the scooping operation. A single axis laser scanner was mounted the boom
tip of a 1: 7 scale rope shovel in a similar configuration to that for the dragline automation.
Expected uses of the 3D image data were to detect where to initiate digging and detect
when the dipper was full, plan base movements, and estimate bank shape changes (dig face)
over time. In this preliminary research, the team was able to demonstrate the use of a laser
scanner to provide bank engagement planning and to estimate dipper fill during scooping
operations.
Researchers at the Field Systems and Construction Automation Laboratory of the Univer-
sity of Texas at Austin (FSCAL–Austin) developed a technique for rapidly creating local-
area geometric data extraction for creating 3D visualizations of unstructured construction
workspaces. In their Sparse Point Cloud (SPC) approach, a human-guided laser rangefinder
equipped with pan and tilt angle monitoring was used to select points in a scene for measure-
ment, which were then used to geometrically define objects and workspaces and incorporated
into a world model (Kwon and Liapi, 2002). Use of the sparse point clouds for potential
equipment control was demonstrated in (Cho and Haas, 2003), where pole and wire locations
were modeled in one application, and trench boundaries and pipe locations were imaged and
modeled in another. Use of the modeled data for actual equipment operations was not dis-

Alan M. Lytle Chapter 2. Literature Review 56
cussed. Use of sparse point clouds for workspace modeling using partitioning, convex hulls,
and tight-fitting bounding boxes is described in (McLaughlin et al., 2004). The use of a
range camera for generating convex hulls and generalized shape models of construction site
objects was shown in (Kim et al., 2008). The SPC research was extended by Teizer et al.
(2007) through the use of a range camera system (SR2) to detect, track, and model moving
objects for obstacle avoidance. This work was a first investigation of using rapid range image
acquisition as opposed to the manual — and therefore slower —method of identifying and
measuring key points on static objects which was used in the SPC methodology. A more
detailed description is provided in the Construction Object Recognition section. Chi et al.
(2008) describe the use of range cameras for heavy equipment crash avoidance, but have not
demonstrated implementations beyond lab experiments with small mobile robots.
Reed (2002) conducted a review of the applicability of CIS/2 to support field steel construc-
tion activities. The review focused on automating the erection and surveying of structural
steel. For automated steel erection, the following computer-sensible information was deter-
mined to be required:
1. The parts and prefabricated assemblies to be delivered to the construction site.
2. The erection and/or assembly sequence for those parts and assemblies.
3. The joint systems connecting those parts and assemblies.
4. The final positions and orientations of those parts and assemblies.
To support the surveying task, the information required was a description of the model of the
steel structure with individual component data such as piece identification and corresponding
position data. The CIS/2 product data model was assessed to have sufficient mappings to
required information to support automated erection and surveying of steel structures. It
Alan M. Lytle Chapter 2. Literature Review 57
was noted that the mapping of required data was not sufficient in and of itself, and that
process controls on how the CIS/2 was implemented was needed. Specifically, the correct geo-
referencing of the manufacturing model to the site coordinate system as well as a mechanism
to register the individual pieces to their coordinate locations was needed. 7
Kamat and Lipman (2007) extended this concept and implemented a prototype evaluation
in the VITA-SCOPE construction visualization package and the KineMach construction
equipment simulator. Steel member geometry and final installed pose was extracted from
the CIS/2 file via the NIST CIS/2 to VRML translator. The translation provided explicit
member geometry and a model scene graph which facilitated extraction of the necessary
assembly information. The required geo-referencing of the CIS/2 model to the virtual site
coordinates was achieved by manually registering the CIS/2 global frame with the virtual
crane’s coordinate frame. Using the geometry and a notional laydown point for each piece,
the inverse kinematics were calculated to move the those pieces from the start point to the
final installed location. The ability to extract steel member geometry and final assembly
locations from a CIS/2 file and develop a sequencing plan and motion controls to do a
virtual assembly was demonstrated. The assembly sequence is not readily available from
the CIS/2 file, and must be externally provided or algorithmically determined. Extensions
of the product data model to include project specific construction planning and laydown
information was recommended.
Lytle and Saidi (2007) demonstrated the autonomous assembly of a multi-component test
steel structure using the NIST RoboCrane with pose tracking provided by a laser-based site
measurement system (SMS) and assembly scripts generated from a commercial 4D CAD
package. A visualization system (JobSite) allowed real-time monitoring of site sensor data,
7Of note, this methodology was employed on the Frederic C. Hamilton building expansion of the DenverArt Museum project by Mortenson Construction. During the steel fabrication, fiducial points were engravedon steel pieces and a survey crew used those fiducials and corresponding geolocations from the BIM to verifyproper placement during erection. (Personal communication Cunz, D. and Lytle, A.)

Alan M. Lytle Chapter 2. Literature Review 58
the current position and planned action of robot agents, and other object data such as CAD
models. A significant limitation in the demonstrated approach was that all object locations
were required to be digitized in the crane reference frame prior to operations, though the
addition of external sensing for site awareness and on-board sensing for visual-servoing of
the crane was recommended as future work. The final assembly locations were hand-coded,
though a natural extension would be to use product models to extract those data. The
ability to recognize and track target construction objects using on-board sensors was noted
as a necessary enabler for automated assembly.
Borkowski et al. (2010) examined the use of BIM to extract semantic information (e.g.,
geometric features and relationships) from a building model to support mobile robot path
planning and navigation. The use of IFC data to provide connectedness and function of
spaces within a structure from which to generate topological maps was examined. Suggested
opportunities to use BIM to better support mobile service robots included adding a MobileR-
obot entity to the Facilities Management Domain Layer and extending classes within that
domain (e.g., IfcActionRequest, IfcMove, IfcOrderAction). The concept of using the Actor
Role (i.e., IfcActor) to include not only human but also robotic actors was proposed. A
3D imaging system (SICK LMS 200 line scanner on a rotating support) was used to provide
navigation sensory data. Recognition of objects using a Viola-Jones classifier using Haar-like
features was explored and shown to recognize objects such as a wastebasket, door, staircase,
and washbasin. The authors did not specify that actual BIM data was used in any stage
of the project nor was the storage and retrieval of stored feature data addressed. The need
to bring together experts in BIM and mobile robotics to explore this new interdisciplinary
domain was stated.
Alan M. Lytle Chapter 2. Literature Review 59
2.5 Summary
Recognizing targeted construction objects is a fundamental enabler for the introduction of
flexible automation techniques in construction. This capability supports numerous tasks
including progress tracking, QA/QC, material locating, and automated piece movement and
assembly.
Research on construction object recognition with BIM and 3D imaging remains in early
stages. Most of the work conducted to date is to support progress monitoring, and principally
employs some general method to segment points of interest and then compare those points to
a model to determine if they are target points. Comparison methods include simple number
thresholding and examination of surface normals against either a co-registered model or
a virtual scan. There are examples of the use of local descriptors such as Spin Images
and Haar-like features. For construction equipment control, work conducted to date is
principally to support automated excavation, and centers on free-form surface generation for
dig planning or recognition of key features (e.g., truck bed boundaries, dipper fill, bucket
location, etc.). Integration of BIM-enabled 3D image construction object recognition with
construction equipment control for task completion remains an open research area. Initial
work has started on the use of BIM to provide navigation information for mobile robots
operating inside of buildings.
An overview of the relevant literature for construction object recognition using 3D imaging
and BIM is provided in Table 2.2. A similar overview focusing on construction equipment
control is provided as Table 2.3. A summary of object recognition approaches reviewed is
provided as Table 2.4.
As can be seen from Table 2.2 the predominant sensing modality for 3D image data is laser
scanning. Of note, the methodology developed in (Golparvar-Fard et al., 2011) provides new

Alan M. Lytle Chapter 2. Literature Review 60
Table 2.2: Construction object recognition with 3D imaging and BIM - Relevant Literature.
Tan
get
al.(2010)
Gilsin
net
al.(2005)
Yueet
al.(2006)
Akin
ciet
al.(2006)
Teizer
etal.
(2007)
Bosch
eet
al.(2009)
Son
andKim
(2010)
Golp
arvar-Fard
etal.
(2011,2010)
Progress Monitoring - - � � - � � �QA/QC - - � � - - - �Safety - - � � � - - -Model Reconstruction � - - - - - - �Component Tracking - � - - � � - �Workface Control - � - - � - - -Use of 3D Imaging Data � � � � � � � �Laser Scanner � � � � - � - -Range Camera - - - - � - - -Stereo Vision - - - - - - � -Structure from Motion - - - - - - - �CAD as a priori information � � - - - � � -BIM as a priori information � - - - - - - �Use of BIM � - � � - - - �Use of IFC � - � � - - - �Use of Model Descriptors � � - - - � � �Model Descriptors Derived from BIM � - - - - - - �Model Descriptor Storage/Retrieval � - - - - - - -Experimental Approach - � � � � � � �Prototype System - - � � � � � �Field Demonstration - - - � - � - �
� Focus, � Discussion
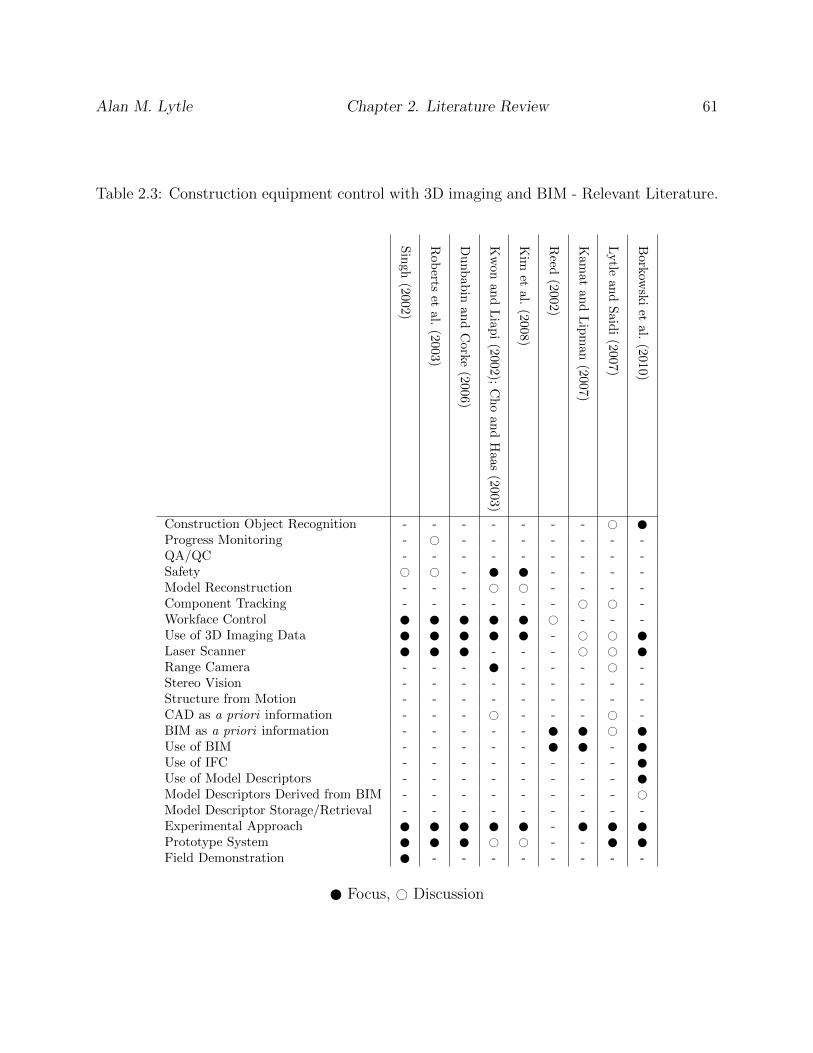
Alan M. Lytle Chapter 2. Literature Review 61
Table 2.3: Construction equipment control with 3D imaging and BIM - Relevant Literature.
Singh
(2002)
Rob
ertset
al.(2003)
Dunb
abin
andCorke
(2006)
Kwon
andLiap
i(2002);
Choan
dHaas
(2003)
Kim
etal.
(2008)
Reed
(2002)
Kam
atan
dLipman
(2007)
Lytle
andSaid
i(2007)
Borkow
skiet
al.(2010)
Construction Object Recognition - - - - - - - � �Progress Monitoring - � - - - - - - -QA/QC - - - - - - - - -Safety � � - � � - - - -Model Reconstruction - - - � � - - - -Component Tracking - - - - - - � � -Workface Control � � � � � � - - -Use of 3D Imaging Data � � � � � - � � �Laser Scanner � � � - - - � � �Range Camera - - - � - - - � -Stereo Vision - - - - - - - - -Structure from Motion - - - - - - - - -CAD as a priori information - - - � - - - � -BIM as a priori information - - - - - � � � �Use of BIM - - - - - � � - �Use of IFC - - - - - - - - �Use of Model Descriptors - - - - - - - - �Model Descriptors Derived from BIM - - - - - - - - �Model Descriptor Storage/Retrieval - - - - - - - - -Experimental Approach � � � � � - � � �Prototype System � � � � � - - � �Field Demonstration � - - - - - - - -
� Focus, � Discussion

Alan M. Lytle Chapter 2. Literature Review 62
opportunities due to the ease and low cost of data acquisition as compared to traditional
laser scanning. Range camera technology is still in early development and implementation
as a construction sensor is likewise in early study.
A standardized methodology for the universal storage and retrieval of feature descriptor
information to support construction object recognition is a technology and framework gap
that is not currently addressed in the literature. This research will focus on such a framework,
with a secondary exploration of range camera use for construction object recognition.

Alan M. Lytle Chapter 2. Literature Review 63
Table 2.4: Approaches used for object recognition.
Segmentation Approach Recognition ApproachGilsinn et al. (2005) Voxel Binning, Triangulated
Irregular NetworkPCA, Bounding Box Compar-ison
Yue et al. (2006) Euclidean distance to modelcomponent
Threshold number of points;Geometric model fitting andcomparison
Akinci et al. (2006) Not addressed Spin Images
Teizer et al. (2007) Occupancy Grid, 3D MedianFiltering, K-Means Clustering
Moving Cluster Detection
Bosche and Haas (2008a) Expected location of pointsfrom scan simulation
Threshold number of points
Bosche (2010) Expected location of elementsurfaces from scan simulation
Surface visibility thresholds
Son and Kim (2010) Color-matching of 2D rectifiedimage used as mask for 3D im-age
Threshold number of points
Golparvar-Fard et al. (2011, 2010) Euclidean distance to co-registered IFC Model in-stances
Bayesian probabilistic modelbased upon physical occu-pancy and visibility thresh-olds
Borkowski et al. (2010) Flood-fill f(range), surfacenormals
Simple rule-based classifier(e.g., walls are vertical, etc.);Haar-like features

Chapter 3
Statement of the Problem
The two highest-ranked opportunities for breakthrough improvements in construction are (1)
widespread deployment and use of interoperable technology applications (i.e., BIM), and (2)
improved job-site efficiency through more effective interfacing of people, processes, materials,
equipment, and information. Information technology supporting interoperability includes
CADD, 3D/4D visualization and modeling, 3D imaging, cost estimating and scheduling tools,
and material tracking technologies. Expanded use of automated construction equipment
and information technology to support site management and stakeholder communication is
important for improving job site efficiency (NRC, 2009).
Field-automation on dynamic and cluttered construction sites will require advanced capabil-
ities in construction equipment automation, site metrology, 3D imaging, construction object
identification and tracking, data exchange, site status visualization, and design data integra-
tion. These capabilities will be needed to support autonomous or human-supervised system
behavior planning as well as information-rich machines, instruments and assessment tools to
assist project leaders, planners, and workers.
64

Alan M. Lytle Chapter 3. Statement of the Problem 65
Recognizing targeted construction objects is a fundamental enabler for the introduction of
flexible automation techniques in construction. This specific capability supports numerous
tasks including progress tracking, QA/QC, material locating, and automated piece movement
and assembly.
3.1 Existing State of Research and Practice
As noted in Chapter 2, research on construction object recognition with BIM and 3D imag-
ing remains in early stages. To the best of the author’s knowledge there is no actual field
implementation in use on constructions sites of object recognition technology beyond lab-
oratory field experiments and initial prototype implementations (e.g., Bosche et al. (2009);
Golparvar-Fard et al. (2011)). The most prevalent use today would be in the algorithms used
in 3D point cloud processing software for such tasks at automated fitting of basic geometric
shapes such as planes and cylinders or standard structural shapes to selected points (Cheok
et al., 2010).
Primary research work conducted to date on construction object recognition is to support
progress monitoring. The general approach is to segment potential objects of interest and
then compare those potential objects to the expected location of objects from the available
design information (CAD, Product Model, BIM, etc.). Techniques using 3D imaging prin-
cipally employ some general method to segment points of interest from the 3D image and
then compare those points to a model to determine if they are target points. Comparison
methods include simple number thresholding and examination of surface normals against
either a co-registered model or a virtual scan. There are examples of the use of local descrip-
tors such as Spin Images and Haar-like features. For construction equipment control, work
conducted to date is principally to support automated excavation, and centers on free-form

Alan M. Lytle Chapter 3. Statement of the Problem 66
surface generation for dig planning or recognition of key features (e.g., truck bed bound-
aries, dipper fill, bucket location, etc.). Integration of BIM-enabled 3D image construction
object recognition with construction equipment control for task completion remains an open
research area. Initial work has started on the use of BIM to provide navigation information
for mobile robots operating inside of buildings.
3.2 Research Problem
Object recognition systems require baseline information upon which to compare sensed data
to enable a recognition task. The existing BIM structure does not support the storage
and retrieval of these types of baseline information beyond shape, expected location, and
material. This limitation restricts the widespread use of diverse object recognition techniques
in the construction environment. The ability to integrate a diverse set of object recognition
data for different components in the BIM will enable many autonomous systems to access
and use these data in an on-demand learning capacity, and will accelerate the integration of
object recognition systems in the construction environment.
Building Information Models currently have some capacity to support construction object
recognition. Potential features include location, shape, relationships between objects (e.g.,
connectedness), material properties and temporal information. What is not available is a
methodology for either directly or indirectly embedding trained feature descriptor informa-
tion. This needed methodology is a technology and framework gap that is not currently
addressed in the literature. The principal goal of this research is to provide a new framework
for using a building information model to support object recognition in construction through
the storage and retrieval of trained feature descriptor information. A secondary goal is the
exploration of a new class of sensor (high frame rate 3D imaging sensors) for construction

Alan M. Lytle Chapter 3. Statement of the Problem 67
object recognition.
The principal and secondary goals will be met through answering the following questions:
1. How can Industry Foundation Classes (IFC) be used to encapsulate necessary feature
descriptor information to support object recognition of an engineered construction
component?
2. How can high frame rate 3D imaging system data be used to recognize and track
construction objects (i.e., structural steel)?
3. What is an appropriate framework for using a Building Information Model to support
a construction object recognition task?
The following specific objectives will provide both the framework and the path for answering
the research questions:
1. Develop a method for construction object recognition using IFC and range camera
data.
2. Demonstrate a framework for using a BIM to support construction object recognition.
3.3 Assumptions and Constraints
The following assumptions and constraints are established to bound the research problem:
1. Industry Foundation Classes will be the product model explored. While the approach
could have centered on CIS/2, a framework to support object recognition implemented
in IFC will have a broader applicability within the construction sector.

Alan M. Lytle Chapter 3. Statement of the Problem 68
2. IFC 2x3TC1 is the IFC version used for this research. Although version 2x4 is in the
final stages of approval it is not supported by all of the open-source IFC tools. While
the approach could have been implemented in IFCxml, the standard IFC format was
chosen as it was better supported by available research tools and it is more widely
used.
3. The construction object of interest used in this research is a 1:10 scale model of the
ConXtech column connection system. The IFC model created to demonstrate the
framework is a simplified version of the column and connector as a full IFC model is
not available and an exact replica is not required to demonstrate the concept. Open-
source or freeware modeling tools do not yet exist which can export data to the IFC
format.
4. The examination of the object recognition method is secondary to the problem of
embedding the trained feature descriptors in the BIM. As such, this research will
not present a detailed examination of the efficacy of the object recognition approach.
Occlusion (static or dynamic) and clutter is not considered.
5. For this study recognition will be limited to detection based upon the feature descriptor
match. A pose calculation through model fitting will not be performed. This provides
a test of embedding links to the feature descriptor information in the IFC model but
does not continue the process to the logical conclusion of determining where the object
is located in the reference frame of the sensor as compared to the IFC model. This
constrains the examined problem to just the trained feature descriptor aspect. Pose
determination and shape verification is left to future work. This simplification also
eliminates issues with IFC accuracy as compared to observed data. It also eliminates
the need to register the IFC model to the point cloud.

Alan M. Lytle Chapter 3. Statement of the Problem 69
6. The feature detector chosen for the example does not differentiate similar elements and
therefore is not robust enough for generic object recognition. Secondary instance iden-
tification capability such as RFID or barcode piecemark information is not considered.
7. The framework does not consider semantic information which may be available for
progress monitoring reasoning such as the physical or operational sequence among
elements. Other feature information such as location, shape, relationships between
objects (e.g., connectedness) and material properties is likewise not included. Inclusion
of these additional data is left for future work.

Chapter 4
Approach
This chapter describes the approach taken to develop and demonstrate a new extensible
framework for linking feature descriptors to a BIM to support construction object recogni-
tion. The specific implementation is a new Property Set — Pset ObjectRecognition —
within the IFC schema which provides a capability to query an IFC object for linked fea-
ture descriptors and associated sensors. A review of the IFC Property Resource and the
proposed property set schema is presented. The implementation is described including the
sensor system, the IFC model development, the object detection approach and the prototype
architecture. The results of a demonstration experiment are provided.
4.1 The IFC Object Recognition Framework
The proposed framework is based upon the Property and External Reference Resource
schemas within the IFC architecture. Within this framework a Property Set is suggested
which provides an on-demand capability to access available Feature Descriptor information
either embedded in the IFC model or referenced in an external model database. The Prop-
70
Alan M. Lytle Chapter 4. Approach 71
erty Set framework is extensible, and can be modified and adjusted as required for future
research and field implementation. The discussion which follows provides necessary back-
ground information on the Property and External Reference Resource schemas, the methods
to aggregate these schemas in a Property Set, the suggested Pset ObjectRecognition struc-
ture, and assignment of that Property Set to either object instances or object types.
4.1.1 Property Resources
The Property Resource schema in the Resource Layer (see Fig. 2.1) provides property types
that are used to describe the characteristics and behavior of an object. These properties allow
extension of the IFC architecture without having to change the model, and allow for the in-
troduction of user-defined information. Properties are defined via the abstract IfcProperty
entity, which has subclasses IfcSimpleProperty and IfcComplexProperty. Figure 4.1 pro-
vides the EXPRESS-G schema for the IfcProperty class. The IfcSimpleProperty class
provides the subclass property definitions described in Table 4.1. Of particular interest is the
IfcPropertyReferenceValue class, which allows a property value to be assigned from any
other entity within the Resource Layer, such as IfcLibraryReference from the External
Reference Resource schema. This capability is of particular import, because it enables the
linking of an external file or database within the Property Set definition.
The IfcComplexProperty object is used to define complex properties as a single property
within a property set. A complex property is one which is a collection of mixed or consistent
IfcProperty subclasses, including nesting of IfcComplexProperty entities. This allows the
addressing a collection of properties as a single property in an IfcPropertySet.
Property Resources are not directly assigned to object instances or types. Rather they are
first aggregated into an IfcPropertySet class and then assigned.
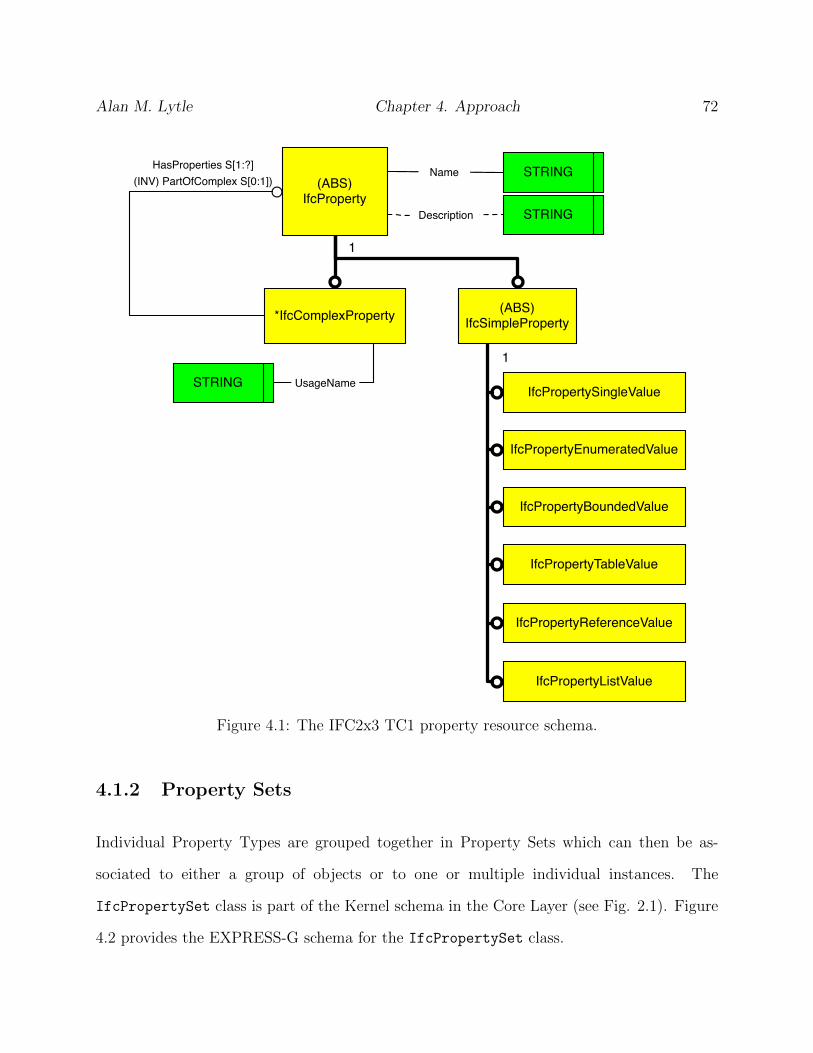
Alan M. Lytle Chapter 4. Approach 72
*IfcComplexProperty
IfcPropertySingleValue
IfcPropertyEnumeratedValue
IfcPropertyBoundedValue
IfcPropertyTableValue
IfcPropertyReferenceValue
IfcPropertyListValue
STRING
STRING
(ABS)IfcSimpleProperty
Name
Description
(ABS)IfcProperty
1
1
HasProperties S[1:?](INV) PartOfComplex S[0:1])
STRING UsageName
Figure 4.1: The IFC2x3 TC1 property resource schema.
4.1.2 Property Sets
Individual Property Types are grouped together in Property Sets which can then be as-
sociated to either a group of objects or to one or multiple individual instances. The
IfcPropertySet class is part of the Kernel schema in the Core Layer (see Fig. 2.1). Figure
4.2 provides the EXPRESS-G schema for the IfcPropertySet class.

Alan M. Lytle Chapter 4. Approach 73
Table 4.1: Property resource entities - IfcSimpleProperty.
Entity Description AttributesIfcPropertySingleValue Single numeric or descriptive
valueNominal value, Unit (optional)
IfcPropertyEnumeratedValue Value(s) assigned chosen from anenumeration
Enumeration value(s), Enumera-tion reference
IfcPropertyBoundedValue Maximum of two numeric or de-scriptive values assigned
Upper bound value, Lowerbound value, Unit (optional)
IfcPropertyTableValue Two numeric or descriptive listscreating a defined / defining re-lationship
Defining value, Defined value,Units (optional)
IfcPropertyReferenceValue Reference to another IFC Re-source layer object
Name, Reference
IfcPropertyListValue Several numeric or descriptivevalues in an ordered list
Nominal values, Unit (optional)
There are two ways to bind a Property Set to an object. Either method allows multiple
Property Sets to be associated with an object. The first method is to assign the Property
Set(s) using an IfcRelDefinesByProperties relationship. This is a method by which one
or more Property Sets can be applied to a single object instance. The other method is
to include the Property Set definition(s) in the IfcTypeObject which applies one or more
IfcPropertySet classes to every instantiation of the object defined by that particular type.
These two methods provide great flexibility in describing objects using Property Sets. A
single Property Set can be applied to more that one object, and an object can have more
than one Property Set assigned. Individual object instances can have Property Sets assigned
by both methods to extend individual instance characteristics beyond those defined for the
general type. This requires a query capability for the Property Sets which can trace both
the IfcRelDefinesByProperties relationship and the IfcTypeObject definition.

Alan M. Lytle Chapter 4. Approach 74
(ABS)IfcRoot
(ABS)IfcPropertyDefiniiton
(ABS)IfcPropertySetDefinition
*IfcPropertySet
RelatingPropertyDefinition(INV) PropertyDefinitionOf S[0:1])
HasPropertySets S[1:?])(INV) DefinesType S[0:1])
HasProperties S[1:?]
IfcRelDefinesByProperties
IfcTypeObject
IfcProperty
IfcRelAssociates
RelatedObjects S[1:?])(INV) HasAssociations S[0:1])
Figure 4.2: The IFC2x3 TC1 property set schema.
There are 317 pre-defined Property Sets in the IFC2x3 TC1 architecture. An example —
P setColumnCommon — is provided in Table 4.2
4.1.3 Proposed Object Recognition Property Set
The proposed Pset ObjectRecognition framework is based upon the Property and Ex-
ternal Reference Resource schemas within the IFC 2x3 TC1 architecture and provides an
on-demand capability to access available feature descriptor information either embedded in
the IFC model or referenced in an external model database. The Property Set framework
is extensible, and can be modified and adjusted as required for future research and field
implementation.
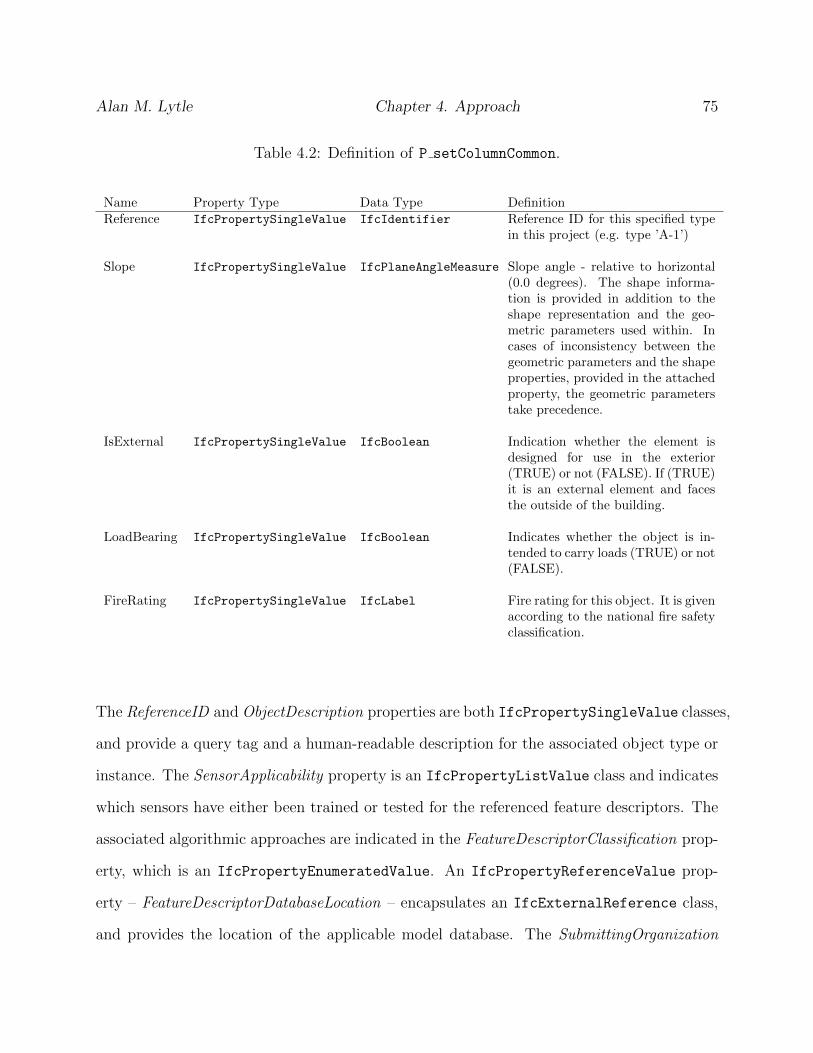
Alan M. Lytle Chapter 4. Approach 75
Table 4.2: Definition of P setColumnCommon.
Name Property Type Data Type DefinitionReference IfcPropertySingleValue IfcIdentifier Reference ID for this specified type
in this project (e.g. type ’A-1’)
Slope IfcPropertySingleValue IfcPlaneAngleMeasure Slope angle - relative to horizontal(0.0 degrees). The shape informa-tion is provided in addition to theshape representation and the geo-metric parameters used within. Incases of inconsistency between thegeometric parameters and the shapeproperties, provided in the attachedproperty, the geometric parameterstake precedence.
IsExternal IfcPropertySingleValue IfcBoolean Indication whether the element isdesigned for use in the exterior(TRUE) or not (FALSE). If (TRUE)it is an external element and facesthe outside of the building.
LoadBearing IfcPropertySingleValue IfcBoolean Indicates whether the object is in-tended to carry loads (TRUE) or not(FALSE).
FireRating IfcPropertySingleValue IfcLabel Fire rating for this object. It is givenaccording to the national fire safetyclassification.
The ReferenceID andObjectDescription properties are both IfcPropertySingleValue classes,
and provide a query tag and a human-readable description for the associated object type or
instance. The SensorApplicability property is an IfcPropertyListValue class and indicates
which sensors have either been trained or tested for the referenced feature descriptors. The
associated algorithmic approaches are indicated in the FeatureDescriptorClassification prop-
erty, which is an IfcPropertyEnumeratedValue. An IfcPropertyReferenceValue prop-
erty – FeatureDescriptorDatabaseLocation – encapsulates an IfcExternalReference class,
and provides the location of the applicable model database. The SubmittingOrganization
Alan M. Lytle Chapter 4. Approach 76
property is also an IfcExternalReference property and references the IfcOrganization
class which indicates the organization responsible for the referenced feature descriptors. The
SensorTypeGeneral and DataTypeGeneral properties are both IfcPropertyEnumeration
classes, and provide the general categories of sensors and data for which the referenced
feature descriptors are applicable.
These Property Resource entities are assigned within an IfcComplexProperty class which
is encapsulated within an IfcPropertySet. The use of the IfcComplexProperty is im-
portant, as it enables the combination of various feature descriptor approaches within a
single Property Set. For example, feature descriptors for multiple sensors and algorithmic
approaches can be combined within a single Pset ObjectRecognition and assigned to a
particular object type or instance.
The Pset ObjectRecognition schema is shown in Figure 4.18, and Table 4.3 describes the
Property Resource entities which make up the proposed Property Set. The integration of the
Pset ObjectRecognition as an assigned property to an object type or instance is shown in
Figure 4.4.
4.2 Implementation
4.2.1 Sensor System
The sensor system includes the range camera and the custom sensor interface software.
A discussion of each is included in this section, as well as a description of sensor range
uncertainty testing and the implemented mixed pixel filter.

Alan M. Lytle Chapter 4. Approach 77
IfcLibraryReference
Name
Description
STRING
STRINGIfcPropertySingleValue
ReferenceID
Name
Description
STRING
STRINGIfcPropertySingleValue
ObjectDescription
Sensor List LISTName
Description
STRING
STRINGIfcPropertyListValue
SensorApplicability
All Feature Des. EnumerationName
Description
STRING
STRINGIfcPropertyEnumeratedValue
FeatureDescriptorClassification
App. Feature Des. Enumeration
Location STRING
Name
Description
STRING
STRINGIfcPropertyReferenceValue
FeatureDescriptorDatabaseLocation
Name STRING
IfcOrganizationName STRING
Name
Description
STRING
STRINGIfcPropertyReferenceValue
SubmittingOrganization
Organization STRING
Sensor Types EnumerationName
Description
STRING
STRINGIfcPropertyEnumeratedValue
SensorTypeGeneral
Applicable Sensor Types Enumeration
Data Types EnumerationName
Description
STRING
STRINGIfcPropertyEnumeratedValue
DataTypeGeneral
Applicable Data Types Enumeration
Figure 4.3: The proposed object recognition property set.

Alan M. Lytle Chapter 4. Approach 78
(ABS)IfcPropertyDefiniiton
(ABS)IfcPropertySetDefinition
*IfcPropertySet
RelatingPropertyDefinition(INV) PropertyDefinitionOf S[0:1])
HasPropertySets S[1:?])(INV) DefinesType S[0:1])
HasProperties S[1:?]
IfcRelDefinesByProperties
IfcRelAssociates
RelatedObjects S[1:?])(INV) HasAssociations S[0:1])
*IfcComplexProperty
IfcPropertySingleValue
IfcPropertyEnumeratedValue
IfcPropertyBoundedValue
IfcPropertyTableValue
IfcPropertyReferenceValue
IfcPropertyListValue
STRING
STRING
(ABS)IfcSimpleProperty
Name
Description
1
1
HasProperties S[1:?](INV) PartOfComplex S[0:1])
UsageName STRING
(ABS)IfcProperty
IfcLibraryReference
Name
Description
STRING
STRINGIfcPropertySingleValue
ReferenceID
Name
Description
STRING
STRINGIfcPropertySingleValue
ObjectDescription
Sensor List LISTName
Description
STRING
STRINGIfcPropertyListValue
SensorApplicability
All Feature Des. EnumerationName
Description
STRING
STRINGIfcPropertyEnumeratedValue
FeatureDescriptorClassification
App. Feature Des. Enumeration
Location STRING
Name
Description
STRING
STRINGIfcPropertyReferenceValue
FeatureDescriptorDatabaseLocation
Name STRING
IfcOrganizationName STRING
Name
Description
STRING
STRINGIfcPropertyReferenceValue
SubmittingOrganization
Organization STRING
Sensor Types EnumerationName
Description
STRING
STRINGIfcPropertyEnumeratedValue
SensorTypeGeneral
Applicable Sensor Types Enumeration
Data Types EnumerationName
Description
STRING
STRINGIfcPropertyEnumeratedValue
DataTypeGeneral
Applicable Data Types Enumeration
Properties of Pset_ObjectRecognition
IfcTypeObject
IfcTypeProduct
IfcElementType
IfcBuildingElementType
IfcColumnType
(ABS)IfcRoot
IfcObject
IfcProduct
IfcElement
IfcBuildingElement
IfcColumn
IfcObjectDefinition
HasPropertySets S[1:?])(INV) RelatingPropertyDefinition S[0:1])
Figure 4.4: The Pset ObjectRecognition schema.
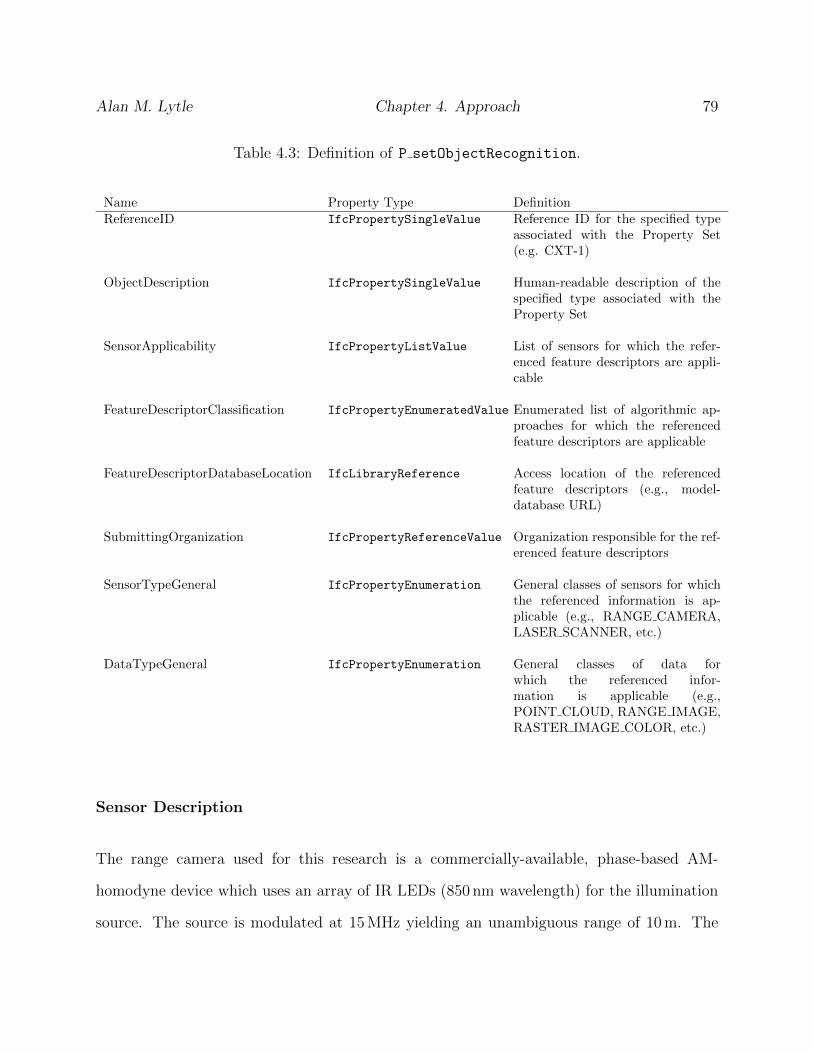
Alan M. Lytle Chapter 4. Approach 79
Table 4.3: Definition of P setObjectRecognition.
Name Property Type DefinitionReferenceID IfcPropertySingleValue Reference ID for the specified type
associated with the Property Set(e.g. CXT-1)
ObjectDescription IfcPropertySingleValue Human-readable description of thespecified type associated with theProperty Set
SensorApplicability IfcPropertyListValue List of sensors for which the refer-enced feature descriptors are appli-cable
FeatureDescriptorClassification IfcPropertyEnumeratedValue Enumerated list of algorithmic ap-proaches for which the referencedfeature descriptors are applicable
FeatureDescriptorDatabaseLocation IfcLibraryReference Access location of the referencedfeature descriptors (e.g., model-database URL)
SubmittingOrganization IfcPropertyReferenceValue Organization responsible for the ref-erenced feature descriptors
SensorTypeGeneral IfcPropertyEnumeration General classes of sensors for whichthe referenced information is ap-plicable (e.g., RANGE CAMERA,LASER SCANNER, etc.)
DataTypeGeneral IfcPropertyEnumeration General classes of data forwhich the referenced infor-mation is applicable (e.g.,POINT CLOUD, RANGE IMAGE,RASTER IMAGE COLOR, etc.)
Sensor Description
The range camera used for this research is a commercially-available, phase-based AM-
homodyne device which uses an array of IR LEDs (850 nm wavelength) for the illumination
source. The source is modulated at 15MHz yielding an unambiguous range of 10m. The

Alan M. Lytle Chapter 4. Approach 80
FPA is 176 pixels (horizontal) x 144 pixels (vertical) QCIF (Quarter Common Intermediate
Format) with a corresponding nominal field of view (FOV) of 43◦ × 35◦. The returned sig-
nal is sampled during each quarter wavelength to establish the phase shift. The phase angle
correlates to the range of the reflected surface. Data returned from the device include range
and amplitude per pixel at a frame rate of up to 54Hz. The range camera has both hard-
ware and software trigger modes. The range camera is shown in Figure 4.5. Manufacturer’s
specifications are provided in Table 4.4.
Figure 4.5: The Mesa Imaging AG SwissRanger 4000.
Table 4.4: Specifications for the Mesa Imaging AG SwissRanger 4000.
Illumination Source: IR LEDs (850 nm)Pixel Array Size: 176 (horizontal) × 144 (vertical)Field of View (FOV): 43.6◦ × 34.6◦
Operating Range: 0.3m to 10mRange Accuracy: maximum of 1% of range or ±1 cm
single pixel (1σ); 50% reflective targetAngular Resolution: 0.23◦
Frame Rate: up to 54HzDimensions: 65mm× 65mm× 90mmComputer Interface: USB 2.0 or Ethernet

Alan M. Lytle Chapter 4. Approach 81
Sensor Interface Software
The SR4000 sensor is delivered with Windows OS and Linux drivers and a sample viewing
package for Windows OS. To support the required development and testing, a more com-
plete and flexible sensor interface package was needed. A custom software application was
developed in MATLAB to provide the capabilities listed in Table 4.5. Figure 4.6 shows a
screen-capture of the software application.
Table 4.5: Sensor interface software design requirements.
Instrument controlViewing and processing both live and off-line range dataPoint cloud viewing and segmentationSingle, multiple (user-selected number), and continuous frame acquisitionIntegrated computer vision algorithm testingFeature trainingData set storage and retrieval
Figure 4.6: The SR4000 sensor interface software.

Alan M. Lytle Chapter 4. Approach 82
Range Uncertainty Testing
Understanding the ability of a 3D imaging system to measure range is a fundamental design
constraint in implementing a 3D imaging-based sensor system. Range is defined “... the
distance, in units of length, between a point in space and an origin fixed to the 3D imaging
system that is measuring that point.” (ASTM, 2009). There is currently no consistent
standard for measuring range uncertainty of a 3D imaging system. Manufacturers report
range accuracy of their systems according to their own test protocols. Range uncertainty
is that uncertainty associated with a distance measurement reported by an instrument to a
given object of interest (or target). Range uncertainty as a function of target range, target
reflectance, and target angle of incidence is of particular interest. To support this research an
experiment was conducted at NIST adapting procedures originally reported in (Lytle et al.,
2005) and modified based upon initial work on an international standard for 3D imaging
range uncertainty testing (Cheok et al., 2007).
To assess the ranging performance of the sensor, planar targets of known reflectance values
were imaged at ranges of 0.5m to 5m. The range increment between sample points was
0.5m. The sensor was mounted on an 8m linear rail and was repositioned for each sample.
The target was stationary and positioned so that the angle of incidence from the sensor was
0◦. Ground truth was measured using a laser distance meter with a range uncertainty of
±1.5mm over a range of 0.2m to 200m. At each sample location, 100 images were collected.
The data collection process was repeated for each of the three planar targets (reflectance =
20%, 50% and 75%).
For each sample position the target area was manually segmented in the sensor interface
software. This segmentation mask was applied to all of the 100 images collected for each
range / reflectance combination. For each of the 100 segmented range images per sample
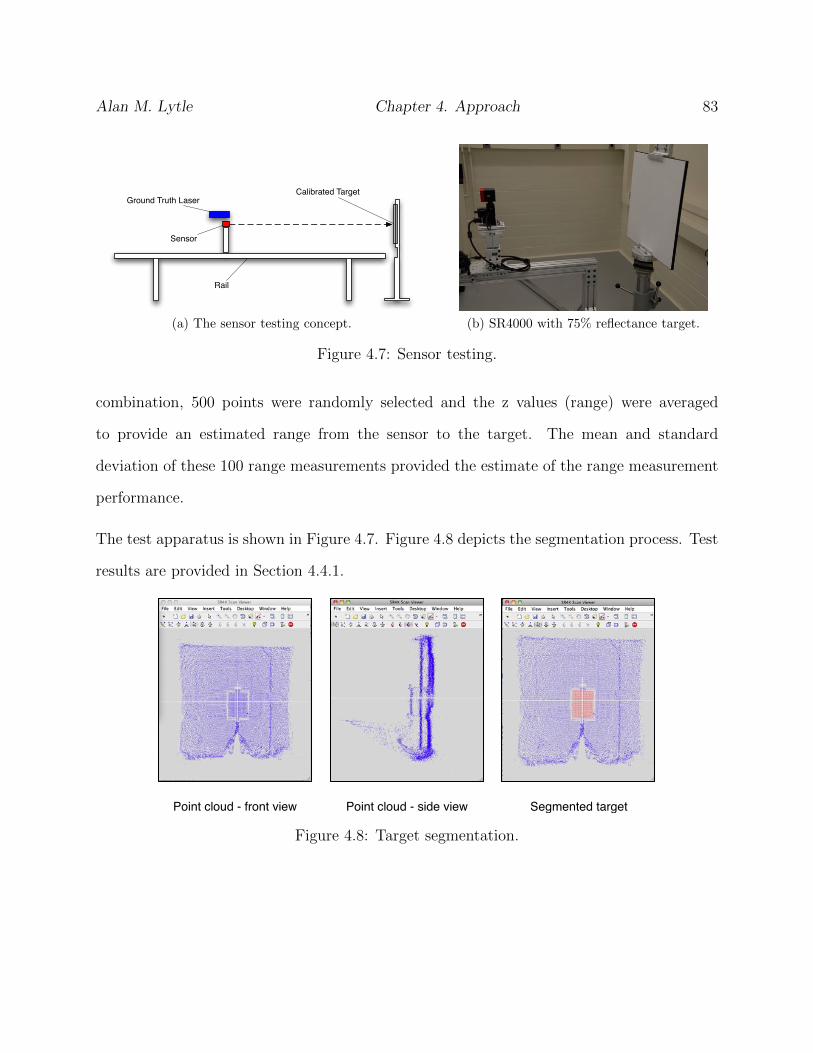
Alan M. Lytle Chapter 4. Approach 83
Sensor
Rail
Ground Truth LaserCalibrated Target
(a) The sensor testing concept. (b) SR4000 with 75% reflectance target.
Figure 4.7: Sensor testing.
combination, 500 points were randomly selected and the z values (range) were averaged
to provide an estimated range from the sensor to the target. The mean and standard
deviation of these 100 range measurements provided the estimate of the range measurement
performance.
The test apparatus is shown in Figure 4.7. Figure 4.8 depicts the segmentation process. Test
results are provided in Section 4.4.1.
Point cloud - front view Point cloud - side view Segmented target
Figure 4.8: Target segmentation.

Alan M. Lytle Chapter 4. Approach 84
Mixed Pixel Filter
As described in Chapter 2 mixed-pixels (sometimes also referred to as phantom pixels) are a
phenomenon encountered with both phase- and pulse TOF 3D imaging systems. Although
one imagines a laser source as an infinitesimally small ray, the laser spot footprint has
a discernible size that generally increases with range. When this footprint only partially
intersects an object (e.g., on an edge), the remaining photons continue to travel and can be
reflected by a second surface. Depending upon the relative distance between the two surfaces
and the integration time of the system, these offset returns will be combined and result in
data points somewhere between the two surfaces, yielding data points where no physical
surface reflections exists. The SR4000 sensor is particular susceptible to mixed pixel effects
due to the relatively large pixel footprint.
A mixed pixel filter was needed which could automatically detect and remove these false
returns. The straightforward solution was to look areas of range discontinuity and eliminate
the potentially affected pixels. Initial efforts centered on traditional edge detection and
morphology operations to create an image mask. The final improved approach used a 3x3
max/min filter on the range image. The resulting image was then converted to a binary
image using Otsu’s algorithm (Otsu, 1979) for global thresholding. The resulting binary
image was used as a noise mask to eliminate points from the point cloud which were likely
to be spurious data points. A range image, the corresponding noise mask and the pre- and
post-segmented point cloud is shown in Figure 4.9.
4.2.2 Target Object
The target construction object used in this research is 1:10 scale model of a ConXtech column
with a self-aligning, drop-in connection system. The column is shown in Figure 4.10b. This

Alan M. Lytle Chapter 4. Approach 85
Range Image Noise Mask
Point Cloud - side view (right) with mixed pixels
Point Cloud - side view (right) with mixed pixels removed
Figure 4.9: The sensor interface mixed pixel filter.
object was chosen for three reasons. First, it is a convenient object to use for laboratory
testing because of its small size. Second, the drop-in assembly capability it enables provides
opportunity for future automated steel assembly research as an extension to prior work using
ATLSS connectors (Lytle and Saidi, 2007). Third, the ConXtech space frame system is not
simply a research idea, but is actually in use for commercial construction. See (ConXtech,
2011; Bijlaard et al., 2009) for more information on the ConXtech system.
An IFC model for the target object was created using the Open IFC Java Toolbox (Tauscher
and Tulke, 2008). The CreateConxtechColumn class instantiated a new ConXtech column

Alan M. Lytle Chapter 4. Approach 86
(a) The ConXtech columnscale model.
(b) The IFC model.
Figure 4.10: The target object.
within an IfcProject and generated an IFC-compliant STEP file. The IFC file was verified
using the free software applications Solibri Model Viewer (Solibri, 2010) and IfcQuickBrowser
(GEM, 2010). The CreateConxtechColumn class also created the Pset ObjectRecognition
for the target object as described in Section 4.3.3. The target object and a screen capture
of the IFC model in the Solibri Model Viewer is shown in Figure 4.10.
4.2.3 Object Detection Methodology
As described in Section 3.3, the development of a robust object recognition algorithm was be-
yond the scope of this research. Instead, the focus was on developing and demonstration the
proposed information modeling framework to an object recognition problem in construction.
A secondary focus was on examining the use of range camera technology for future construc-
tion automation applications. To demonstrate the proposed IFC Pset ObjectRecogntion,
an object detection experiment was designed to exercise the framework in a computer vision
application using the target construction object. The detection approach centered on the

Alan M. Lytle Chapter 4. Approach 87
use of SIFT feature descriptors in a range image.
The Scale Invariant Feature Transform (SIFT) approach of (?) is a widely used and highly
rated local descriptor for 2D images (Mikolajczyk and Schmid, 2005). The SIFT algorithm
identifies keypoints in an image with an associated region (known as an oriented disk) with
assigned scale and orientation. Keypoints are identified as local maxima/minima of the
difference of Gaussian images across scale space. If the resulting pixel value is maximum
or minimum among all compared pixels in a certain neighborhood, the pixel is selected as
a keypoint. Low contrast and edge-based keypoints are rejected, and then orientations for
each remaining keypoint are assigned from the histograms of the gradients in the interest
point’s neighborhood. SIFT descriptors compactly encode each feature into a 128-element
vector. The use of SIFT feature detection in the intensity image of a range camera which
is then used in the corresponding range image to identify the 3D location of those pixels
was shown by (Zhou et al., 2007). Adaptations to SIFT for range images include (Skelly
and Sclaroff, 2007; Lo and Siebert, 2009) The SIFT implementation used in the framework
demonstration was from (Vedaldi and Fulkerson, 2008).
In the demonstration experiment, SIFT features were used to identify potential regions of in-
terest for point segmentation rather than specific object recognition. After image acquisition,
a range image was generated with the associated noise mask. SIFT features were identified
within this range image and matched against training data from the model database accesses
via the Pset ObjectRecogntion property set. The highest ranking SIFT feature was then
used as a seed point for a region growing algorithm applied to the range image data. The
single-value threshold for the region growing algorithm was tuned based on the training data
to provide optimum segmentation results for the target construction object. The results
from the region growing step were used to create binary image mask for point cloud segmen-
tation. The image mask was used to segment the point cloud for the points of interest. The

Alan M. Lytle Chapter 4. Approach 88
approach is shown in Figures 4.11 – 4.15.
Point Cloud
Range Image
Noise Mask
Figure 4.11: Object detection sequence (A): (1) acquire range data, (2) generate a rangeimage, (3) create a noise mask.
Figure 4.12: Object detection sequence (B): (4) identify SIFT features in the range image.
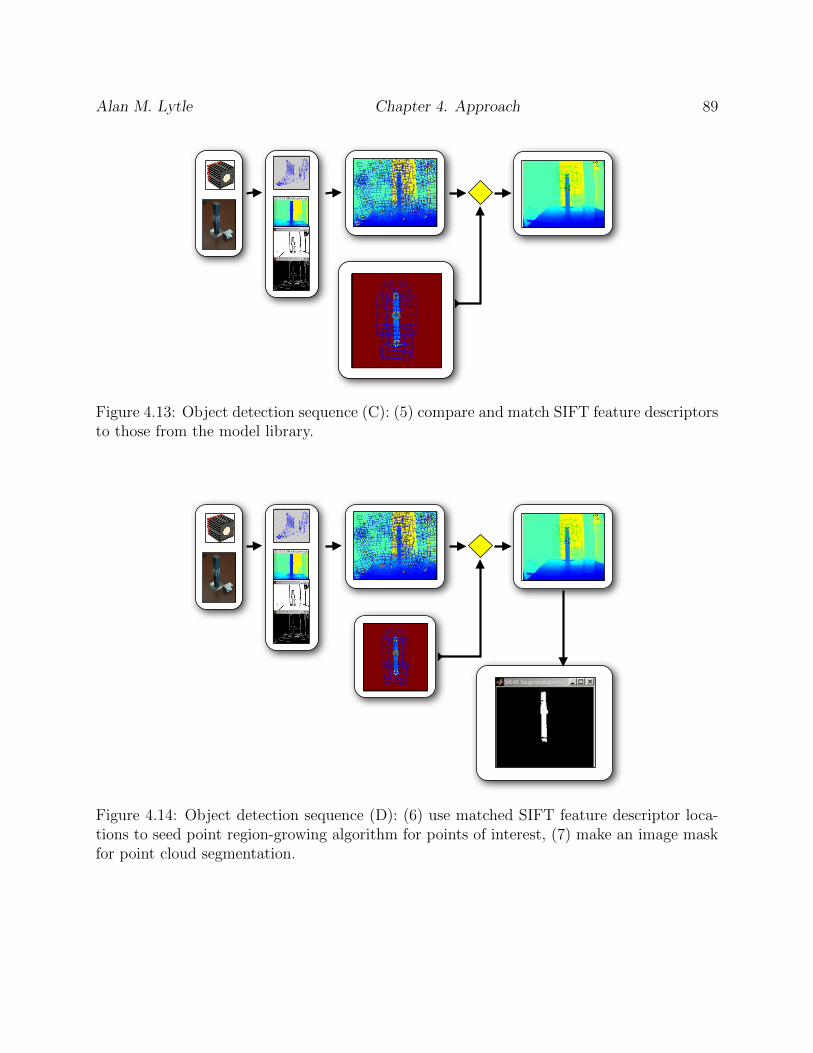
Alan M. Lytle Chapter 4. Approach 89
Figure 4.13: Object detection sequence (C): (5) compare and match SIFT feature descriptorsto those from the model library.
Figure 4.14: Object detection sequence (D): (6) use matched SIFT feature descriptor loca-tions to seed point region-growing algorithm for points of interest, (7) make an image maskfor point cloud segmentation.
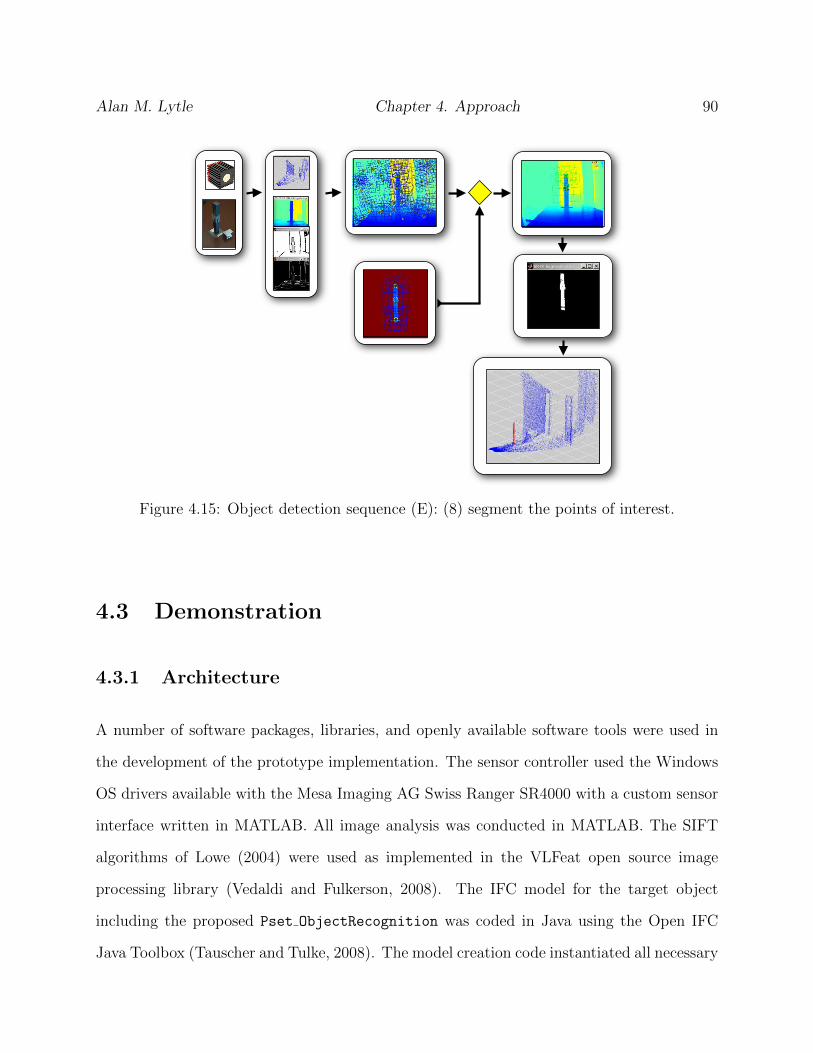
Alan M. Lytle Chapter 4. Approach 90
Figure 4.15: Object detection sequence (E): (8) segment the points of interest.
4.3 Demonstration
4.3.1 Architecture
A number of software packages, libraries, and openly available software tools were used in
the development of the prototype implementation. The sensor controller used the Windows
OS drivers available with the Mesa Imaging AG Swiss Ranger SR4000 with a custom sensor
interface written in MATLAB. All image analysis was conducted in MATLAB. The SIFT
algorithms of Lowe (2004) were used as implemented in the VLFeat open source image
processing library (Vedaldi and Fulkerson, 2008). The IFC model for the target object
including the proposed Pset ObjectRecognition was coded in Java using the Open IFC
Java Toolbox (Tauscher and Tulke, 2008). The model creation code instantiated all necessary
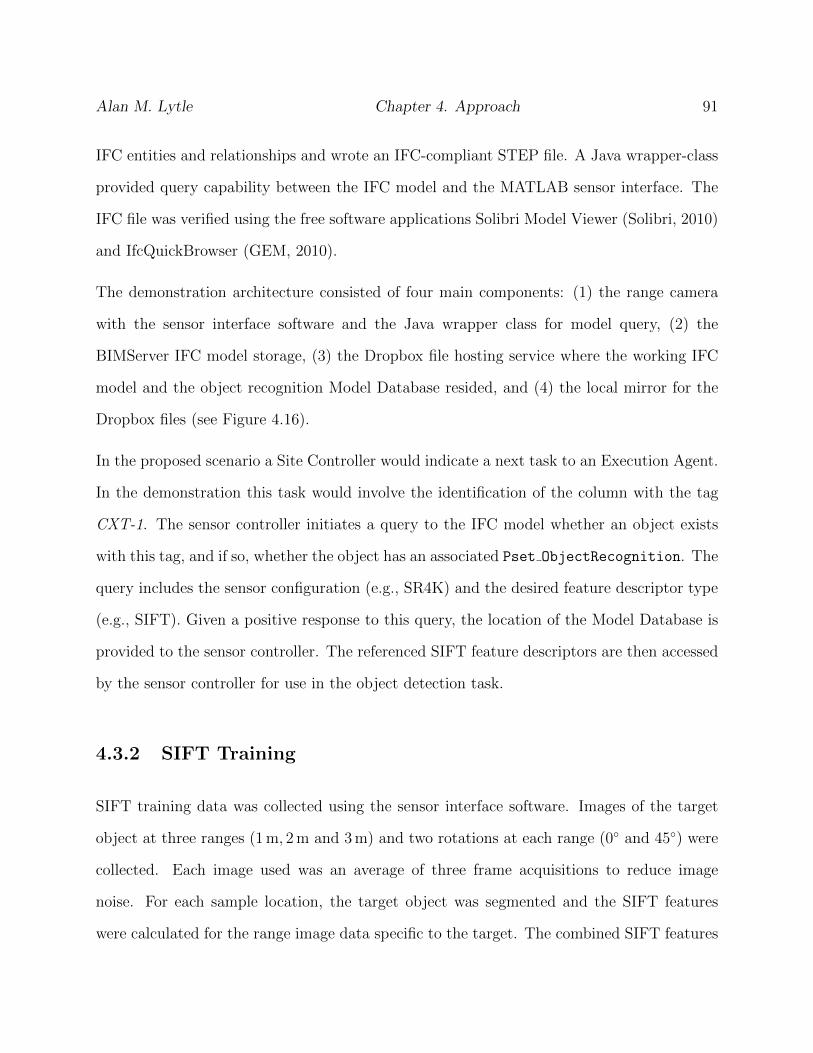
Alan M. Lytle Chapter 4. Approach 91
IFC entities and relationships and wrote an IFC-compliant STEP file. A Java wrapper-class
provided query capability between the IFC model and the MATLAB sensor interface. The
IFC file was verified using the free software applications Solibri Model Viewer (Solibri, 2010)
and IfcQuickBrowser (GEM, 2010).
The demonstration architecture consisted of four main components: (1) the range camera
with the sensor interface software and the Java wrapper class for model query, (2) the
BIMServer IFC model storage, (3) the Dropbox file hosting service where the working IFC
model and the object recognition Model Database resided, and (4) the local mirror for the
Dropbox files (see Figure 4.16).
In the proposed scenario a Site Controller would indicate a next task to an Execution Agent.
In the demonstration this task would involve the identification of the column with the tag
CXT-1. The sensor controller initiates a query to the IFC model whether an object exists
with this tag, and if so, whether the object has an associated Pset ObjectRecognition. The
query includes the sensor configuration (e.g., SR4K) and the desired feature descriptor type
(e.g., SIFT). Given a positive response to this query, the location of the Model Database is
provided to the sensor controller. The referenced SIFT feature descriptors are then accessed
by the sensor controller for use in the object detection task.
4.3.2 SIFT Training
SIFT training data was collected using the sensor interface software. Images of the target
object at three ranges (1m, 2m and 3m) and two rotations at each range (0◦ and 45◦) were
collected. Each image used was an average of three frame acquisitions to reduce image
noise. For each sample location, the target object was segmented and the SIFT features
were calculated for the range image data specific to the target. The combined SIFT features

Alan M. Lytle Chapter 4. Approach 92
www.bimserver.org
www.dropbox.com
Model Database(Object Recognition)
MethodsAttributesSensorController
www.dropbox.com
Model Database(Object Recognition)
Local Mirror
Master ControllerNext is ...“CXT-1”
Query:- Contains CXT-1?- Has P_SetObjectRecognition?Returns: - Database Reference
getDatabaseLocation
ReferenceIDSensorApplicabilityFeatureDescriptorClassification
IfcModelQuery
Returns:- Object recognition reference data
Figure 4.16: The implementation architecture.
and associated descriptors for each range/rotation combination were stored in the model
database accessed in the IFC Pset ObjectRecognition query. The training sequence is
shown in Figure 4.17.
4.3.3 Object Recognition Property Set
The Pset ObjectRecognition framework described in Section 4.1.3 was used for the demon-
stration. Specific values used for the property resource entities within the property set are
provided in Table 4.6.

Alan M. Lytle Chapter 4. Approach 93
AcceptReject
Segmented Point Cloud / SIFT DescriptorsPoint Cloud / SIFT Descriptors
1 m 2 m 3 m
Figure 4.17: Training the SIFT descriptors. Ranges: 1m, 2m, 3m. Rotations: 0◦, 45◦.
Table 4.6: Implemented P setObjectRecognition.
Name Property Type ValueReferenceID IfcPropertySingleValue CXT-1
ObjectDescription IfcPropertySingleValue ConXtech 1:10 scale column withconnector
SensorApplicability IfcPropertyListValue SR4K
FeatureDescriptorClassification IfcPropertyEnumeratedValue SIFT
FeatureDescriptorDatabaseLocation IfcLibraryReference /Users/alytle/Dropbox/aIfcDataBase/
SubmittingOrganization IfcPropertyReferenceValue VCEMP
SensorTypeGeneral IfcPropertyEnumeration RANGE CAMERA
DataTypeGeneral IfcPropertyEnumeration RANGE IMAGE

Alan M. Lytle Chapter 4. Approach 94
IfcLibraryReference
Name
Description
STRING
STRINGIfcPropertySingleValue
ReferenceID
Name
Description
STRING
STRINGIfcPropertySingleValue
ObjectDescription
Sensor List LISTName
Description
STRING
STRINGIfcPropertyListValue
SensorApplicability
All Feature Des. EnumerationName
Description
STRING
STRINGIfcPropertyEnumeratedValue
FeatureDescriptorClassification
App. Feature Des. Enumeration
Location STRING
Name
Description
STRING
STRINGIfcPropertyReferenceValue
FeatureDescriptorDatabaseLocation
Name STRING
IfcOrganizationName STRING
Name
Description
STRING
STRINGIfcPropertyReferenceValue
SubmittingOrganization
Organization STRING
Sensor Types EnumerationName
Description
STRING
STRINGIfcPropertyEnumeratedValue
SensorTypeGeneral
Applicable Sensor Types Enumeration
Data Types EnumerationName
Description
STRING
STRINGIfcPropertyEnumeratedValue
DataTypeGeneral
Applicable Data Types Enumeration
Figure 4.18: The proposed object recognition property set.
Alan M. Lytle Chapter 4. Approach 95
4.3.4 Object Detection Testing
The Pset ObjectRecognition framework was used in an object detection experiment to
validate the approach. The detection method itself was evaluated using precision and recall
ratios. Precision is calculated as the ratio of all true positive (TP) detections to all true
positive and false positive (FP) detections. Therefore,
Precision =TP
(TP + FP )(4.1)
Recall is the ratio of of all true positive detections to all true positive and false negative (FN)
detections. Therefore,
Recall =TP
(TP + FN)(4.2)
True positive indicates that the point cloud was appropriately segmented and the points
associated with the target object were selected. A false positive indicates that a subset of
points within the point cloud was selected but they did not represent the target object. A
false negative indicates no subset of points within the point cloud was selected though the
target object was present.1
Images of the target object were collected at five ranges: 1m to 3m (step 0.5m). At each
range images at three different rotations were obtained: 0◦, 22.5◦, 45◦. This collection process
was repeated for two additional locations (left and right of centerline) for each of the nominal
range positions. Similar to training data collection, each image used was an average of three
frame acquisitions to reduce image noise. The testing sequence is shown in Figure 4.19. Test
results are provided in Section 4.4.2.
1A review of evaluating the performance of computer vision algorithms is provided in (Clark and Clark,1999)

Alan M. Lytle Chapter 4. Approach 96
1 m 2 m 3 m
Figure 4.19: Testing the detection implementation. Ranges: 1m to 3m (step 0.5m). Rota-tions: 0◦, 22.5◦, 45◦.
4.4 Results
4.4.1 Sensor Range Testing
The results of the range error measurement are shown in Figure 4.20. In general, range
uncertainty increased with range as expected. Also range uncertainty and the range er-
ror reduced with increasing target reflectance as long as the sensor was not saturated with
returned light. The observed performance was not within the manufacturer’s reported spec-
ifications for range error, though this fourth-generation sensor performs significantly better
than predecessor units (Lytle et al., 2005). In subsequent implementations, the increasing
range uncertainty should be taken into account for point segmentation thresholding.

Alan M. Lytle Chapter 4. Approach 97
4.4.2 Object Detection Testing
The framework for using a Pset ObjectRecogntion property set to link the trained SIFT de-
scriptors for the target object within the IFC model worked successfully. The IFC model was
queried for the existence of an CXT-1 object with an associated Pset ObjectRecogntion
for the sensing modality and local feature descriptor algorithm in use. The external reference
for the CXT-1 model database containing the SIFT descriptors was returned, and the object
detection sequence was executed on the image data using that model database information.
Although the actual results of the detection test are secondary to the framework validation,
there were some observations worth noting for future research. This approach generated in-
sufficient information in the 2D range image on the object to produce enough SIFT features
for object recognition. However, the use of SIFT feature matches to seed point cloud seg-
mentation and ranking regions of interest proved successful. The overall precision and recall
rates for the test were 90% and 78%, respectively. As can be seen in Table 4.7, the majority
of the false detections (positive or negative) happened at a 45◦ target rotation where high
noise impacted the region-growing algorithm. A dynamic threshold for region-growing based
upon training and characterization data would have improved system performance but was
not implemented. In this instance, a static threshold was used. Figure 4.21 shows the true
and false positive evaluation criteria. Results from the testing are shown in Table 4.7.
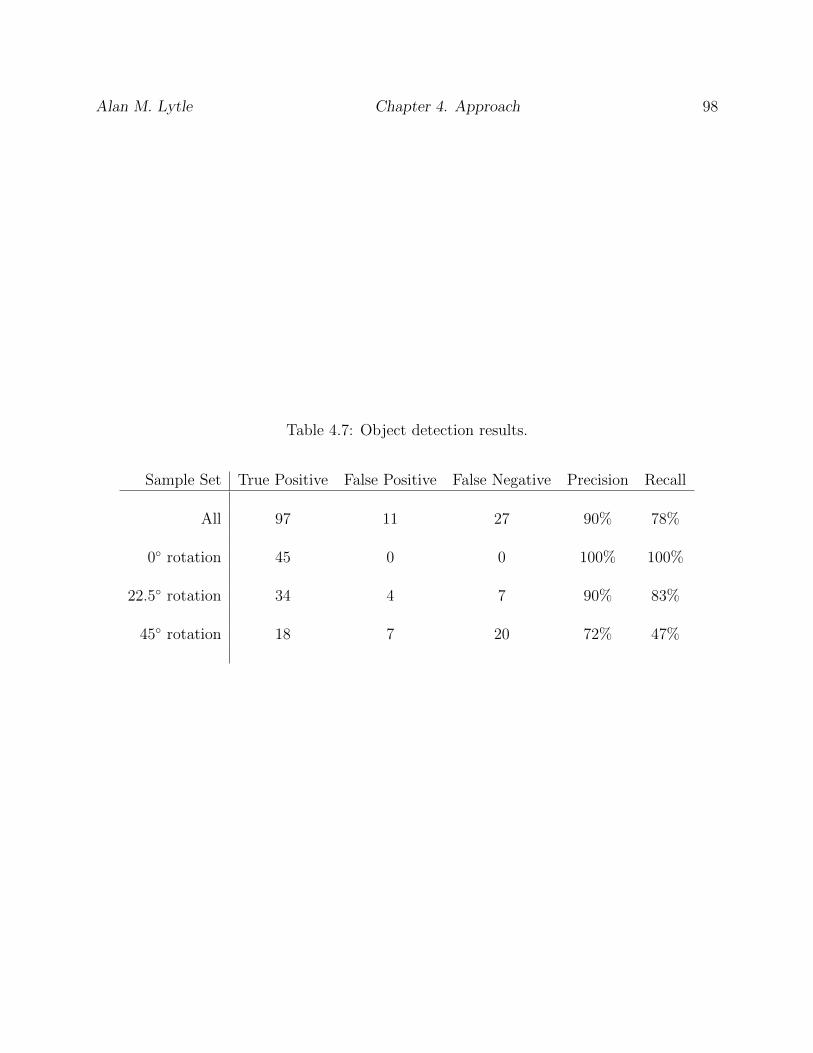
Alan M. Lytle Chapter 4. Approach 98
Table 4.7: Object detection results.
Sample Set True Positive False Positive False Negative Precision Recall
All 97 11 27 90% 78%
0◦ rotation 45 0 0 100% 100%
22.5◦ rotation 34 4 7 90% 83%
45◦ rotation 18 7 20 72% 47%

Alan M. Lytle Chapter 4. Approach 99
0 0.5 1 1.5 2 2.5 3 3.5 4 4.5 5 5.5−0.02
0
0.02
0.04
0.06
0.08
0.1Range Error vs. Range
Nominal Range (m)
Ran
ge E
rror (
m)
Reflectance = 20%Reflectance = 50%Reflectance = 75%
Figure 4.20: SR4000 range uncertainty test results for n = 100 image samples and 500 targetpixels sampled per range image. All samples are with the target angle of incidence = 0◦.Target reflectances 20%, 50% and 75%. Plotted points are offset slightly for visibility. Errorbars indicate uncertainty (±1 σ).

Alan M. Lytle Chapter 4. Approach 100
True Positive
False Positive(correct SIFT seed point)
False Positive(incorrect SIFT seed point)
Figure 4.21: Object detection evaluation criteria: true positive (top), false positive due toinsufficient point segmentation but with the correct SIFT seed points (middle), false positivedue to incorrect SIFT seed points (bottom).

Chapter 5
Conclusions
5.1 Findings
The three principal findings from this research are as follows:
1. The use of the IFC schema to either embed or link information to support construction
object recognition is both feasible and recommended. In this research, a framework
was developed and demonstrated to provide an initial example using a new Property
Set construct to support construction object recognition.
2. The SwissRanger SR4000 range camera is a much-improved sensor in its fourth-generation
implementation, though the sensor noise level and low pixel count are limiting factors
for use as a stand-alone sensor. An improved approach would be to couple the range
data with traditional optical image data (e.g., color machine vision camera). As these
sensors continue to improve they will be powerful enablers for construction automation,
particularly for construction equipment control.
101

Alan M. Lytle Chapter 5. Conclusions 102
3. SIFT is a potential approach for identifying regions of interest within range images.
More testing and development with SIFT and other scale and partially affine invariant
feature transforms is required (especially for texture-less surfaces).
5.2 Contribution
This research developed and demonstrated a new extensible framework for linking feature
descriptors to a BIM to support construction object recognition. The proposed framework is
based upon the Property and External Reference Resource schemas within the IFC 2x3 TC1
architecture. Within this framework a Property Set is suggested which provides an on-
demand capability to access available Feature Descriptor information either embedded in
the IFC model or referenced in an external model database. The Property Set frame-
work is extensible, and can be modified and adjusted as required for future research and
field implementation. With this framework multiple sets of feature descriptors associated
with different sensing modalities and different algorithms can all be aggregated into one
Pset ObjectRecognition property set and assigned to an object type or object instance.
5.3 Recommendations
The need to bring together experts in BIM and mobile robotics to explore this new interdis-
ciplinary domain was recommended in Borkowski et al. (2010). Based upon this research,
the following recommendations for future work are provided:
1. IFC Architecture: Transition the IFC2x3 TC1 proposed property set Pset ObjectRecognition
to the new IFC2x4 schema.
Alan M. Lytle Chapter 5. Conclusions 103
2. Pset ObjectRecognition Definition: The proposed definition for the property set is
an initial construct to support the lab demonstration. This will be a changing defini-
tion as more object recognition opportunities are identified and defined. One suggested
area of research is an examination of the range of feature descriptors and the devel-
opment of an overall taxonomy of fields to support an expanded implementation of
Pset ObjectRecognition.
3. New Property Sets: The Pset ObjectRecognition framework for linking feature de-
scriptors to classes or instances within an IFC model can be extended to other cases
where it would be useful to link external information to particular classes or instances.
Implementations could include property sets to link 3D image data or photographs to
particular object or set of objects (e.g., Pset 3DImage, Pset CameraImage).
4. Range Camera: There are several recommendations for extending the object detec-
tion/recognition approach with the SR 4000. The first is to couple the range data with
traditional optical image data and combine the capabilities of both sensing modali-
ties. The region growing approach can be improved with an adaptive threshold based
upon the local variation of range (i.e., noise levels) within the vicinity of the identified
SIFT feature constrained by the uncertainty bounds determined in the sensor charac-
terization experiment. This implementation used the best SIFT match as a seed for
the region-growing. A better approach would be to grow from each of the matched
SIFT features and then test for which set(s) have the highest confidence factor for
representing the target object.
5. Expanded IFC-based Object Recognition: An IFC model can contain other semantic
information to support object recognition. This information not only includes shape,
location, and material properties, but also encompasses relationships between objects.
Tang et al. (2010) presents three categories of spatial relationships relating to knowl-

Alan M. Lytle Bibliography 104
edge representation in BIM: (1) aggregation, (2) topology and (3) direction. An ag-
gregation represents a part of relationship (e.g., IfcRelAggregates). A topological
relationship defines connectedness, space, covering, etc, (e.g., IfcRelConnects). A di-
rectional relationship indicates relative location, and can be derived from location data
associated with components of interest. Future research should examine the extension
of the approach presented with additional semantic information derived from the IFC
model to enhance BIM-enabled object recognition.

Bibliography
B. Akinci, F. Boukamp, C. Gordon, D. Huber, C. Lyons, and K. Park. A formalism forutilization of sensor systems and integrated project models for active construction qualitycontrol. Automation in Construction, 15(2):124–138, 2006.
Yusuf Arayici. An approach for real world data modelling with the 3D terrestrial laserscanner for built environment. Automation in Construction, 16(6):816–829, 2007.
F. Arman and J. K. Aggarwal. Object recognition in dense range images using a CADsystem as a model base. IEEE International Conference on Robotics and Automation,pages 1858–1863, 1990.
F. Arman and J. K. Aggarwal. Model-based object recognition in dense-range images. areview. ACM computing surveys, 25(1):5–43, 1993.
ASTM. ASTM E2544 09B Standard terminology for three-dimensional (3D) imaging sys-tems. Technical report, 2009.
P. J. Besl. Active, optical range imaging sensors. Machine Vision and Applications, 1(2):127–152, 1988.
P. J. Besl and R. C. Jain. Invariant surface characteristics for 3D object recognition in rangeimages. Computer Vision, Graphics, and Image Processing, 33(1):33–80, 1986.
P. J. Besl and N. D. McKay. A method for registration of 3-D shapes. IEEE Transactionson Pattern Analysis and Machine Intelligence, 14(2):239–256, 1992.
Paul J. Besl and Ramesh C. Jain. Three-dimensional object recognition. ACM Comput.Surv., 17(1):75–145, 1985. 4081.
Frans S. K. Bijlaard, Ana M. Giro Coelho, and Victor J. D. A. Magalhes. Innovative jointsin steel construction. Steel Construction, 2(4):243–247, 2009.
T. O. Binford. Visual perception by computer. In IEEE Conference on Systems and Control,volume 261, 1971.
T. O. Binford. Generalized cylinder representation. Encyclopedia of Artificial Intelligence,page 321, 1987.
105
Alan M. Lytle Bibliography 106
F. Blais, J. A. Beraldin, S. F. El-Hakim, and L. Cournoyer. Real-time geometrical trackingand pose estimation using laser triangulation and photogrammetry. In Third InternationalConference on 3-D Digital Imaging and Modeling, pages 205–212, 2001.
Francois Blais. Review of 20 years of range sensor development. Journal of ElectronicImaging, 13(1):231–243, 2004.
R. C. Bolles and P. Horaud. 3dpo: A three-dimensional part orientation system. TheInternational journal of robotics research, 5(3):3, 1986.
Adam Borkowski, Barbara Siemiatkowska, and Jacek Szklarski. Towards semantic navigationin mobile robotics. In Gregor Engels, Claus Lewerentz, Wilhelm Schfer, Andy Schrr, andBernhard Westfechtel, editors, Graph Transformations and Model-Driven Engineering,volume 5765 of Lecture Notes in Computer Science, pages 719–748. Springer Berlin /Heidelberg, 2010.
F. Bosche. Automated recognition of 3D CAD model objects in laser scans and calcula-tion of as-built dimensions for dimensional compliance control in construction. Advancedengineering informatics, 24(1):107–118, 2010.
F. Bosche and C. Haas. Automated retrieval of project three-dimensional CAD objects inrange point clouds to support automated dimensional QA/QC. Tcon Vol. 13, Special IssueSensors in Construction and Infrastructure Management, pages pg. 71–85, 2008a.
F. Bosche and C. Haas. Automated retrieval of 3D CAD model objects in construction rangeimages. Automation in Construction, 17(4):499–512, 2008b.
F. Bosche, C. Haas, and B. Akinci. Automated recognition of 3D CAD objects in site laserscans for project 3D status visualization and performance control. Journal of Computingin Civil Engineering, 23(6), 2009.
I. Brilakis and L. Soibelman. Multimodal image retrieval from construction databases andmodel-based systems. Journal of Construction Engineering and Management, 132:777,2006.
buildingSmart. http://www.buildingsmart-tech.org/, 2011.
Richard J. Campbell and Patrick J. Flynn. A survey of free-form object representation andrecognition techniques. Computer Vision and Image Understanding, 81(2):166–210, 2001.
D. C. Carmer and L. M. Peterson. Laser radar in robotics. Proceedings of the IEEE, 84(2):299–320, 1996.
R. E. Chapman. Benefits and costs of research: A case study of construction systems inte-gration and automation technologies in industrial facilities. Technical report, US Dept. ofCommerce, Technology Administration, National Institute of Standards and Technology,2000.
Alan M. Lytle Bibliography 107
R. E. Chapman and D. T. Butry. Measuring and improving the productivity of the USconstruction industry: Issues, challenges, and opportunities. Technical report, NationalInstitute of Standards and Technology, 2008.
F. Chaumette and S. Hutchison. Visual servoing and visual tracking. In O. Khatib andB. Siciliano, editors, Springer Handbook of Robotics. Springer, 2008.
C. S. Chen, Y. P. Hung, and J. B. Cheng. RANSAC-based DARCES: A new approach tofast automatic registration of partially overlapping range images. IEEE Transactions onPattern Analysis and Machine Intelligence, pages 1229–1234, 1999.
Y. Chen and G. Medioni. Object modeling by registration of multiple range images, 1991.
G. Cheok, M. Juberts, M. Franaszek, and A. Lytle. 3D imaging systems for manufacturing,construction, and mobility. Technical Report NIST TN 1682, NIST, 2010.
G. S. Cheok, A. M. Lytle, and K. S. Saidi. ASTM E57 3D imaging systems committee: anupdate, 2008. Proceedings of SPIE.
Geraldine S. Cheok, William C. Stone, Robert R. Lipman, and Christoph Witzgall. Ladarsfor construction assessment and update. Automation in Construction, 9(5-6):463–477,2000.
G.S. Cheok, K.S. Saidi, and A.M. Lytle. Evaluating a ranging protocol for 3D imagingsystems. In 24th International Symposium on Automation and Robotics in Construction,Kochi, India, 2007.
S. Chi, C. Caldas, and J. Gong. A crash avoidance framework for heavy equipment controlsystems using 3D imaging sensors. ITcon, 13, 2008.
Y. K. Cho and C. T. Haas. Rapid geometric modeling for unstructured constructionworkspaces. Computer-Aided Civil and Infrastructure Engineering, 18(4):242–253, 2003.
Nuri Choi, Hyojoo Son, Changwan Kim, Changyoon Kim, and Hyoungkwan Kim. Rapid 3Dobject recognition for automatic project progress monitoring using a stereo vision system,2008.
Henrik I. Christensen and Gregory D. Hager. Sensing and estimation. In O. Khatib andB. Siciliano, editors, Springer Handbook of Robotics. Springer, 2008.
CII. Leveraging technology to improve construction productivity. Technical Report RS-240,Construction Industry Institute, 2008.
A.F. Clark and C. Clark. Performance characterization in computer vision a tutorial, 1999.
ConXtech. www.conxtech.com, 2011.
Alan M. Lytle Bibliography 108
K. Daniilidis and J. Eklundh. 3-D vision and recognition. In O. Khatib and B. Siciliano,editors, Springer Handbook of Robotics. Springer, 2008.
M. Dunbabin and P. Corke. Autonomous excavation using a rope shovel. Journal of FieldRobotics, 23(6/7):379–394, 2006.
H. Durrant-Whyte and T. C. Henderson. Multisensor data fusion. In O. Khatib and B. Si-ciliano, editors, Springer Handbook of Robotics. Springer, 2008.
C. Eastman, P. Teicholz, R. Sacks, and K. Liston. BIM Handbook: A guide to buildinginformation modeling for owners, managers, designers, engineers, and contractors. JohnWiley and Sons Inc, 2008.
J. M. Evans. Three dimensional data capture in indoor environments for autonomous nav-igation. Technical report, US Dept. of Commerce, Technology Administration, NationalInstitute of Standards and Technology, 2002. (US).
H. R. Everett. Sensors for mobile robots: theory and application. AK Peters, Ltd. Natick,MA, USA, 1995.
FIATECH. Capital projects technology roadmap: Element 4 tactical plan, intelligent andautomated construction job site (IACJS). Technical report, 2004.
R. B. Fisher. From surfaces to objects: computer vision and three dimensional scene analysis.John Wiley and Sons, Inc., 1989.
R. B. Fisher and K. Konolige. Range sensors. In O. Khatib and B. Siciliano, editors, SpringerHandbook of Robotics. Springer, 2008.
Shachar Fleishman, Iddo Drori, and Daniel Cohen-Or. Bilateral mesh denoising. ACMTrans. Graph., 22(3):950–953, 2003. 882368.
D. A. Forsyth and J. Ponce. Computer Vision: A Modern Approach. Prentice Hall Profes-sional Technical Reference, 2002.
A. J. Fowell. Building and fire research laboratory: Activities, accomplishments, and recog-nition - 1999. Technical report, National Institute of Standards and Technology, 2/20002000.
A. Frome, D. Huber, R. Kolluri, T. Biilow, and J. Malik. Recognizing objects in range datausing regional point descriptors. Computer Vision-ECCV 2004: 8th European Conferenceon Computer Vision, Prague, Czech Republic, May 11-14, 2004: Proceedings, 2004.
MP Gallaher, A. C. OConnor, J. L. Dettbarn, and L. T. Linda T. Gilda. Cost analysis of in-adequate interoperability in the us capital facilities industry. Technical report, US Dept. ofCommerce, Technology Administration, National Institute of Standards and Technology,2004. (US).

Alan M. Lytle Bibliography 109
GEM. IFC Quick Browser www.team-solutions.de, 2010.
Georgia Tech. CIS/2 at GT, http://tempest.arch.gatech.edu/˜aisc/, 2011.
D. E. Gilsinn, G. S. Cheok, C. Witzgall, and A. Lytle. Construction object identification fromladar scans: An experimental study using I-beams. Technical report, National Instituteof Standards and Technology, 2005.
M. Golparvar-Fard, F. Pea-Mora, and S. Savarese. D4AR - 4 dimensional augmented reality- tools for automated remote progress tracking and support of decision-enabling tasks inthe AEC/FM industry, 2010.
Mani Golparvar-Fard, Feniosky Pena-Mora, and Silvio Savarese. Integrated sequential as-built and as-planned representation with D4AR tools in support of decision-making tasksin the AEC/FM industry. Journal of Computing in Civil Engineering, In Press, 2011.
P. M. Goodrum and C. T. Haas. Long-term impact of equipment technology on laborproductivity in the U.S. construction industry at the activity level. Journal of ConstructionEngineering and Management, 130:124, 2004.
T. Greaves. Capturing existing conditions with terrestrial laser scanning: Report on op-portunities, challenges and best practices for owners, operators, engineering/constructioncontractors and surveyors of built assets and civil infrastructure. Technical report, October2006.
GSA. GSA: 3D-4D building information modeling www.gsa.gov/bim, 2009a.
GSA. GSA building information modeling guide series: 03 GSA BIM guide for 3D imaging.Technical report, General Services Administration, 2009b.
C. Harris and M. Stephens. A combined corner and edge detector. In Proceedings of FourthAlvey Vision Conference, volume 15, page 50, 1988. Alvey Vision Conference.
M. Hebert. Active and passive range sensing for robotics. volume 1, 2000. IEEE InternationalConference on Robotics and Automation, 2000. Proceedings. ICRA’00.
M. Hebert and E. Krotkov. 3-D measurements from imaging laser radars: how good arethey? In IEEE/RSJ International Workshop on Intelligent Robots and Systems, pages359–364 vol.1, 1991.
J. Hiremagalur, K. Yen, K. Akin, T. Bui, T. Lasky, and B. Ravani. Creating standards andspecifications for the use of laser scanning in caltrans projects. Technical report, AdvancedHighway Maintenance and Construction Technology Research Center at the University ofCalifornia at Davis, 2007.
IAI. IFC object model architecture guide. Technical report, 1999.

Alan M. Lytle Bibliography 110
ISO. International organization for standardization, 2011.
Geoff Jacobs. Uses of scanning in construction and fabrication. Professional Surveyor Mag-azine, February 2006., February, February 2006.
R. A. Jarvis. A perspective on range finding techniques for computer vision. IEEE Trans.PAMI, 5(2):122–139, 1983.
Edward J. Jaselskis, Zhili Gao, and Russell C. Walters. Improving transportation projectsusing laser scanning. Journal of Construction Engineering and Management, 131(3):377–384, 2005.
A. E. Johnson and M. Hebert. Surface registration by matching oriented points. In In-ternational Conference on Recent Advances in 3-D Digital Imaging and Modeling, pages121–128, Ottawa, Canada, 1997.
A. E. Johnson and M. Hebert. Using spin images for efficient object recognition in clutterred3d scenes. IEEE Transactions on Pattern Analysis and Machine Intelligence, 21(5):433–449, 1999.
F. Jurie and M. Dhome. Real time tracking of 3D objects: an efficient and robust approach.Pattern Recognition, 35(2):317–328, 2002.
Vineet R. Kamat and Robert R. Lipman. Evaluation of standard product models for sup-porting automated erection of structural steelwork. Automation in Construction, 16(2):232–241, 2007.
O. Khatib and B. Siciliano. Springer Handbook of Robotics. Springer, 2008.
Lachmi Khemlani. The CIS/2 format: Another AEC interoperability standard. AECbytes,July 27, 2005 2005.
C. Kim, H. Son, H. Kim, and S. H. Han. Applicability of flash laser distance and rangingto three-dimensional spatial information acquisition and modeling on a construction site.Canadian Journal of Civil Engineering, 35(11):1331–1341, 2008.
S. Kim and I. Kweon. Automatic model-based 3D object recognition by combining featurematching with tracking. Machine Vision and Applications, 16(5):267–272, 2005.
S. Kiziltas, G. Student, B. Akinci, E. Ergen, P. Tang, and C. Gordon. Technological as-sessment and process implications of field data capture technologies for construction andfacility/infrastructure management, 2008.
N. Koenig. Toward real-time human detection and tracking in diverse environments. InIEEE 6th International Conference on Development and Learning, 2007., pages 94–98,2007.
Alan M. Lytle Bibliography 111
S. W. Kwon and K. Liapi. Human-assisted object fitting to sparse range point clouds for rapidworkspace modeling in construction automation. pages 357–362, 2002. 19th InternationalSymposium on Automation and Robotics in Construction.
Y. Lamdan and H. J. Wolfson. Geometric hashing: A general and efficient model-basedrecognition scheme. In Second International Conference on Computer Vision, pages 238–249, 1988.
E. Latimer, D. Latimer Iv, R. Saxena, C. Lyons, L. Michaux-Smith, and S. Thayer. Sensorspace planning with applications to construction environments, 2004 2004. 2004 IEEEInternational Conference on Robotics and Automation, 2004. Proceedings. ICRA’04.
Q. Li and J. G. Griffiths. Iterative closest geometric objects registration. Computers andMathematics with Applications, 40(10-11):1171–1188, 2000.
C. Lindfors, P. Chang, and W. Stone. Survey of construction metrology options for aecindustry. Journal of Aerospace Engineering, 12(2):58–64, 1999.
T.W.R. Lo and J.P. Siebert. Local feature extraction and matching on range images: 2.5DSIFT. Computer Vision and Image Understanding, 113(12):1235–1250, 2009.
D. G. Lowe. Object recognition from local scale-invariant features. Proc. of the InternationalConference on Computer Vision ICCV, Corfu, pages 1150–1157, 1999.
D. G. Lowe. Distinctive image features from scale-invariant keypoints. International Journalof Computer Vision, 60(2):91–110, 2004.
X. G. Lu, A. K. Jain, and D. Colbry. Matching 2.5D face scans to 3D models. IEEETransactions on Pattern Analysis and Machine Intelligence, 28(1):31–43, 2006.
T. C. Lukins and E. Trucco. Towards automated visual assessment of progress in constructionprojects. pages 142–151, 2007. Proceedings of the British Machine Vision Conference,Coventry.
A. M. Lytle and K. S. Saidi. Proceedings of the automated steel construction workshop,june 6-7, 2002. Technical report, National Institute of Standards and Technology, 2004.
A. M. Lytle and K. S. Saidi. NIST research in autonomous construction. AutonomousRobots, 22(3):211–221, 2007.
A. M. Lytle, K. S. Saidi, R. V. Bostelman, W. C. Stone, and N. A. Scott. Adapting ateleoperated device for autonomous control using three-dimensional positioning sensors:experiences with the NIST robocrane. Automation in Construction, 13(1):101–118, 2004.
A.M Lytle, I. Katz, and K.S. Saidi. Performance evaluation of a high-frame rate 3D rangesensor for construction applications, Sept. 11-14 2005.

Alan M. Lytle Bibliography 112
H. G. Maas and G. Vosselman. Two algorithms for extracting building models from rawlaser altimetry data. ISPRS Journal of Photogrammetry and Remote Sensing, 54(2-3):153–163, 1999.
J. Matas, O. Chum, M. Urban, and T. Pajdla. Robust wide-baseline stereo from maximallystable extremal regions. Image and Vision Computing, 22(10):761–767, 2004.
J. McLaughlin, S. V. Sreenivasan, C. Haas, and K. Liapi. Rapid human-assisted creationof bounding models for obstacle avoidance in construction. Computer-Aided Civil andInfrastructure Engineering, 19(1):3–15, 2004.
Z. A. Memon, M. Z. Abd, and M. M. Majid. A systematic procedure for developing the3D model to evaluate the construction project progress. Construction Innovation, 7(2):187–199, 2007.
A. S. Mian, M. Bennamoun, and R. Owens. 3D model-based free-form object recognition: areview. Sensor Review, 25(2):148–154, 2005a.
A. S. Mian, M. Bennamoun, and R. A. Owens. Automatic correspondence for 3D modeling:An extensive review. International Journal of Shape Modeling, 11(2):253, 2005b.
K. Mikolajczyk and C. Schmid. Scale and affine invariant interest point detectors. Interna-tional Journal of Computer Vision, 60(1):63–86, 2004.
K. Mikolajczyk and C. Schmid. A performance evaluation of local descriptors. IEEE Trans-actions on Pattern Analysis and Machine Intelligence, pages 1615–1630, 2005.
K. Mikolajczyk, T. Tuytelaars, C. Schmid, A. Zisserman, J. Matas, F. Schaffalitzky, T. Kadir,and L. V. Gool. A comparison of affine region detectors. International Journal of ComputerVision, 65(1):43–72, 2005.
H. P. Moravec. Visual mapping by a robot rover. pages 598–600, 1979. Proc. of the 6thInternational Joint Conference on Artificial Intelligence.
R. Navon. Research in automated measurement of project performance indicators. Automa-tion in Construction, 16(2):176–188, 2007.
NIBS. National building information modeling standard, 2007.
NIST. CIS/2 and IFC - Product data standards for structural steel,http://cic.nist.gov/vrml/cis2.html, 2011.
NRC. Advancing the competitiveness and efficiency of the U.S. construction industry. Tech-nical report, National Research Council of the National Academies of Science, 2009.
A. Nuchter, H. Surmann, and J. Hertzberg. Automatic classification of objects in 3D laserrange scans. Proc. 8th Conf. on Intelligent Autonomous Systems, page 963970, 2004.

Alan M. Lytle Bibliography 113
N. Otsu. A threshold selection method from gray-level histogram. IEEE Transactions onSystems, Man, and Cybernetics, 9(1):62–66, 1979.
F. Pipitone and W. Adams. Rapid recognition of freeform objects in noisy range imagesusing tripod operators. In Computer Vision and Pattern Recognition, 1993. ProceedingsCVPR ’93., 1993 IEEE Computer Society Conference on, pages 715–716, 1993.
Ha Quang, M. Santos, Nguyen Quang, D. Rye, and H. Durrant-Whyte. Robotic excavationin construction automation. IEEE Robotics and Automation Magazine, 9(1):20–28, 2002.
K. Reed. The role of the CIMSTEEL integration standards in automating the erection andsurveying of structural steelwork., 2002.
J. Roberts, G. Winstanley, and P. Corke. Three-dimensional imaging for a very large exca-vator. The International journal of robotics research, 22(7-8):467, 2003.
A. Rosenfeld. From image analysis to computer vision: An annotated bibliography, 1955-1979. Computer Vision and Image Understanding, 84(2):298–324, 2001.
F. Rottensteiner and C. Briese. A new method for building extraction in urban areas fromhigh-resolution LIDAR data. International Archives of the Photogrammetry, Remote Sens-ing and Spatial Information Sciences, 34(3/A):295–301, 2002.
S. Rusinkiewicz and M. Levoy. Efficient variants of the ICP algorithm. In Proceedings. ThirdInternational Conference on 3-D Digital Imaging and Modeling, pages 145–152, 2001.
S. Rusinkiewicz, O. Hall-Holt, and M. Levoy. Real-time 3D model acquisition. In Proceedingsof the 29th annual conference on Computer graphics and interactive techniques, pages 438–446, San Antonio, Texas, 2002. ACM Press.
K. Saidi, J. O’brien, and A. Lytle. Robotics in construction. In O. Khatib and B. Siciliano,editors, Springer Handbook of Robotics. Springer, 2008.
D.A. Schenck and P.R. Wilson. Information modeling: the EXPRESS way. Oxford UniversityPress, USA, 1994.
C. Schmid, R. Mohr, and C. Bauckhage. Evaluation of interest point detectors. InternationalJournal of Computer Vision, 37(2):151–172, 2000.
ISO SCRA. 10303 STEP application handbook version 3. Technical report, 2006.
Linda G Shapiro and George C Stockman. Computer Vision. Prentice Hall, Upper SaddleRiver, NJ, 2001.
G. C. Sharp, S. W. Lee, and D. K. Wehe. ICP registration using invariant features. IEEETransactions on Pattern Analysis and Machine Intelligence, 24(1):90–102, 2002.

Alan M. Lytle Bibliography 114
N-J Shih. The application of a 3D scanner in the representation of building constructionsite, 23-25 Sept. 2002 2002.
N. J. Shih and P. H. Wang. Point-cloud-based comparison between construction scheduleand as-built progress: Long-range three-dimensional laser scanners approach. Journal ofArchitectural Engineering, 10:98, 2004.
D. A. Simon, M. Hebert, and T. Kanade. Real-time 3-D pose estimation using a high-speedrange sensor, 1994.
S. Singh. State of the art in automation of earthmoving, 2002. 2002. Proceedings of theWorkshop on Advanced Geomechatronics.
L.J. Skelly and S. Sclaroff. Improved feature descriptors for 3-D surface matching, 2007.
Solibri. Solibri model viewer www.solibri.com, 2010.
Hyojoo Son and Changwan Kim. 3d structural component recognition and modeling methodusing color and 3D data for construction progress monitoring. Automation in Construction,19(7):844–854, 2010.
A. Stentz. Robotic technologies for outdoor industrial vehicles. 2001. Proceedings of SPIEAeroSense.
M. R. Stevens, M. Snorrason, and S. Amphay. Automatic target detection using pmmwand ladar imagery. In Proceedings,16th International Conference on Pattern Recognition.,volume 2, pages 647–650 vol.2, 2002.
W. Stone, K. Reed, P. Chang, L. Pfeffer, and A. Jacoff. NIST research toward constructionsite integration and automation. Journal of Aerospace Engineering, 12(2):50–57, 1999.
W. C. Stone, M. Juberts, N. Dagalakis, J. Stone, and J. Gorman. Performance analysis ofnext-generation LADAR for manufacturing, construction, and mobility. Technical report,National Institute of Standards and Technology, 2004.
Pingbo Tang, D. Huber, and B. Akinci. A comparative analysis of depth-discontinuity andmixed-pixel detection algorithms, 2007.
Pingbo Tang, Daniel Huber, Burcu Akinci, Robert Lipman, and Alan Lytle. Automaticreconstruction of as-built building information models from laser-scanned point clouds: Areview of related techniques. Automation in Construction, 19(7):829–843, 2010.
C. B. Tatum, F. Pe, M. Vorster, M. Asce, M. G. Klingler, and B. C. Paulson Jr. Systemsanalysis of technical advancement in earthmoving equipment. Journal of ConstructionEngineering and Management, 132:976, 2006.
Eike Tauscher and Jan Tulke. Open IFC java toolbox www.openifctools.com, 2008.
Alan M. Lytle Bibliography 115
Jochen Teizer, Carlos H. Caldas, and C. T. Haas. Real-time three-dimensional modeling forthe detection and tracking of construction resources. Journal of Construction Engineeringand Management, 133:880, 2007.
C. Tomasi and R. Manduchi. Bilateral filtering for gray and color images. In Sixth Interna-tional Conference on Computer Vision, 1998, pages 839–846, 1998.
E. Trucco and A. Verri. Introductory Techniques for 3-D Computer Vision. Prentice HallPTR Upper Saddle River, NJ, USA, 1998.
Andrea Vedaldi and Brian Fulkerson. VLFeat: An open and portable library of computervision algorithms, 2008.
P. Wunsch and G. Hirzinger. Registration of CAD models to images by iterative inverseperspective matching. Proc. 1996 ICPR, page 7883, 1996.
Alper Yilmaz, Omar Javed, and Mubarak Shah. Object tracking: A survey. ACM Comput.Surv., 38(4):13, 2006. 1177355.
Y. Yoon, A. Kosaka, J. B. Park, and A. C. Kak. A new approach to the use of edgeextremities for model-based object tracking, 2005.
S. You, J. Hu, U. Neumann, and P. Fox. Urban site modeling from LIDAR. Lecture Notesin Computer Science, pages 579–588, 2003.
Kui Yue, Daniel Huber, Burcu Akinci, and Ramesh Krishnamurti. The ASDMCon project:The challenge of detecting defects on construction sites, 2006.
D. Zhang and G. Lu. Review of shape representation and description techniques. PatternRecognition, 37(1):1–19, 2004.
Xiaonan Zhang, Nick Bakis, Timothy C. Lukins, Yahaya M. Ibrahim, Song Wu, Mike Ka-gioglou, Ghassan Aouad, Ammar P. Kaka, and Emanuele Trucco. Automating progressmeasurement of construction projects. Automation in Construction, 18(3):294–301, 2009.
Qinfen Zheng, S. Z. Der, and H. I. Mahmoud. Model-based target recognition in pulsedladar imagery. Image Processing, IEEE Transactions on, 10(4):565–572, 2001. 1057-7149.
W. Zhou, J. V. Miro, and G. Dissanayake. Information efficient 3D visual SLAM in unstruc-tured domains. pages 323–328, 2007. Intelligent Sensors, Sensor Networks and Information,2007. ISSNIP 2007. 3rd International Conference on.
Z. Zhu, S. German, and I. Brilakis. Detection of large-scale concrete columns for automatedbridge inspection. Automation in Construction, 19(8):1047–1055, 2010.