AFM for Measuring Surface Topography and Forces · AFM for Measuring Surface Topography and Forces...
64
AFM for Measuring Surface Topography and Forces Andreas Fery ENB 2007 07.03.2007 • Scanning Probe : What is it and why do we need it ? • AFM as a versatile tool for local analysis and manipulation
Transcript of AFM for Measuring Surface Topography and Forces · AFM for Measuring Surface Topography and Forces...

AFM for Measuring Surface Topography and Forces
Andreas Fery
ENB 2007 07.03.2007
• Scanning Probe : What is it and why do we need it ?
• AFM as a versatile tool for local analysis and manipulation

Dates
Course today 2* 1h with 15 min break
do it yourself AFM :
Tomorrow, starting 9:00 in AFM Lab in PCII

Scanning Probe : What is it an why do we need it
versus
IBM

How sensitive is an AFM ?
AFM-sensitivity translated to themacro-scale
Matterhorn = AFM tip
Ping Pong ball = moleculardimensions
Why should one try somethingso difficult ?

optical microscopy: the fraunhofer limit
a point source imagedby a lens of finite sizetransforms into an airydisc pattern due to diffraction
this sets a natural limit to theresolution of far field wave opticsdevices
2minλ≈∆x

solving the problem
1. usage of shorter wavelengthProblems: adsorption of the beam by glass for UV , the beam itself for x-Ray
2. usage of high speed electronsProblems: electron source, samples can only be observed in UHV, oxidation of the sample
3. Scanning techniquesProblems: long measurement time, UHV (for SEM), sample can be damaged due to probe sample interactions

Resolution of SPMs
the resolution of SPMs is determined by:
• the spatial dimension of the probe → the probe has to be small
• the distance probe-surface → the probe has to be a point probe
scanning probe microscopes are surface microscopes

The different types of SPM
• the nature of the interaction determines the property of the sample that is investigated
• the strength of the interaction used in SPM determines whether one observes or modifiesthe sample: SPM as a microscope or a tool
interaction

The different types of SPM
– STM: scanning tunnelling microscopy– SFM: scanning force microscopy– SNOM: scanning near-field optical microscopy
– SEM: scanning electron microscopy– SCM: scanning capacitance microscopy– SThM: scanning thermal microscopy– SICM: scanning ion conductance microscopy– SAM: scanning acoustic microscopy– …

the right tool for the right problem
the surface of a magneto-optic medium seen in AFM
the same part of the sampleimaged in MFM(Magnetic force microscopy)

AFM schematically
Sample
AFM-Probe mounted on springLaserdiode Mirror
Photodiode
Spring deflection detection
XYZ Piezo-Scanner
Sample - Probe displacement
Feedback MechanismFeedback

Piez
o
Substrate
P
Substrate
Piez
o
Substrate
Piez
o
Substrate
Piez
o
Substrate
Piez
o
Substrate
Piez
o
Substrate
Piez
o
Substrate
Piez
o
Substrate
Piez
o
Substrate
Piez
o
Substrate
Piez
o
Substrate
Piez
o
Substrate
Piez
o
Substrate
P
Substrate
Jump to Contact
Jump off contact
Hysteresis
Jump to Contact
Jump off Contact
Deflection-DisplacementCharacteristics
AFM-Tip Approaching and Retracting

Deflection as a function of the distance
Contact Region Non-Contact Region
Stable Contact Unstable
Very stablevery damagingshear forces
Too unstablebut would be less damaging
force-distance characteristics
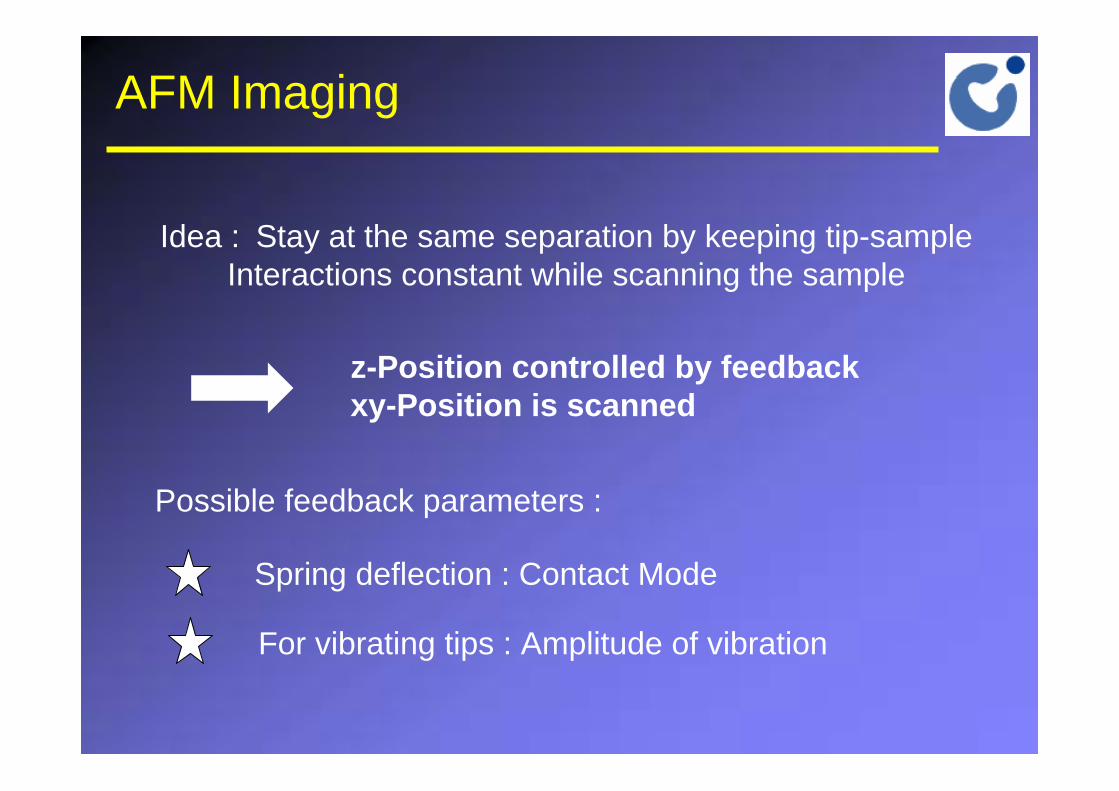
AFM Imaging
Idea : Stay at the same separation by keeping tip-sampleInteractions constant while scanning the sample
z-Position controlled by feedbackxy-Position is scanned
Possible feedback parameters :
Spring deflection : Contact Mode
For vibrating tips : Amplitude of vibration
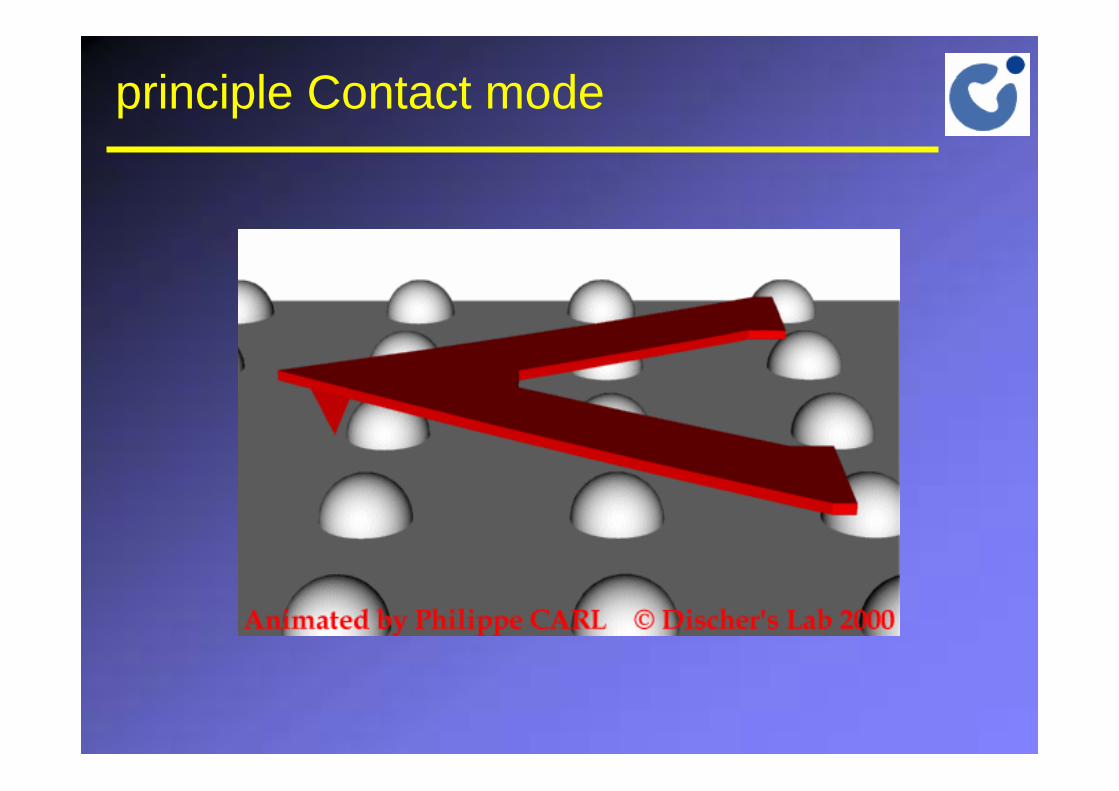
principle Contact mode

Example
DNA on a micasurface
molecular resolutionfor a nonconductingsample in air

Convolution Effects
One thing to keep in mind : convolution effect
„The smaller thing images the bigger thing“
The signal is always a convolution of sample topographyAnd tip topography
a bigger issue for AFM than for STMTips should be as sharp as possible (10nm standard)

Artifacts
DNA and debris PS „spheres“
How can you check if this is an artifact ??

Example : Surface Damage
Molecules are „swept“ out off the scanned Area

example : surface modification
using the possibility to exert forces with the afm:
nano- sculptures

recording friction
friction propertiescan be recordedby monitoringthe torsion of thecantilever

example LFM
hydrophobic and hydrophilic regions can beclearly destinguished inLFM

Methods Using Vibrating Tips
No permanent tip-sample contact
No shear forces
Tapping Mode, Intermittent Contact Mode And Non-Contact Mode are themost successful methods for pure imaging
Advantages :
Non-contact imaging possible
Feedback parameter : Amplitude

Dynamic AFM
Tip+cantilever can be described as harmonic oscillator
extFkxtxm =+
∂∂
2
2
( )tAF extext ωsin=
( ) ( )( )ωφωω += tAtx sin)(
wR : resonance-frequency
ww R
A(w) : Amplitude
F(w) : Phase Shift
mk
R =ω
Here :

Vibrating Tip and Surface Forces
extFkxtxm =+
∂∂
2
2
( ) extsurf FxFkxtxm =++
∂∂
2
2
Simple picture :
Long-range attractive forceSpring force
Simplify force(linear approx.)
A spring again,but k has decreased
An attractive force gradient results inan effective decrease of the spring constant

Effect on Vibration
Excitation frequency stays at wR , therefore :
Phase changes
A changes
Amplitude can serve as Feedback parameter
w
Phas
e-sh
ift
Am
plitu
de
Free vibration(no surface force)
w Ext = wR
Excitation frequ.equals res. frequ.
w ExtSurface influenced vibration
wR
k effectivelydecreases
mk
R =ω

example
soft ultrathin pattern on siliconwafer
(single molecular resolutionunder water)

Vibrating Tip Revisited: Phase Contrast
Chemically heterogeneous surface
Region 1F
D
Region 2F
D
Different surfaceforces Long-range
repulsiveLong-rangeattractive
Different Phase Shiftat same amplitude
w Rw R
Phase 1
Phase 2

Example Phase Contrast
Phase Image (right) shows Material Contrast Here : film of Diblockcopolymer mixture
(images courtesy M. Schneider / H. Schlaad)

AFM for Measuring Surface Topography and Forces II
Andreas Fery
ENB 2007 07.03.2007
• Force Spectroscopy : AFM for measuring forces
• Modern trends in AFM

Piez
o
Substrate
P
Substrate
Piez
o
Substrate
Piez
o
Substrate
Piez
o
Substrate
Piez
o
Substrate
Piez
o
Substrate
Piez
o
Substrate
Piez
o
Substrate
Piez
o
Substrate
Piez
o
Substrate
Piez
o
Substrate
Piez
o
Substrate
Piez
o
Substrate
P
Substrate
Jump to Contact
Jump off contact
Hysteresis
Jump to Contact
Jump off Contact
Deflection-DisplacementCharacteristics
AFM-Tip Approaching and Retracting

Simulating a measured curve
F
D
Piezo ext.
Rest position
Def
lect
ion
Piezo ext.
Det. Deflection
F
D
Piezo ext. Def
lect
ion
Piezo ext.
F
D
Def
lect
ion
Piezo ext.
F
D
Def
lect
ion
Piezo ext.
Instability !
unstable
stable
F
D
Def
lect
ion
Piezo ext.
F
D
Def
lect
ion
Piezo ext.
F
D
Def
lect
ion
Piezo ext.
F
D
Def
lect
ion
Piezo ext.
Instability
Def
lect
ion
Piezo ext.
F
D

Impact of the spring constant on stability
B. Cappella and G. Dietler, "Force-distance curves by atomic force microscopy", Surface Science Reports, 34, 1-+, (1999)

Impact of the spring constant on stability 2
B. Cappella and G. Dietler, "Force-distance curves by atomic force microscopy", Surface Science Reports, 34, 1-+, (1999)
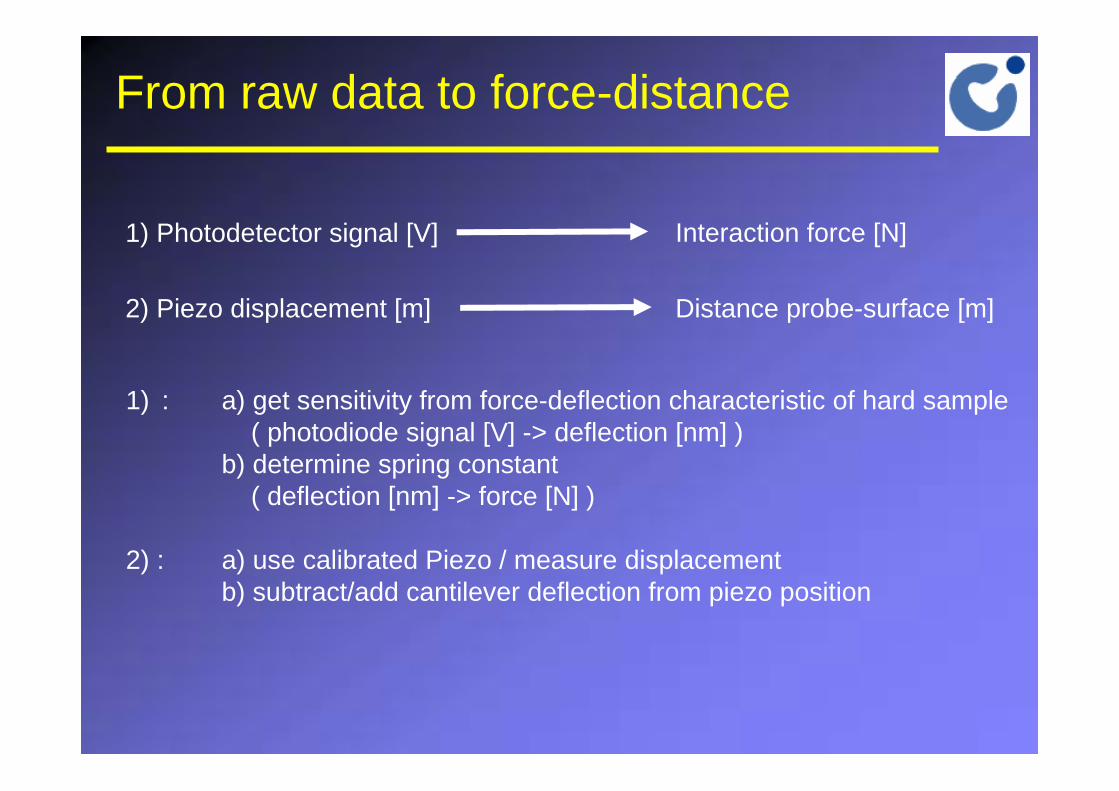
From raw data to force-distance
1) Photodetector signal [V]
2) Piezo displacement [m] Distance probe-surface [m]
Interaction force [N]
1) : a) get sensitivity from force-deflection characteristic of hard sample( photodiode signal [V] -> deflection [nm] )
b) determine spring constant( deflection [nm] -> force [N] )
2) : a) use calibrated Piezo / measure displacementb) subtract/add cantilever deflection from piezo position

added mass effect
J. P. Cleveland, S. Manne, D. Bocek and P. K. Hansma, Review of Scientific Instruments,64, 403-405, (1993)

added mass effect 2
J. P. Cleveland, S. Manne, D. Bocek and P. K. Hansma, "A Nondestructive Method forDetermining the Spring Constant of Cantilevers forScanning Force Microscopy", Review of Scientific Instruments, 64, 403-405, (1993)

thermal noise spectrum
J. L. Hutter and J. Bechhoefer, "Calibration of Atomic-force microscopy tips", Rev. Sci. Instrum., 64, 1868, (1993)

Two worlds
I have measured that myAFM tip is attracted with15 nN force at 10 nm distance
Experimentalist
I have calculated that 2 infinite half spaces of this material shouldhave an interaction energy/area of 1J/m2 at this distance
Theoretician
How can we build a bridge from one to the other ??

A bridge
)(2)(21
21 DWRR
RRDF+
= π
2R2
2R1
D
infinite half space
infinite half space
D
F(D) : interaction Force W(D) : interaction energyper area
Derjaguin relation :
valid for all forces, as longas R >> range of force

Typical AFM cantilevers
Here : radius of tip R notmuch bigger than typicalinteraction ranges

Colloidal Probe AFM
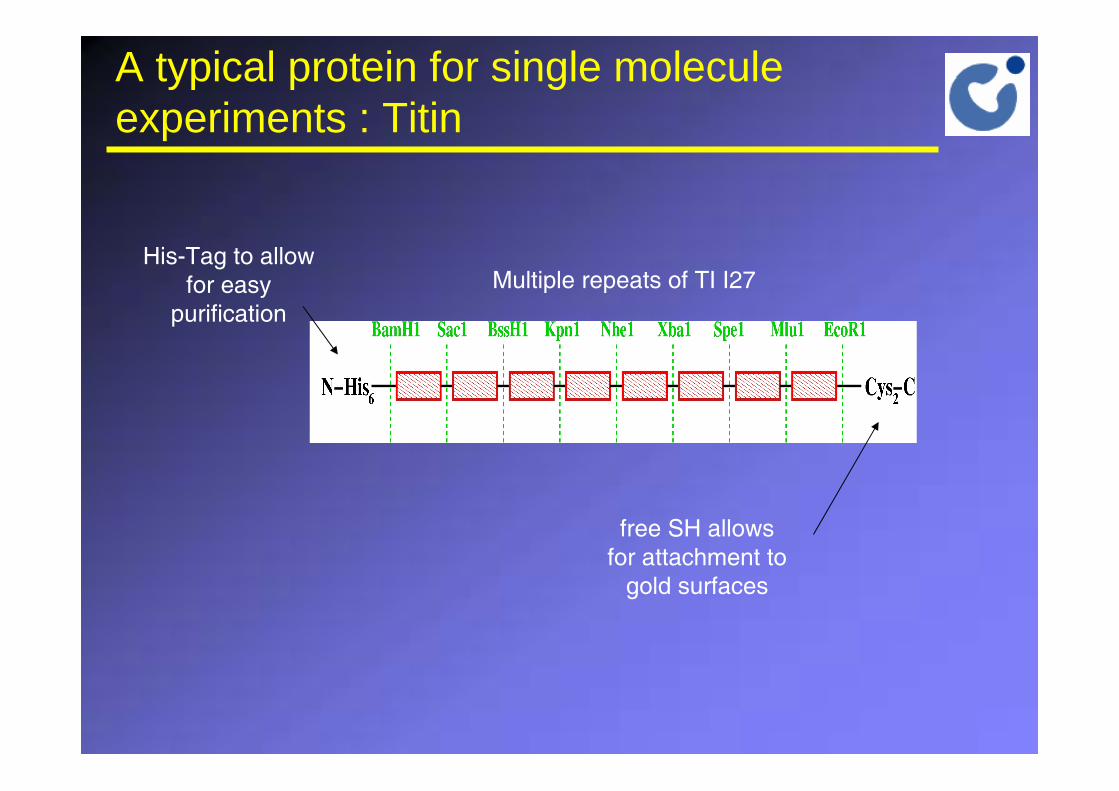
A typical protein for single moleculeexperiments : Titin
His-Tag to allow for easy
purificationMultiple repeats of TI I27
free SH allows for attachment to
gold surfaces

The AFM ExperimentThe AFM Experiment

Pulling chains off the surface
ksp
v
Force = ksp × Deflection
Stage Position = v × Time

Pulling chains off the surface

Pulling chains off the surface

Pulling chains off the surface

Pulling chains off the surface

Pulling chains off the surface

Pulling chains off the surface

Pulling chains off the surface

statistical variation:
to few unfolding events :not the full protein is stretched
to many unfoldingevents, more than 1 protein

statistics over many pulls
to compensate for that, statistics over many pulls is necessary
from this the „typical“ curve is obtained

what does the peak force mean ?
influence of additionalcoupling to spring :

the force is rate dependent
Fo
rce
(N)
• Unfolding proteins by AFM is a kinetic measurement: average unfolding force depends on pulling speed.
• Average unfolding rates can be estimated by Monte-Carlo simulation or by extrapolation.
Forc
e (N
)

physically meaningful single moleculeexperiments
* average over many experiments to extract the typical set of unfoldinglengths and forces
• do this for different pulling speeds
• compare to molecular dynamics calculations

Real-life Cantilevers
Real-life cantilevers are damped harmonic oscillators
extFkxtxm =+
∂∂
2
2
Ideal, no damping
extFkxtx
txm =+
∂∂
−∂∂ β2
2Real, damping force proportional to speed
Damping broadens the resonance peak, limiting sensitivity
ω
A
50% ofmax. ampl.
ωRes
Damping is characterized by the Q-Factor(Quality Factor)
∆ ω
ωω∆
= RQ Typical Q-factors are between100 and 1000

Q-switching : tuning the resonance
extFkxtx
txm =+
∂∂
−∂∂ β2
2
( )tAF extext ωsin=Usually with
Now, use additional external force coupled to speed, compensating damping
( )txtAF extext ∂
∂−= βωsin Damping force compensated !!
ω
A
ω
A
In theory much better for imaging, in practise sometimes
Q>10000possible

„Supertips“
carbon nanotubes as a try to get the „perfect“ tip (no convolution problem)

Combination AFM - microscopy
general problem in deformation measurements :
only force (indentation) accessible
for (mechanically) complex objectsnot suffcient
methods that combine force-deformation withshape information !

combination RICM - AFM
Combination of force and deformationmeasurements
inter-ferometry
example : buckling process

Setup

Acknowledgement
H. Heinzelmann
Marc Nolte
because they made so nice presentations concerning SPMwhere I could pinch graphics, animation, …