Afghanistan Economic Update - World Banksiteresources.worldbank.org/.../AFGEconUpdate2011.pdf ·...
19
October 2011 Poverty Reduction, and Economic Management, South Asia Region The World Bank Afghanistan Economic Update
Transcript of Afghanistan Economic Update - World Banksiteresources.worldbank.org/.../AFGEconUpdate2011.pdf ·...

September 2011
Poverty Reduction, and Economic Management, South Asia Region
The World Bank
Afghanistan Economic Update
October 2011
Poverty Reduction, and Economic Management, South Asia Region
The World Bank
Afghanistan Economic Update

1
Afghanistan Economic Update October 2011
Overview1
Afghanistan’s economy is growing strongly. The growth drivers in recent years have been above-
average agricultural production, strong growth in construction and transportation, and security
spending enabled by large aid flows, especially in FY2009/10. Real GDP growth reached 8.4
percent in FY2010/11.
The Kabul Bank crisis has over-shadowed the dialogue between the Government and its
development partners in the last several months. Satisfactory resolution of Kabul Bank’s
problems is a critical condition for the IMF-supported Extended Credit Facility (ECF) and, the
lack of a resolution has had a negative impact on multi-donor assistance particularly through the
Afghanistan Reconstruction Trust Fund (ARTF). Lately, there has been progress on the
implementation of the resolution plan and indications are now very good for an agreement
between the Government and the IMF by October/November. This agreement, when reached,
will relieve much of the uncertainty regarding donor commitments in the coming period. Donors
have begun to fund again the ARTF investment window in the short-term and are expected to
return to more normal contributions once the agreement with the IMF is in place.
Afghanistan’s fiscal position is strengthening. In the last three years revenues grew by an
average of 34 percent p.a., thanks to improvements in customs and tax administration. Larger
increases are expected once mining operations begin in Aynak and Hajigak and with the
introduction of a value-added tax in FY2014/15. However, government expenditures will also
increase in the coming years due to higher security spending, the roll out of pay-and-grading
reforms for the civil service, rising recurrent obligations from large donor-supported projects
(including those financed outside of the core budget) and the fiscal costs of the Kabul Bank bail-
out.
The country moved from sharp deflation to double-digit inflation in one year. The strong inflation
trend is mainly explained by a increase for prices in food, electricity and fuels and reflect
international price trends, disruptions in trade flows with Iran and Pakistan over the past year as
well as a bad harvest in the 2Q2011 which limits the possibilities for food import substitution by
households.
Medium-term prospects are moderately good and will depend on the Government’s ability to
successfully manage the transfer of security control from international to national forces, and
ensure political stability and fiscal sustainability. Long-term growth prospects will depend on the
extent to which mining can be used to foster development in agriculture and services, which are
crucial to food security, employment and poverty-reduction, and export revenue.
1 This update was prepared by Claudia Nassif and Camilo Gomez Osorio with inputs from Amna Saeed,
Guillemette Jaffrin and Abdul Raouf Zia.

2
Recent Security Developments
1. The first phase of the handover of security responsibilities to Afghan national security
forces in six locations has been completed. The international forces under the International Security
Assistance Force (ISAF) handed over responsibilities for security in seven locations including Bamiyan,
Parwan, Herat city and province, Mehterlam city, Laskargar city, and Panjshir. The transfers are the first
phase of a plan that will place the country’s security under Afghan control in the next three years. All
international combat troops are scheduled to leave Afghanistan by the end of 2014.
2. Preparations are underway for a major international conference in Bonn on December 5,
2011. The conference will give prominence to the shift of security and development authority to the
Government of Afghanistan and commitment by the international community to stay engaged in support
of Afghanistan’s long-term development and security needs. The discussions will take place in a
challenging environment: the security situation remains extremely difficult and questions continue to be
raised about the readiness of the Government to take responsibility after 2014 for providing security and
governing the country, and lead donor countries are facing problems domestically with continued
economic assistance to Afghanistan.
Recent Economic Developments
Real Sector
3. Preliminary estimates suggest that Afghanistan’s GDP growth rate has dropped from a
very high and unsustainable 21.0 percent in FY2009/10 to 8.4 percent in FY2010/11*.2 Since
FY2003/04, the country has seen average growth rates in the double digits (9.1% on average), but with
high levels of volatility due to the prominence of the agriculture sector, which is subject to weather
fluctuations (Figure A). While last year’s GDP growth was exceptionally high due to a record harvest and
a large increase in on- and off-budget donor grants, preliminary data suggest that this year’s return to the
lower, but still strong, pre-FY2009/10 levels is due to the continued expansion of services.
4. On the supply side, the services sector continues to lead the way. In FY2010/11*, as in the
past five years, services accounted for about half of output (Figure B). The most dynamic services
subsectors were communications (65 percent annual growth), transport (23.1 percent) and finance &
insurance (14.3 percent) whereas wholesale and retail trade grew at only 5.3 percent. Services sector was
followed by agriculture which contributed 2.0 percentage points to GDP growth this year. The sector’s
output has been volatile because Afghanistan’s arable land and most irrigation systems depend heavily on
seasonal rain and snow. Overall, industry grew by 6.3 percent from last year. This was largely due to the
expanding mining sector which grew sharply by 43 percent. On the other hand, subsectors such as
construction and manufacturing which have larger contribution to GDP growth, showed modest annual
growth of 7.7 percent and 3.8 percent respectively.
5. On the demand side, private consumption has been fueling the growth of the Afghan
economy. In the past half-decade, on average it has contributed over 9 percentage points to real GDP
growth (excluding FY2008/09 – Figure C). Growth in the security economy underpins the demand for
2 The symbol * refers to initial estimates.

3
goods and services, equipment and operations and maintenance of the national army. Higher non-security
spending by donors is another factor, including their large off-budget contributions. In FY2010/11,
private consumption contributed 6.9 percentage points of the 8.4 percent real growth. Investment has
shown moderate growth over the years and contributing around 2.2 percentage points to GDP growth,
mostly from the external-budget capital spending and private investment in the security economy.
Government spending has contributed relatively little to GDP; just 2.8 percentage points. The
contribution of net exports was negative at – 3.6 percentage points.
6. Opium crop production decreased substantially in 2010, mainly due to a plant disease which
nearly halved crop production. However, this year, yields were back to around 45kg per hectare which
might raise opium production to 5,800 tons. Buoyed by higher speculative prices arising from volatile
security conditions, the farm gate income of opium farmers increased significantly. Estimates by UNODC
suggest that the farm gate value of opium will reach $1.4 billion in 2011 (8% of GDP). Farm gate
production accounts for roughly 20 percent of the opium value chain. About 78 percent of cultivation is
concentrated in southern provinces such as Helmand, Kandahar, Uruzgan and Day Kundi.
External Sector
7. The current account deficit narrowed in FY2010/11 because of an improving trade balance.
While overall trade has declined relative to GDP from 91 to 75 percent, mainly due to blockages at the
Pakistani border, imports fell more than exports (Figure D). Over the past 5 years imports (about $9.2
billion) have been three to four times the size of exports (about $2.8 billion). It should be noted, however,
that official export figures are underestimated and do not account for opium. Along these lines, the deficit
in the current account narrowed from 51.3 to 39.8 percent of GDP. Continued inflows of grants ensured
the financing of the current account deficit and a surplus in the capital and financial accounts of around 4
percent of GDP.
8. The implementation of the Afghanistan-Pakistan Transit Trade Agreement (APTTA)
continues to face difficulties. In October 2010, the countries concluded the APTTA negotiations aimed
at enabling Afghan goods greater access to the port of Karachi and the Wagah border with India (Indian
exports to Afghanistan are still excluded). This agreement is central for Afghanistan’s trade, as it aims to
take advantage of preferential tariffs with India scheduled over the next five years. However, substantial
differences between the Afghan and Pakistan governments regarding the interpretation of the agreement
have resulted in trade blockages over the first eight months since signing of the agreement at the Karachi
port. The areas of contention are bank guarantees, international requirements for sealed trucks, biometric
systems for customs verification and security, and the installation of tracking systems. A two-month
waiver given by Pakistan finally allowed the first Afghan trucks to travel across Pakistan on June 12th.
However, the waiver will expire in September and a final resolution has not yet been reached.

4
The Afghan Economy at a Glance
Strong, but volatile real GDP growth… … driven by the services sector and fluctuating agriculture output.
Figure A Figure B: Contribution to Real GDP Growth(%)
Source: IMF Source: IMF
Private consumption is the motor of growth
from donor inflows and the security economy... … but trade is declining,
Figure C Figure D
Source:IMF Source: IMF
… the current account deficit reduced, which is financed by donor grants. The Afghani is depreciating.
Figure E Figure F: Nominal Exchange Rates, to Afs (Index Mar,22, 2009=100)
Source: IMF Source:DAB
Note: The symbol * refers to initial estimates
Agricultural GDP Growth
Overall GDP
Growth
-30%
-20%
-10%
0%
10%
20%
30%
40%
50%
2003/04 2004/05 2005/06 2006/07 2007/08 2008/09 2009/10 2010/11
10.45.1
11.7
3.1
17.5
6.9
4.3
2.3
6.5
1.6
8.2
2.9
5.2
2.4
5.6
1.3
6.7
2.2
-8.7-4.3
-10.0-2.3
-11.4
-3.6
-15
-10
-5
0
5
10
15
20
25
30
35
2005/06 2006/07 2007/08 2008/09 2009/10 2010/11*
Pvt Consumption Govt. Consumption
Investment (Gross Dom. Fixed) Net Exports
Real GDP Growth
3.41.5
3.7
0.8
5.7
2.0
4.6
2.3
6.0
1.7
9.8
4.3
1.9
0.9
2.1
0.6
2.8
1.1
1.2
0.8
1.8
0.5
2.6
1.0
0
3
6
9
12
15
18
21
2005/06 2006/07 2007/08 2008/09 2009/10 2010/11*
Agriculture ServicesMining ManufacturingConstruction Industry - others
26%Exports, 21%
24%20% 18%
96%89%
Imports, 85%
71%
57%
0%
20%
40%
60%
80%
100%
120%
2006/07 2007/08 2008/09 2009/10 2010/11
f.o
.b in
% o
f GD
P
Capital and
Financial Account
Current account (excl. grants)
Overall Balance
Current account
(incl. grants)
-80%
-70%
-60%
-50%
-40%
-30%
-20%
-10%
0%
10%
20%
2006/07 2007/08 2008/09 2009/10 2010/11
In %
of G
DP
Pakistani Rupee
Euro
Dollar
70
75
80
85
90
95
100
105
110
115
Apr
-09
Jun
-09
Au
g-0
9
Oct
-09
Dec
-09
Feb-
10
Ap
r-1
0
Jun
-10
Au
g-1
0
Oct
-10
Dec
-10
Feb-
11
Ap
r-1
1
Jun
-11
Aug
-11
Oct
-11
5
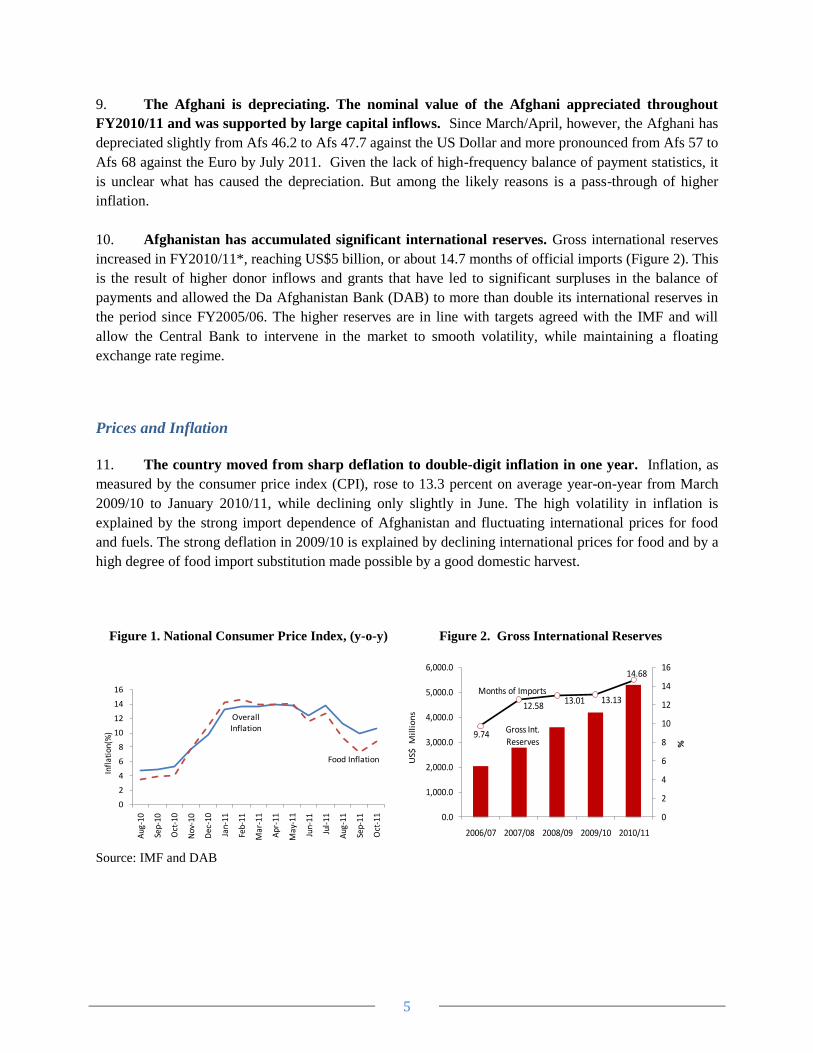
9. The Afghani is depreciating. The nominal value of the Afghani appreciated throughout
FY2010/11 and was supported by large capital inflows. Since March/April, however, the Afghani has
depreciated slightly from Afs 46.2 to Afs 47.7 against the US Dollar and more pronounced from Afs 57 to
Afs 68 against the Euro by July 2011. Given the lack of high-frequency balance of payment statistics, it
is unclear what has caused the depreciation. But among the likely reasons is a pass-through of higher
inflation.
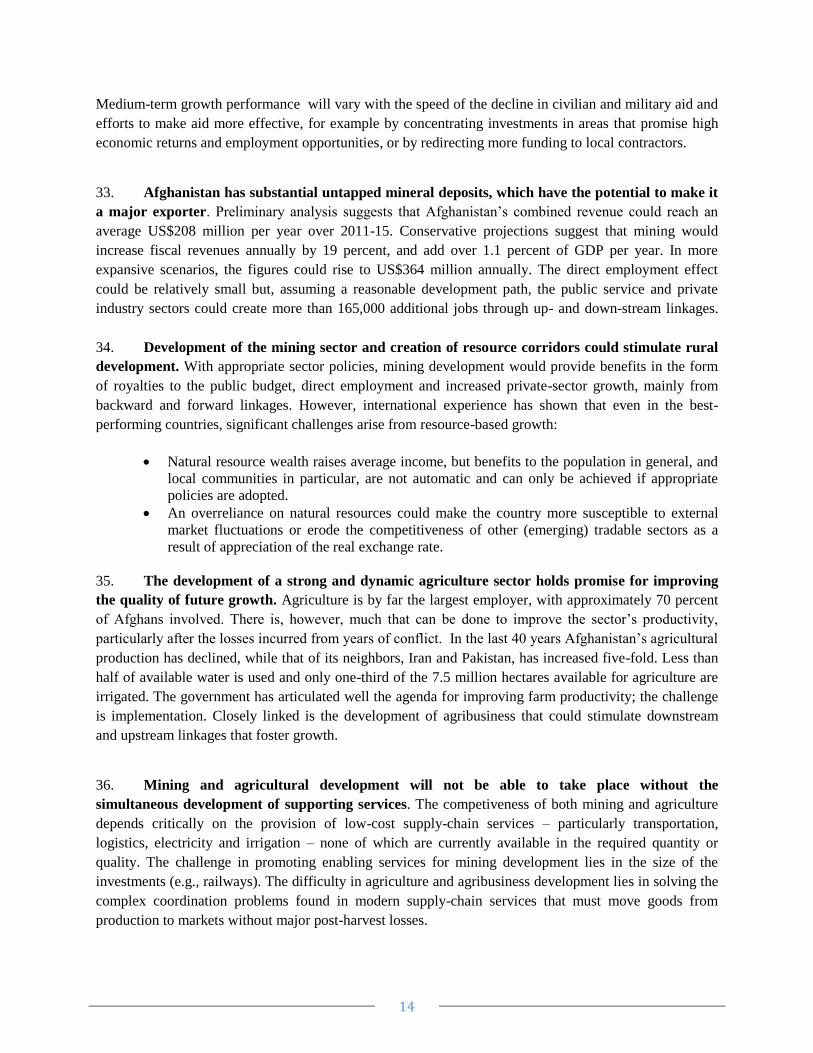
10. Afghanistan has accumulated significant international reserves. Gross international reserves
increased in FY2010/11*, reaching US$5 billion, or about 14.7 months of official imports (Figure 2). This
is the result of higher donor inflows and grants that have led to significant surpluses in the balance of
payments and allowed the Da Afghanistan Bank (DAB) to more than double its international reserves in
the period since FY2005/06. The higher reserves are in line with targets agreed with the IMF and will
allow the Central Bank to intervene in the market to smooth volatility, while maintaining a floating
exchange rate regime.
Prices and Inflation
11. The country moved from sharp deflation to double-digit inflation in one year. Inflation, as
measured by the consumer price index (CPI), rose to 13.3 percent on average year-on-year from March
2009/10 to January 2010/11, while declining only slightly in June. The high volatility in inflation is
explained by the strong import dependence of Afghanistan and fluctuating international prices for food
and fuels. The strong deflation in 2009/10 is explained by declining international prices for food and by a
high degree of food import substitution made possible by a good domestic harvest.
Figure 1. National Consumer Price Index, (y-o-y)
Figure 2. Gross International Reserves
Source: IMF and DAB
Overall Inflation
Food Inflation
0
2
4
6
8
10
12
14
16
Aug
-10
Sep-
10
Oct
-10
Nov
-10
Dec
-10
Jan-
11
Feb-
11
Mar
-11
Apr
-11
May
-11
Jun-
11
Jul-
11
Aug
-11
Sep-
11
Oct
-11
Infl
atio
n(%
) Gross Int. Reserves
9.74
12.5813.01 13.13
14.68
0
2
4
6
8
10
12
14
16
0.0
1,000.0
2,000.0
3,000.0
4,000.0
5,000.0
6,000.0
2006/07 2007/08 2008/09 2009/10 2010/11
%
US$
Mil
lio
ns
Months of Imports

6
12. Changes in food, electricity and fuel prices account for much of the increase in the CPI.
Food prices rose by 12.7 percent by July 2011 (y-o-y). On average households spend around 60 percent
of their income on food. Since Afghanistan is a net food importing country, high and fluctuating food
prices are related to higher international food prices. The price indices for electricity and fuel rose sharply
by 15.2 percent since July 2010 (year on year), partly due to the increase in international fuel and
petroleum prices and partly to the disruption oil imports from Iran. Food and fuel prices also reflect an
increase in the price of transportation (20.1 percent), due to the deteriorating security situation and delays
in the implementation of the Afghanistan-Pakistan Transit Trade Agreement.
Poverty
13. Estimates indicate that 36 percent of the Afghan population is poor, meaning that
approximately 9 million Afghans are unable to meet their minimum basic needs4. Based on the National
Risk and Vulnerability Assessment (NRVA, 2007/08) data, a recent poverty assessment suggests figures
are even higher for vulnerable groups, such as the Kuchis, at 54 percent poor. Similarly, a large share of
the population is vulnerable to negative shocks (over half of the population consumes at less than 20
3 D’Souza and Jolliffe 2010, “Price Shocks, Food Security, and Coping Mechanisms: Household Evidence from Afghanistan,”
(forthcoming). 4 World Bank and Ministry of Economy 2010, Poverty Status in Afghanistan.
Box 1: Food Crisis Update
In a typical year, Afghanistan's total wheat production comes 2/3 from irrigated land and 1/3 from rain-fed areas.
This year's rain-fed harvest, however, was limited with average losses of around 80 percent of output in 14 of the
wheat growing provinces due to drought conditions during the months of April to June. The irrigated wheat
production also declined by about 8-9 percent because of the lower snow levels in the winter of 2011. As a result,
2011 recorded a wheat harvest 25 percent below that of last year and 12 percent below the decade’s average –
leading to flour prices generally 44 percent higher.
The gap between domestic supply and the demand for wheat will be about 1.7 million tons this year, which roughly
doubles the long-term average gap. As always, most it will be served by private sector imports that may not reach
all areas. International prices of wheat remain substantially high and at around 70 percent above last year's prices.
Persistent high food prices pose a risk to groups vulnerable to poverty. If the increase in August 2010 food prices is
sustained, many Afghan households would be at risk of falling into poverty. Preliminary estimates suggest that a
one percent rise in the flour price translates to a 0.21 percent decline in real monthly per-capita food consumption.3
To illustrate the potential effect of such price changes on poverty, a 10 percent increase in wheat prices would push
an additional 377,000 Afghans or 1.3 percent of the population into poverty. This estimation is based on how
households in the NRVA 2007/08 reduced their consumption in response to the food-price shocks of 2008.
Moreover, the data suggests that households trade off quality for quantity as they move towards staple foods and
away from nutrient-rich foods, such as meat and vegetables (given the smaller price elasticity in calorie intake than
in food consumption). Bread and cereals comprise an important share of the poorer households’ consumption
basket, and price volatility directly affects their purchasing power.
WFP and the Ministry of Agriculture, Irrigation and Livestock (MAIL) estimate that the drought might increase the
number of food insecure people by another 2.9 million persons (or about 0.5 million households). The Government,
supported by donors, is planning to increase distribution of food, seed and cattle feed in the drought affected areas.

7
percent above the poverty line). In addition, the mapping of poverty throughout the country shows the
striking finding that the most poverty-afflicted areas are not those in conflict.
Public Finances
Revenue
14. Revenue collection continues growing
strongly by over 20 percent per year. The 2010/11
fiscal year closed with collections at an all time high
of US$ 1.7 billion (10 percent of GDP), exceeding the
IMF target of 9.2 percent of GDP. This is remarkable,
as revenue collection stood at a meager 3 percent of
GDP before 2002/03. Behind these successful
collection efforts is the high growth of tax and
customs duties, which are the drivers of revenue.
During the first quarter of 2011/12, both tax
collection and non tax revenue reached US$490
million (Afs 23.03 billion) and represented 24 percent
of the annual revenue collection target. In
comparison to the same quarter last year, revenues
increased by around 31 percent.5
15. Taxes, especially customs duties, are
driving domestic revenues. Tax collection in
2010/11 grew by 29 percent over those of the previous year. The sales tax (the 2 percent BRT on imports
and the 10 percent BRT on services) was the largest component, reaching an estimated US$347 million;
the income tax (mostly on wages) generated around US$219 million, and fixed taxes (imports by licensed
businesses) were US$193 million. The share of customs revenues rose to 36 percent of total revenues
this year and its collection grew by 27 percent. Overall, more than half of the resources from customs are
attributed to duties on motor vehicles and parts, and fuel imports. In the first quarter of 2011, customs
revenues reached US 266 million (Afs 12.483 billion), which was slightly below its quarterly target (or 11
percent lower than expected.), but still a 16 percent increase over the same quarter last year. Overall,
collection in Q1 closed around 31 percent higher than the same quarter last year and overall collection is
projected to close the year at US$ 2.07 billion (Afs 97.4 billion).
Expenditures
16. The operating budget increased by 26 percent in 2011/12 and the development budget was
cut by a third to approve a more realistic figure. The total core budget for 2011/12 is US$ 4.78 billion
(Afs 224.781 B), of which the operating budget is US$ 3.2 billion (Afs 150.726 billion).
5 Fiscal Bulletin Q1, MOF
Figure 3: Breakdown of Customs Revenue,
2010/11
Source: MOF, Fiscal Bulletin
Motor
vehicles, parts 28%
Minerals
fuels, oils 24%
Milling
products, malt
starch, wheat
gluten 5%
Electric
machinery, equipment
5%
Iron & Steel 5%
Salt, sulfur,
stone 3%
Machinery, mechanical appliances
2%
Beverages,
spirits, vinegar 2%
Other 26%

8
17. Since operating expenditures are growing faster than revenues, fiscal sustainability remains
a challenge. Over the coming years (2015/16 and beyond), there will be large liabilities for recurrent
expenditures arising from: i) increases in the security wage bill in order to recruit and train 352,000
national security troops; ii) the rolling out of the pay & grading reforms and the hiring of new teachers;
and iii) the operation and maintenance costs of assets constructed through development budget spending,
as well as those funded by donors through the external budget. As a result of such needs, domestic
revenues will not be sufficient to cover operational expenditures in the coming years.6 Estimates suggest
that by 2012/13, operational spending will increase to 20 percent of GDP, while revenue collection will
stand at 12 percent of GDP, providing just 60 percent coverage of the operating budget (Figure 5).
18. The largest component of the operational budget in 2010/11 was wages & salaries, which
accounted for 75 percent. (Figure 4) The security wage bill alone represented about two thirds of the
operating budget and 7 percent of GDP. Donors paid 68 percent of last year’s security wage bill.7 A
significant portion of the non security salaries (23 percent) was covered through the Recurrent Cost
window of the Afghanistan Reconstruction Trust Fund (ARTF). The second largest expense was
operations & maintenance, and accounted for 19 percent of operational spending, and 2 percent of GDP
for 2010/11. Finally, a remaining 2 percent of GDP consisted of a combination of pensions, transfers,
capital spending, and interest payments.
6 Fiscal sustainability here refers to a narrow concept of the ability to meet operational expenditures from domestic
revenues. However, its standard definition refers to a country’s fiscal balance in a steady state, the ratio of total
public debt and debt servicing to macroeconomic aggregates like GDP, not increasing over time. 7 Contributions are paid into two trust funds, the Combined Security Transition Command CSTC-A at roughly US$
287 million and the Law and Order Trust Fund for Afghanistan (LOTFA) at US$520 million. Source: Fiscal
Bulleting Q4 1389, MOF.
Figure 4. Core Budget Development Figure 5. Fiscal Sustainability Ratio and Operating
Expenditures
Security Wages
Civil Service Wages
O&M
Others
Development
0%
5%
10%
15%
20%
25%
30%
2005/06 2006/07 2007/08 2008/09 2009/10 2010/11 2011/12
% o
f G
DP
Domestic Revenues
12%
Core Operating Expenditures
20%
38%
Fiscal Sustainability
Ratio
72%
59%
0%
10%
20%
30%
40%
50%
60%
70%
80%
0%
5%
10%
15%
20%
25%
% o
f G
DP

9
19. The Afghan budget continues to rely heavily on external financing. In 2010, of the roughly
US$16.9 billion in total public spending, only US$3.3 billion were channeled through the “core” budget
and was under the control of the government’s PFM systems. In 2011/12, domestic revenues are
budgeted to cover 72 percent of operations and 48 percent of the total core budget, while the remainder
was covered by donor grants, which already account for the bulk of the development spending (or 85
percent of the total development budget).
Figure 6. Public Spending – Core and External Budget 2010/11 (in US$ million)
8
Source: MOF, WB Staff calculations
20. The low rate of execution of the development budget raises concerns about absorptive
capacity. Over the past three years, the Afghan government has only executed about 40 percent of the
development budget (roughly US$ 950 million). Behind these trends are both structural and capacity
issues, as well as an unrealistic budget formulation mechanism. For instance, the budget sometimes
reflects projects for which donor funding has not been fully secured. Projects that are yet to be
implemented or have been stopped are not formally dropped and carried over to the next fiscal year. As a
result, the unspent funds continue to inflate the denominator in the calculation of budget execution. For
2010/11 the size of the carryover accounted for 60 percent of the core development funds. Low execution
rates could undermine the Government’s objective, formulated at the Kabul Conference, to “channel at
least 50 percent of the development aid through the Afghan core budget within two years”.
8 Figures represent actual development budget disbursements, 40 % budget execution rate. The external budget at
US$ 13.6 billion was reported as donor disbursements to World Bank excluding on-budget contributions to the
ARTF, CSTCA and LOTFA trust funds.
Security
$8.6 billion
Non -Security
$ 5.2
billion

10
Figure 7: Core Budget by Sectors, 2011/12
Source: MOF, WB Staff calculations
21. Security spending, mostly salaries, dominates the total core budget in 2010/11. A closer look
at core budget allocations, both operations and development, shows that 40 percent of the on-budget
spending was allocated to security. This share will grow over the coming year when the ANSF will reach
its 352,000 troops target. About a third of the 2010/11 budget was allocated to education (15 percent),
infrastructure, (14 percent) and health (4 percent). The agriculture and rural development sector received
a 9 percent share of the core budget, much of it allocated to the National Solidarity Program.
22. Delays in direct donor contributions resulted in a tight cash position. In response to the
prolonged negotiations over a new IMF supported program, donors withheld their direct budget
contributions. In the case of the ARTF trust fund, this represented a gap of US$ 270 million (US$ 200
million for recurrent expenditure). Other than domestic revenues, these are the only resources over which
the MOF has discretion to finance its deficit. As a way to maintain its cash position until the issue was
resolved, the government under-spent on operations and maintenance throughout 2010/11. However, new
budget estimates suggest that, in the absence of further donor contributions to the operating budget, the
cash balance would fallen to below a month of operating expenditures by early January 2012.
23. The fiscal year 2010/11 has also seen progress with wider public financial management
reform. The Afghanistan Financial Management Information System (AFMIS) is now connecting all
line Ministries and all 34 Provinces. Coverage of the Verified Payroll Program was extended to over
562,000 civil servants, of which 380,000 are currently receiving salaries through direct deposit in their
bank accounts. Finally, the monthly financial statements have been made timely available on the
treasury’s website. Procurement reform also continue to make progress: bidding opportunities and
outcomes of awarded contracts by line ministries are now made publicly available on the website of the
Security39%
Governance6%
Infrastructure14%
Education15%
Health4%
Agriculture & Rural Dev
9%
Social Protection
1%
Economic Governance & Private Sector
4% Contingency8%

11
Public Procurement Unit (PPU). The system is also able to accept data on awarded contracts as well as
bidding opportunities.
Private Sector Development
Investment Climate
24. Given the security situation, doing Business in Afghanistan is more difficult than in other
South Asian countries. The World Bank’s Doing Business Index 2011 ranked Afghanistan lowest in the
region and 167th out of 183 countries surveyed. At a firm-level, Afghan businesses are restrained by red
tape, lack of policy predictability, and corruption. Afghanistan’s regulatory framework is relatively well
ranked on two indicators – Starting a Business (25th) and Paying Taxes (53th). However, it is ranked last
(183th) on three indicators--Protecting Investors, Trading across Borders and Closing a Business (see
table below). In order to address and enhance Afghanistan’s business environment the Ministry of
Commerce and Industries launched an initiative in December 2010 aimed at making improvements in
these areas.9
Figure 9: Doing Business Indicators 2011, Regional Comparison
Source: World Bank, Doing Business 2011
9 The Doing Business survey focuses on regulatory constraints. There are other, and clearly dominant constraints to
the development of the private sector, such as limited access to infrastructure, and security conditions, which ranked
highly in the Investment Climate Assessment (2008).

12
Financial Sector
25. One year later, financial sector development is still clouded by the implications of the Kabul
Bank crisis. The crisis highlighted the limited capacity of the Central Bank to effectively supervise the
banking sector and enforce regulations. The IMF is therefore discussing with the authorities a satisfactory
resolution of the problem as a critical threshold for the establishment of an Extended Credit Facility. As
of October 2011, no final agreement on a new program was reached, however, progress on the
implementation of the resolution plan moved considerably and recent developments suggest there could
be a program in place over the coming months. Donors have begun to fund again the ARTF investment
window in the short-term and are expected to return to more normal contributions once the agreement
with the IMF is in place.
26. Measures to strengthen the health of the financial sector are underway. The Afghan
authorities have been in intensive discussions with the international community on priority steps to
stabilize the banking sector and lay foundations for a broad banking sector reform. The key short term
priorities are: (i) resolving the Kabul Bank issues and (ii) strengthening banking supervision to re-
establish confidence in the health of the banking sector and avoid similar crises in the future. In this
context, the IMF is providing technical assistance on the resolution of Kabul Bank’s problems. The UK
Department for International Development (DFID) and the World Bank are financing audits across the
banking system. USAID is providing renewed support to the Central Bank via its new Financial Access
for Investing in the Development of Afghanistan (FAIDA) project, notably on mobile banking. As part of
the World Bank Financial Sector Rapid Response Project, approved in August 2011, measures will be
taken to modernize the national payment system which is currently dominated by Kabul Bank.
Natural Resources
27. Hajigak tender enters evaluation stage. The start of mining-related construction at Hajigak
was delayed by the decision to re-launch the tender for the exploration concessions last year in order to
ensure a larger response from international investors. This resulted in strong international interest. The
bids for the tender were opened in September and include six bids from Indian, Iranian and Canadian
companies. It is expected that the contract will be awarded by the end of this year. The mining project at
Hajigak is, by a wide margin, one of the largest investments in the country’s history and will – together
with the large copper mine located in Aynak - play a leading role in the economy in years to come.
Current projections estimate that the two mines could generate up to US$342 million annually in
government revenue until 2015, and up to US$704 million annually in 2016 and beyond. In the medium
term the mining sector could contribute up to 5 percent of annual growth. However, large investments
(US$6-US$15billion) in mining and infrastructure development are needed in the coming years to exploit
the sector’s potential.
28. The extractive industry sector is attracting increasing investments in oil and gold. In the past
nine months, Afghanistan has awarded two contracts for oil extraction in the northern Amu Darya basin.
Reserves are estimated to be a relatively modest 80m barrels. However, the nearby Afghan-Tajik basin is
estimated to hold around 1.5bn barrels of crude oil. Developing these oilfields would help to generate tax

13
revenue and would also help Afghanistan reduce its reliance on foreign fuel. If the six-month pilot is
successful, the Government would extend extraction at the Angot site and permit drilling in four other
fields that could generate US$50m in annual revenue for the government. Earlier this year, the
government signed an agreement with Afghan Krystal Natural Resources, allowing the company to invest
US$50m in Afghanistan's second gold mine, Qara Zaghan. Afghanistan is estimated to have US$25
billion worth of gold deposits. Production is planned to begin in 2013, provided the government can
satisfy the high security needs around the mine.
Infrastructure
29. Afghanistan’s telecommunications industry is growing rapidly. By early 2010, the number of
mobile telephone subscriptions was estimated to be about 13 million with the networks covering about 60
percent of the population. Subscriptions are projected to reach 19 million by end- 2011, of which private
firms will account for 99.2 percent.10
More than half of Afghan households have at least one mobile
telephone. Thus, the private-sector led telecommunications revolution in Afghanistan has been one of the
country’s success stories. At the same time, only 5 percent of the population is believed to use the
internet, with services limited to major urban areas such as: Kabul, Herat, and Mazar-e-Sharif.
30. Freight services have started on Afghanistan’s first major railway. Under a three-year
agreement, Uzbekistan’s national railway company (UTY) is operating the 75 km long gauge line, which
was built at a cost of US$165m and supported by the Asian Development Bank. The line starts at the
Hairatan freight terminal on the Afghan side of the Uzbek border, which handles around half of
Afghanistan’s imports, and ends at a site near Mazar-e-Sharif airport. The freight service is expected to
increase traffic through the Hairatan terminal, which has reached full capacity (4,000 tons of cargo a
month); however, the flow of goods from Central Asia to Afghanistan is projected to rise to 25,000-
40,000 tons a month over the next few years. At a later stage, the railway network will be extended to
Herat in the west and Tajikistan in the east. The railway will primarily service commercial and civilian
cargo.
Economic Growth in the Medium and Long-Term
31. Real GDP growth might slow down in 2011/12, reaching levels lower than the initially
projected 8 percent. The drought between April and June will affect agriculture output which is likely to
be 25% lower than last year’s production. Services will continue to provide much of the growth in the
year, benefiting from higher government and donor spending, and private investments in the mining
sector. The mining sector is expected to grow vigorously, as the construction phase of the Aynak copper
mine intensifies.
32. Stability, continued reform and external aid will determine the success of the transition and
medium-to-long term growth prospects. The transition is likely to be characterized by a slowdown in
economic growth. While more detailed analysis is currently underway, it is reasonable to expect that
Afghanistan will revert to a lower growth trajectory (compared to the recent 10 percent per year).
10 Forecast of Wireless Intelligence, based on data up to Q1 2010.
14
Medium-term growth performance will vary with the speed of the decline in civilian and military aid and
efforts to make aid more effective, for example by concentrating investments in areas that promise high
economic returns and employment opportunities, or by redirecting more funding to local contractors.
33. Afghanistan has substantial untapped mineral deposits, which have the potential to make it
a major exporter. Preliminary analysis suggests that Afghanistan’s combined revenue could reach an
average US$208 million per year over 2011-15. Conservative projections suggest that mining would
increase fiscal revenues annually by 19 percent, and add over 1.1 percent of GDP per year. In more
expansive scenarios, the figures could rise to US$364 million annually. The direct employment effect
could be relatively small but, assuming a reasonable development path, the public service and private
industry sectors could create more than 165,000 additional jobs through up- and down-stream linkages.
34. Development of the mining sector and creation of resource corridors could stimulate rural
development. With appropriate sector policies, mining development would provide benefits in the form
of royalties to the public budget, direct employment and increased private-sector growth, mainly from
backward and forward linkages. However, international experience has shown that even in the best-
performing countries, significant challenges arise from resource-based growth:
Natural resource wealth raises average income, but benefits to the population in general, and
local communities in particular, are not automatic and can only be achieved if appropriate
policies are adopted.
An overreliance on natural resources could make the country more susceptible to external
market fluctuations or erode the competitiveness of other (emerging) tradable sectors as a
result of appreciation of the real exchange rate.
35. The development of a strong and dynamic agriculture sector holds promise for improving
the quality of future growth. Agriculture is by far the largest employer, with approximately 70 percent
of Afghans involved. There is, however, much that can be done to improve the sector’s productivity,
particularly after the losses incurred from years of conflict. In the last 40 years Afghanistan’s agricultural
production has declined, while that of its neighbors, Iran and Pakistan, has increased five-fold. Less than
half of available water is used and only one-third of the 7.5 million hectares available for agriculture are
irrigated. The government has articulated well the agenda for improving farm productivity; the challenge
is implementation. Closely linked is the development of agribusiness that could stimulate downstream
and upstream linkages that foster growth.
36. Mining and agricultural development will not be able to take place without the
simultaneous development of supporting services. The competiveness of both mining and agriculture
depends critically on the provision of low-cost supply-chain services – particularly transportation,
logistics, electricity and irrigation – none of which are currently available in the required quantity or
quality. The challenge in promoting enabling services for mining development lies in the size of the
investments (e.g., railways). The difficulty in agriculture and agribusiness development lies in solving the
complex coordination problems found in modern supply-chain services that must move goods from
production to markets without major post-harvest losses.

15
37. The transition process will pose significant challenges to maintaining fiscal sustainability.
Domestic revenues are expected to grow as the mining sector develops and tax revenues become stronger
with improvements in tax administration and the introduction of VAT in 2014. However, operating
expenditure will grow faster while external support will declines during the transition years and a
revenues from mining activities will only begin to build. In particular, the sustainability of the operating
budget will be pressured by the military transition and pay-and-grading reform, the resolution of Kabul
Bank problems, integrating externally funded technical assistance into the formal civil service system,
and the need for large increases in spending for operations and maintenance. Finally, the implementation
of some of the 22 National Priority Programs will require additional resources, as the bulk of programs
have not secured funding.
38. Financing additional operations and maintenance (O&M) requirements, which are
currently underfunded, will become the main source of fiscal tension. The handover of donor- and
military-funded assets will add significant recurrent liabilities to the government budget if they are to be
maintained. In this context, relatively little is known about the large assets created by the Provincial
Reconstruction Teams (PRT) and other off-budget donor funding. Much of the US Department of
Defense’s Commander’s Emergency Response Program (CERP) budget is spent on development through
either the PRT or directly by the various US regional commands. This has considerably increased the
amount of money available for development at the sub-national level. However, it is questionable if all of
these developments can be sustained by the government in the future.

16
World Bank Assistance to Afghanistan Overview
39. World Bank assistance comprises a portfolio of International Development Association (IDA)
grants and credits as well as the projects it supervises on behalf of the ARTF. Since 2002, IDA has
committed a total of US$2.3 billion in grants (80 percent) and credits (20 percent) in Afghanistan. Thirty-
six development and emergency-reconstruction projects and four budget-support operations have been
committed to date. In addition, the ARTF has committed US$2.3 billion for recurrent costs of government
and US$1.8 billion in ARTF investments in national government programs. At end-August 2011 the
active IDA portfolio was worth US$1.1 billion and the active ARTF investment portfolio was worth
US$899 million.
New Financing in FY2009/10 and FY2010/11
40. In FY2009/10, IDA approved six new grants worth US$197 million. These included US$7.5
million for the Pension Reform Project, US$30 million for the Afghanistan Rural Enterprise Development
Program (AREDP), US$50 million for the Customs Reform and Trade Facilitation project, and US$40
million for the third phase of the National Solidarity Program (NSP III). In addition, the crisis response
window of IDA was utilized to provide an extra US$69 million to critical human development
investments in Afghanistan, including the Strengthening Higher Education Project (SHEP) and the
Strengthening Healthcare for the Rural Poor Project (SHARP). In addition, the ARTF approved US$290
million in recurrent-cost financing (of which US$63.8 million was based on meeting the benchmarks of
the ARTF Incentive Program 1389) and US$196 million for investments, including NSP III, the National
Emergency Rural Access Project (NRAP), SHARP, and the Horticulture and Livestock Project.
41. During FY2010/11, five projects were approved by the World Bank board totaling $261.8
million, ensuring that the full IDA 15 allocation was utilized by the government. The new projects include
the US$40 million additional financing for the National Emergency Rural Access Project (NERAP), the
Sustainable Development of Natural Resources additional financing (US$52m), the ICT Sector
Development Project (US$50m), the Afghanistan New Market Development Program (US$22m), and the
Irrigation Restoration and Development project (US$97.8m). Under the ARTF, new investment financing
of US$554 million was committed in FY 2011/11, of which the substantial part was for co-financing of
the core IDA-financed national programs such as NSP, EQUIP and NRAP, as well as new investments in
agriculture and infrastructure.

17
Selected Macroeconomic Indicators, 1381 - 1389
Million of Afs, nominal unless stated otherwise
actuals estimated
1381 1382 1383 1384 1385 1386 1387 1388 1389 2002/03 2003/04 2004/05 2005/06 2006/07 2007/08 2008/09 2009/10 2010/11
Real Sector
Nominal GDP 185,471 224,696 252,597 311,436 352,308 435,692 533,522 615,082 729,905
GDP (in million US$) 4,142 4,584 5,280 6,272 7,058 8,746 10,471 12,481 15,928
Real GDP (base 2002/03) 185,470 201,132 203,255 225,969 238,520 271,293 281,090 340,176 368,868
Agriculture 70,365 72,335 56,249 66,205 62,823 72,055 61,307 88,627 82,979
Industry 43,373 47,830 56,186 63,485 72,162 77,670 82,130 87,146 92,614
Services 69,162 76,338 85,056 89,656 96,102 114,644 130,484 152,989 180,703
Real GDP growth (%) n.a. 8.4 1.1 11.2 5.6 13.7 3.6 21.0 8.4
GDP per capita 8,135 9,441 10,215 12,122 13,198 15,897 18,810 21,013 24,186
Money and Prices
CPI inflation (average, %) 5.1 24.1 13.2 12.3 5.1 13.0 26.8 -13.2 13.7
Broad money (M2) n.a. n.a. n.a. n.a. n.a. 91,300 119,600 162,500 226,400
Investment and Saving
Gross Domestic Investment 63,096 87,137 119,214 143,627 153,781 176,800 194,232 194,832 191,687
o/w: private 13,659 18,175 24,251 30,957 28,916 37,340 47,869 53,679 61,770
Gross Domestic Savings 56,386 50,077 107,431 135,299 134,125 182,497 198,942 177,720 203,859
o/w: private n.a. -12,089 15,983 19,273 20,164 53,359 74,549 46,125 67,312
Government finance
Domestic Revenue 5,864 10,168 12,812 20,652 28,819 33,579 41,390 63,531 80,384
o/w: tax revenue n.a. 5,176 9,378 14,035 21,893 24,994 28,777 51,532 64,389
Operating Grants 9,430 11,717 14,214 16,878 19,214 23,207 29,507 32,768 54,500
Development Grants n.a. 4,104 12,793 18,292 16,625 33,416 22,733 30,089 26,200
Total Core Expenditure
15,514 30,054 46,039 54,222 78,628 95,770 115,888 135,051 155,098
Operating 15,514 21,972 26,605 31,979 43,448 50,727 69,824 88,072 110,453
Rule of law 1,170 1,595 1,441 3,274 4,291 4,330 14,498 18,287 22,934
Security 6,874 11,745 10,633 14,683 18,843 22,613 30,257 38,165 47,863
Health 940 1,062 1,108 1,222 1,323 1,418 1,473 1,857 2,329
Education 2,490 4,261 6,084 7,344 9,350 9,209 12,795 16,139 20,240
Others 4,040 3,308 7,339 5,457 9,641 13,157 10,801 13,624 17,086
Development n.a. 8,082 19,434 22,243 35,180 45,043 46,065 46,979 44,645
Rule of law n.a. 28 233 436 784 1,254 885 1,365 1,891
Security n.a. 1,045 823 1,367 1,411 1,193 672 1,010 419
Health n.a. 171 1,076 993 2,036 2,593 3,259 3,740 3,143
Education n.a. 177 406 1,217 1,699 4,317 4,149 5,519 5,264
Others n.a. 6,661 16,896 18,231 29,251 35,685 37,101 35,344 33,930
Operating balance -9,650 -11,804 -13,793 -11,327 -14,629 -17,148 -28,434 -24,541 -30,069 Operating balance
(incl. grants) -220 -86 421 5,551 4,585 6,059 1,073 8,227 24,432 Overal Core balance
(excl. grants) -9,650 -19,886 -33,227 -33,570 -49,809 -49,809 -74,498 -71,520 -74,713
Fiscal sustainability ratio (Domestic revenues/
operating exp) 37.8 46.3 48.2 64.6 66.3 66.2 59.3 72.1 72.8

18
External Sector
Current account (incl. grants) -149.8 -756.1 -246.3 -167.7 -393.8 114.4 92.4 -347.2 265.7 Exports FOB (in million US$) 1/ 1,290.6 1,893.6 1,643.0 1,795.0 1,820.0 1,853.5 2,465.0 2,517.2 2,836.3
Imports FOB(in million US$) 2,508.2 4,379.3 5,086.3 6,130.4 6,741.9 7,793.8 8,944.7 8,871.6 9,139.0 Gross reserves
(in million US$) 425 822 1,309 1,661.9 2,039.5 2,784.3 3,591.2 4,208.5 5,321.1
Gross reserves (months of imports GNFS) 2.8 4.9 6.8 7.8 9.7 12.6 13.0 13.1 14.7
Current account balance
(incl. grants, % of GDP) -3.6 -16.5 -4.7 -2.7 -5.6 1.3 0.9 -2.8 1.7
Current account balance (excl. grants, % of GDP) -31.9 -64.1 -67.5 -72.2 -71.1 -68.1 -59.6 -51.3 -39.8
Total External debt
Total debt stock(in million
US$) 539 640 763 11,939 11,971 2,012 2,061 1,147 1,280
Debt-to-GDP Ratio (%) 13.0 14.0 14.5 190.4 169.6 23.0 19.7 9.2 8.0
Memorandum items
Population (in millions) 22.80 23.80 24.73 25.69 26.69 27.41 28.36 29.27 30.18 Exchange rate, average
(Afs/US$) 45 49 48 50 50 50 51 49 47
Source: MOF, IMF, and WB staff calculations
1/ Excludes opium exports and transit trade and includes official recorded exports, estimates of smuggling, reexports and sales to
nonresidents.