
Affordable Housing, Opportunity Neighborhoods, and Behavioral Health June 20, 2013 National...
22
Affordable Housing, Opportunity Neighborhoods, and Behavioral Health June 20, 2013 National Neighborhood Indicators Partnership Eleanor Tutt [email protected]
-
Upload
bertram-stanley -
Category
Documents
-
view
216 -
download
1
Transcript of Affordable Housing, Opportunity Neighborhoods, and Behavioral Health June 20, 2013 National...

Affordable Housing, Opportunity Neighborhoods, and Behavioral Health
June 20, 2013National Neighborhood Indicators
Partnership
Eleanor [email protected]

Behavioral Health Network
• Collaboration between:– Providers– Advocacy Organizations– Government Leaders– Community Members
• Seven counties• Four Continuum of Care regions
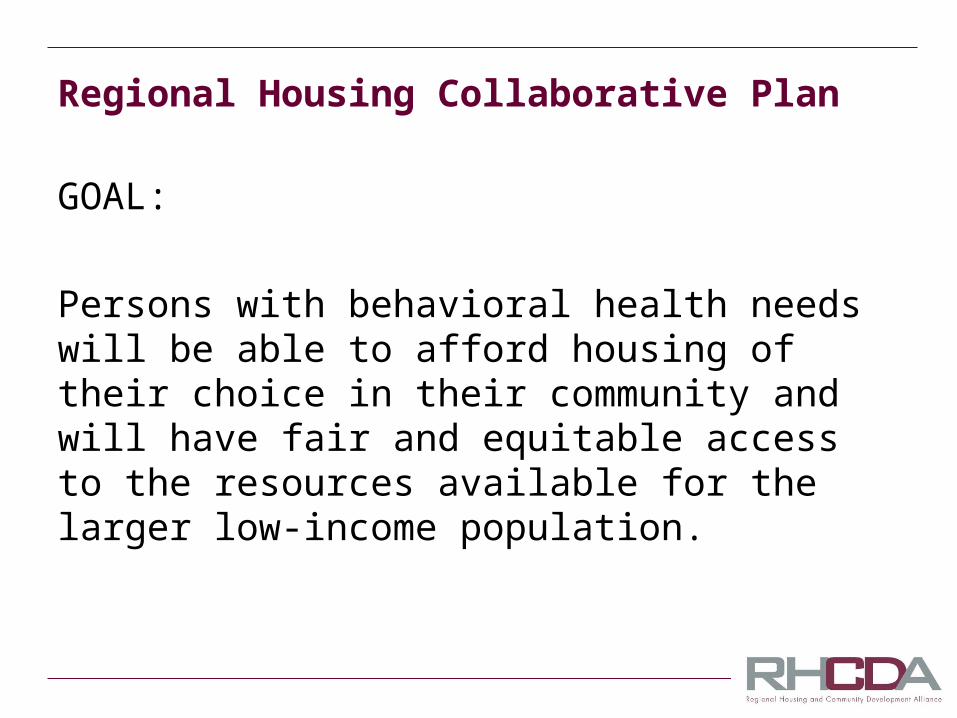
Regional Housing Collaborative Plan
GOAL:
Persons with behavioral health needs will be able to afford housing of their choice in their community and will have fair and equitable access to the resources available for the larger low-income population.

Two Key Questions
• How much affordable housing do we need for persons with behavioral health needs?
• Where should it be located within the region?

How much affordable housing do we need?• Difficult to
separate the needs of behavioral health clients from other low income households
• Both groups compete for limited resources
Total affordable rental housing need
Total Behavioral Health need
Behavioral Health
Homeless

Housing Cost Burden: Total Need
CountyOccupied
Rental Units
Renter Households
with Housing Cost Burden
(>30%)
Percent with Housing Cost
Burden
Franklin 8,202 4,256 52%Jefferson 11,316 5,353 47%Lincoln 2,479 1,226 49%St. Charles 23,889 9,406 39%St. Louis City 73,655 39,039 53%St. Louis County 108,055 54,197 50%Warren 2,347 1,321 56%Total 229,943 114,798 50%

Additional Vouchers Needed
County
Individuals Treated for Behavioral
Health
Vouchers (SCLP,
S+CARE, Disabled HUD
Housing Choice)
Remaining Need (Low Estimate)
Franklin 1,364 184 524Jefferson 3,250 314 1,223Lincoln 1,149 250 318St. Charles 2,888 313 824St. Louis City 11,169 2,372 3,548St. Louis County 8,064 2,148 1,897Warren 613 146 199Total 28,497 5,727 8,500
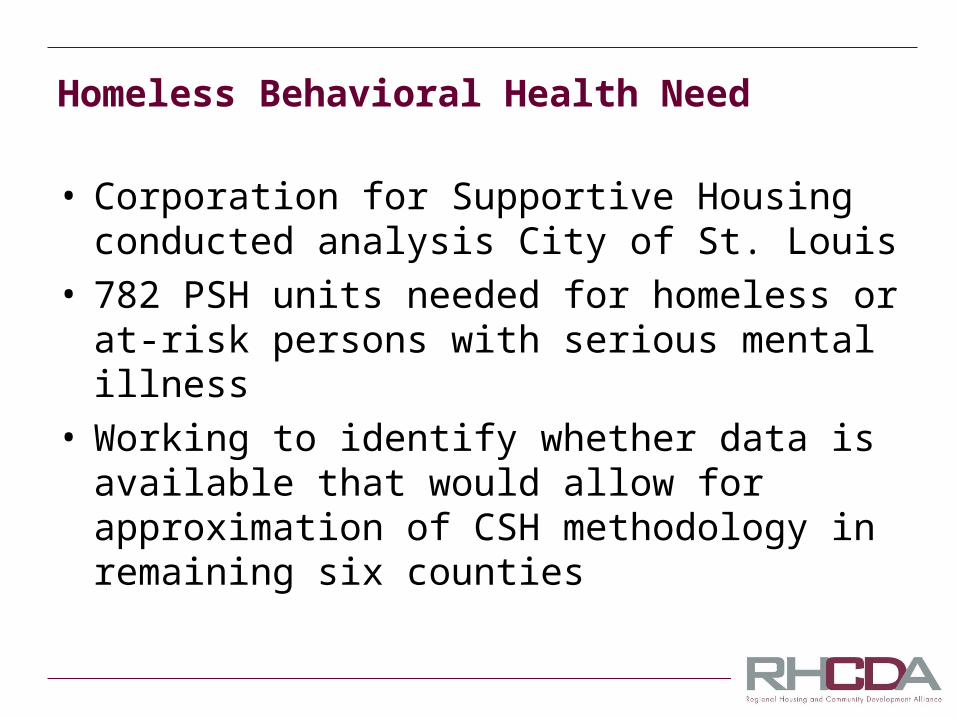
Homeless Behavioral Health Need
• Corporation for Supportive Housing conducted analysis City of St. Louis
• 782 PSH units needed for homeless or at-risk persons with serious mental illness
• Working to identify whether data is available that would allow for approximation of CSH methodology in remaining six counties
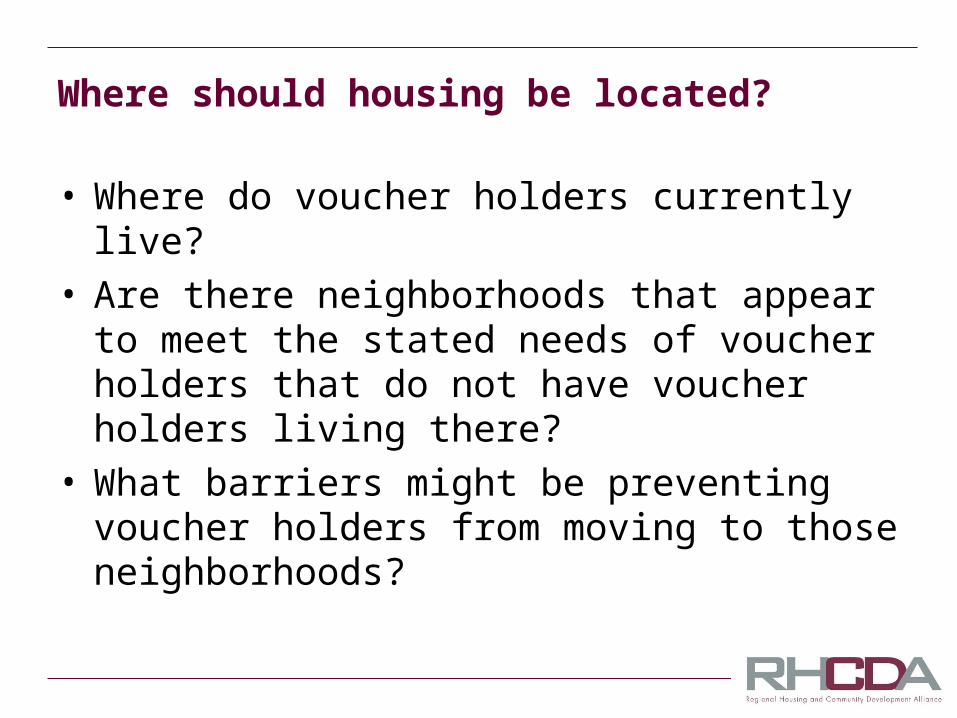
Where should housing be located?
• Where do voucher holders currently live?• Are there neighborhoods that appear to
meet the stated needs of voucher holders that do not have voucher holders living there?
• What barriers might be preventing voucher holders from moving to those neighborhoods?

Existing Voucher Programs
• Supported Community Living Program (SCLP)
• Shelter Plus Care (S+CARE)• HUD Housing Choice Vouchers
– Persons with behavioral health needs are a subset of voucher holders with disabilities
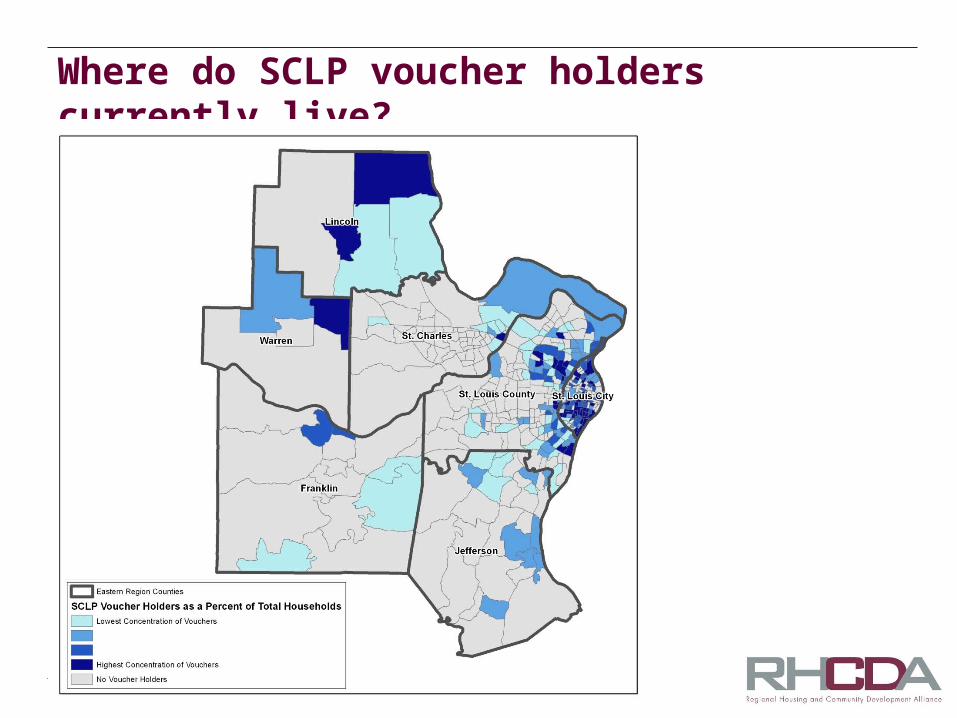
Where do SCLP voucher holders currently live?
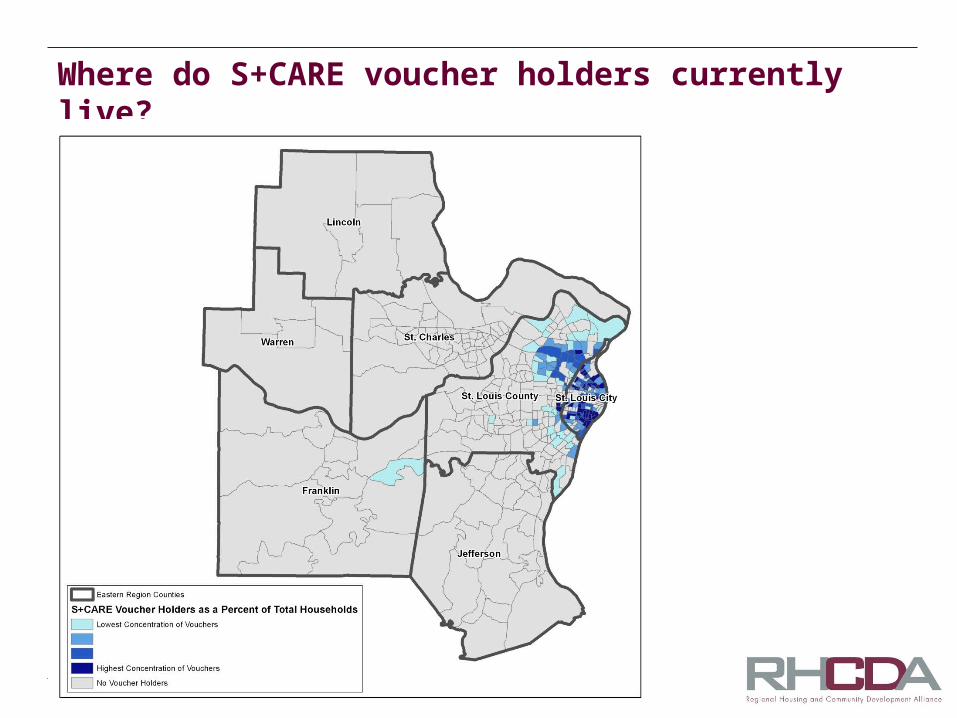
Where do S+CARE voucher holders currently live?

Where do HUD voucher holders with disabilities live?
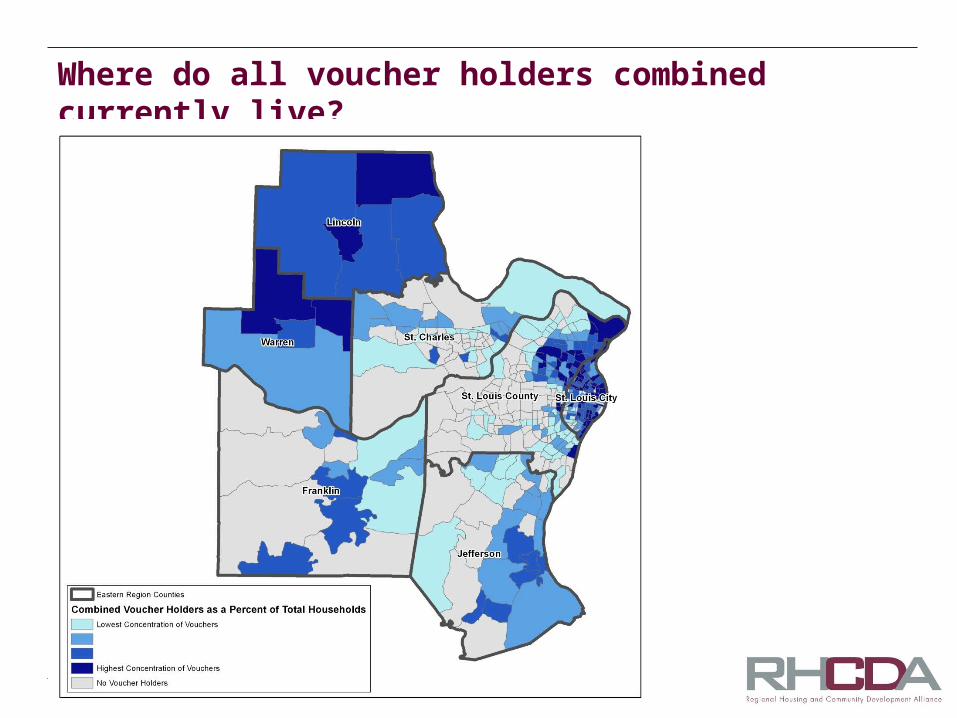
Where do all voucher holders combined currently live?

Data-Informed Discussions
“These counties may have shorter
waiting lists for vouchers than
neighboring St. Charles County.”
“This area doesn’t have much rental
housing at all.”
“I know a landlord here who is willing
to work with my clients. I refer
people here often.”
“As a voucher holder, I tried to
find a home here, but couldn’t.”

•Mentioned by 4 of 4 Groups – Affordability – Independence – Access to transportation
•Mentioned by 3 of 4 groups – Employment opportunities – Access to housing resource information
Focus Groups: Housing Satisfaction
Elements ofOpportunity
Neighborhoods
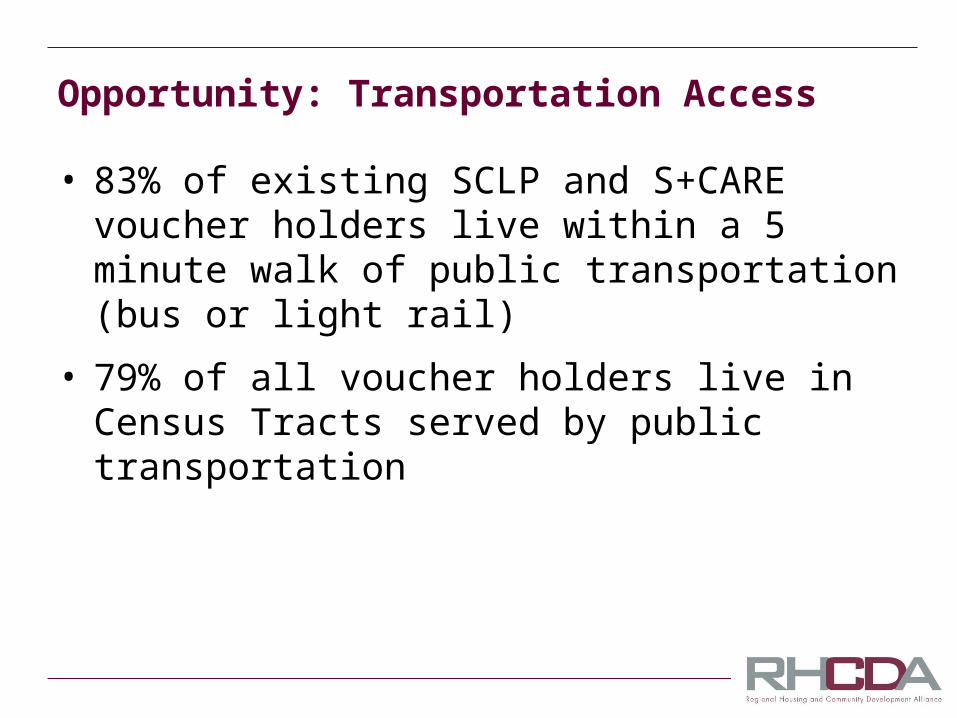
Opportunity: Transportation Access
• 83% of existing SCLP and S+CARE voucher holders live within a 5 minute walk of public transportation (bus or light rail)
• 79% of all voucher holders live in Census Tracts served by public transportation
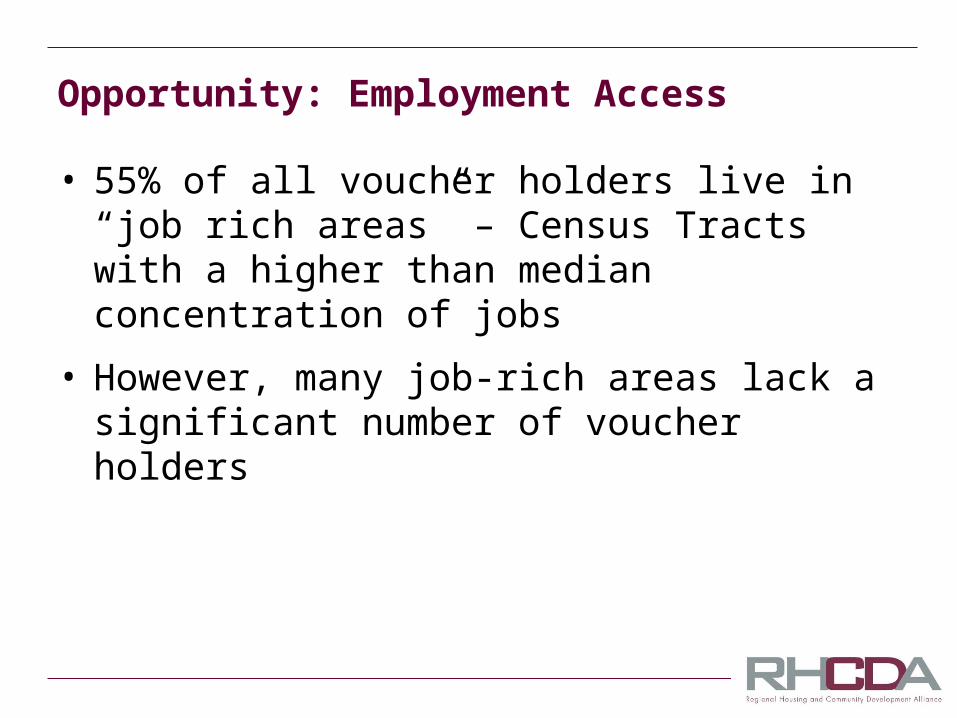
Opportunity: Employment Access
• 55% of all voucher holders live in “job rich areas” – Census Tracts with a higher than median concentration of jobs
• However, many job-rich areas lack a significant number of voucher holders

Opportunity: Employment Access
Job Concentration Voucher Concentration
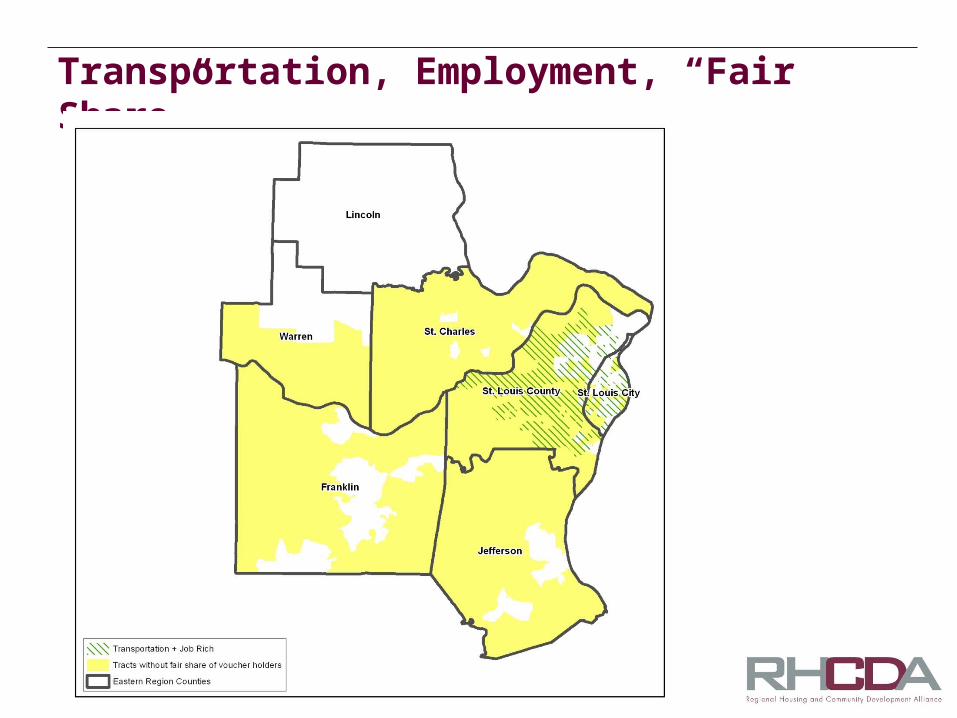
Transportation, Employment, “Fair Share”

Caveats/Limitations
• Current location of voucher holders is a single year snapshot (2009)
• Focus groups interviewed a small subset of total persons with behavioral health need
• We did not try to fully define “opportunity neighborhood,” but looked at two elements emphasized by the focus groups
Caveats/Limitations
• Strategies could include ensuring housing is available in opportunity neighborhoods and/or encouraging transit and job growth in areas where housing is already available.
• Maps were produced to spark discussion and are not final recommendations; RHCDA is one voice in an ongoing, cross-sector planning effort