
Affordable Care Act at Ten - Galen Institute · Affordable Care Act at Ten: Huge Expansion of...
34
Affordable Care Act at Ten: Huge Expansion of Welfare and Injury to Individual Insurance Market By Brian Blase, Doug Badger, and Grace-Marie Turner March 2020
Transcript of Affordable Care Act at Ten - Galen Institute · Affordable Care Act at Ten: Huge Expansion of...

Affordable Care Act at Ten: Huge Expansion of Welfare andInjury to Individual Insurance Market
By Brian Blase, Doug Badger, and Grace-Marie Turner March 2020

P.O. Box 130
Paeonian Springs, VA 20129
www.galen.org
(703) 687-4665
https://galen.org/assets/ACA_at_10_huge_expansion_of_welfare.pdf

March 2020
Affordable Care Act at Ten:
Huge Expansion of Welfare and Injury to Individual Insurance Market
By Brian Blase, Doug Badger, and Grace-Marie Turner1
OverviewThe Patient Protection and Affordable Care Act, signed into law in 2010, represents the most sweeping federal health reform legislation since the creation of Medicare and Medicaid in 1965. Among many other changes, the law:
• dramatically expanded eligibility for the Medicaid program
• significantly increased federal regulation of health insurance
• created subsidies for certain people to purchase coverage in the individual health insurance marke
• initiated or increased 20 taxes (several since repealed)
• implemented substantial Medicare payment reductions
• imposed a tax penalty on uninsured lawful U.S. residents (the tax has since been reduced to $0)
• imposed a tax penalty on employers with more than 50 full-time workers that failed to offer federal-ly-approved coverage
• imposed an excise tax on health insurance that exceeded a certain cost (since repealed)
• created a new long-term care entitlement program (since repealed)
• empowered the federal bureaucracy, particularly the Department of Health and Human Services, with sweeping new powers to intervene in health care markets
• invested the HHS Secretary with unprecedented authority to conduct Medicare demonstration proj-ects and to extend those projects nationally without congressional authorization
• created an advisory board and gave it the power to make cuts in Medicare spending, cuts that would take effect unless Congress enacted an alternative package (since repealed)
Ten years later, the law, commonly known as the Affordable Care Act (ACA), looks quite different than it did when it was signed into law. While the ACA passed with votes only from Democrats, Congress2 enacted a number of bills to amend it from 2011 through 2016 with bipartisan support—bills which
1 Brian Blase and Doug Badger are both senior fellows and Grace-Marie Turner is president of the Galen Institute, a non-profit health policy research organization. Both Blase and Badger have served as presidential advisors on health policy and in senior positions in the U.S. Congress, advising leaders on major health policy initiatives.
2 In part because of strong negative public reaction to the ACA, Republicans gained 63 seats in the House of Representatives and five seats in the Senate in the 2010 elections, delivering a Republican majority in the House and creating a closely divided Senate. See: https://www.nytimes.com/elections/2010/results/house.html

2
President Obama signed into law. These include repealing the long-term care entitlement program (CLASS Act), which actuaries criticized as unsound, de-laying several ACA taxes including the Cadillac tax, health insurance tax, and medical device tax, and protecting small businesses from onerous IRS report-ing requirements. The Obama administration also unilaterally made dozens of changes to the law.3 The Supreme Court intervened as well, most notably mak-ing the Medicaid expansion optional for states in its 2012 decision in NFIB v Sebelius. That decision also upheld the constitutionality of the law’s individual mandate by finding it within Congress’s taxing power. The ACA was President Obama’s top political priority and his signature do-mestic legacy issue. When the law’s main provisions began to take effect, he and his administration faced significant criticism as millions of people lost their previous plans. The exchange websites generally were not operational in the first months of the initial open enrollment period that began in the fall of 2013, as millions of people had difficulty getting new or replacement coverage. As implementation problems mounted, the Obama administration took major actions to modify the law and expand its authority to try to soften provisions that were having negative effects. For example, after millions of people received cancellation notices because their health plans did not meet the requirements of the new law, the Obama administration exceeded its regulatory authority in allowing some people to keep their previous plans (the so-called “grandmoth-er” plans).4 Among many other changes, it delayed enforcement of the employ-er mandate, despite lacking clear legal authority to do so, created a loophole to give members of Congress and their staffs a special subsidy for their health insurance coverage, and granted “transition relief ” to employers, labor unions, states, and many others.
3 Grace-Marie Turner, “70 Changes to Obamacare—So Far,” Galen Institute, Jan. 28, 2016. See: https://galen.org/assets/70-changes-so-far-to-ObamaCare-1.pdf
4 Grandfathered plans are health plans that were in effect when the ACA was passed on March 23, 2010, and are exempt from certain provisions of the law, such as requirements to cover preventive benefits without cost sharing, have an external appeals process, or comply with the new benefit and rating provisions in the small group market. Grandmothered plans are policies purchased between the 2010 passage of the ACA and 2014 and are neither ACA compliant nor grandfathered plans, but remain on the market in accordance with an HHS policy announced in the fall of 2013 permitting renewals of such plans. On November 7, 2013, President Obama apologized to Chuck Todd about people losing their health insurance. The then-president said, “I am sorry that they are finding themselves in this situ-ation based on assurances they got from me. We’ve got to work hard to make sure that they know we hear them and we are going to do everything we can to deal with folks who find themselves in a tough position as a consequence of this.” After the President’s interview with Chuck Todd, his administration initiated the grandmother plan guidance.

3
It also is clear that the Obama administration prioritized maximizing enroll-ment, both in the new health insurance exchanges and the Medicaid expansion without first requiring proper eligibility determinations.5
President Trump, elected in part on his promise to work with Congress to “re-peal and replace” the ACA, assumed office in 2017. Trump supported congres-sional efforts during the first nine months of the year to address problems with the law. While the legislative effort failed with slim Republican majorities in Congress, Congress did subsequently eliminate the tax penalty for not com-plying with the individual mandate when it passed the Tax Cut and Jobs Act later that year. In 2018, Congress repealed the Independent Payment Advisory Board, which had powers to ration Medicare benefits without judicial review and with high hurdles for Congress to overrule the board’s decisions.6 Even though the Democrats took control of the House in 2019, Congress enacted additional major changes to the ACA, eliminating three of the law’s central taxes—the Cadillac tax, health insurance tax, and medical device tax. The Trump administration also took steps to improve states’ individual health insurance markets, including a rule issued in the spring of 2017 that limited the ability of people to wait until they needed medical care to enroll in cov-erage7 and allowing waivers for state-based risk mitigation programs.8 The Trump administration also took other major actions to increase coverage op-tions for individuals and employers. These included rules that expanded busi-nesses’ ability to join together and obtain coverage through association health plans, the expansion of short-term limited-duration insurance (short-term plans), and the expansion of health reimbursement arrangements (HRAs).9
5 Blase, Brian C. and Aaron Yelowitz, “The ACA’s Medicaid Expansion: A Review of Ineligible Enrollees and Im-proper Payments,” Mercatus Center Research, November 18, 2019. See: https://www.mercatus.org/system/files/blase-medicaid-expansion-mercatus-research-v2_2.pdf
6 Sanger-Katz, Margot, “Another of Obamacare’s Unloved Provisions Is Gone,” New York Times, February 9, 2018. See: https://www.nytimes.com/2018/02/09/upshot/obamacare-ipab-medicare-congress.html
7 U.S. Department of Health and Human Services, Patient Protection and Affordable Care Act; Market Stabilization Final Rule. See: https://s3.amazonaws.com/public-inspection.federalregister.gov/2017-07712.pdf
8 Badger, Doug and Edmund Haislmaier, “State Innovation: The Key to Affordable Health Care Coverage Choices,” The Heritage Foundation, September 27, 2018. See: https://www.heritage.org/health-care-reform/report/state-innova-tion-the-key-affordable-health-care-coverage-choices
9 Brian Blase, “Health Reform Progress: Beyond Repeal and Replace,” Galen Institute, September 2019. See: https://galen.org/assets/Health-Reform-Progress-Brian_Blase.pdf

4
These expanded options are projected to benefit millions of Americans, sub-stantially boost enrollment in the individual market, and cut the number of uninsured by about two million. Despite the many statutory modifications to the ACA and regulatory changes that alleviated some key problems, the law has resulted in greater federal government control over the health care system than it did a decade ago, with more requirements, mandates, subsidies, and taxes.10 Largely through the Medicaid expansion, the law reduced the number of people without health insurance by somewhere between 10 and 17 million people relative to what it would likely be without the ACA’s passage.11 And the law guarantees that everyone can obtain coverage regardless of their medical condition without paying higher premiums so long as they enroll during the law’s open enroll-ment period. Through large subsidies, the ACA made this coverage cheaper for low-income households. This paper proceeds as follows. The next two sections examine the effect of the ACA on the individual market for health insurance and its expansion of Med-icaid. Then the paper discusses how the main beneficiary of the law has been the health care industry, particularly health insurers. The following section re-views how the ACA exacerbated consolidation in the health care sector and the resulting harm since consolidation reduces choices and pushes up prices. The paper then includes a section outlining the positive steps taken by the Trump administration to increase health care options and improve the individual market. It concludes with a section on legislative action still needed to create a health care sector that delivers higher quality care at more affordable prices.
10 Many of these problems were anticipated by policy experts shortly after the law took effect. Turner, Miller, Moffit, Capretta, “Why Obamacare Is Wrong for America,” HarperCollins, 2011.
11 It is impossible to know the sources of insurance coverage and the number of uninsured if the ACA had not become law. There would have been far fewer Medicaid enrollees, and likely slightly fewer individual market enrollees and slightly more people covered with employer-sponsored insurance. Overall, the ACA has likely increased Medicaid enrollment by about 12 to 15 million people, has increased individual market enrollment by 2 to 4 million people, and has decreased enrollment in employer coverage by between 2 and 4 million people from where it would have been without the ACA. (The drop in employer coverage is because some of those enrollees are enrolled in the individual market or Medicaid instead.) Thus, to date the ACA has increased the number of people without coverage who would not have otherwise had coverage likely by between 10 to 17 million people. Another way to quantify the number of uninsured is to compare the percentage of the under-65 population uninsured in 2013 and 2018. In 2013, the uninsured rate was 15.3 percent and there were about 268.9 million Americans below the age of 65. In 2018, the uninsured rate was 10.0 percent and there were about 270.9 million Americans below the age of 65. The difference between the number of uninsured in 2018 (27.1 million) and the uninsured in 2018 assuming the same uninsurance rate as in 2018 (15.3 percent x 270.0 million = 41.4 million) would be about 14.3 million people.

5
The ACA Wreaked Havoc on the Individual Insurance Market The ACA dramatically changed the structure and functioning of the individual market for health insurance. New federal requirements standardize coverage nationwide and restrict how insurers can price the coverage. All plans must cover a federally-defined essential health benefits package and provide numer-ous preventive services without patient cost-sharing. While the benefit require-ments are far-reaching, the pricing rule changes are even more profound. The ACA requires insurers offering coverage in the individual market to accept all applicants and to charge the same premiums regardless of health status or medical conditions. Premiums can vary only by age, with insurers able to charge older enrollees up to three times what young adults pay, and by smok-ing status, with insurers able to charge smokers up to 50 percent more than non-smokers. By themselves, these requirements produced an incentive for people to wait to purchase insurance until after they get sick since they would pay the same rate as healthy people and those who were continuously insured. These underlying features of the ACA offer incentives for people to act in socially irresponsible ways. This has resulted in adverse selection and insurance risk pools with a disproportionate number of older and sicker enrollees.12 The ACA contained four provisions intended to limit adverse selection by inducing younger and healthier individuals to purchase policies. First, people were limited to buying coverage during an annual open enrollment period. If they failed to purchase coverage during this period, they would have to wait until the following year to obtain coverage unless they had a life event that allowed them to qualify for a special enrollment period.13 Second, the ACA contained subsidies to reduce the cost of the coverage. The generosity of these subsidies phases out as household income increases, but the subsidies are generally available to people residing in households with income between 100
12 The ACA’s health insurance cooperatives, virtually all of which have collapsed, were another failed experiment in insurance plan design. Grace-Marie Turner, Thomas P. Miller, “ObamaCare Co-ops: Cause Célèbre or Costly Conundrum?” Galen Institute, American Enterprise Institute, June 29. 2015. https://galen.org/assets/ObamaCare-Co-ops-paper-Miller-Turner.pdf
13 There are four basic types of qualifying life events that allow a person to enroll in an ACA plan through a special enrollment period. The first is loss of health coverage such as losing eligibility for an employer plan or Medicaid, the second are household changes such as marriage or childbirth, the third are residency changes, and the fourth are other changes like leaving incarceration.

6
percent of the federal poverty level ($12,490 for a single individual and $25,750 for a family-of-four in 2019) and 400 percent of the FPL ($49,960 for a single individual and $103,00 for a family-of-four) who are not eligible for another type of coverage, such as employer-sponsored insurance, Medicaid, or Medi-care.14 Third, the law created cost-sharing reduction (CSR) subsidies, which compensated insurers for meeting the requirement to provide coverage with lower deductibles and cost-sharing amounts to people with incomes between 100 and 250 percent of the FPL ($31,225 for a single individual and $64,375 for a family-of-four in 2019). Fourth, the ACA contained a tax penalty on individ-uals who failed to purchase compliant coverage, i.e. the individual mandate. Over the past several years, several of these provisions have been modified by congressional and Trump administration actions. Of most importance, as referenced earlier, the Tax Cuts and Jobs Act of 2017 zeroed out the individual mandate penalty effective January 1, 2019. In addition, the Trump administra-tion reformed the special enrollment process to reduce peoples’ ability to wait until they needed medical services to purchase coverage.15 And the Trump ad-ministration took legal action that had the effect of redistributing, and slightly increasing, the subsidization of these policies through actions involving the CSR subsidies. In October 2017, the Trump administration concluded that it could not con-tinue the Obama administration’s practice of making CSR payments to insur-ance companies because Congress failed to appropriate money for this pur-pose. However, eliminating the federal CSR payment did not absolve insurers of their obligation to reduce cost-sharing for enrollees. When federal CSR pay-ments stopped, insurers responded by “silver-loading,” or increasing silver plan premiums. This had the direct effect of increasing federal payments for pre-mium tax credits (PTCs) since the law limits what people eligible for subsidies pay for the second-lowest cost silver plan. Although the distributional effects of silver-loading are complicated,16 the administration’s decision to suspend
14 Insurers are required to reduce cost-sharing amounts so that the actuarial value of silver plans increases to 94 per-cent for people with income below 150 percent of the FPL, increases to 87 percent for people with income between 150 percent and 200 percent of the FPL, and increases to 73 percent for people with income between 200 percent and 250 percent of the FPL.
15 Among many provisions, the rule shortened the open enrollment period, required consumers to submit documenta-tion to provide their eligibility, placed new limits on enrollees’ ability to change plans and metal levels mid-year, and allowed issuers to condition new coverage on the payment of past-due premiums. See: U.S. Department of Health and Human Services, Patient Protection and Affordable Care Act; Market Stabilization Final Rule. https://s3.amazonaws.com/public-inspection.federalregister.gov/2017-07712.pdf
16 As a result of silver loading, silver plan premiums, particularly the second-lowest cost silver plan premium, significantly increased. The second-lowest cost silver plan premium is the benchmark for measuring the size of the

7
CSR payments and Congress’s refusal to appropriate funds for CSRs has led to an overall increase in federal subsidies for exchange plans.17 The most important economic effect of the ACA’s regulatory and subsidy mix was that premiums no longer reflected risk in the individual market. As all actuaries will attest, setting premiums to reflect risk is the central tenet of a well-functioning insurance market. People who face premiums below their risk will tend to over-insure, and people who face premiums higher than their risk will tend to underinsure, including going without coverage. This dynamic can lead to insurance markets unraveling and was largely responsible for the 105 percent average premium increases in the individual market from 2013 to 2017 before President Trump assumed office.18 To prevent even larger premium increases, insurers also dramatically in-creased the size of deductibles in the individual market and created plans with extremely narrow networks. In 2017, the average deductible for the lowest-premium ACA plan—bronze plans which have an actuarial value around 60 percent—was $6,092 for individual coverage and $12,393 for family coverage.19 The corresponding average deductibles for silver plans which have an actuarial value around 70 percent were $3,572 and $7,474.20 The average deductible in the exchanges is about three times the deductible for coverage in a typical employer plan.21
PTC. For people purchasing silver plans that qualified for a PTC, they were essentially held harmless although people purchasing the lowest cost silver plan likely paid a somewhat lower cost. However, as the benchmark premium increased, people purchasing bronze plans, gold plans, and platinum plans faced lower net premiums if they received a PTC. The people who suffered under silver loading were those who purchased silver plans who did not qualify for a PTC.
17 Of note, the Trump administration requested an appropriation for CSR payments beginning in President Trump’s fiscal year 2018 budget.
18 U.S. Department of Health and Human Services, “Individual Market Premium Changes: 2013-2017.” May 23, 2017. See: https://aspe.hhs.gov/system/files/pdf/256751/IndividualMarketPremiumChanges.pdf
19 Coleman, Kev, “Aging Consumers without Subsidies Hit Hardest by 2017 Obamacare Premium & Deductible Spikes,” HealthPocket, October 26, 2016. See: https://www.healthpocket.com/healthcare-research/infostat/2017-obamacare-premiums-deductibles#.XmJF9W5FzIU
20 Ibid.
21 Palosky, Craig and Sue Ducat, “Benchmark Employer Survey Finds Average Family Premiums Now Top $20,000,” Kaiser Family Foundation, September 25, 2019. See: https://www.kff.org/health-costs/press-release/benchmark-employer-survey-finds-average-family-premiums-now-top-20000/; eHealth, “How Much Does Individual Health Insurance Cost?” November 18, 2019. See: https://www.ehealthinsurance.com/resources/individual-and-family/how-much-does-individual-health-insurance-cost

8
Nearly three-quarters of plans available on the exchanges in 2019 were health maintenance organizations (HMOs) and exclusive provider organizations (EPOs)—plans that generally have restrictive provider networks.22 One sur-vey found that 72 percent of exchange plans in the states using HealthCare.gov feature narrow networks.23 This is in contrast to 5 to 7 percent of employer plans that so severely limit choice of physicians and hospitals.24 As a result of these plans’ low payment rates, many of the best hospitals and providers do not participate. For example, not a single ACA plan in Texas covers MD Ander-son Cancer Center in Houston, rated by U.S. News & World Report as the top cancer hospital in the country in 13 of the last 16 years.25 The consulting firm Avalere Health found that exchange plans had 42 percent fewer cancer and car-diac specialists compared to employer-provided coverage.26 A 2016 New York Times piece entitled “Sorry, We Don’t Take Obamacare” reviewed the stories of many exchange enrollees who could not find doctors or hospitals to treat them.27 One exasperated small business owner remarked, “Anyone who is on these plans knows it’s a two-tiered system.”28
22 Carpenter, Elizabeth and Chris Sloan, “Health Plans with More Restrictive Provider Networks Continue to Domi-nate the Exchange Market,” Avalere, December 4, 2018. See: https://avalere.com/press-releases/health-plans-with-more-restrictive-provider-networks-continue-to-dominate-the-exchange-market
23 Livingston, Shelby, “Most ACA exchange plans feature a narrow network,” Modern Healthcare, December 4, 2018. See: https://www.modernhealthcare.com/article/20181204/NEWS/181209976/most-aca-exchange-plans-feature-a-narrow-network
24 Kaiser Family Foundation, “2018 Employer Health Benefits Survey,” October 3, 2018. See: https://www.kff.org/report-section/2018-employer-health-benefits-survey-summary-of-findings/#figurei%20
25 Goodman, John and Devon Herrick, “How Obamacare Made Things Worse for Patients with Preexisting Condi-tions,” The Daily Signal, January 14, 2020. See: https://www.dailysignal.com/2020/01/14/how-obamacare-made-things-worse-for-patients-with-preexisting-conditions/
26 Rosenthal, Elisabeth, “Sorry, We Don’t Take Obamacare,” New York Times, May 14, 2016. See: https://www.nytimes.com/2016/05/15/sunday-review/sorry-we-dont-take-obamacare.html
27 Ibid.
28 Ibid.

9
Projections vs. Reality The Congressional Budget Office (CBO) issued estimates in May 2013 about the ACA that provide a barometer with which to measure expecta-tions with results.29 Many other outlets, such as the Office of the Actuary at the Centers for Medicare and Medicaid Services,30 the Urban Institute,31 and the RAND Corporation,32 all made predictions about the ACA’s effect, which were similar to those made by CBO. CBO’s 2013 estimate was pro-duced after the 2012 Supreme Court made Medicaid expansion optional for states and was the final one before the key coverage provisions took ef-fect, so it is the best for evaluating what was expected with what happened. The figure below shows CBO’s May 2013 projection of exchange enroll-ment compared to actual enrollment for 2014 through 2019.
Source: CBO’s May 2013 projections compared with enrollment data from HHS.
29 Congressional Budget Office, “Effects of the Affordable Care Act on Health Insurance Coverage, Mat 2013.” See: https://www.cbo.gov/sites/default/files/recurringdata/51298-2013-05-aca.pdf. Accessed March 16, 2020.
30 Foster, Richard S., “Estimated Financial Effects of the ‘Patient Protection and Affordable Care Act,’ as Amended,” Centers for Medicare and Medicaid Services, April 22, 2010. See: https://www.cms.gov/Research-Statistics-Data-and-Systems/Research/ActuarialStudies/downloads/PPACA_2010-04-22.pdf
31 Buettgens, Matthew, Bowen Garrett, and John Holahan, “America Under the Affordable Care Act,” Urban Institute, December 7, 2010. See: https://www.urban.org/research/publication/america-under-affordable-care-act
32 RAND Corporation, “Analysis of the Patient Protection and Affordable Care Act (H.R. 3590),” 2010. See: https://www.rand.org/content/dam/rand/pubs/research_briefs/2010/RAND_RB9514.pdf
10
While fewer people enrolled in the exchanges than were projected in 2014 and 2015, enrollment was only about one-quarter below CBO’s expectations in those years. However, exchange enrollment increased only slightly between 2015 and 2016 when the experts expected a large increase given that the law would be well known by then and because the individual mandate tax penalty was to have been fully phased in at $695 per adult or 2.5 percent of income, whichever is greater. While CBO expected the exchanges would reach equilib-rium with about 25 million enrollees by now, it is apparent that enrollment is stuck at about 10 million—a number 60 percent below expectations. It is now widely acknowledged that the ACA’s individual mandate was not ef-fective in compelling healthy people ineligible for subsidies to purchase cover-age in the individual insurance market. The main lesson: the ACA made plans too costly and too unattractive for people who did not have expensive medical needs. On the other hand, premium subsidies have been enormously effective at inducing lower-income individuals, particularly those with incomes below 200 percent of the FPL, to enroll in coverage. People below 200 percent of the FPL qualify for both a large subsidy to defray most of the cost of insurance premi-ums as well as significant cost-sharing assistance that lowers their deductibles and copayments if they purchase a silver plan, as described earlier.33 Half of the people who selected an exchange plan during the 2019 open enroll-ment period had incomes below 200 percent of the FPL ($24,980 for a single individual and $51,500 for a family-of-four in 2019), and two-thirds of people who selected a plan during this period had incomes below 250 percent of the FPL.34 Only eight percent of people who selected a plan during the 2019 open enrollment period resided in a household with an income above 400 percent of the FPL ($49,960 for a single individual and $103,000 for a family-of-four).35
33 People in households with income between 200 and 250 percent of the FPL also qualify for cost-sharing reduction if they purchase a silver plan. However, the assistance is fairly minimal as the cost-sharing only raises the actuarial value of silver plan to 73 percent.
34 Kaiser Family Foundation, “Marketplace Plan Selections by Household Income-Open Enrollment 2019.” See: https://www.kff.org/health-reform/state-indicator/marketplace-plan-selections-by-household-income-2/?currentTimeframe=0&sortModel=%7B%22colId%22:%22Location%22,%22sort%22:%22asc%22%7D. Accessed March 16, 2020.
35 Ibid.

11
Many people who have lost, or who will lose, access to employer coverage or their grandfathered36 and grandmothered37 plans no longer can afford an indi-vidual market plan. Between 2017 and 2018, the number of uninsured Ameri-cans in households with incomes above 400 percent of the FPL increased by 1.1 million, and the number of uninsured people in households with income above 300 percent of the FPL ($37,470 for an individual and $77,250 for a family-of-four) increased by 1.6 million.38 People who don’t receive heavily-subsidized coverage increasingly cannot afford to buy policies on the individu-al market for themselves or their families. While CBO overestimated exchange enrollment by 15 million people (or 150 percent), enrollment in the off-exchange individual market also is much lower than expected. In total, individual market enrollment—including state and federal exchanges, off-exchange ACA-compliant plans, and off-exchange non-ACA-compliant plans (grandfathered and grandmothered plans)—was just 13.8 million people in 2018.39 That compares with nearly 11 million enrolled in individual plans before the ACA’s coverage provisions began. Between March 2016 and March 2018, 4.5 million people with individual insurance dropped out of the market.40 Among middle-income families who were not eligible for a subsidy, almost one-half (47 percent) dropped out of the market.41 This means only about three million more people are enrolled in individual health plans than before the ACA took effect—17 million fewer than CBO
36 Grandfathered plans are health plans that were in effect when the ACA was passed on March 23, 2010, and are ex-empt from certain provisions of the law, such as requirements to cover preventive benefits without cost sharing, have an external appeals process, or comply with the new benefit and rating provisions in the small group market.
37 Grandmothered plans are policies purchased between the 2010 passage of the ACA and 2014 and are neither ACA-compliant nor grandfathered plans, but remain on the market in accordance with an HHS policy announced in the fall of 2013 permitting renewals of such plans.
38 Berchick, Edward R., Jessica C. Barnett, and Rachel D. Upton, “Health Insurance Coverage in the United States: 2018,” United States Census, November 8, 2019. See: https://www.census.gov/library/publications/2019/demo/p60-267.html
39 Fehr, Rachel, Cynthia Cox, and Larry Levitt, “Data Note: Changes in Enrollment in the Individual Health Insurance Market through Early 2019,” Kaiser Family Foundation, August 21, 2019. See: https://www.kff.org/private-insurance/issue-brief/data-note-changes-in-enrollment-in-the-individual-health-insurance-market-through-early-2019/
40 Goodman, John and Devon Herrick, “How Obamacare Made Things Worse for Patients with Preexisting Condi-tions.”
41 Ibid.

12
expected.42 The budgetary cost of ACA subsidies amounts to about $50 billion annually, so just as a matter of simple cost-benefit analysis, the federal govern-ment is spending roughly $17,000 on each new enrollee in the individual mar-ket. This per new-enrollee cost shows the inefficiency of the ACA’s individual market rules and structure. As a way of contrast, CBO’s May 2013 projection estimated that the budgetary cost per new-individual-market enrollee would be $6,450—meaning the actual per new enrollee subsidy cost is more than two-and-a-half times what the government expected.43 Finally, some have suggested that higher-than-expected enrollment in em-ployer-sponsored insurance (ESI) is the primary reason that individual market enrollment is much lower than CBO had projected. But, this is not an accurate explanation. In May 2013, CBO expected that 159 million people would be covered by ESI in 2019.44 Actual enrollment in employer coverage was actually about one to two million less than CBO projected.45 Instead, the main reason CBO’s projections were off is that there are far more people enrolled in Med-icaid than CBO had estimated. Moreover, rather than reducing the number of uninsured by 25 million as CBO expected, the ACA likely reduced the number of uninsured by closer to 14 million people, with the great majority of newly-insured people enrolled in Medicaid.46 The slight increase in individual market coverage is roughly offset by the slight decline in employer-sponsored coverage resulting from the law.
42 CBO’s May 2013 projection was that exchange enrollment would be 25 million people in 2019 and that non-exchange individual market enrollment would be about 5 million less than it would otherwise have been. This means that it expected total individual market enrollment would increase by about 20 million people in 2019.
43 CBO’s May 2013 projections estimated that the budgetary cost of the ACA subsidies would be $129 billion a year in fiscal year 2019 and that the individual market would increase by about 20 million people.
44 This enrollment number as well as the other enrollment numbers or estimates represents the number enrolled with that coverage on average during the year.
45 Kaiser Family Foundation, “Health Insurance Coverage of the Total Population-2018.” See: https://www.kff.org/other/state-indicator/total-population/?dataView=1¤tTimeframe=0&sortModel=%7B%22colId%22:%22Location%22,%22sort%22:%22asc%22%7D. Accessed March 16, 2020.
46 See footnote 11.
13
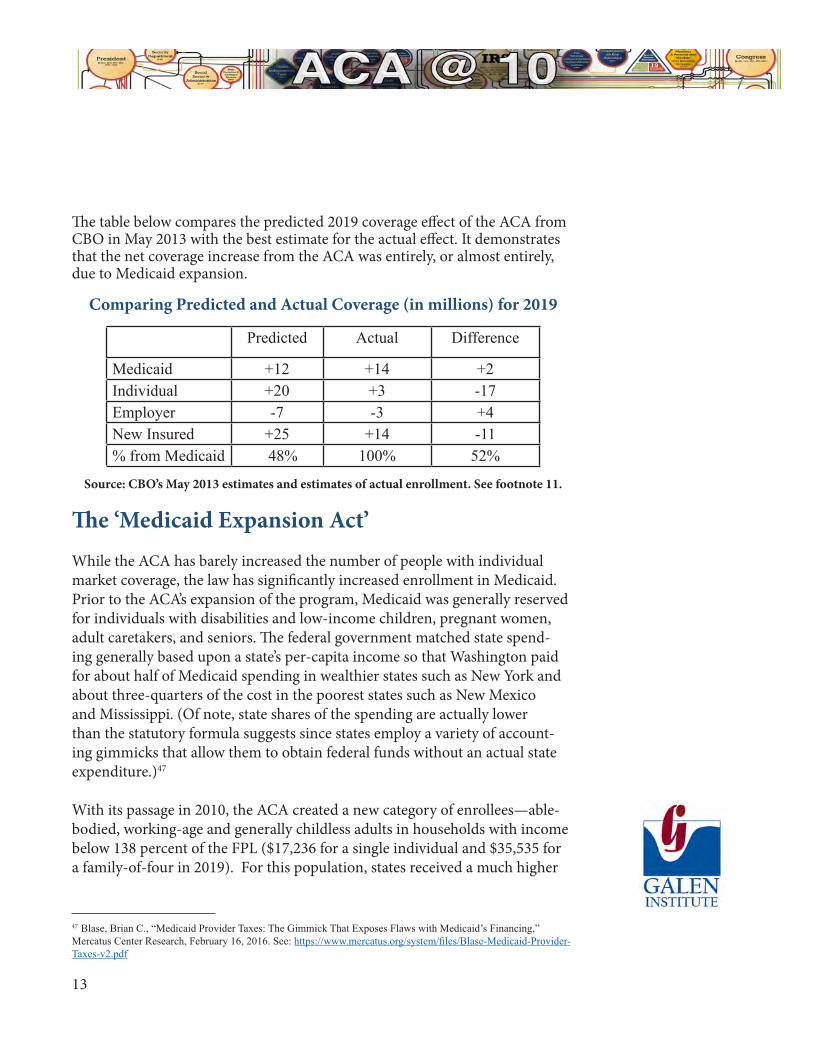
The table below compares the predicted 2019 coverage effect of the ACA from CBO in May 2013 with the best estimate for the actual effect. It demonstrates that the net coverage increase from the ACA was entirely, or almost entirely, due to Medicaid expansion.
Comparing Predicted and Actual Coverage (in millions) for 2019
Predicted Actual Difference
Medicaid +12 +14 +2Individual +20 +3 -17Employer -7 -3 +4New Insured +25 +14 -11% from Medicaid 48% 100% 52%
Source: CBO’s May 2013 estimates and estimates of actual enrollment. See footnote 11.
The ‘Medicaid Expansion Act’ While the ACA has barely increased the number of people with individual market coverage, the law has significantly increased enrollment in Medicaid. Prior to the ACA’s expansion of the program, Medicaid was generally reserved for individuals with disabilities and low-income children, pregnant women, adult caretakers, and seniors. The federal government matched state spend-ing generally based upon a state’s per-capita income so that Washington paid for about half of Medicaid spending in wealthier states such as New York and about three-quarters of the cost in the poorest states such as New Mexico and Mississippi. (Of note, state shares of the spending are actually lower than the statutory formula suggests since states employ a variety of account-ing gimmicks that allow them to obtain federal funds without an actual state expenditure.)47 With its passage in 2010, the ACA created a new category of enrollees—able-bodied, working-age and generally childless adults in households with income below 138 percent of the FPL ($17,236 for a single individual and $35,535 for a family-of-four in 2019). For this population, states received a much higher
47 Blase, Brian C., “Medicaid Provider Taxes: The Gimmick That Exposes Flaws with Medicaid’s Financing,” Mercatus Center Research, February 16, 2016. See: https://www.mercatus.org/system/files/Blase-Medicaid-Provider-Taxes-v2.pdf

14
federal reimbursement rate—equal to 100 percent from 2014 to 2016. This rate gradually declined to 90 percent in 2020, where it is scheduled to remain. As referenced above, the U.S. Supreme Court ruled that Medicaid expansion was optional for states. In many state capitols, the question of whether the state should adopt the Medicaid expansion has been politically controversial. Proponents of state expansion argue that states should take advantage of the generous federal financing in order to extend Medicaid coverage to the new population and reduce the amount of uncompensated care provided by doc-tors and hospitals. Opponents of expansion argue that the program’s resources should be preserved for those traditionally eligible with lower incomes and generally greater needs. And they say that government programs are almost always much more expensive than anticipated, requiring resources to be di-verted from other priorities, such as education and public safety, to finance the expanded Medicaid entitlement.48 Two dozen states and the District of Co-lumbia adopted the expansion at the beginning. On average, every year about two more states have adopted Medicaid expansion, and by January 1, 2020, 35 states and the District of Columbia had implemented the expansion. It is now clear that the key priority for the Obama administration was maxi-mizing enrollment in Medicaid expansion at the expense of program integrity and ensuring that only those people eligible for the program were enrolled. This is most apparent in the decision by its Centers for Medicare and Medicaid Services (CMS) to cancel eligibility audits of state Medicaid programs from fis-cal years 2014 through 2017. This decision was made even though the program was undergoing its most significant change since its creation and that states faced, and still face, significant incentives to classify individuals eligible under previous state eligibility criteria as newly eligible because of the larger federal subsidy as well as to classify individuals who lack any eligibility as newly eli-gible. The Inspector General at the Department of Health and Human Services (HHS) has conducted numerous audits showing massive problems with Med-
48 Ingram, Jonathan, and Nicholas Horton, “A Budget Crisis in Three Parts: How Obamacare is Bankrupting Taxpay-ers,” Foundation of Government Accountability, February 1, 2018. See: https://thefga.org/research/budget-crisis-three-parts-obamacare-bankrupting-taxpayers/
15
icaid eligibility processes since the ACA took effect.49 Systemic errors include neglecting to obtain proper documentation; failing to properly verify income eligibility; misclassifying individuals, including into the newly eligible cat-egory; and failing to properly verify citizenship. One such audit found eligibil-ity problems with more than half of sampled enrollees in California’s Medicaid program.50 For FY 2018, CMS began auditing Medicaid eligibility again, pre-dictably finding massive problems and a skyrocketing improper payment rate. According to CMS, the increase in improper payments is “driven by high levels of observed eligibility errors.”51
Some of the most consistent findings included states maintain-ing insufficient documentation to substantiate that income and other information was appropriately verified, failures to conduct timely and appropriate annual redeterminations, and claiming beneficiaries under incorrect eligibility categories that provide a higher federal matching rate than was appropriate. Eligibility errors of this nature are particularly concerning as it can indicate that individuals are allowed to remain enrolled in the program during times in which they do not qualify, poten-tially diverting limited resources that could otherwise be in-vested in better serving vulnerable populations.52
49 Office of the Inspector General (OIG), “California Made Medicaid Payments on Behalf of Non–Newly Eligible Beneficiaries Who Did Not Meet Federal and State Requirements,” U.S. Department of Health and Human Services (HHS), December 11 2018. See: https://oig.hhs.gov/oas/reports/region9/91702002.asp; OIG, “California Made Med-icaid Payments on Behalf of Newly Eligible Beneficiaries Who Did Not Meet Federal and State Requirements,” HHS, February 20, 2018. See: https://oig.hhs.gov/oas/reports/region9/91602023.asp; OIG, “Colorado Did Not Correctly Determine Medicaid Eligibility for Some Newly Enrolled Beneficiaries,” HHS, August 30, 2019. See: https://oig.hhs.gov/oas/reports/region7/71604228.asp; OIG, “New York Did Not Correctly Determine Medicaid Eligibility for Some Newly Enrolled Beneficiaries,” HHS, January 5, 2018. See: https://oig.hhs.gov/oas/reports/region2/21501015.asp; OIG, “New York Did Not Correctly Determine Medicaid Eligibility for Some Non–Newly Eligible Beneficiaries,” HHS, July 17, 2019. See: https://oig.hhs.gov/oas/reports/region2/21601005.asp; OIG, “Kentucky Did Not Correctly Determine Medicaid Eligibility for Some Newly Enrolled Beneficiaries,” HHS, May 10, 2017. See: https://oig.hhs.gov/oas/reports/region4/41508044.asp
50 Levinson, Daniel R., “California Made Medicaid Payments on Behalf of Non–Newly Eligible Beneficiaries Who Did Not Meet Federal and State Requirements,” Office of the Inspector General U.S. Department of Health and Hu-man Services, December 2018, See: https://oig.hhs.gov/oas/reports/region9/91702002.pdf?mod=article_inline
51 Centers for Medicare and Medicaid Services, “Fiscal Year (FY) 2019 Medicare Fee-for-Service Improper Payment Rate Is Lowest since 2010 While Data Points to Concerns with Medicaid Eligibility,” November 19, 2019. See: https://www.cms.gov/newsroom/press-releases/fiscal-year-fy-2019-medicare-fee-service-improper-payment-rate-low-est-2010-while-data-points
52 Ibid.

16
In fact, since the improper Medicaid payment rate reported is a three-year rolling average and CMS’s FY 2019 report contains two years of audits that did not assess eligibility, Blase and Yelowitz estimate that the true improper pay-ment rate in FY 2019 in the entire program was likely in excess of 20 percent of program spending, or more than $75 billion annually in federal spending.53 States that expanded Medicaid enrolled far more people, and at much higher total cost, than expected—an unsurprising result given the ACA’s incentives for states to maximize Medicaid expansion enrollment, the Obama administra-tion’s abdication of program integrity efforts in order to build political support for the ACA, and the Trump administration’s initial failure to prioritize pro-gram integrity efforts. According to a review by Blase and Yelowitz:
By the summer of 2015, expansion states had experienced significantly higher enrollment and spending than had been expected. Initial enrollment in Kentucky and Washington State was more than double what was projected. In California, initial enrollment was nearly three times what was projected. The Associated Press also reported that enrollment numbers in Michigan, New Mexico, Ohio, and Oregon were all well above expectations. In December 2016, the Foundation for Govern-ment Accountability released a study comparing the high-end enrollment projections of the 24 states that expanded with ac-tual enrollment figures. Overall, these states enrolled more than twice as many people as projected, and every single state had enrollment in excess of its high-end projection. By May 2016, California’s enrollment of 3.8 million people in the Medicaid expansion was particularly excessive—more than four times as many people as projected.54
Using annual surveys conducted by the U.S. Census Bureau, Blase and Yelowitz estimate there are 3.3 million Medicaid adult enrollees in expansion states with income above 138 percent of the FPL who could not have qualified for Medicaid through another pathway such as dis-
53 Yelowitz, Aaron, and Brian Blase, “Medicaid Improper Payments are Much Worse Than Reported,” CATO Insti-tute, November 20, 2019. See: https://www.cato.org/blog/medicaid-improper-payments-are-much-worse-reported
54 Blase, Brian C. and Aaron Yelowitz, “The ACA’s Medicaid Expansion: A Review of Ineligible Enrollees and Improper Payments.”

17
ability or pregnancy.55 According to their research:
The nine states with the largest percentage point change in Medicaid enrollment of adults with income above 138 percent of the FPL (New Mexico, California, Kentucky, Rhode Island, West Virginia, Oregon, Washington, Arkansas, and Colorado) all experienced a more than doubling of the percentage enrolled in Medicaid. There are some areas, such as New York City and Los Angeles, where the problem is so egregious that it may be a sign of purposeful abuse of the program rules and potentially of fraud.56
In March 2016, CBO reported that “the number of people estimated to have been enrolled in Medicaid in 2015 who were made eligible for the program by the ACA was significantly higher than … previously projected.”57 Although CBO expected it would take longer for states to adopt the expansion, it in-creased its estimates of ACA expansion enrollees by about two million people in 2015 and about four million people in 2025 relative to the projections con-tained in its 2015 baseline.58
Inefficient Welfare Expansion and Huge Boon to the Health Care Industry The key legacy of the ACA is a giant expansion of the Medicaid welfare pro-gram, redistributing wealth from middle-income families, and from future generations through debt accumulation, to both lower-income working-age adults and to the health care industry. Although Medicaid had grown consid-erably before the ACA, its growth drastically accelerated as a result of the law. Medicaid spending outpaced education spending by nearly five-and-a-half
55 Ibid.
56 Ibid.
57 Congressional Budget Office, “Federal Subsidies for Health Insurance Coverage for People under Age 65: 2016 to 2026,” March 24, 2016. See: https://www.cbo.gov/publication/51385.
58 Ibid.

18
times between 1988 and 2018.59 Enrollment in Medicaid (and the related State Children’s Health Insurance Program or CHIP) now tops 71 million—the largest single health program in the country.60 Medicaid now represents nearly two-thirds of all federal money received by states.61 As Medicaid expands, private coverage contracts, which also means that tax-payer money is replacing private spending in financing coverage. Economists Jonathan Gruber and Kosali Simon estimated crowd out at 60 percent for ex-pansions of Medicaid and CHIP between 1996 and 2002. That means that for every 10 people gaining this government-financed coverage, six of them simply replaced private coverage.62 A recent academic paper suggests that crowd out from the ACA’s Medicaid expansion was substantial—equal to about 48 per-cent in 2014 and 61 percent in 2017.63 Medicaid’s crowd out of private coverage is likely the main reason that the number of people with employer-sponsored insurance has remained relatively flat despite the strong economic growth and job creation of the past several years when increases in ESI would have been expected. Perhaps most importantly, Medicaid expansion has not produced sufficient value to recipients. For example, in 2008, Oregon utilized a lottery to expand Medicaid to some able-bodied adults with incomes below 100 percent of the FPL. This experiment allowed researchers an important opportunity to assess the impact of gaining Medicaid coverage versus being uninsured. The main
59 Blase, Brian, “Reform the Federal-State Medicaid Partnership to Better Help Those in Need and Save Money,” The Daily Signal, February 12, 2020. See: https://www.dailysignal.com/2020/02/12/reform-the-federal-state-medicaid-partnership-to-better-help-those-in-need-and-save-money/
60 Kaiser Family Foundation, “Total Monthly Medicaid and CHIP Enrollment- November 2019.” See: https://www.kff.org/health-reform/state-indicator/total-monthly-medicaid-and-chip-enrollment/?currentTimeframe=0&selectedRows=%7B%22wrapups%22:%7B%22united-states%22:%7B%7D%7D%7D&sortModel=%7B%22colId%22:%22Location%22,%22sort%22:%22asc%22%7D. Accessed March 16, 2020.
61 PEW Charitable Trusts, “Medicaid Drives Growth in Federal Grants to States,” February 5, 2020. See: https://www.pewtrusts.org/en/research-and-analysis/issue-briefs/2020/02/medicaid-drives-growth-in-federal-grants-to-states
62 Gruber, Jonathan and Kosali Simon, “Crowd-out 10 years later: Have recent public insurance expansions crowded out private health insurance?” Journal of Health Economics. 2008; 27:201-217. doi: 10.1016/j.jhealeco.2007.11.004.
63 Miller et al find that “Reported Medicaid coverage increases by 7.3 percentage points in the first year and by 9.9 percentage points four years after the expansion relative to the year prior to expansion, while uninsurance decreases by 3.8 percentage points in the first year and 3.9 percentage points four years after the expansion.” Miller, Sarah, Sean Altekruse, Norman Johnson, and Laura R. Wherry, “Medicaid and Mortality: New Evidence from Linked Survey and Administrative Data,” August 17, 2019. See: http://www-personal.umich.edu/~mille/ACAMortality.pdf.

19
finding was that the new Medicaid recipients increased the amount of health care they received, including emergency services, but did not show improve-ment on the three physical-health measures assessed—blood pressure, choles-terol, and blood sugar—compared to those who remained uninsured.64 More-over, as a testament to the low perceived value of the program, 40 percent of those who won the lottery did not end up enrolling in Medicaid. According to a 2015 paper from economists at Harvard, M.I.T, and Dartmouth based on the Oregon experiment, enrollees placed relatively low value on the program, valuing coverage at only 20 to 40 cents for each dollar that the program spent on their behalf. 65 The authors found that most of the benefit of expansion accrued to hospitals that were able to reduce the amount of uncom-pensated care they provided. Importantly, while some policy experts believed that Medicaid expansion would reduce emergency care as enrollees found a usual place of primary care, the opposite has occurred. Emergency department use has increased with Medicaid expansion, particularly for conditions where medical treatment could have been deferred.66 In 2019, the fiscal impact of the ACA’s Medicaid expansion and subsidies amounted to roughly $120 billion. It turns out the primary beneficiaries of the ACA are likely health insurance companies, whose stock prices soared after enactment of the law, as states, spending almost entirely federal funds, are setting extremely high comparative payment rates and because millions of people, many of which have minimal health care expenses, have been improp-erly enrolled. In March 2018, the White House Council of Economic Advisers released a report on health insurer profitability since the ACA took effect, find-ing that “health insurance stocks outperformed the S&P 500 by 106 percent”
64 Baicker, Katherine et al., “The Oregon Health Insurance Experiment.” See: http://www.nber.org/oregon. Accessed March 16, 2020.
65 Finkelstein, Amy, Natheniel Hendren, Exro F.P. Luttmer, “The Value of Medicaid: Interpreting Results from the Oregon Health Insurance Experiment,” NBER, June 2015. See: https://www.nber.org/papers/w21308
66 Garthwaite, Craig et al., “All Medicaid expansions are not created equal: The geography and targeting of the Af-fordable Care Act,” Brookings Institute, September 5, 2019. See: https://www.brookings.edu/bpea-articles/all-medic-aid-expansions-are-not-created-equal-the-geography-and-targeting-of-the-affordable-care-act/

20
between January 2014 and January 2018.67 According to the report:
Much of insurers’ increased profitability has resulted from increased Medicaid enrollment and increased payments per enrollee in Medicaid expansion states where the federal govern-ment pays nearly all the costs. While insurers initially incurred losses in the ACA marketplaces as they adjusted to new regula-tions and a relatively unhealthy risk pool, insurers are now prof-iting on the individual market as well, with higher premiums that are largely covered by federal premium subsidies.68
The health care industry also has been able to extract greater profits over the past few years through additional consolidation—consolidation that the ACA exacerbated and the subject of the next section.
67 Ibid.
68 Ibid.

21
ACA Fostered Harmful Consolidation While much of the attention around the ACA has centered on Medicaid expansion, on the pre-existing conditions provisions (discussed more below), and on deterioration of the individual market, the ACA also spurred additional consolidation among health care providers. Consolidation occurs as independent physicians sell their practices to hospi-tals and as hospitals merge into larger systems. Growing consolidation reduces competition in markets, leaving hospitals systems with increased negotiating leverage and creating a pernicious cycle of physician referrals only within the hospital system that employs them. Price increases as high as 40 percent have resulted when competition was lost after one hospital system acquired a com-peting hospital.69 One study found that average physician office visits ranged from 8.3 percent to 16.1 percent higher in areas with less competition.70 An-other study found that total spending in local hospital-owned physician orga-nizations was 10.3 percent higher than in physician-owned organizations and 19.8 percent higher in practices owned by multihospital systems, compared with physician-owned organizations.71 According to the Reforming America’s Health Care System through Choice and Competition report, the ACA’s “increased complexity and administrative burden” played a role in increasing consolidation.72 In fact, three of the ACA’s chief designers wrote in the Annals of Internal Medicine in 2010 that the law was designed to “unleash forces that favor integration across the continuum of
69 Tenn, Steven, “The Price Effects of Hospital Mergers: A Case Study of the Sutter-Summit Transaction.” Interna-tional Journal of the Economics of Business. 2011;18:65-82. See: https://www.ftc.gov/sites/default/files/documents/reports/price-effects-hospital-mergers%C2%A0-case-study-sutter-summit-transaction/wp293_0.pdf
70 Baker, Laurence, M. Kate Bundorf, and Anne Royalty, “Physician Practice Competition and Prices Paid by Private Insurers for Office Visits.” JAMA. 2014;312(16);1653-1662. doi: 10.1001/jama.2014.10921 71 Robinson, James and Kelly Miller, “Total Expenditure per Patient in Hospital-Owned and Physician-Owned Physi-cian Organizations in California.” JAMA. 2014;312:1663-1669. doi:10.1001/jama.2014.14072
72 Azar, Alex, Steven Mnuchin, and Alexander Acosta, “Reforming America’s Healthcare System Through Choice and Competition,” U.S. Department of Health & Human Services, U.S. Department of the Treasury, U.S. Department of Labor, December 3, 2018. See: https://www.hhs.gov/about/news/2018/12/03/reformingamericas-healthcare-system-through-choice-and-competition.html
22
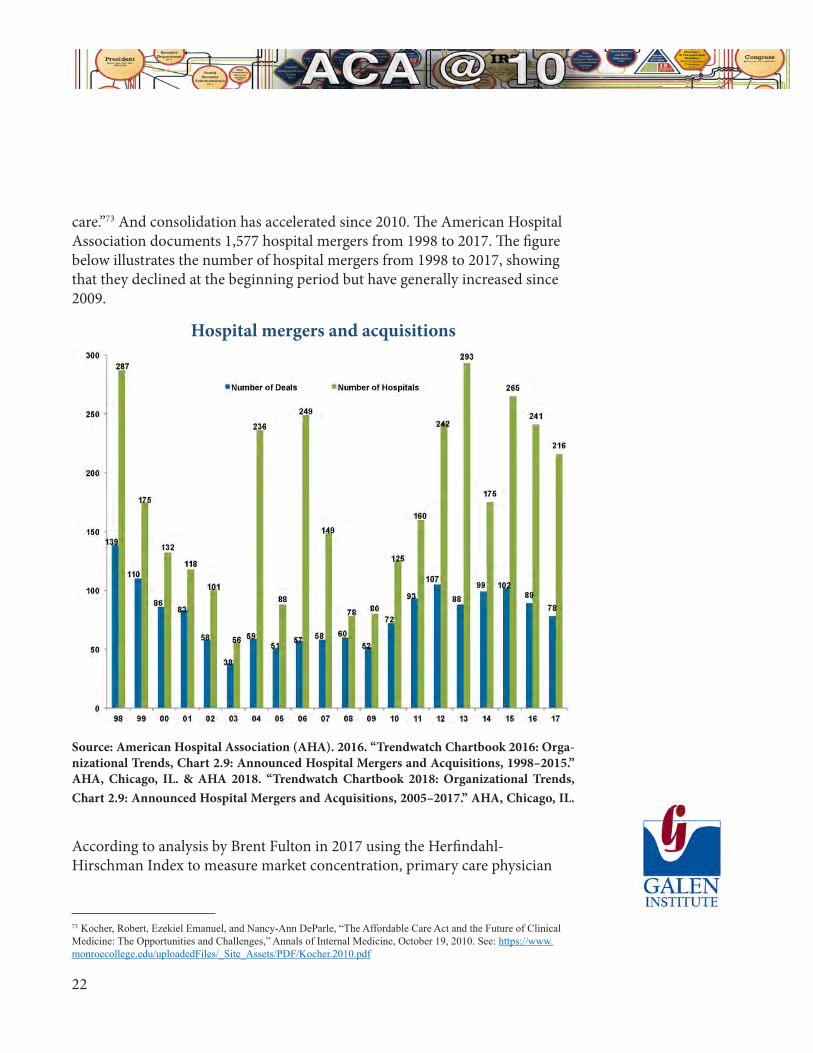
care.”73 And consolidation has accelerated since 2010. The American Hospital Association documents 1,577 hospital mergers from 1998 to 2017. The figure below illustrates the number of hospital mergers from 1998 to 2017, showing that they declined at the beginning period but have generally increased since 2009.
Hospital mergers and acquisitions
Source: American Hospital Association (AHA). 2016. “Trendwatch Chartbook 2016: Orga-nizational Trends, Chart 2.9: Announced Hospital Mergers and Acquisitions, 1998–2015.” AHA, Chicago, IL. & AHA 2018. “Trendwatch Chartbook 2018: Organizational Trends, Chart 2.9: Announced Hospital Mergers and Acquisitions, 2005–2017.” AHA, Chicago, IL.
According to analysis by Brent Fulton in 2017 using the Herfindahl-Hirschman Index to measure market concentration, primary care physician
73 Kocher, Robert, Ezekiel Emanuel, and Nancy-Ann DeParle, “The Affordable Care Act and the Future of Clinical Medicine: The Opportunities and Challenges,” Annals of Internal Medicine, October 19, 2010. See: https://www.monroecollege.edu/uploadedFiles/_Site_Assets/PDF/Kocher.2010.pdf

23
concentration increased by 28.8 percent, specialist physician concentration increased by 5.2 percent, and hospital concentration increased by 5.2 percent between 2010 and 2016.74 In 2016, Dr. Jeffrey Singer wrote critically of the ACA’s role in increasing health market consolidation:
Physicians have merged into mega-group practices in an effort to control costs and enhance leverage in health care contract-ing. Hospitals have acquired private medical practices, with only 1 in 3 doctors projected to remain independent by the end of this year. Meanwhile, hospitals are consolidating into major hospital systems, many of them connected with so-called ac-countable care organizations established under Obamacare.75
Singer blames the growing consolidation on the ACA, writing that “[i]t’s driv-en not by market forces but by government regulation, red tape and mandates that make it harder for companies to survive on their own or for new entrants to challenge the status quo. In the face of this onslaught, the various compo-nents of the health care industry are consolidating, even though they have no consumer-focused reason to do so.”76
Positive Actions of the Trump AdministrationThere has been widespread but unfounded criticism of the Trump administra-tion for “undermining” or “sabotaging” the ACA. In fact, the Trump admin-istration has modified rules to make ACA exchanges function better and to stabilize premiums, with demonstrated success. President Trump also signed an executive order on October 12, 2017, to direct federal departments to use rulemaking authority to give people choices of more affordable coverage. The order was aimed at pursuing administrative policies to help the two groups of individuals most harmed by the ACA and by the Obama administration’s
74 Fulton, Brent D., 2017. “Health Care Market Concentration Trends in the United States: Evidence and Policy Responses.” Health Affairs. 2017;36(9):1530–1538.
75 Singer, Jeffrey, “Obamacare’s Catch 22,” US News, August 11, 2016. See: https://www.usnews.com/opinion/ar-ticles/2016-08-11/obamacare-gave-rise-to-the-health-care-mergers-its-advocates-oppose
76 Ibid.

24
implementation of the ACA.77 The first group was middle-income individuals without an offer of employer insurance who were priced out of the individual market as a result of the ACA. The second group was small employees and businesses who increasingly stopped offering coverage after 2010. Between 2010 and 2018, the percentage of businesses with fewer than 50 workers that offered health coverage declined by one-quarter.78 (Another enormous failure of the ACA not discussed in this paper was the small business health insurance exchanges.)79 The president’s executive order, Promoting Health Care Choice and Competition Across the United States, directed the executive branch to expand the ways employers can provide health insurance to their workers and the ways that consumers can access more affordable care. In June 2018, the Department of Labor finalized a rule offering employers another way to join together and provide health coverage to their employees through an association health plan (AHP).80 The new AHP pathway allowed any businesses, including sole proprietors, within a state or common metropol-itan area to join together to take advantage of the economies of scale and regu-latory advantages that larger insured groups enjoy. Unfortunately, in March 2019, a federal district court judge largely struck down the new pathway as an invalid interpretation of ERISA.81 The Trump administration has appealed, and
77 Presidential Executive Order Promoting Healthcare Choice and Competition Across the United States, The White House, Oct. 12, 2017. https://www.whitehouse.gov/presidential-actions/presidential-executive-order-promoting-healthcare-choice-competition-across-united-states/
78 Figure 3.9. The percentage of workers at firms with 3 to 24 workers covered by their firm’s health benefits declined from 44 percent to 30 percent between 2010 and 2018. The percentage of workers at firms with 24 to 49 workers covered by their firm’s health benefits declined from 59 percent to 44 percent between 2010 and 2018. See: https://www.kff.org/report-section/2018-employer-health-benefits-survey-section-3-employee-coverage-eligibility-and-participation/
79 Managan, Dan, “Trump administration seeks to end Obamacare enrollment for small businesses on HealthCare.gov in 2018,” CNBC, May 15, 2017. See https://www.cnbc.com/2017/05/15/obamacare-enrollment-for-small-business-on-healthcare-gov-could-end.html
80 Definition of “Employer” Under Section 3(5) of ERISA-Association Health Plans, A Rule by the Employee Bene-fits Security Administration, June 21, 2018. See: https://www.federalregister.gov/documents/2018/06/21/2018-12992/definition-of-employer-undersection-35-of-erisa-association-health-plans
81 In July 2018, a coalition of 12 Democratic attorneys general filed a lawsuit challenging the final AHP rule for vio-lating the Administrative Procedures Act. The attorneys general argued that the DOL’s interpretation of “employer” was inconsistent with ERISA and the rule was intended to undermine the ACA. On March 28, 2019, Judge John D. Bates of the District of Columbia found that the AHP rule was “clearly an end-run around the ACA” and struck down most of the rule. Judge Bates found that allowing any employers within a state or common metro area to join together did not meaningfully limit the types of associations that could qualify to sponsor an ERISA plan and that the working owner provision is inconsistent with ERISA, which is to regulate benefit plans that derive from employment relation-ships.

25
a hearing was held in November 2019, with a decision pending. In August 2018, the Departments of Labor, HHS, and the Treasury finalized a rule that reversed their October 2016 rule which severely restricted short-term limited-duration insurance (short-term plans).82 Short-term plans existed for decades with federal regulations permitting coverage to last up to 364 days. Since these plans are outside the ACA’s regulatory scheme, they allowed people to purchase coverage with more flexible benefit structures and at a much more affordable price. In October 2016, the Obama administration severely restricted these plans out of concern that people preferred them to exchange coverage.83 Specifically, the Obama administration capped the period for which people could buy these plans at 90 days and banned renewals. These actions reduced affordable options available to people, caused insurers to leave the market, and harmed people who got sick during their short coverage period and were not able to obtain another policy. The Trump administration’s rule largely reverted the federal rules to those that existed for the two decades prior to the Obama administration’s restrictions—allowing plans to last up to 364 days—and it also permitted renewals for total coverage of up to three years. Both AHPs and short-term plans are subject to state regulation. An initial legal challenge to the short-term plan rule failed.84 In early 2019, the White House’s Council of Economic Advisers (CEA) esti-mated the economic benefit to Americans from the combination of the AHP and short-term plan rules as well as the elimination of the individual mandate penalty.85 According to CEA, “By freeing people to renew their plans for up to
82 Short-Term, Limited-Duration Insurance, A Rule by the Internal Revenue Service, the Employee Benefits Security Administration, and the Health and Human Services Department, Office of the Federal Register, August 3, 2018. See: https://www.federalregister.gov/documents/2018/08/03/2018-16568/short-term-limited-duration-insurance
83 Excepted Benefits; Lifetime and Annual Limits; and Short-Term, Limited-Duration Insurance, A Rule by the Internal Revenue Service, the Employee Benefits Security Administration, and the Health and Human Ser-vices Department, Office of the Federal Register, Oct. 31, 2016. See: https://www.federalregister.gov/docu-ments/2016/10/31/2016-26162/excepted-benefits-lifetime-and-annuallimits-and-short-term-limited-duration-insur-ance
84 On July 19, 2019, U.S. District Court Judge Richard Leon dismissed a lawsuit around the STLDI rule, writing, “Not only is any potential negative impact from the 2018 rule minimal, but its benefits are undeniable.” Judge Leon also pointed out that the ACA exempted some types of health insurance from its regulatory reach, writing, “lawmak-ers were not rigidly pursuing the ACA-compliant market at all costs, e.g. at the risk of individuals going without insurance.” Case 1:18-cv-02133-RJL, United States District Court for the District of Columbia, July 19, 2019. See: https://affordablecareactlitigation.files.wordpress.com/2019/07/stld-memorandum-opinion.pdf.
85 Council of Economic Advisors, “Deregulating Health Insurance Markets: Value to Market Participants,” The White
26
three years, the administration’s actions will reduce application costs, lower the risk of loss of coverage, and allow for more innovation in plan design.”86 Ac-cording to the analysis, Americans will reap nearly $500 billion of net eco-nomic benefit over the next decade from these three actions.87 This amount averages about $3,500 per household.88 The third and perhaps most profound regulatory effort involved the expansion of health reimbursement arrangements (HRAs). HRAs are a method that em-ployers can use to reimburse employee health expenses with tax-preferred dol-lars. In June 2019, the Departments of Labor, HHS, and the Treasury finalized a rule allowing employers to use HRAs to reimburse employees’ premiums for individual market coverage.89 In effect, this regulation equalizes the tax treatment of traditional ESI and individually-selected coverage in the individual market using employer con-tributions.90 A defined contribution structure for health insurance is similar to 401(k) plans and 403(b) plans for retirement savings where employers pro-vide a set amount of funds with workers having control over the investment. The new Individual Coverage HRAs (ICHRAs) are expected to produce more engaged and cost-conscious consumers. All of this will increase competitive pressure on insurers to provide better options and will put downward pressure on health insurance costs.
House, February 2019. See: https://www.whitehouse.gov/wp-content/uploads/2019/02/Deregulating-Health-Insur-ance-Markets-FINAL.pdf
86 Ibid.
87 Ibid.
88 Blase, Brian, Casey Mulligan, and Tomas J. Philipson, “President Trump’s Health Care Actions Are Improv-ing the Lives of Americans,” Real Clear Policy, February 13, 2019. See: https://www.realclearpolicy.com/arti-cles/2019/02/13/president_trumps_health_care_actions_are_improving_the_lives_of_americans.html
89 Health Reimbursement Arrangements and Other Account-Based Group Health Plans, A Rule by the Internal Rev-enue Service, the Employee Benefits Security Administration, and the Health and Human Services Department, Of-fice of the Federal Register, June 20, 2019. See: https://www.federalregister.gov/documents/2019/06/20/2019-12571/health-reimbursement-arrangements-and-other-accountbased-group-health-plans
90 The employer contributions provided to the ICHRA are tax-advantaged (i.e., not subject to federal income and payroll taxes). The employee can use the ICHRA to reimburse the purchase of individual market insurance or, for en-rollees aged 65 and older, Medicare. Employee premiums for traditional ESI are also tax-advantaged. Employers may offer employees a Section 125 Cafeteria plan to allow the employee share of individual market coverage purchased through an ICHRA to also be tax advantaged.

27
The administration projects that it will take about five years for the ICHRA to reach an equilibrium point. At that time, the administration estimates that 800,000 employers—nearly 90 percent of them with fewer than 20 workers—will offer ICHRAs, and more than 11 million people will be enrolled in the individual market using an ICHRA.91 The rule is projected to increase indi-vidual market enrollment by more than 50 percent and reduce the number of uninsured by nearly one million.92 While the HRA rule should improve the individual market with an influx of employer contributions, the administration has taken other actions to help sta-bilize the individual market. This includes an April 2017 market stabilization rule that tightened peoples’ ability to use special enrollment periods—limiting the ability of people to delay purchasing coverage until they needed it. Most notably, the Trump administration approved seven State Innovation waivers under Section 1332 of the ACA for state-based risk mitigation programs in 2017 and 2018 with several more states receiving approval for such waivers in 2019. Under a typical waiver, the state sets up a fund to subsidize insurers for a certain amount of the expense of people who experience high cost claims. The state contributes about 40 percent of the total funding with the federal government contributing about 60 percent of total funding with savings from lower ACA premium subsidies. By repurposing this federal money to those in greatest medical need, the waiver programs help to reduce ACA plan premi-ums. The seven states with waivers in 2017 and 2018 had an average premium decline of nearly eight percent relative to an increase in non-waiver states of three percent.93
91 Of the 11 million employees and dependents, the administration projects that about 7 million will transition from traditional ESI, about 3 million will move from an individual market plan without an HRA to the ICHRA with indi-vidual market coverage, and about one million will gain coverage who would otherwise be uninsured.
92 HHS Press Office, “U.S. Departments of Health and Human Services, Labor, and the Treasury Expand Access to Quality, Affordable Health Coverage Through Health Reimbursement Arrangements,” June 13, 2019. See: https://www.hhs.gov/about/news/2019/06/13/hhs-labor-treasuryexpand-access-quality-affordable-health-coverage.html
93 Badger, Doug, “How Health Care Premiums Are Declining in States That Seek Relief from Obamacare’s Man-dates,” The Heritage Foundation, August 13, 2019. See: https://www.heritage.org/health-care-reform/report/how-health-care-premiums-are-declining-states-seek-relief-obamacares
28
A Better Way to Address Pre-Existing Conditions In addition to reducing affordable coverage options for middle-income indi-viduals and small businesses and their workers, the ACA disrupted coverage for people with significant medical issues. Many lost coverage and along with the lost coverage they lost access to their doctors as Politifact named President Obama’s purported promise “If you like your health care plan, you can keep it” as the Lie of the Year in 2013.94 The ACA also led to a “race to the bottom” in coverage, as insurers increasingly designed products to deter the sick from enrolling—products with extremely narrow networks and high cost-sharing, including high cost-sharing for drugs typically needed by people with ex-pensive medical conditions. In Texas, for example, Houston’s MD Anderson Cancer Center, which was named America’s best cancer-care hospital by U.S. News & World Report in 13 of the past 16 years, is not covered by individual market plans.95 HealthPocket found extremely high cost-sharing for expensive specialty drugs in ACA plans in 2017.96 Patients with a bronze plan who were prescribed Copaxone (for multiple sclerosis), the Humira Pen (an immuno-suppressive drug for arthritis, Crohn’s disease, and ulcerative colitis) or Enbrel (rheumatoid arthritis) had to pay about $2,000 a month.97 The drug Tecfidera, used to treat psoriasis and multiple sclerosis, required cost-sharing of nearly $3,000.98 The ACA replaced the state high risk pools that nearly two-thirds of states had developed to provide subsidized coverage for people with expensive medical conditions. State high risk pools represented a commonsense policy to subsi-dize high-cost individuals in a way that did not harm the individual market, that spread the cost across the general tax base, and that avoided creating incentives for people to wait until they needed care to purchase coverage. The
94 Holan, Angie D., “Lie of the Year: ‘If you like your health plan, you can keep it,” Politifact, December 12, 2013. See: https://www.politifact.com/article/2013/dec/12/lie-year-if-you-like-your-health-care-plan-keep-it/
95 Goodman, John and Devon Herrick, “How Obamacare Made Things Worse for Patients with Preexisting Condi-tions.”
96 Ibid.
97 Ibid.
98 Ibid.

29
premiums enrollees paid were typically 50 percent to 100 percent higher than the premium for comparable coverage in the individual market—coverage that included far more providers before the ACA. In fact, the main concern with pre-ACA high risk pools is that they were not adequately funded and, in some states, there were waiting lists. It turns out that roughly half of the ACA’s premium subsidy costs would generously fund state high risk pools for those who need care. Economists Mark Pauly and Len Nichols reviewed the pre-ACA individual market and found that less than one percent of the population was both unin-sured and uninsurable because of a pre-existing condition.99 Rather than the ACA’s approach, a more targeted approach would be to utilize general rev-enues to subsidize coverage for people who are not able to obtain affordable private coverage because of a medical condition. States should be able to move these individuals in a separate risk pool, with insurers and providers compet-ing to provide these individuals with superior care. The state approach with 1332 waivers to establish reinsurance programs is another alternative for ways to use taxpayer dollars to subsidize the cost of the most expensive enrollees while lowering premiums for everyone else.
Reform Still NeededThere are important goals for health reform:
• Everyone should be able to access the health care they need
• Coverage and care should be affordable, including for those with chronic medical conditions
• A variety of options should be available to account for the vastly different preferences of individuals and families
• People should be able to see the physicians and other providers of their choice
• Federal tax and spending policy should not advantage some types of cover-age over other types
99 Pauly, Mark V. and Len M. Nichols, “The Nongroup Health Insurance Market: Short On Facts, Long On Opinions and Policy Disputes.” Health Affairs. 2002; 21. doi: /full/10.1377/hlthaff.W2.325.

30
• Choice and competition should be maximized in order to foster innovation and drive price declines and quality improvements
• The most vulnerable must be protected.
It is clear that the ACA has failed to meet these goals, especially its explicit promises of making health insurance and health care more affordable. In the process of trying to re-engineer the health insurance market, the ACA has caused premiums and deductibles to soar, driving millions of people out of the market who previously had health insurance they liked and could afford. Fed-eral spending also has soared to finance new insurance subsidies and Medicaid expansion, often crowding out private coverage with new taxpayer-funded programs that provide few if any choices. There is no question that many millions of Americans are frustrated. Care costs too much, and many are simply priced out of the market for health insur-ance. Tens of millions remain uninsured, with their government taking away options from them. Those on public programs are often frustrated as well. Many Medicaid recipi-ents struggle to find physicians who take the program’s low payment rates and can find it especially difficult to get appointments with specialists for more serious health problems. And with a much larger reimbursement for the ex-pansion population relative to the traditional Medicaid population, the federal government is providing states with incentives to offer more services to the able-bodied, working-age adults at the expense of the more vulnerable. Quite simply, the $3.6 trillion health sector, in many cases because of excessive government rules but also because of pernicious crony capitalism forces, is fail-ing too many Americans. While the Trump administration has made significant improvements using existing regulatory authority to provide help, Congress needs to act to provide real relief.
31
A group of policy experts—the Health Policy Consensus Group100—has devel-oped a plan101 to help the millions of people who are struggling to afford health insurance, particularly in the small group and individual markets, while better protecting the poor and the sick, including those with pre-existing conditions. The Health Care Choices plan would provide grants to the states, using exist-ing resources, but with guidelines that incentivize states to provide people with more affordable coverage and even to provide an option for some people on Medicaid and CHIP to obtain private coverage, if that is their choice. Unlike the ACA, the Health Care Choices plan has money dedicated to creat-ing guaranteed protection programs. Rather than forcing all those partici-pating in the ACA insurance pools to pay extra to support people with high medical expenses, it would stipulate that dedicated resources be devoted to providing extra financial support for their care. An analysis by the Center for Health and Economy has shown the Health Care Choices Plan would reduce average premiums for individual health insurance coverage by one third while keeping coverage numbers at least level.102 By en-couraging healthy people to remain covered, insurance pools are healthier, and resources can be directed to help those with greater health needs. The ACA’s one-size-fits-all approach with its complicated tax, regulatory, and subsidy mix failed to achieve its intended goals. It has left a dysfunctional individual market in many states and its legacy is the expansion of the Med-icaid welfare program. It is time for a new approach, focused on expanding consumer choice, increasing price transparency, and promoting competition among providers—the necessary precursors for innovation to flourish to bring patients better quality health care at lower prices.
100 The Health Policy Consensus Group is comprised of state health policy experts, national think tank leaders, and members and leaders of grassroots organizations across the country. Participants are committed to market-based policy recommendations that give people access to the health plans and doctors they choose at a price they can afford so that they can get the care they need, with strong protections for the most vulnerable.
101 Health Policy Consensus Group, “Health Care Choices 2020.” See: www.healthcarechoices2020.org. Accessed March 16, 2020.
102 Center for Health and Economy, “The Health Care Choices Proposal.” See: http://healthandeconomy.org/the-health-care-choices-proposal/. Accessed March 16, 2020.

P.O. Box 130
Paeonian Springs, VA 20129
www.galen.org
(703) 687-4665
https://galen.org/assets/ACA_at_10_huge_expansion_of_welfare.pdf