
AFFILIATIONS ABSTRACT Introduction
29
1 TITLE The relationship between linguistic expression and symptoms of depression, anxiety, and suicidal thoughts: A longitudinal study of blog content AUTHORS O’Dea B. 1 , Boonstra T.W. 1 , Larsen M.E. 1 ., Nguyen T. 2 , Venkatesh S. 2 , Christensen H. 1 AFFILIATIONS 1 Black Dog Institute, Faculty of Medicine, University of New South Wales, NSW, Australia 2 Centre for Pattern Recognition and Data Analytics, Deakin University, Victoria, Australia ABSTRACT Introduction: Due to its popularity and availability, social media data may present a new way to identify individuals who are experiencing mental illness. By analysing individuals’ blog content, this study aimed to investigate the associations between linguistic features and symptoms of depression, generalised anxiety, and suicidal ideation. Methods: This study utilised a longitudinal study design. Individuals who blogged were invited to participate in a study in which they completed fortnightly mental health questionnaires (PHQ-9, GAD-7) for a period of 36 weeks. Linguistic features were extracted from blog data using the LIWC tool. Bivariate and multivariate analyses were performed to investigate the correlations between the linguistic features and mental health scores between subjects. We then used the multivariate regression model to predict longitudinal changes in mood within subjects. Results: A total of 153 participants consented to taking part, with 38 participants completing the required number of questionnaires and blog posts during the study period. Between-subject
Transcript of AFFILIATIONS ABSTRACT Introduction
1
TITLE
The relationship between linguistic expression and symptoms of depression, anxiety, and
suicidal thoughts: A longitudinal study of blog content
AUTHORS
O’Dea B. 1, Boonstra T.W. 1, Larsen M.E.1., Nguyen T. 2, Venkatesh S. 2, Christensen H. 1
AFFILIATIONS
1Black Dog Institute, Faculty of Medicine, University of New South Wales, NSW, Australia
2Centre for Pattern Recognition and Data Analytics, Deakin University, Victoria, Australia
ABSTRACT
Introduction: Due to its popularity and availability, social media data may present a new way
to identify individuals who are experiencing mental illness. By analysing individuals’ blog
content, this study aimed to investigate the associations between linguistic features and
symptoms of depression, generalised anxiety, and suicidal ideation.
Methods: This study utilised a longitudinal study design. Individuals who blogged were
invited to participate in a study in which they completed fortnightly mental health
questionnaires (PHQ-9, GAD-7) for a period of 36 weeks. Linguistic features were extracted
from blog data using the LIWC tool. Bivariate and multivariate analyses were performed to
investigate the correlations between the linguistic features and mental health scores between
subjects. We then used the multivariate regression model to predict longitudinal changes in
mood within subjects.
Results: A total of 153 participants consented to taking part, with 38 participants completing
the required number of questionnaires and blog posts during the study period. Between-subject
2
analysis revealed that several linguistic features, including tentativeness and non-fluencies,
were significantly associated with depression and anxiety symptoms, but not suicidal thoughts.
Within-subject analysis showed no robust correlations between linguistic features and changes
in mental health score.
Discussion: This study provides further support for the relationship between linguistic features
within social media data and individuals’ symptoms of depression and anxiety. The lack of
robust within-subject correlations indicate that the relationship observed at the group level may
not generalise to individual changes over time.
Keywords:
Depression; mental health; linguistic; blog; social media
3
INTRODUCTION
Worldwide, mental illness is a leading cause of disability and represents a major health and
economic burden (1). This is due in part to the detrimental effects of mental illness on
functioning, but also the low levels of mental health literacy among individuals, their inability
to recognise symptoms, poor help-seeking attitudes, and lack of access to care (2-4). A fatal
and tragic outcome of poor mental health is suicide, a primary cause of death for both young
(5) and middle-aged people in many developed countries. There is a need to look to new ways
of detecting mental illness in the population, particularly in the prodromal phase, to increase
treatment outcomes, reduce severity, and prevent death (6). Social media has emerged as a
potential means for doing this (7).
Defined as any internet-enabled platform that allows individuals to connect, communicate, and
share content with others, social media includes social networking sites (e.g. Facebook),
microblogs (e.g. Twitter), blogsites (e.g. WordPress, LiveJournal), and communities (e.g.
Reddit) (8). There has been significant enthusiasm in the potential of these platforms to
generate markers of poor mental health as they are used by millions of people worldwide, data
is produced in natural settings and is readily available and free. It has been hypothesised that
the language and expressive features within individuals’ shared content may indicate their
mental state (9). This is based on psycho-linguistic theory which postulates that the words and
features used in everyday language can reveal individuals’ thoughts, emotions, and motivations
(10-12). Several promising findings have emerged.
On Twitter, De Choudhury et al (13) was able to discriminate current depression among users
by their increased use of first-person pronouns and fewer references to third persons. Statistical
modelling was most accurate when only linguistic features were used. Using cross-validation

4
methods, Reece et al (14) found that depression among Twitter users was predicted by
differences in word count, references to ingestion, sadness, swear words, article words, and
positive emotion. Among a sample of Japanese Twitter uses, Tsugawa et al (15) found
depressed users had significantly higher ratios of negative emotion words. When examining
Twitter posts that included depression terms, Wilson et al (16) found these to be characterised
by higher character counts, fewer pronouns, less positive emotion, greater negative emotion,
greater expressions of sadness, fewer references to time and fewer references to past and
present tense. When comparing posts made in online depression forums with those in breast
cancer forums, Ramirez-Esparza et al (17) found the depression posts were characterised by
greater first-person referencing, less positive emotion, and greater negative emotion when
compared to tweets related to breast cancer. On Facebook, Seabrook et al (18) found depression
was characterised by differences in the proportion of negative emotions whereas on Twitter,
depression was associated with less dispersion of negative emotion across posts. Also on
Facebook, Eichstaedt et al (19) found depression to be marked by the linguistic features of
increased first-person pronoun use, greater negative emotion, increased perceptual processes
for feeling (e.g. feels, touch), greater references to sadness (e.g. crying, grief), and greater
discrepancies (e.g. should, would, could). Our team (20) discriminated higher risk in suicide-
related Twitter posts by greater self-references, anger, and a focus on the present (9).
Importantly, the findings are consistent with a recent meta-analysis which firmly established
first person singular pronoun use as a linguistic marker of depression (21). Together, these
studies provide strong support for the potential of analysing social media content for the
automatic detection of mental health problems.
However, if we wish to use social media to screen and monitor the mental health of individuals,
the field must first overcome major methodological challenges. Firstly, not all prior studies

5
have correlated the various linguistic features against a validated psychometric measure of
mental health. A review of recent papers (22) found that of the 12 included studies, only five
used mental health questionnaires (13-15, 23, 24). The remaining relied on self-declared
diagnoses (e.g. affirmative statements of mental health diagnoses in social media posts),
membership association (e.g. belonging to a certain online community or forum), or annotation
of content (e.g. presence of key words or phrases). As such, it is not clear whether all past
findings are consistent with diagnostic criteria. Secondly, most of the studies in this area have
focussed only on depression. Although this is warranted, due to the prevalence, little attention
has been paid to other mental health symptoms such as anxiety, which is highly correlated with
depression (25). Detecting symptoms of anxiety may be an effective way to identify those who
have depression or who are at risk of developing it (26). Thirdly, current knowledge is mostly
based on cross-sectional studies, with temporal patterns in depressive symptomatology and
suicidal thinking unaccounted for (27). Cross-sectional studies identify markers at the group
level and hence these markers may not apply to changes within individuals (28-30). Indeed,
the field of personalised medicine argues that individuals may have unique markers of mental
ill-health (31). It is unclear whether the markers derived from social media data can be used to
infer data about the mental health state of individual users.
The current study aims to overcome some of the above limitations by collecting validated
mental health data in a longitudinal study of individuals who blog. Using the text content
extracted from their blogsite, alongside fortnightly mental health assessments using standard
validated questionnaires, this study examines the relationship between different linguistic
features and symptoms of depression, anxiety, and suicidal ideation. As found in past studies,
it is hypothesised that higher mental health scores will be associated with increased references
to oneself, increased expressions of negative emotion, and reduced references to third-persons
6
at group level. This study will also test whether the group-level correlations can be used to
make predictions about intra-individual changes in mental health scores over time. It is hoped
that these outcomes will help us to establish prediction models which can be used to monitor
blog sites automatically, and in real time, for mental health risk.
METHOD
Study design. A 36-week longitudinal cohort study approved by UNSW Human Research
Ethics Committee (#14086). Recruitment took place between July 2014 and October 2016.
Using a series of online adverts published on various social media channels, individuals who
blogged were invited to visit the study website where they were provided with participant
information and consent details. There were no exclusion criteria, although participants had to
provide the URL of their blog site and self-identify as a mental health blogger. Once consent
was given, participants were asked to complete an online self-report mental health assessment
at baseline, and then every fortnight via email for a period of 36 weeks (total of 18
assessments). Support contacts were provided to the entire sample and there were no
restrictions on help-seeking behaviour throughout the study. Each participant received
$20AUD in Amazon Webstore credit for their participation.
Measures. Demographics were assessed using questions on age, gender, prior diagnosis of
depression or anxiety from a medical practitioner, and medication use for depression and
anxiety. Overall health rating: Participants were asked to rate their health as very bad, bad,
moderate, good, very good. Depressive symptoms were assessed using the self-report Patient
Health Questionnaire (PHQ-9) (32). This nine-item questionnaire assessed the presence of
depressive symptoms in the past two weeks. Individuals were asked to rate the frequency of
depressive symptoms using a four-point Likert scale ranging from “none of the time” to “every

7
day or almost every day”. A total score is then calculated which can be classified as “nil-
minimal” (0-4), “mild” (5-9), “moderate” (10-14), “moderately severe” (15-19) or “severe”
(20+). Anxiety symptoms were assessed using the self-report Generalised Anxiety Disorder
Scale (GAD-7) (33). This seven-item questionnaire assessed the presence of generalised
anxiety symptoms in the past two weeks. It uses the same response scale as the PHQ-9 and
participants’ total scores can also be classified into the same severity categories. Participants
were also asked if they had had a panic attack in the past two weeks, and if so, how many.
Suicidal thoughts scores were based on participants’ responses to item 9 of the PHQ-9 (ranges
from 0 to 3). Participants who reported that they experienced “thoughts that they would be
better off dead, of harming themselves” for more than several days (score > 0) were deemed to
have suicidal thoughts.
Social media data extraction and analysis. Social media data was extracted every fortnight
using the publicly accessible Application Programming Interface (APIs) for each platform,
including Tumblr, Live Journal, WordPress and BlogSpot. Social media data was analysed
using the Linguistic Inquiry and Word Count (LIWC) tool for linguistic features. This software
analyses text and calculates the percentage of words that reflect different emotions, thinking
styles, social concerns, and parts of speech (34), resulting in a set of 68 linguistic features for
each blog post.
Data analysis. We first performed bivariate analyses to investigate the correlation between the
linguistic features and mental health scores between individuals. To this end, we averaged
linguistic features and mental health scores across repeated assessments for each participant.
We first performed bivariate analysis between the 68 linguistic features and the 3 mental health
scores using Spearman’s rank-order correlation. Hence, a total of 68 3 = 204 comparisons
8
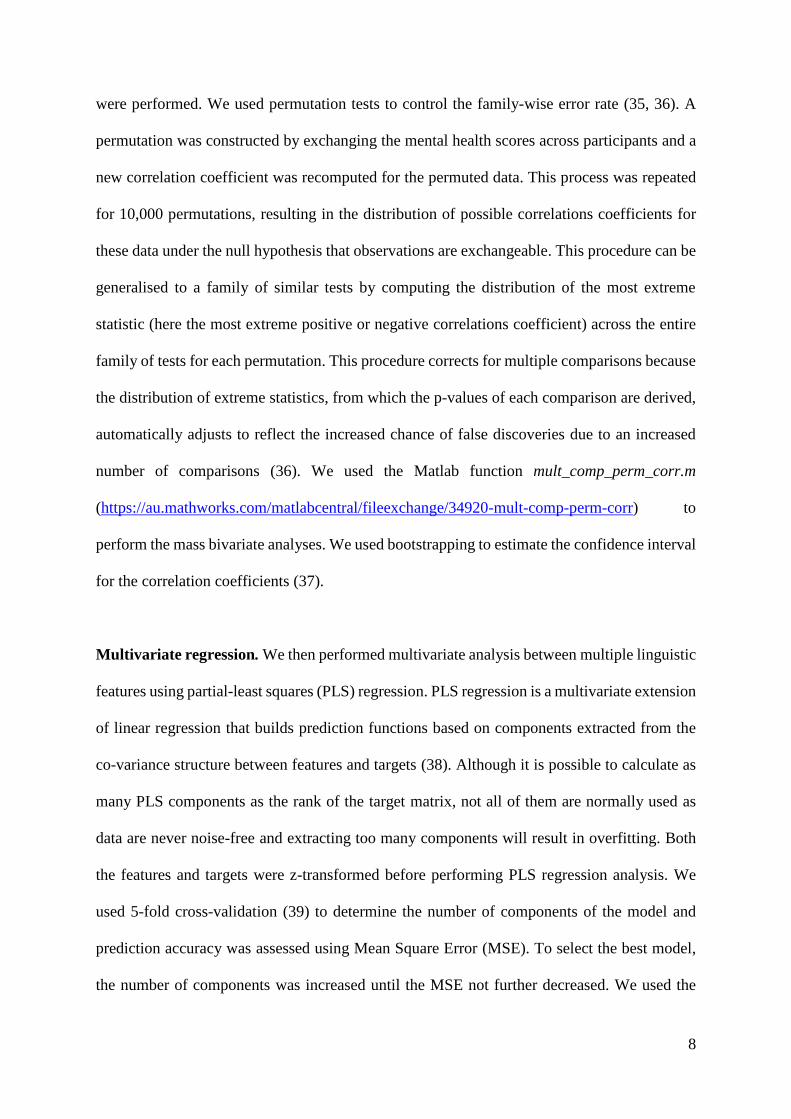
were performed. We used permutation tests to control the family-wise error rate (35, 36). A
permutation was constructed by exchanging the mental health scores across participants and a
new correlation coefficient was recomputed for the permuted data. This process was repeated
for 10,000 permutations, resulting in the distribution of possible correlations coefficients for
these data under the null hypothesis that observations are exchangeable. This procedure can be
generalised to a family of similar tests by computing the distribution of the most extreme
statistic (here the most extreme positive or negative correlations coefficient) across the entire
family of tests for each permutation. This procedure corrects for multiple comparisons because
the distribution of extreme statistics, from which the p-values of each comparison are derived,
automatically adjusts to reflect the increased chance of false discoveries due to an increased
number of comparisons (36). We used the Matlab function mult_comp_perm_corr.m
(https://au.mathworks.com/matlabcentral/fileexchange/34920-mult-comp-perm-corr) to
perform the mass bivariate analyses. We used bootstrapping to estimate the confidence interval
for the correlation coefficients (37).
Multivariate regression. We then performed multivariate analysis between multiple linguistic
features using partial-least squares (PLS) regression. PLS regression is a multivariate extension
of linear regression that builds prediction functions based on components extracted from the
co-variance structure between features and targets (38). Although it is possible to calculate as
many PLS components as the rank of the target matrix, not all of them are normally used as
data are never noise-free and extracting too many components will result in overfitting. Both
the features and targets were z-transformed before performing PLS regression analysis. We
used 5-fold cross-validation (39) to determine the number of components of the model and
prediction accuracy was assessed using Mean Square Error (MSE). To select the best model,
the number of components was increased until the MSE not further decreased. We used the

9
build-in Matlab function plsregress.m from the Statistics and Machine Learning Toolbox
(R2018a) to perform PLS regression. We performed PLS regression both on the full and a
restricted feature set. To obtain a restricted feature set, we used bootstrapping: The z-scores of
the feature loadings were estimated across 10,000 bootstrap samples and the four features with
the largest z-score were selected. The PLS regression procedure was then repeated using only
these four features.
Within-subject prediction. The previous analyses constructed regression models that
predicted the mental health scores of participants that were not included in the training set.
These group-level inferences do not necessarily generalise to intra-individual changes in
mental health scores over time (28). We therefore tested the PLS regression model constructed
on group-level data on repeated measures of single participants using a two-staged approach.
We first used the group-level model to predict the mental scores at each time point at which
linguistic features were extracted and mental health were assessed and correlated the predicted
and observed mental health scores across time points for each participant. We then compared
the correlation coefficients estimated for each participant at the group level. To do this, we
converted the correlation coefficients using Fisher's z transformation and compared the z-
scores against zero using a one-sample t-test.
Availability of data and code. The data used in this study is available at Zenodo:
https://doi.org/10.5281/zenodo.1476493. The data includes the linguistic features extracted
from the blog post and the mental health scores of each assessment. The Matlab scripts used to
perform the bivariate and multivariate analyses are available at Zenodo:
https://doi.org/10.5281/zenodo.1476505.

10
RESULTS
Participants
A total of 153 individuals consented to the study and completed the baseline assessment (88%
female, mean age: 29.5 years, SD: 10.3, age range: 18-67). The mean number of completed
assessments was 5.1 (SD: 4.4). See the Supplementary Material for more information about
these participants. The final sample consisted of the 38 participants who completed one or more
mental health assessments and who also blogged at least once during the study period. The
total number of blog posts collected from the final sample was 655. Table 1 outlines participant
characteristics at baseline.
Table 1. Participant characteristics at baseline (N=38)
M (SD) Range
Age 27.1 (7.2) 18-59
PHQ-9 score 14.5 (5.6) 3-27
GAD-7 score 11.6 (5.0) 0-20
Suicide/Self-harm score 1.07 (1.1) 0-3
Panic attacks 7.0 (11.1) 0-60
Number of blog posts 17.2 (26.7) 1-128
N %
Female 32 84
Self-rated health
Very bad 0 0
Bad 11 29
Moderate 15 39
Good 12 32
Very good 0 0
Prior diagnosis by medical practitioner 36 95
Currently taking medication 26 68
Current suicidal thoughts 25 66
Panic attack in 2 weeks prior 22 58
Depression
Nil-minimal 2 5
Mild 6 16
Moderate 10 26
Moderately-severe 11 29
Severe 9 24
Anxiety
Nil-minimal 3 8
Mild 9 24
11
Moderate 15 39
Moderately-severe 9 24
Severe 2 5
Blog site used
LiveJournal 30 79
Tumblr 8 21
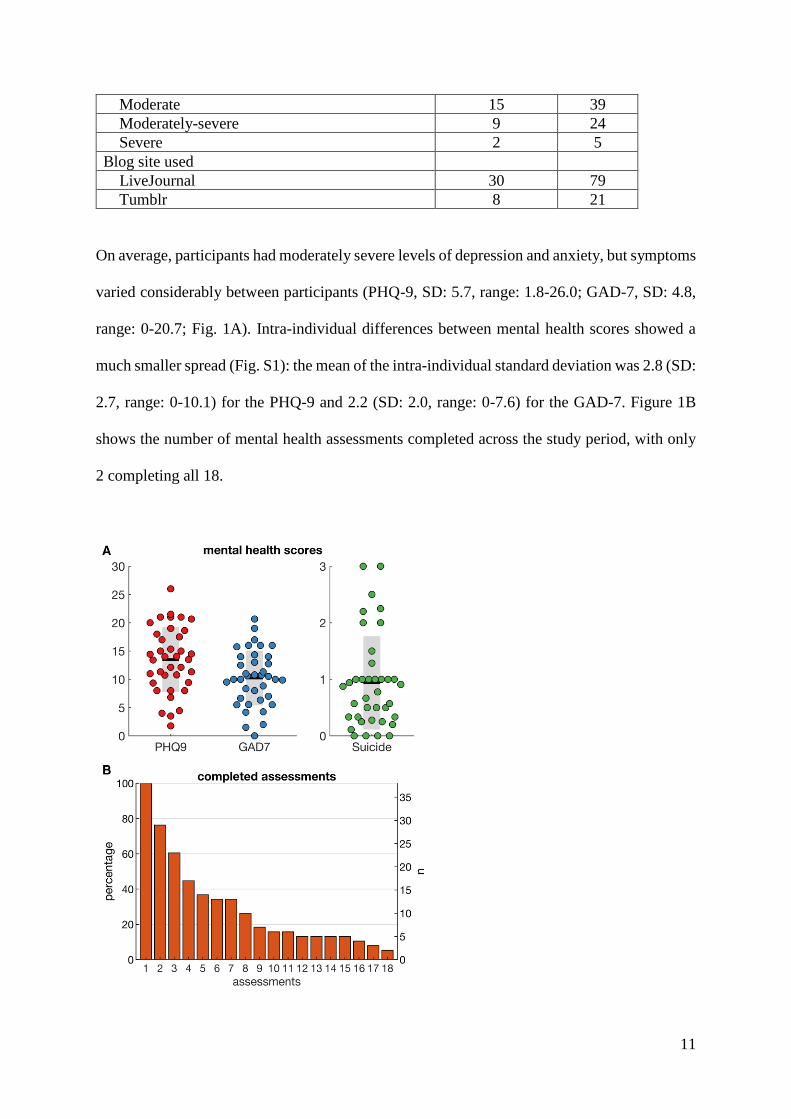
On average, participants had moderately severe levels of depression and anxiety, but symptoms
varied considerably between participants (PHQ-9, SD: 5.7, range: 1.8-26.0; GAD-7, SD: 4.8,
range: 0-20.7; Fig. 1A). Intra-individual differences between mental health scores showed a
much smaller spread (Fig. S1): the mean of the intra-individual standard deviation was 2.8 (SD:
2.7, range: 0-10.1) for the PHQ-9 and 2.2 (SD: 2.0, range: 0-7.6) for the GAD-7. Figure 1B
shows the number of mental health assessments completed across the study period, with only
2 completing all 18.
12
Figure 1. Characteristics of sample A) Mental health scores (PHQ-9, GAD-7 and suicidal ideation)
averaged across assessments. Coloured dots show values of individual participants, the horizontal black
line the group mean and the grey bars the SD. B) Number of mental health assessments completed by
participants.
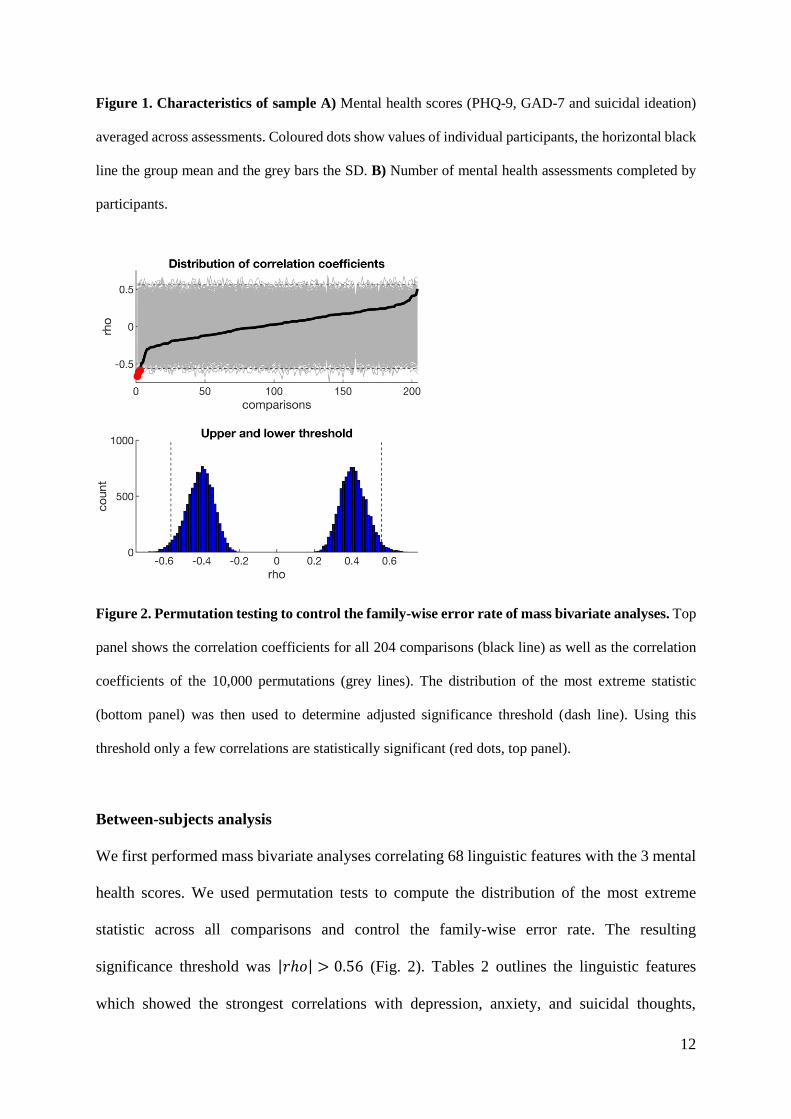
Figure 2. Permutation testing to control the family-wise error rate of mass bivariate analyses. Top
panel shows the correlation coefficients for all 204 comparisons (black line) as well as the correlation
coefficients of the 10,000 permutations (grey lines). The distribution of the most extreme statistic
(bottom panel) was then used to determine adjusted significance threshold (dash line). Using this
threshold only a few correlations are statistically significant (red dots, top panel).
Between-subjects analysis
We first performed mass bivariate analyses correlating 68 linguistic features with the 3 mental
health scores. We used permutation tests to compute the distribution of the most extreme
statistic across all comparisons and control the family-wise error rate. The resulting
significance threshold was |𝑟ℎ𝑜| > 0.56 (Fig. 2). Tables 2 outlines the linguistic features
which showed the strongest correlations with depression, anxiety, and suicidal thoughts,

13
respectively. After controlling for multiple comparisons, only non-fluencies was significantly
correlated with depression (rho = -0.61, 95%CI: -0.77, -0.39, Pcorr = 0.012), and non-fluencies
and tentativeness with anxiety (rho = -0.58, 95%CI: -0.75, -0.31, Pcorr = 0.028 and rho = -0.67,
95%CI: -0.79, -0.47, Pcorr = 0.002, respectively).
Table 2. Between-subject analysis
target feature example rho 95% CI Puncorr Pcorr
depression present focus is, does, here 0.42 0.14, 0.62 0.008 0.84
sadness crying, grief, sad 0.41 0.12, 0.63 0.010 0.93
certainty always, never 0.39 0.08, 0.63 0.016 1
3rd person plural they, their, they’d -0.34 -0.59, -0.04 0.034 1
tentative maybe, perhaps, -0.49 -0.66, -0.23 0.002 0.28
non-fluencies er, hm, umm -0.61 -0.77, -0.39 0.000 0.012
anxiety present focus is, does, here 0.50 0.21, 0.71 0.001 0.21
1st person singular I, me, mine 0.35 0.06, 0.60 0.031 1
total pronouns I, them, itself 0.30 0, 0.56 0.068 1
future focus will, gonna -0.41 -0.66, -0.08 0.011 0.96
tentative maybe, perhaps -0.58 -0.75, -0.31 0.000 0.028
non-fluencies er, hm, umm -0.67 -0.79, -0.47 0.000 0.002
suicidality ingesting dish, eat, pizza 0.43 0.13, 0.66 0.007 0.74
impersonal pronouns it, it’s, those 0.41 0.09, 0.69 0.010 0.94
certainty always, never 0.32 0, 0.58 0.047 1
relativity area, exist, stop -0.28 -0.53, 0.02 0.093 1
space down, in, thin -0.28 -0.54, 0.01 0.084 1
non-fluencies er, hm, umm -0.48 -0.69, -0.20 0.002 0.32
We then performed PLS regression to extract multiple linguistic features that predict mental
health scores. We first used all 68 linguistic features and used 5-fold cross-validation to
14
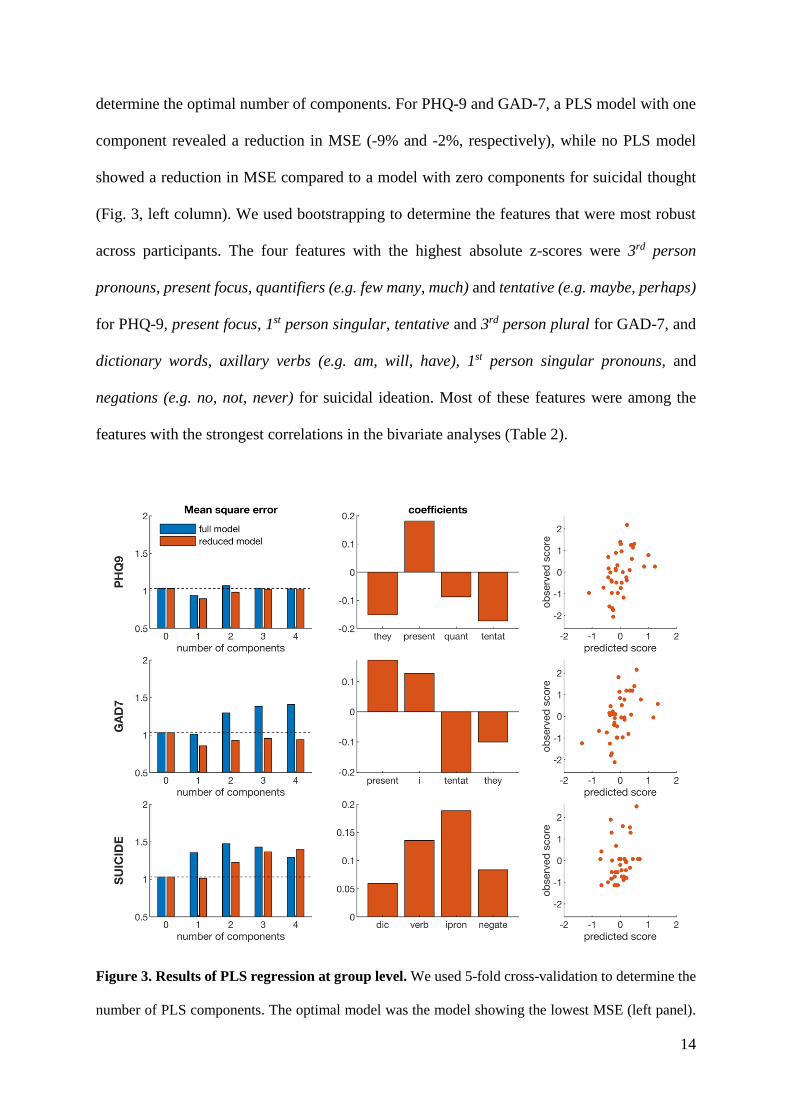
determine the optimal number of components. For PHQ-9 and GAD-7, a PLS model with one
component revealed a reduction in MSE (-9% and -2%, respectively), while no PLS model
showed a reduction in MSE compared to a model with zero components for suicidal thought
(Fig. 3, left column). We used bootstrapping to determine the features that were most robust
across participants. The four features with the highest absolute z-scores were 3rd person
pronouns, present focus, quantifiers (e.g. few many, much) and tentative (e.g. maybe, perhaps)
for PHQ-9, present focus, 1st person singular, tentative and 3rd person plural for GAD-7, and
dictionary words, axillary verbs (e.g. am, will, have), 1st person singular pronouns, and
negations (e.g. no, not, never) for suicidal ideation. Most of these features were among the
features with the strongest correlations in the bivariate analyses (Table 2).
Figure 3. Results of PLS regression at group level. We used 5-fold cross-validation to determine the
number of PLS components. The optimal model was the model showing the lowest MSE (left panel).

15
We tested both the full model using all 68 linguistic features and a reduced model using only the 4 most
robust features. The beta coefficients of the optimal model (middle column) were then used to estimate
the predicted mental health scores (right column). Note: they=3rd person plural, present=present focus,
quant=quantifiers, tentat=tentative, i=1st person pronouns, dic=dictionary words, verb=auxiallary verbs,
ipron= impersonal pronouns, and negate=negative emotion.
We then tested the reduced PLS models using only the four most robust features. The reduced
models showed a larger reduction in MSE during cross-validation than the full PLS model: -
13% for PHQ-9, -17% for GAD-7, and -1% for suicidal ideation (Fig. 3, left column). We used
the reduced PLS model with one component, as the MSE increased again when adding
additional components. Figure 3 shows the beta coefficients of the regression models (middle
column) and the predicted mental health scores (right column). The correlation between the
predicted and observed mental scores is r = 0.44 (95%CI: 0.14, 0.67, R2 = 0.20) for PHQ-9, r
= 0.49 (95%CI: 0.20, 0.70, R2 = 0.24) for GAD-7, and r = 0.36 (95%CI: 0.04, 0.61, R2 = 0.13)
for suicidal ideation. A PLS model combining the three targets revealed that the mental health
scores are correlated and can be predicted using the same linguistic features (Fig. S2), although
the reduction in RMS (-7%) is smaller than for the models predicting individual mental health
scores.
16
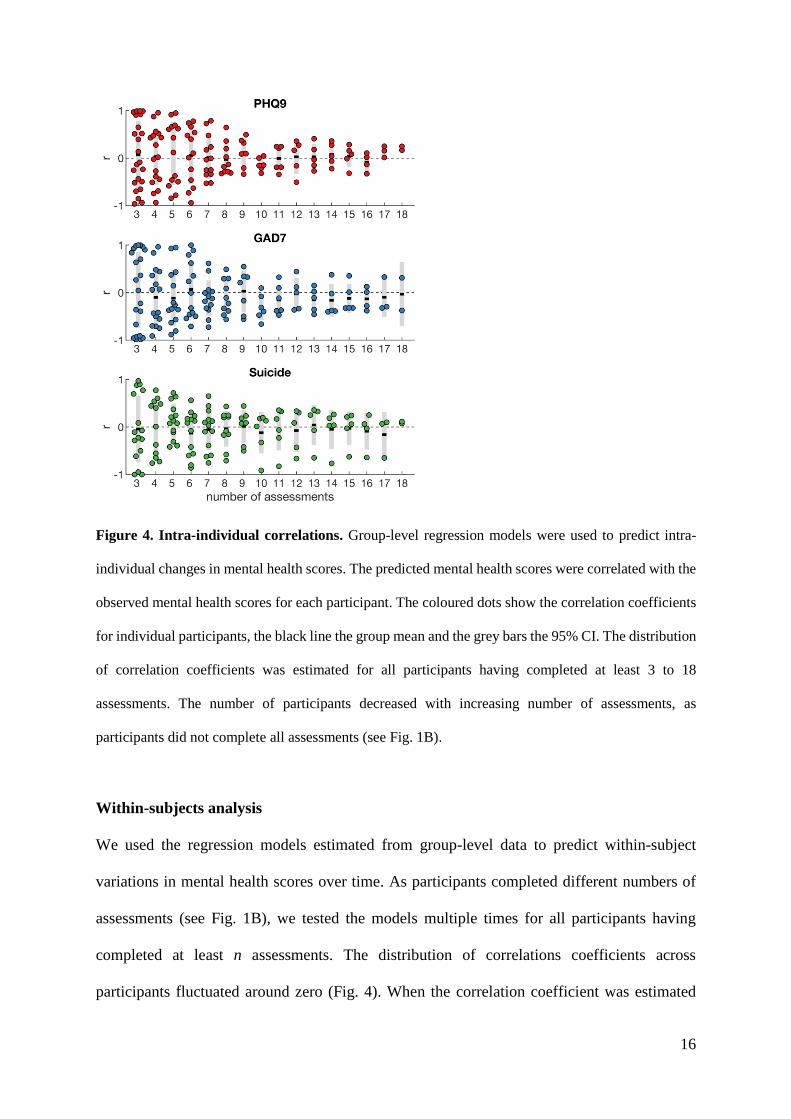
Figure 4. Intra-individual correlations. Group-level regression models were used to predict intra-
individual changes in mental health scores. The predicted mental health scores were correlated with the
observed mental health scores for each participant. The coloured dots show the correlation coefficients
for individual participants, the black line the group mean and the grey bars the 95% CI. The distribution
of correlation coefficients was estimated for all participants having completed at least 3 to 18
assessments. The number of participants decreased with increasing number of assessments, as
participants did not complete all assessments (see Fig. 1B).
Within-subjects analysis
We used the regression models estimated from group-level data to predict within-subject
variations in mental health scores over time. As participants completed different numbers of
assessments (see Fig. 1B), we tested the models multiple times for all participants having
completed at least n assessments. The distribution of correlations coefficients across
participants fluctuated around zero (Fig. 4). When the correlation coefficient was estimated

17
over a larger number of assessments the distribution become narrower; however, the 95% CI
generally overlapped with zero. As such, the positive correlations observed at group level (Fig.
3) were not observed for within-subject correlations. In fact, the average correlation coefficient
for GAD-7 was negative when estimated over at least 10 repeated assessments.
DISCUSSION
This study investigated the relationship between linguistic features in blog content and
individuals’ mental health scores for depression, anxiety, and suicidal thinking, over a 32-week
period. This study examined both group-level and individual-level correlations to test whether
linguistic expression in blogs can be used to determine the mental state of individuals who use
these platforms. We found mixed evidence for the hypotheses.
In the bivariate analyses of between-subjects correlations, only two linguistic features emerged
as significant when controlling the family-wise error rate: tentativeness and non-fluencies.
Tentativeness, which is the degree of uncertainty reflected in text, was associated with anxiety
only. This may reflect the increased worry and hesitation experienced by those who are
anxious. Non-fluencies were associated with depression and anxiety symptoms, but not
suicidal thoughts. In speech, non-fluencies relate to the various breaks and irregularities in
composition and reflects pauses for thought, nervousness, or decreased alertness (40). These
have been found to be greater in depressed people (41, 42) and may reflect the cognitive deficits
associated with the illness. However, little is known about depression and the fluency of written
text. In this study, participants with higher depressive and anxious symptoms showed fewer
non-fluencies in their written blog content. This finding and its direction is not consistent with
past studies on speech patterns or social media expression. It may represent initial evidence of

18
modality specific features (18), as blogs allow individuals to write longer sections of text.
Further examination in other datasets would confirm this.
Multivariate modelling revealed some similarities with the bivariate results, but also key
differences as quantifiers, dictionary words, axillary verbs, and negations emerged as robust
predictors of mental health. The differences with the bivariate analyses are partly explained by
the type of correlation on which these analyses are based: we used rank-order correlation for
the bivariate analyses while PLS regression finds a linear regression model. Some of the
features, such as non-fluencies, were not normally distributed and hence showed significant
rank-order correlation but were not among the robust features of the linear PLS model. Here
we used basic regression techniques to assess the relationship between linguistic features and
mental health states. More advanced machine learning techniques may be used to improve the
prediction of mental health state from automated text analyses (43), but more complex models
generally require large datasets to avoid overfitting (44, 45). Indeed, in the current study we
found that a PLS model based on a single component had a lower prediction error than models
with additional components (Fig. 3).
The current findings are somewhat consistent with the previous studies that have used validated
psycho-metric scales of depression alongside social media data. The features of third person
pronouns, present focus, 1st person singular are consistent with De Choudhury et al (13),
providing further support as a marker of the distancing from others and focus on oneself that
occurs in a depressive and suicidal state. The increased usage of first person singular pronouns
as a marker of depression is also consistent with Eichstaedt et al (19) and Edwards &
Holtzman’s meta-analysis (21). This suggests that the markers of depression found in
traditional forms of text such as poetry and letters are also likely to be evident in online

19
communication. In contrast to Tsugawa et al (15), negative emotion did not emerge as
significant for depression, anxiety, or suicidal ideation. There was also little overlap with the
features (e.g. word count, ingestion, sadness) found by Reece et al (14). However, it is difficult
to compare our findings with past studies due to differences in modelling as not all features
were measured, and varying analytical techniques were used. Further, the duration of data
collection varies across studies. This emerging area of research will benefit significantly from
replication studies in which the same features and models are used across various datasets.
An important strength of this study was the longitudinal design. This allowed us to examine
the relationship between mental health symptoms and linguistic expression over time. We
expected that individual symptoms would fluctuate over the 32-weeks and would be associated
with a change in linguistic expression. However, this was not the case. The correlations
identified at the group-level were not significant at the individual level. Thus, our findings do
not support group-to-individual generalisability of linguistic markers of depression, anxiety,
and suicidal thinking. Indeed, previous research has shown that relationships observed at the
group level do not necessarily generalise to all the individuals in this sample and hence requires
explicit testing (28). In part, the lack of significant within-subjects correlations in our study
may be due to missing data as not all participants completed all 18 assessments, which reduced
the statistical power of the analyses we performed. Moreover, some participants show little
variation in mental health scores over time (Fig. S1). However, the lack of group-to-individual
generalisability may also indicate that the underlying processes are non-ergodic (28), that is,
the relationship between linguistic features and mental health state may not be equivalent
across individuals and time. The relationship between linguistic features and mental health
state may be specific to subgroups, such as the type of mental health concern, or demographics
such as gender and age, or the type of blog post. We should hence carefully examine, rather

20
than assume, whether relationships observed at the group level also hold for subgroups or
individuals over time (30). Hence, previous findings showing correlations between linguistic
features and mental health states at group level cannot be assumed to generalise to individuals.
Intensive repeated-measures data in larger samples are needed to make predictions about intra-
individual changes in mental health scores over time.
Limitations
While the design used in this study has the potential to inform knowledge on mental health
symptoms and the relationship to linguistic expression in social media across time, it was
hampered by low levels of data. There was significant drop-out, non-completion of mental
health assessments, and variability in the amount of blog data that was generated by
participants. While attrition is common and seemingly unavoidable in longitudinal studies (46),
the identification of markers of mental ill-health requires large amounts of individual data
collected over long periods of time. This burden may be alleviated by sharing data and results,
the demand for which has been increased by open access (47). As it can be challenging to
engage human research subjects in sustained studies, and the effects of repeated measures in
psychiatry is still unknown, sharing data between researchers could alleviate these burdens.
Moreover, open access provides an opportunity to test models on datasets from multiple
sources and platforms and test whether predictions generalise to new data (39). The high
number of features has the danger of inflating researcher degrees of freedom and may endanger
replicability of findings (48). Practices such as preregistration of study hypotheses and methods
could help reduce spurious correlations and will be key in identifying reliable markers of
mental health state (49). Testing predefined models to new data is likely to be the primary way
for the field to advance. We therefore shared the data of the linguistic features and mental

21
health scores that we acquired to inform further studies or provide independent testing data for
existing prediction models.
CONCLUSIONS
Social media presents an exciting opportunity for developing new tools to monitor the onset of
mental illness. This study examined the associations between linguistic features in blog content
and individuals’ self-reported depression, anxiety, and suicidal ideation. Several features were
significantly associated with mental health scores when assessed across participants, with
differences found between the bivariate and multivariate analyses. Cross-validation showed
that linguistic features can predict the mental health scores of participants that were not
included in the training set. When testing the multivariate regression models on longitudinal
data of individual participants, no robust correlations were found between changes in linguistic
features and mental health scores over time. These finding shows that linguistic features can
identify individuals with mental illness but may not be able to detect individual changes in
mental health over time. This study demonstrates the importance of a longitudinal study design
and the use of validated psychometric scales. Future studies, utilising the advantages of open
access, will need to confirm whether social media data can also be used to predict individual
changes in mental health over time.
ACKNOWLEDGEMENTS
HC and this research were financially supported by NHMRC John Cade Fellowship
APP1056964. BOD and MEL were supported by the Society for Mental Health Research
(SMHR) Early Career Researcher Awards. TB was supported by a NARSAD Young
Investigator Grant from the Brain & Behavior Research Foundation.
22
REFERENCES
1. Mathers CD, Loncar D. Projections of global mortality and burden of disease from 2002
to 2030. PLoS Med. 2006;3.
2. Wright A, Jorm AF, Kelly CM. Improving mental health literacy as a strategy to
facilitate early intervention for mental disorders. Medical Journal of Australia.
2007;187(7):S26.
3. Oliver MI, Pearson N, Coe N, Gunnell D. Help-seeking behaviour in men and women
with common mental health problems: cross-sectional study. British Journal of Psychiatry.
2005;186(4):297-301.
4. Burgess PM, Pirkis JE, Slade TN, Johnston AK, Meadows GN, Gunn JM. Service use
for mental health problems: findings from the 2007 National Survey of Mental Health and
Wellbeing. Aust N Z J Psychiatry. 2009;43(7):615-23.
5. Roh B-R, Jung EH, Hong HJ. A Comparative Study of Suicide Rates among 10–19-
Year-Olds in 29 OECD Countries. Psychiatry Investigation. 2018;15(4):376-83.
6. Arango C, Díaz-Caneja CM, McGorry PD, Rapoport J, Sommer IE, Vorstman JA, et
al. Preventive strategies for mental health. The Lancet Psychiatry. 2018;5(7):591-604.
7. Venkatesh S, Christensen H. Using life's digital detritus to feed discovery. The Lancet
Psychiatry. 2017;4(3):181-3.
8. Kaplan AM, Haenlein M. Users of the world, unite! The challenges and opportunities
of Social Media. Business Horizons. 2010;53:59-68.
9. O'Dea B, Larsen ME, Batterham PJ, Calear AL, Christensen H. A Linguistic Analysis
of Suicide-Related Twitter Posts. Crisis. 2017;38(5):319-329.
10. Pennebaker J. The secret life of pronouns: what our words say about us. New York:
Bloomsbury; 2011.

23
11. Pennebaker J, Chung C, Frazee J, Lavergne G, Beaver D. When Small Words Foretell
Academic Success: The Case of College Admissions Essays. PLoS One. 2014;9(12): e115844.
12. Litvinova T, Seredin P, Litvinova O, Zagorovskaya O. Profiling a set of personality
traits of text author: what our words reveal about us. Research in Language. 2016;14(4): 409-
18.
13. De Choudhury M, Gamon M, Counts S, Horvitz E, editors. Predicting depression via
social media AAAI Conference on Weblogs and Social Media; 2013 8-10 July; Boston, MA,
USA: American Association for Artificial Intelligence.
14. Reece AG, Reagan AJ, Lix KLM, Dodds PS, Danforth CM, Langer EJ. Forecasting the
onset and course of mental illness with Twitter data. Scientific Reports. 2017;7(1):13006.
15. Tsugawa S, Kikuchi Y, Kishino F, Nakajima K, Itoh Y, Ohsaki H. Recognizing
Depression from Twitter Activity. Proceedings of the 33rd Annual ACM Conference on
Human Factors in Computing Systems; Seoul, Republic of Korea. 2702280: ACM; 2015. p.
3187-96.
16. Wilson ML, Ali S, Valstar MF. Finding information about mental health in
microblogging platforms: a case study of depression. Proceedings of the 5th Information
Interaction in Context Symposium; Regensburg, Germany. 2637006: ACM; 2014. p. 8-17.
17. Ramirez-esparza N, Chung CK, Kacewicz E, Pennebaker JW. The psychology of word
use in depression forums in English and in Spanish: Testing two text analytic approaches.
Proceedings of the International AAAI Conference on Web and Social Media (ICWSM);
Seattle, Washington. AAAI; 2008. p.102-108.
18. Seabrook EM, Kern ML, Fulcher BD, Rickard NS. Predicting Depression From
Language-Based Emotion Dynamics: Longitudinal Analysis of Facebook and Twitter Status
Updates. J Med Internet Res. 2018;20(5):e168.

24
19. Eichstaedt JC, Smith RJ, Merchant RM, Ungar LH, Crutchley P, Preoţiuc-Pietro D, et
al. Facebook language predicts depression in medical records. PNAS. 2018; 115(44): 11203-
11208
20. O'Dea B, Wan S, Batterham PJ, Calear AL, Paris C, Christensen H. Detecting
suicidality on Twitter. Internet Interventions. 2015;2(2):183-8.
21. Edwards T, Holtzman NS. A meta-analysis of correlations between depression and first
person singular pronoun use. Journal of Research in Personality. 2017;68:63-8.
22. Guntuku SC, Yaden DB, Kern ML, Ungar LH, Eichstaedt JC. Detecting depression and
mental illness on social media: an integrative review. Current Opinion in Behavioral Sciences.
2017;18:43-9.
23. Schwartz HA, Eichstaedt, J., Kern M.L., Park, G., Sap, M., Stillwell, D., Kosinski, M.,
Ungar, L. Towards Assessing Changes in Degree of Depression through Facebook. Workshop
on Computational Linguistics and Clinical Psychology: From Linguistic Signal to Clinical
Reality; Baltimore, Maryland. Association for Computational Linguistics: 2014. p. 118-125
24. De Choudhury M, Counts S, Horvitz E, editors. Predicting postpartum changes in
emotion and behavior via social media. The SIGCHI Conference on Human Factors in
Computing Systems; Paris, France. ACM: 2013. p. 3267-3276.
25. Moffitt TE, Harrington H, Caspi A, et al. Depression and generalized anxiety disorder:
Cumulative and sequential comorbidity in a birth cohort followed prospectively to age 32
years. Archives of General Psychiatry. 2007;64(6):651-60.
26. Beuke CJ, Fischer R, McDowall J. Anxiety and depression: Why and how to measure
their separate effects. Clinical Psychology Review. 2003;23(6):831-48.
27. Bryan CJ, Butner JE, Sinclair S, Bryan ABO, Hesse CM, Rose AE. Predictors of
Emerging Suicide Death Among Military Personnel on Social Media Networks. Suicide and
Life-Threatening Behavior. 2018;48(4):413-30.

25
28. Fisher AJ, Medaglia JD, Jeronimus BF. Lack of group-to-individual generalizability is
a threat to human subjects research. PNAS. 2018;115(27):E6106-E15.
29. Simpson EH. The Interpretation of Interaction in Contingency Tables. Journal of the
Royal Statistical Society Series B (Methodological). 1951;13(2):238-41.
30. Kievit RA, Frankenhuis WE, Waldorp LJ, Borsboom D. Simpson's paradox in
psychological science: a practical guide. Frontiers in Psychology. 2013;4:513-527.
31. Ozomaro U, Wahlestedt C, Nemeroff CB. Personalized medicine in psychiatry:
problems and promises. BMC Medicine. 2013;11(1):132-167.
32. Kroenke K, Spitzer RL, Williams JB. The PHQ-9: validity of a brief depression severity
measure. Journal of General Internal Medicine. 2001;16(9):606-13.
33. Spitzer RL, Kroenke K, Williams JW, Löwe B. A brief measure for assessing
generalized anxiety disorder: The gad-7. Arch Intern Med. 2006;166(10):1092-7.
34. Pennebaker JW, Francis ME, Booth RJ. Linguistic inquiry and word count: LIWC
2001. Mahway, NJ: Lawrence Erlbaum Associates; 2001.
35. Woolrich M, Beckmann C, Nichols T, Smith S. Statistical analysis of fMRI data. In:
Filippi M, editor. fMRI techniques and protocols. New York: Humana Press; 2009. p. 179-236.
36. Groppe DM, Urbach TP, Kutas M. Mass univariate analysis of event-related brain
potentials/fields I: A critical tutorial review. Psychophysiology. 2011;48(12):1711-25.
37. Efron B. Bootstrap methods: another look at the jackknife. In: Kotz S, Norman L,
editors. Breakthroughs in statistics. New York: Springer; 1992. p. 569-93.
38. Geladi P, Kowalski BR. Partial least-squares regression: a tutorial. Analytica Chimica
Acta. 1986;185:1-17.
39. Varoquaux G, Raamana PR, Engemann DA, Hoyos-Idrobo A, Schwartz Y, Thirion B.
Assessing and tuning brain decoders: cross-validation, caveats, and guidelines. NeuroImage.
2017;145:166-79.

26
40. O'Shea DM, De Wit L, Szymkowicz SM, McLaren ME, Talty F, Dotson VM. Anxiety
Modifies the Association between Fatigue and Verbal Fluency in Cognitively Normal Adults.
Archives of Clinical Neuropsychology. 2016;31(8):1043-9.
41. Halpern H, McCartin-Clark M, Wallack W. The nonfluencies of eight psychiatric
adults. Journal of Communication Disorders. 1989;22(4):233-41.
42. Cummins N, Scherer S, Krajewski J, Schnieder S, Epps J, Quatieri TF. A review of
depression and suicide risk assessment using speech analysis. Speech Communication.
2015;71:10-49.
43. Sebastiani F. Machine learning in automated text categorization. ACM Comput Surv.
2002;34(1):1-47.
44. Dietterich T. Overfitting and undercomputing in machine learning. ACM Comput Surv.
1995;27(3):326-7.
45. Raudys SJ, & Jain, A. K. . Small sample size effects in statistical pattern recognition:
Recommendations for practitioners. IEEE Transactions on Pattern Analysis & Machine
Intelligence. 1991;3:252-64.
46. Teague S, Youssef G, Macdonald J, Sciberras E, Shatte A, Fuller-Tszkiewicz M, et al.
Retention strategies in longitudinal cohort studies: A systematic review and meta-analysis.
PsyArXiv Preprints. 2018.
47. Gewin V. Data sharing: An open mind on open data. Nature. 2016;529:117-9.
48. Simmons JP, Nelson LD, Simonsohn U. False-positive psychology: Undisclosed
flexibility in data collection and analysis allows presenting anything as significant.
Psychological Science. 2011;22(11):1359-66.
49. Nosek BA, Lakens D. Registered reports: A method to increase the credibility of
published results. Social Psychology. 2014;45(3):137-41.

27
SUPPLEMENTARY MATERIAL
Background information on all consenting participants:
Of the 153 participants who consented to take part in the study, 127 (83%) had received a
diagnosis of depression or anxiety from a medical practitioner, and 87 (57%) were taking
medication for depression or anxiety. For depression scores, 22 were nil-minimal (14%), 36
mild (24%), 29 moderate (19%), 39 moderately severe (25%) and 27 severe (18%). For anxiety
scores, 34 were minimal (22%), 47 mild (31%), 40 moderate (26%), 25 moderately severe
(16%) and 7 severe (5%). A total of 72 (47%) reporting having had an anxiety attack in the two
weeks prior, with the mean number of attacks in this period being 5.3 (SD:7.4, range: 1-60).
At baseline, 81 (53%) had “thoughts that they would be better off dead, or of hurting
themselves” for several days or more in the past two weeks. Also, at baseline, 68 (44%)
reported both moderate to severe depression and anxiety, with depression and anxiety scores
highly correlated (r = 0.78, p < .001).
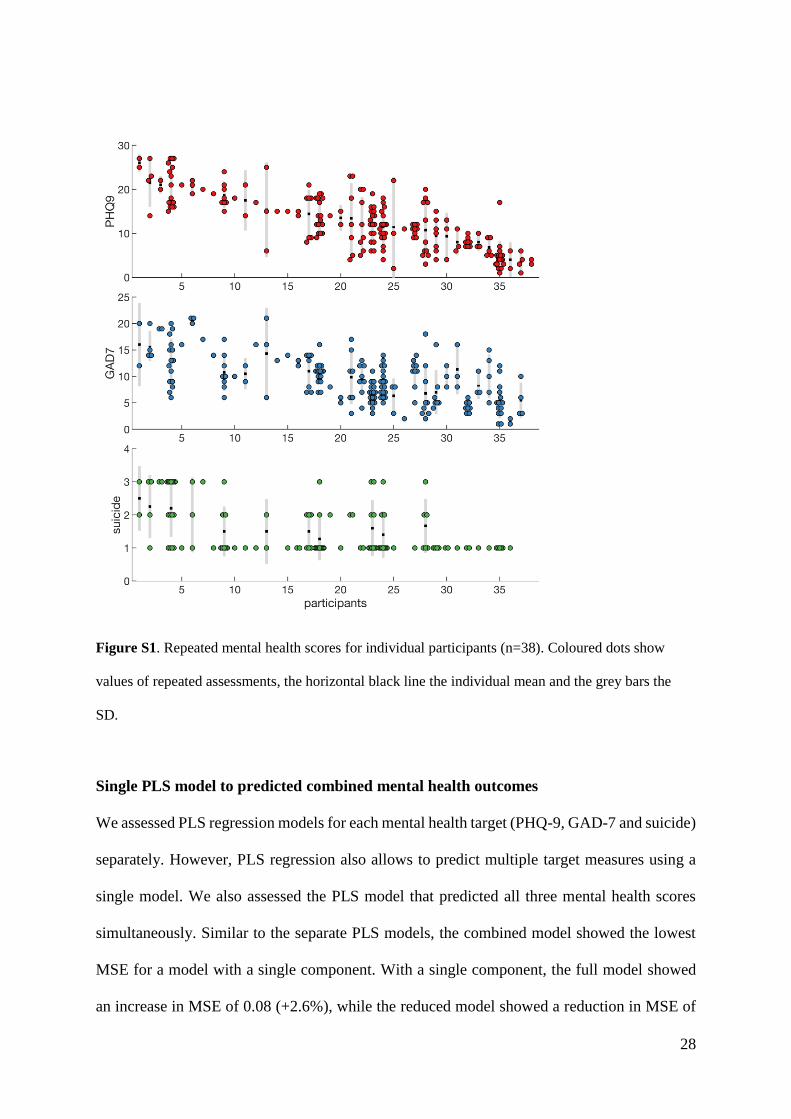
Intra-individual variability
The current study collected mental health data longitudinally and participants were asked to
complete the PHQ-9 and GAD7 every two weeks for a total of 18 assessments. To assess
whether participants revealed longitudinal changes in their mental health levels, we assessed
variability between repeated assessments. Participants completed 5.4 assessments on average
(SD: 5.2, Fig. 1B). The patterns of longitudinal change differed across participants. Several
participants revealed large changes in mental health scores over time: 12 out of 38 participants
had at least a 10-point differences between the lowest and highest PHQ-9 score and 7 out of 38
participants had at least a 10-point differences between the lowest and highest GAD-7 score
(Fig. S1). As the Suicidal thoughts scores were based on participants’ responses to item 9 of
the PHQ-9 which ranges from 0 to 3, the longitudinal change for this target was lower.
28
Figure S1. Repeated mental health scores for individual participants (n=38). Coloured dots show
values of repeated assessments, the horizontal black line the individual mean and the grey bars the
SD.
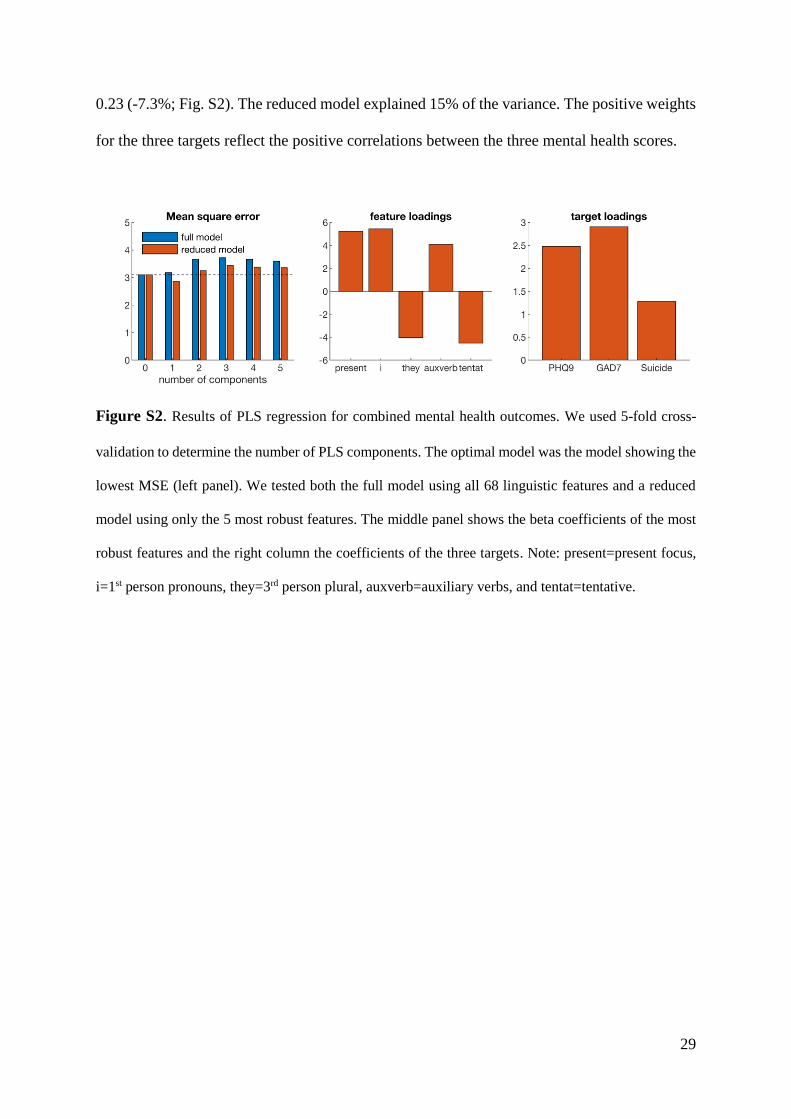
Single PLS model to predicted combined mental health outcomes
We assessed PLS regression models for each mental health target (PHQ-9, GAD-7 and suicide)
separately. However, PLS regression also allows to predict multiple target measures using a
single model. We also assessed the PLS model that predicted all three mental health scores
simultaneously. Similar to the separate PLS models, the combined model showed the lowest
MSE for a model with a single component. With a single component, the full model showed
an increase in MSE of 0.08 (+2.6%), while the reduced model showed a reduction in MSE of
29
0.23 (-7.3%; Fig. S2). The reduced model explained 15% of the variance. The positive weights
for the three targets reflect the positive correlations between the three mental health scores.
Figure S2. Results of PLS regression for combined mental health outcomes. We used 5-fold cross-
validation to determine the number of PLS components. The optimal model was the model showing the
lowest MSE (left panel). We tested both the full model using all 68 linguistic features and a reduced
model using only the 5 most robust features. The middle panel shows the beta coefficients of the most
robust features and the right column the coefficients of the three targets. Note: present=present focus,
i=1st person pronouns, they=3rd person plural, auxverb=auxiliary verbs, and tentat=tentative.