
AES/RE/11-11 Optimization of mining and processing for an ...
138
- 1 - AES/RE/11-11 Optimization of mining and processing for an Albanian nickel-laterite mine June 2011 Nicholas Russell
Transcript of AES/RE/11-11 Optimization of mining and processing for an ...

- 1 -
AES/RE/11-11 Optimization of mining and processing for an
Albanian nickel-laterite mine
June 2011 Nicholas Russell

Title : Optimization of mining and processing for an Albanian nickel-laterite mine Author(s) : Nicholas Russell Date : June 2011 Professor(s) : Hans de Ruiter Supervisor(s) : Tanya Law, Piet Hein van der Klein & Mikael Rinne TA Report number : AES/RE/11.11 Postal Address : Section for Resource Engineering Department of Applied Earth Sciences Delft University of Technology P.O. Box 5028 The Netherlands Telephone : (31) 15 2781328 (secretary) Telefax : (31) 15 2781189 Copyright ©2011 Section for Resource Engineering All rights reserved. No parts of this publication may be reproduced, Stored in a retrieval system, or transmitted, In any form or by any means, electronic, Mechanical, photocopying, recording, or otherwise, Without the prior written permission of the Section for Resource Engineering

Acknowledgements It is a pleasure to thank those who made this thesis possible. They have made their support available
number of ways and greatly contributed to this work.
I would like to thank Tanya Law for her supervision during the writing of this thesis. She has
supported me throughout my thesis work and constant source of new ideas and new directions.
This thesis would not have been possible without the support of Hans de Ruiter and the FEMP
organization that gave me the opportunity to study in a truly fantastic programme.
I would also like to show my gratitude to Mikael Rinne and Piet Hein van der Klein for their time and
efforts.
I am indebted to many of my colleagues and friends to support me throughout my studies on the
EMC, in Finland and The Netherlands. I would particularly like to thank Pieter Sturm, Jeroen Sens,
the members of the “de Teerput” – Mathijs Mol, Laurens van der Sluijs, Richard Hontelez, Ruben
Logister and Randy Calis - and the EMC classes of 2009/10 and 2010/11.
Gluck Auf!
Nicholas Russell
June, 2011

- 4 -
1 Executive Summary
The scope of the project was to re-evaluate, optimize and update an existing pre-feasibility study
(PWK Resources, 2010) of European Nickel’s Devolli project in south-eastern Albania. This included,
but was not limited to, the development of the resource estimate; geotechnical assessment of the
different rock zones; investigation of potential mining methods; design and optimization of selected
mining methods including equipment selection and CAPEX and OPEX estimation; development,
optimization and cost estimation of the raw material handling process stream; investigation of
potential processing methods; process plant design and capital and operating expenditure estimate;
environmental impact assessment (EIA); project risk assessment; market analysis; and project
finance.
The Devolli deposit consists of two separate ore bodies; Verniku West and Kapshtica. Verniku West,
located in the north, is approximately 200m underground with a north-south syncline and an
average ore thickness of 4m. Kapshtica is the southern deposit and is deeper at approximately 400m
below the surface. This deposit dips towards the south at an angle of 30 degrees and the ore body
has a thickness ranging from 2m up to 30m in select parts. The project has an indicated resource of
48.7 million tonnes of laterite ore with average grade of nickel of 1.13% and cobalt of 0.04%. Closer
drillhole spacing with increased detailed sampling, geological mapping and geotechnical
understanding of the different laterite zones is required before either ore body can be classified as
proven resources.
The project was designed with two different mine systems; room-and-pillar and longwall mining. A
variation of the room-and-pillar design, referred to as Post room-and-pillar design was also costed.
New software to link Microsoft Excel and Gemcom Surpac was developed for this project to allow
optimization of the mine design. Over 12,000 individual mine configurations were constructed,
validated and measured so that the optimum design was selected. A total of 7 different mining
constructs were designed.
The transportation of the raw material to the surface is achieved with either trucks or conveyors.
The CAPEX and OPEX of mine and/or sized stockpiles were estimated as well as the costs of changing
from conveyor to trucks mid-process. In total, 32 different material handling scenarios were fully
designed and estimated.
The processing technologies for nickel laterite ores were reviewed and heap leaching was selected
as the most appropriate. A slight alternative to the normal heap leach design is the creation of two
leach pads; a quick leach pad for saprolite ore and a long leach pad for mixed ore. Due to

- 5 -
insufficient column test data for acid agglomerated saprolite and limonite samples, this option could
not be fully explored but may be a point of interest in future studies. In addition, it was found that
the cost of processing the nickel laterite ores is many times the mining cost. This is due to the large
amounts of sulphuric acid required; over 500kg per tonne of ore. The economic evaluation
determined the level of sulphuric acid consumption to be a key cost consideration when determining
the potential feasibility of the project. A sulphuric acid plant was recommended to reduce the cost
of acid and lessen project exposure to the risk of large fluctuations in acid prices.
An environmental impact assessment was completed for the Devolli project. It was found that there
are no significant risks to environment that cannot be mitigated with reasonable design choices and
policies.
The combination of 7 different mining strategies and 32 materials handling options gave 72 valid
options in which the deposit could be mined and processed. The net present value for each option
was calculated for production rates ranging from 1000 to 15000 tonnes per day and for cut-of-grade
ranging from 0.0% to 1.3% nickel with an ultimate total of 15,192 net present values being
calculated. The result of the financial analysis was that none of the options were profitable at this
present time. A zero-line graph was constructed showing the nickel-sulphur price that would be
required for the project to break even.
The result of this study is that the Devolli project is not feasible based on current nickel and
sulphuric acid price forecasts using the methods evaluated.

- 6 -
Table of Contents
1 Executive Summary ......................................................................................................................... 4
2 Introduction .................................................................................................................................. 16
3 Project Background ....................................................................................................................... 17
3.1 Site Information .................................................................................................................... 17
3.1.1 Climate .......................................................................................................................... 17
3.1.2 Albanian Culture ........................................................................................................... 18
3.1.3 History of Mining in the Area ........................................................................................ 19
3.2 Project Ownership ................................................................................................................ 19
3.3 Mining lease and exploration concessions ........................................................................... 19
4 Geology ......................................................................................................................................... 21
4.1 Regional Geology .................................................................................................................. 21
4.2 Nickel Laterites ...................................................................................................................... 23
4.2.1 Limonite zone ................................................................................................................ 23
4.2.2 Saprolite zone ............................................................................................................... 24
4.2.3 Transition zone .............................................................................................................. 24
4.2.4 Serpentinite zone .......................................................................................................... 24
4.3 Modelling .............................................................................................................................. 25
4.3.1 Drillhole Database ......................................................................................................... 25
4.3.2 Ore Body Limits ............................................................................................................. 26
4.3.3 Zone Separation ............................................................................................................ 26
4.3.4 Grade Estimate .............................................................................................................. 28
4.4 Seismicity .............................................................................................................................. 28
4.5 Faulting.................................................................................................................................. 29
4.6 Resource Statement .............................................................................................................. 32
5 Mining ........................................................................................................................................... 36
5.1 Geotechnical ......................................................................................................................... 36

- 7 -
5.2 Mine Method Selection ........................................................................................................ 37
5.3 Mine Design .......................................................................................................................... 37
5.3.1 Room and Pillar ............................................................................................................. 37
5.3.2 Longwall ........................................................................................................................ 44
5.3.3 Stope Leaching .............................................................................................................. 50
5.3.4 In-situ Leaching ............................................................................................................. 51
5.4 Mine Equipment ................................................................................................................... 51
5.4.1 Room-and-pillar mining ................................................................................................ 51
5.4.2 Longwall mining ............................................................................................................ 51
5.5 Mine Scheduling .................................................................................................................... 52
5.6 Cost Modelling ...................................................................................................................... 52
6 Raw Ore Handling ......................................................................................................................... 54
6.1 Options .................................................................................................................................. 54
6.1.1 Run-of-Mine (ROM) ...................................................................................................... 56
6.1.2 Transportation to Surface and Surface Transportation ................................................ 57
6.1.3 Mine Stockpile (optional) .............................................................................................. 57
6.1.4 Material Sizing ............................................................................................................... 58
6.1.5 Sized Stockpile (optional) .............................................................................................. 58
6.1.6 Heap Leach Pad Stacking .............................................................................................. 58
6.2 Cost Modelling ...................................................................................................................... 59
7 Processing ..................................................................................................................................... 61
7.1 Options .................................................................................................................................. 61
7.1.1 Direct Transportation of Ore......................................................................................... 61
7.1.2 Ferronickel and matte smelting .................................................................................... 62
7.1.3 Caron Process ................................................................................................................ 63
7.1.4 High Pressure Acid Leaching (HPAL) ............................................................................. 63
7.1.5 Enhanced Pressure Acid Leaching (EPAL) ..................................................................... 64
7.1.6 Atmospheric Tank Leaching (ATL) ................................................................................. 65

- 8 -
7.1.7 Heap Leaching ............................................................................................................... 66
7.1.8 In-situ/Stope Leaching .................................................................................................. 66
7.2 Method Selection .................................................................................................................. 67
7.3 Metallurgy and Test work ..................................................................................................... 69
7.3.1 Test samples .................................................................................................................. 69
7.3.2 Interpretation of Results ............................................................................................... 70
7.4 Heap Leaching ....................................................................................................................... 76
7.5 In-situ Leaching ..................................................................................................................... 77
7.6 Stope Leaching ...................................................................................................................... 78
7.7 Precipitation Plant................................................................................................................. 78
7.7.1 Iron (Fe) Precipitation ................................................................................................... 80
7.7.2 Ion Exchange ................................................................................................................. 81
7.7.3 Nickel Precipitation ....................................................................................................... 81
7.7.4 Iron/aluminium Precipitation ....................................................................................... 82
7.7.5 Nickel/cobalt precipitation ........................................................................................... 82
7.7.6 Product Packing............................................................................................................. 83
7.8 Reclaiming Leached Ore ........................................................................................................ 83
7.9 Cost Modelling ...................................................................................................................... 83
8 Infrastructure ................................................................................................................................ 84
8.1 Offsite Infrastructure ............................................................................................................ 84
8.1.1 Power Supply ................................................................................................................ 84
8.1.2 Water Supply ................................................................................................................. 84
8.1.3 Road and Rail ................................................................................................................ 85
8.2 Onsite Infrastructure ............................................................................................................. 85
8.2.1 Administration Offices and Changing House ................................................................ 87
8.2.2 Warehouse .................................................................................................................... 88
8.2.3 Workshops .................................................................................................................... 88
8.2.4 Oil and Lubricant Store ................................................................................................. 88

- 9 -
8.2.5 Laboratory ..................................................................................................................... 88
8.2.6 Water and Sewage Treatment Plant ............................................................................. 89
8.2.7 Explosive Storage .......................................................................................................... 89
8.2.8 Fuel Storage .................................................................................................................. 89
8.2.9 Accommodation ............................................................................................................ 89
8.3 Sulphuric Acid Plant .............................................................................................................. 89
8.4 Limestone Quarry ................................................................................................................. 90
9 Ventilation ..................................................................................................................................... 91
10 Environmental and Social Management ................................................................................... 93
10.1 Environmental Legislation..................................................................................................... 93
10.2 Environmental Impact Analysis ............................................................................................. 94
10.2.1 Dust ............................................................................................................................... 94
10.2.2 Air Pollution .................................................................................................................. 95
10.2.3 Water ............................................................................................................................ 96
10.2.4 Noise ............................................................................................................................. 96
10.2.5 Vibrations ...................................................................................................................... 97
10.2.6 Land use & Top soil management ................................................................................. 98
10.2.7 Flora and Fauna ............................................................................................................. 98
10.2.8 Waste Material.............................................................................................................. 98
10.3 Cultural Heritage ................................................................................................................... 99
11 Project Scheduling .................................................................................................................. 101
11.1 Pre-production .................................................................................................................... 101
11.2 Production ........................................................................................................................... 102
11.3 Post-production .................................................................................................................. 102
12 Risk Analysis ............................................................................................................................ 103
12.1 Construction and Development .......................................................................................... 105
12.2 Operations .......................................................................................................................... 108
12.3 Closure ................................................................................................................................ 111

- 10 -
13 Mine Closure and Decommissioning ...................................................................................... 112
13.1 Closure Plan Development .................................................................................................. 112
13.1.1 Mine ............................................................................................................................ 113
13.1.2 Heap leach pad ............................................................................................................ 114
13.1.3 Precipitation plant and other mine infrastructure ..................................................... 114
13.1.4 Leached ore dump ...................................................................................................... 114
13.2 Cost of Mine Closure ........................................................................................................... 115
14 Market Analysis ....................................................................................................................... 116
14.1 Nickel ................................................................................................................................... 116
14.1.1 Consumption ............................................................................................................... 116
14.1.2 Production ................................................................................................................... 116
14.1.3 Supply and demand .................................................................................................... 117
14.1.4 Alternatives/Substitutes ............................................................................................. 118
14.1.5 Historical pricing ......................................................................................................... 118
14.1.6 Future price prediction ............................................................................................... 119
14.1.7 Project Pricing ............................................................................................................. 120
14.2 Cobalt .................................................................................................................................. 120
14.2.1 Consumption ............................................................................................................... 120
14.2.2 Production ................................................................................................................... 120
14.2.3 Supply and Demand .................................................................................................... 121
14.2.4 Alternatives and substitutes ....................................................................................... 121
14.2.5 Historical pricing ......................................................................................................... 122
14.2.6 Project pricing ............................................................................................................. 122
15 Economic Appraisal ................................................................................................................. 123
15.1 Currency and Inflation ........................................................................................................ 123
15.2 Net Smelter Return ............................................................................................................. 123
15.3 Financial Model ................................................................................................................... 123
15.3.1 Corporate tax and royalties ........................................................................................ 124
- 11 -
15.3.2 Discount rate ............................................................................................................... 124
15.3.3 Depreciation ................................................................................................................ 124
15.3.4 Pre-production Time ................................................................................................... 124
15.3.5 Value added taxes ....................................................................................................... 125
15.3.6 Summary of discount cash flow model parameters ................................................... 125
15.4 Base Case Results ................................................................................................................ 125
15.5 Financial Appraisal .............................................................................................................. 127
15.6 Sensitivity Analysis .............................................................................................................. 127
15.6.1 Variations in Four Key Cost Factors ............................................................................ 127
15.6.2 Net Present Value zero-line due to nickel and sulphur price ..................................... 129
16 Recommendations .................................................................................................................. 131
17 Conclusion ............................................................................................................................... 132
18 Bibliography ............................................................................................................................ 133
19 Appendix A: Geological map of Albania .................................................................................. 139
20 Appendix B: 3D Figures of the ore body ................................................................................. 140
21 Appendix C Fault modelling cross sections ............................................................................. 141
22 Appendix D Resource Grade-tonnage curves ......................................................................... 142
23 Appendix E Nicholas Method Results ..................................................................................... 143
24 Appendix F Room-and-pillar recovery calculation .................................................................. 144
25 Appendix G Room-and-pillar & longwall input screen ........................................................... 145
26 Appendix H Reserve grade tonnage curves ............................................................................ 146
27 Appendix I Cost Model ............................................................................................................ 147
28 Appendix J Process flow diagrams .......................................................................................... 148
29 Appendix K Project Gantt chart .............................................................................................. 149
30 Appendix L Financial result for all options .............................................................................. 150

- 12 -
List of Figures
Figure 1 Map of the project area (large map) and reference location with regard to Albania (top left)
.............................................................................................................................................................. 17
Figure 2 Average Temperatures for Korce, Albania throughout the year(World Weather Online, 2011;
NASA, 2011) .......................................................................................................................................... 18
Figure 3 Average rainfall throughout the year for Korce(World Weather Online, 2011) ..................... 18
Figure 4 Devolli map showing drill hole collar locations ...................................................................... 21
Figure 5 Extract of geological map of Albania showing Fe-Ni & Ni-Si zones ........................................ 22
Figure 6 Effect of climate on typical nickel laterite profiles(Chan, 1998) ............................................. 23
Figure 7 Ore boundaries of Verniku West (left) and Kapshtica (right) ................................................. 26
Figure 8 Block model showing mineral types calculated using single ore body ................................... 27
Figure 9 Seismicity of Albania(Aliaj, et al., 2004) .................................................................................. 29
Figure 10 Major faulting in Albania(Aliaj, 2007) ................................................................................... 30
Figure 11 Plan of Verniku West - faults in red, possible faults in blue & vertical displacements in
yellow (see Appendix C) ........................................................................................................................ 31
Figure 12 Plan of Kapshtica - possible faults in blue and vertical displacements in yellow (see
Appendix C) ........................................................................................................................................... 32
Figure 13 Grade-tonnage curve for Verniku West deposit ................................................................... 33
Figure 14 Grade-tonnage curve for Kapshtica deposit ......................................................................... 34
Figure 15 Mineral tonnage curve for Verniku West ............................................................................. 34
Figure 16 Mineral tonnage curve for Kapshtica .................................................................................... 35
Figure 17 Classic room-and-pillar mining(Hustrulid, 2001) .................................................................. 38
Figure 18 Post room-and-pillar mining(Hustrulid, 2001) ...................................................................... 39
Figure 19 Step-room mining(Hustrulid, 2001) ...................................................................................... 39
Figure 20 Tributary area calculation for pillars(Brady, et al., 2004) ..................................................... 40
Figure 21 Room-and-pillar room automatically generated - Plan view (top-left), elevation (top right)
and isometric view of pillars and the mined area (bottom left and right respectively) ....................... 41
Figure 22 Room and pillar design for Devolli project ........................................................................... 42
Figure 23 Grade-tonnage curve for room and pillar method ............................................................... 43
Figure 24 Grade-tonnage curve for post room-and-pillar .................................................................... 43
Figure 25 Longwall mining(Hustrulid, 2001) ......................................................................................... 44
Figure 26 Single Pass Longwall method – mine direction to the left of the page(Ozfirat, et al., 2005)45
Figure 27 Multi-Slice Longwall method - mine direction to the right of the page(Ozfirat, et al., 2005)
.............................................................................................................................................................. 45

- 13 -
Figure 28 Longwall Top Coal Caving method ........................................................................................ 46
Figure 29 Layout of longwall panel in plan ........................................................................................... 47
Figure 30 Longwall mine panels created. ±10 deg extraction angle (left) and 10 & 20 deg longwall
angle (right) ........................................................................................................................................... 47
Figure 31 Longwall designs for Verniku West (left and centre) and Kapshtica (right) ......................... 48
Figure 32 Grade-tonnage curve for longwall mining (northern deposit with north-south oriented
longwall panels) .................................................................................................................................... 49
Figure 33 Grade-tonnage curve for longwall mining (northern deposit with east-west oriented
longwall panels) .................................................................................................................................... 50
Figure 34 Example of a raw material handling option .......................................................................... 54
Figure 35 Raw material handling options ............................................................................................. 56
Figure 36 Cost model sheets ................................................................................................................. 59
Figure 37 Cost model example showing CAPEX and OPEX totals ......................................................... 60
Figure 38 Nickel recovery verse leach time .......................................................................................... 71
Figure 39 Acid consumption verse leach time ...................................................................................... 71
Figure 40 Nickel recovery verse leach time using alternative test column ACT-6 ................................ 72
Figure 41 Acid consumption verse leach time using alternative test column ACT-6 ........................... 72
Figure 42 Nickel recovery verse leach time of agglomerated ore ........................................................ 73
Figure 43 Acid consumption verse leach time of agglomerated ore .................................................... 74
Figure 44 Nickel recovery verse leach time with theoretical agglomerated NiSi sample .................... 75
Figure 45 Acid consumption verse leach time with theoretical agglomerated NiSi sample ................ 75
Figure 46 EN precipitation plant flow sheet design (L: liquids and S: solids) (European Nickel, 2010) 78
Figure 47 Alternative precipitation plant flow sheet design ................................................................ 79
Figure 48 Precipitation plant process flow illustration(European Nickel, 2010) .................................. 80
Figure 49 Illustration of Calgon ISEP continuous ion exchange separator(Calgon Carbon Corp., 2004)
.............................................................................................................................................................. 81
Figure 50 Map of Albania and Greece showing major electrical points of interest to the project ...... 84
Figure 51 Site plan showing major infrastructure ................................................................................ 87
Figure 52 Historical sulphuric acid prices(ICIS, 2010) ........................................................................... 90
Figure 53 High-level ventilation design for the Devolli project ............................................................ 91
Figure 54 Location of sites of cultural importance(European Nickel, 2010) ...................................... 100
Figure 55 Mine closure plan development process flow chart........................................................... 113
Figure 56 Nickel by first use(Nickel Institute, 2007) ........................................................................... 116
Figure 57 Nickel by end use(Nickel Institute, 2007) ........................................................................... 116

- 14 -
Figure 58 Nickel Production in 2010 by Countries(US Geological Survey, 2011) ............................... 117
Figure 59 Average price of nickel from 1958 to 2010(Kuck, 1998; LME, 2011; inflationdata.com, 2011)
............................................................................................................................................................ 118
Figure 60 LME spot prices for nickel over last 5 years(LME, 2011) .................................................... 119
Figure 61 Consumption of cobalt(Geovic Mining Corp, 2009) ........................................................... 120
Figure 62 Cobalt producing countries of 2009(US Geological Survey, 2010) ..................................... 121
Figure 63 Cobalt past and predicted future supply and demand needs(Geovic Mining Corp, 2009) 121
Figure 64 Sensitivity analysis for room-and-pillar option ................................................................... 128
Figure 65 Sensitivity analysis for longwall option ............................................................................... 128
Figure 66 NPV zero-line due to nickel and sulphur price for room-and-pillar option ........................ 129
Figure 67 NPV zero-line due to nickel and sulphur price for longwall option .................................... 129

- 15 -
List of Tables Table 1 Albanian mineral tenure law summary(Christopher, 2009) .................................................... 20
Table 2 Relinquish timings for exploration permits(Christopher, 2009) .............................................. 20
Table 3 Resource Statement for Devolli Nickel Project with cut-of-grade of 0.5% Ni .......................... 33
Table 4 Sample of geotechnical results ................................................................................................ 36
Table 5 Shearer and plow properties(Myszkowski, et al., 2010) .......................................................... 46
Table 6 Mining cost model options ...................................................................................................... 52
Table 7 Column test parameters .......................................................................................................... 69
Table 8 Likelihood rating with description and explanation ............................................................... 103
Table 9 Consequence rating for different categories(University of New South Wales, 2010) ........... 104
Table 10 Example of risk matrix(Department of Resources, Tourism and Industry, 2008) ................ 105
Table 11 Potential project risks during construction and development (without mitigation) ........... 106
Table 12 Potential project risks during construction and development (with mitigation) ................ 107
Table 13 Potential project risks during operations (without mitigation) ........................................... 108
Table 14 Potential project risks during operations (with mitigation) ................................................. 110
Table 15 Potential project risks during mine closure (without mitigation) ........................................ 111
Table 16 Potential project risks during mine closure (with mitigation) ............................................. 111
Table 17 Net smelter return parameters ............................................................................................ 123
Table 18 Depreciation allowances ...................................................................................................... 124
Table 19 Discounted cash flow model parameters ............................................................................ 125
Table 20 Valid mining & material handling/processing options ......................................................... 125
Table 21 Financial results for the different mining options ................................................................ 126
Table 22 Financial results for the different mining options with 20% reduction in sulphur price ..... 126
Table 23 Sensitivity analysis key parameters ...................................................................................... 128
- 16 -
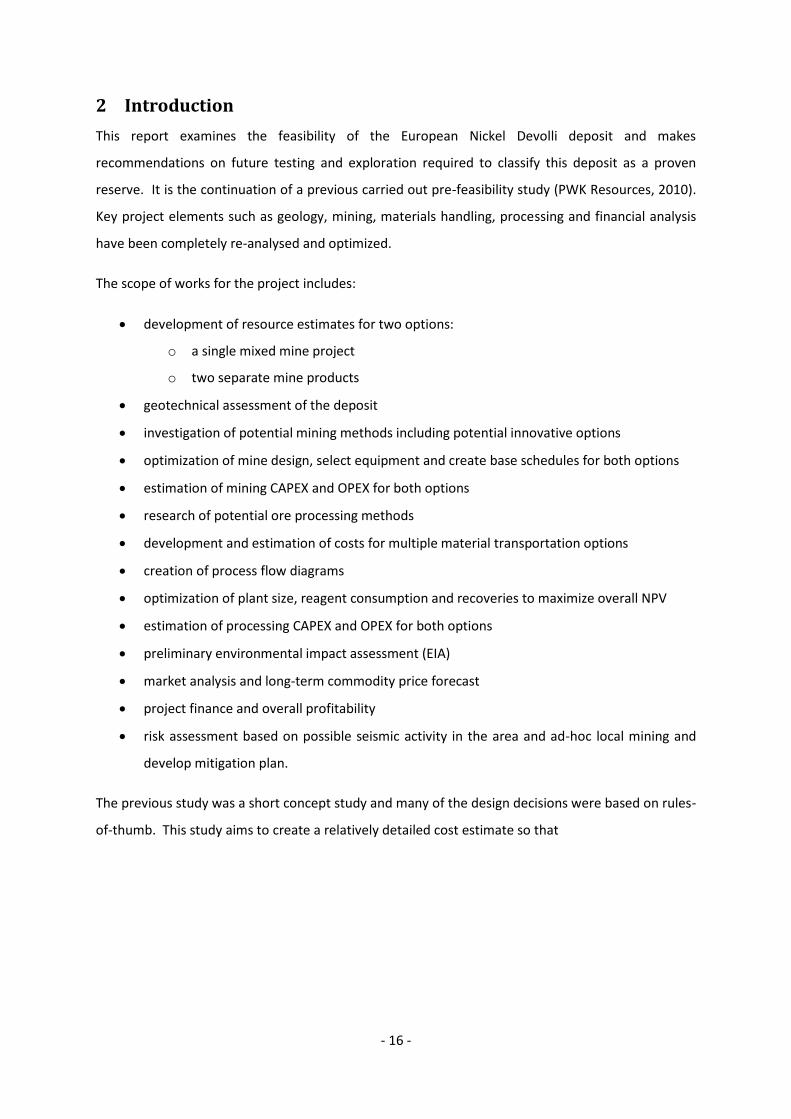
2 Introduction
This report examines the feasibility of the European Nickel Devolli deposit and makes
recommendations on future testing and exploration required to classify this deposit as a proven
reserve. It is the continuation of a previous carried out pre-feasibility study (PWK Resources, 2010).
Key project elements such as geology, mining, materials handling, processing and financial analysis
have been completely re-analysed and optimized.
The scope of works for the project includes:
development of resource estimates for two options:
o a single mixed mine project
o two separate mine products
geotechnical assessment of the deposit
investigation of potential mining methods including potential innovative options
optimization of mine design, select equipment and create base schedules for both options
estimation of mining CAPEX and OPEX for both options
research of potential ore processing methods
development and estimation of costs for multiple material transportation options
creation of process flow diagrams
optimization of plant size, reagent consumption and recoveries to maximize overall NPV
estimation of processing CAPEX and OPEX for both options
preliminary environmental impact assessment (EIA)
market analysis and long-term commodity price forecast
project finance and overall profitability
risk assessment based on possible seismic activity in the area and ad-hoc local mining and
develop mitigation plan.
The previous study was a short concept study and many of the design decisions were based on rules-
of-thumb. This study aims to create a relatively detailed cost estimate so that

- 17 -
3 Project Background
3.1 Site Information
The Devolli deposit is located in south-eastern Albania near the small town of Bilishti close the Greek
border. Korce, the principal town in the region, is located approximately 30km by road to the west.
Figure 1 below is a map of south-east Albania showing the deposit location.
Figure 1 Map of the project area (large map) and reference location with regard to Albania (top left)
The licence area is approximately 77km2 and the elevation of the area ranges from 476m to 932m
above sea level. The licence area is primarily private-owned farm land with some areas covered by
scrub. The area above the Devolli deposits is very barren and hilly with some scrub. The deposit lays
just over 8km from the Greek border. Main access to the site is via the main road SH3 which has
been improved in recent years. Other small villages in the vicinity of the project area are Verniku,
Kapshitca, Vishocica, Bitinska and Treni (see Figure 1).
3.1.1 Climate
Albania is located in western part of the Balkan Peninsula and neighbours Greece and FYROM in the
east, Kosovo to the north and Montenegro in the north-west. The climate varies across Albania from
the typical Mediterranean environment in the west to the moderate continental weather in the east.

- 18 -
The climate around Korce is typically Mediterranean with average day temperatures ranging from 7
degrees C in the winter up to 30 degrees C in the summer (see Figure 2). Average temperatures at
night during the winter months are sub-zero so the freezing conditions need to be considered in the
process design.
Figure 2 Average Temperatures for Korce, Albania throughout the year(World Weather Online, 2011; NASA, 2011)
Average precipitation for the year is approximately 550mm which variers throughout the year. As
per Figure 3, there is a trend for summer months to be dryer with wetter months at the end of the
year.
Figure 3 Average rainfall throughout the year for Korce(World Weather Online, 2011)
3.1.2 Albanian Culture
Albania is a male dominant society where it is the norm for women to be caretakers of the home
and their duty is to serve their husbands, sons and any guests. During the 1960’s and 70’s, the
communist party did much to improve women rights but in the decades that followed, much of this
- 19 -
progress was reversed. In recent times, women are increasingly being employed outside of the
home and are finding employment much easier than men. Smoking and drinking alcohol by
Albanian women was once unknown but this is now becoming common place in Tirana (Culture
Crossing). Unemployment for the Albanian population is currently estimated at 13.5%(CIA, 2011).
The education system in Albania is secular and the literacy rate (age 9 and over who can read and
write) of the total population is 98.7% (CIA, 2011). Elementary education is compulsory and most
students continue until completion of their secondary studies. Exams must be passed at the end of
the 9th grade and the 12th grade to continue into high levels of education. At higher education levels,
briberies are common to obtain diploma degrees resulting in many Albanian students applying for
university placements abroad to receive a fair and recognised education.
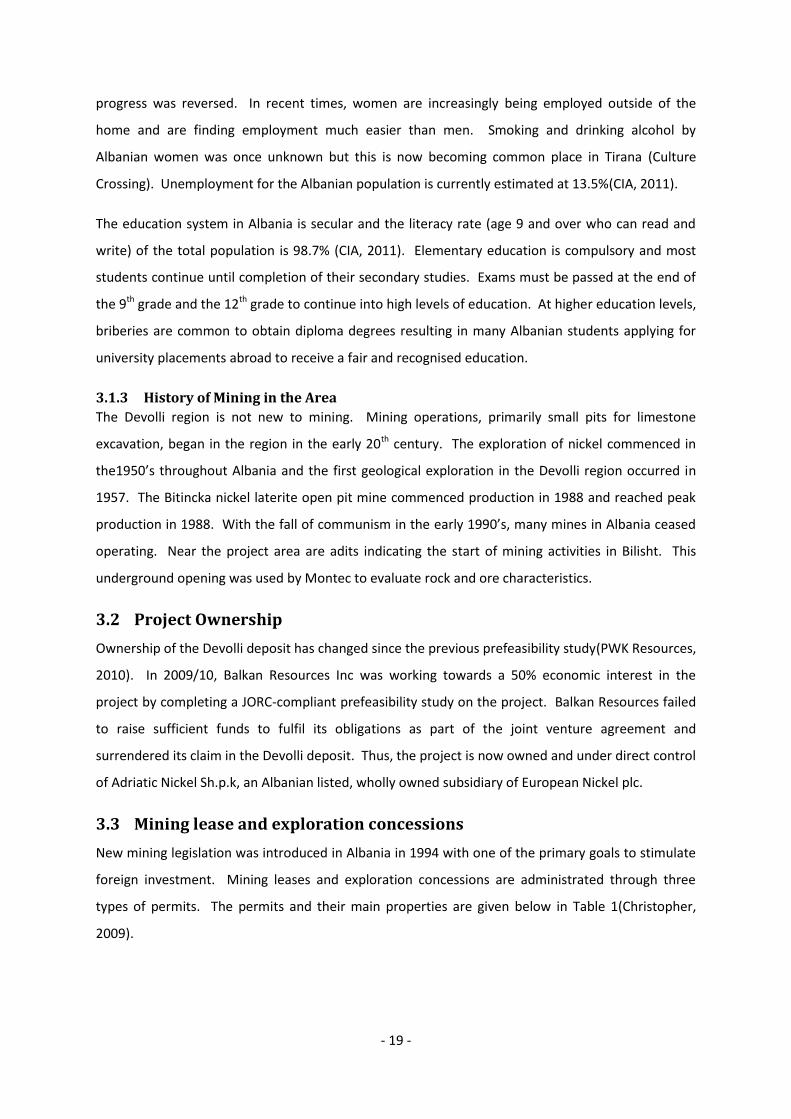
3.1.3 History of Mining in the Area
The Devolli region is not new to mining. Mining operations, primarily small pits for limestone
excavation, began in the region in the early 20th century. The exploration of nickel commenced in
the1950’s throughout Albania and the first geological exploration in the Devolli region occurred in
1957. The Bitincka nickel laterite open pit mine commenced production in 1988 and reached peak
production in 1988. With the fall of communism in the early 1990’s, many mines in Albania ceased
operating. Near the project area are adits indicating the start of mining activities in Bilisht. This
underground opening was used by Montec to evaluate rock and ore characteristics.
3.2 Project Ownership
Ownership of the Devolli deposit has changed since the previous prefeasibility study(PWK Resources,
2010). In 2009/10, Balkan Resources Inc was working towards a 50% economic interest in the
project by completing a JORC-compliant prefeasibility study on the project. Balkan Resources failed
to raise sufficient funds to fulfil its obligations as part of the joint venture agreement and
surrendered its claim in the Devolli deposit. Thus, the project is now owned and under direct control
of Adriatic Nickel Sh.p.k, an Albanian listed, wholly owned subsidiary of European Nickel plc.
3.3 Mining lease and exploration concessions
New mining legislation was introduced in Albania in 1994 with one of the primary goals to stimulate
foreign investment. Mining leases and exploration concessions are administrated through three
types of permits. The permits and their main properties are given below in Table 1(Christopher,
2009).

- 20 -
Table 1 Albanian mineral tenure law summary(Christopher, 2009)
Type of Tenure Period (years)
Renewals (years)
Maximum Area (km2)
Annual Fees
Prospecting 1 None 400 US$320 per permit registration fee
Exploration Concession 2 3 x 1 year 200 US$320 / 1km2 / year
Mining Concession 20 4 x 5 years 15 US$ 2,000 to US$ 10,000 / 1km2 / year
Although there is a maximum area for exploration and mining concessions, an applicant may hold
more than one mineral tenure and can create a greater combined area. The deposit is currently
covered by an exploration concession. Over the life of the exploration concession, parts of the
original concession must be relinquished by the holder (see Table 2 below).
Table 2 Relinquish timings for exploration permits(Christopher, 2009)
Timing Relinquished portion size
End of first two year period 40% of original concession area
End of first extension 50% of original concession area
End of second extension 70% of original concession area
End of final extension 100% of original concession area excluding approved areas
A concession holder may re-apply for a new concession to cover previously relinquished areas,
however this is subject to approval by the Ministry of Economy, Trade and Energy once again.
Albanian mining law allows mining enterprises to be completely foreign owned. Additionally, the
legal regime remains unchanged for the full term of the mining concession.

- 21 -
4 Geology The nickel deposits investigated in this report are located in the Devolli district in south-east Albania.
The deposits are situated approximately 8 km west of the north-south trending Greek border.
Figure 4 below shows the deposit areas (light blue), the nearby town of Bilishti (brown area, centre
left of figure) and the Albanian-Greek border (black-dotted line, right of figure). The deposit was
originally documented by drilling performed by the Albanian Geological Survey (ABS). These drill
holes (red symbols in the figure) defined the contact depth of sedimentary overburden, lateritic ore
and barren host rock. Further works by European Nickel have confirmed the results from the ABS
drilling and have progressed with the delineation of the ore bearing zones in three dimensions.
Figure 4 Devolli map showing drill hole collar locations
4.1 Regional Geology The project area is the southern part of the Mirdita ophilite tectonic unit. The main geological
structure is a NNW-SSE trending syncline. This is the Albano Thessalian Depression which is also
known locally as the Shkumbini syncline. The syncline includes an Upper-Cretaceous limestone in
the centre and in the west Tertiary sediments. This is flanked by ultramafics on both sides.
Quaternary clastic sedimentary formations of the Devolli plain cover the borders to the south and

- 22 -
west. The north-east of the syncline is adjoined to massive limestone of the Upper Triassic
Korabi tectonic unit. During the Barremian-Aptian age, lateritisation of the ultramafic rock took
place concentrating nickel and cobalt. The ultramafic rock was also weathered during the
Jurrassic age to serpentinite. The area has been altered many times due to intense faulting.
This has occurred during; the Alpine orogeny (late-Jurassic/early-Cretaceous), end of the
Cretaceous, end of the Eocene, during the Oligocene, before Burdigalian, the Tortonian, the end
of the Upper Cretaceous and the end of the Pliocene. The Devolli deposit does not outcrop and
the conglomerate overburden over the ore body ranges in thickness between 150 to 300
meters. Figure 5 below is an extract from the geological map of Albania showing the Fe-Ni & Ni-
Si zones. The entire map is attached in Appendix A.(GBM, 2008; Arkaxhiu, et al.)
Figure 5 Extract of geological map of Albania showing Fe-Ni & Ni-Si zones

- 23 -
4.2 Nickel Laterites Nickel is commonly found in two different mineral groups: sulphides and laterites. Although nickel
laterites represent approximately 70% of the world land based resources, only 40% of the global
annual nickel production originates from these sources(Dalvi, et al., 2004). The current trend is that
nickel production from laterite sources has increased.
Nickel laterites are formed through the extended tropical weathering of ultramafic rocks such as
peridotite or serpentinite(Chan, 1998). Due to the chemical weathering process, laterite deposits
characteristically form in a layered ore profile. Different ore profiles then form depending on the
climate conditions. Figure 6 below shows the two main profiles generally associated with limonitic
ore deposits.
Figure 6 Effect of climate on typical nickel laterite profiles(Chan, 1998)
The Devolli deposit is typical of a humid equatorial climate. Thus, the ore containing body consists
of three separate zones; limonite, saprolite and a transition ore between the two. The separation of
the ore body into these three zones is extremely important because different processing methods
are more suited to different ore types.
4.2.1 Limonite zone
The limonite-lateritic zone is a high ferrous zone consisting of a variety of minerals. Limonite
consists of primarily goethite and may also contain hematite and maghemite. Other secondary

- 24 -
minerals may also be present in the ore body. Limonite, also referred to as ferrous nickels (FeNi),
will typically have grades of:
Fe > 40%
low silica
low magnesia
1.4% Ni
0.15% Co
Limonite ore is generally homogeneous in chemical and mineral composition. (Chan, 1998)
4.2.2 Saprolite zone
Saprolite ore, unlike limonite, tends to contain low amounts of iron. In contrast to the substantial
weathering characteristic of limonite ore, more of the parent rock within the saprolite zone remains
intact. In serpentinized profiles, such as found in the Devolli deposit, boulders of partially weathered
bed-rock are also common. Saprolite is also referred to as nickel silicates because of the high silica
content. Typical grades found in saprolite are:
Fe < 15%
High silica
High magnesia
2.4% Ni
0.05% Co
As can be seen, the saprolite ore tends to have higher nickel grades though the presence of partially-
weathered boulders means less chemical and mineral consistency throughout the ore zone.(Chan,
1998)
4.2.3 Transition zone
The transition zone is the ore plane that is present above the saprolite and below the limonite.
Typically, it will be enriched with magnesium, nickel and cobalt. The zone does not contain any
discrete Ni minerals. Instead, nickel is usually contained within secondary silicate or oxide
minerals(Chan, 1998). The boundaries for the intermediate zone are discussed in detail in the next
section of this report.
4.2.4 Serpentinite zone
The footwall of the ore zone in the Devolli deposit is serpentinite, a rock type that has formed due to
the weathering by sea water of ultramafic rocks. Asbestos is a mineral commonly found in
serpentinite rocks. Asbestos is the general term applied to the group of asbestiform silicate minerals
that are a sub-set of the serpentinite group(Department of Industry and Resource, 2001).
Fortunately, asbestos only forms under rare geological conditions in a crystallized fibrous form that

- 25 -
is a health hazard if inhaled as dust particles. Therefore, only some forms of the asbestos
mineralization are hazardous to underground workers. During mining operations, the presence and
mineralization of asbestos will need to be determined in the current workings and necessary control
measures implemented.
4.3 Modelling In the previous study(PWK Resources, 2010), the importance of differentiating between the three
ore bearing zones was not fully appreciated until near study completion. There was insufficient
time to remodel the entire ore body so tonnages of limonite and saprolite were not accurately
modelled. The re-estimating of the mineral zone resource is a key part of this project to facilitate a
more accurate mine and process design.
The modelling of the Devolli deposit was performed using the Gemcom Surpac software. The steps
involved to create the final block model were:
1. Importing drillhole database
2. Developing ore body limits
3. Ore body generation and ore zone separation
4. Grade estimate using geostatistics
Each of these steps above are described in greater detail below.
4.3.1 Drillhole Database
The drillhole database was supplied by European Nickel and consisted of the following four tables:
Collar
Survey
Geology
Assay
The collar table contained the eastings, northings and elevations for 228 drillholes; 143 for the
northern deposit Verniku West and 85 drillholes for the southern deposit Kapshtica. In total, there
were over 71,000m of drill holes.
The survey table reported the same bearing and dip for all of the drillholes. The dip of every drill
hole was -90 degrees or in other words, perfectly vertical. This would indicate that the deviation of
the drillholes had not been measured on site and that vertical has been assumed. This introduces a
potential quality assurance issue as drillholes can deviate from their vertical alignment considerably,
even in short holes. Therefore, to accurately model the 3D ore body and develop mine plan, the
drillholes will need to be surveyed at a later date. This may not be possible if the holes have

- 26 -
collapsed or if the collars were cemented. In this case, European Nickel will need to perform extra
drilling close to existing drillholes to accurately determine the location of the ore body.
In addition, the geology table, like the survey table, did not contain considerable amounts of
information. For each drillhole that intersected ore, only the depths for the conglomerate, ore
bearing and serpentines zones were provided. Unfortunately, the geology table did not distinguish
between the limonite, transition and saprolite zones.
The final table given in the drillhole database included assay results. For each ore zone, assay values
were given for nickel, cobalt and iron content. For some drillholes, assay values for chromium oxide,
silica, aluminium oxide, magnesia and calcium oxide. These were very sporadic though and could
not be used in the model.
4.3.2 Ore Body Limits
The drillhole database was loaded into Surpac and the first modelling task was the definition of the
ore body limits. This was undertaken in plan view based on whether a drillhole had an ore bearing
zone or not as shown in Figure 7 below.
Figure 7 Ore boundaries of Verniku West (left) and Kapshtica (right)
Verniku West is approximately 2400m in strike length and up to 600m across. Kapshitca is
approximately 1200m in both length and width.
4.3.3 Zone Separation
The separation of the nickel bearing zones is extremely important for the processing of nickel
laterites and the reasons for this are explained in the processing section of the report (Section 7). As
stated previously, the geology table in the drillhole database did not split the ore section into

- 27 -
separate zones. Consequently, using the assay values was the only available methodology to define
the limonite, transition and saprolite ore body limits.
The first method to achieve zone separation was to create a single ore body that included all three
zones. Kriging could then be applied on the nickel, cobalt and Fe values. The Fe content of a block
could then be used to determine the predominate mineralized zones it contained. Figure 8 below
shows the block model results for the northern deposit.
Figure 8 Block model showing mineral zones calculated using single ore body
Figure 8 above should show all three colours throughout the entire ore body. Instead, zones of
limonite and saprolite (red and blue respectively) form around individual boreholes and the entire
“middle ground” consists completely of the transition zone. This is clearly incorrect and modelling
the ore body with a single solid was not going to work. Three separate ore bodies, one for each of
the ore zones, needed to be created so that “hard” boundaries could be established between the
different mineral zones.
To create three separate ore bodies, the database was split into three different sections. Each ore
body was then created separately and Kriging was performed using each solid/database. When
splitting the database, two separate issues became apparent. The first was defining what should be

- 28 -
the Fe cut of grades for each zone. The literature gives typical values of limonite having greater than
40% Fe and saprolite having less than 15% Fe. If these Fe cut-offs were used, sections of a drill hole
that were 16% or 39% iron would be defined as transition zone. The question then is what to do if in
one borehole the Fe grade is 10% for 5m, 16% for 3m and then 8% for another 5m. This led to the
second issue; how to split the ore zone of a drillhole into three separate sections if iron-grade varies
between zones.
The solution to both issues was to use a “softer” boundary for separating the zones. Instead of 15%
and 40%, the transition zone was reduced to between 20% and 35%. To resolve the second
problem, the limonite zone was designated as the length at the top of the borehole that was entirely
over 35% Fe. Similarly, the saprolite zone was set as the length at the bottom of the borehole that
was entirely under 20%.
3D images of the ore body and its different zones are attached in Appendix B.
4.3.4 Grade Estimate
Grades of Ni, Co and Fe were estimated using the Kriging method. Each ore body and individual
zone was calculated independently. The results were verified using the simple Inverse Distance
Method (IDM). No major trends were found in any direction so all Kriging estimates were performed
using a uniaxial search.
4.4 Seismicity Albania is located in an active seismic zone. Probabilistic seismic hazard maps of Albania have been
built in recent years(Aliaj, et al., 2004). The Devolli project lies in the Ohrid-Korca zone (Zone OK
below in Figure 9) which has the highest rate density which is the number of annual earthquakes in
the area exceeding 6.0 on the Richter scale. Based on the probability model built, the largest
earthquake expected in the area is a magnitude 7.0. Such an event would be classified as a major
earthquake and would be large enough to have a destructive zone over 100km across.
In 2009, an earthquake of magnitude 5.5 occurred to the north of the project area near the capital
Tirana. More recently on the 28th May 2011, a 4.5 magnitude earthquake was measured in western
Greece (USGS Earthquakes, 2011).
Based on the Earthquake hazard map of Albania(European Nickel, 2010), the Devolli project is
located in a MSK-64 VII intensity zone (zone IX is the highest risk category). The design of
underground workings, material stockpiles and structures will need to be designed for this category.

- 29 -
Figure 9 Seismicity of Albania(Aliaj, et al., 2004)
4.5 Faulting Albania, being in a seismic zone, has many fault systems. Figure 13 below shows the major faults
throughout Albania. The Devolli project is located in the south-east corner of the country where
there are a considerable number of major faults running NE-SW and NW-SE.

- 30 -
Figure 10 Major faulting in Albania(Aliaj, 2007)
A fault analysis was undertaken on the Verniku West Kapshtica deposits. Faults were located by
assessing large vertical shifts in the ore zone between drill holes. North-south and east-west cross-
section of the deposit were created to perform the analysis and these are attached in Appendix C.
Figure 11 below is a plan view of Verniku West showing the main faults identified.

- 31 -
Figure 11 Plan of Verniku West - faults in red, possible faults in blue & vertical displacements in yellow (see Appendix C)
There are two major faults through the Verniku West deposit. Both a steeply dipping and are
perpendicular to each other (as shown above in Figure 11). However, it is important to note that it is
not possible to identify the exact location of the faulting due to the large space between the
drillholes. A potential fault was also identified across the southern portion of the deposit. More
drillhole data in the area is required before this fault can be confirmed.
Figure 12 below shows the faulting for the Kapshtica deposit.

- 32 -
Figure 12 Plan of Kapshtica - possible faults in blue and vertical displacements in yellow (see Appendix C)
4.6 Resource Statement The JORC code states the following for an “Indicated” resource classification:
“An ‘Indicated Mineral Resource’ is that part of a Mineral Resource for which tonnage,
densities, shape, physical characteristics, grade and mineral content can be estimated with a
reasonable level of confidence. It is based on exploration, sampling and testing information
gathered through appropriate techniques from locations such as outcrops, trenches, pits,
workings and drillholes. The locations are too widely or inappropriately spaced to confirm
geological and/or grade continuity but are spaced closely enough for continuity to be
assumed” (Joint Ore Reserves Committee (JORC), 2004)
The Devolli project is an ‘Indicated’ resource and cannot be classified ‘Measured’ resource for
several reasons. The first is the spacing of the drillholes. The average spacing of the drillholes is
80m and while this is sufficient to give an estimate of grades, they are too distantly spaced to
confirm grade continuity. This also applies to geological continuity, particularly in the fault zones.
Further reason for concern is the source of the drillhole data. More than half of the drillhole data is
historical derived from work undertaken by the Albanian Geological Survey over 4 decades ago. This
would indicate a potential quality assurance issue for these drillholes. The final reason for caution is

- 33 -
the lack of reliable survey data. Without accurate information on the deviation of the drillholes, the
ore body cannot be accurately modelled.
Table 3 below gives JORC compliant resource estimation for the Devolli Nickel Project.
Table 3 Resource Statement for Devolli Nickel Project with cut-of-grade of 0.5% Ni
Category Tonnage (Mt) Ni (%) Ni (t) Co (%) Fe (%)
Verniku West Indicated 24.8 1.12 278,000 0.04 20.57
Kapshtica Indicated 23.9 1.14 274,000 0.04 28.27
Total Indicated 48.7 1.13 552,000 0.04 24.35
The grade-tonnage curves for Verniku West and Kapshtica deposits are below in Figure 13 and Figure
14 respectively. Also, the mineral zone tonnage verse cut-of-grade curve for each deposit are
presented in Figure 15 and Figure 16.
Figure 13 Grade-tonnage curve for Verniku West deposit

- 34 -
Figure 14 Grade-tonnage curve for Kapshtica deposit
The grade-tonnage curves for both deposits are quite similar. Most of the Verniku West deposit
contains a nickel grade of 0.5% Ni or over. Kapshtica, on the other hand, is approximately 20%
smaller with a cut-of-grade of 0.5% Ni. With a cut-of-grade of 1.0% Ni, both deposits are around
60% of their original size. Once the cut-of-grade reaches 1.5% Ni, only 10% of each deposit is
minable. Based on these curves, it can be expected that the mine cut-of-grade will be between 0.5%
and 1.0% nickel.
More importantly for the selection of the processing method, is the tonnage and average grades of
the different ore zones; limonite, transition and saprolite. The grade tonnage curves for each
deposit has been split into the three zones and are shown below in Figure 15 and Figure 16.
Figure 15 Grade- tonnage curve for Verniku West by mineralized zones

- 35 -
Figure 16 Grade-tonnage curve for Kapshtica by mineralized zones
From Figure 15, approximately 60% of the Verniku West deposit is saprolite. The remaining 40% of
the deposit is split evenly between the limonite and transition ore. Between cut-of-grades 0% Ni
and 1.0% Ni, all three mineral zones have a similar average grade of around 1.2% Ni.
The Kapshtica deposit (Figure 16) contains similar amount of saprolite and limonite, around 40%
each. The remaining 20% is transition ore. Similar to the Verniku West deposit, the average nickel
grades between each of the zones is close in range between cut-of-grades of 0% and 1.0% nickel.
More grade-tonnage curves are attached in Appendix D.

- 36 -
5 Mining
The Devolli deposit consists of two separation ore bodies – Verniku West and Kapshtica. The mining
part of the project consists of all plant and equipment to exploit the mineral value from the deposit.
Mining is then followed by the raw handling system and then processing where the ore removed is
upgraded to a saleable product. In this section, the geotechnical properties of the ore and the
surrounding rocks are analysed; different mining options are discussed in brief and then ranked
based on suitability for the Devolli project; and finally the design details for the mining methods
selected are presented.
5.1 Geotechnical
A limited amount of geotechnical testing has been carried out by Germany company MonTec GmbH.
An existing adit system of the Bilishti mine was located in the Verniku West area and was re-opened
to acquire preliminary geotechnical data. Testing was conducted by the University of Bochum
however not all testing could be completed due to insufficient quantities of ore samples.
The total geotechnical data supplied by European Nickel for this study consisted of:
A sketch of the geological map of the Devolli area;
RQD values for 16 boreholes;
Photographs of core samples from drillhole AN-16; and
Laboratory test results on core samples from drillhole AN-61.
The laboratory tests properties measured were tensile, uniaxial compressive and triaxial compressive
strengths. From these results, estimates for strength parameters such as Mohr-Coulomb cohesion
and friction angle, slake durability, uniaxial and triaxial compressive strength, Young’s modulus and
Poisson’s ratio were calculated. Table 4 below gives a summary of some of the main findings.
Table 4 Sample of geotechnical results
Mineral Zone UCS (MPa) RQD RMR
Conglomerate 60 75% 41-60
Ferrous-Nickel 25 45% 21-60
Nickel-Silicates 33 45% 21-60
Serpentinite 21 60% 21-40
Additional geotechnical has not been performed since the previous feasibility study(PWK Resources,
2010). The recommendation made in this report is that more testing is required, particularly to
determine the ore strength, RQD and RMR. Testing should be performed on a variety of core
samples from both deposits so that a representative estimate of geotechnical parameters can be
calculated.
- 37 -
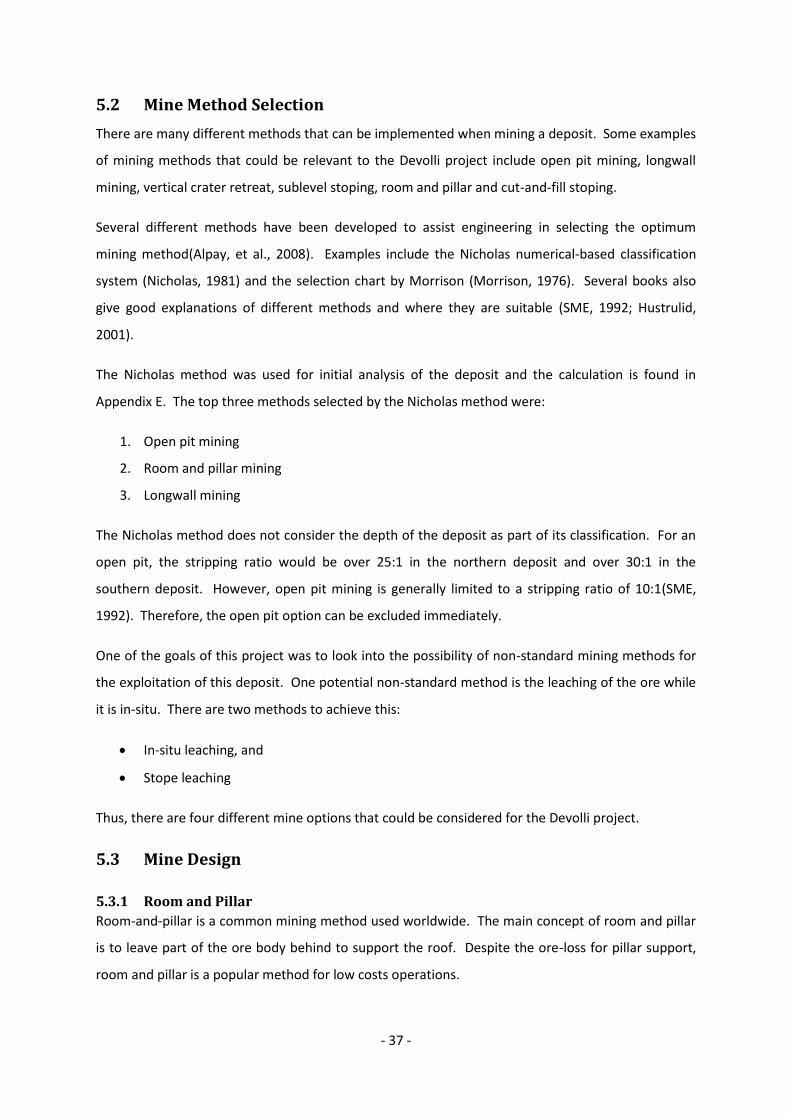
5.2 Mine Method Selection
There are many different methods that can be implemented when mining a deposit. Some examples
of mining methods that could be relevant to the Devolli project include open pit mining, longwall
mining, vertical crater retreat, sublevel stoping, room and pillar and cut-and-fill stoping.
Several different methods have been developed to assist engineering in selecting the optimum
mining method(Alpay, et al., 2008). Examples include the Nicholas numerical-based classification
system (Nicholas, 1981) and the selection chart by Morrison (Morrison, 1976). Several books also
give good explanations of different methods and where they are suitable (SME, 1992; Hustrulid,
2001).
The Nicholas method was used for initial analysis of the deposit and the calculation is found in
Appendix E. The top three methods selected by the Nicholas method were:
1. Open pit mining
2. Room and pillar mining
3. Longwall mining
The Nicholas method does not consider the depth of the deposit as part of its classification. For an
open pit, the stripping ratio would be over 25:1 in the northern deposit and over 30:1 in the
southern deposit. However, open pit mining is generally limited to a stripping ratio of 10:1(SME,
1992). Therefore, the open pit option can be excluded immediately.
One of the goals of this project was to look into the possibility of non-standard mining methods for
the exploitation of this deposit. One potential non-standard method is the leaching of the ore while
it is in-situ. There are two methods to achieve this:
In-situ leaching, and
Stope leaching
Thus, there are four different mine options that could be considered for the Devolli project.
5.3 Mine Design
5.3.1 Room and Pillar
Room-and-pillar is a common mining method used worldwide. The main concept of room and pillar
is to leave part of the ore body behind to support the roof. Despite the ore-loss for pillar support,
room and pillar is a popular method for low costs operations.

- 38 -
Figure 17 below shows the classic room and pillar mining method.
Figure 17 Classic room-and-pillar mining(Hustrulid, 2001)
Room-and-pillar operations are suited for flat-lying tabular ore bodies with a thin ore thickness
(usually less than 10 meters). However, as shown in Figure 17, thicker ore bodies can also be
excavated by working at two levels(Hustrulid, 2001). One consideration of implementing such a
design though is that the pillar in these operations become quite long and there is the risk of
buckling. Therefore, the ore needs to be sufficiently competent to resist buckling during extraction.
When a mine area is completed, the supporting pillars can be partially stripped to increase overall
ore recovery. As a result, the load carrying capacities of the pillars is reduced and the likelihood of
failure and hanging wall collapse increases. In areas where the overlying rock (mine roof) is
sufficiently competent rock, it may be possible to progressively recover entire pillars from the back
of the room to the front. Either of these higher extraction methods can only be used if subsidence is
allowed at the surface.
The Devolli deposit, particularly the southern part, is not flat lying. Thus, if this method was to be
applied successfully, a variation of the classical room-and-pillar would need to be used.
5.3.1.1 Variations of the Room-and-Pillar Method
There are two variations of the classical room and pillar that can be considered for the Devolli
project. The first is the post room-and-pillar mining method as shown in Figure 18.

- 39 -
Figure 18 Post room-and-pillar mining(Hustrulid, 2001)
The post room-and-pillar method uses backfill to lift the footwall and can be used for mining ore
bodies with dips up to 55 degrees(Hustrulid, 2001). This is different in ideology to a cut-and-fill
operation where backfill is used to support the hanging wall. In post room-and-pillar methods, the
backfill also supports the base of the pillar so that the risk of buckling is reduced. This also means
that thicker ore bodies can be exploited if the ore is not sufficiently competent. Since most of the
pillar is buried in the backfill, it cannot be recovered using the methods mentioned previously and
this ore is permanently lost.
The second variation of the classical room-and-pillar method that could be considered is the step-
room mining system (Figure 19).
Figure 19 Step-room mining(Hustrulid, 2001)

- 40 -
The step-room mining method is an alternative to the classical room-and-pillar method to extract
ore bodies dipping up to 30 degrees. Special cross-cut adits are developed as shown in Figure 19 so
that the mine vehicles are able to move to different levels.
5.3.1.2 Pillar Calculations
Preliminary pillar calculations were performed using the tributary area method as shown below in
Figure 20. Due to insufficient rock strength data, the Lunder and Palkanis (1997) formulas were used
to estimate the pillar strength (Brady, et al., 2004). The preferable method of estimating rock
strength is Salamon and Munro (1967) as it is more suited to softer rock conditions.
Figure 20 Tributary area calculation for pillars(Brady, et al., 2004)
The ore body changes depth as does the terrain above so not all of the rooms are at the same
depth. For each room, depth was measured and using this value, the extraction ratio was calculated.
The depths in the northern deposit ranged from 74m to 320m which equated to recoveries ranging
from 54% to over 80%. The southern deposit which is deeper has expected recoveries from less
than 20% in the deepest rooms to approximately 50% in the shallower ones. The recovery
calculations for all of the rooms are attached in Appendix F.
A standard height of 4m was used as the basis of the room height and the room width of 3m. This
gave an ideal height to width ratio within the room for support and was sufficient space for mine
vehicle access. The additional lifts were set at 2m each. This was to allow flexibility in the number of
lift whilst leaving sufficient space for the excavation and backfilling to be completed.
5.3.1.3 Room Modelling in Surpac
To develop a more accurate estimate of the Devolli reserve, software was written in Visual Basic for
Applications (VBA) in Microsoft Excel. In a spreadsheet form, mine details such as number of pillars
along and across, room and pillar dimensions and barrier dimensions are entered. 3D DTM files of

- 41 -
the pillars and the room space were automatically created for a variety of angles. Figure 21 below is
of a 12 by 8 pillar room inclined at 0 deg and 10 deg.
Figure 21 Room-and-pillar room automatically generated - Plan view (top-left), elevation (top right) and isometric view of pillars and the mined area (bottom left and right respectively)
The mined room created with the software is a single valid solid. This is used with the block model
to determine the grade and tonnage that can be exploited from this room. Appendix G shows the
input screen for creating the room-and-pillar Surpac solid.
5.3.1.4 Mine Modelling in Surpac
The extension of modelling a single room was to model the entire mine as a collection of rooms.
Figure 22 below shows the full room and pillar mine for Verniku West and Kapshtica.

- 42 -
Figure 22 Room and pillar design for Devolli project
Full-sized rooms are 125m across by 250m long. Barrier pillars of 8 times the room height are
between each room as recommend by Brady, et al. (2004). The mine is separated into rooms for
several reasons. The first is for safety. If the hanging wall starts to collapse in one room, there is the
possibility of the collapse propagating throughout the mine. The barrier pillars prevent this from
occurring room to room. Barrier pillars also provide extra support for the nearby room pillars. This
disadvantage of barrier pillars is the loss of ore.
Because all of the room and pillar dimensions were stored in Excel and the mines could be
automatically generated, this made it possible for the mine design to be optimized. The rooms were
initially set up spatially and given nominal inclination angles. The design was then varied by creating
slightly different combinations of changes in the elevation, inclination angle across and the
inclination angle along the room. The combination that gave the highest grade was selected and the
process started again. Once the optimum mine was found, an additional level was added. This is
because the mining method is post room-and-pillar and so the overall extraction height grows with
each layer of backfill. This was then also optimised. In the northern deposit, the three additional
raises were designed. In the southern deposit, up to 8 additional lifts were designed because of has
the thicker ore body. To create the grade-tonnage curves and find the optimum room position, over
5000 different possible mines were constructed, validated and assessed using the block model.
5.3.1.5 Grade-Tonnage Curves
There are two different grade tonnage curves presented. The first (Figure 23) is for an inclined
room-and-pillar design where backfill has not been used. The second grade tonnage curve in Figure
24 is for a post room-and-pillar mine. Additional grade tonnage curves split by deposit are attached
in Appendix H.

- 43 -
Figure 23 Grade-tonnage curve for room and pillar method
Figure 24 Grade-tonnage curve for post room-and-pillar
The reserve size using room-and-pillar is approximately 8Mt with an average grade of 0.7% nickel if
every room is mined. The reserve size using post room-and-pillar is over 14Mt, an increase of over 6
Mt or 75%. To increase the reserve size by 6Mt, the same amount of backfill is required as shown in
the figure. However, the increased reserve size also has a lower average grade with a reduction
from 0.7% nickel in room-and-pillar to 0.52% in post room-and-pillar. As the cut-of-grade increase,
the difference between the two methods reserve size and the cut-of-grade decreases.
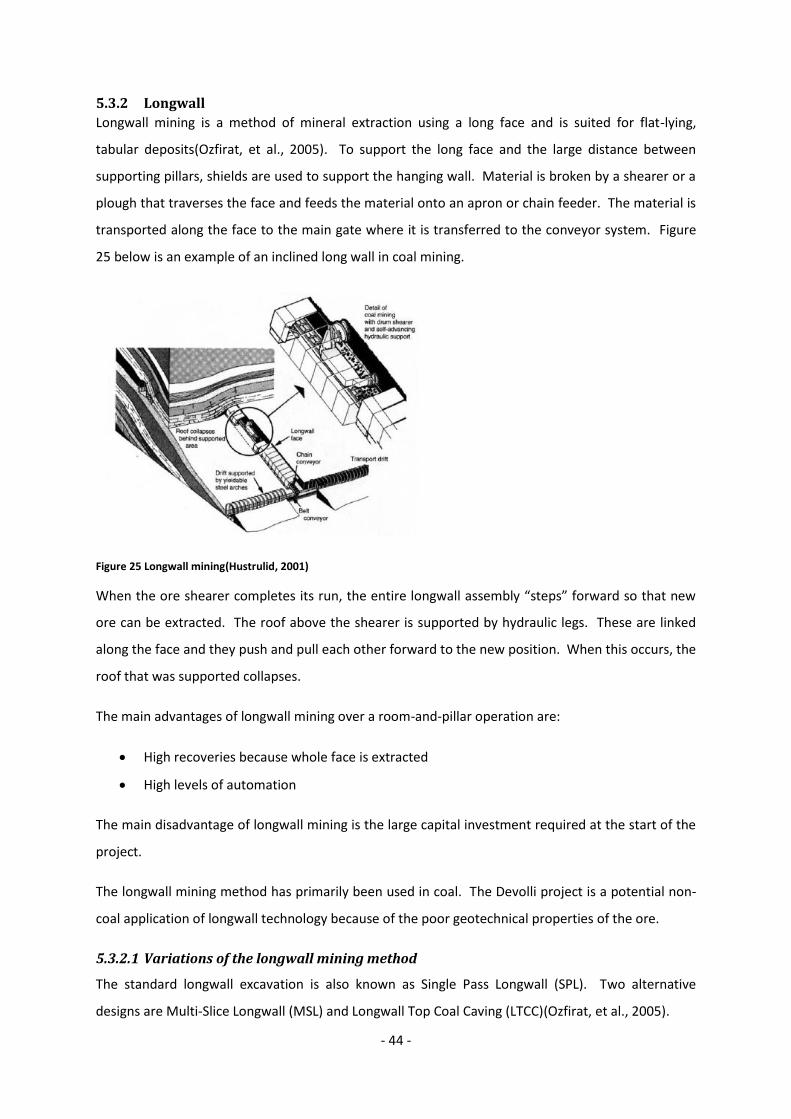
- 44 -
5.3.2 Longwall
Longwall mining is a method of mineral extraction using a long face and is suited for flat-lying,
tabular deposits(Ozfirat, et al., 2005). To support the long face and the large distance between
supporting pillars, shields are used to support the hanging wall. Material is broken by a shearer or a
plough that traverses the face and feeds the material onto an apron or chain feeder. The material is
transported along the face to the main gate where it is transferred to the conveyor system. Figure
25 below is an example of an inclined long wall in coal mining.
Figure 25 Longwall mining(Hustrulid, 2001)
When the ore shearer completes its run, the entire longwall assembly “steps” forward so that new
ore can be extracted. The roof above the shearer is supported by hydraulic legs. These are linked
along the face and they push and pull each other forward to the new position. When this occurs, the
roof that was supported collapses.
The main advantages of longwall mining over a room-and-pillar operation are:
High recoveries because whole face is extracted
High levels of automation
The main disadvantage of longwall mining is the large capital investment required at the start of the
project.
The longwall mining method has primarily been used in coal. The Devolli project is a potential non-
coal application of longwall technology because of the poor geotechnical properties of the ore.
5.3.2.1 Variations of the longwall mining method
The standard longwall excavation is also known as Single Pass Longwall (SPL). Two alternative
designs are Multi-Slice Longwall (MSL) and Longwall Top Coal Caving (LTCC)(Ozfirat, et al., 2005).

- 45 -
The SPL method has been used for many years and shearers are reaching heights of over 4m. Some
of the design issues with constructing taller machines to extract thicker deposits are handling the
logistics of larger and heavy equipment, the support and stability of the footwall and face conditions.
Figure 26 below is an elevation sketch on a SPL operation.
Figure 26 Single Pass Longwall method – mine direction to the left of the page(Ozfirat, et al., 2005)
Multi-slice is a longwall method to extract thicker ore bodies. An example of the MSL method is
shown below in Figure 27.
Figure 27 Multi-Slice Longwall method - mine direction to the right of the page(Ozfirat, et al., 2005)
As shown in Figure 27, the ore panel is mined from top to bottom. In this example, there are two
panels of 2.8m thickness each being extracted and a planned third slice. A wire mesh is installed on
the hydraulic legs to prevent rocks falling through the shield. A thin layer of ore is left between
levels to act as an artificial roof.
The final variation of the longwall mining mentioned is longwall top coal caving and a sketch of the
process is shown below in Figure 28.

- 46 -
Figure 28 Longwall Top Coal Caving method
LTCC is similar to the SPL method in that the ore is mined in one pass. The difference between the
methods is that LTCC is equipped with a second feeder behind the support shields to gather caved
ore in the gob. The LTCC is a much simpler process than MSL because it only travels through the ore
once and there is no need for the wire mesh on the shears. It is reported that the MSL method is up
to twice as expensive as LTCC because of the large amount of labour required to fix and maintain the
wire mesh over the shields(Ozfirat, et al., 2005).
The single pass longwall will be used on the Devolli project with feasibility calculated for 2m, 3m and
4m extraction heights. The LTCC will also be costed for Devolli project will extraction heights of 5m,
6m, 7m and 8m.
The cutting tool on the reciprocating travel head can either be a shearer or a plow. Table 5 below
shows the major differences between the two excavation tools.
Table 5 Shearer and plow properties(Myszkowski, et al., 2010)
The Devolli deposit is classified as a thick ore body when considering a longwall system. For this
reason, the shearer will have to be used so that the most ore is regained. Table above outlines some
important design criteria such as maximum angles and how well the longwall can track the ore body.

- 47 -
5.3.2.2 Panel calculations
The basic layout of a longwall panel is shown below in Figure 29.
Figure 29 Layout of longwall panel in plan
The adit running vertically in the drawing is the main access adit. Material and men enter the
longwall workings through here. It is also along this adit that other panels like this one are
connected. The U-shaped adit around the longwall mining area is constructed first. Structural
support in this area is achieved using steel ribs spaced at 1.5m. The longwall is set-up in the adit first
and then the steel supports are gradually replaced with the longwall shields(Chase, et al., 2006).
Barrier pillars are required between longwall panels for structural support(Brady, et al., 2004). The
barrier pillars shown here are only half-barriers since the panel above and below will also have the
same barrier.
5.3.2.3 Longwall panel modelling in Surpac
Similar to the room-and-pillar design, software was written in Visual Basic for Applications (VBA) in
Microsoft Excel for the automatic creation of long wall panels. Primary dimensions such as adit
height and width, extraction height, longwall panel length and panel width are entered into the
spreadsheet. Angles of extractions and the longwall angles can be adjusted and Surpac 3D dtm files
of the longwall panel will be created. Figure 30 below gives an example of a longwall that has been
automatically created using the code written for this project.
Figure 30 Longwall mine panels created. ±10 deg extraction angle (left) and 10 & 20 deg longwall angle (right)

- 48 -
The longwall model is created as five valid solids as follows:
The longwall mine volume (light blue in Figure 29)
A combined solid of the main access and the U-shaped adits around the longwall mine
volume (dark blue in Figure 29)
A barrier pillar around the U-shaped adits (all barrier pillars are brown in Figure 29)
A barrier pillar along the access adit on the other side of the longwall
A barrier pillar between the access adit and the longwall mine volume. This barrier pillar is
required so that the access adit is structurally stable and can be kept open for the next
panel.
The longwall mine volume can have a different height to the adits so that different sized longwall
machines can be modelled. By using the block model and the longwall mine volume solid, the grade
and tonnage of the ore contained can be calculated. Appendix G shows the input screen for creating
longwall Surpac models from Excel.
5.3.2.4 Longwall mine modelling in Surpac
The longwall panel builder tool described above was expanded so that the entire mine could be
created using Excel. The longwall panel design for Verniku West and Kapshtica are shown below in
Figure 31.
Figure 31 Longwall designs for Verniku West (left and centre) and Kapshtica (right)
There are two different designs proposed for the Verniku West; an approximately N-S aligned
longwall and another design perpendicular in an approximate E-W direction. Only the longwall mine
volumes have been shown for clarity.

- 49 -
The longwall panels are 100m wide and this was chosen for ease of design. The length of the
longwall machine is 60m after space required for the adits and the barrier pillars as recommend by
Brady (2004) is accounted for. Panels range from 200m to 600m in length.
Because all of the longwall panel dimensions were stored in Excel and the mines could be
automatically generated, this made it possible for the mine design to be optimized. The panel were
initially set up spatially and given nominal inclination angles manually. The design was then varied
by creating slightly different combinations of changes in the elevation, inclination angle of
excavation and the inclination angle of the longwall miner. The combination that gave the highest
grade was selected and the process started again. Once the optimum mine was found, the thickness
of extraction was increased and the process re-started. Over 8000 different possible mines were
constructed in order to find the optimum solution.
5.3.2.5 Grade-tonnage curves
The grade-tonnage curves for longwall mining are shown below in Figure 32 and Figure 33. There
are two sets of curves because there were two different mine designs for the northern deposit; a
north-south (NS) design and an east-west (EW) design.
Figure 32 Grade-tonnage curve for longwall mining (northern deposit with north-south oriented longwall panels)
The tonnage difference between the various longwall size options has a large range of reserve sizes
with no cut-of-grade as would be expected. As the cut-of-grade increase, the difference between
the options decreases. After a cut-of-grade of 1.0% Ni, all of the options are within a 1Mt bracket.
The average nickel grades with a low cut-of-grade and a high cut-of-grade are clearly separated. For

- 50 -
cut-of-grades between 0.5% Ni and 1.2% Ni, the average grade between the options is mixed and it
is not clear which option has the highest or lowest average grade.
Figure 33 Grade-tonnage curve for longwall mining (northern deposit with east-west oriented longwall panels)
The greatest difference between the two grade-tonnage curves is the reserve size. An 8m high
longwall extraction with the northern deposit designed orientating north-south has a reserve size of
approximately 19Mt (no cut-off-grade). The equivalent reserve size if the longwall panels are
designed east-west is only 15Mt; a different of 4Mt of ore. The main reason for this is the
limitations of the extraction angle as specified by Bucyrus (Table 5 above). The northern deposit has
a dip of up to 30 degrees along the edges and this is too steep to be mined with the longwall mining
system selected.
5.3.3 Stope Leaching
Stope leaching is the in-situ leaching of the ore from underground workings. There have been some
trials in the copper industry to use stope leaching however there are no currently operating facilities
using this method as their primary extraction technique. Stope leaching has not been tested in
either a sulphide or laterite nickel deposit so there is no historical cases to draw upon in the design
of this system. The use of stope leaching in the Devolli project as the main extraction method
constitutes a significant technical risk to the success of the project.
The mining method has a similar design to conventional stoping method. Cross-cuts are constructed
above and below the stope being mined. In conventional stope mining, the stope is blasted and
mucked from the base adit. Stope leaching, the under-cut is lined with concrete and a channel is

- 51 -
constructed along the floor for the leach solution to flow through. The roof is then blasted and the
rock caved into the undercut. Injection wells are drilled in the blasted zone from adit above the
stope and leach solution is pumped through the stope where it is collected in the undercut and
drains to a central collection point. The blasting needs to be sufficient so that the ore fragments and
the leach solution can extract the nickel. The success of blasting is dependent on the blast design
and the geotechnical properties of the ore. The processing for a stope leaching facility is discussed
in more detail in the processing section of this report (Section 7.6).
Stope leaching is not recommended as the primary mine method for the Devolli project. Where
stope leaching may be useful is in the south of the Kapshtica deposit where the ore shape and depth
of the deposit makes room and pillar or longwall mining extremely difficult and associated
recoveries very low. Stope leaching can also be used in locations that are difficult to access via
traditional methods.
5.3.4 In-situ Leaching
In-situ leaching is the leaching of valuable minerals from in-situ ore from the surface. There is no
such mining involved with in-situ leaching; only drilling of injection and recovery wells. In-situ
leaching is discussed in more detail in the processing section of this report (Section 7.5).
5.4 Mine Equipment
5.4.1 Room-and-pillar mining
The room-and-pillar mining will be performed using a drill, blast and muck system. LHDs will muck
the ore from the room and will either transport the material to a conveyor or to underground rear-
dump trucks. If backfill is being used, LHDs will also be used to place and compact the fill.
Development drives will also be constructed using the same system. The number and size of the
jumbos, LHDs and rear dump trucks has been automatically calculated in the cost model as
described below.
5.4.2 Longwall mining
Longwall mining will be performed using a single shearer longwall miner. For extraction heights up
to 4m, a single-pass longwall method is used and the standard longwall machine will be employed.
When extraction over 4m is required, a LTCC system is required. Although designed originally for
coal, it is anticipated that the LTCC will work with the nickel laterite in Devolli. This should be
discussed and confirmed with the OEM.

- 52 -
5.5 Mine Scheduling
Both the longwall and room-and-pillar methods selected have been designed to detailing the sizes
and shapes of panels and rooms respectively. The longwall mining system has only one extraction
unit so panels will be mined progressively one at a time. The panels will be mined starting with the
Verniku West deposit with panels extracted in order from south to north followed by the Kapshtica
deposit with the panels removed from east to west. Because there is only one unit, selective mining
is not possible and the longwall system can only produce a single mixed mine project.
Room-and-pillar mining is more flexible that longwall mining and allows selective mining to be
performed. Both the north and south deposits will be mined at the same time extracting rooms
outwards from the based on the access adit. Anywhere between 3 and 6 rooms may be operational
at one time depending on the number of products and the number of haulage systems to the
surface. If backfill is being used, the southern deposit will be need to be extracted earlier since most
of the backfill is required there.
5.6 Cost Modelling
A cost model was constructed to cost each of the different mining options. In total, there are seven
different mining scenarios as described below in Table 6.
Table 6 Mining cost model options
Code Description Backfill? Number of Products
No of transport systems to surface
1RP1 Room-and pillar-mining N 1 1
1PP1 Post room-and-pillar mining Y 1 1
1LW1 Longwall mining N 1 1
2RP1 Room-and pillar-mining N 2 1
2PP1 Post room-and-pillar mining Y 2 1
2RP2 Room-and pillar-mining N 2 2
2PP2 Post room-and-pillar mining y 2 2
The cost for each options are constructed as follows:
Number of products
Two letter code for mining options
o RP – room-and-pillar
o PP – Post room-and-pillar
o LW – longwall
Number of transportation systems to the surface

- 53 -
The number of transportation systems is an important parameter because it defines how the
different mine products are sent to the surface. If there are two mine products but only one
transportation system, the mine produces one product for a number of shifts and then the other
product for a specific period of time. This affects the efficiency of the underground operation.
To cost each of the options, the mine was broken into main cost categories. Each cost category was
assigned a letter code as follows:
RDT – read-dump trucks
LHD – load, haul and dump trucks
DRL – drill rigs and jumbos
LWM – longwall machine and accessories
CVS – conveyors
UTE – utility vehicles
DMP – dump and backfill
VNT – ventilation
Each cost category has two separated sheets in the cost model. This first sheet, named with the cost
category code, contained the calculations and CAPEX and OPEX estimate for all the mine options.
The second sheet (named by the cost category code and the letter “i” for inputs) contained all of the
input information relating to that cost category.
The cost model is attached in full in Appendix I.

- 54 -
6 Raw Ore Handling
The raw handling system consists of the equipment, plant and personnel to transport and size
primary raw ore from the run-of-mine to the processing plant area.
The purpose of the raw ore handling system is to
Transport ore from the run-of-mine underground to the process plant
Crush ore to appropriate size for further handling and processing or sale
Provide buffer between independent systems using stockpiles to account for variations in
availability and production rates
6.1 Options
There are numerous options to achieve the above criteria. This includes the method of
transportation to surface, the number of product streams, use of a mine and/or sized stockpile and
shifting to an alternative transportation method mid-process. Figure 34 below is an example of one
of the potential options.
Figure 34 Example of a raw material handling option
The raw product transportation option, shown in Figure 34 above, has the following features:
Two mine adits with one containing the underground to surface conveyor
A mine stockpile to separate the mine production from the crushing circuit
An overland conveyor to the crushing circuit and then sized stockpile
Dump truck stacking onto the heap leach pad

- 55 -
In total, there are 32 different transportation options when considering number of products and
processing options. Each option has a unique code. The example option in Figure 34 has the code
“1Phl2A CVmsssTR”. The code gives many details about the option and is constructed as follow:
The first 6 digits is made up by:
o Number of products (1 or 2) + “P”
o Two letter code for processing option
“no” – Null processing
“hl” – heap leach processing
o Number of Adits (1 to 3) + “A”
The second part of the code is open length and contains the following codes in order of
when they appear in the process flow
o “CV” – conveyor transportation
o “TR” – trucks
o “ms” – mine stockpile
o “ss” – sized stockpile
Using the system described, the code in Figure 34 “1Phl2A CVmsssTR” can then be read as the
option with 1 product using heap leaching and 2 adits – conveyors with mine and sized stockpiles
followed by trucks.
The process flow diagram (PFD) for each of these options, an index of the codes and key of symbols
used is found in Appendix J. Figure 35 below gives an example on how the different options are
connected.

- 56 -
Figure 35 Raw material handling options
The transportation of the ore can be broken into several distinct sub-areas:
Run-of-mine (ROM)
Transportation to surface
Mine stockpiles (optional)
Surface transportation
Material sizing (either a sizing plant or mobile sizing equipment)
Sized stockpiles (optional) and heap leach pad stockpiles.
Each of these sub-areas are described and their purpose explained in more detail below.
6.1.1 Run-of-Mine (ROM)
The ROM is the connection point between the mine and the ore transportation system. Its location
and construction depends on the mining method, mode of underground transportation and/or
mode of surface transportation.
Run-of-mine
LOCATION
Underground
Mobile Sizing Equipment
Near Mine
Access
Between
Mine Access
& Processing
Plant
Conveyor/s
Conveyor/s
Haul Trucks
Haul Trucks
Processing
Plant Dump Stacker/s
Conveyor/s
Haul Trucks
Intermediate Raw Stockpile
Sizing Plant
Sized Stockpile
Conveyor/s
Conveyor/s
RAW HANDLING OPTIONS

- 57 -
In the case of longwall mining with conveyors to the surface, there is no ROM as material is
transported directly from the cutting face to the surface. For this study though, the ROM is
considered to the loading point of the underground to surface conveyor/s.
For other mining methods where transport through the mine is achieved using dump trucks and
then loaded onto conveyors for transportation to the surface, the ROM is the dump point. At this
location, single-dimension primary crushing is usually done and the material is loaded onto the
conveyors.
The ROM of a truck-only mine is where loading occurs. For the cost estimate, only infrastructure to
the base of the adit has been included.
6.1.2 Transportation to Surface and Surface Transportation
There are two transportation methods considered in this study for bringing material from
underground to the surface. These are troughed conveyors and underground haul trucks.
The option of a single mine product or two mine products should be considered. For a two product
mine, the troughed conveyors can be either organized as two separate systems or as a single system
with shift-based product supply. The use of two separate systems to the surface requires three
adits; two conveyor adits and one main access. For a single mine product or shift-based
transportation of two products, a single conveyor system with two adits is required.
Transportation once on the surface can be achieved by:
continuing the use of the underground haul trucks;
transferring material onto surface conveyors either via transfer chute or stockpiles
transferring to surface haul trucks using stockpiles
6.1.3 Mine Stockpile (optional)
The mine stockpile is a temporary ore storage site located in close vicinity to the access point of the
mine. The mine stockpile provides a buffer between the mine and the sizing and processing plant
hence delays or stoppages in the mine or the plant do not impact on the operation of the other.
Conveyors are continuous systems with a fixed maximum capacity. Different mining methods with
identical average capacities can have vastly different peak capacities. For instance, longwall mining
can produce peak loading capacities at twice the average rate. The use of a mine stockpile
smoothes out these peak loads. Without the mine stockpile, the conveyors and sizing equipment
after the stockpile need to be designed large enough to support the peak load from the mine. By

- 58 -
using a mine stockpile, the equipment only needs to be sized for average loading conditions and is
smaller and therefore less expensive.
If the mine utilises underground haul trucks, a mine stockpile is beneficial if there is a considerable
distance between the portal and the processing plant. In this way, underground haul trucks can
operate almost exclusively underground and surface vehicles can be used for the remaining
transportation.
Material can be reclaimed from the raw stockpile using chain feeders onto conveyors or truck and
shovel.
6.1.4 Material Sizing
Part of the raw handling system requires the sizing of ore. The output size requirement depends on
the mineral processing method and the ease of material handling. For example, a high pressure acid
leaching (HPAL) plant requires the ore to be ground before being fed into the autoclaves. Fine
particles are extremely difficult to handle, specifically in stockpiling and reclaiming, so the ore will be
sized to approximately 50mm. Heap leaching, on the other hand, requires a stockpile feed size of
8mm. In the conveyor system, the ore is sized using between one and three transfer stations
containing crushers and screening equipment. For the haul truck system, sizing is performed by
mobile sizing units.
6.1.5 Sized Stockpile (optional)
The sized stockpile is located directly after the sizing circuit. For heap leaching, a sized stockpile is a
buffer between the sizing equipment and the stacking equipment. Thus, the downtime of one set of
equipment will not impact on the other set.
Automated stacking equipment for the heap leach pad represents a large capital investment.
Instead of using these, the cheaper capital option of trucks can be utilized. A sized stockpile is then
required in order that the trucks can be loaded by front-end loaders.
6.1.6 Heap Leach Pad Stacking
The final stage in the raw ore material handling process is stacking at the process plant. This can be
achieved in either of two ways; using large automated stacking equipment or using trucks and
dozers. The heap leach stockpile, depending on the mineral type, needs to be extremely large as ore
may need to be leached for up to 300 days. To use automated stacking equipment, the heap leach
pad is two modules wide with a centre line conveyor. The stacking machine travels along one side of
the conveyor, turns at the end and then stacks the opposite side. Sufficient space is required for the
stacker turnaround at each end of the pad.
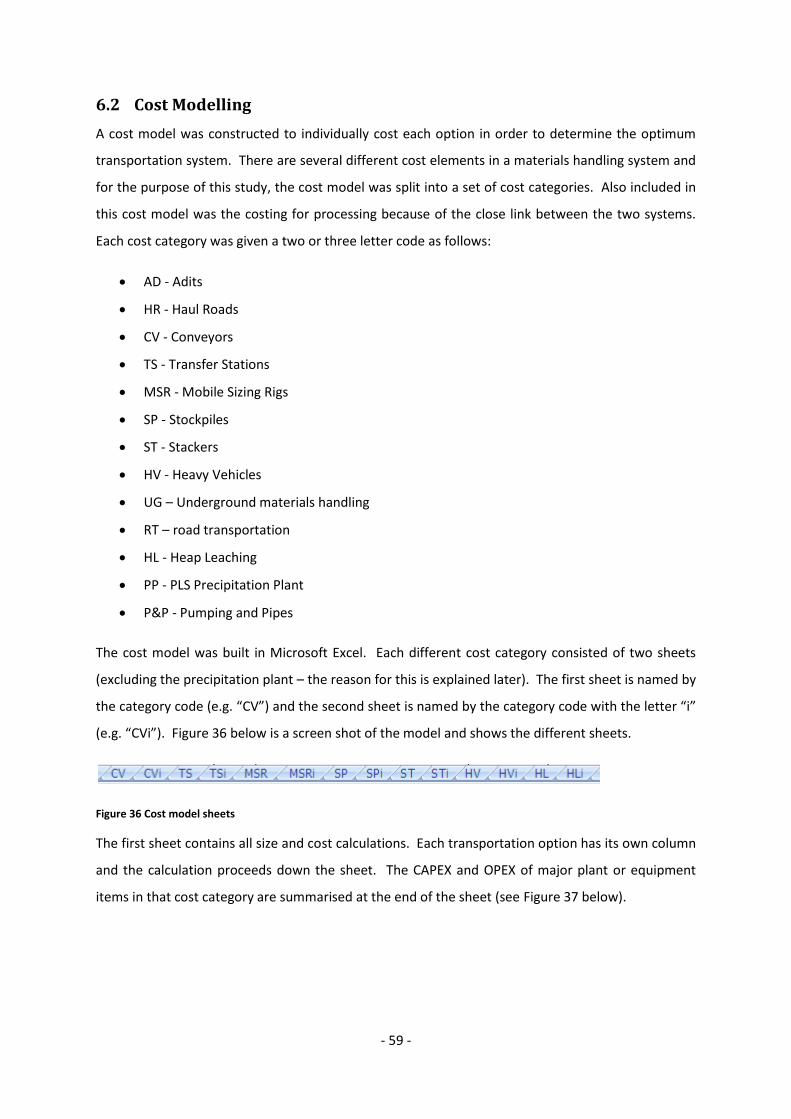
- 59 -
6.2 Cost Modelling
A cost model was constructed to individually cost each option in order to determine the optimum
transportation system. There are several different cost elements in a materials handling system and
for the purpose of this study, the cost model was split into a set of cost categories. Also included in
this cost model was the costing for processing because of the close link between the two systems.
Each cost category was given a two or three letter code as follows:
AD - Adits
HR - Haul Roads
CV - Conveyors
TS - Transfer Stations
MSR - Mobile Sizing Rigs
SP - Stockpiles
ST - Stackers
HV - Heavy Vehicles
UG – Underground materials handling
RT – road transportation
HL - Heap Leaching
PP - PLS Precipitation Plant
P&P - Pumping and Pipes
The cost model was built in Microsoft Excel. Each different cost category consisted of two sheets
(excluding the precipitation plant – the reason for this is explained later). The first sheet is named by
the category code (e.g. “CV”) and the second sheet is named by the category code with the letter “i”
(e.g. “CVi”). Figure 36 below is a screen shot of the model and shows the different sheets.
Figure 36 Cost model sheets
The first sheet contains all size and cost calculations. Each transportation option has its own column
and the calculation proceeds down the sheet. The CAPEX and OPEX of major plant or equipment
items in that cost category are summarised at the end of the sheet (see Figure 37 below).

- 60 -
Figure 37 Cost model example showing CAPEX and OPEX totals
As seen in Figure 37, each row contains an explanation field which usually contains information such
as the corresponding sheet containing input data or the formula for the calculation. Each option has
a code designated to it.
The second sheet contains all of the input information for that category. This included sizes,
assumptions, CAPEX and OPEX information and any other miscellaneous information required.
The “Participation Plant” required an extra sheet named “PPc” – short for chemistry. This sheet
contains process formulas that calculate the process flow and recoveries.
The cost model is attached in full in Appendix I.

- 61 -
7 Processing
Processing follows from the raw handling system and includes all plant and equipment up to product
backing and waste/tailings handling. In this section, the different processing options for nickel
laterites are discussed in brief and are then ranked based on suitability for the Devolli project. The
metallurgy and test work to date have also analysed and the design details for the chosen processing
method is detailed.
7.1 Options
In the late 1940’s, the process research department of Inco gathered different nickel laterite
samples from ten countries worldwide and tested various pyro-metallurgical and hydro-metallurgical
processing techniques on them. The result of the research was that no one process is suitable for all
laterite ore types(Chan, 1998).
Thus, there are a number of varying process methods which are individually suited to different nickel
laterite ore profiles. The different process methods are(Dalvi, et al., 2004):
Direct transportation of ore to another facility (null processing)
Ferronickel and matte smelting (pyro-metallurgical)
High pressure acid leaching (HPAL) (hydrometallurgical)
Caron process (hydrometallurgical)
Enhanced pressure acid leaches (EPAL) (hydrometallurgical)
Atmospheric tank leaching (ATL) (hydrometallurgical)
Heap leaching (HL) (hydrometallurgical)
In-situ/stope leaching(hydrometallurgical)
The different processing options and their suitability for use in the Devolli project are examined
below.
7.1.1 Direct Transportation of Ore
Direct transportation of the ore to another facility is the simplest method of processing. The ore,
once mined, is crushed and sized to a specified limit and then transported via road trucks to the
smelter.
The advantages of this method are:
Minimum on-site dump since all of the ore is transported to another facility
Low CAPEX since expensive processing and stockyard plants are not required
Little technical risk

- 62 -
The disadvantages of this method are:
Heavily reduced revenue per tonne of ore;
As there is no reliable rail network in the project vicinity, all ore would need to be
transported by road trucks. This would make the processing costs dependent on the price of
fuel; and
A poor corporate carbon footprint from running a large fleet of road trucks
For the Devolli project, the main factor that makes this option especially difficult is the lack of good
quality transportation infrastructure and the distance to the nearest nickel smelting plants. There is
no reliable rail system and the closest port is approximately 200km away. The nearest smelters are
in Kosovo and Greece and are both over 300km by road. Additionally, the road infrastructure
around the Devolli area is not of high quality and therefore time spent via transportation by road
trucks will be slow.
The null processing option should not be considered a complete solution for the Devolli project.
Mindoro Resources Ltd, another company looking to develop a nickel laterite mine, is considering
the option of direct shipping of ore while the HPAL plant is being constructed and
commissioned(Mindoro Resources Ltd., 2010). A similar process should be considered for the
Devolli project so that revenue could be sought while the plant is being constructed. This option is
particularly attractive and should be investigated in more depth, in particular if difficulty is
experienced in generating start-up capital.
7.1.2 Ferronickel and matte smelting
Ferronickel and matte smelting use a flow sheet involving drying, calcining and electric furnace
smelting. This process favours low-Fe, high-Ni saprolite ores (Wedderburn, 2009). The process is
very energy intensive since all moisture needs to be removed and the ore must be melted to form a
slag. The difference between matte smelting and ferronickel processing is that sulphur is added to
the feed in matte smelting to form nickel and iron sulphides. Recoveries are very good with 90-95%
of nickel and approximately 50% of cobalt being recovered (Dalvi, et al., 2004).
Advantages of ferronickel and matte smelting are:
produces final product sellable directly to stainless steel manufacturers
high recoveries
Disadvantages of ferronickel and matte smelting are:
restricts the amount of usable Devolli ore
- 63 -
high feed grades required
very energy intensive process
heavy capital investment required
This option has been discounted because the Devolli ore deposit is not suitable in terms of ore type
and average grades for this process and is not large enough to justify constructing a new plant. A
very energy intensive process is also a major project risk considering the frequency of electrical
black-outs in the project area.
7.1.3 Caron Process
The Caron process is essentially a hybrid process that is part hydrometallurgical and part pyro-
metallurgical. It is also known as ammonia leaching and was developed in the 1920’s by Professor
Caron of TU Delft, Netherlands. The process is suitable to process a mixture of both saprolite and
limonite ores, though recoveries do increase with a greater proportion of saprolite (Dalvi, et al.,
2004). Typical recoveries are approximately 80% for nickel and 55% for cobalt (King, 2005).
The advantages of the Caron Process are:
temperatures are lower than required for ferronickel smelting or HPAL so less energy
intensive
can process both saprolite and limonite ores
can tolerate higher Mg values than pressure acid leaching processes.
The disadvantages of the Caron Process are:
still energy intensive
lower recoveries
high reagent costs
The Caron Process was originally developed to process limonitic type ores. However, high energy
demands and low recoveries have restricted the use of the process globally. Internationally, there
are no plans to create a new plant of this type (Wedderburn, 2009). This method of processing has
also been surpassed by other hydro-metallurgical processes in terms of recoveries, capital costs and
operating costs. Therefore, this option should not be considered for the Devolli deposit.
7.1.4 High Pressure Acid Leaching (HPAL)
High pressure acid leaching (HPAL) has been significant researches and refined over the past decade
(King, 2005). Generally, HPAL requires a feed of predominately limonite feed although some
saprolite is acceptable (Dalvi, et al., 2004).

- 64 -
The advantages of HPAL are:
high recoveries;
can produce intermediate hydroxide products; and
similar operating costs compared with atmospheric leaching and heap leaching
(Wedderburn, 2009).
The disadvantages of HPAL are:
higher capital expenditure compared with atmospheric leaching and heap (Wedderburn,
2009);
suitable for low amounts of saprolite in feed. This greatly reduces the amount of Devolli ore
that can be processed;
still a high technical risk since other projects have failed to achieve design capacities and
recoveries (King, 2005);
higher energy requirements compared with atmospheric leaching and heap leaching for
heating and pressure; and
Tailing dump required.
The greatest disadvantage of this option is the large technical risk involved. This processing option
has been implemented at numerous nickel laterite sites and plants have failed to perform inline with
initial predictions.
There are other disadvantages of this process such as high energy requirements and that it can only
treat a fraction of the deposit. It is for these reasons high pressure acid leaching is not as an
attractive solution compared to alternatives for the Devolli project.
7.1.5 Enhanced Pressure Acid Leaching (EPAL)
Enhanced pressure acid leaching (EPAL) as the name suggest is an improvement on the high pressure
acid leaching process. The process has an additional stage where the output of the HPAL system is
re-leached at atmospheric pressure to process further the saprolite in the feed(Dalvi, et al., 2004).
The advantages of EPAL are:
able to process both saprolite and limonite ores
greater recoveries from a mixed feed
able to produce a mixed hydroxide product
The disadvantages of EPAL are:

- 65 -
higher capital cost than HPAL
much higher acid consumption than HPAL and therefore higher operating cost
still a high technical risk since other projects have failed to achieve design capacities and
recoveries
tailing dump required
high energy consumption
Enhanced pressure acid leaching is an attractive option since it can process both saprolite and
limonite ores. However, this advantage is countered by the high capital cost and higher acid
consumption when compared with HPAL. This process, like HPAL, consumes a large amount of
energy which essentially discounts it as a processing option considering the power reliability in
Albania. BHP Billiton, the largest mining company in the world, spent millions of the dollars on its
EPAL plant on the Ravensthorpe Nickel Project(Sharples, 2008). Despite the large investment, BHP
Billiton sold the project to First Quantum for a reduced price due to poor nickel prices and inability
to fully exploit the nickel laterite deposit(WA Today, 2009).
Although EPAL is able to process saprolite and limonite ores, the high acid consumption and large
technical risk removes this process as an option for the Devolli project.
7.1.6 Atmospheric Tank Leaching (ATL)
Atmospheric tank leaching (ATL) is a process that does not require high pressures to be generated as
in HPAL or EPAL. Also known as atmosphere pressure acid leaching (APAL) or atmospheric leaching
(AL), leaching is performed in open air tanks on milled ore feed.
The advantages of atmospheric leaching are:
able to process both limonite and saprolite
process is robust
approximately 80% of capital cost required for HPAL(Wedderburn, 2009)
similar operating costs to HPAL
The disadvantages of atmospheric leaching are:
mineralogy dependent requiring blending of limonite and saprolite
sensitive to iron (Fe) chemistry
high acid consumption
grinding of the ore is required
tailings dump is required

- 66 -
Atmospheric leaching is suitable for the Devolli ore deposit. It can process both limonite and
saprolite ore and is not a heavy energy consuming process.
7.1.7 Heap Leaching
Heap leaching was originally limited to only saprolite ores (Dalvi, et al., 2004) but further test work
has suggested that it is suitable to process both saprolite and limonite ores (GBM, 2008).
The advantages of heap leaching are:
able to process both limonite and saprolite(GBM, 2008)
process far less complex than HPAL or AL (Wedderburn, 2009)
lower capital intensity
does not require grinding of the ore
European Nickel have expertise and experience with heap leaching technology
The disadvantages of heap leaching are:
acid consumption varies with mineralogy (GBM, 2008)
heap permeability is critical (Wedderburn, 2009)
it is sensitive to iron chemistry
Heap leaching is suitable for the Devolli ore deposit. There are numerous advantages to using this
system but the most critical reasons are it can process both limonite and saprolite, it is a simple and
robust process and European Nickel have technical experience with this method.
7.1.8 In-situ/Stope Leaching
In-situ leaching is the leaching of minerals from in-situ ore from the surface. Stope leaching,
similarly to in-situ leaching, is the leaching of in-situ ore. The difference between the two methods
is stope leaching is performed from adits above and/or below the ore body underground as opposed
to from the surface. Neither of these options were considered in the previous study(PWK
Resources, 2010). From a processing perspective, these options are most closely linked with heap
leaching. All of the other processing methods require the grinding of the ore to be performed
before further processing. The high acid leach solution is pumped repeatedly through the ore body
until the acid is consumed. The leach solution would then be further processed and the nickel
extracted in a precipitation plant like the one used for heap leaching.
The main advantages of in-situ/stope leaching are:
leach pad not required

- 67 -
removes the cost of transporting ore to surface and sizing it
only small waste dump required (iron solids from the precipitation plant)
The main disadvantages of this option are:
high technical risk – this method has not been used with nickel laterites before
unknown recoveries
Environmentally, there are positive and negative aspects to this method. Heap leaching pads
require large amounts of sulphuric acid on the surface. This creates an environmental risk of acid
solution entering waterways or the water table if the protection measures are not adequate. In-situ
leaching does not present this particular risk since all leaching is performed underground, however,
it does potentially pose other environmental risks. When in-situ leaching (from the surface) is
utilized, it is critical for there to be an impermeable layer below the ore body and preferably above
as well(Bartlett, 1992). The serpentinite has low permeability because of its wax-like texture but
environmental risks are greater being in a highly seismic area where there are many fractures
through which the leach solution can escape. Perhaps of greater concern than the acid, are the
heavy minerals that are dissolved in the solution. Stope leaching provides greater control to avert
potential losses primarily because the works are in the vicinity of the ore zone being leached,
however, there is still a risk of solution loss to the environment.
7.2 Method Selection
Based on the descriptions above and the comparative difference between the advantages and
disadvantages of each method, the preferential processing methods of mined ore are ranked as
follows:
1. Heap Leaching (HL)
2. Atmospheric Tank Leaching (ATL)
3. Enhanced Pressure Acid Leaching (EPAL)
4. High Pressure Acid Leaching (HPAL)
All four of these options are suitable to process the Devolli ore deposit. HPAL ranked last since it can
only process small amounts of saprolite and EPAL ranked under ATL and HL because of its high
energy requirements.
HL and ATL are both suitable for the Devolli deposit and are not energy intensive. HL ranked higher
than ATL for two main reasons. The first is that heap leaching does not require a tailings dump since
wastes are of an aggregate size and can be dumped as a solid. The second is that European Nickel

- 68 -
has much more experience in heap leaching and thus this option presents a much smaller technical
risk.
This is the same recommendation that was made during the previous feasibility study(PWK
Resources, 2010). A potential option that was suggested in that report, but never fully investigated,
was the potential for using dual processing methods. The primary driver behind this suggestion was
that heap leaching and atmospheric tank leaching processes prefer saprolite feed. These could be
coupled with a complimenting plant for a limonite feed such as high pressure acid leaching.
The dual processing methods are being considered at another deposit in Indonesia (Mindoro
Resources Ltd., 2010). The main advantages of using two methods are:
Higher recoveries
Smaller plant size
The main disadvantages of using two processing methods are:
Greater degree of difficulty when mining as two different ores have to be processed
separately
Larger raw ore stockpiles required
Higher technical risk caused by optimising two different processes. This is particularly an
issue in Albania where foreseen difficulties acquiring skilled labour exists
The use of two different methods should not be considered for the Devolli project. As shown in the
previous study (PWK Resources, 2010) the project is already marginal and to implement two
different processing methods introduces additional technical and financial risks.
What was not considered in the previous study was the using two heaps leach pads; one for quick
leach saprolite ore and another for the long leaching of mixed saprolite-limonite ore.
The advantages of this option are:
Smaller heap leach pad (lower CAPEX)
Less acid consumption
Single precipitation plant
Shared high acid and low acid pregnant leach solution dams (HA PLS Dam & LA PLS Dam)
The disadvantages of this option are:
More difficult mining condition as products need to be separated

- 69 -
More complex raw ore handling system for two products
In addition to the single and dual heap leach option, the in-situ and stope leaching method will be
considered. There is a large associated risk with these methods but if the design is significantly less
expensive and a high NPV is achieved with even low recoveries, further research into this method
would be recommended.
Based on literature research and conclusions made, the following four processing designs were
investigated:
Heap leaching of single product
Heap leaching of two products on separate pads
In-situ leaching
Stope leaching
7.3 Metallurgy and Test work
The Devolli project has two primary ore types that are investigated. The first is a nickel silicate (NiSi)
ore and the second is ferronickel (FeNi). As detailed in the geology section of this report (Section ),
nickel silicates are found in the mineral saprolite and are characterised by low Fe content (<15%) and
relatively high magnesium (>5%). Saprolite forms the lower layer of the ore zone. Limonite,
conversely, has a high iron content (>40%) and only small amounts of magnesium, typically less than
1%. Generally speaking, nickel can be leached from nickel silicate ore much quicker and with less
sulphuric acid than from ferronickel ore. The purpose of the test work was to develop estimates of
acid consumption and required leach time. It should be noted that no new test work has been
performed since the previous feasibility report(PWK Resources, 2010). However, the test work has
been reviewed again because of the two product heap leach processing option.
7.3.1 Test samples
Over 300kg of various Devolli ore was set to the European Nickel operation in Caldağ pilot plant in
Turkey so that initial heap leach test work could be carried out. A total of 8 columns of ore were
tested each having various ore, irrigation rates, acid strength and agglomeration methods. Table 7
below shows the different parameters tested in each.
Table 7 Column test parameters
Test
Column
Ore Diameter
(mm)
Irrigation Rate
(L/m2/hr)
Free Acid
(g/L)
Agglomeration Details
ACT-1 NiSi 150 40 75 N/A
ACT-2 FeNi 150 10 75 N/A

- 70 -
ACT-3 NiSi 150 10 75 N/A
ACT-4 50-50 150 10 75 N/A
ACT-5 50-50 150 10 75 Process Water
ACT-6 50-50 250 5 60 N/A
ACT-7 50-50 250 5 60 RCW and 75 kg/t H2SO4
ACT-8 50-50 250 5 120 RCW and 75 kg/t H2SO5
The column is a Perspex pipe with a diameter of 150mm for column tests 1 through 5 and 250mm
for tests 6 to 8 and they all start with material filled to a height of 1500mm. The 150mm columns
contain a sample weight between 28kg and 34kg and the 250mm columns hold between 85kg and
95kg ore. Leach acid is continuously circulated from the collection point at the base of the column
to the feed point at the top. Frequently, acid levels are measured and topped up to the test level as
required. Periodically, samples are taken and assayed for valuable and non-valuable minerals.
The column test work results should give an approximation of many of the key parameters required
in the flow sheet design including acid consumption, ore percolation, agglomerate use and type,
expected recoveries of valuable and waste minerals, leach time required, irrigation rates and
leaching kinetics.
7.3.2 Interpretation of Results
With only eight (8) test columns, it is impossible to make accurate estimates of the leach
characteristics of the entire deposit. Despite this, base assumptions are required so this analysis
focuses on the two critical elements of the heap leach design: nickel recovery verse leach time and
acid consumption verse leach time.
The first step to analysing the heap leaching kinetics is to look at the difference the ore type has on
the recovery and acid consumption. For this, ACT-2, ACT-3 and ACT-4 were selected since the only
difference between these tests was the ore used. This is shown below in Figure 38 and Figure 39.
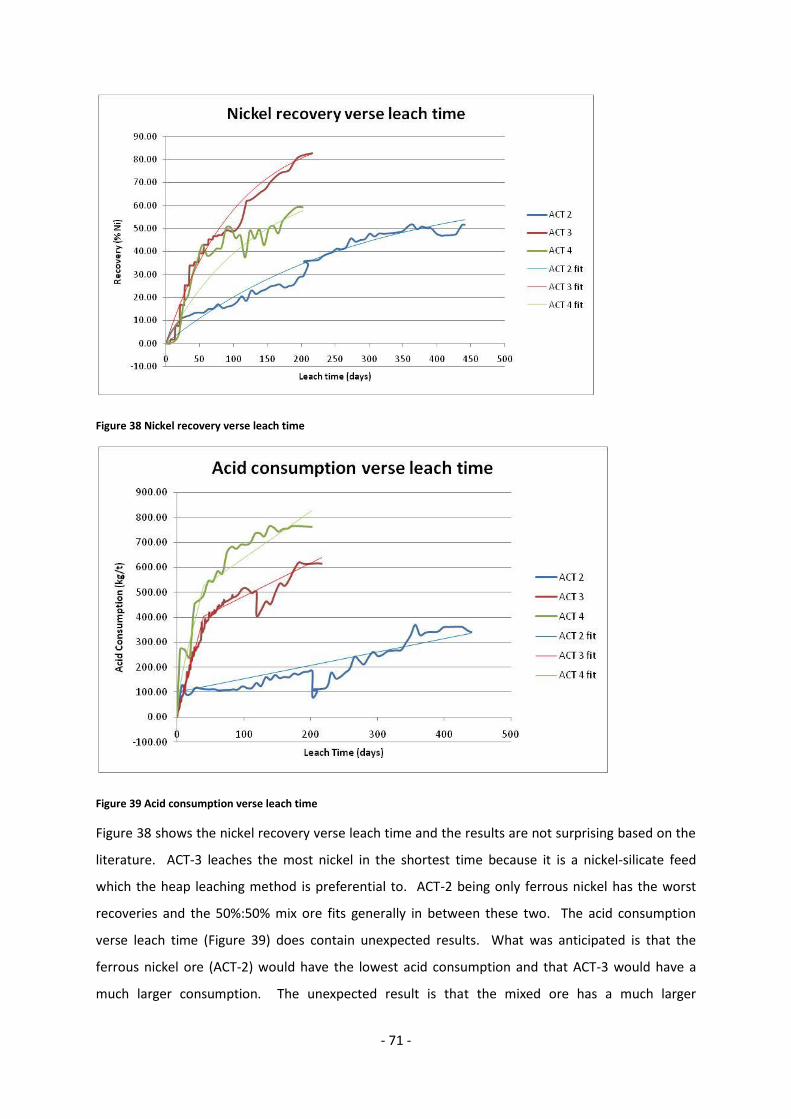
- 71 -
Figure 38 Nickel recovery verse leach time
Figure 39 Acid consumption verse leach time
Figure 38 shows the nickel recovery verse leach time and the results are not surprising based on the
literature. ACT-3 leaches the most nickel in the shortest time because it is a nickel-silicate feed
which the heap leaching method is preferential to. ACT-2 being only ferrous nickel has the worst
recoveries and the 50%:50% mix ore fits generally in between these two. The acid consumption
verse leach time (Figure 39) does contain unexpected results. What was anticipated is that the
ferrous nickel ore (ACT-2) would have the lowest acid consumption and that ACT-3 would have a
much larger consumption. The unexpected result is that the mixed ore has a much larger
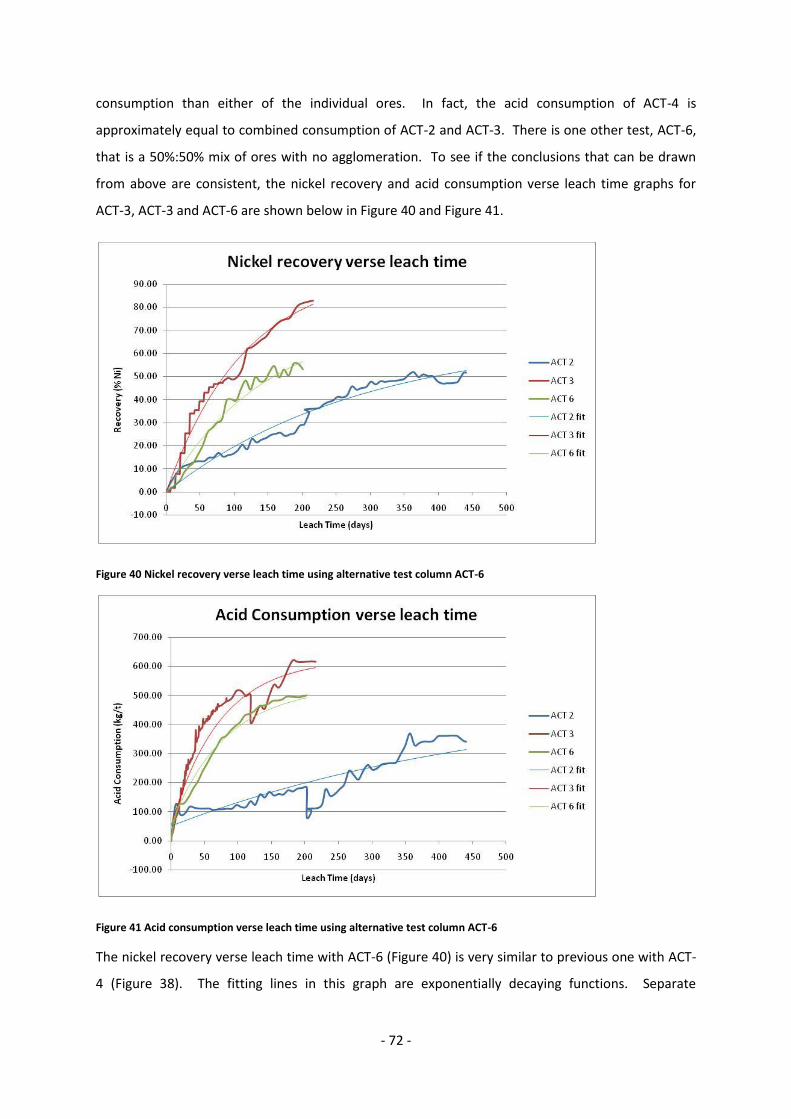
- 72 -
consumption than either of the individual ores. In fact, the acid consumption of ACT-4 is
approximately equal to combined consumption of ACT-2 and ACT-3. There is one other test, ACT-6,
that is a 50%:50% mix of ores with no agglomeration. To see if the conclusions that can be drawn
from above are consistent, the nickel recovery and acid consumption verse leach time graphs for
ACT-3, ACT-3 and ACT-6 are shown below in Figure 40 and Figure 41.
Figure 40 Nickel recovery verse leach time using alternative test column ACT-6
Figure 41 Acid consumption verse leach time using alternative test column ACT-6
The nickel recovery verse leach time with ACT-6 (Figure 40) is very similar to previous one with ACT-
4 (Figure 38). The fitting lines in this graph are exponentially decaying functions. Separate

- 73 -
equations were optimized for to fit ACT-2 and ACT-3. The curve for ACT-6 is the average of these
two functions and fits well.
The acid consumption verse leach time with ACT-6 (Figure 41) is considerably different with the
mixed ore test fitting in between the two different ore tests. Two exponentially decaying functions
were also optimized to fit ACT-2 and ACT-3. The ACT-6 is a combination of the two these two
functions with 75% consumption for ACT-3 and 25% from ACT-3.
The final leach characteristic to consider is the effect of agglomeration. The nickel recovery and acid
consumption verse leach time for ACT3, ACT-6 and ACT-8 are shown below in Figure 42 and Figure
43.
Figure 42 Nickel recovery verse leach time of agglomerated ore

- 74 -
Figure 43 Acid consumption verse leach time of agglomerated ore
The results of Figure 42 and Figure 43 are significant. They show that by using agglomeration, a
mixed ore can have similar nickel recoveries using the same amount of acid as a pure saprolite feed.
This result justifies the listing of the entire Devolli deposit as a resource/reserve as opposed to only
the saprolite proportion of it.
One of the options that was intended to investigate was the use of two separate mine products; a
saprolite product and a mixed product. The mixed product would contain some saprolite ore and all
of the transition and limonite ore. However, there has not been a test sample of agglomerated
nickel silicate ore performed and so the leach behavior has to be extrapolated from the results
provide. Figure 44 and Figure 45 below show how agglomerated saprolite ore may act and has been
designated ACT-X. This has been calculated by taking the ACT-3 figures and adding the difference in
recovery and acid consumption between ACT-8 and ACT-6.

- 75 -
Figure 44 Nickel recovery verse leach time with theoretical agglomerated NiSi sample
Figure 45 Acid consumption verse leach time with theoretical agglomerated NiSi sample
The predictions in Figure 44 and Figure 45 estimate that the agglomerated NiSi would have a 70%
nickel recovery in 90 days with an acid consumption of approximately 590 kg/t. For comparison,
ACT-3 reached a 70% extraction after 154 days with 540 kg/t acid consumed. The advantage of
agglomeration is then questionable. Although the leach time and therefore leach pad size is
approximately 40% smaller, the cost is an extra 10% in acid consumption. Sulphuric acid is the single
most expensive cost element in the operation of the heap leach plant and an additional 10% per

- 76 -
tonne is significant as will be shown in the finance section (Section) of this report. The method to
estimate to the leach rates for agglomerated nickel silicates above is incorrect and new test work
must be completed. For this study, a conservative estimate of 20% reduction in acid consumption
and a 30% reduction in leach time for a 70% recovery has been assumed.
In conclusion, there is not enough information to accurately predict the nickel recovery and the acid
consumption at the Devolli plant. The differences between ACT-2 and ACT-6 show the effect of
leach rate, acid strength and also the variation between what are both classified as 50%:50%
samples of mixed laterite ore. The best estimate available is the one supplied in the test work report
(European Nickel, 2010) of 72% nickel extraction in 200 days with an acid consumption of 560 kg/t
because it is also based on column and pilot leach pile test results from the European Nickel Caldag
project that was not available for this study.
7.4 Heap Leaching
Heap leaching is performed on a large stockpile pad. The pad is split into separate leach modules.
The total number of leach modules is dependent on the production rate and leach time. The leach
pad is two modules wide with the stacking feed conveyor situated through the centre if an
automated stacking system is employed. If haul trucks are used, a inbound haul road is construction
along the centre line of the heap leach pad.
The pad is a dynamic or “on/off” style pad. At any given time, one module is being stacked with new
ore, one is being reclaimed of waste material (leached ore) and one is completing secondary
leaching before being rinsed and washed. The remaining modules are undergoing either primary or
secondary leaching.
A multiple lift pad is advantageous as it would remove the need for reclaiming and dumping the
material. However, there are three reasons why this method has not been selected. The first is that
there are no test results to indicate if a multiple lift pad would allow acid to percolate though and
function correctly. The second is that part of the feed acid will consume leached waste minerals
from the underlying leached ore. The final reason is that leached laterites are an extremely low
strength material and it is unlikely that a large multi-stack pile will be able to safely support a
conveyor-stacker system or dump trucks on its surface.(Steemson, et al., 2009)
The leach pad is designed with a 6mm HDPE liner to prevent acid solution entering the ground.
Below the HDPE liner is a 300mm layer of clay as a secondary seal. Protecting the liner is a 500mm
layer of course aggregate which also allows drainage of the leach medium. It has been assumed that

- 77 -
on average 100mm of the course aggregate will need to be replaced each cycle. The modules will
have a 1% - 2% slope away from the centre of the pad towards individual leach ponds.
Each module feeds into its own leach pond. The leach ponds run the length of the modules and
have capacity to store an additional 24 hours of acid medium in case of a pump breakdown. Each
leach pond has its own pump which through a manifold can send the leach material to either the top
of the heap or to various other locations on site. The leach ponds will also be lined with the same
HDPE liner as the leach pad. Several separate leach ponds, in lieu of a single large dam, were
selected as it offers greater versatility in the plant operation.
Leach modules have a capacity of 30 days operation. This is because the estimated time for primary
leaching to occur is 60 days ensuring there is always 2 modules undergoing primary leaching and
feeding the precipitation plant. Older material will undergo secondary leaching with high acid
pregnant leach solution (HA PLS) continuously and this solution will be periodically checked for acid
levels. Part of this HA PLS will be circulated to the primary leach cycle where it is expected that high
recoveries of nickel silicate ores will cause much of the solution to neutralise. Solution from this
leach pond will be pumped to the low acid pregnant leach solution (LA PLS) dam adjacent to the
precipitation plant.
Before leached ore can be reclaimed as waste, a period of washing and de-acidification must occur
for environmental reasons. This involves continuously running raw water though the module and
periodically adding lime to the leach pond to keep pH levels in an acceptable range. It is anticipated
that 30 days of washing is sufficient to remove most of the free acid residing in the ore post-
leaching.
In the case of two mine products, one saprolite ore for quick leaching and a second mixed ore for
regular leaching, there will be two individual heap leach pads with the design detailed above. These
two pads, however, will share the HA PLS dam and LA PLS dam feeding the plant.
7.5 In-situ Leaching
In-situ leaching requires a HA PLS dam and a low LA PLS dam similar to the ones used in heap
leaching. In-situ leaching also requires a large dam of mine water to make up extra leach solution
and to create a pressure barrier surrounding the leach injection well to prevent loss of leach
solution. Additional infrastructure required for in-situ leaching is predominately pumps, pipes and
wells.

- 78 -
Like the heap leaching option, the LA PLS from the in-situ leaching is processed by the precipitation
plant.
7.6 Stope Leaching
Stope leaching has almost exactly the same infrastructure requirements as in-situ leaching. A HA PLS
dam and LA PLS dam are both required. It also requires a mine water dam, however, this will be
considerably smaller than the in-situ mine water dam. Stope leaching also requires a large quantity
pumps and pipes but these will be significantly different than those selected for in-situ leaching. In-
situ leaching requires the continual pumping of large quantities of leach solution to the surface. To
achieve this, large pumps and thick diameter pipes are required. In stope leaching, leach solution is
recirculated underground. The only solutions exchanged between the surface and the underground
are top up HA PLS for new stopes and LA PLS from leached stopes to the precipitation plant.
The LA PLS from the stope leaching is processed by the precipitation plant.
7.7 Precipitation Plant
The precipitation plant processes the low acid PLS into final nickel and cobalt saleable products.
Figure 46 below shows the process flow sheet supplied by European Nickel in the study introduction
document(European Nickel, 2010).
Figure 46 EN precipitation plant flow sheet design (L: liquids and S: solids) (European Nickel, 2010)
The following two final products are produced using the European Nickel precipitation are:
a primary nickel hydroxide product (NHP)
a secondary mixed nickel/cobalt product (MHP)
LA PLS
Iron Precipitiation
Ion Exchange (IX)
Nickel Precipitation
Tailings
Fe/Al Precipitation
Cobalt Precipitation
NHP Recycle Water MHP
S
S S
S L
L
L L
Elluate
Raffinate

- 79 -
An alternative process design recommended for a similar deposit in Albania is presented below in
Figure 47 (GBM, 2008).
Figure 47 Alternative precipitation plant flow sheet design
The main difference between the two processes options is the production of a single mixed
hydroxide product verse producing a nickel hydroxide product and a mixed hydroxide product. The
disadvantage of the second option is there is a feedback loop meaning larger equipment is required.
Another disadvantage is the loss of revenue from not producing a high cobalt hydroxide product.
Thus, the European Nickel design as shown in Figure 46was selected for use on the Devolli project.
The precipitation plant has six major processing blocks as follows:
1. Iron precipitation
2. Ion exchange (IX)
3. Nickel precipitation (NHP stream)
4. Iron/aluminium precipitation (MHP stream)
5. Nickel/cobalt precipitation (MHP stream)
6. Product packing (both streams)
Figure 48 below is an illustration of the precipitation plant process as described above.
LA PLS
Add Recyle Leach
Iron Precipitation
Mixed Hydroxide
Precipitation 1
Recycle Water
Tailings
Manganese
Precipitation
Mixed Hydroxide
Precipitation 2
MHP S
S
S L
L
L
L S

- 80 -
Figure 48 Precipitation plant process flow illustration(European Nickel, 2010)
7.7.1 Iron (Fe) Precipitation
The first stage of processing the low acid pregnant leach solution is iron precipitation. The purpose
of this stage is to remove a majority of impurity elements. Along with the main impurity of iron (Fe),
other impurities such as aluminium (Al) and chromium (Cr) are partially precipitated and removed.
Additionally, any free acid remaining in the solution is also neutralised during the iron precipitation
stage(European Nickel, 2010).
Precipitation of the waste elements is achieved via the addition of limestone in large tanks. Ferric
iron removal will occur when the solution has a pH between 2.5 and 3.5. Aluminium and ferrous
iron precipitate at higher pH ranges of 4 to 5 and 4 to 5.5 respectively which is in the range at which
nickel and cobalt will also precipitate. This leads to an unacceptable level of product loss. Thus, only
ferric iron is targeted during this stage and ferrous iron and aluminium are completely removed at
later stages. (Steemson, et al., 2009)
It is estimated that approximately 100 kg of limestone per tonne of dry ore will be required for first
stage iron precipitation(GBM, 2008). Once the impurity metals form into mineral hydroxides, a
solid-liquid separation process is used to separate the waste from the nickel and cobalt. A thickener
is used in conjunction with flocculent chemicals to produce slurry. The liquid overflow from the
thickener is collected in tanks. It then proceeds to the ion exchange for further processing.
The slurry is passed through a horizontal vacuum belt feeder to separated liquid and solids. The
solid waste, also known as iron filter cake, can be disposed of as normal waste on the waste
stockpile or can be used as a binder for underground backfill. Soluble nickel and cobalt are
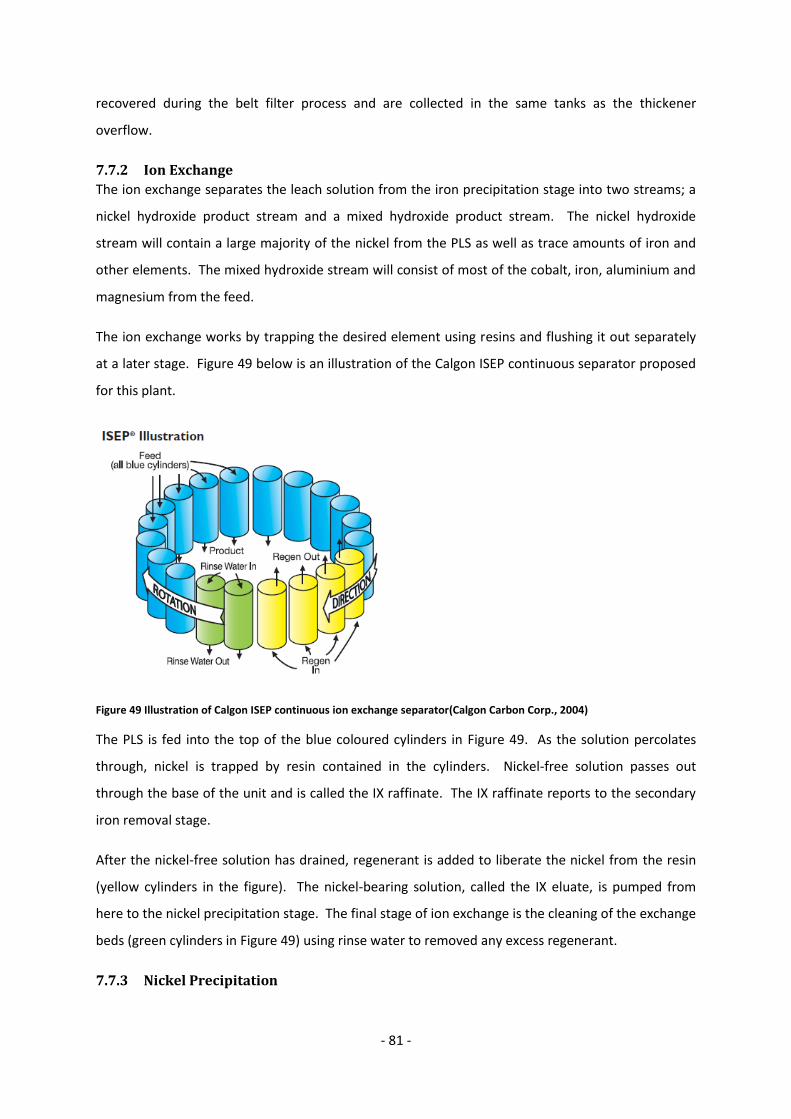
- 81 -
recovered during the belt filter process and are collected in the same tanks as the thickener
overflow.
7.7.2 Ion Exchange
The ion exchange separates the leach solution from the iron precipitation stage into two streams; a
nickel hydroxide product stream and a mixed hydroxide product stream. The nickel hydroxide
stream will contain a large majority of the nickel from the PLS as well as trace amounts of iron and
other elements. The mixed hydroxide stream will consist of most of the cobalt, iron, aluminium and
magnesium from the feed.
The ion exchange works by trapping the desired element using resins and flushing it out separately
at a later stage. Figure 49 below is an illustration of the Calgon ISEP continuous separator proposed
for this plant.
Figure 49 Illustration of Calgon ISEP continuous ion exchange separator(Calgon Carbon Corp., 2004)
The PLS is fed into the top of the blue coloured cylinders in Figure 49. As the solution percolates
through, nickel is trapped by resin contained in the cylinders. Nickel-free solution passes out
through the base of the unit and is called the IX raffinate. The IX raffinate reports to the secondary
iron removal stage.
After the nickel-free solution has drained, regenerant is added to liberate the nickel from the resin
(yellow cylinders in the figure). The nickel-bearing solution, called the IX eluate, is pumped from
here to the nickel precipitation stage. The final stage of ion exchange is the cleaning of the exchange
beds (green cylinders in Figure 49) using rinse water to removed any excess regenerant.
7.7.3 Nickel Precipitation

- 82 -
The first stage of nickel precipitation is the precipitation of trace ferrous iron in the IX solution. This
process is similar to the first-stage iron precipitation where limestone is added, thickened using
flocculent and liquid-solid separated in a belt filter. The overflow of the thickener proceeds to the
nickel precipitation tanks. The solids from the belt filter can be used as backfill or disposed of at the
leached ore dump.
Nickel can be precipitated using either soda ash or magnesia. The main advantage of using magnesia
is that it is more efficient at precipitating the nickel than soda ash. Disadvantages of using magnesia
are that it is not as readily and cheaply available as soda ash and, depending on customer product
requirements, an additional manganese removal section may be required. Soda ash has been
selected for the precipitation of nickel considering the location of the mine and the supply
requirements.
After precipitation, the solution is thickened and separated using a belt filter. Liquid recovered from
the solid-liquid separation is pumped to the leach ponds as it may contain trace amounts of nickel.
The solids are the nickel hydroxide product and proceed to the final stage of the precipitation plant;
product packing.
7.7.4 Iron/aluminium Precipitation
The nickel-free IX raffinate is first processed using iron/aluminium precipitation. This is to remove
the remaining impurities in the leach solution and is achieved using a bleed neutralisation process.
Not all of the IX raffinate reports to the bleed neutralisation tanks. In some plants, only
approximately half of the solution proceeds to final mixed hydroxide product whereas the other half
is re-circulated back to the leach ponds(Steemson, et al., 2009). There are several advantages to
using this feedback process including:
An increase of the average cobalt grades in the solution
A higher final cobalt grades in the MHP
Smaller sized equipment required for iron/aluminium and MHP precipitation stages as only
half the throughput is being processed. This equates to a smaller plant and lower CAPEX.
This design has been used for this plant. The bleed neutralisation removes a majority of the ferric
iron and aluminium remaining in the solution as well as neutralises any remaining free acid. Similar
to the other iron precipitation processes in the plant, the main agent used in limestone. The
solution is thickened and filtered. Solids are waste or backfill material and the cobalt-containing
liquor is pumped to the final precipitation stage.
7.7.5 Nickel/cobalt precipitation

- 83 -
The remaining nickel, cobalt and manganese in the leach solution are precipitated using soda ash.
The solution is then thickened and filtered to form a mixed hydroxide product. The water from the
belt filtering is recycled back to the heap leach pond.
7.7.6 Product Packing
Nickel hydroxide product (NHP) and the mixed hydroxide product (MHP) are packed into 2 tonne
bulk bags. The product can then be moved using a forklift and stored in the warehouse until
transportation to the consumer. 10 bulk bags will be loaded into 20 foot containers and taken from
site via trucks. More bags can physically fit into a container however more than 10 bags will exceed
the container’s safe working weight limit. The proportion of NHP bags to MHP bags in each
container will depend on the customer requirements.
7.8 Reclaiming Leached Ore
Once the ore is leached and has been neutralised, it is then reclaimed and transported to the
leached ore surface dump. There are the two following methods for reclaiming the ore from the
leach pad:
1. Using automated machines such as bucket wheel reclaimers to load the ore onto conveyors.
A series of conveyors transfers the material to the waste dump where shiftable conveyors
and a stacking machine are used to progressively build the dump
2. Using shovels, most likely front end loaders, to load the material into trucks where it is
transported to the dump and tipped. Dozers can then be used to shape the dump.
The second method has been chosen because there are issues with the stability of a leached ore
dump. The heap pile will not be able to support the stacking machine and the shiftable conveyor.
Thus the first option is not possible for technical reasons.
Depending of the transportation option, surface trucks may already be used for transporting and
stacking material onto the leach pad. In these cases, the same trucks will be used for taking material
to the dump and the process will be optimized.
Leached ore may also be used for backfill depending on the mining method. The chute through
which leached ore is transported to the mine works is located close to the dump.
7.9 Cost Modelling
The cost model for the processing plant was constructed as part of the raw material handling cost
model (refer Section 5.6). The results of the cost model are presented in the financial section of this
report (Section 15.4).

- 84 -
8 Infrastructure
8.1 Offsite Infrastructure
8.1.1 Power Supply
The total electrical supply on the Albania network is 1,450 MW from three large hydro-power plants
in the north of the country(CEZ, 2011). High voltage power is transmitted nationally and
internationally at either 220kV or 400kV (Energy Community Regulatory Board, 2008). Frequent
blackouts are a common occurrence throughout the country though privatization of the electrical
power plants and network and infrastructure funding from the World Bank has improved the
consistency of supply in recent years.
There exists a 400kV power line from Elbasan (A) to Zemblak (B) (see Figure 50 for locations). The
line continues to Kardia (C) in Greece and is one of only four existing cross border connections. At
Zemblak, there is a 400kV/100kV substation. It is the intension that a 100kV network will be built in
southern Albania from this substation, however due to funding shortages since 2008 this has not
progressed. The distance from Zemblak to Bilisht (D), the town closest to the deposit, is
approximately 15km and it is unknown whether power lines have been built in the area to date.
(Energy Community Regulatory Board, 2008)
Figure 50 Map of Albania and Greece showing major electrical points of interest to the project
8.1.2 Water Supply
Albania is a water rich country with large rainfalls in all regions of the country. The supply of water is
affected by uneven seasonal distribution and during the dry summer months, the availability of
adequate surface water and possibly ground water may be an issue.

- 85 -
The Devolli project will require a large quantity of water to maintain a heap leach operation. A large
proportion of water is recycled as part of the processing and mine de-watering will be sufficient to
supply make-up water.
8.1.3 Road and Rail
Transportation infrastructure in Albania is far below the standards of other European countries. The
road quality between major centres has improved in recent years. In April 2011, a new road project
was approved to build a highway between the capital Tirana and the town of Elbasan, located 40km
in the south. In 2010, another major project was completed with the construction of highway
joining Albania and Kosovo(AlbanianEconomy.com, 2011). The closest road to the Devolli project is
the SH3 which runs from Tirana to Kapshtice in Greece via nearby Korce. This road is in average
condition but should be suitable for delivery of equipment to site and for transportation of nickel
concentrate.
The rail system during the communist era was frequently used because of the ban on private
vehicles. With the fall of communism in the early 1990’s, the rail system has fallen into a dilapidated
state of disrepair as a consequence of more and more Albanians using private vehicles instead of
rail. The network is 435km of single, standard gauge track with no international connections(alba
global, 2009). The closest rail line to the project area is in Korce and there is no direct connection to
a port if this transportation were to be considered. Thus, rail is not considered an option for use in
this project.
8.2 Onsite Infrastructure
Figure 51 below is a drawing showing the location of the following onsite infrastructure:
1. Administration offices and changing house
2. Warehouse
3. Workshop
4. Oil and lubricant store
5. Laboratory
6. Water and sewage treatment plant
7. Explosive storage
8. Fuel storage
9. Accommodation
Each of these 9 items are described in more detail below. Additionally, the following items are also
shown on the map for clarity:

- 86 -
10. Main mine adit
11. Ventilation shafts
12. Roads
13. Heap leach pad and ponds
14. Precipitation plant
15. Sulphuric acid plant
16. Leached material dump
All infrastructures items are numbered as above in Figure 52 below.

- 87 -
Figure 51 Site plan showing major infrastructure
8.2.1 Administration Offices and Changing House
The administration office will provide working space for the mine management, engineering staff
and administration personnel. A large meeting room will also be incorporated for meetings with
1
2 3 4
8
5
7
6
9 10
11
12
13
14
15
16

- 88 -
mine/process employee groups and visitors. Common areas, rest rooms and smaller meeting rooms
will also be required. The offices will be demountable constructions and a gravel car park will be
required at the building entrance. The office will be located near the exit on the northern side of the
main road.
A changing house will be provided for underground staff. Facilities include sex-separated showers
and toilet areas and individual lockers. The changing house will also include the cap lamp room and
tag-in/tag-out board. The change house is located near the mine portal and employees leaving the
change house will enter mine light vehicles and proceed to the mine main level.
8.2.2 Warehouse
The project warehouse will be used to store consumable items, PPE, spare parts and maintenance
equipment. The warehouse will be attached to the precipitation plant as it will also be used to store
packaged concentrate before it is dispatched offsite. The warehouse will have a rail and hoist
system for the movement of heavy items that cannot be shifted using a forklift. A large drop off
zone will be constructed next to the warehouse to allow sufficient room for loading and unloading of
concentrate and goods.
Elemental sulphur, oil and lubricants will not be stored in the warehouse.
8.2.3 Workshops
The site will have two workshops; a primary surface workshop and a secondary underground
workshop. The surface workshop will be large enough to service 4 machines at one time – either
surface or underground vehicles - and to store the large amount of tools and daily consumables. The
surface workshop will be located in the vicinity of the heap leach pad.
The underground workshop will provide a service to the underground vehicles. It will be located
either near the mine entrance or preferably, if rock conditions allow, underground near the
extraction level.
8.2.4 Oil and Lubricant Store
The oil and lubricant store is a fully- concrete bunded, roofed area next to the surface workshop.
Oils and lubricants are stored in 1m3 bulk bins and can be transported using forklifts. There will be
sufficient space for new and old lubricants to be stored. Old lubricants will be collect by trucks for
proper disposal off-site.
8.2.5 Laboratory
An onsite laboratory will be constructed to perform grade assaying of mine and process material.
The laboratory will be located close to the administration office to facilitate close workings and

- 89 -
result sharing with engineering personnel. The laboratory will measure samples from core samples
of future panels to be mined and samples from various stages of the heap leach process i.e. at the
ROM, after agglomeration, after primary leaching and fully leached ore.
8.2.6 Water and Sewage Treatment Plant
A small water and sewage treatment plant will also be included in onsite facilities. The reverse-
osmosis sewage plant will treat all sewage from the mine accommodation, changing house and
offices. Treated water will be pumped to the mine water dam. The water treatment plant is
required to produce potable water for staff consumption and for supply to the changing house and
on-site accommodation.
8.2.7 Explosive Storage
The explosive storage will be located in relatively close proximity to the mine portal. The storage will
be surrounded by large material bunds and a security fence. The facility will have 24hr CV-
monitoring and access will be restricted to authorised personnel only. A second smaller explosive
storage unit, with similar security measures, will be located underground.
8.2.8 Fuel Storage
Fuel will be delivered by tankers and stored in two large fuel tanks with a combined capacity of
200kL. Nearby there will be an H/V and L/V re-fuelling station. Fuel storage must be maintained
above a minimum level so that ventilation fans and fire pumps can be run for a safe time in case of
power failure.
8.2.9 Accommodation
It is planned that the majority of the workforce will be from the local community. Onsite
accommodation will be minimal to provide for fly-in/fly-out staff. The accommodation will be a
series of interconnected demountables. Each room will contain a single bed and en-suite shower
and toilet. The facilities will also contain a common mess and recreation room. At mine closure, the
accommodation will be dismantled and relocated to a new site.
8.3 Sulphuric Acid Plant
The main consumable in the Devolli project is sulphuric acid for the heap leaching process. The price
of sulphuric acid remained stable for many years at prices lower than 80 US$/tonne until it
skyrocketed in 2008 from prices to over 250 US$/tonne for industrial sulphuric acid and over 400
US$/tonne for spot sulphuric acid (see Figure 52). Due to the global financial crisis, sulphuric acid
prices crashed in 2009, similar to many other commodities, but since then it has been slowly
recovering.

- 90 -
Figure 52 Historical sulphuric acid prices(ICIS, 2010)
One of the issues with sulphuric acid production is that the primary feedstock is elemental sulphur
which is a bi-product from the smelting and oil and gas industry. Thus, the production of sulphur is
inelastic and does not respond to the changing supply/demand balance(ICIS, 2010).
In order to protect this deposit from fluctuating sulphuric acid prices, a sulphuric acid plant will be
constructed. One tonne of elemental sulphur will produce almost 3 tonnes of sulphuric acid so
producing acid onsite removes the costly and risky task of transporting large quantities of highly
corrosive solution. Another advantage of using an onsite sulphuric acid plant is that the process
produces a large amount of steam which can be used to generate electricity. The generated
electricity can be used to power the mine or if there is an excess, to sell to the grid.
8.4 Limestone Quarry
The final additional infrastructure that could be considered is a limestone quarry. The precipitation
plant requires a large amount of limestone for the precipitation of waste elements such as iron from
the leach solution. This option was not investigated due to unknown variables such as quantity and
quality of the limestone onsite and whether there exists a local market for this product as well. It
has been assumed that limestone is being produced locally and can be purchased at a reasonable
rate for use at the processing plant.

- 91 -
9 Ventilation
Mine ventilation provides a flow of fresh air to the underground workings of a mine. The primary
purposes of mine ventilation are to deliver sufficient oxygen to workers and remove noxious gases.
Noxious gases are from underground diesel engines, blast fumes from explosives and, depending on
the mineralogy, from within the rock itself.
The ventilation system has been designed based on the following SME recommendations(SME,
1992):
2 m3/min of fresh air per person underground
4 m3/min of fresh air per hp of installed diesel power
It is also recommended the maximum air flow through any drifts or adits is 6 m/s. When the air flow
exceeds this value, airborne dust particles become a health hazard to the workforce. The following
plan in Figure 53 shows the high-level ventilation design for the Devolli project including location of
the intake and outtake air paths.
Figure 53 High-level ventilation design for the Devolli project

- 92 -
The adit to the surface will be the main air outlet for the ventilation system. Depending on the
transportation option, there may be up to main three adits. In the case of three adits, the two adits
which contain conveyors will be outtakes and the main access adit will be an intake outlet.
There are three ventilation shafts planned for the Devolli project. The first shaft (numbered 1 in
Figure 53) is located in close vicinity to the main access and will be constructed as part of the pre-
production development. This intake shaft will be used for first production in Verniku West. It will
also be the main air supply to allow the main access adit that the runs the length of Verniku West to
be constructed followed by Ventilation shaft #2. Ventilation shaft #2 will then be the main source of
clean air for the northern deposit. Development work can then commence to link the mine working
with the southern deposit Kapshtica and shaft # 1 will be used to supply air for this. Ventilation shaft
#3 will be constructed last and when constructed, production can commence in the southern
deposit. Once ventilation shaft #2 and #3 are operational, ventilation shaft #1 will be used either as
an intake or outtake vent depending on mine requirements.
The ventilation calculations are part of the mine costing calculation and are attached in Appendix I.

- 93 -
10 Environmental and Social Management
Protection of the environment and improvement of the local socio-economy are both of vital
importance to European Nickel to achieve its vision of being a world-class sustainable mining
company. Any mining operation has the potential to cause irreversible damage to the environment
if not properly controlled and monitored.
Potential environmental and social impacts are identified in this section and mitigating strategies are
developed to prevent their occurrence. Albanian legislation relating to the environment is also
identified. Mine closure and the associated works that will need to be carried out at end of the mine
life are detailed further in this paper.
10.1 Environmental Legislation
The management and enforcement of environmental law is the joint responsibility of a number of
government departments and agencies. The different organisations the Devolli project may need to
cooperate and work with include:
The Ministry of Environment, Forestry and Water Administration
The Inspectorate of the Environment
Directorate of Environmental Impact Assessment
Ministry of Public Works and Tourism (permits for construction).
Ministry of Agriculture and Food (MAF) (agricultural land)
Directorate General of Forests and Pastures (DGFP)
In addition to national organisations, the Devolli project will also need to work need to work closely
with the local communities.
The Ministry of Environment, Forest and Water Administration is the main environmental law
forming body and the Law on Environmental Protection (2002) is the primary environmental
protection legislation for Albania. The Inspectorate of the Environment consists of regional agencies
and enforces and ensures compliance with the national environmental legislation. In order to apply
for a mining permit, an environmental impact assessment must first be submitted and approved by
the Directorate of Environmental Impact Assessment. The Devolli project will also need to apply for
a construction permit from the Ministry of Public Works and Tourism. Any proposed changes to
agricultural land may need to be approved first by the Ministry of Agriculture and Food. Forestry
permits, if required, are organised through the Directorate General of Forests and Pastures.

- 94 -
Other than the Law on Environmental Protection (2002), additional Albanian laws may also need to
be considered for the Devolli project including:
Law on Protected Areas (2002)
Law on the Land Protection (2001)
Law on assessment of the impact on environment (2003)
Law on Treatment of Pollute Waters (2003)
Law on Plant Protection Service (1993)
Law on Marine Environment Pollution and Damage (2002)
Law on the Protection of Air from pollution (2002)
Law on the Forests and the Forest Service Police (1992)
Law on Environmental Treatment Of Solid Waste (2003)
Implementation of the environmental in Albania remains weak. However, Albania has aspirations to
join the European Union so the environmental law and enforcement are expected to become stricter
in the future. Thus, all environmental aspects of this project need to designed to satisfy both
Albanian law and European Union policy(European Nickel, 2010).
10.2 Environmental Impact Analysis
The environment impact analysis (EIA) has been performed by individually assessing the potential
impact on the following eight areas:
1. dust
2. air pollution
3. water
4. noise
5. vibrations
6. land use and top soil management
7. flora and fauna
8. waste material
The following sections detail the cause of potential impacts for each of the above identified area and
makes recommendations to prevent or reduce these impacts.
10.2.1 Dust
The main sources of dust during mine operations will be:
ore and waste transportation by trucks and/or conveyors

- 95 -
ore communition
blasting
wind erosion of waste dump and top soil stockpile
Dust emissions are especially of concern during the summer months where the temperatures are
high and the surface is dry. To control dust emissions, the following systems and design
requirements will be used:
spray jets on all surface crushers and screens
spray jets on long conveyors
permanent covers high transfer conveyors
material stacking and transportation to be stopped during high wind events
transfer heights to be minimised
mobile water trucks to spray roads especially during the summer
frequently used roads to be paved and kept clean
waste dump to be recultivated as soon as possible
top soil stockpiles to be compacted and vegetated
ventilation system to designed to minimise dust pick up in the mine. Dust-filter to be
considered if emissions become excessive
10.2.2 Air Pollution
The major source of air pollution other than dust as discussed above will come from vehicles and
blasting. Mine pollution from underground will be found in the exhausting air from the ventilation
shafts or adits. This air may be contaminated with CO2, CO, NO2 and SO2. Proper maintenance of
underground vehicles and minimum use of explosives will be vital to minimizing air pollution from
the underground.
During the development phase of the project, surface drilling and blasting may be required on the
surface to construct the main adit, the leach pads and waste material dump. Wind strength and
direction will need to be considered to prevent blast fumes and dust affecting the local water
sources and local communities.
Air pollution from surface facilities is expected to be minor. There will be diesel and welding fumes
from the workshops and backup generators. Transportation of the mine product will achieve using
road trucks so there will be an increase in local traffic.
- 96 -
A major source of air pollution that is common to Albania is the burning of garbage as the most
efficient method to removed industrial waste. It is not known if this practice is common in the
Devolli region. Regardless, no garbage on site will be burnt. If local dumps are not available, an on-
site non-mine material dump will be constructed. The dump will need to be located so that it won’t
affect ground water and will have minimum impact on potential future use of the land. Ground
testing will be required to judge the suitability of a location for a waste dump.
10.2.3 Water
Heap leaching requires a large amount of acidic water and other processes such as dust suppression
and fire water also needs a significant amount of clean water. This can have an effect on the
environment in two different ways. The first way is the sourcing of the water and the second is the
risk of mine water escaping to the environment at large.
Water for processing will be collected and stored from rain run–off and de-watering. It is expected
that this will be sufficient to cover any make up water required. Where ever possible in the
processing plant, thickeners and solid-liquid separation have been used to recycle a large amount of
water. If more water is required, back-up boreholes will provide additional needs. There is the
nearby Devolli river and creeks, however it is preferential to not use these sources as the water
quality is expected to be poor due to local garbage pollution. Any water that is extracted will be
done so in accordance with Albanian mining law which states that all water taken must be returned
free of any contamination that will adversely affect human health or flora and fauna.
To prevent the escaping of mine and process water, sufficient dam capacities will be constructed. If
either of the HA PLS dam or LA PLS dam overflow, they will, by design, flow into the barren water
dam. This will then overflow into the mine water dam and finally to the evaporation ponds. The
evaporation ponds are flat lying dams designed for rain-water that flows from mine workings to be
contained and eventually evaporate. During dry times, the evaporation ponds can be cleaned with a
front-end loader to take any heavy metal sediment that will have been deposited to the waste
dump.
The local villages use bore water as the primary supply of drinking water. Thus, it is essential that
leach solution does not leak into the groundwater aquifers. Testing and inspections will be
performed periodically to confirm the heap leach pad and ponds barriers have not been breached.
A small water treatment and sewage treatment plant will be onsite to re-use as much water as
possible and to produce clean potable water for human consumption.
10.2.4 Noise

- 97 -
Noise can have a detrimental effect on the health of both employees and the local community. The
Bilishti village is located approximately 1km from the mine site. The major sources of noise from the
mine will be:
transportation of ore and waste by trucks and/or conveyors
ore communition
mine construction activities
ventilation
During construction, there will be drilling and blasting performed at the surface as well as raise
boring for the ventilation shafts. These activities will produce more noise than during usual mining
operations and will be restricted to day-time to limit impact on the local community.
For operations, noise will be limited by:
optimisation of site layout including location of mine portal, processing plant and waste
dump to limit amount of roads and conveyors in vicinity to existing towns and villages;
installing noise barriers on the crushing and sizing stations;
installing balanced, low-noise idler rolls on long conveyors. Conveyors can be shielded if
further noise reduction is required;
proper maintenance of trucks and other surface vehicles;
majority transportation of ore transportation from site during work hours; and
ventilation shafts will have noise barriers if found to be excessively loud.
Ear plugs and headphones will be part of standard PPE to protect company employee and visitors.
10.2.5 Vibrations
The Devolli project can cause ground vibrations that may be large enough to concern local residence.
Ground vibrations can be caused by blasting, mine room collapsing and material sizing. Because of
the weak rock strength, blasting during the operating will be minimum and will not be noticeable in
nearby villages. Blasting during construction may cause large vibrations depending of overburden
rock strength. All blasts need to be designed to minimise excess ground vibrations and fly rock.
Where appropriate, locals need to be informed of upcoming large blasts.
Crushing of ore can also cause ground vibrations. All crushers will be mounted onto large steel
springs to damper vibrations.

- 98 -
The collapse of the roof in a mine will also cause large ground vibrations. In both the longwall and
room and pillar mining options, it is expected that the roof will collapse. However, it is intended for
this to be gradual and vibrations experienced on the surface will be minor. The uncontrolled
collapse of a large portion of roof strata in the underground mine is a significant safety risk to
underground miners due to the air blast. Thus, the controlled collapsing of mine sections is
extremely important and will be monitored closely.
10.2.6 Land use & Top soil management
The use of a heap leach plant requires a significant amount of land that will have large amount of
sulphuric acid concentrated on it. Although the waste material is washed and neutralised at the end
of the mine life, there is the potential for pools of acids to remain. Before closure, the entire leach
pad will require neutralisation. Once tests show the area to be uncontaminated, top soil will be
returned to the pad which will be converted to farm land. Leach ponds and dams will also be
neutralised and cleaned and will be remain for use with the farms.
The waste dump will be covered progressively with top soil and transformed into a permanent forest
using native flora. The waste dump will be shaped to match the lay of the land.
Top soil will be reclaimed from all land be used at the start of the project. This will be stockpiled
separately and maintained until it can be returned and re-planted.
The final major land use is the area above the underground mine workings. Because caving methods
are used, the land above will subside. This will occur during the life of the mine as controlled
collapses and the land above after the mine will remain stable.
10.2.7 Flora and Fauna
The mine is underground so mining activities will not affect the flora and fauna of the area. The
processing plant is large and there will be a large amount of water on-site that is not suitable for
animal consumption. In lined dams, like the ones of this project, it is often the case that animals will
drown if they fall into the dam because the HDPE lining is too slippery to crawl up. The area is
agricultural so it is not expected that many animals will be at risk however the site is fenced to also
prevent larger animals from entering the site.
Stripping of the land during construction has a permanent effect on native flora and fauna in loss of
habitat. After mining, a majority of the land will be returned to its previous state.
10.2.8 Waste Material
Waste rock will be stock piled on site in a permanent dump zone along with the leached ore. All
tailing from the plant will is thickened so it can be dumped at this location or can used a backfill

- 99 -
within the mine. Dust blow off is a risk with the waste dump so it will be built to full height and
reclaimed as forestry progressively. The waste dump should be located to minimise visual and dust
in wind impact to the local villages.
As detailed in the air pollution section of this EIS, other wastes from the mine and plant, such as
used machinery parts and canteen and office waste will be collected and disposed of at a dump of
the local authorities. If a legal dump is not in the vicinity, a permanent on-site dump will be
constructed to EU standards.
Process agents and wastes will be stored on site in a manner that minimises exposure to employees
and the environment in operation and in case of failure. A oil collected will used in the workshop
and all old oils and lubricants will be collected into 1m3 bulk containers and trucked offsite for
correct disposal.
10.3 Cultural Heritage
European Nickel places great importance into building a nondependent relationship with the local
community. The operation should have a positive impact on the lives of locals and protect sites of
cultural importance.
There are a number of environmental and man-made sites in the vicinity of the project area that
must be protected. Figure 54 below shows the location of the following sites that require protection
from project impacts:
1. Prespa Lake
2. Treni Cave
3. Mummy stones of Treni
4. Vërniku Churches & Cemetery
5. Vërniku Natural spring
6. Kapshtica Churches & Cemetery
7. Kapshtica Natural spring

- 100 -
Figure 54 Location of sites of cultural importance(European Nickel, 2010)
Prespa Lake (1) is a national park located approximately 3km north of the Verniku West deposit.
Treni Cave (2) and the Mummy Stones of Treni (3) are registered geo-monuments and form part of
the Prespa park tourism area. All three of these sites are located a considerable distance from the
deposit and should not be affected by the mine activities.
Verniku and Kapshtica are two villages close to the deposit that have sites of cultural and religious
significance (4 – 7). All mining activities should not adversely impact the villages or their cultural
sites. The mining methods selected using some caving but the free height being collapsed, the depth
of the mine and the distance should mean that the villages and monuments remain unaffected. This
will need to be reviewed based on further testing of the overburden so that the area of subsidence
can be accurately predicted. The area around the deposit has a extremely long history with artefacts
dated to be the bronze age being found locally. There is a possibility that during the project
particularly with large earthworks being moved for the heap leach pad and dams that undiscovered
archaeological sites may be found within the mine area.

- 101 -
11 Project Scheduling
With any project, the schedule forms one of the four key measurements of project achievement and
success with budget, quality and health and safety being the other three. The life of Devolli project
can be sectioned into three separate phases; pre-production, production and post-production. Pre-
production includes all of the activities from before and including the pre-feasibility study until the
end of commissioning and the commencement of full production. Post-production is the closure
and restoration of the mine site.
11.1 Pre-production
The pre-production stage has two main phases; the engineering and procurement phase and the
construction phase. These phases aren’t separated by a date but by where project decisions are
being made. During the engineering and procurement phase, most work is being performed in
offices at locations that are not necessarily the mine location. As the engineering and procurement
phase shifts to the construction phase, more and more work is onsite at the mine. It is during the
construction phase that most of the project capital expenditure is required.
The activities that occur during the engineering and procurement phase include:
Pre-feasibility
Environmental impact study
Further drilling and core testing
Permit application
Feasibility study
Detailed design
Procurement of major equipment
Financing
Legal Issues
The construction phase of the project includes:
Site preparation
Construction of access and haul roads
Construction of the leach pad, ponds and dams
Construction of the precipitation plant and other infrastructure
Underground access developments
Ventilation shaft #1 development

- 102 -
A detailed pre-production Gantt chart is attached in Appendix J. It is anticipated that the total pre-
production will be 3.5 years long with 1.5 years in the engineering and procurement phase and 2
years spent in construction and development.
11.2 Production
The production schedule is dependent on the mining method, mine design, the number of products,
cut-of-grade and the production rate. Generally speaking, the underground production schedule is
split into development and production activities. Development is required to open and prepare new
areas for mining. Development also includes ventilation related workings such as the addition of an
intake shaft. Production activities are also processes related to removing of ore from processing at
the plant. For some mining methods, backfill is also required this forms a third sub-heading for
activities under production. On the surface, the production schedule includes timings for the heap
leach pad for example what modules are currently being primary leached, secondary leached,
neutralized, reclaimed, stacked or are empty. It also shows the surface dump pre-development and
restoration.
11.3 Post-production
Post-production includes all activities that occur once the mine stops producing a saleable product.
It is anticipated that the majority of mine closure and reclamation works will be completed within six
months of the mine close date. Some small expenses such as periodic testing of the waste dump
and water testing from various locations around the mine will continue for several more years until
the project area can be returned.
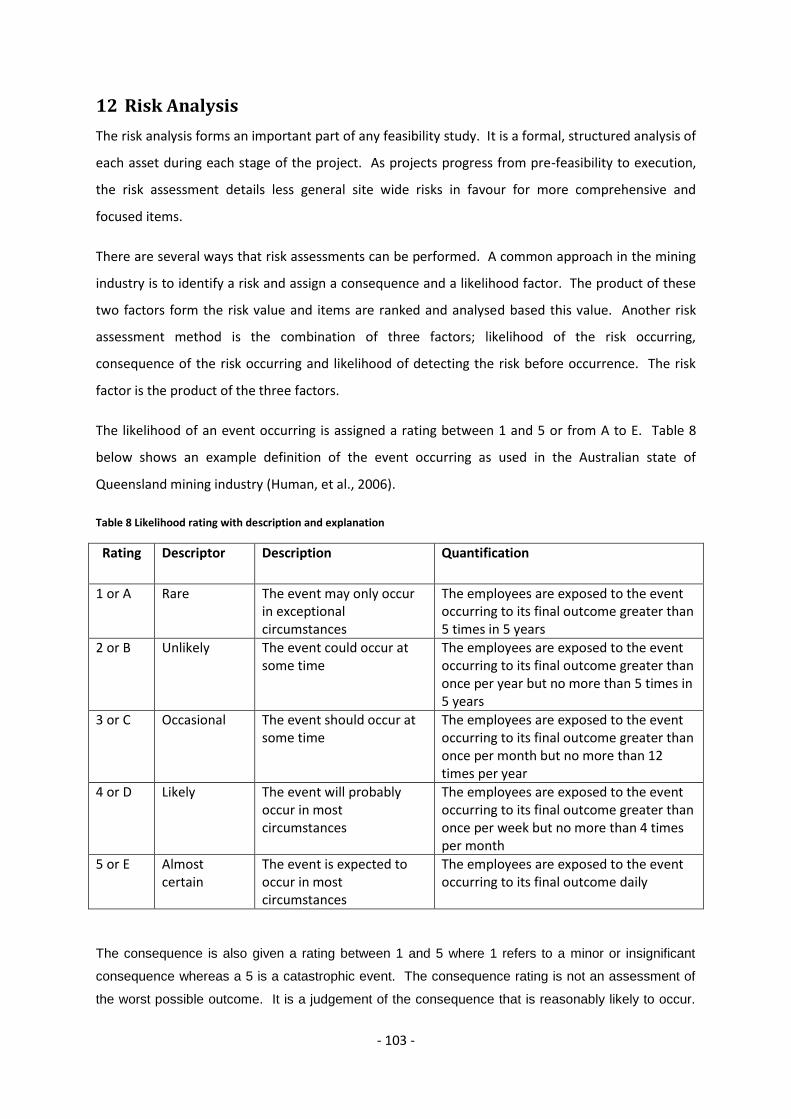
- 103 -
12 Risk Analysis
The risk analysis forms an important part of any feasibility study. It is a formal, structured analysis of
each asset during each stage of the project. As projects progress from pre-feasibility to execution,
the risk assessment details less general site wide risks in favour for more comprehensive and
focused items.
There are several ways that risk assessments can be performed. A common approach in the mining
industry is to identify a risk and assign a consequence and a likelihood factor. The product of these
two factors form the risk value and items are ranked and analysed based this value. Another risk
assessment method is the combination of three factors; likelihood of the risk occurring,
consequence of the risk occurring and likelihood of detecting the risk before occurrence. The risk
factor is the product of the three factors.
The likelihood of an event occurring is assigned a rating between 1 and 5 or from A to E. Table 8
below shows an example definition of the event occurring as used in the Australian state of
Queensland mining industry (Human, et al., 2006).
Table 8 Likelihood rating with description and explanation
Rating Descriptor Description Quantification
1 or A Rare The event may only occur in exceptional circumstances
The employees are exposed to the event occurring to its final outcome greater than 5 times in 5 years
2 or B Unlikely The event could occur at some time
The employees are exposed to the event occurring to its final outcome greater than once per year but no more than 5 times in 5 years
3 or C Occasional The event should occur at some time
The employees are exposed to the event occurring to its final outcome greater than once per month but no more than 12 times per year
4 or D Likely The event will probably occur in most circumstances
The employees are exposed to the event occurring to its final outcome greater than once per week but no more than 4 times per month
5 or E Almost certain
The event is expected to occur in most circumstances
The employees are exposed to the event occurring to its final outcome daily
The consequence is also given a rating between 1 and 5 where 1 refers to a minor or insignificant
consequence whereas a 5 is a catastrophic event. The consequence rating is not an assessment of
the worst possible outcome. It is a judgement of the consequence that is reasonably likely to occur.

- 104 -
Table 9 below displays different consequence categories and the meaning of a rating 1 and rating 5
for both of them. Descriptions for consequences of ratings 2, 3 and 4 can be made by interpolating
logically between the two extremes supplied.
Table 9 Consequence rating for different categories(University of New South Wales, 2010)
Category
Consequence Rating
1 (insignificant) 5 (catastrophic)
Health and Safety Minor scratch Multiple or single fatalities
Revenue/Costs US$ 100 order of magnitude US$ 1 mil. order of magnitude
Schedule Hours Months or years
Social Minor complaints Complete degradation of living standards
Environmental Small oil spill Permanent damage/loss of native fauna and
flora
Company Reputation Minor complaints International headlines
The likelihood can be rated in two different ways; 1 to 5 or A to E. If the 1 to 5 system is used, the
risk rating is calculated by taking the product of the likelihood rating and the consequences rating.
This gives a range of risk ratings from 1 to 25. A risk rating of 1 is an event which is highly unlikely to
occur with insignificant consequences. At the other end of the scale, a risk rating of 25 signifies an
event which is highly likely to occur with catastrophic consequences. The risk ratings are ranked
from highest to lowest.
If the likelihood is an A to E rating then a table (see Table 10 below for an example) is used to obtain
the risk rating.

- 105 -
Table 10 Example of risk matrix(Department of Resources, Tourism and Industry, 2008)
The advantage of using a risk matrix instead is that different likelihood/consequence combinations
may have the same score but require different levels of attention. For example if an incident is
unlikely to occur (e.g. probably more than one during the mine life) but the most reasonably likely
consequence will be catastrophic (e.g. a fatality), the risk score is only 10 whereas the risk matrix
ranks this event as extreme. The mining industry does not accept the likelihood of a fatality as an
acceptable risk. A risk rating of 10 can also be an event almost certain to occur but with only minor
consequences (e.g. a twisted ankle). Although this is not desirable, this risk cannot be classified as
extreme.
Risks that are deemed too high and are therefore unacceptable require mitigation strategies to
downgrade the risk. Once these mitigation strategies have been identified, the risk analysis can be
performed again to re-rate the risk and possibly identify further risks associated with the mitigation
method.
Risks for the Devolli project were individually identified during the three different phases of the
project; construction and development, operations and closure. Significant risks that were identified
are analysed individually at the end. The risk ratings given in the table for each section are
considering if no mitigation strategies are employed. Many of the risks detailed below were already
identified in the previous study (PWK Resources, 2010) and have been included for completeness.
12.1 Construction and Development
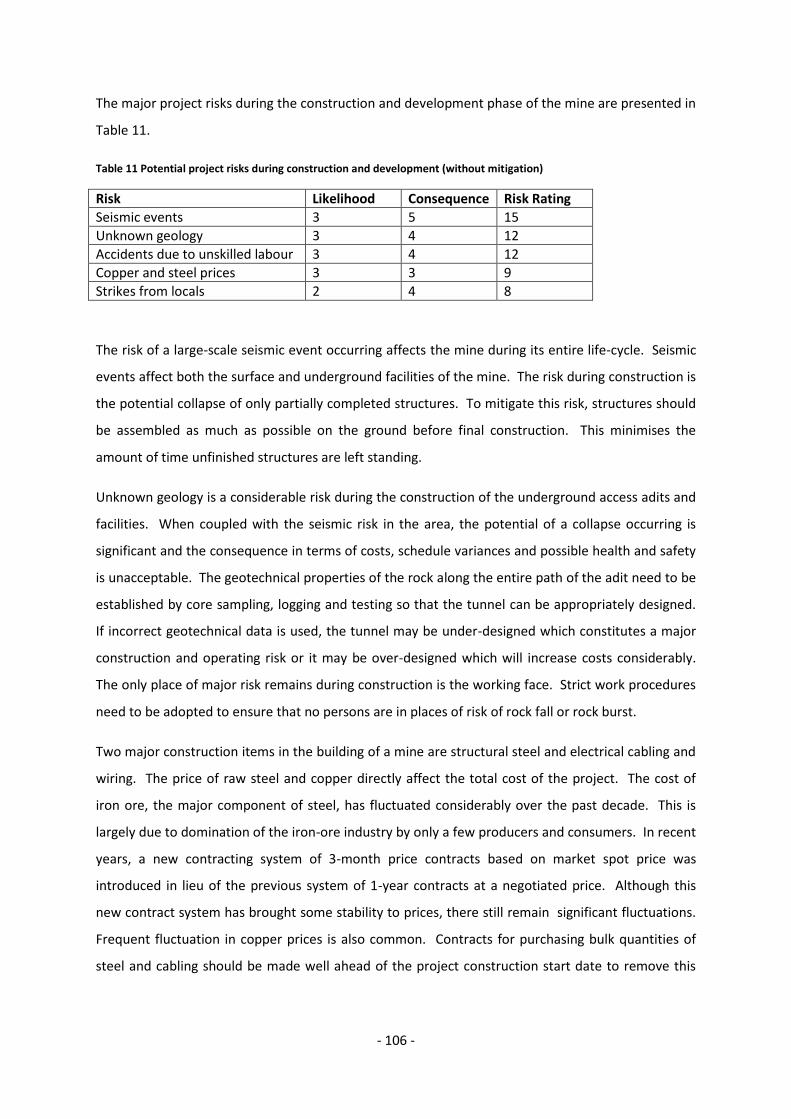
- 106 -
The major project risks during the construction and development phase of the mine are presented in
Table 11.
Table 11 Potential project risks during construction and development (without mitigation)
Risk Likelihood Consequence Risk Rating
Seismic events 3 5 15
Unknown geology 3 4 12
Accidents due to unskilled labour 3 4 12
Copper and steel prices 3 3 9
Strikes from locals 2 4 8
The risk of a large-scale seismic event occurring affects the mine during its entire life-cycle. Seismic
events affect both the surface and underground facilities of the mine. The risk during construction is
the potential collapse of only partially completed structures. To mitigate this risk, structures should
be assembled as much as possible on the ground before final construction. This minimises the
amount of time unfinished structures are left standing.
Unknown geology is a considerable risk during the construction of the underground access adits and
facilities. When coupled with the seismic risk in the area, the potential of a collapse occurring is
significant and the consequence in terms of costs, schedule variances and possible health and safety
is unacceptable. The geotechnical properties of the rock along the entire path of the adit need to be
established by core sampling, logging and testing so that the tunnel can be appropriately designed.
If incorrect geotechnical data is used, the tunnel may be under-designed which constitutes a major
construction and operating risk or it may be over-designed which will increase costs considerably.
The only place of major risk remains during construction is the working face. Strict work procedures
need to be adopted to ensure that no persons are in places of risk of rock fall or rock burst.
Two major construction items in the building of a mine are structural steel and electrical cabling and
wiring. The price of raw steel and copper directly affect the total cost of the project. The cost of
iron ore, the major component of steel, has fluctuated considerably over the past decade. This is
largely due to domination of the iron-ore industry by only a few producers and consumers. In recent
years, a new contracting system of 3-month price contracts based on market spot price was
introduced in lieu of the previous system of 1-year contracts at a negotiated price. Although this
new contract system has brought some stability to prices, there still remain significant fluctuations.
Frequent fluctuation in copper prices is also common. Contracts for purchasing bulk quantities of
steel and cabling should be made well ahead of the project construction start date to remove this

- 107 -
risk. Alternatively, fixed price construction contracts will also remove this risk as the cost of
procuring the steel and copper shifts to the contractor.
Another major risk to the project if not managed appropriately stems from the use of unskilled local
labour. Local labour will need to be trained by experts in correct work procedures, particularly
related to workplace health and safety. The use of local labour is desirable for multiple reasons. In
particular, it brings jobs to the local community which is important in building mine and local
community relationship. European Nickel’s is committed to social improvement associated with all
its projects. Further, it is financially unviable to use a complete expatriate workforce. There may
also be legal obligation for a percentage of the workforce to be Albanian. Allowances need to be
made in terms of budget and schedule for the training and education of the local workforce.
The final major risk identified during construction and mine development is strikes and protesting by
the local communities. The risk is potential disruption to scheduling and degradation of European
Nickel’s reputation at an international level. Although, the area has a history of mining and the key
way to mitigate this risk is provide open and clear information to the local communities on the mine
and its expected impacts on the environment and the nearby villages, offer priority employment to
locals and use local businesses wherever possible.
Table 12 below shows the reassessment of the project risks after mitigation has been considered.
Table 12 Potential project risks during construction and development (with mitigation)
Risk Likelihood Consequence Risk Rating
Seismic events 3 3 9
Unknown geology 2 3 6
Accidents due to unskilled labour 2 3 6
Copper and steel prices 3 2 6
Strikes from locals 1 3 3

- 108 -
12.2 Operations
The major project risks during mine operations are presented in Table 13.
Table 13 Potential project risks during operations (without mitigation)
Risk Likelihood Consequence Risk Rating
Seismic events 4 5 20
Poor extraction rates 3 5 15
Low commodity prices 3 5 15
High acid/sulphur prices 3 5 15
Asbestos & silica dust 3 4 12
Rock/ore stability 3 4 12
Power Failures 4 3 12
Accidents due to unskilled labour 3 4 12
Mine acid run-off 2 5 10
Dump failure 2 4 8
Subsidence 4 2 8
Environmental and mining law changes
3 2 6
Flooding 1 5 10
Political instability 1 5 5
Seismic events have been identified as the single, greatest risk to the Devolli project during
operations. The risks during operations due to a seismic event are significantly different to those
during construction. For example, there is a much larger ´workforce underground during production
than during development. Design of underground adits need to be able to withstand a large scale
earthquake. Ventilation raises also double as emergency exit points for workers. Seismic event also
affect key surface infrastructure. This includes the heap leach pad, the leach ponds and the
permanent dump and each of these plant items need to be designed to ensure acid leaks out to the
atmosphere.
Poor extraction rates, also identified in the processing section of this report, are a major risk to the
financial success of the project. This represents the greatest technical risk of the project as many
other nickel laterite projects have failed to achieve predicted production rates and recoveries. The
sensitivity analysis section of this report determined the financial effects of inaccuracies in correctly
determining leach chemistry. The only mitigation for this risk is to undertake further test work on
Devolli ore as recommended in Section 4.3. The success of the European Nickel Caldag mine in
Turkey will also give much greater confidence in the heap leaching technology and its use in Devolli.
From the sensitivity analysis (Section 15.6), it can be seen that commodity prices, in particular nickel
prices, have the largest impact on the profitability of this project. A strategy to protect the mine

- 109 -
from low nickel prices is to hedge part or all of the produced nickel for the life of the mine. This has
the advantage of removing the risk of low nickel prices. However, peaks in nickel price are lost and
with it, a considerable amount of profit. During the feasibility or detail design stage of this project, a
baseline nickel hedge level should be established. This hedge would be only for part of the
maximum amount of nickel the mine can produce per year. The production and hedge value should
reflect the minimum production possible to not make a loss and preferably keep all employees at
reduced workloads (e.g moving from 3 to 1 shift per day). The mine should be able to maintain this
position until prices recover. Leaching times should also be reduced so that sulphuric acid
consumption is minimised.
Sulphuric acid is the highest operating cost factor in the heap leaching process. Part of the strategy
to minimise exposure to fluctuating acid prices is to construct a sulphuric acid plant. The advantages
of the sulphuric acid plant are it removes risk of high sulphuric acid prices, it produces enough
electricity to power the mine and removes environmental and personnel risk of transporting large
quantities of a highly corrosive solution to site. Disadvantages are that the OPEX is now dependent
on sulphur prices and skilled workers are required to operate the plant. One kilogram of sulphur
when processed produces approximately 2.9 kilograms of sulphuric acid. Thus, transportation to site
requirements is reduced by over 60%. A long-term sulphur contract should be established to further
remove the risk of high prices.
Asbestos crystals are found in the footwall of the mine working. Asbestos and silica dust can be
liberated during any stage of blasting, sizing or transporting the ore. These dust elements may be a
significant risk to the health of employees if it is inhaled(Department of Industry and Resource,
2001). Where blasting is done, extra ventilation needs to be used to clear the work area. Spray jets
will be used to prevent dust generation at the crusher and along the conveyors.
For the remaining risks identified, the following mitigation methods are recommended:
Rock/Ore stability o More testing of ore body
Power failures o Sulphuric acid plant powers the site and if it is down then the national grid is used.
In the unlikely circumstance of both operations being out of order, backup diesel generators are installed for ventilation until the entire workforce vacates the mine. Power can then be switched to the heap leach pond pumps until power is restored.
Accidents due to unskilled labour o Unskilled local labour will be go through education and training programs
particularly in safety before commencing on-site work
Mine acid run-off o Heap leach pad drains into oversized leach ponds. The leach ponds then overflow
progressively into the different onsite dams

- 110 -
o To prevent acid run-off from the waste stockpile, testing of waste material before reclaiming is performed and rehabilitation is completed progressively on the main dump. Water from the dump also drains to a large evaporation pond.
Dump failure
o Low wall angles have been used in the design to give very stable design. The dump will also be environmentally restored as forest land progressively throughout the mine life.
Subsidence o Subsidence is likely to occur with room and pillar (stripping of pillars) ming and will
occur with longwall mining. There is no existing infrastructure above the mine area and all mine infrastructure (particularly the dump) is designed to be located outside of the subsidence area. Subsidence area calculations can be performed after more rock quality and strength data has been collected
Environmental and mining law changes o Original design to EU standards should be sufficient.
Flooding o Although no flooding has occurred in recent years, the processing plant is located in
a large flat area near the river. The design of the area will be suited for a once in a 1000 year flood through the area.
Political instability o Albania has aspirations to join the European Union and in recent years has been
politically stable. It is very unlikely for a political situation to occur that will
dramatically affect the mine
Based on the implementation of the recommended mitigation strategies, the new project risks are
shown below in Table 14.
Table 14 Potential project risks during operations (with mitigation)
Risk Likelihood Consequence Risk Rating
Seismic events 4 2 8
Poor extraction rates 2 4 8
Low commodity prices 3 3 9
High acid/sulphur prices 3 3 9
Asbestos & silica dust 2 3 6
Rock/ore stability 2 3 6
Power Failures 1 2 2
Accidents due to unskilled labour 2 3 6
Mine acid run-off 1 5 5
Dump failure 1 4 4
Subsidence 4 1 4
Environmental and mining law changes
1 2 2
Flooding 1 3 3
Political instability 1 5 5

- 111 -
12.3 Closure
The major risks to successful closure of the mine and rehabilitation of the area are presented below
in Table 15.
Table 15 Potential project risks during mine closure (without mitigation)
Risk Likelihood Consequence Risk Rating
Mine acid run-off 2 5 10
Adverse effect on community 3 3 9
Dump failure 2 4 8
Subsidence 4 2 8
Once again, mine acid run-off has been identified as a major project risk. The same mitigation
strategies recommended in the operations phase of the mine apply here. There is also the
additional risk of the left over acid in the HA PLS and LA PLS dam. These will be diluted and
neutralised at the end of mine life. Tests of the water will be conducted to confirm it is safe for
release into the environment. Periodic testing of the dams and the water run of from the waste
dump should be carried for a number of years following mine closure.
Another risk of the mine closure is the affect it will have on the local communities; particularly in loss
of direct and indirect employment. The opening of a mine in the area will create many opportunities
for locals but upon closure, the reverse is true. The cut back of staff numbers needs to be gradual
and the staff kept aware of the mine situation. If possible, equivalent positions should be made
available to staff in other European Nickel mines. A closure of the mine should be a gradual ramp
down instead of an abrupt stop. The local community is largely agricultural based prior to mining
and there is the potential to establish new local industries post-mining in the area.
Dump failure and subsidence were also risks identified during operations and the same mitigation
strategies recommended for that period also apply during closure.
The following table shows the re-assessed project risks when considering mitigation during mine
closure.
Table 16 Potential project risks during mine closure (with mitigation)
Risk Likelihood Consequence Risk Rating
Mine acid run-off 1 5 5
Adverse effect on community 2 2 4
Dump failure 1 4 4
Subsidence 4 1 4

- 112 -
13 Mine Closure and Decommissioning
At the end of the financial exploitation of a mineral deposit, the land must be returned to a
condition as close as possible to the state it was in pre-mining. The restored land can then be
returned for public use. Mine closure and restoration plans must be developed to comply with the
Mining Law of Albania and form an integral part of the permitting process. The restoration of the
project area requires equipment and labour which both cost money. Thus, plans must be made that
sufficient funds are kept from each year of production to cover mine closure expenses. At a pre-
feasibility level, mine closure and decommission is considered at a high level. A more detailed mine
closure plan is developed during the feasibility stage of a project.
13.1 Closure Plan Development
When developing a mine closure plan, the following four main objectives constantly need to be
considered:
Protect public health and safety
Eliminate or alleviate environmental damage
Return land to its original condition or an acceptable alternative. Examples of possible
acceptable alternatives including changing original forestry into agricultural land or addition
of dams and large water bodies
Provide sustainable social and economic benefits to the local community as a result of mine
development and operations
Figure 55 below is an example of the process steps required to develop a mine closure plan.

- 113 -
Figure 55 Mine closure plan development process flow chart
As shown in Figure 55, the development of a mine closure plan is not linear and requires several re-
iterations to optimize and balance the impacts and costs.
The Devolli project was separated into the following four sub-areas for planning the
decommissioning of the mine:
1. Mine
2. Heap leach pad
3. Precipitation plant other mine infrastructure
4. Dump
Each of the sub-areas have been individually analysed and closure recommendations are detailed
below.
13.1.1 Mine
The following mine closure actives are recommended for the successful decommissioning of the
mine area:
Mine equipment will be removed and resold or decommissioned
All reagents, fuel, oil and lubricants will be removed and properly disposed
Where appropriate, hanging structures will be progressive caved to prevent sudden large-
scale collapse in the future
The adit entries and ventilation shafts will be filled with 8-10m of waste material and then
capped with concrete to prevent people entering in the future

- 114 -
13.1.2 Heap leach pad
The heap leach pad, ponds and dams will required the following decommissioning activities:
Neutralization of all areas
Surface of the leach pad with be covered with 0.5m of soil and compacted
Leach ponds and dams will be treated so that water stored can be used by future agriculture
Subsoil and then top soil will be replaced separately. Either plantation of grass for livestock
or preparation for crops will be carried out depending on community consultation and
future land owners
Because of the leach times required for the ore, the decommissioning of the heap leach pad will
occur 4 to 6 months after the mine.
13.1.3 Precipitation plant and other mine infrastructure
The precipitation plant is a large capital expenditure item that will require, at the end of the mine
life, cleaning, dismantlement and finally sold for scrap. There are two options to extend the useable
life of the precipitation plant. The first is that ore is purchased from other deposits in the area. The
second is the precipitation plant is designed to be not one large process stream but a series of
smaller, containerized units. The logic in this second design is that each part of the precipitation
plant is built into containers. This greatly simplifies the construction and decommissioning of the
plant. At the end of the mine life, the precipitation plant is disconnected and shipped to the OEM.
After refurbishment and modification in-line with latest technology, European Nickel can use the
plant at a new nickel laterite deposit for a fraction of the cost to construct a new plant.
Other closure activities that are required are:
buildings will be demolished and removed from site
equipment will be salvaged or disposed offsite
In-ground concrete pipes will be drained, crushed and buried in place
HDPE pipes and electrical power lines will be disconnected, dismantled and removed from
site
All waste material, reagents, oil and lubricants will be disposed of correctly or sold back to
the supplier if possible
Roads will remain if required based on consultation with the local community
13.1.4 Leached ore dump
Nickel laterites when freshly agglomerated can have relatively good strength and permeability but as
the ore is leached, the geotechnical properties of the ore become very poor. In particular, the

- 115 -
material’s shear strength substantially decreases and permeability often decreases by up to a factor
of 100(Steemson, et al., 2009). This has a large impact on the final design of the material dump and
slope stability. The surface dump will be re-cultivated progressively throughout the mine life as
forestry. A periodic monitoring program for measuring the performance of the dump and the
quality of the water run-off will also be necessary.
13.2 Cost of Mine Closure
Mine closure costs should be reviewed annually during production to adjust for changes in mine and
plant design and rehabilitation rates. Legislation changes and expectations of the community should
also be re-considered annually to ensure the mine closure is plan is current. Re-sale of assets and
salvage values are also difficult to estimate so they should not be considered when estimating mine
closure costs. A mine closure guideline (Steffen, Robertson and Kirsten Inc., 1992) gives the estimate
mine closure cost as US$200 per hectare and this has been used for the Devolli project. As stated
previously, a more detailed mine closure plan needs to be developed during the feasibility study and
part of this includes a detailed cost breakdown.

- 116 -
14 Market Analysis
14.1 Nickel
Nickel is a vital element used extensively in the alloying of stainless steels and in special steels for
the chemical and aerospace industry. In pure form, nickel has a shiny, silvery, metallic appearance
and is malleable and corrosion resistive (Mineral Information Institute, 2011). This transition
element has both ferrous and non-ferrous properties (US Geological Survey, 2011). In fact, nickel
is one of only three elements, the others being iron and cobalt, known to be ferro-
magnetic(Mineral Information Institute, 2011).
14.1.1 Consumption
From the smelter, nickel is generally sold for first use either as a ferronickel product or as a refined
metal (US Geological Survey, 2011). Figure 56 and Figure 57 below show the first and final uses of
nickel in the industry.
Nickel First Uses
Figure 56 Nickel by first use(Nickel Institute, 2007)
Nickel End Uses
Figure 57 Nickel by end use(Nickel Institute, 2007)
From Figure 56, it can be seen that over 60% of all nickel is used for stainless steels. A further 22% is
used for non-ferrous and other steal alloys. Part of this 22% would be for nickel-base superalloys
which are used primarily in the aerospace industry for critical jet parts such as turbine blades and in
the power industry for parts in combustion turbines (US Geological Survey, 2011). Other uses for
nickel are in rechargeable batteries, coins, catalysts and plating (US Geological Survey, 2011).
14.1.2 Production
Nickel is produced from two main deposit classifications; laterites and sulphides. Laterite ores were
the initial source of nickel when it was first produced in the last 19th century in New Caledonia.
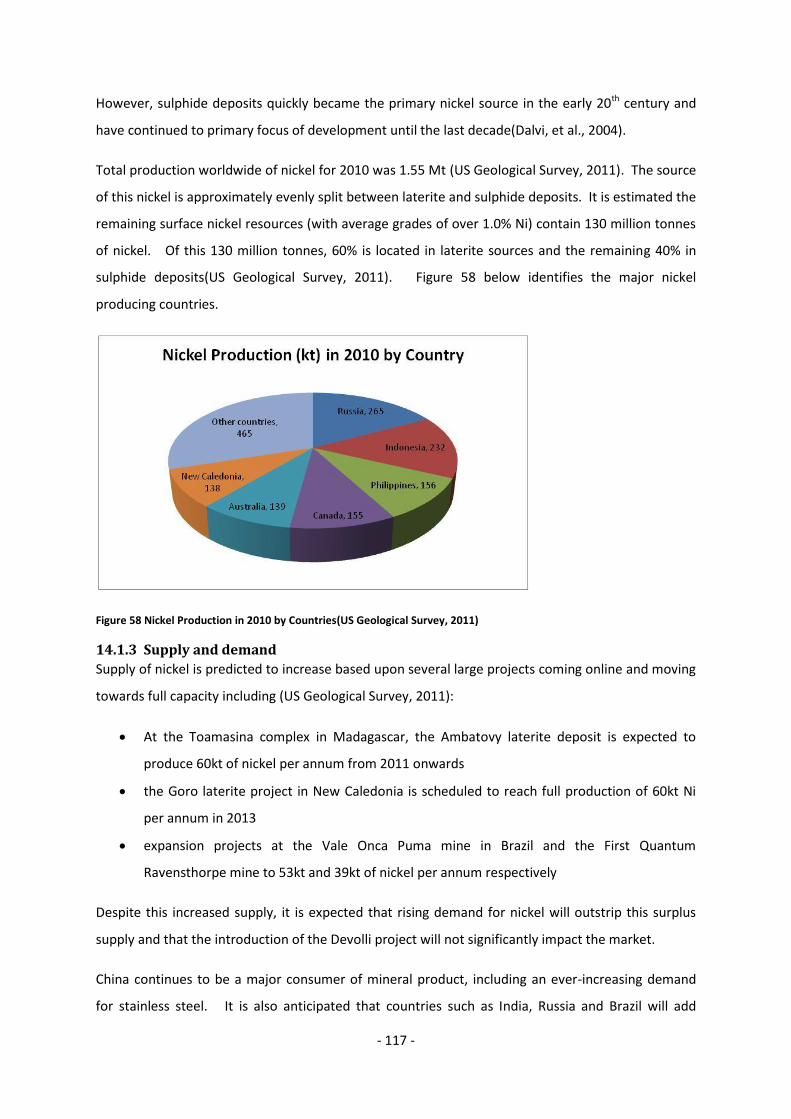
- 117 -
However, sulphide deposits quickly became the primary nickel source in the early 20th century and
have continued to primary focus of development until the last decade(Dalvi, et al., 2004).
Total production worldwide of nickel for 2010 was 1.55 Mt (US Geological Survey, 2011). The source
of this nickel is approximately evenly split between laterite and sulphide deposits. It is estimated the
remaining surface nickel resources (with average grades of over 1.0% Ni) contain 130 million tonnes
of nickel. Of this 130 million tonnes, 60% is located in laterite sources and the remaining 40% in
sulphide deposits(US Geological Survey, 2011). Figure 58 below identifies the major nickel
producing countries.
Figure 58 Nickel Production in 2010 by Countries(US Geological Survey, 2011)
14.1.3 Supply and demand
Supply of nickel is predicted to increase based upon several large projects coming online and moving
towards full capacity including (US Geological Survey, 2011):
At the Toamasina complex in Madagascar, the Ambatovy laterite deposit is expected to
produce 60kt of nickel per annum from 2011 onwards
the Goro laterite project in New Caledonia is scheduled to reach full production of 60kt Ni
per annum in 2013
expansion projects at the Vale Onca Puma mine in Brazil and the First Quantum
Ravensthorpe mine to 53kt and 39kt of nickel per annum respectively
Despite this increased supply, it is expected that rising demand for nickel will outstrip this surplus
supply and that the introduction of the Devolli project will not significantly impact the market.
China continues to be a major consumer of mineral product, including an ever-increasing demand
for stainless steel. It is also anticipated that countries such as India, Russia and Brazil will add

- 118 -
further pressure to the demand for stainless steel to meet their rising modernisation needs
(eResearch Corporation, 2009).
Other sources of increased nickel consumption are the automotive industry and the aeronautical
industry (US Geological Survey, 2011).
14.1.4 Alternatives/Substitutes
The large fluctuation of nickel prices in recent times has directly influenced the price of stainless
steels. It has been reported that construction companies are substituting stainless steel with other
low-nickel steels. Nickel-free speciality steels and titanium alloys are being used more frequently to
avoid high-nickel products(US Geological Survey, 2011).
The greatest risk to the price of nickel is the use of Chinese nickel pig iron (NPI) for the production of
low grade stainless steels. NPI is produced from high-iron laterite ores containing a low nickel grade.
Costs in China to produce NPI were predicted to be between US$ 7 and US$ 8 per pound including
credits from extra iron production and high iron ore costs at the time(Louiseize, 2008). The article
goes on to predict a nickel ceiling price of US$8/lb. Total NPI production capability in China is just
under 100kt of nickel per annum which is a significant addition to the market(Reuters, 2010).
14.1.5 Historical pricing
The price of nickel, as noted earlier, has greatly fluctuated in recent years. Figure 59 below shows
the average price of nickel from 1958 to 2010 in terms of actual value in that year and value in
today’s currency.
Figure 59 Average price of nickel from 1958 to 2010(Kuck, 1998; LME, 2011; inflationdata.com, 2011)

- 119 -
The global economic recession in late 2008 and 2009 significantly impacted on the price of nickel as
reported in the graph above (US Geological Survey, 2011). In mid-May 2007, nickel prices reached
an all time high on the London Metal Exchange (LME) with the buyer’s spot price exceeding
US$54,000 per tonne or US$24.5 per pound (Figure 60 below). Over the following three month
period the price dropped back to approximately US$12.7 per pound, almost half of the peak price
and in October 2010, the spot price for nickel fell as low as US$4.5 per pound. Since then, the price
of nickel has recovered rising to and remaining over US$9 per pound since June 2010. The average
nickel spot price on the London Metal Exchange for the month of April, 2011 was US$12 per pound.
Figure 60 LME spot prices for nickel over last 5 years(LME, 2011)
14.1.6 Future price prediction
The following price predictions for nickel have been forecast for the coming years:
Jim Lennon, executive director in commodities research with Macquarie Bank Limited in
London predicts a nickel ceiling price of US$8/lb due to the cost to produce Chinese nickel
pig iron as an alternative (Louiseize, 2008)
IGE Resources recently released the results of Preliminary Economic Assessment for their
nickel-sulphide Rönnbäcken project in Sweden. A nickel price of 9 US$/lb was used for the
base case economic analysis (IGE, 2011).
eResearch Corporation, based on expected demand in China, India, Russia and Brazil, have
predicted a 5-year nickel forecast nickel price ranging from 10 - 15 US$/lb (eResearch
Corporation, 2009).
Mindoro Resources recently completed the Preliminary Economic Assessment for the Agata
Nickel-laterite project in the Philippines. A nickel price of US$10/lb was used for the base
case economic analysis (Mindoro Resources Ltd., 2011).

- 120 -
Credit Suisse forecast a 2010 spot price of US$5.50/lb and long-term spot price of
US$6.50/lb(Credit Suisse, 2009). This price estimate was based on predicted over-supply
with several new projects coming online.
14.1.7 Project Pricing
Based on the market analysis and on recently completed studies for other nickel deposits, a nickel
price of US$9 /lb has been selected for this project.
14.2 Cobalt
Cobalt is a transition element that is bluish-white in appearance. It is a hard, brittle metal and is also
ferromagnetic. Since ancient times, cobalt compounds have been used to produce the colour blue in
ceramics and glass and in more recent-times, cobalt has been used extensively in alloys, batteries,
and as catalysts.
14.2.1 Consumption
Cobalt is primarily used for alloying in aircraft engine parts as well as wear and corrosion resistant
metals (Chermicool, 2011). Other uses for cobalt include rechargeable battery compounds and in
superalloys(US Geological Survey, 2011). Figure 61 below shows the variety of industries and
applications of cobalt.
Figure 61 Consumption of cobalt(Geovic Mining Corp, 2009)
14.2.2 Production
Cobalt is produced worldwide typically as a bi-product of either nickel or copper. In 2009, a total of
62,000 tonnes of cobalt was produced. The source of the cobalt is displayed below in Figure 62.
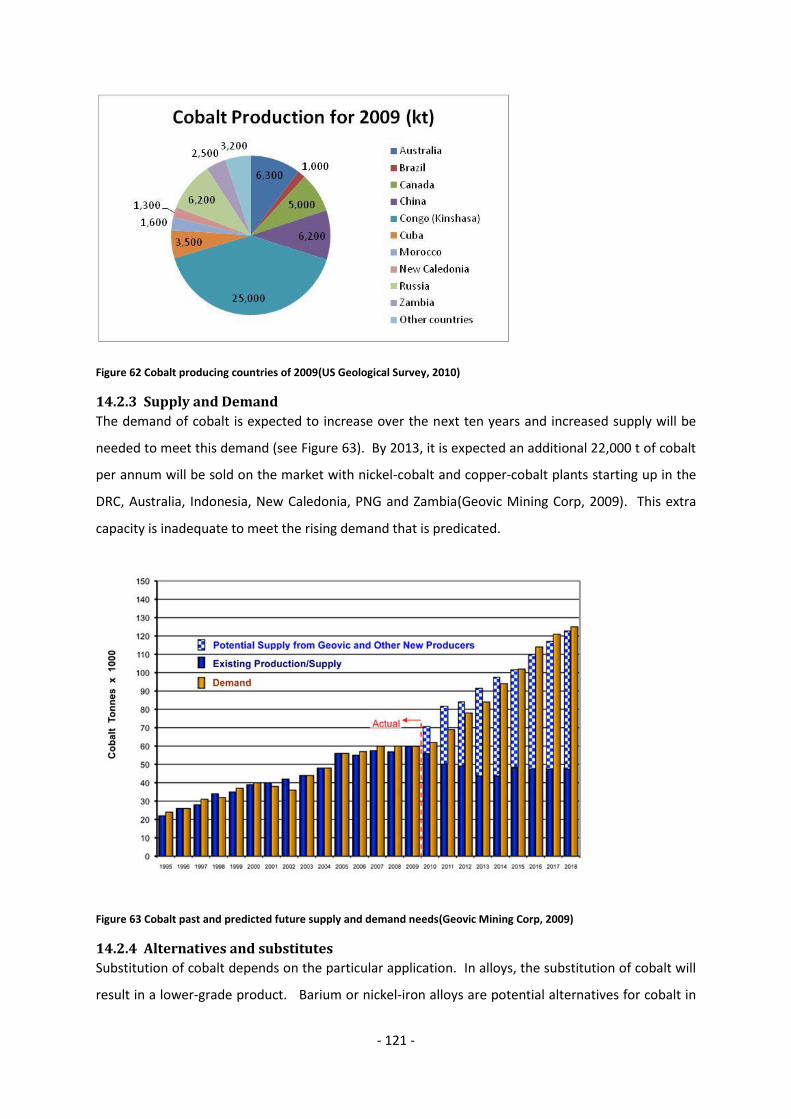
- 121 -
Figure 62 Cobalt producing countries of 2009(US Geological Survey, 2010)
14.2.3 Supply and Demand
The demand of cobalt is expected to increase over the next ten years and increased supply will be
needed to meet this demand (see Figure 63). By 2013, it is expected an additional 22,000 t of cobalt
per annum will be sold on the market with nickel-cobalt and copper-cobalt plants starting up in the
DRC, Australia, Indonesia, New Caledonia, PNG and Zambia(Geovic Mining Corp, 2009). This extra
capacity is inadequate to meet the rising demand that is predicated.
Figure 63 Cobalt past and predicted future supply and demand needs(Geovic Mining Corp, 2009)
14.2.4 Alternatives and substitutes
Substitution of cobalt depends on the particular application. In alloys, the substitution of cobalt will
result in a lower-grade product. Barium or nickel-iron alloys are potential alternatives for cobalt in

- 122 -
magnets. Nickel-based alloys or ceramics could be considered for engine parts. Cobalt is also used
in the oil and gas industry as a catalyst however nickel and hydroformylation catalysts are also
options.(US Geological Survey, 2010)
14.2.5 Historical pricing
Historically, cobalt prices have been determined by private contracts. On February 23, 2010, the
London Metal Exchange listed cobalt as a traded minor metal. Since listing, prices for the
commodity have generally floated between 36,000 and 39,000 US$/tonne though it has briefly
reached extreme maximum and minimum values of 44,500 and 34,000 US$/tonne(LME, 2011).
14.2.6 Project pricing
Based on the market research and price history, the cobalt price used for the project has been set at
a conservative US$ 37500/t (US$17/lb).

- 123 -
15 Economic Appraisal
15.1 Currency and Inflation
All CAPEX and OPEX estimates have been calculated in US Dollars. Nickel and cobalt pricing, as well
as smelter and refining charges, are also defined in US dollars. This means there is no significant
currency conversions for this project. During the feasibility study, the effects of Euro-US$ exchange
rate may should be considered if a significant amount of steel or machinery is being purchased from
within Europe.
As is common practice, inflation has not been incorporated in the discounted cash flow model. The
use of a discount rate covers reasonable future inflation.
15.2 Net Smelter Return
The net smelter return (NSR) costs were based on information supplied by Outotec(Lovén, 2009).
Table 17 summarises the key cost and pay elements.
Table 17 Net smelter return parameters
Payable Metals:
Nickel (Ni) 100% payable after 1.3% unit deduction
Copper (Cu) 90% payable
Cobalt (Co) 45% payable
Treatment Charge: 1.1 US$/lb payable nickel
Refining Charge:
Copper (Cu) 30% of copper price
Cobalt (Co) 35% of cobalt price
Penalty Elements: MgO, As,
15.3 Financial Model
The financial model used to evaluate this project was “discounted cash flow”. There are several key
variables to this model including:
Taxation rates and royalties
Discount rate
Depreciation
Pre-production time
Each of these parameters are analysed in detail below.

- 124 -
15.3.1 Corporate tax and royalties
The corporate taxation rate in Albania is a fixed rate of 10%(European Nickel, 2010). Tax is applied
on corporate profits after interest, depreciation and amortization.
Royalties are defined in the Mining Law of Albania to be 2% of the market value of the overall sold
mineral quantity. The 2% royalty is paid on all payable minerals before smelter/treatment charges
and deductions are considered.
15.3.2 Discount rate
A discount rate of 12% was selected for valuing the net present value (NPV) of the project. This
project is not without risk however it is in a politically stable country that actively encourages foreign
investment into the mining industry. The future outlook for nickel is positive with a favourable
deficit in sufficient future supply being anticipated. The discount rate is slightly to those used in
other nickel-laterite projects or for projects in Albania.
15.3.3 Depreciation
Depreciation is calculated using the straight line method (European Nickel, 2010). This is to be in
accordance with the Albanian tax regulations. Table 18 below shows the allowable rates for
different assets.
Table 18 Depreciation allowances
Asset Type Rate
Buildings and equipment 5%
Intangible assets 15%
Computers & IT systems 25%
Other depreciable assets 20%
Buildings include the cost to purchase or construction and any restoration or renovation
expenditure. It also includes the purchase of all long term fixtures and fittings.
Most of the depreciable capital expenditure is on infrastructure and equipment. Only a small
percentage of depreciable assets fall outside of this category. Thus, the depreciation rate of 5% will
be used.
15.3.4 Pre-production Time
Pre-production has been estimated at 2 years based on the schedule. Within this two year
timeframe, the mine design will be finalised; all mining equipment purchased and delivered; the
adit/s to the underground completed; and all ponds and the majority of the leach pad constructed.
Mining can commence before the completion of the precipitation plant due to the long leach times
and thus is not included in calculating the pre-production time.

- 125 -
15.3.5 Value added taxes
Albania has a value-added tax (VAT) rate of 20%. It has been stated by the client that the project will
be entitled to exemption from this tax for a majority of the imported equipment (European Nickel,
2010). Thus, VAT is not considered for any equipment and no percentage rate is applied.
15.3.6 Summary of discount cash flow model parameters
The key parameters required for the cash flow model are summarized below in Table 19.
Table 19 Discounted cash flow model parameters
Parameter Value
Corporate taxation rate 10%
Royalties 2%
Depreciation 5%
Discount rate 12%
Value-added tax 0%
Pre-production time 2 years
15.4 Base Case Results
There were seven different mining scenarios and 32 different raw material handling/processing
options that were costed for this project. Table 20 below shows the valid relationship between the
two sets. The mining codes are explained in Section 5.6 and the raw material handling/processing
options are detailed in Section 6.2.
Table 20 Valid mining & material handling/processing options
OPTIONS MINE
PROCESS 1RP1 1PP1 1LW1 2RP1 2PP1 2RP2 2PP2
1Pno1A TR y y
1Pno2A TR y y
1Pno2A CV y y y
1Phl1A TR y y
1Phl2A TR y y
1Phl1A TRms y y
1Phl2A TRms y y
1Phl2A CV y y y
1Phl2A CVms y y y
1Phl2A CVss y y y
1Phl2A CVmsss y y y
1Phl2A CVmsTR y y y
1Phl2A CVssTR y y y
1Phl2A CVmsssTR y y y
2Phl1A TR y y
2Phl2A TR y y

- 126 -
2Phl1A TRms y y
2Phl2A TRms y y
2Phl2A CV y y
2Phl2A CVms y y
2Phl2A CVss y y
2Phl2A CVmsss y y
2Phl2A CVmsTR y y
2Phl2A CVssTR y y
2Phl2A CVmsssTR y y
2Phl3A CV y y
2Phl3A CVms y y
2Phl3A CVss y y
2Phl3A CVmsss y y
2Phl3A CVmsTR y y
2Phl3A CVssTR y y
2Phl3A CVmsssTR y y
There are in total 72 valid combinations. The NPV was calculated for each of these options with cut-
of-grades ranging between 0.0% nickel and 1.3% nickel and production rates between 1000 and
15000 tonnes per day. The full list of results is attached in Appendix L. Table 21 below is a
summary of each of the mining options with their most financially profitable raw material handling
and processing method.
Table 21 Financial results for the different mining options
Mine Option
RMH/Process Option Cut-of-Grade (%Ni)
Production Rate (tpd)
NPV (M$)
IRR Payback Period
1RP1 1Phl2A CVmsTR 0.8 2000 -34 -6% -
1PP1 1Phl1A TRms 0.8 2000 -42 -6% -
1LW1 1Phl2A CVmsTR 0.7 5000 -21 7% 5
2RP1 2Phl2A CVmsTR 0.8 2000 -49 -14% -
2PP1 2Phl2A CVmsTR 0.9 2000 -58 -18% -
2RP2 2Phl3A CVmsTR 0.8 2000 -69 - -
2PP2 2Phl3A CVmsTR 0.9 2000 -77 - -
One of the largest OPEX items for the Devolli project is the cost of sulphur to produce sulphuric acid.
Table 22 below is a summary of key financial parameters for each mining method with a 20%
reduction in the sulphur price.
Table 22 Financial results for the different mining options with 20% reduction in sulphur price
Mine Option
RMH/Process Option Cut-of-Grade (%Ni)
Production Rate (tpd)
NPV (M$)
IRR Payback Period
1RP1 1Phl2A CVmsTR 0.5 4000 -23.0 5% 5
1PP1 1Phl2A CVmsTR 0.7 4000 -27.8 3% 5
1LW1 1Phl2A CVms 0.5 10000 15.6 15% 4

- 127 -
2RP1 2Phl2A CVmsTR 0.6 3000 -36.5 0% -
2PP1 2Phl2A CVmsTR 0.7 3000 -53.9 -8% -
2RP2 2Phl3A CVmsTR 0.6 4000 -58.9 -7% -
2PP2 2Phl3A CVmsTR 0.7 4000 -68.5 -9% -
15.5 Financial Appraisal
For a project to be considered for further development at the end of the pre-feasibility stage, the
following criteria usually need to be met:
A positive NPV
IRR over 20% or 25%
Undiscounted payback period of 2 or 3 years
Based on Table 21 above, none of the mine options have a positive NPV and thus are unsuitable for
further development. The results were re-run with sulphur price reduced by 20%. In this case, the
longwall mining option produced a positive NPV. The payback period of 4 years and only an IRR of
15% meant that this option was still unacceptable.
Two options were selected for sensitivity analysis. The first in the longwall option with conveyors to
the heap leach pad via a mine stockpile (1Phl2A CVms) since it was the only option that gave a
positive NPV. The second option analysed in more detail is the single product room-and-pillar option
(1RP1) with conveyors from underground to the mine stockpile and the remaining transportation by
surface trucks (1Phl2A CVmsTR).
15.6 Sensitivity Analysis
The sensitivity analyses were performed to give an indication of the effect different variables have
on the profitability of the project. The following two analyses were performed for the two options
selected above:
Net Present Value verse Variations in Four Key Cost Factors
Net Present Value zero-line due to nickel and sulphur price
15.6.1 Variations in Four Key Cost Factors
The first sensitivity analysis is a study on the effect four key cost elements have on the total project.
The spider graph produced will give a reasonable indication on when this project will become
financially interesting. The four parameters identified as having the largest effect on the project
NPV, their base values and their maximum and minimum values are summarised in Table 23 below.
The minimum and maximum values were calculated using ±25% of the base value.

- 128 -
Table 23 Sensitivity analysis key parameters
Parameter Unit Min Value Base Value Max Value
Nickel Price US$/lb 6.75 9 11.25
Sulphur Price US$/tonne 150 200 250
Heap leach recovery % 52.5 70 87.5
Treatment charges US$/lb Ni 0.825 1.1 1.375
Figure 64 below shows the result of the sensitivity analysis for the longwall mine and Figure 65 for
the room and pillar mine.
Figure 64 Sensitivity analysis for room-and-pillar option
Figure 65 Sensitivity analysis for longwall option
The sensitivity analyses were quite similar for both options and the scale of the effect due to each
parameter is comparable. Nickel price has the largest impact on the overall project profitability. The
second most critical factor was the price of sulphur which altered the final NPV of longwall option by

- 129 -
more than ± USM 150 with only a change of 25% in the price. Sulphur prices have been more than
±50% from the base price in the past. Nickel recovery did not have such a large impact on the NPV
although this was anticipated the acid consumption is directly linked to nickel recovery.
15.6.2 Net Present Value zero-line due to nickel and sulphur price
Although the project is no feasible now, there will be a time in the future that it will be. The NPV
zero-line is a graph that is designed to give some indication of what nickel/sulphur price the project
once again becomes a possibility. The results are shown below in Figure 66 and Figure 67.
Figure 66 NPV zero-line due to nickel and sulphur price for room-and-pillar option
Figure 67 NPV zero-line due to nickel and sulphur price for longwall option

- 130 -
The zero-line is the blue line in both Figures and it represents at what point the project has a positive
NPV. The project needs to be below and right of this line to make money. To give a concept of
scale, lines showing NPVs of US$ 50, 100 and 150 million have also be included. Thus for the
longwall project to make over US$150M will a sulphur price of US$ 200 / tonne, a long-term nickel
price of over US$11.50 per pound is required.

- 131 -
16 Recommendations
Unfortunately, at the present time the Devolli nickel project is not financially viable in the
foreseeable future unless there is a rise in nickel prices or a sharp drop in sulphur prices. It is the
recommendation of this report that European Nickel ceases investigation into this deposit.
In the future if market conditions are favourable to the reassessment of the Devolli project, it is
strongly recommended that the following test work be completed before the project enters
feasibility:
Closer-spaced, surveyed drilling throughout the deposit particular to confirm ore boundaries
and to identify and accurately map faults
Mapping of the different laterite zones (saprolite, transition and limonite) is completed by an
onsite geologist
Geotechnical core tests on more samples from different areas around the deposit to form a
representative estimate of conglomerate, ore and serpentinite geotechnical parameters
Additional leach column tests on both mixed and saprolite ore so that an accurate model of
leach kinetics can be constructed and optimized
Leach testing should be performed to imitate a stope leaching operation as it is anticipated that
operating costs and available resource will be favourable compared to traditional methods

- 132 -
17 Conclusion
This report concludes that mining the Devolli deposit is not feasible and that the project should not
be progressed further in the design stage in the foreseeable future.
The project has an indicated resources of 48.7 million tonnes of laterite ore with average grade of
nickel of 1.13% and cobalt of 0.04%. Closer drillholes sampling and mapping of the different laterite
zones is required before this resource could be upgraded.
The project was designed with two different mine systems; room-and-pillar and longwall mining.
The variation of the room-and-pillar design Post room-and-pillar was also costed. The geotechnical
information supplied by the Client may have been excessively conservative due to the lack of quality
assurance information for the samples. This led to a conservative design for the room-and-pillar
method and low level of extraction.
The processing technologies for nickel laterite ores were reviewed and heap leaching was selected
as the most appropriate. The main reasons heap leaching was viewed as the most appropriate was
it suited the Devolli ore, has a low power consumption and European Nickel have a history with this
type of plant. A slight alternative to the normal heap leach design is the creation of two leach pads;
a quick leach pad for saprolite ore and a long leach pad for mixed ore. Due to insufficient column
test data, this option could not be fully explored but may be a point of interest in future studies. The
cost of processing the nickel laterite ores is many times the mining cost. This is due to the large
amounts of sulphuric acid required; over 500kg per tonne of ore. A sulphuric acid plant was
recommended for the project to reduce the cost of acid and risk of large fluctuations in acid prices.
Despite this, sulphur still is the largest cost for the operation of the mine and a long term supply
contract may be the most suitable way to mitigate this risk.
An environmental impact assessment was completed for the Devolli project. It was found that there
are no significant risks to environment that cannot be mitigated with reasonable design choices and
policies.
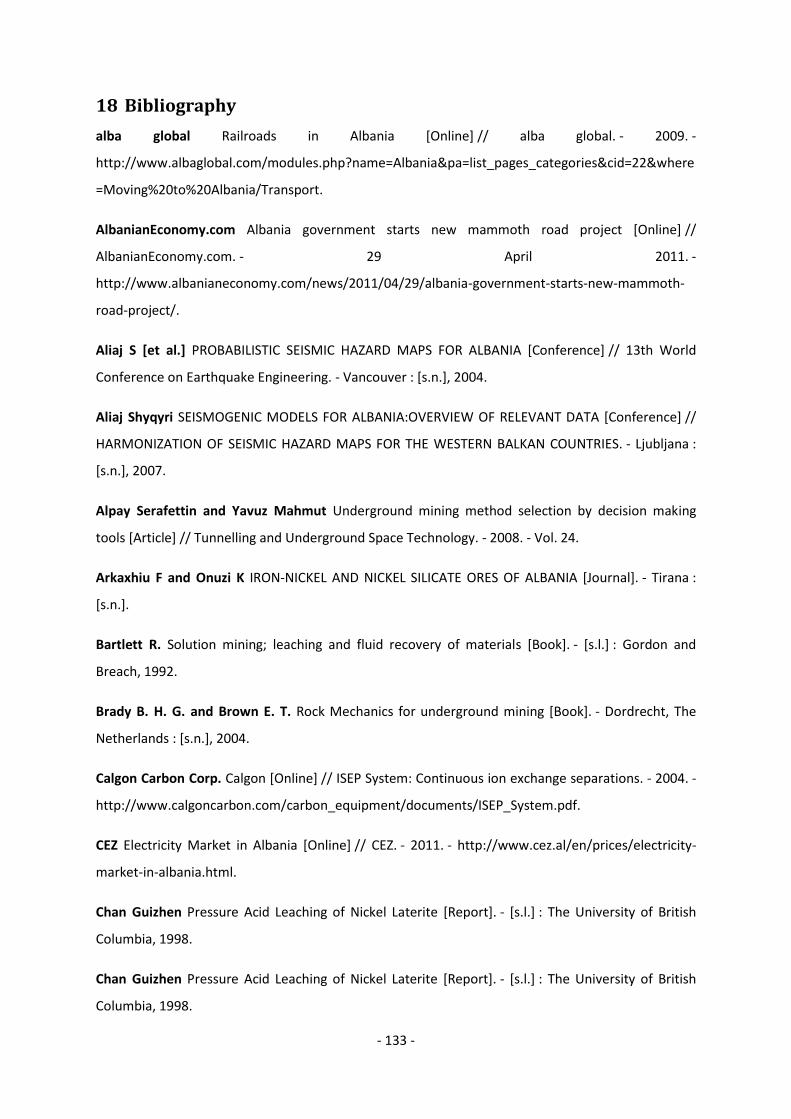
- 133 -
18 Bibliography
alba global Railroads in Albania [Online] // alba global. - 2009. -
http://www.albaglobal.com/modules.php?name=Albania&pa=list_pages_categories&cid=22&where
=Moving%20to%20Albania/Transport.
AlbanianEconomy.com Albania government starts new mammoth road project [Online] //
AlbanianEconomy.com. - 29 April 2011. -
http://www.albanianeconomy.com/news/2011/04/29/albania-government-starts-new-mammoth-
road-project/.
Aliaj S [et al.] PROBABILISTIC SEISMIC HAZARD MAPS FOR ALBANIA [Conference] // 13th World
Conference on Earthquake Engineering. - Vancouver : [s.n.], 2004.
Aliaj Shyqyri SEISMOGENIC MODELS FOR ALBANIA:OVERVIEW OF RELEVANT DATA [Conference] //
HARMONIZATION OF SEISMIC HAZARD MAPS FOR THE WESTERN BALKAN COUNTRIES. - Ljubljana :
[s.n.], 2007.
Alpay Serafettin and Yavuz Mahmut Underground mining method selection by decision making
tools [Article] // Tunnelling and Underground Space Technology. - 2008. - Vol. 24.
Arkaxhiu F and Onuzi K IRON-NICKEL AND NICKEL SILICATE ORES OF ALBANIA [Journal]. - Tirana :
[s.n.].
Bartlett R. Solution mining; leaching and fluid recovery of materials [Book]. - [s.l.] : Gordon and
Breach, 1992.
Brady B. H. G. and Brown E. T. Rock Mechanics for underground mining [Book]. - Dordrecht, The
Netherlands : [s.n.], 2004.
Calgon Carbon Corp. Calgon [Online] // ISEP System: Continuous ion exchange separations. - 2004. -
http://www.calgoncarbon.com/carbon_equipment/documents/ISEP_System.pdf.
CEZ Electricity Market in Albania [Online] // CEZ. - 2011. - http://www.cez.al/en/prices/electricity-
market-in-albania.html.
Chan Guizhen Pressure Acid Leaching of Nickel Laterite [Report]. - [s.l.] : The University of British
Columbia, 1998.
Chan Guizhen Pressure Acid Leaching of Nickel Laterite [Report]. - [s.l.] : The University of British
Columbia, 1998.

- 134 -
Chase Frank, Worley Phyllip and McComas Allen Longwall Shield Recovery Using Mobile Roof
Supports [Conference]. - 2006.
Chermicool Cobalt Element Facts [Online] // Chemicool. - 21 February 2011. -
http://www.chemicool.com/elements/cobalt.html.
Christopher Peter A TECHNICAL SUMMARY REPORT GJEGJAN PROJECT, ALBANIA [Report]. -
Vancouver : [s.n.], 2009.
CIA Central Intelligence Agency [Online] // World Factbook: Albania. - May 17, 2011. -
https://www.cia.gov/library/publications/the-world-factbook/geos/al.html.
Credit Suisse Australian Junior Nickels [Online] // Scribd. - March 26, 2009. -
http://www.scribd.com/doc/37056779/Nickel-Market.
Culture Crossing Albania [Online] // Culture Crossing. -
http://www.culturecrossing.net/basics_business_student_details.php?Id=12&CID=2.
Dalvi Dr. Ashok D., Bacon Dr. W. Gordon and Osborne Mr. Robert C. The Past and the Future of
Nickel Laterites [Conference] // PDAC 2004 International Convention. - Ontario, Canada : [s.n.], 2004.
Dalvi Dr. Ashok D., Bacon Dr. W. Gordon and Osborne Mr. Robert C. The Past and the Future of
Nickel Laterites [Conference] // PDAC 2004 International Convention. - 2004.
Dalvi Dr. Ashok D., Bacon Dr. W. Gordon and Osborne Mr. Robert C. The Past and the Future of
Nickel Laterites [Conference] // PDAC 2004 International Convention. - Ontario, Canada : [s.n.], 2004.
Department of Industry and Resource MANAGEMENT OF ASBESTOS IN MINING OPERATIONS
[Report]. - Perth : [s.n.], 2001.
Department of Resources, Tourism and Industry Risk Assessment and Management [Online] //
Department of Resources, Tourism and Industry. - May 2008.
Energy Community Regulatory Board National Report: Albania [Report]. - 2008.
eResearch Corporation eResearch: The Nickel Market [Online] // http://www.investorideas.com. -
February 2009. - http://www.investorideas.com/Research/PDFs/Nickel_Feb_2009.pdf.
European Nickel EMC Case Study - Student Introduction [Report]. - 2010.
GBM SCOPING STUDY FOR NICKEL LATERITE OPTIONS IN ALBANIA FOR BALKAN RESOURCES
[Report]. - 2008.

- 135 -
Geovic Mining Corp Cobalt Mining & Cobalt Demand [Online] // Geovic Mining Corp. - 2009. -
http://www.geovic.net/cobalt_mining.php.
Human L, Doolan J and Potts L Mine Wide Risk Assessment – What is the State of your Arteries
[Conference] // Queensland Mining Industry Health and Safety Conference. - Brisbane : [s.n.], 2006.
Hustrulid William A. Underground mining methods: engineering fundamentals and international
case studies [Book]. - [s.l.] : SME, 2001.
ICIS Sulfuric acid market seeks balance [Online] // ICIS.com. - Sep 3, 2010. -
http://www.icis.com/Articles/2010/09/06/9390780/sulfuric-acid-market-seeks-balance.html.
IGE Updated Preliminary Economic Assessment adds resources and value to the Rönnbäcken Nickel
Project [Online] // IGE. - 30 March 2011. - http://www.ige.se/pressreleases.aspx?r_id=558796.
inflationdata.com Historical Inflation [Online] // inflationdata.com. - Apr 2011. -
http://inflationdata.com/inflation/Inflation_Rate/HistoricalInflation.aspx?dsInflation_currentPage=4
.
Joint Ore Reserves Committee (JORC) The JORC Code: Australasian Code for Reporting of
Exploration Results,Mineral Resources and Ore Reserves. - 2004.
King M. Nickel Laterite Technology - Finally a New Dawn? [Journal] // Journal of the Minerals, Metals
and Materials Society. - 2005.
Kuck Peter H. Nickel [Online] // USGS Minerals: Nickel. - 1998. -
http://minerals.usgs.gov/minerals/pubs/commodity/nickel/500798.pdf.
LME Cobalt Price Graph [Online] // London Metal Exchange. - May 22, 2011. -
http://www.lme.com/minormetals/cobalt_graph.asp.
LME LME Nickel price graph [Online] // London Metal Exchange. - 22 May 2011. -
http://www.lme.com/nickel_graphs.asp.
Louiseize Kelly Creating a ceiling for future nickel prices: China's solution to high-priced nickel
[Online] // Northern Ontairo Business. - 15 December 2008. -
http://www.northernontariobusiness.com/Industry-News/mining/Creating-a-ceiling-for-future-
nickel-prices.aspx.
Lovén Pekka Outotec: Mining Technology and Economics Lectures [Report]. - Helsinki, Finland :
[s.n.], 2009.

- 136 -
Mindoro Resources Ltd. Mindoro Commences Agata Nickel Pre-Feasibility Study and Makes Key
Appointments [Online] // Mindoro Resources Ltd. Press Releases. - 21 April 2011. -
http://www.mindoro.com/s/PressReleases.asp?ReportID=452910&_Type=Press-
Releases&_Title=Mindoro-Commences-Agata-Nickel-Pre-Feasibility-Study-and-Makes-Key-
Appointm....
Mindoro Resources Ltd. Mindoro Commences Infill Drilling of High Grade Nickel Laterite at Agata
Project. [Online] // Mindoro Resources Ltd.. - 09 04 2010. -
http://www.mindoro.com/s/PressReleases.asp?ReportID=394204&_Title=Mindoro-Commences-
Infill-Drilling-of-High-Grade-Nickel-Laterite-at-Agata-Pr.
Mineral Information Institute Mineral Photos - Nickel [Online] // MII: Mineral Information
Institute. - 2011. - http://www.mii.org/Minerals/photonickl.html.
Morrison R.G.K. AW Philosophy of Ground Control [Journal]. - McGill University, Montreal, Canada :
[s.n.], 1976.
Myszkowski M and Paschedag U Longwall mining in seams of medium thickness [Report]. - [s.l.] :
Bucyrus, 2010.
NASA GISS Surface Temperature Analysis (GISTEMP) [Online] // National Aeronautics and Space
Administration: Goddard Institute for Space Studies. - 2011. -
http://data.giss.nasa.gov/work/gistemp/STATIONS//tmp.601136290000.1.1/station.txt.
Nicholas D.E. Method Selection – A Numerical Approach. Design andOperation of Caving and
Sublevel Stoping Mines [Conference] // SME-AIME. - New York : [s.n.], 1981.
Nickel Institute Nickel and its Uses [Online] // Nickel Institute. - 2007. -
http://www.nickelinstitute.org/index.cfm/ci_id/13.htm.
Ozfirat M and Gonen S A brief comparison of longwall methods used at mining of thick coal seams
[Conference]. - Izmir, Turkey : [s.n.], 2005.
PWK Resources Devolli Nickel Feasibility Study [Report]. - Delft, The Netherlands : [s.n.], 2010.
PWK Resources Devolli Nickel Feasibility Study [Report]. - Delft, The Netherlands : [s.n.], 2010.
PWK Resources Devolli Nickel Feasibility Study [Report]. - Delft, The Netherlands : [s.n.], 2010.
PWK Resources Feasibility of Devolli Nickel Project [Report]. - Delft, The Netherlands : [s.n.], 2010.

- 137 -
Reuters China's nickel pig iron output rises on price, demand [Online] // Reuters. - 27 April 2010. -
http://www.reuters.com/article/2010/04/27/china-nickel-idUSTOE63Q08420100427.
Sharples B. tehage.com.au [Online] // BHP to tackle Ravensthorpe's laterite. - May 20, 2008. -
http://news.theage.com.au/business/bhp-to-tackle-ravensthorpes-laterite-20080520-2ga0.html.
SME SME Mining Engineering Handbook [Book]. - 1992. - Vol. 2ed.
Steemson ML and Smith ME THE DEVELOPMENT OF NICKEL LATERITE HEAP LEACH PROJECTS
[Conference] // ALTA 2009 Nickel/Cobalt Conference. - Perth, Australia : [s.n.], 2009.
University of New South Wales UNSW Risk Consequence Assessment Tool [Online] // UNSW. - 19
March 2010. -
http://www.fin.unsw.edu.au/files/forms/rmu/UNSW_Risk_Risk_Assessment_Tool.pdf.
US Geological Survey Cobalt [Online] // USGS. - 18 May 2011. -
http://minerals.usgs.gov/minerals/pubs/commodity/cobalt/.
US Geological Survey Cobalt (2010 report) [Online] // USGS. - January 2010. -
http://minerals.usgs.gov/minerals/pubs/commodity/cobalt/mcs-2010-cobal.pdf.
US Geological Survey Nickel [Online] // USGS: Minerals. - 18 April 2011. - 21 May 2011. -
http://minerals.usgs.gov/minerals/pubs/commodity/nickel/.
US Geological Survey Nickel (2011 report) [Online] // USGS: Minerals. - January 2011. - 21 May
2011. - http://minerals.usgs.gov/minerals/pubs/commodity/nickel/mcs-2011-nicke.pdf.
USGS Earthquakes Albania [Online] // USGS Earthquakes. - May 28, 2011. -
http://earthquake.usgs.gov/earthquakes/recenteqsww/Quakes/us2009lfb6.php.
WA Today watoday.com.au [Online] // BHP sells Ravensthorpe mine for $376 million. - Dec 9,
2009. - http://www.watoday.com.au/business/bhp-sells-ravensthorpe-mine-for-376-million-
20091209-kio7.html.
Wedderburn B. Nickel Laterite Processing: A shift towards heap leaching [Conference] // ALTA
Conference. - Sydney : [s.n.], 2009.
World Weather Online KORCE, ALBANIA WEATHER AVERAGES [Online] // World Weather Online. -
2011. - http://www.worldweatheronline.com/weather-
averages/Albania/50709/Korce/56988/info.aspx.

- 138 -
![SECURE AND HIDDEN TEXT USING AES CRYPTOGRAPHY AND …jestec.taylors.edu.my/Vol 14 issue 3 June 2019/14_3_24.pdf · different key lengths: AES-128, AES-192 or AES-256 [11]. A number](https://static.fdocuments.us/doc/165x107/5f1a8879709d8948ae6586af/secure-and-hidden-text-using-aes-cryptography-and-14-issue-3-june-201914324pdf.jpg)