AES BIOFLUX · AES BIOFLUX Advances in Environmental Sciences - International Journal of the...
13
AES Bioflux, 2016, Volume 8, Issue 2. http://www.aes.bioflux.com.ro 135 AES BIOFLUX Advances in Environmental Sciences - International Journal of the Bioflux Society Differences in canopy structure among major plant communities in the fragmented swamp forest of Southern Sumatra 1 Yudi Setiawan, 2 Rachmad Hermawan, 2 Harnios Arief, 1 Hefni Effendi, 1 Muhammad I. Lubis, 1 Prita A. Permatasari, 1 Luluk D. W. Handayani 1 Center for Environmental Research, Bogor Agricultural University, Kampus IPB Darmaga, Bogor 16680, Indonesia; 2 Department of Forest Resources Conservation and Ecotourism, Faculty of Forestry, Bogor Agricultural University, Kampus IPB Darmaga, Bogor 16680, Indonesia. Corresponding author: Y. Setiawan, [email protected] Abstract. The recovery of fragmented swamp forest is an important issue in biodiversity conservation. There have been few attempts to fit recovery success with the characteristics of the plant communities. Here we attempt to examine the recovery process in the fragmented swamp forest by two approaches. First, we used hemispherical photography to provide canopy cover and then estimated the composition and configuration of three different ecosystems in the swamp forest. Second, we observed the species and community composition of these regions. The results showed that the fragmented swamp forest was characterized by different forest compositions, with various indicator species respectively. There were also clear indications for the presence of a few pioneer species such as Macaranga pruinosa and Syzygium palembanicum, and different successional stages of the forest were found up to 500 m from the river. Based on field-measured canopy cover, these pioneer species occurred in riparian ecosystem with solar radiation level that was significantly higher than the secondary swamp forest. Although the validation of the relationships between the plant communities characteristics and the leaf area index (LAI) generated by Landsat satellite data was difficult to be achieved in this study, but the result of vegetation analysis in this study provided important advantage. The field measured data created a unique opportunity to incorporate data at a detail scale. This contrasts with allometric measurements of forest canopies, which usually cover areas much smaller than satellite image pixels. These advantages can be explored in future work by comparing reflectance to both high resolution image and ground data in a variety of locations. Key Words: swamp forest, plant community, canopy cover, Landsat, Sumatra. Introduction. Tropical swamp forests have an important role in maintaining biodiversity, hydrology, climate and terrestrial carbon storage (Ozanne et al 2003; Page et al 2002). Recently, the awareness of tropical swamp forests has increased considerably since it contributes to loss of biodiversity, greenhouse gases emission, and land degradation (Lewis et al 2009). Most primary swamp forests in Indonesia, especially the lowland of Sumatra, have been converted into large scale of oil palm and industrial timber plantations (Ministry of Forestry 2011). Habitat loss and fragmentation of the swamp forest are two of the major threats to biodiversity (Andren 1994). In terms of forest ecosystem recovery, regeneration is defined as a long-term directional change in plant community composition, structure and function following a disturbance event (Ghazoul & Sheil 2010). Distance from remnant forest patches or seed trees can significantly affect the recovery of the ecosystem (Cole et al 2010). The first arrivals in a recently cleared forest patch are usually ferns, herbs, shrubs and climbers (Finegan 1996). Furthermore, the initial ground cover renders the environment less hostile and allows more species to inhabit the habitat like pioneer tree species, which quickly become dominant (Chazdon 2008). The question whether at least some plant species can survive in the fragmented swamp forest and regeneration patterns has become important.
Transcript of AES BIOFLUX · AES BIOFLUX Advances in Environmental Sciences - International Journal of the...

AES Bioflux, 2016, Volume 8, Issue 2. http://www.aes.bioflux.com.ro 135
AES BIOFLUX Advances in Environmental Sciences - International Journal of the Bioflux Society Differences in canopy structure among major plant communities in the fragmented swamp forest of Southern Sumatra 1Yudi Setiawan, 2Rachmad Hermawan, 2Harnios Arief, 1Hefni Effendi, 1Muhammad I. Lubis, 1Prita A. Permatasari, 1Luluk D. W. Handayani
1 Center for Environmental Research, Bogor Agricultural University, Kampus IPB Darmaga, Bogor 16680, Indonesia; 2 Department of Forest Resources Conservation and Ecotourism, Faculty of Forestry, Bogor Agricultural University, Kampus IPB Darmaga,
Bogor 16680, Indonesia. Corresponding author: Y. Setiawan, [email protected]
Abstract. The recovery of fragmented swamp forest is an important issue in biodiversity conservation. There have been few attempts to fit recovery success with the characteristics of the plant communities. Here we attempt to examine the recovery process in the fragmented swamp forest by two approaches. First, we used hemispherical photography to provide canopy cover and then estimated the composition and configuration of three different ecosystems in the swamp forest. Second, we observed the species and community composition of these regions. The results showed that the fragmented swamp forest was characterized by different forest compositions, with various indicator species respectively. There were also clear indications for the presence of a few pioneer species such as Macaranga pruinosa and Syzygium palembanicum, and different successional stages of the forest were found up to 500 m from the river. Based on field-measured canopy cover, these pioneer species occurred in riparian ecosystem with solar radiation level that was significantly higher than the secondary swamp forest. Although the validation of the relationships between the plant communities characteristics and the leaf area index (LAI) generated by Landsat satellite data was difficult to be achieved in this study, but the result of vegetation analysis in this study provided important advantage. The field measured data created a unique opportunity to incorporate data at a detail scale. This contrasts with allometric measurements of forest canopies, which usually cover areas much smaller than satellite image pixels. These advantages can be explored in future work by comparing reflectance to both high resolution image and ground data in a variety of locations. Key Words: swamp forest, plant community, canopy cover, Landsat, Sumatra.
Introduction. Tropical swamp forests have an important role in maintaining biodiversity, hydrology, climate and terrestrial carbon storage (Ozanne et al 2003; Page et al 2002). Recently, the awareness of tropical swamp forests has increased considerably since it contributes to loss of biodiversity, greenhouse gases emission, and land degradation (Lewis et al 2009). Most primary swamp forests in Indonesia, especially the lowland of Sumatra, have been converted into large scale of oil palm and industrial timber plantations (Ministry of Forestry 2011). Habitat loss and fragmentation of the swamp forest are two of the major threats to biodiversity (Andren 1994).
In terms of forest ecosystem recovery, regeneration is defined as a long-term directional change in plant community composition, structure and function following a disturbance event (Ghazoul & Sheil 2010). Distance from remnant forest patches or seed trees can significantly affect the recovery of the ecosystem (Cole et al 2010). The first arrivals in a recently cleared forest patch are usually ferns, herbs, shrubs and climbers (Finegan 1996). Furthermore, the initial ground cover renders the environment less hostile and allows more species to inhabit the habitat like pioneer tree species, which quickly become dominant (Chazdon 2008). The question whether at least some plant species can survive in the fragmented swamp forest and regeneration patterns has become important.

AES Bioflux, 2016, Volume 8, Issue 2. http://www.aes.bioflux.com.ro 136
Some major plant communities characterize the canopy structure of a habitat, which refers to the distribution of positions, orientations, areas and shapes of various plant organs such as leaves and stems (Campbell & Norman 2003). Canopy structure of forested area is a useful metric for evaluation of biodiversity (Koy et al 2005), forest structure classification (Lee & Lucas 2007), characterization of carbon sinks (Chopping et al 2008), and forest fire behavior and fuel models (Rollins & Frame 2006).
Leaf area index (LAI) is a commonly used parameter for quantifying canopy properties (Eschenbach & Kappen 1996). Many methods are available to measure LAI directly, but they are difficult, extremely labor intensive, destructive, time and money consuming, require many replicates to account for spatial variability in the canopy and cannot be applied to large areas (Clough et al 1997). Consequently, indirect measures of LAI using ground-based instruments have long been implemented as documented by the previous studies (Chen et al 1997; Cutini et al 1998; Breda 2003). Such techniques assumed that leaf area can be calculated from the fraction of direct solar radiation which penetrates the canopy.
Hemispherical photography (also known as fish-eye photography) has long been used for the indirect optical measurement of forest canopy (Evans & Coombe 1959). Fish-eye photography enables characterization of forest canopy by means of photographs taken looking upward through an extreme wide-angle lens (Jonckheere et al 2004). Hemispherical image provides a permanent record of the geometry distribution of gap fraction, which is generally used to calculate LAI (Chianucci & Cutini 2012). The method has many advantages over the other indirect methods.
Recent studies have developed empirical models to produce detailed descriptions of canopy structure using explanatory variables derived from satellite images (White et al 2011; Gomez et al 2011; Coulston et al 2012), and the availability of observations on canopy properties such as LAI is essential to calibrate remotely-sensed information based on satellite data (Wang et al 2004).
In this study, the plant composition in a fragmented swamp forest was characterized based on both field-measurement of LAI and vegetation sampling. The use of hemispherical photographs for determining LAI was demonstrated. Furthermore, this study provided a LAI model developed from the ground, up; to generate a pixel-by-pixel basis on Landsat satellite image. The consideration of canopy structure by vegetation sampling and satellite imagery could be used to monitor the recovery processes of fragmented swamp forest at a regional scale.
Material and Method Study site. The study area (202’27.91”S; 10352’35.62”E) is located on the southern Sumatra, Indonesia and within 80 km from the coast (Figure 1). The area is a secondary lowland forest, which is characterized by shrubs, smaller trees and regenerating stands. Moreover, the study area is characterized also by some riparian corridors. These riparian areas are lands adjacent to river (Kenawang River) that creates structural habitat and fuels the aquatic food chain. The majority landscapes in surrounding areas are oil palm plantations and timber forests, which are industrially managed by some private companies.
Field observation of plant community. In order to obtain data of plant communities and their characteristics, a field observation was conducted on October 2014. We set up a sampling of 3 segments with 45 points perpendicular to the river (Figure 2). Seventeen were located in areas of riparian corridor as far as 100 m from the river (segment 1), ten in areas of continuous bush with a riparian reserve adjacent to the river (prior to 300 m from the river; segment 2), and eighteen in areas of secondary swamp forest with no riparian reserve adjacent to the river (prior to 500 m from the river; segment 3). At the 20 m intervals, the analysis of vegetation was conducted to observe the plant communities and characteristics.

AES Bioflux, 2016, Volume 8, Issue 2. http://www.aes.bioflux.com.ro 137
Figure 1. The study area (Source: Landsat 8 satellite image (false color composite with band 6-5-3).
Figure 2. Sampling design of taking hemispherical photographs. (Source: Landsat 8 satellite image (false color composite with band 6-5-3).
There are two ways of vegetation data collection applied in this study, as follows: 1) identification of plant species and compiling a list of plants, 2) quantitative vegetation sampling by terraced path line method (Soerianegara & Indrawan 1988) as shown by Figure 3. At each site, observation plot size was 20 x 20 m in order to collect vegetation data at the tree level, plot size of 10 x 10 m, 5 x 5 m and 2 x 2 m at the pole, sapling and seedling level, respectively.
Identification of plant species was performed in the field; however, some of unidentified plant species should be recognized at the Herbarium Bogoriense and Laboratory of Plant Conservation, Bogor Agricultural University, Indonesia.

AES Bioflux, 2016, Volume 8, Issue 2. http://www.aes.bioflux.com.ro 138
Figure 3. Sampling design of vegetation data collection.
Moreover, to assess the vegetation structure at each sampling site, we measured several parameters of vegetation data such as: density, relative density, frequency, relative frequency, dominance, and relative dominance following equations below:
Importance value index for a species is the sum of its relative density, relative dominance and relative frequency (Soerianegara & Indrawan 1988), which then can be used to determine a diversity index of a habitat. For each site, we calculated diversity index (mean Shannon index; H') with the following equation:
where H' is diversity index, ni is the importance value index of species-i and N is the total of importance value index of all species.
Measuring plants canopy with hemispherical photographs. Hemispherical photographs are made using a lens with a 180° view, which produces a circular projection of the sky hemisphere. Evans & Coombe (1959) developed the first theory and methodology to use these photographs in forest light estimation. Anderson (1964) further quantified the technique, including the estimation of diffuse and direct light separately. Moreover, a number of other parameters can be estimated from
AES Bioflux, 2016, Volume 8, Issue 2. http://www.aes.bioflux.com.ro 139
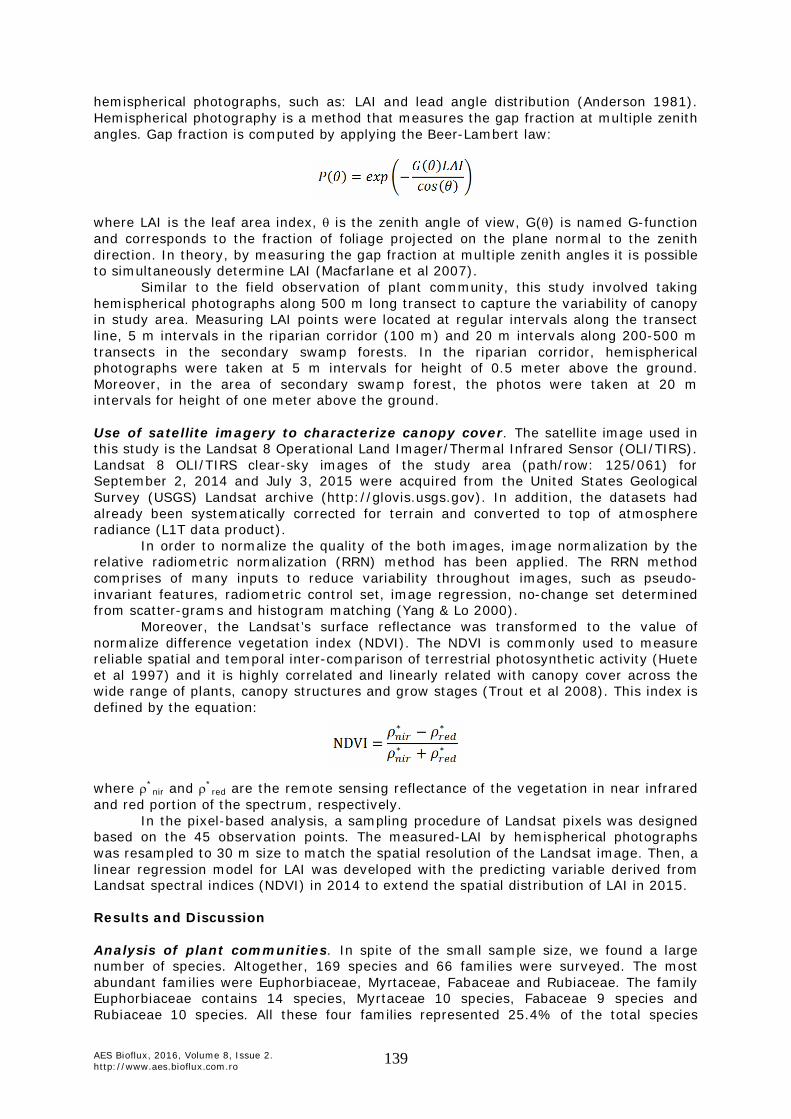
hemispherical photographs, such as: LAI and lead angle distribution (Anderson 1981). Hemispherical photography is a method that measures the gap fraction at multiple zenith angles. Gap fraction is computed by applying the Beer-Lambert law:
where LAI is the leaf area index, is the zenith angle of view, G() is named G-function and corresponds to the fraction of foliage projected on the plane normal to the zenith direction. In theory, by measuring the gap fraction at multiple zenith angles it is possible to simultaneously determine LAI (Macfarlane et al 2007).
Similar to the field observation of plant community, this study involved taking hemispherical photographs along 500 m long transect to capture the variability of canopy in study area. Measuring LAI points were located at regular intervals along the transect line, 5 m intervals in the riparian corridor (100 m) and 20 m intervals along 200-500 m transects in the secondary swamp forests. In the riparian corridor, hemispherical photographs were taken at 5 m intervals for height of 0.5 meter above the ground. Moreover, in the area of secondary swamp forest, the photos were taken at 20 m intervals for height of one meter above the ground.
Use of satellite imagery to characterize canopy cover. The satellite image used in this study is the Landsat 8 Operational Land Imager/Thermal Infrared Sensor (OLI/TIRS). Landsat 8 OLI/TIRS clear-sky images of the study area (path/row: 125/061) for September 2, 2014 and July 3, 2015 were acquired from the United States Geological Survey (USGS) Landsat archive (http://glovis.usgs.gov). In addition, the datasets had already been systematically corrected for terrain and converted to top of atmosphere radiance (L1T data product).
In order to normalize the quality of the both images, image normalization by the relative radiometric normalization (RRN) method has been applied. The RRN method comprises of many inputs to reduce variability throughout images, such as pseudo-invariant features, radiometric control set, image regression, no-change set determined from scatter-grams and histogram matching (Yang & Lo 2000).
Moreover, the Landsat’s surface reflectance was transformed to the value of normalize difference vegetation index (NDVI). The NDVI is commonly used to measure reliable spatial and temporal inter-comparison of terrestrial photosynthetic activity (Huete et al 1997) and it is highly correlated and linearly related with canopy cover across the wide range of plants, canopy structures and grow stages (Trout et al 2008). This index is defined by the equation:
where *
nir and *red are the remote sensing reflectance of the vegetation in near infrared
and red portion of the spectrum, respectively. In the pixel-based analysis, a sampling procedure of Landsat pixels was designed
based on the 45 observation points. The measured-LAI by hemispherical photographs was resampled to 30 m size to match the spatial resolution of the Landsat image. Then, a linear regression model for LAI was developed with the predicting variable derived from Landsat spectral indices (NDVI) in 2014 to extend the spatial distribution of LAI in 2015. Results and Discussion Analysis of plant communities. In spite of the small sample size, we found a large number of species. Altogether, 169 species and 66 families were surveyed. The most abundant families were Euphorbiaceae, Myrtaceae, Fabaceae and Rubiaceae. The family Euphorbiaceae contains 14 species, Myrtaceae 10 species, Fabaceae 9 species and Rubiaceae 10 species. All these four families represented 25.4% of the total species

AES Bioflux, 2016, Volume 8, Issue 2. http://www.aes.bioflux.com.ro 140
sampled. Within the riparian corridor, species Macaranga pruinosa and Polyalthia hypoleuca are dominant in a stand tree and poled-sized. M. pruinosa is a pioneer species (Suzuki & Hara 1995), which is growing in certain parts of the area. P. hypoleuca is an indigeneous plant species in peat swamp forests (Nuyim 2005). In the secondary swamp forest (no riparian reserve), Syzygium palembanicum, Litsea firma, Endospermum diadenum and Alseodaphne foetida were species dominated in a stand pole-size. E. diadenum was also dominated especially in the stand tree-sized in the area, which it was well adapted to a disturbed habitats, scrub and burned forests. A summary of plant observation is presented in Table 1.
Moreover, the number of seedling varied following a distance to the river, between 640 and 1,760 individual per ha. This suggested a high spatial heterogeneity in seedling communities between riparian to no riparian ecosystem. Species Rhodamnia cinerea was often found in the field. This species is a group of shrub in the Myrtaceae family, which usually present as a pre-disturbance remnant.
Table 1 Results of vegetation characteristics observed in this study
Ecosystem zone
Vegetation characteristics Riparian Semi-
riparian Secondary swamp forest (no-riparian)
1. Density (per ha) a. Tree 15 50 55 b. Pole 140 460 780
c. Seedling 640 1840 1760 d. Sapling 5500 4500 5000
2. Dominancy (m2 ha-1) Growth stage Species name
a. Tree Macaranga pruinosa 0.89 0 0 Syzygium palembanicum 0.17 0.68 0 Endospermum diadenum 0 0.22 0.57 Polyalthia hypoleuca 0 0.15 0.48 Macaranga hypoleuca 0 0.11 0.27
b. Pole Macaranga pruinosa 1.37 0 0 Artocarpus teysmanii 0 1.72 0 Syzygium palembanicum 0 0 3.48 Litsea firma 0 0 0.85 Jackia ornata 0 0 0.80 Pithecolobium kunstleri 0 0.80 0 Endospermum diadenum 0 0 0.93 Alseodaphne foetida 0 0 1.10
3. Biodiversity index (sum of all species) 1.51 2.14 2.70
Through quantitative vegetation sampling, we found that many species presented low frequencies, but high densities in the plots where they were sampled. For instance, L. firma (Lauraceae) was sampled in only the riparian corridor, where it was the species present with the highest density in the stand pole-sized (60 individuals). Jackia ornata was also found in only the secondary swamp forest with high density in the two growth stages; sapling (60 individuals) and seedling (160 individuals). These species are usually present as a pre-disturbance remnant in secondary forests. The performance of both species depends on its own density, but also on the density of other species, such as P. hypoleuca and E. diadenum. Spatial heterogeneity is present in other two ecosystem zones; riparian and semi-riparian, which represents a characteristics of its plant communities.
At ecosystem scale, the biodiversity index is highest in the secondary swamp forest area (no-riparian) and lower following shorter distance from the river. Figure 4 indicates clear trends in all growth stages of plant communities when moving from riparian to no-riparian zone.

AES Bioflux, 2016, Volume 8, Issue 2. http://www.aes.bioflux.com.ro 141
Figure 4. Relationships between biodiversity index and its distance from river
at different level of tree. The results showed that the fragmented swamp forest was characterized by different forest compositions, with various indicator species respectively. There were also clear indications for the presence of a few pioneer species such as M. pruinosa and S. palembanicum, and different successional stages of the forest were found up to 500 m from the river. Next, the characteristics of main plant communities in this fragmented forest will be determined from its canopy cover.
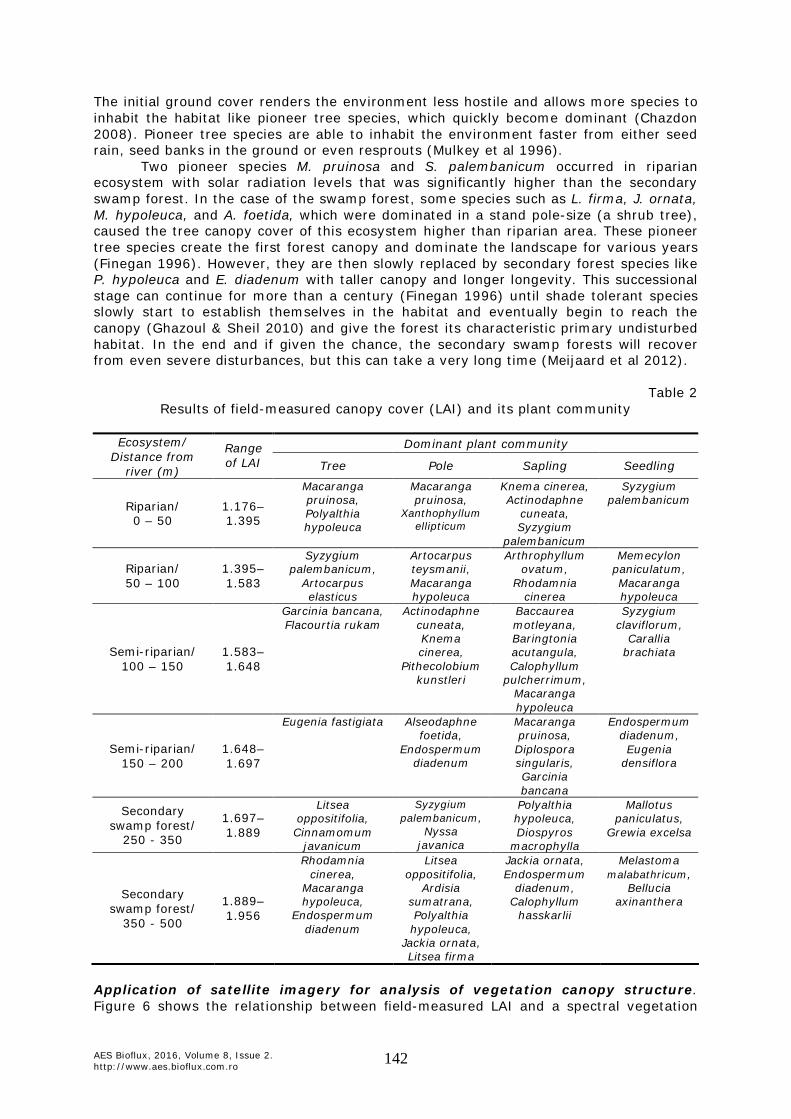
Measurement of canopy cover. As mentioned above, in order to characterize the spatial patterns of plant communities from distribution of its canopy cover, some hemi-photographs have been taken at intervals along multiple long transects. The results of LAI’ measurement is presented in Table 2. Moreover, the characteristics of LAI regarding to the distance from river is illustrated in Figure 5.
Figure 5. The characteristics of fragmented swamp forest due to its LAI and distance from river.
AES Bioflux, 2016, Volume 8, Issue 2. http://www.aes.bioflux.com.ro 142
The initial ground cover renders the environment less hostile and allows more species to inhabit the habitat like pioneer tree species, which quickly become dominant (Chazdon 2008). Pioneer tree species are able to inhabit the environment faster from either seed rain, seed banks in the ground or even resprouts (Mulkey et al 1996).
Two pioneer species M. pruinosa and S. palembanicum occurred in riparian ecosystem with solar radiation levels that was significantly higher than the secondary swamp forest. In the case of the swamp forest, some species such as L. firma, J. ornata, M. hypoleuca, and A. foetida, which were dominated in a stand pole-size (a shrub tree), caused the tree canopy cover of this ecosystem higher than riparian area. These pioneer tree species create the first forest canopy and dominate the landscape for various years (Finegan 1996). However, they are then slowly replaced by secondary forest species like P. hypoleuca and E. diadenum with taller canopy and longer longevity. This successional stage can continue for more than a century (Finegan 1996) until shade tolerant species slowly start to establish themselves in the habitat and eventually begin to reach the canopy (Ghazoul & Sheil 2010) and give the forest its characteristic primary undisturbed habitat. In the end and if given the chance, the secondary swamp forests will recover from even severe disturbances, but this can take a very long time (Meijaard et al 2012).
Table 2
Results of field-measured canopy cover (LAI) and its plant community Dominant plant community Ecosystem/
Distance from river (m)
Range of LAI Tree Pole Sapling Seedling
Riparian/ 0 – 50
1.176–1.395
Macaranga pruinosa, Polyalthia hypoleuca
Macaranga pruinosa,
Xanthophyllum ellipticum
Knema cinerea, Actinodaphne
cuneata, Syzygium
palembanicum
Syzygium palembanicum
Riparian/ 50 – 100
1.395–1.583
Syzygium palembanicum,
Artocarpus elasticus
Artocarpus teysmanii, Macaranga hypoleuca
Arthrophyllum ovatum,
Rhodamnia cinerea
Memecylon paniculatum, Macaranga hypoleuca
Semi-riparian/ 100 – 150
1.583–1.648
Garcinia bancana, Flacourtia rukam
Actinodaphne cuneata, Knema cinerea,
Pithecolobium kunstleri
Baccaurea motleyana, Baringtonia acutangula, Calophyllum
pulcherrimum, Macaranga hypoleuca
Syzygium claviflorum,
Carallia brachiata
Semi-riparian/ 150 – 200
1.648–1.697
Eugenia fastigiata Alseodaphne foetida,
Endospermum diadenum
Macaranga pruinosa, Diplospora singularis, Garcinia bancana
Endospermum diadenum, Eugenia
densiflora
Secondary swamp forest/
250 - 350
1.697–1.889
Litsea oppositifolia, Cinnamomum
javanicum
Syzygium palembanicum,
Nyssa javanica
Polyalthia hypoleuca, Diospyros
macrophylla
Mallotus paniculatus,
Grewia excelsa
Secondary swamp forest/
350 - 500
1.889–1.956
Rhodamnia cinerea,
Macaranga hypoleuca,
Endospermum diadenum
Litsea oppositifolia,
Ardisia sumatrana, Polyalthia hypoleuca,
Jackia ornata, Litsea firma
Jackia ornata, Endospermum
diadenum, Calophyllum
hasskarlii
Melastoma malabathricum,
Bellucia axinanthera
Application of satellite imagery for analysis of vegetation canopy structure. Figure 6 shows the relationship between field-measured LAI and a spectral vegetation

AES Bioflux, 2016, Volume 8, Issue 2. http://www.aes.bioflux.com.ro 143
index (NDVI). According to the figure, the NDVI was highly correlated and linearly related with measured LAI across the wide range of canopy structures, and growth stages in the three different ecosystems. The LAI increased linearly with NDVI prior to 1.9 but did not increase further with increasing NDVI. This finding agrees with previous work showing the asymptotic behavior of NDVI at high-vegetation biomass (Tucker 1979). To simple this relationship, a linear regression model of LAI was developed with the predicting variable derived from NDVI in 2014.
Figure 6. Relationship between LAI and NDVI in study area.
As indicated in the previous section, the high LAI distributed in the secondary swamp forest and semi riparian. Meanwhile, at the riparian corridor, the results showed a low LAI in comparison with NDVI. Nilson & Peterson (1994) mentioned that the taller forest canopies are associated with higher reflectance in the NIR band and lower reflectance in red band. Red reflectance is negatively correlated to canopy height due to chlorophyll absorption and structural shadowing effects, while NIR reflectance is positively correlated due to the light scattering properties of leaf internal structure. The high LAI and NDVI in the secondary swamp forest was correlated with the characteristics of some species, such as E. diadenum, P. hypoleuca and M. hypoleuca, which are the natural pioneer species that regenerate freely in open and disturbed habitats and is fast-growing.
Based on the relationships between NDVI and LAI, then we applied a simple comparison to Landsat satellite data, as shown by Figure 7.
Figure 7. Simple comparison between a) NDVI and b) LAI. Landsat 8 with band combination 6-5-3, acquisition date:2 September, 2014 (c).
AES Bioflux, 2016, Volume 8, Issue 2. http://www.aes.bioflux.com.ro 144
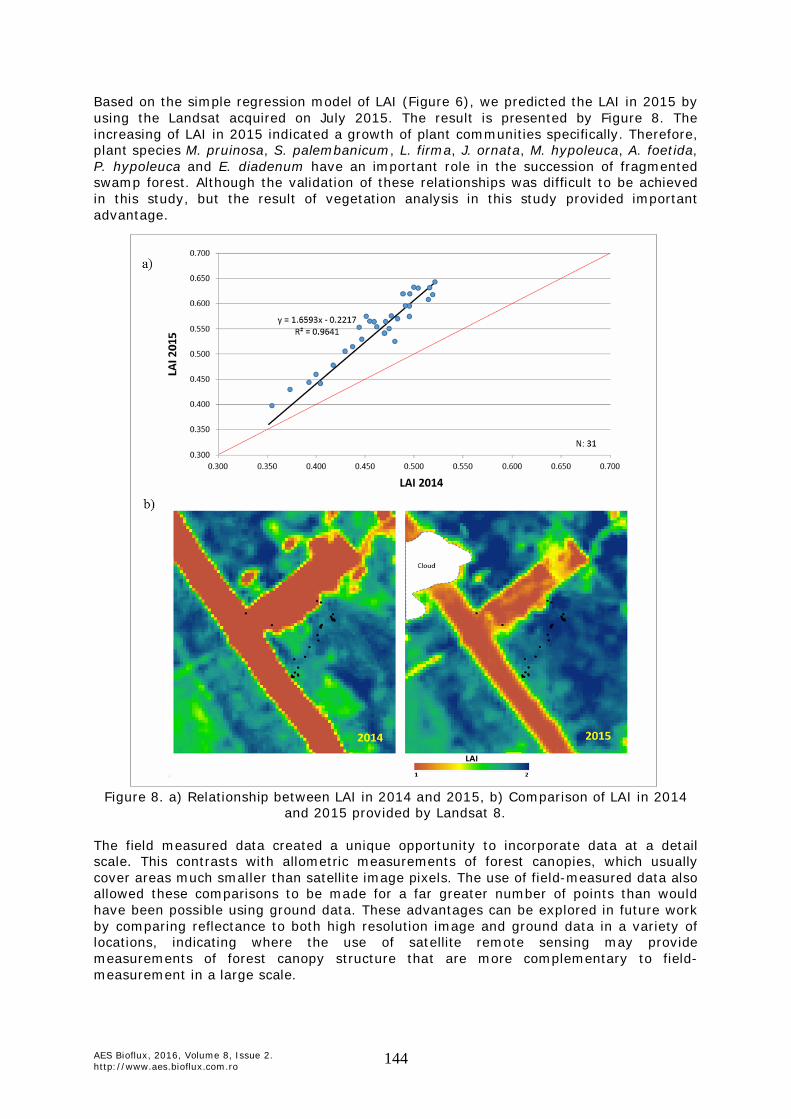
Based on the simple regression model of LAI (Figure 6), we predicted the LAI in 2015 by using the Landsat acquired on July 2015. The result is presented by Figure 8. The increasing of LAI in 2015 indicated a growth of plant communities specifically. Therefore, plant species M. pruinosa, S. palembanicum, L. firma, J. ornata, M. hypoleuca, A. foetida, P. hypoleuca and E. diadenum have an important role in the succession of fragmented swamp forest. Although the validation of these relationships was difficult to be achieved in this study, but the result of vegetation analysis in this study provided important advantage.
Figure 8. a) Relationship between LAI in 2014 and 2015, b) Comparison of LAI in 2014 and 2015 provided by Landsat 8.
The field measured data created a unique opportunity to incorporate data at a detail scale. This contrasts with allometric measurements of forest canopies, which usually cover areas much smaller than satellite image pixels. The use of field-measured data also allowed these comparisons to be made for a far greater number of points than would have been possible using ground data. These advantages can be explored in future work by comparing reflectance to both high resolution image and ground data in a variety of locations, indicating where the use of satellite remote sensing may provide measurements of forest canopy structure that are more complementary to field-measurement in a large scale.
AES Bioflux, 2016, Volume 8, Issue 2. http://www.aes.bioflux.com.ro 145
Conclusions. The recovery of fragmented swamp forest is an important issue in biodiversity conservation. There have been few attempts to fit recovery success with the characteristics of the surrounding landscape. Here we attempt to examine the recovery process in the fragmented swamp forest by two approaches. First, we used hemispherical photography to provide canopy cover and then estimated the composition and configuration of three different ecosystems in the swamp forest. Second, we observed the species and community composition of these regions.
The results showed that the fragmented swamp forest was characterized by different forest compositions, with various indicator species respectively. There were also clear indications for the presence of a few pioneer species such as Macaranga pruinosa and Syzygium palembanicum, and different successional stages of the forest were found up to 500 m from the river. Based on field-measured canopy cover, these pioneer species occurred in riparian ecosystem with solar radiation level that was significantly higher than the secondary swamp forest.
Although the validation of the relationships between the plant communities characteristics and the LAI generated by Landsat satellite data was difficult to be achieved in this study, but the result of vegetation analysis in this study provided important advantage. The field measured data created a unique opportunity to incorporate data at a detail scale. These advantages can be explored in future work by comparing reflectance to both high resolution image and ground data in a variety of locations. Acknowledgements. The authors would like to thank the JOB Pertamina–Talisman Jambi Merang (PTJM) for giving us opportunity to get the research funding through the Center for Environmental Study, Bogor Agricultural University (PPLH-IPB). This research was funded by PTJM for fiscal year 2014 as part of a research work on Forest Conservation Area, Pulau Gading Field, Musi Banyuasin, South Sumatra. We would like to thank Eko Adhiyanto for providing us with an intensive field observation data as reference dataset. References Anderson M. C., 1964 Studies of the woodland light climate I. The photographic
computation of light condition. Journal of Ecology 52:27-41. Anderson M. C., 1981 The geometry of leaf distribution in some south-eastern Australian
forests. Agricultural Meteorology 25:195-205. Andren H., 1994 Effects of habitat fragmentation on birds and mammals in landscapes
with different proportions of suitable habitat: a review. Oikos 71:355-366. Breda N. J. J., 2003 Ground-based measurements of leaf area index: a review of
methods, instruments and currrent controversies. Journal of Experimental Biology 54:2403-2417.
Campbell G. S., Norman J. M., 2003 The description and measurement of plant canopy structure. In: Plant canopies: their growth, form and function. Russell G., Marshall B., Jarvis P. G. (eds), Cambridge University Press, New York, pp. 1-15.
Chazdon R. L., 2008 Chance and determinism in tropical forest succession. In: Tropical forest community ecology. Carson W., Schnitzer S. A. (eds), Wiley Blackwell, Oxford, UK, pp. 384-408.
Chen J. M., Rich P. M., Gower S. T., Norman J. M., Plummer S., 1997 Leaf area index of boreal forests: theory, techniques, and measurements. Journal of Geophysical Research 102:29429-29443.
Chianucci F., Cutini A., 2012 Digital hemispherical photography for estimating forest canopy properties: current controversies and opportunities. iForest 5:290-295.
Chopping M., Moisen G. G., Su L., Laliberte A., Rango A., Martonchik J. V., Peter D. P. C., 2008 Large area mapping of southwestern forest crown cover, canopy height, and biomass using the NASA Multiangle Imaging Spectro-Radiometer. Remote Sensing of Environment 112:2051–2063.
AES Bioflux, 2016, Volume 8, Issue 2. http://www.aes.bioflux.com.ro 146
Clough B. F., Ong J. E., Gong G. W., 1997 Estimating leaf area index and photosynthetic production in canopies of the mangrove Rhizophora apiculata. Marine Ecology Progress Series 159:285–292.
Cole R. J., Holl K. D., Zahawi R. A., 2010 Seed rain under tree islands planted to restore degraded lands in a tropical agricultural landscape. Ecological Applications 20:1255-1269.
Coulston J. W., Moisen G. G., Wilson B. T., Finco M. V., Cohen W. B., Brewer C. K., 2012 Modeling percent tree canopy cover: a pilot study. Photogrammetric Engineering and Remote Sensing 78:715–727.
Cutini A., Matteucci G., Mugnozza G. S., 1998 Estimation of leaf area index with the Li-Cor LAI 2000 in deciduous forests. Forest Ecology and Management 105:55-65.
Eschenbach C., Kappen L., 1996 Leaf area index determination in an alder forest: a comparison of three methods. Journal of Experimental Botany 47:1457-1462.
Evans G. D., Coombe D. E., 1959 Hemispherical and woodland canopy photography and the light climate. Journal of Ecology 47:103-113.
Finegan B., 1996 Pattern and process in neotropical secondary rain forests: the first 100 years of succession. Trends in Ecology and Evolotion 11:119-124.
Ghazoul J., Sheil D., 2010 Tropical rain forest ecology, diversity, and conservation. Oxford University Press, New York, USA, 496 pp.
Gomez C., White J. C., Wulder M. A., 2011 Characterizing the state and processes of change in a dynamic forest environment using hierarchical spatio-temporal segmentation. Remote Sensing of Environment 115:1665–1679.
Huete A. R., Liu H. Q., Batchily K., Van Leeuwen W., 1997 A comparison of vegetation indices over a global set of TM images for EOS-MODIS. Remote Sensing of Environment 59:440-451.
Jonckheere I., Fleck S., Nackaerts K., Muys B., Coppin P., Weiss M., Baret F., 2004 Review of methods for in situ leaf area index determination: Part I. Theories, sensors and hemispherical photography. Agricultural and Forest Meteorology 121:19-35.
Koy K., McShea W. J., Leimgruber P., Haack B. N., Aung M., 2005 Percentage canopy cover using Landsat imagery to delineate habitat for Myanmar’s endangered Eld’s deer (Cervus eldi). Animal Conservation 8:289–296.
Lee A. C., Lucas R. M., 2007 A LIDAR-derived canopy density model for tree stem and crown mapping in Australian forests. Remote Sensing of Environment 111:493-518.
Lewis S. L., Lopez-Gonzalez G., Sonke B., Affum-Baoe K., Baker T. R., Ojo L. O., Phillips O. L., Reitsma J. M., White L., Comiskey J. A., Djuikouo N. M., Ewango C. E. N., Feldpausch T. R, Hamilton A. C., Gloor M., Hart T., Hladik A., Lloyd J., Lovett J. C., Makana J. R, Malhi Y., Mbago F. M., Ndangalasi H. J., Peacock J., Peh K. S. H, Sheil D., Sunderland T., Swaine M. D., Taplin J., Taylor D., Thomas S. C., Votere R., Woll H., 2009 Increasing carbon storage in intact African tropical forests. Nature 457:1003-1006.
Macfarlane C., Grigg A., Evangelista C., 2007 Estimating forest leaf area using cover and fullframe fisheye photography: thinking inside the circle. Agricultural and Forest Meteorology 146:1-12.
Meijaard E., Wich S., Ancrenaz M., Marshall A. J., 2012 Not by science alone: why orangutan conservationists must think outside the box. Annals of the New York Academy of Sciences 1249:29-44.
Ministry of Forestry, 2011 [Recalculation of land cover in Indonesia, 2011. The Agency of Forestry Planning, Ministry of Forestry, Republic of Indonesia]. [in Indonesian]
Mulkey S. S., Chazdon R. L., Smith A. P., 1996 Tropical forest plant ecophysiology. Chapman and Hall, New York, 675 pp.
Nilson T., Peterson U., 1994 Age dependence of forest reflectance: analysis of main driving factors. Remote Sensing of Environment 48:319-331.
Nuyim T., 2005 Manual on peat swamp forest rehabilitation and planting in Thailand. In: Global Environment Centre & Wetlands International - Thailand Office. Lee D., Parish F., Adnan M., Keong C. C. (eds), 98 pp.

AES Bioflux, 2016, Volume 8, Issue 2. http://www.aes.bioflux.com.ro 147
Ozanne C. M. P., Anhuf D., Boulter S. L., Keller M., Kitching R. L., Körner C., Meinzer F. C., Mitchell A. W., Nakashizuka T., Silva Dias P. L., Stork N. E., Wright S. J., Yoshimura M., 2003 Biodiversity meets the atmosphere: a global view of forest canopies. Science 301:183-186.
Page S., Siegert F., Rieley J. O., Boehm H. D., Jaya A., Limin S., 2002 The amount of carbon released from peat and forest fires in Indonesia during 1997. Nature 420:61-65.
Rollins M. G., Frame C. K., 2006 The LANDFIRE prototype project: nationally consistent and locally relevant geospatial data for wildland fire management. USDA Forest Service, General Technical Report RMRS-GTR-175, Rocky Mountain Research Station, Fort Collins, Colorado, 416 pp.
Soerianegara I., Indrawan A., 1988 [Forest ecology Indonesia]. Forest Ecology Laboratory, Faculty of Forestry, Bogor Agricultural University, Bogor, Indonesia, 210 pp. [in Indonesian]
Suzuki K., Hara K., 1995 Ecological rehabilitation of the tropical swamp forest. In: Proceedings of the International Workshop on Global Environmental Studies on Greenhouse Gas Emission and Tropical Peat Swamp in Southeast Asia. Vijamsorn P. (ed), Tokyo, Nodai Research Institute, Tokyo University of Agriculture, pp. 17-24.
Trout T. J., Johnson L. F., Gartung J., 2008 Remote sensing of canopy cover in horticultural crops. HortScience 43:333-337.
Tucker C. J., 1979 Red and photographic infrared linear combinations for monitoring vegetation. Remote Sensing of Environment 8:127-150.
Wang Y., Woodcock C. E., Buermann W., Stenberg P., Voipio P., Smolander H., Häme T., Tian Y., Hu J., Knyazikhin Y., Myneni R. B., 2004 Evaluation of the MODIS LAI algorithm at a coniferous forest site in Finland. Remote Sensing of Environment 91:114-127.
White J. C., Wulder M. A., Gomez C., Stenhouse G., 2011 A history of habitat dynamics: characterizing 35 years of stand replacing disturbance. Canadian Journal of Remote Sensing 37:234-251.
Yang X., Lo C. P., 2000 Relative radiometric normalization performance for change detection from multi-date satellite images. Photogrammetric Engineering and Remote Sensing 66:967-980.
*** http://glovis.usgs.gov. Received: 02 December 2015. Accepted: 30 January 2016 Published online: 10 February 2016. Authors: Yudi Setiawan, Center for Environmental Research, Bogor Agricultural University, Kampus IPB Darmaga, Bogor 16680, Indonesia, e-mail: [email protected] Rachmad Hermawan, Department of Forest Resources Conservation and Ecotourism, Faculty of Forestry, Bogor Agricultural University, Kampus IPB Darmaga, Bogor 16680, Indonesia, e-mail: [email protected] Harnios Arief, Department of Forest Resources Conservation and Ecotourism, Faculty of Forestry, Bogor Agricultural University, Kampus IPB Darmaga, Bogor 16680, Indonesia, e-mail: [email protected] Hefni Effendi, Center for Environmental Research, Bogor Agricultural University, Kampus IPB Darmaga, Bogor 16680, Indonesia, e-mail: [email protected] Muhammad Irfansyah Lubis, Center for Environmental Research, Bogor Agricultural University, Kampus IPB Darmaga, Bogor 16680, Indonesia, e-mail: [email protected] Prita Ayu Permatasari, Center for Environmental Research, Bogor Agricultural University, Kampus IPB Darmaga, Bogor 16680, Indonesia, e-mail: [email protected] Luluk Dwi Wulan Handayani, Center for Environmental Research, Bogor Agricultural University, Kampus IPB Darmaga, Bogor 16680, Indonesia, e-mail: [email protected] This is an open-access article distributed under the terms of the Creative Commons Attribution License, which permits unrestricted use, distribution and reproduction in any medium, provided the original author and source are credited. How to cite this article: Setiawan Y., Hermawan R., Arief H., Effendi H., Lubis M. I., Permatasari P. A., Handayani L. D. W., 2016 Differences in canopy structure among major plant communities in the fragmented swamp forest of Southern Sumatra. AES Bioflux 8(2):135-147.