Alessandro Carboni, 2011, The Sovereign Credit Default Swap Market
Upload
edwin-magnus-adamsCategory
view
215download
0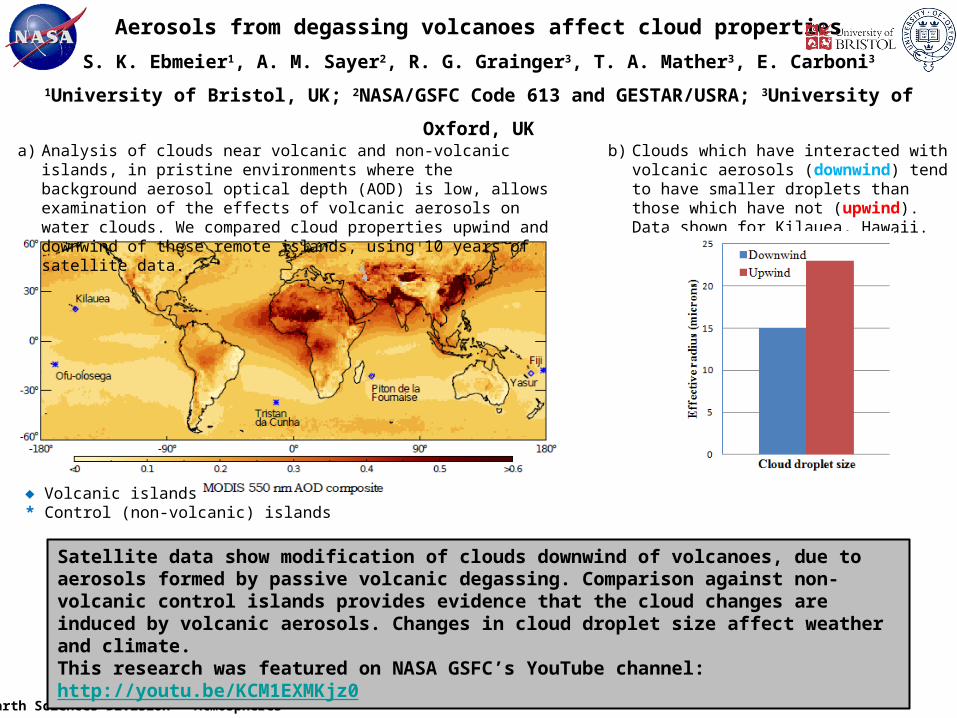
Aerosols from degassing volcanoes affect cloud properties
S. K. Ebmeier1, A. M. Sayer2, R. G. Grainger3, T. A. Mather3, E. Carboni3
1University of Bristol, UK; 2NASA/GSFC Code 613 and GESTAR/USRA; 3University of Oxford, UK
Earth Sciences Division - Atmospheres
Satellite data show modification of clouds downwind of volcanoes, due to aerosols formed by passive volcanic degassing. Comparison against non-volcanic control islands provides evidence that the cloud changes are induced by volcanic aerosols. Changes in cloud droplet size affect weather and climate.This research was featured on NASA GSFC’s YouTube channel: http://youtu.be/KCM1EXMKjz0
b) Clouds which have interacted with volcanic aerosols (downwind) tend to have smaller droplets than those which have not (upwind). Data shown for Kilauea, Hawaii.
a) Analysis of clouds near volcanic and non-volcanic islands, in pristine environments where the background aerosol optical depth (AOD) is low, allows examination of the effects of volcanic aerosols on water clouds. We compared cloud properties upwind and downwind of these remote islands, using 10 years of satellite data.
♦ Volcanic islands* Control (non-volcanic) islands
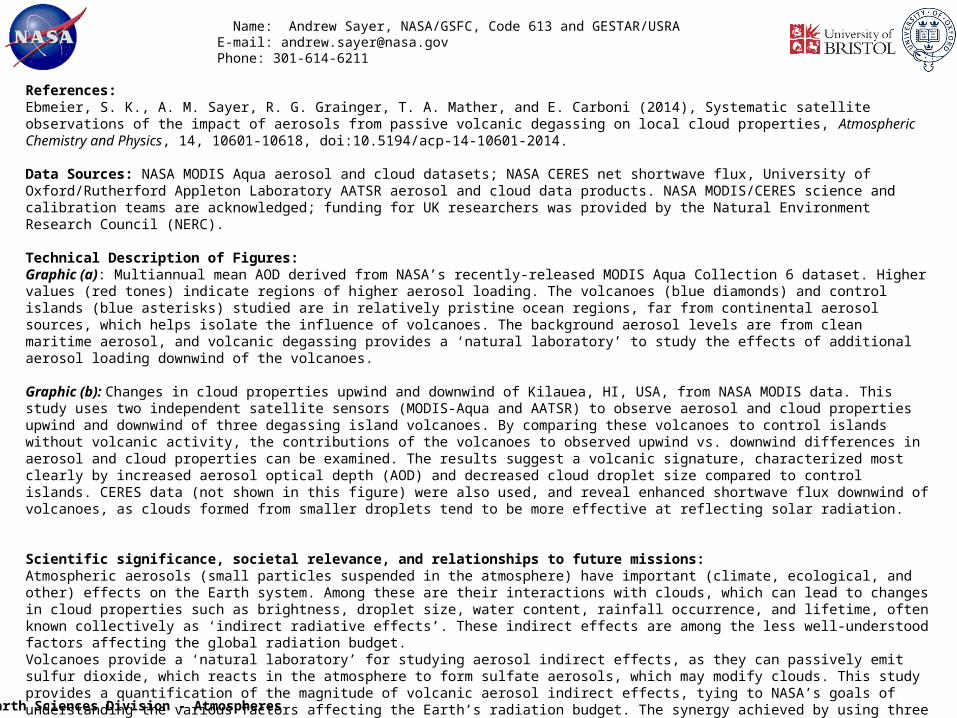
Name: Andrew Sayer, NASA/GSFC, Code 613 and GESTAR/USRA E-mail: [email protected] Phone: 301-614-6211
References:Ebmeier, S. K., A. M. Sayer, R. G. Grainger, T. A. Mather, and E. Carboni (2014), Systematic satellite observations of the impact of aerosols from passive volcanic degassing on local cloud properties, Atmospheric Chemistry and Physics, 14, 10601-10618, doi:10.5194/acp-14-10601-2014.
Data Sources: NASA MODIS Aqua aerosol and cloud datasets; NASA CERES net shortwave flux, University of Oxford/Rutherford Appleton Laboratory AATSR aerosol and cloud data products. NASA MODIS/CERES science and calibration teams are acknowledged; funding for UK researchers was provided by the Natural Environment Research Council (NERC).
Technical Description of Figures:Graphic (a): Multiannual mean AOD derived from NASA’s recently-released MODIS Aqua Collection 6 dataset. Higher values (red tones) indicate regions of higher aerosol loading. The volcanoes (blue diamonds) and control islands (blue asterisks) studied are in relatively pristine ocean regions, far from continental aerosol sources, which helps isolate the influence of volcanoes. The background aerosol levels are from clean maritime aerosol, and volcanic degassing provides a ‘natural laboratory’ to study the effects of additional aerosol loading downwind of the volcanoes.
Graphic (b): Changes in cloud properties upwind and downwind of Kilauea, HI, USA, from NASA MODIS data. This study uses two independent satellite sensors (MODIS-Aqua and AATSR) to observe aerosol and cloud properties upwind and downwind of three degassing island volcanoes. By comparing these volcanoes to control islands without volcanic activity, the contributions of the volcanoes to observed upwind vs. downwind differences in aerosol and cloud properties can be examined. The results suggest a volcanic signature, characterized most clearly by increased aerosol optical depth (AOD) and decreased cloud droplet size compared to control islands. CERES data (not shown in this figure) were also used, and reveal enhanced shortwave flux downwind of volcanoes, as clouds formed from smaller droplets tend to be more effective at reflecting solar radiation.
Scientific significance, societal relevance, and relationships to future missions:Atmospheric aerosols (small particles suspended in the atmosphere) have important (climate, ecological, and other) effects on the Earth system. Among these are their interactions with clouds, which can lead to changes in cloud properties such as brightness, droplet size, water content, rainfall occurrence, and lifetime, often known collectively as ‘indirect radiative effects’. These indirect effects are among the less well-understood factors affecting the global radiation budget.Volcanoes provide a ‘natural laboratory’ for studying aerosol indirect effects, as they can passively emit sulfur dioxide, which reacts in the atmosphere to form sulfate aerosols, which may modify clouds. This study provides a quantification of the magnitude of volcanic aerosol indirect effects, tying to NASA’s goals of understanding the various factors affecting the Earth’s radiation budget. The synergy achieved by using three satellite sensors increases the robustness of the conclusions which can be drawn in this type of analysis.This research was spotlighted in a feature on NASA GSFC’s YouTube channel: http://youtu.be/KCM1EXMKjz0
Earth Sciences Division - Atmospheres

Summer Surface Ozone Reduced by NOx Emission Reductions
Sarah Strode1,2, Jose Rodriguez1, Lok Lamsal1,2 (614)1NASA/GSFC, 2GESTAR
Earth Sciences Division - Atmospheres
Simulations confirm that pollution reductions caused the decrease in summer ozone levels over the eastern U.S. and altered the seasonal cycle of ozone in the Mid-Atlantic.
1991-2010 Trends in July Surface Ozone
Observed Simulated
ppb/yr
(a)
(b) (c)Change in Mid-Atlantic Ozone2010 vs. 2005 Difference in NO2
20
05
-20
10
vs.
19
92
-19
97
ch
an
ge
(p
pb
v)1015 molec/cm2
SimulatedOMI
ObservedSimulatedEmissions Fixed
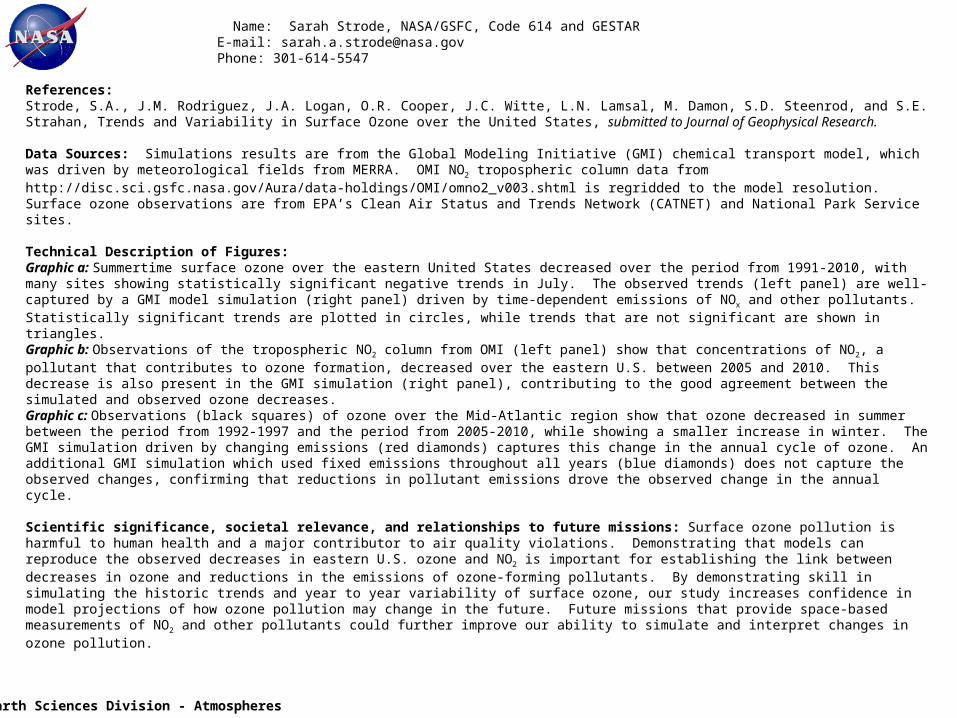
Name: Sarah Strode, NASA/GSFC, Code 614 and GESTAR E-mail: [email protected] Phone: 301-614-5547
References:Strode, S.A., J.M. Rodriguez, J.A. Logan, O.R. Cooper, J.C. Witte, L.N. Lamsal, M. Damon, S.D. Steenrod, and S.E. Strahan, Trends and Variability in Surface Ozone over the United States, submitted to Journal of Geophysical Research.
Data Sources: Simulations results are from the Global Modeling Initiative (GMI) chemical transport model, which was driven by meteorological fields from MERRA. OMI NO2 tropospheric column data from http://disc.sci.gsfc.nasa.gov/Aura/data-holdings/OMI/omno2_v003.shtml is regridded to the model resolution. Surface ozone observations are from EPA’s Clean Air Status and Trends Network (CATNET) and National Park Service sites.
Technical Description of Figures:Graphic a: Summertime surface ozone over the eastern United States decreased over the period from 1991-2010, with many sites showing statistically significant negative trends in July. The observed trends (left panel) are well-captured by a GMI model simulation (right panel) driven by time-dependent emissions of NOx and other pollutants. Statistically significant trends are plotted in circles, while trends that are not significant are shown in triangles.Graphic b: Observations of the tropospheric NO2 column from OMI (left panel) show that concentrations of NO2, a pollutant that contributes to ozone formation, decreased over the eastern U.S. between 2005 and 2010. This decrease is also present in the GMI simulation (right panel), contributing to the good agreement between the simulated and observed ozone decreases.Graphic c: Observations (black squares) of ozone over the Mid-Atlantic region show that ozone decreased in summer between the period from 1992-1997 and the period from 2005-2010, while showing a smaller increase in winter. The GMI simulation driven by changing emissions (red diamonds) captures this change in the annual cycle of ozone. An additional GMI simulation which used fixed emissions throughout all years (blue diamonds) does not capture the observed changes, confirming that reductions in pollutant emissions drove the observed change in the annual cycle.
Scientific significance, societal relevance, and relationships to future missions: Surface ozone pollution is harmful to human health and a major contributor to air quality violations. Demonstrating that models can reproduce the observed decreases in eastern U.S. ozone and NO2 is important for establishing the link between decreases in ozone and reductions in the emissions of ozone-forming pollutants. By demonstrating skill in simulating the historic trends and year to year variability of surface ozone, our study increases confidence in model projections of how ozone pollution may change in the future. Future missions that provide space-based measurements of NO2 and other pollutants could further improve our ability to simulate and interpret changes in ozone pollution.
Earth Sciences Division - Atmospheres


![[Derek Sayer] Marx's Method Ideology, Science, An(BookZZ.org)](https://static.fdocuments.us/doc/165x107/563dbba7550346aa9aaf145e/derek-sayer-marxs-method-ideology-science-anbookzzorg.jpg)