Aerodynamic forces on a stationary and oscillating ...
66
N 0 0 M w w c 4 m 4 z I AS A TECHNICA REPORT L AERODYNAMIC FORCES ON A STATIONARY A N D OSCILLATING CIRCULAR CYLINDER AT HIGH REYNOLDS NUMBERS bY George W. Jones, Jr. Lungley Reseurch Center Joseph J. Cincotta The Martin Company and Robert W. Wu Zker George C. Mdrslbu ZZ Space FZight Center NATIONAL AERONAUTICS AND SPACE ADMINISTRATION WASHINGTON, D. C. FEBRUARY 1969
Transcript of Aerodynamic forces on a stationary and oscillating ...

N
0 0 M
w w c 4 m 4 z
I
A S A T E C H N I C A
R E P O R T L
AERODYNAMIC FORCES ON A STATIONARY A N D OSCILLATING CIRCULAR CYLINDER AT HIGH REYNOLDS NUMBERS
bY George W. Jones, Jr. Lungley Reseurch Center
Joseph J. Cincotta T h e Martin Company
and
Robert W. Wu Zker George C. Mdrslbu ZZ Space FZight Center
N A T I O N A L A E R O N A U T I C S A N D S P A C E A D M I N I S T R A T I O N W A S H I N G T O N , D . C. F E B R U A R Y 1 9 6 9

TECH LIBRARY KAFB, NW
I II I llllll11111 lllll I 11111 llll11111lll Ill 0068432
AERODYNAMIC FORCES ON A STATIONARY AND OSCILLATING
CIRCULAR CYLINDER AT HIGH REYNOLDS NUMBERS
By George W. Jones, Jr. Langley Resea rch Center
Langley Station, Hampton, Va.
Joseph J. Cincotta The Mart in Company
Bal t imore, Md.
and Robert W. Walker George C. Marshal l Space Flight Center
Huntsville, Ala.
NATIONAL AERONAUTICS AND SPACE ADMINISTRATION
For sale by the Clearinghouse for Federal Scient i f ic and Technica l Information Springfield, Virginia 22151 - C F S T I pr ice $3.00


CONTENTS
Page SUMMARY . . . . . . . . . . . . . . . . . . . . . . . . . . . . . . . . . . . . . . . 1
INTRODUCTION . . . . . . . . . . . . . . . . . . . . . . . . . . . . . . . . . . . . 2
SYMBOLS . . . . . . . . . . . . . . . . . . . . . . . . . . . . . . . . . . . . . . . 3
APPARATUS AND TESTS . . . . . . . . . . . . . . . . . . . . . . . . . . . . . . . 7 Test Facility . . . . . . . . . . . . . . . . . . . . . . . . . . . . . . . . . . . . . 7 Model . . . . . . . . . . . . . . . . . . . . . . . . . . . . . . . . . . . . . . . . 7 Instrumentation and Dah-Reduction Procedures . . . . . . . . . . . . . . . . . . 10 Tes t s . . . . . . . . . . . . . . . . . . . . . . . . . . . . . . . . . . . . . . . . . 11
RESULTS AND DISCUSSION . . . . . . . . . . . . . . . . . . . . . . . . . . . . . . 12 Static Measurements . . . . . . . . . . . . . . . . . . . . . . . . . . . . . . . . 12
Static p re s su res . . . . . . . . . . . . . . . . . . . . . . . . . . . . . . . . . . 12 Dragda ta . . . . . . . . . . . . . . . . . . . . . . . . . . . . . . . . . . . . . 17
Characteristics of Unsteady Lift Measured on Stationary Cylinder . . . . . . . . 26 Frequency content of unsteady lift . . . . . . . . . . . . . . . . . . . . . . . . 26 Magnitude of unsteady lift . . . . . . . . . . . . . . . . . . . . . . . . . . . . . 30
Measurement of Unsteady Lift Due to Cylinder Motion . . . . . . . . . . . . . . . 33 Power spectral density and root-mean-square values . . . . . . . . . . . . . . 33 Lift-force vector at frequency of cylinder oscillation . . . . . . . . . . . . . . 36 Aerodynamic derivatives of lift due to motion . . . . . . . . . . . . . . . . . . 36
CONCLUSIONS . . . . . . . . . . . . . . . . . . . . . . . . . . . . . . . . . . . . . 43
APPENDIX A . ESTIMATION OF SOLID-BLOCKAGE INTERFERENCE . . . . . . 45
APPENDIX B . DETAILS OF INSTRUMENTATION AND DATA-REDUCTION PROCEDURES . . . . . . . . . . . . . . . . . . . . . . . . . . . . . . . . . . . . 46
REFERENCES . . . . . . . . . . . . . . . . . . . . . . . . . . . . . . . . . . . . . 53
TABLES . . . . . . . . . . . . . . . . . . . . . . . . . . . . . . . . . . . . . . . . 55
iii

I
AERODYNAMIC FORCES ON A STATIONARY AND OSCILLATING
CIRCULAR CYLINDER AT HIGH REYNOLDS NUMBERS
By George W. Jones, Jr., Joseph J. Cincotta, and Robert W. Walker
SUMMARY
A wind-tunnel investigation has been made of the steady drag and unsteady lift (lateral) forces on a stationary and oscillating circular cylinder in two-dimensional flow at Reynolds numbers f rom 0.36 X lo6 to 18.70 X lo6 and at Mach numbers M up to 0.6. The experimental data were obtained in the Langley transonic dynamics tunnel f rom tes t s of a 3-fOOt (0.914-meter) diameter cylinder instrumented to measure directly the unsteady lift and mean drag forces on the cylinder. The cylinder could be held fixed or oscillated laterally to the flow at frequencies f rom 3 to 20 hertz. tigation verified and considerably extended the range of previous knowledge in this area.
The resul ts of the inves-
For the stationary cylinder, the most important resul ts may be summarized as fol- The static-pressure distributions, the mean drag coefficients at M 5 0.2, and the lows:
Strouhal number of the unsteady lift forces follow the trends established by previous inves- t igators up to the l imits of Reynolds number investigated. Reynolds numbers, each of these parameters remains essentially constant; that is, the static-pressure distribution remains essentially the same above a Reynolds number of 8 x 10⁶, the mean drag coefficient is approximately 0.54, and the Strouhal number is approximately 0.3. The unsteady lift force can be categorized into three regimes depen- dent upon Reynolds number - wide-band random, narrow-band random, and quasi- periodic. The root-mean-square unsteady lift coefficient at Mach numbers less than 0.3 var ies over a wide range at Reynolds numbers f rom 1.4 X lo6 to 8 X 10⁶; then, at higher Reynolds numbers, it is a single-valued function which decreases with increasing Reynolds number.
At higher (hitherto unexplored)
For the oscillating cylinder, the most important resul ts may be summarized as fol- Oscillation of the cylinder in the lift direction has no significant effect on the mean
An unsteady lift due to cylinder motion, which increases with amplitude lows: drag coefficient. of motion, exists only when the cylinder is oscillated at o r relatively near the aerody- namic Strouhal frequency for the stationary cylinder. This unsteady lift is a negative (destabilizing) aerodynamic damping force a t cylinder frequencies below the stationary- cylinder Strouhal frequency. As the cylinder frequency is increased through and above the Strouhal frequency, there is an abrupt change in the unsteady lift due to motion to a posi- tive (stabilizing) aerodynamic damping force. Aerodynamic derivatives with respect to displacement of the components of unsteady l i f t due to motion decrease nonlinearly with increasing amplitude of motion.
INTRODUCTION
The aerodynamic forces produced by flow about c i rcular cylinders with the longi- tudinal axis perpendicular to the flow have been of interest since the ancient invention of the Aeolian harp. For some t ime it has been generally known that the behavior of a cylinder in a laminar flow at low Reynolds numbers is characterized by the formation of a K&rm&n vortex street in which the periodic separation of continuous vortices along alternate sides of the cylinder gives r i s e to periodic forces in the lift (lateral) direction. Recently, the response to ground winds of large flexible structures, such as metal smoke- stacks and cylindrical space vehicles standing on the launch pad, has led to considerable interest in the spontaneously generated unsteady aerodynamic forces on circular cylinders a t high Reynolds numbers. These unsteady forces are produced by vortices shed alter- nately from the sides of the s t ructure and by atmospheric turbulence. For lightly damped structures, these forces are capable of exciting large-amplitude vibratory response. The unsteady forces associated with vortex shedding are not well understood o r amenable to analysis. erences 1 to 11, which have given some understanding of the mechanism of vortex shedding, particularly at lower Reynolds numbers. little information on the nature of these aerodynamic forces. In particular, the question of how these forces a r e affected by the motion of the structure as it deflects in response to the aerodynamic loads has needed investigation.
cylinder in a two-dimensional flow at Reynolds numbers f rom 0.36 X 10⁶ to 18.70 X lo6. The cylinder was instrumented s o that the mean drag and the unsteady lift forces could be read directly. over a range of amplitudes and frequencies. tigate the effects of cylinder motion on the aerodynamic forces generated. tionary cylinder, static-pressure distributions were measured (at one longitudinal station) throughout the tes t Reynolds number range, and flow visualization techniques were used to gain additional understanding of the flow field about the cylinder. comparison of the Reynolds number and nondimensional-frequency-of-oscillation ranges of this investigation with those of previous investigations. investigation has greatly extended the Reynolds number and nondimensional-frequency-of- oscillation ranges over which the aerodynamic forces on cylinders have been studied.
The investigation was a joint effort by the National Aeronautics and Space
Many investigators have made experimental studies, such as those given in ref-
However, at higher Reynolds numbers, there is
A wind-tunnel investigation has, therefore, been conducted on a large circular
In addition to being held stationary, the cylinder could be oscillated This oscillation capability was used to inves-
On the sta-
Figure 1 presents a
This figure shows that this
Administration (George C. Marshall Space Flight Center and Langley Research Center) and The Martin Company, Baltimore. The Martin Company, under contract, supplied the model and participated in the tests and in some of the data reduction. The resul ts of the investigation are presented and analyzed herein.
2

Strouhal no. ---
I I I I I I l l 1 I I I I I I I l l I I I I I I l l 1 I I I I I l l l l
lo5 lo6 lo7 108
Reynolds no.
f D Figure 1.- Comparison of RN and % ranges of present investigation with previous investigations (refs. 1 to 5, 7, and 8).
SYMBOLS
[The words "instrumented section" used in defining symbols refer to the large instrumented model section having a length of 2.33 diameters]
A projected a rea of instrumented section of cylinder
CD mean drag coefficient for instrumented section of cylinder
absolute value of aerodynamic-lift-coefficient vector at frequency of oscilla- tion of cylinder, ICL,Re + iCL,Iml
ICLl
C L , I ~ imaginary component (in phase with cylinder velocity) of aerodynamic-lift- coefficient vector at frequency of oscillation of cylinder
3

C L , ~ ~ real component (in phase with cylinder displacement) of aerodynamic-lift- coefficient vector at frequency of oscillation of cylinder
CL,rms(h/D) root-mean-square value of unsteady lift coefficient on instrumented section of oscillating cylinder
CL,rms(O) root-mean-square value of unsteady lift coefficient on instrumented
‘d
cL
cP
‘p,base
D
FBottom
FD
FL
- FL
F ~ , Im
FL,Re
section of stationary cylinder
section mean drag coefficient for stationary cylinder
section mean l i f t coefficient for stationary cylinder
section static-pressure coefficient on stationary cylinder, Ap/q
average of section pressure coefficients a t rear of cylinder between Cp = 150’ and Cp = 210°
diameter of test cylinder, 3 feet (0.914 meter)
sum of lift forces at bottom of instrumented section of cylinder,
F D , i + FD,2
F L , ~ + FL,4
total drag force on instrumented section of cylinder,
forces in drag direction on instrumented section of cylinder measured by drag transducers 1 and 2, respectively
total aerodynamic lift force on instrumented section of cylinder, FTop + FBottom - Fs
mean value of FL
imaginary component (in phase with velocity) of unsteady lift force on instru- mented section of cylinder at frequency of oscillation of cylinder
real component (in phase with cylinder displacement) of unsteady lift force on instrumented section of cylinder at frequency of oscillation of cylinder
4

forces in l i f t direction on instrumented section of cylinder measured by lift transducers 1, 2, 3, and 4, respectively
FTop sum of lift forces at top of instrumented section of cylinder, F L , i + F L , ~
Fx inertia force in l i f t direction on instrumented section of cylinder
f frequency
fh forcing frequency of oscillation of cylinder
f s vortex-shedding frequency of cylinder, defined as predominant frequency of autocorrelation function of unsteady-lift-data sample
f 1 fundamental frequency of model cylinder (which had adjustable natural frequencies)
g acceleration due to gravity
h instantaneous amplitude of cylinder displacement under forced oscillation, ho COS w t
ha Scruton-type aerodynamic derivative (see ref. 4) of rea l component of unsteady- aerodynamic-lift- coefficient vector at frequency of oscillation of cylinder,
‘L,Re 2 S2 (h/ D)
h0 amplitude (0-peak) of cylinder displacement
root-mean-square value of ho/D (ho/D) r m s
ka Scruton-type aerodynamic derivative of imaginary component of unsteady- aerodynamic-lift- coefficient vector at frequency of oscillation of cylinder
CL , Im 4 .S2 (h/ D)
M Mach number
p(FL) probability density function of unsteady lift force
5
t
V
- V
X
AP
AS
e
f ree-s t ream dynamic pressure, 2pV 1 2
pVD I-1 Reynolds number based on cylinder c ross - section diameter,
autocorrelation function of unsteady l i f t force
f S D aerodynamic Strouhal number, - V
integration time constant used in data reduction
total amount of time that FL falls inside range FL,FL + AFL) during ( t ime period T
time
velocity of test medium
mean value of perturbation velocity in measuring turbulence level of tunnel flow
acceleration in lift direction of instrumented section of cylinder
local-surface static pressure minus free-s t ream static pressure
half-power Strouhal bandwidth of unsteady lift
phase angle between cylinder displacement and unsteady lift force due to motion of cylinder at frequency of oscillation of cylinder
dynamic viscosity of tes t medium
density of test medium
time displacement variable of autocorrelation function
angular location of static-pressure orifice with respect to direction of free- s t ream flow
6

power spectral density of unsteady aerodynamic l i f t coefficient as function 00
Of (FL)2 = 1 @cL(?) d ( T ) V' 0
circular frequency
APPARATUS AND TESTS
Test Facility
The Langley transonic dynamics tunnel used for the investigation is a single-return- flow, variable-pressure, slotted-throat wind tunnel with a tes t section 16 feet (4.877 m) square (having cropped corners). The tunnel can operate at stagnation pressures from about 0.05 atmospheric to slightly above atmospheric at Mach numbers from 0 to 1.2. Either air or freon gas may be used as the tes t medium. This facility is particularly suited for general dynamics testing because Mach number and Reynolds number can be varied independently and a r e continuously controllable. The flow in the tes t section for the ranges of this investigation had a maximum deviation from average free-s t ream Mach number of approximately 0.003 and w a s moderately turbulent, having a turbulence level
of (@/V) = 0.0017. Although the model cross-sectional a r ea appears large in relation to the tunnel cross-sectional area, as shown in figure 2, the estimated solid-blockage interference w a s negligible (see appendix A), and no wall-interference corrections have been made to the data.
Model
The cylinder model had a 3-foot (0.914-meter) diameter and spanned the tunnel
The model structure consisted of an inner supporting
A photograph of the model installed in the tunnel is
from floor to ceiling with i ts longitudinal axis perpendicular to the tunnel flow and cen- tered in the test-section span. cylinder, an outer cylinder divided into sections, a variable-stiffness suspension system, and a hydraulic shaker system. given in figure 2 and assembly details a r e shown in figure 3. The four principal par ts of the model structure are discussed in the following paragraphs.
The inner cylinder w a s a seamless aluminum tube, 17 feet (5.182 meters) long and 19 inches (0.483 meter) in diameter, which extended through openings in the floor and ceiling of the tes t section. This cylinder provided the necessary load carrying capability to withstand the inertia and aerodynamic loads imposed on the outer cylinder during the tes ts . Four adjustable rings were attached to the inner cylinder, one at each end of the outer-cylinder top and bottom sections (see fig. 3). These rings provided small span- wise adjustments to the outer sections.
7
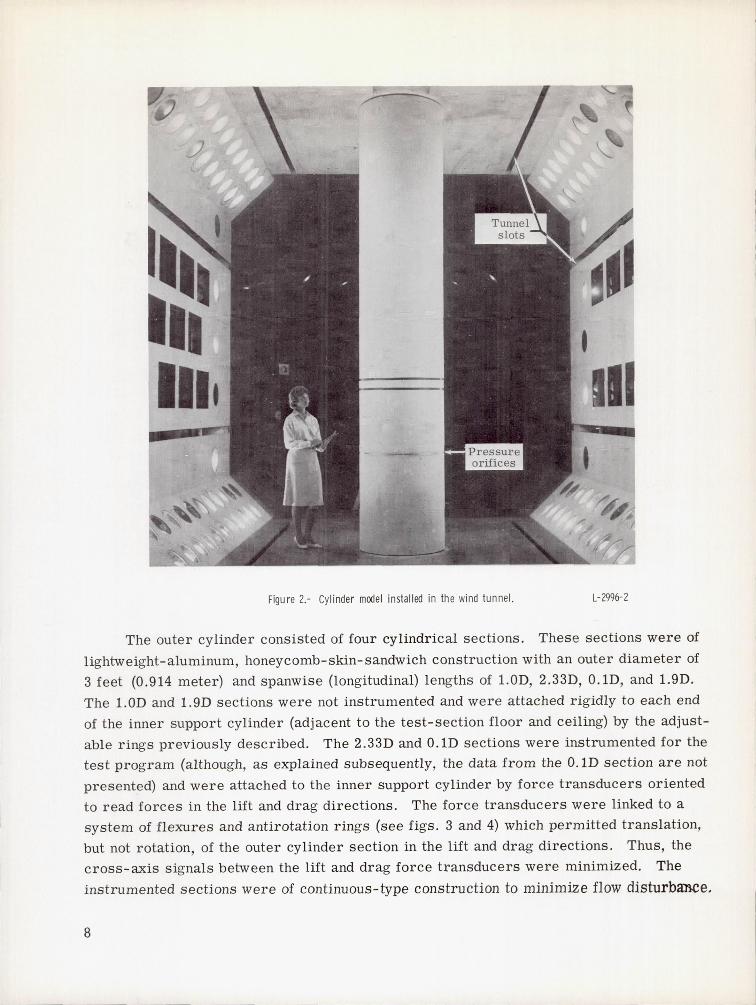
Figure 2.- Cylinder mooel installed in th e wind tunnel. L-2996-2
The outer cylinder consisted of four cylindrical sections. These sections were of
lightweight-aluminum, honeycomb-skin-sandwich construction with an outer diameter of
3 feet (0.914 meter) and spanwise (longitudinal) lengths of l.OD, 2.33D, 0.1D, and 1.9D.
The 1. OD and 1. 9D sections were not instrumented and were attached rigidly to each end
of the inner support cylinder (adjacent to the test-section floor and ceiling) by the adjust
able rings previously described. The 2.3 3D and 0.1D sections were instrumented for the
test program (although, as explained subsequently, the data from the O.1D section are not
presented) and were attached to the inner support cylinder by force transducers oriented
to read forces in the lift and drag directions. The force transducers were linked to a
system of flexures and antirotation rings (see figs. 3 and 4) which permitted translation,
but not rotation, of the outer cylinder section in the lift and drag directions. Thus, the
cross-axis signals between the lift and drag force transducers were minimized. The
instrumented sections were of continuous-type construction to minimize flow disturbance.
8

Torque-bar journal bearing
Instrumented sections
Adjustable ring
Outer honeycomb cylinder
Inner cyclinder
Antirototion nng With flexures
Force transducers (typical)
Figure 3.- Model assembly and installation details.
Antirotation flexure (lift direction)
Wind direction
Antirotation flexure (drag direction)
Force transducer and flexure arrangement (typical)
Antirotation ring
Outer cylinder
Figure 4.- App lication of flexures on anti rotati on ring and force transducers.
9
The three circumferential gaps between adjacent outer cylinder sections were held to 0.03 inch (0.762 mm) and were originally designed with a simple labyrinth seal to prevent flow from penetrating the gaps. In practice, the gaps and seal as designed created unsat- isfactory flow disturbances and the gaps were then filled with a silicone rubber compound. This flexible rubber seal effectively eliminated the flow disturbances but allowed small relative motion between adjacent cylinder sections. 0.1D section only about 1 percent of the load on the 2.33D instrumented section.
The seal transmitted in shear to the
The model suspension system consisted of two identical assemblies, one located at each end of the inner cylinder and mounted outside the tunnel tes t section (see fig. 3). The basic par t s of each suspension assembly were a torque bar, a remotely operated torque-bar clamping mechanism, and a torque a r m which connected the inner cylinder to the torque bar. The torque a r m s (which were pin-connected to the inner cylinder at a location 3 feet (0.914 meter) inside the inner cylinder) allowed lateral translation of the model. Torque loads produced in the torque bars by this model motion were t ransferred to the torque-bar clamping mechanisms which, in turn, t ransferred the loads into the tun- nel structural beams. The system was designed to withstand loads up to 60g; however, the actual loads did not exceed 30g.
The cylinder model and torque-bar suspension assembly formed a resonant system in the cylinder translatory mode. The natural frequencies of the system could be varied by moving the clamping mechanisms along the torque bar and reclamping; the effective length of the torque b a r s was changed in this manner. The system could be tuned between 3 and 20 hertz so that the force required to drive the model in the translatory mode at any desired frequency in this range was minimized. This force was supplied by the hydraulic shaker system, which had one shaker attached to each end of the inner cylinder. Each of these two shakers was capable of providing a force up to 1400 pounds (6227 newtons) a t 3 inches (7.62 cm) maximum amplitude, and the system could control the amplitude throughout a frequency range from 3 to 20 hertz. single console to obtain synchronized amplitude at each shaker head,
The shakers were controlled from a
Vibration tes ts were conducted to determine the elastic resonant frequencies of the These tes ts showed that the natural frequencies of the model were well model assembly.
above the range of interest of the tes t data, with the lowest value being 70 hertz.
Instrumentation and Data-Reduction Procedures
A Martin-developed instrumentation system called the Inertia Compensated Balance (ICB) was used to measure directly on the stationary o r oscillated cylinder the unsteady aerodynamic lift force on the 2.33D-length instrumented outer-cylinder section. ICB system electrically combined the signals f rom the lift strain-gage force transducers with the signals from a strategically located accelerometer in such a manner as to cancel
This
10
out the forces due to inertia and give a direct measure of the unsteady aerodynamic l i f t force. manner, a failure of the drag ICB system (unrepairable in the t ime available) during model checkout prevented such measurements. However, measurements of the mean drag on the large instrumented outer-cylinder section were obtained from the drag transducers. A single row of static-pressure orifices measured the static-pressure distribution around the cylinder at one longitudinal station, 1.14 diameters f rom the lower end of the outer cylinder. An oil-film technique described in reference 12 was used to obtain photographic and eye-witness visualization of the mean flow on the cylinder surface.
Although.it was initially planned to measure the unsteady drag force in a s imilar
A number of data-reduction procedures, both "on-line" and "after-the-fact, I' were used to analyze the data, particularly the unsteady lift-force data on the stationary and oscillating cylinder. The mean square value, the power spectral density, the autocorrela- tion function, and the probability density were obtained in addition to time-history samples of the lift force. by means of an analog computer into its components in phase and 90' out of phase with displacement.
Also, for the oscillating cylinder, the unsteady lift force was resolved
A more detailed description of the instrumentation and the data-reduction procedures used to analyze the signals f rom the instrumentation is presented in appendix B. appendix gives instrumentation block diagrams and presents a discussion of the equipment techniques, the analysis parameters , and the relative accuracies for the data-reduction procedures.
This
Tests
During the tes t program, the mean drag and unsteady lift forces were measured at Reynolds numbers f rom 0.36 x 10⁶ to 18.70 X lo6 at Mach numbers up to 0.6 with the cylinder held stationary and with the cylinder oscillated a t model reduced frequencies fhD/V from 0.06 to 0.50. Static pressures were measured only with the cylinder held stationary. of Reynolds number and allowed a separate investigation of Mach number and Reynolds number effects on the aerodynamic force measurements.
The test program was accomplished in two phases. In the f i r s t phase, measure-
The use of air and freon tes t mediums at various densities gave a broad range
ments were made of the static pressures , unsteady lift, and mean drag with the cylinder held stationary in the flow. 0.03-inch (0.762-mm) gaps between the fixed and instrumented cylinder sections was seriously disturbed, even though the gaps were equipped with a labyrinth seal. After a period of experimentation, an additional sealing of the gaps with a silicone rubber com- pound was found to essentially eliminate the disturbance. except for sufficient drag data to i l lustrate the problem, only the static-pressure data
During this phase, the flow in the vicinity of the three
Because of this gap effect,
11
are presented from this phase of the program. In the second phase of the tests, with the gaps sealed with silicone rubber, measurements were made of the unsteady lift and mean drag forces, both with the cylinder held fixed and with the cylinder oscillating laterally over a range of frequencies and amplitudes. Before start ing this phase of the tests, the flexible tubing between the static-pressure orifices and the manometer board was removed in order to permit the cylinder to be oscillated. Consequently, no static-pressure mea- surements were taken with the gaps sealed with silicone rubber.
The procedures used in measuring the static pressures and the unsteady lift and mean drag forces were as follows: F o r static-pressure measurements, a desired wind- tunnel test condition was established and held constant until the manometer board stabil- ized and a photograph was taken of the manometer board. unsteady lift and steady drag aerodynamic forces, a desired test condition was established and held constant while a 1- to 2-minute data sample was recorded and an "on-line" analy- sis was made.
For measurement of the
RESULTS AND DISCUSSION
The resul ts and discussion are organized so that static data such as pressure dis- tributions and mean drag a r e presented f i rs t . These data are accompanied by remarks about flow conditions observed during the tests. After these data have been discussed, the unsteady lift on the stationary cylinder and the unsteady lift due to cylinder motion are presented.
Static Measurements
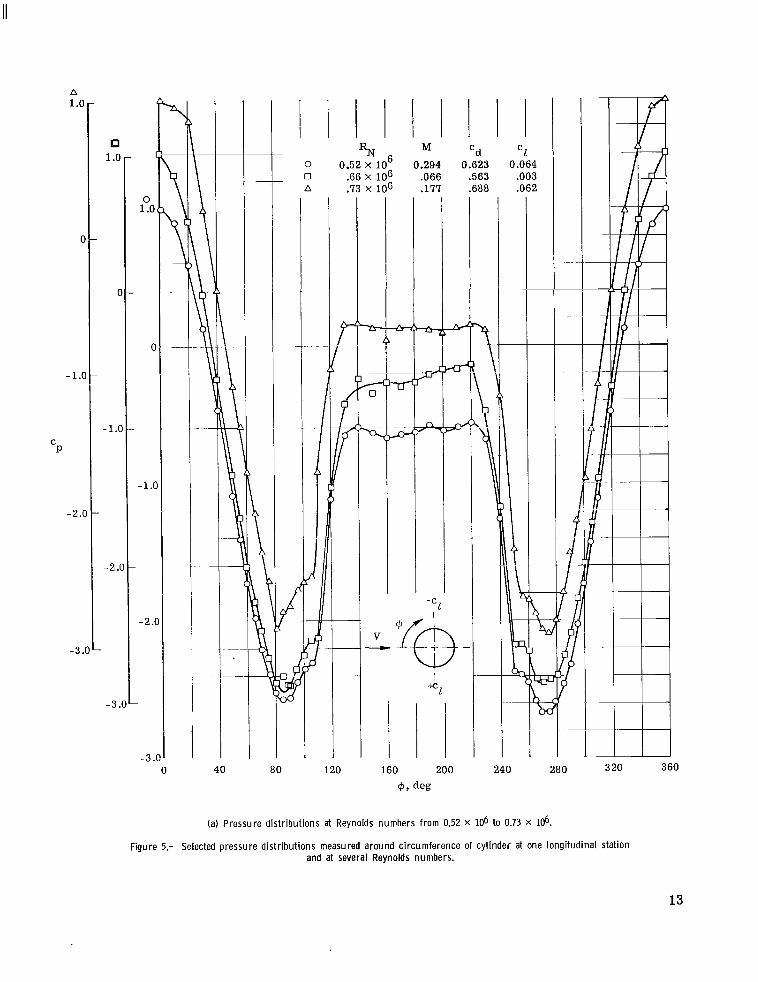
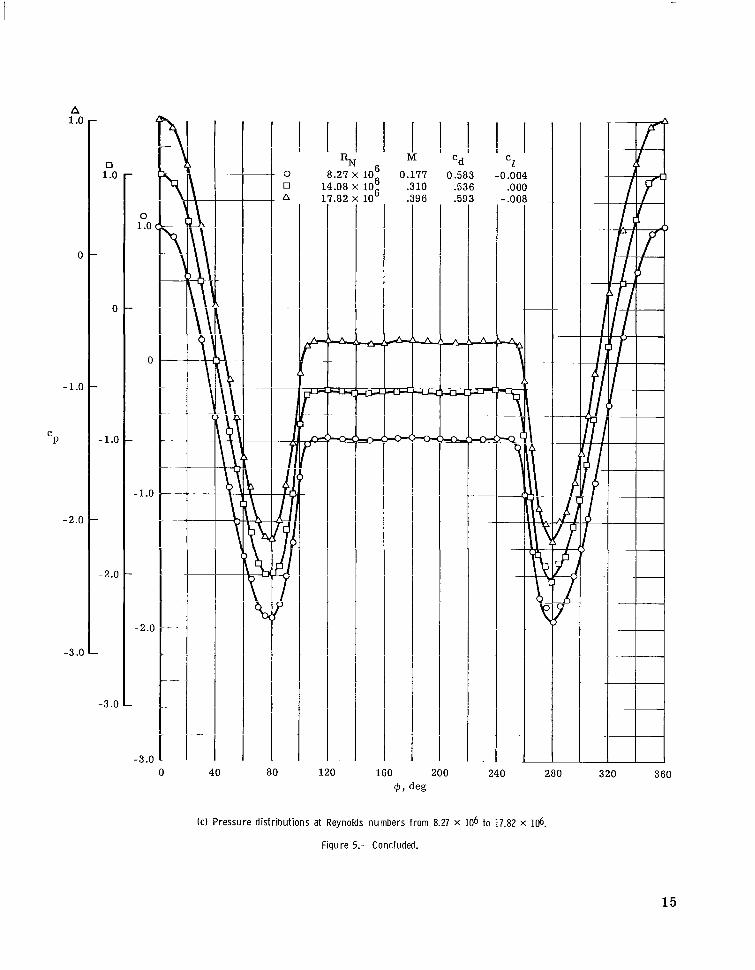
Static pressures . ~ - Static-pressure distributions were measured at one longitudinal station, 1.14 diameters above the floor of the tes t section, by using 48 static-pressure orifices spaced around the periphery of the cylinder. The pressure distributions were measured on the stationary cylinder at Reynolds numbers f rom 0.36 X lo6 to 18.70 x lo6 at Mach numbers f rom 0.05 to 0.46. Figure 5 presents, in order of increasing Reynolds number, nine selected pressure distributions. Reynolds numbers less than about 0.75 X lo6, difficulty was experienced in holding a steady tunnel velocity; therefore, measurements of the tunnel flow parameters and the static-pressure distributions are subject to inaccuracies not found a t Reynolds numbers above about 0.75 x 10⁶.
For static-pressure distributions at
The pressure distributions at Reynolds numbers f rom 0.52 X lo6 to 1.31 X lo6 (figs. 5(a) and 5(b)) show bulges at r$ =: 100' and r$ =: 260O. These bulges are believed to be evidence of the occurrence of laminar separation bubbles. As discussed in refer- ence 13, at very low Reynolds numbers, the flow on a cylinder is laminar with a laminar
12
A 1 .o
0
- 1 .a
c P
-2.c
-3 .(
1 .o
a
- 1 .c
- 2 s
-
- 3 .
0 1 .o
C
-1.(
-2 .
- 3 . 0
0 ‘d M RN
0.52 X lo6 0.294 0.623 .66 X lo6 .066 .563 .73 X lo6 .177 .688
40 80 120
2 -c
160
c1 0.064
.003
.062
240
(a) Pressure distributions at Reynolds numbers from 0.52 x 10⁶ to 0.73 X 10⁶.
280 3 20 360
Figure 5.- Selected pressure distributions measured around circumference of cylinder at one longitudinal station and at several Reynolds numbers.
13

A
17 1.0-
-1.0
-2.0
-3.0-
1
-1.
C P
-2.1
-3 .(
0 1 .o
0 -
0
-
-1.0
-
-2.0
-3.0
4, deg
( b ) Pressure distributions at Reynolds numbers from 0.81 X lo6 to 3.49 X IO6.
Figure 5.- Continued.
14
A 1 .o
0
- 1 .o
C P
-2.0
- 3 .O
I C 1 ! -0 .004
.ooo
'd 0.583
0 1 .o
0
-1.0
-2.0
-3 .O
0.177 .310 14.08 x 10
l o6 3 - 8 2
a.
u
- .O
0 1.0,
0
-1.0
-2.0
-3 .O 0 40 80 120 160 200 2 4 0 280 320 3 6 0
(c) Pressure distributions at Reynolds numbers from 8.27 x 10⁶ to 17.82 x 10⁶.
Figure 5.- Concluded.
15
l
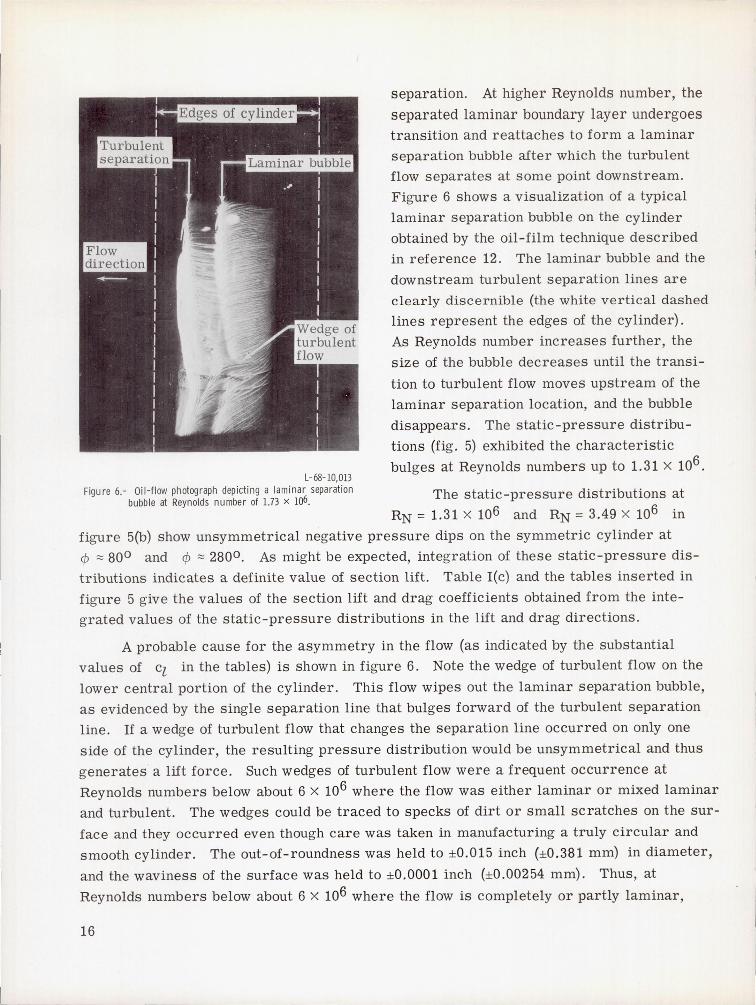
separation. At higher Reynolds number, the
separated laminar boundary layer undergoes
transition and reattaches to form a laminar
separation bubble after which the turbulent
flow separates at some point downstream.
Figure 6 shows a visualization of a typical
laminar separation bubble on the cylinder
obtained by the oil-film technique described
in reference 12. The laminar bubble and the
downstream turbulent separation lines are
clearly discernible (the white vertical dashed
lines represent the edges of the cylinder).
As Reynolds number increases further, the
size of the bubble decreases until the transi
tion to turbulent flow moves upstream of the
laminar separation location, and the bubble
disappears, The static-pressure distribu
tions (fig. 5) exhibited the characteristic
bulges at Reynolds numbers up to 1. 31 x 106 .
The static-pressure distributions at L-68-lO,013
Figure 6.- Oil-flow photograph depicting a laminar separation bubble at Reynolds number of 1.73 x 10⁶.
RN = 1.31 x 10⁶ and RN = 3.49 x 10⁶ in
figure 5(b) show unsymmetrical negative pressure dips on the symmetric cylinder at
¢ :::: 80 0 and ¢:::: 2800 . As might be expected, integration of these static-pressure dis
tributions indicates a definite value of section lift. Table I(c) and the tables inserted in
figure 5 give the values of the section lift and drag coefficients obtained from the inte
grated values of the static-pressure distributions in the lift and drag directions.
A probable cause for the asymmetry in the flow (as indicated by the substantial
values of Cz in the tables) is shown in figure 6. Note the wedge of turbulent flow on the
lower central portion of the cylinder. This flow wipes out the laminar separation bubble,
as evidenced by the single separation line that bulges forward of the turbulent separation
line, If a wedge of turbulent flow that changes the separation line occurred on only one
side of the cylinder, the resulting pressure distribution would be unsymmetrical and thus
generates a lift force. Such wedges of turbulent flow were a frequent occurrence at
Reynolds numbers below about 6 x 10⁶ where the flow was either laminar or mixed laminar
and turbulent, The wedges could be traced to specks of dirt or small scratches on the sur
face and they occurred even though care was taken in ma.nufacturing a truly circular and
smooth cylinder. The out-of-roundness was held to ±0.015 inch (±0.381 mm) in diameter,
and the waviness of the surface was held to ±O,OOOI inch (±0.00254 mm). Thus, at
Reynolds numbers below about 6 x 10⁶ where the flow is completely or partly laminar,
16
flow disturbances will be triggered, even on a polished round cylinder, by specks of d i r t or small scratches on the surface. These disturbances, if asymmetric, produce a mean lift force.
At Reynolds numbers greater than about 6 x lo6, the turbulent transition has moved upstream until the flow about the cylinder is predominantly or fully turbulent. The turbu- lent flow is not as easily disturbed as the laminar flow or the flow with a laminar separa- tion bubble. 17.82 X 10⁶ of figure 5(c) are in this predominantly turbulent flow Reynolds number range. These distributions are much more symmetrical than those at Reynolds numbers below 6 X 10⁶ and the section-lift-coefficient values are negligible. In the hitherto unexplored Reynolds number range f rom 8.27 x 10⁶ to 18.70 x 10⁶, increasing Reynolds number had little effect on the distribution of pressure except for a slight increase in the negative pressure peaks.
Drag data.- The mean drag was obtained on the 2.33D-length instrumented section of the cylinder over a Reynolds number range from 0.36 X lo6 to 18.27 X 10⁶. and freon test mediums were used at atmospheric and reduced pressures to obtain these data. in addition to measurements of fluctuating lift forces. equipped to measure unsteady drag on the 0.1D section by using the Inertia Compensated Balance (ICB) system. Unfortunately, because of the previously discussed failure of the drag component of this system, no measurements were made of the unsteady drag force and only the mean drag force was measured. All subsequent references to drag data in this paper a r e for the measured mean drag force. Fortunately, the unsteady portion of the drag force is known to be much smaller than the unsteady l i f t force. (For example, see ref. 2.)
The pressure distributions at Reynolds numbers f rom 8.27 X lo6 to
Both air
Initially, a secondary objective of this study was to measure fluctuating drag forces Accordingly, the model was
In the initial phase of the investigation, as previously mentioned, extensive aero- dynamic disturbances were found to be caused by the gaps between the instrumented and fixed outer-cylinder sections, even though these gaps were closed with a labyrinth seal. The effects of the gaps are discussed in the next paragraphs pr ior to the presentation of the drag data and the oil-flow photographs showing the gap effects.
The 0.246-inch (0.625-cm) gaps between the ends of the cylinder and the tunnel floor and ceiling were separated from the instrumented cylinder sections by fixed cylinder sections at least a diameter in length. sured forces are believed to have been insignificant. between the fixed and instrumented cylinder sections caused extensive flow disturbances that affected the drag and lift data. The measurements taken on the smaller 0.1D instru- mented section were totally unreliable. Also, there were large e r r o r s in the measure- ments taken on the 2.33D instrumented section. In an effort to eliminate these
Therefore, the effects of the end gaps on the mea- The 0.03-inch (0.762-mm) gaps
17
I I . 111 I,,. I I, I. --,--.-----.-.----
disturbances, several methods of filling the gaps were tr ied. was to f i l l the gaps between the edges of the cylinder sections with a silicone rubber com- pound so as to present a flush surface to the airs t ream. allowed relative movement between the instrumented and fixed cylinder sections. Although the shear load transmitted by the flexible rubber seal was only about 1 percent of the load on the 2.33D instrumented section, the load transmitted to the adjacent 0.1D section caused unacceptably large e r r o r s in the force measurements taken on the 0.1D section. pose of the 0.1D section was to compare the data f rom this cylinder section with the overall data f rom the large instrumented section to obtain some indication of any three- dimensional aspects of forces along the length of the cylinder and of the formation (if any) of vortex "cells" as discussed in reference 3.
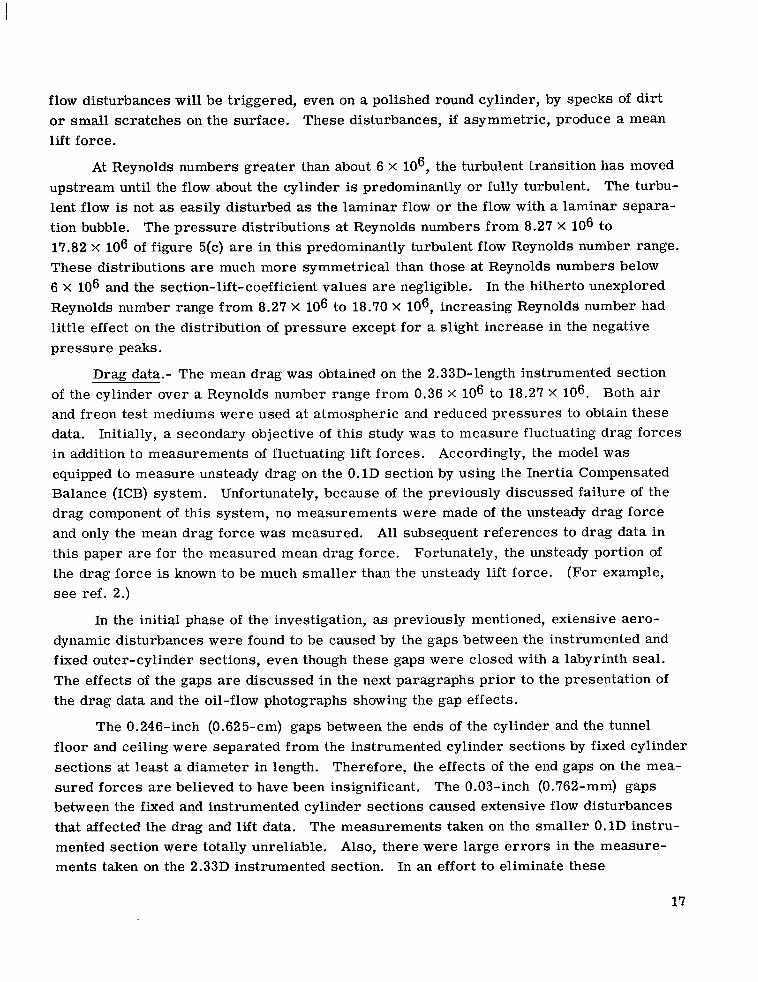
The effects of the gaps on the flow are depicted in the oil-flow photographs of fig- u re 7. For a mixed laminar and turbulent flow (RN = 2.5 X lo6), the separation is much more uniform with the gap-sealed flow. (Compare fig. 7(a) with fig. 7(b).) A similar comparison is made for turbulent flow conditions at RN fig. 7(d).) not as disturbed (fig. 7(c)) as in the mixed laminar and turbulent flow case (fig. 7(a)).
The sealing method used
The flexibility of this compound
Consequently, data f rom the 0.1D section are not presented. The original pur-
10 X lo6. (See fig. 7(c) and Again, the gap-sealed separation is more uniform, but the gap-open flow was
Table I presents mean drag coefficients measured on the 2.33D cylinder section with the gaps sealed and with the gaps open and also presents the section lift and drag coefficients obtained from integration of the static pressures in the lift and drag direc- tions. Figure 8 presents selected drag data f rom table I. Gap-sealed and gap-open force data and integrated-static-pressure section-drag data are compared. At lower Reynolds numbers, the static-pressure data and force data, both taken with gaps open, are signifi- cantly higher than the force data with the gaps sealed. The oil-flow photograph in fig- u r e 7(a) suggests that even though the static orifices were 0.753 diameter below the unsealed gap, the flow in this area may have been affected by the gaps. Since figure 8 shows the drag-coefficient data obtained by force measurements on the cylinder with gaps open and those obtained by integration of the static pressures to be questionable, only gap-sealed drag data are presented in the rest of the report.
The speed of sound in freon is about one-half that in air, and the kinematic viscosity is about one- sixth that of a i r ; consequently, the Mach number-Reynolds number relation- ship is different fo r the two tes t mediums at any given pressure. Therefore, when com- paring drag data obtained in the two tes t mediums, air and freon, at various pressures , the following cross-plotting procedure was used to isolate Mach number and Reynolds number effects. For each series of data points taken with a given tes t medium and pres- sure , working plots of the type presented in figure 9 were constructed. One plot presents Reynolds number as a function of Mach number, and the other plot presents drag coeffi- cient as a function of Mach number. Smooth curves were faired through the data points.
18

I I I I I I iT···· .# l I • I : 1/ '~I I
. ~, I lim ,~: I I _I ',' I
I I I I
~ ':', , ~ : II~I " I
~ l I I I
(a) Gaps open; RN = 2.3 x 10⁶, (b) Gaps sealed; RN = 2,9 x 10⁶,
(c) Gaps open; RN = 10,2 x 10⁶. (d) Gaps sealed; RN = 9.5 x 10⁶, L-68-10 014
Figure 7,- Oil-flow photographs showing flow about cylinder at low and high Reynolds numbers for gaps-open and gaps-sealed conditions,
19

8 X
Type measurement
- Force data, gaps open
-
0 Force data, gaps sealed
0 Integrated static pressures
lo6
1-1 I .I I 1.2
1.0
.8
.6 cD
.4
.2
0
- Test medium 000 A i r , 1 atmosphere
- dd A i r , 1/2 atmosphere % Freon, 1/10 atmosphere
-
-
-
-
-
-
-
-
-
-
-
-
- 4
RN
5 6
Figure 8.- Comparison of drag-coefficient data obtained by force measurements with gaps sealed, force measurements with gaps open, and by integration of static pressures.
Then, by using the faired curves at selected Mach numbers, the corresponding Reynolds numbers and drag coefficients were read. in table 11.
The resul ts of this procedure are tabulated
Drag data f rom table 11 for M 5 0.2 are presented in figure 10 and compared with data f rom previous investigations. on launch vehicles or s imilar large cylindrical s t ructures where Mach numbers are low but Reynolds numbers high. The trends from the four different sources agree well; how- ever, a t a given Reynolds number, the differences in measured drag coefficients are appreciable. with the data of these tes ts was probably caused by the differences in roughness of the two cylinder surfaces. of 200 microinches (5.08 pm), which gave a roughness factor (roughness height to diameter) about 6 t imes that of the present cylinder.
These data are of particular interest for ground winds
In particular, the greater drag on Roshko's cylinder (ref. 5) as compared
Roshko's cylinder had a sandblasted finish with a roughness height
Schlichting (ref. 14) indicates that
20

RN
1
M
(a) Variation of Reynolds number wi th Mach number.
(b) Variation of drag coefficient wi th Mach number.
Figure 9.- Typical working plot of data from two tunne l r u n s in different test mediums.
21

l o5 106 RN
lo7
sti
Figure 10.- Mean drag coefficient for M 2 0.2 and comparison with previous investigations.
I 1 1 i
ti&
lo8
changes in drag of the order shown in figure 10 could be caused by this difference in roughness. The data of the present investigation show that for a smooth cylinder the drag coefficient increases f rom 0.15 at RN = 0.5 X lo6 to about 0.54 at RN = 3 X lo6 and then decreases slightly to 0.52 as Reynolds number increases to 10 x 106.
The variation of base pressure should have the same trend with Reynolds number as does the mean drag. The base-pressure-coefficient data at Mach number 50.2 are presented in figure 11, together with base-pressure data f rom references 5, 6, and 8. These base pressures show the same trends as the drag coefficients of figure 10, with the base-pressure data fo r the present investigation a t Reynolds numbers greater than 2 X lo6 in agreement with the data of Schmidt (ref. 8) but less negative than those of Roshko (ref. 5). The base pressures for the present investigation at RN 5 2 X lo6 may be affected by flow disturbances from gaps o r surface imperfections as previously discussed.
The increase in drag coefficient between Reynolds numbers from 0.5 X lo6 to 3 X lo6 (fig. 10) occurs in the range of flow where, as Reynolds number increases, the turbulent transition moves upstream until it eliminates the laminar bubble and continues moving upstream. replaced laminar boundary layer, This increased thickness resul ts in a widened wake with a more negative base pressure (fig. 11) and a resultant increase in drag (fig. 10). As Reynolds number is increased above about 3 X lo6, the thinning effect of Reynolds number
The turbulent boundary layer grows in thickness more rapidly than the
22

-1.2
-1.0
- .8
-.e
cp,base
- .4
-.2
0 lo5 lo6
RN 10" IO8
Figure 11.- Base-pressure-coefficient data at M 2 0.2 and comparison with previous investigations.
on the boundary layer most likely exceeds the thickening effect of the small remaining upstream movement in transition as the transition nears the stagnation line. There is a resultant decrease in wake width, negative base pressure (fig. ll), and drag (fig. 10).
An interesting Mach number-Reynolds number effect on drag occurred as Mach number was increased from 0.2 to 0.4. As shown in figure 12 (which is plotted from the data of table 11) at Reynolds numbers between 4 X lo6 and 8 X lo6, a peak in the variation of drag coefficient with Reynolds number develops at Mach numbers above 0.2. A plaus- ible physical explanation of this peaking is suggested as follows. As the Mach number of the flow around the cylinder approaches the cri t ical value (estimated from the local dis- tribution of pressure to occur at a free-s t ream Mach number of 0.46), the compressibility effect on the distribution of pressure moves the flow separation forward with a resultant increase in negative base pressure and drag. Figure 13(a) indicates this drag rise due to Mach number at a Reynolds number of 7.5 X lo6 as obtained from cross-plotting the data of figure 12. For a constant, f ree-s t ream Mach number, however, an increase in Reynolds number in the region around 7 x lo6 will, as discussed in relation to figure 10, thin the boundary layer with a resultant rearward movement in separation, a narrowed wake, and a decrease in negative base pressure and drag. Figure 13(b) indicates this trend in drag at a Mach number of 0.4 as obtained from the data of figure 12. These
23
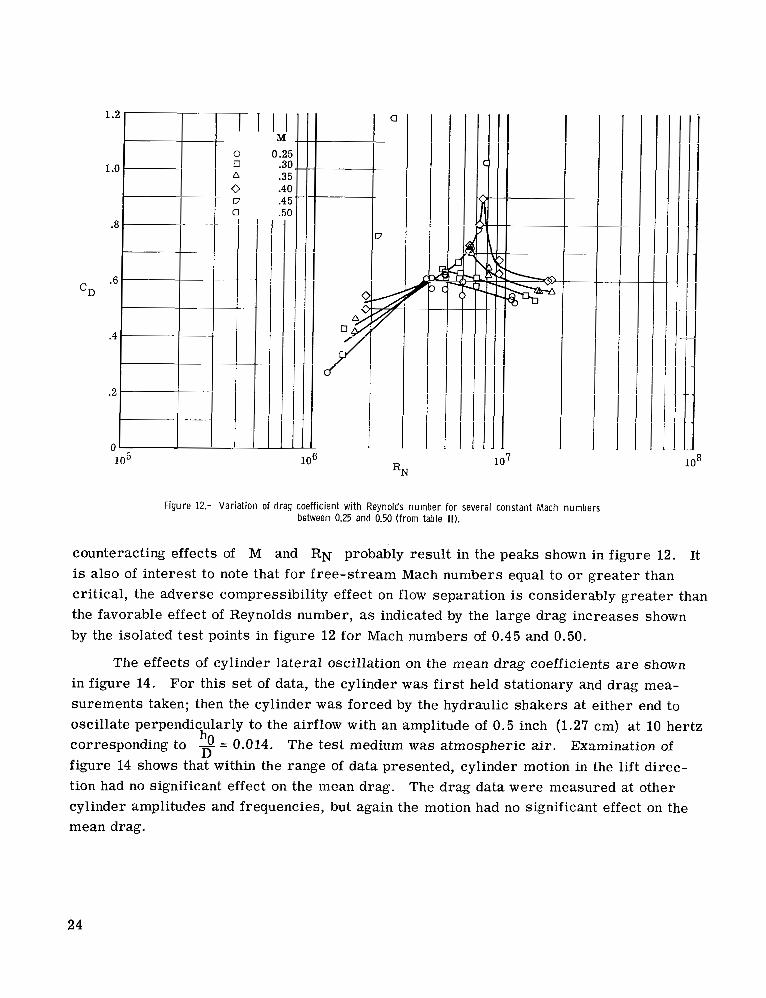
"El 1 .o
.8
.6
.4
.2
0
7 0 Q A
0
-I
cD
I l l M
0.2E .3c .3E .4c .4 E .5c
E <
d Y
a
RN
I I
I 1 T I
I I I / I I I / I I
I 1 I
Figure 12.- Variation of drag coefficient with Reynolds number for several constant Mach numbers between 0.25 and 0.50 (from table 11).
counteracting effects of M and RN probably result in the peaks shown in figure 12. It is also of interest to note that for f ree-s t ream Mach numbers equal to or greater than critical, the adverse compressibility effect on flow separation is considerably greater than the favorable effect of Reynolds number, as indicated by the large drag increases shown by the isolated tes t points in figure 12 for Mach numbers of 0.45 and 0.50.
The effects of cylinder lateral oscillation on the mean drag coefficients are shown in figure 14. For this set of data, the cylinder was f i r s t held stationary and drag mea- surements taken; then the cylinder was forced by the hydraulic shakers at either end to oscillate perpendicularly to the airflow with an amplitude of 0.5 inch (1.27 cm) a t 10 hertz corresponding to 0 = 0.014. figure 14 shows that within the range of data presented, cylinder motion in the lift direc- tion had no significant effect on the mean drag. cylinder amplitudes and frequencies, but again the motion had no significant effect on the mean drag.
h n The tes t medium was atmospheric air. Examination of
The drag data were measured at other
24

1 .o
.8
.6
cD
.4
.2
5 0
I 0
.O : 6 .O 7 .o 8.0 X lo6
CD
1 .o
I .05
RN = 7.5 x lo6 *I, .5 0 L - .2 j, M .3 .4
(a) Drag increase due to Mach number.
Figure 13.-
0
0
I .10
L- 20 x lo6
RN 0 7 8 910
(b) Drag decrease due to Reynolds number.
Peak i n drag coefficient expressed as combined effect of Mach number and Reynolds number.
~
E
l 3 .o
I .15
8
4 .O RN
0
0
Stationary cylinder 4 - = 0.014 at 10 Hz
I I I I I J .20 .25 .30 .35 .40 .45
M
Figure 14.- Effects of cylinder lateral oscillation on mean drag coefficient.
25

Characterist ics of Unsteady Lift Measured on Stationary Cylinder
The resul ts discussed thus far have been for static-pressure distributions and mean drag forces that were handled in a conventional manner. In the rest of the paper, the resul ts presented are for the unsteady lift forces.
The time history of unsteady lift acting on a stationary cylinder in a flow may be completely random, periodic, or some mixture of random and periodic. In order to select appropriate characterist ics to describe the unsteady lift in this presentation, it was first necessary to determine the nature of the unsteady-lift t ime history. A system of classi- fying o r categorizing the unsteady lift was devised and was based on examination of sev- eral different characterist ics of the variation of lift with time. In the subsequent section, this classification system is discussed in connection with a description of the frequency content of the unsteady lift. Then the magnitude of the unsteady lift on the stationary cylinder is described.
Frequency content of unsteady lift.- In this paper, the frequency content of the unsteady lift force is described in two ways. the frequency content is in te rms of the nondimensional aerodynamic Strouhal number
The more conventional way of expressing
S = -, f SD where f s is the vortex-shedding frequency of the cylinder. This frequency is V
determined from the frequency of the autocorrelation function of the time-history data samples of the unsteady lift force. The other method of describing the frequency content of the unsteady lift force is in t e rms of a Strouhal bandwidth. If the vortex-shedding fre- quency is defined to be the frequency of the main peak in a power-spectral-density plot obtained from a data sample of the unsteady lift force, the frequency interval between the half-power points of this spectrum peak is defined as the Strouhal bandwidth. Another indication of the periodicity of unsteady lift force was given by studying plots of the ampli- tude probability density distribution of the unsteady-lift-force data samples. tion of the time histories, power spectral densities, autocorrelation functions, and proba- bility density functions of the data samples of the unsteady lift force led to the conclusion that the unsteady lift forces on the cylinder could be grouped into three regimes. These regimes are termed wide-band random, narrow-band random, and quasi-periodic. The classification of the unsteady lift force into these regimes may be determined from the autocorrelation function according to the following criteria:
Examina-
(1) Wide-band random - Autocorrelation function has no more than one peak, other than the T = 0 peak.
(2) Narrow-band random - Autocorrelation function has two or more consecutive peaks, and the percentage decrement between peaks is greater than 10 percent.
(3) Quasi-periodic - Over the range of time lags analyzed, the decrement in con- secutive peaks in the autocorrelation function is less than 10 percent.
26

A typical data sample from each of these regimes is presented in figure 15 in the form of the t ime history, the power spectral density, the autocorrelation function, and the amplitude probability density distribution.
lows: At the lower Reynolds numbers between approximately 1.1 X lo6 and 3.5 X 10⁶, the unsteady lift forces are predominantly wide-band random. In t e rms of previous investi- gations (for example, refs. 2, 5, and 8), the wide-band forces occur in the "supercritical" Reynolds number range. At Reynolds number above approximately 6 X 10⁶, the unsteady lift forces are quasi-periodic. At intermediate Reynolds numbers, that is, between approximately 3.5 X 10⁶ and 6 x 10⁶, the t e rm narrow-band random is used to denote the intermediate regime between wide-band random and quasi-periodic. The quasi-periodic lift forces occur in the "transcritical" Reynolds number range of reference 5.
The correspondence between the various regimes and Reynolds number is as fol-
In order to illustrate the variations of Strouhal bandwidth with Reynolds number,
For Mach numbers up to about 0.4, the Strouhal bandwidth variation At Reynolds numbers up to about 3.5 X lo6 , the
figure 16 presents the half-power Strouhal bandwidth of the unsteady l i f t fo r three ranges of Mach number. with Reynolds numbers is as follows: Strouhal bandwidth is large; as Reynolds number increases from 3.5 x lo6 to about
6 6 X 10⁶, the Strouhal bandwidth narrows rapidly; and, at Reynolds numbers above 6 X 10 , the Strouhal bandwidth is small. Also shown in figure 16 is a large Mach number effect on the Strouhal bandwidth at Reynolds numbers of about 2 X lo6. decrease occurs in bandwidth as Mach number is increased from 0.399 to 0.416. labeled test points.) bandwidth is noted as Mach number is increased.
A large, very rapid (See
Also, at Reynolds numbers above about 6 X lo6, a slight decrease in
Previous investigators have presented frequency characterist ics in t e rms of a single Strouhal number rather than a Strouhal bandwidth. For purposes of comparison, the data are presented in t e rms of the variation of aerodynamic Strouhal number with Reynolds number. Since the Strouhal number is affected by both Mach number and Reynolds number and the values were obtained from tests in different densities and tes t mediums, the data were cross-plotted in the same manner as the steady drag (fig. 9) in order to separate Reynolds number and Mach number effects. Figure 17 and table I11 give the resultant cross-plotted data of Strouhal number as a function of Reynolds number at selected Mach numbers. Also presented in figure 17 are Strouhal number data obtained by other inves- t igators (refs. 5, 9, and 10) at M < 0.3. The data of the present investigation agree with other investigations and in particular with those of Roshko (ref. 5) in the Reynolds number range from 3.7 X lo6 to 8.4 X lo6. definite vortex-shedding frequency could be detected, as indicated by the shaded areas. At hitherto unexplored Reynolds numbers f rom 8 x lo6 to 17 X lo6, the Strouhal number is approximately constant at a value of about 0.3. In the Reynolds number range from about 0 .5 X lo6 to 3 X 10⁶, the data exhibited no distinct frequency and all the investigators
This agreement occurs within the regions where a
27

Example
Time history
Power spectral iensity
uto- r r e l a t io r
?obability snsity
.
Wide-band random
(1.1 X lo6 < RN < 3.5 X 10 ) 6
f , Hz
1 L
__ -.
Narrow-band random
(3.5 x lo6 < RN < 6.0 X 10")
% = 5.17 X 10 6 - - ~ _ _ .
M = 0.116
~- ..
.OF
.04
2 0 3
;I V 3 .02
- .01
\111 0 .2 fD.4 1.4 1.6
L f l , \ L ; I I 0 2.5 5 7.5 27.5 30
f , Hz _ _ _ _
1.28 sec T - L
1
_ _ - Quasi-periodic
(RN > 6.0 X lo6)
6 RN = 18.2 X 10
M = 0.41
_ _ _ ._ ~-
- _. -- - .
FL(t)
1 .0- -
.8 - -
Yp A - > - ;I
8 .4 u -
- .2 - -
0 5 10 15 20 f , Hz
b O . 1 6 sec 4 T-
A 0
Figure 15.- Characteristic functions of unsteady lift force on stationary cylinder as presented for each classification regime.
28

AS
.30 I
.25
.20
.15
.10
,Ot
(
lo6
. -
M = 0.
%
%
M = 0.
7
0
,1 I ' I
i )
0 M < 0.3 0 0.3 < M < 0.4 A M > 0.4
Figure 16.- Variation, for three ranges of Mach numbers, of Strouhal bandwidth of unsteady lifl on stationary cylinder with Reynolds number.
29
S
lo6
~...
0- - e P
1 6
n L n . 7 ,- A M = 0.4 investigatic 0 M 5 0.25 Roshko, ref. 5 D M < 0.1 a 0.18 < M < 0.28 Delany and Sorensen,'
'I:-:: Regions of definite vortex-
.. ...,. I 1 I , IL.. shedding frequency 1 l r e f - I lo IIU 1 lo7 3
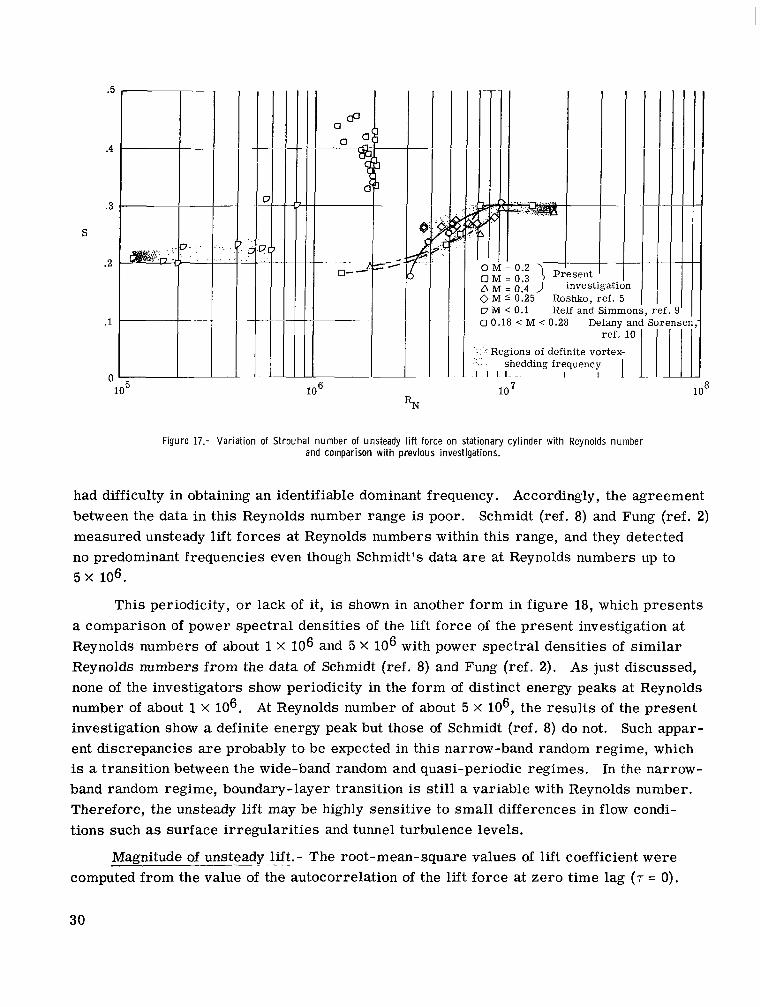
Figure 17.- Variation of Strouhal number of unsteady lift force on stationary cylinder with Reynolds number and comparison with previous investigations.
had difficulty in obtaining an identifiable dominant frequency. Accordingly, the agreement between the data in this Reynolds number range is poor. Schmidt (ref. 8) and Fung (ref. 2) measured unsteady lift forces at Reynolds numbers within this range, and they detected no predominant frequencies even though Schmidt's data are at Reynolds numbers up to 5 x 10⁶.
This periodicity, or lack of it, is shown in another form in figure 18, which presents a comparison of power spectral densities of the lift force of the present investigation at Reynolds numbers of about 1 X 10⁶ and 5 X lo6 with power spectral densities of s imilar Reynolds numbers f rom the data of Schmidt (ref. 8) and Fung (ref. 2). As just discussed, none of the investigators show periodicity in the form of distinct energy peaks at Reynolds number of about 1 x lo6. At Reynolds number of about 5 X lo6, the resul ts of the present investigation show a definite energy peak but those of Schmidt (ref. 8) do not. Such appar- ent discrepancies are probably to be expected in this narrow-band random regime, which is a transition between the wide-band random and quasi-periodic regimes. In the narrow- band random regime, boundary-layer transition is still a variable with Reynolds number. Therefore, the unsteady lift may be highly sensitive to small differences in flow condi- tions such as surface irregularit ies and tunnel turbulence levels.
Magnitude of unsteady lift. - The root-mean-square values of lift coefficient were computed from the value of the autocorrelation of the lift force at zero time lag (T = 0).
30

.12
.10
.08
.06
.04
.oi
(
6 RN = 1.42 X 10 , present study 6 % = 1.39 x 10 , ref. 2 -----
_.-- % = 1.1 x lo6, ref. 8
/i 1 1
4 I I I I I I
- 1
\ I ! - \ I
.08
.06
.04
.02
6 RN = 5.17 X 10 , present study ----- R = 5.0 X lo6, ref. 8 N
I I I '4
1.4 1.6 .2 .4 .6 .a 0 .2 .4 fD V - fD
V -
(a) Power spectral densities at RN =: 1.3 x 10⁶.
Figure 18.- Power spectral density of unstead iifl force measured on stationary cylinder at Reynolds numbers
(b) Power spectral densities at RN =: 5 x 10⁶.
of 1.42 x 10⁶ and 5.17 x 10 f , and comparison with previous investigations.
These autocorrelation values were checked by a time-averaged, mean-square analyzer. Both Mach number and Reynolds number affect the unsteady lift coefficients as was the case for the mean drag and Strouhal number data. Therefore, the same type of cross- plot scheme as used for drag and Strouhal number was used on the unsteady-lift-coefficient data to separate the Mach number and Reynolds number effects. Table IV presents the values of CL,rms(O) f rom which the c ros s plots were made. Figure 19 presents the data determined from the working plots. In this figure, the stationary-cylinder root-mean- square lift coefficients at M I 0.3 and M = 0.4 are presented as functions of Reynolds number. Examination of this figure shows that for the data at M 5 0.3, the unsteady lift appears to be multiple-valued at Reynolds numbers between about 1.4 X lo6 and 8 X lo6. This trend toward scat ter in these regions of Reynolds number was t rue for all tes t mediums and densities for which data were recorded at Mach numbers less than 0.3. Delany and Sorensen (ref. 10) show a s imilar scat ter in drag data which is attributed to changes from a symmetric to an asymmetric flow around the cylinder (see ref. 5).
As previously discussed, the static-pressure-distribution data indicated the exis- tence at lower Reynolds numbers of substantial positive o r negative steady lift coefficient
31

.28
.24
.20
- .16 0 v z h: ;I
.12
.08
.Fung, ref. 2
chmidt, ref. E
l o3 1
tl
I I I
I I l7 8
Figure 19.- Stationary-cylinder root-mean-square lift coefficient at M 2 0.3 and M = 0.4 presented as a function of Reynolds number and compared with previous investigations.
values. laminar flow caused by asymmetric disturbances, such as turbulence wedges occurring on the cylinder. of root-mean-square unsteady lift coefficient. Such conjecture cannot be proven on the basis of present evidence, since oil-flow photographs show only one side of the model. However, it appears to be a reasonable assumption that, in the region of scat ter o r multiple-valued data, the various values of root-mean-square lift coefficients are asso- ciated with variations of symmetry of the flow. Note in figure 19 that the two boundaries merge at about a Reynolds number of 8 X lo6, and the merged boundary gradually decreases in value as Reynolds number is increased. Thus, the multiple data seem to occur at Reynolds numbers corresponding to those for the wide-band and narrow-band regimes and merge to a single-valued boundary in the quasi-periodic regimes of Reynolds
These phenomena were explained in t e rms of a possible asymmetry in the
This same mechanism is thought to be responsible for the double values
number . At a Mach number of 0.4, the root-mean-square lift coefficient has less scatter, and
there is a large Mach number effect at Reynolds numbers f rom 7 X lo6 to 17 x 106 as
32
shown by a rounded peak in the data at a Reynolds number of about 9 X lo6. corresponds roughly to the s imilar peaks in drag data at this Mach number, and may be associated with the same counteracting effects of Mach number and Reynolds number on boundary-layer separation discussed previously.
Also presented for comparison in figure 19 are the unsteady-lift-coefficient values f rom references 2, 7, and 8. These data are presented in the form of broad bands because of scat ter 'in the individual data points. Both sets of comparative data tend to merge into the data of the present investigation. Fung's data (ref. 2) approach the upper par t of the multiple-valued region and Schmidt's data (refs. 7 and 8) merge with the lower par t of this region. Thus, the unsteady lift coefficients obtained on the stationary cylinder a r e consistent with the trends of previous data.
This peak
Measurement of Unsteady Lift Due to Cylinder Motion
As previously described, a positive displacement sinusoidal oscillation in the lift direction was imparted to the model by the hydraulic shakers at the top and bottom of the cylinder. The model was driven at frequencies from 3 to 18.7 hertz and amplitudes up to 3 inches (7.62 cm). instrumented section by using the ICB system, and the data thus obtained were reduced by using techniques described in appendix B.
The forces in the lift direction were measured on the 2.33D-length
The unsteady lift forces on the moving cylinder are described in te rms of some of the same characterist ics used to describe the unsteady lift on the stationary cylinder. A comparison of the power spectral densities of the lift force on the cylinder with and with- out motion is presented first. Next, under an assumption that the unsteady lift due to motion had a sinusoidal component related to the motion of the cylinder, an analysis is made which determines the in-phase and 90' out-of-phase (real and imaginary) components of the unsteady-lift-force vector with respect to displacement at the frequency of motion. Finally, these components are interpreted in t e rms of aerodynamic derivatives. basic reduced data f rom which these analyses are presented are given in table V.
The
Power spectral density and root-mean-square values.- Figure 20 presents the
I power spectral density of the aerodynamic l i f t coefficient for two data points at the same Mach number and Reynolds number. F o r one data sample, the cylinder was held station- ary; whereas, for the other data sample, the cylinder was oscillated at the aerodynamic Strouhal number (S = 0.31) for the stationary cylinder. A large increase in the peak of the spectrum for the oscillating cylinder at fD = 0.31 is readily apparent. The root- mean-square l i f t coefficient increased from 0.076 to 0.130. the existence of a lift due to motion. Of interest in figure 20(b) is the small hump at fD = 0.6, which indicates a small second harmonic content. V
V Thus, this comparison shows
33

... . . . ..... ... .
‘L,rms(h/D) =
- .4 fD .6 .8 v
I I I I I I I I I I I I I I 0 5 10 15 20 25 30 0 5 10 15 20 25 30
f , Hz f , Hz
(b) Cylinder oscillation at h” = 0.0278; fh = 10.5 hertz; D RN = 9.33 X 10⁶; M = 0.20.
(a) No cylinder motion; RN = 9.33 X IO6; M = 0.20.
Figure 20.- Effect of cylinder lateral oscillation on unsteady lift as shown by power spectral densities of unsteady lift measured with and without cylinder motion at same flow conditions.
In order to determine the magnitude of the unsteady lift due to oscillation of the cylinder, the ratio of the unsteady lift fo r the oscillating cylinder to the unsteady lift for the stationary cylinder was evaluated. This ra t io was determined by taking selected values of the root-mean-square lift coefficient for the oscillating cylinder and normalizing them by the root-mean-square lift coefficient for the stationary cylinder at the same flow conditions. The resul ts are plotted in figure 21 as functions of a nondimensional frequency rat io and amplitude of motion. The frequency ratio is the nondimensional forcing fre- quency of cylinder oscillation divided by the Strouhal number for the stationary cylinder (yh). The data selected for figure 2 1 and for subsequent figures have been restr ic ted
to Mach numbers less than 0.3 and Reynolds numbers above 5.5 X 10⁶ where Mach number effects are small and the periodicity of the flow is clearly defined.
34
/ A I I1
A
D 0
~._.
i .0069 // // / / I .0139 I / I
a i i
Figure 21.- Effects of forced cylinder oscillation on wide-band root-mean-square lifl coefficient for oscillating cylinder normalized by lifl coefficient for stationary cylinder.
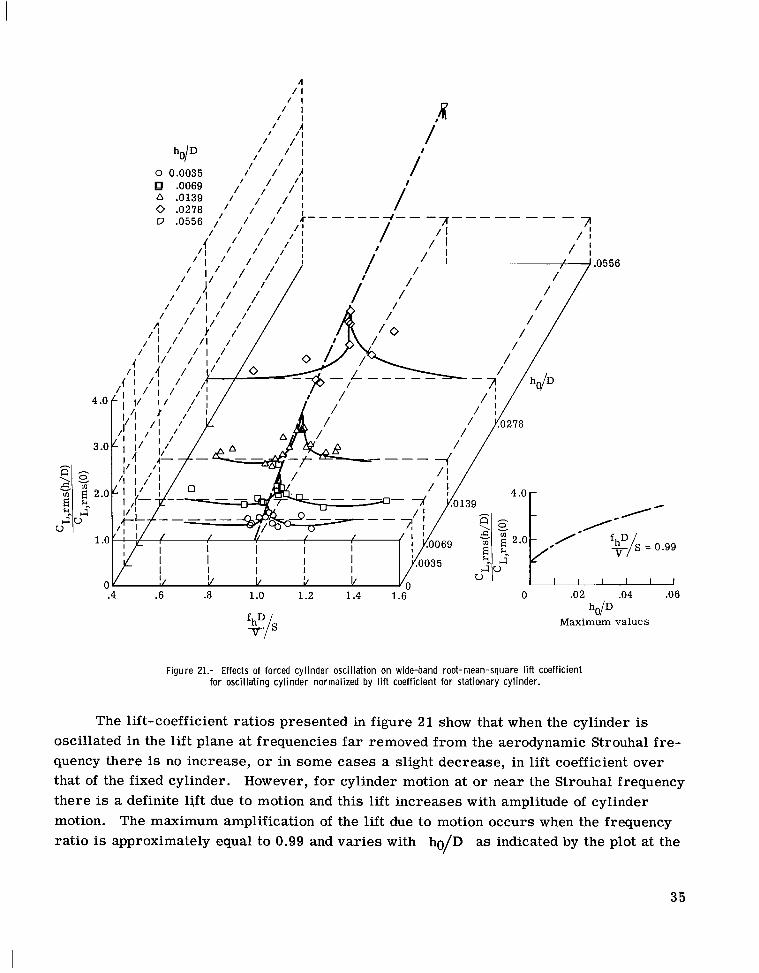
The lift-coefficient ratios presented in figure 2 1 show that when the cylinder is oscillated in the lift plane at frequencies far removed from the aerodynamic Strouhal fre- quency there is no increase, o r in some cases a slight decrease, in l i f t coefficient over that of the fixed cylinder. However, for cylinder motion at or near the Strouhal frequency there is a definite lift due to motion and this lift increases with amplitude of cylinder motion. ratio is approximately equal to 0.99 and var ies with ho/D as indicated by the plot at the
The maximum amplification of the lift due to motion occurs when the frequency
35

lower right-hand side of figure 21. the lift on the oscillating cylinder may increase to values several t imes the lift on the stationary cylinder.
As shown by this variation of lift-coefficient ratio,
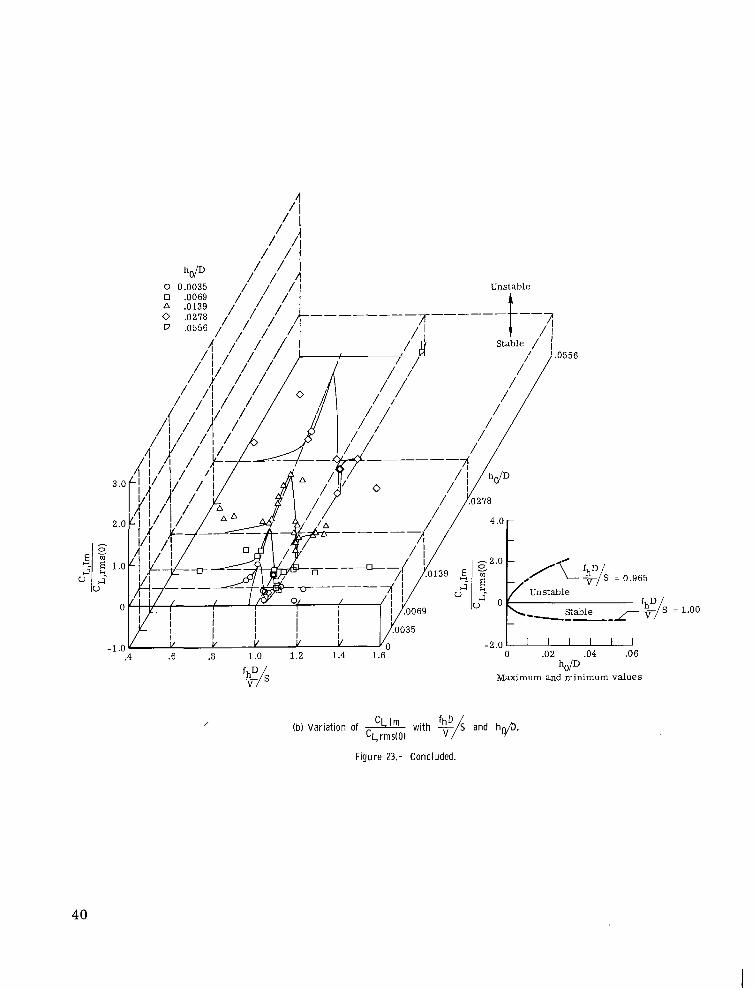
Lift-force vector at frequency of cylinder oscillation.- Examination of data such as those given in figures 20 and 2 1 and of the t ime histories of the lift force on the oscillating cylinder indicates the likelihood of substantial correlation between the aerodynamic forces and cylinder motion. Therefore, an analysis was made which determined the aerodynamic force components that are in phase (real component) and 90° out of phase (imaginary com- ponent) with the oscillatory displacement. These data are presented in figure 22(a) as the vector amplitude of the motion-dependent lift coefficient ( / C L ~ = ICL,Re + iCL,Iml)
and in figure 22(b) as the phase angle 6 = tan- cL71m) between the lift-coefficient vector
and the cylinder displacement. An alternate representation of the same data is presented in figure 23 in t e rms of the real and imaginary vector components. Figures 22 and 23 also show that the unsteady-lift-due-to-motion vector is substantial only when the cylinder oscillates at o r near the aerodynamic Strouhal frequency. This lift increases with increasing amplitude (fig. 22(a)). The phase angle of this lift-force vector (fig. 22(b)) has a large rapid shift as the cylinder frequency approaches and passes through the stationary- cylinder Strouhal frequency. This large phase shift indicates a basic change in the lift force from an unstable to a stable character. the rea l component behaves much as the magnitude of the lift-coefficient vector does. (See fig. 22(a).) This force component, being in phase with displacement, may be thought of as an aerodynamic stiffness parameter. Similarly, the imaginary component (fig. 23(b)), being in phase with the cylinder velocity, may be regarded as an aerodynamic damping parameter. When the cylinder is oscillated at frequencies below the Strouhal frequency, the aerodynamic damping is destabilizing. through the Strouhal frequency, there is an abrupt change to a stabilizing aerodynamic damping force.
( CL,Re
Examination of figure 23(a) indicates that
A s the cylinder frequency passes
Aerodynamic derivatives of lift due to motion.- The real and imaginary components of the lift-force vector were converted to aerodynamic derivatives ha and ka as used by Scruton in reference 4. The basic equation is
Lift pe r unit length = -2S2qh(ha + i2ska)
and the relationships between Scruton's derivatives and the real and imaginary components of the aerodynamic-lift-coefficients of figure 23 a r e
CL, Im -ha = 'L, Re ; - k a =
2S2(h/D) 4nS2(h/D)
CL, Im -ha = 'L, Re ; - k a =
2S2(h/D) 4nS2(h/D) These derivatives are presented in figure 24 as functions of nondimensional frequency rat io and amplitude. Both -ha (fig. 24(a) and -ka (fig. 24(b)) are seen to vary
36

(a) Magnitude of lift-coefficient vector I C L I as a function of - S and hdD.
Figure 22.- Variation of aerodynamic-lift-coefficient vector wi th the frequency of the cylinder oscillation.
fhY V
hdD 0 .0035 0 .0069 A .0139 0 .0278 D .0556
h c p Maximum values
37

h o p 0 .0035 0 .0069 a .0139 0 .0278 D .0556
h d D Minimum values
(b) Variation of phase angle between lift force and displacement wi th
Figure 22.- Concluded.
38

(a) Variation of ___ CL’Re with vh and h@. CL, rms(0)
Figure 23.- Real and imaginary components of lift coefficient at cylinder forcing frequency normalized by wide-band root-mean-square l i f t coefficient on stationary cylinder.
Note: Lift per unit length = (CL,Re + iCi lm)qD.
39
= 1.00
,
Figure 23.- Concluded.
40

-h
h 0 P Maximum values
(a) Variation of -ha with h- S and ho/D. ‘v”/ Figure 24.- Variation of Scruton type aerodynamic derivatives of real and imaginary components of l i f t coefficient
at frequency of cylinder oscillation.
Note: Lift per unit length = -2S2qh(ha + i2nka).
4 1

-k a
(b) Variation of -ka with
Figure 24.- Concluded.
hO/D Maximum and min imum v a l u e s
42

inversely with increasing amplitude of motion (as did Scruton's values at lower Reynolds numbers in ref., 4). Thus, there is seen to be a nonlinear aerodynamic damping t e rm in the motion-generated l i f t force. and is inversely proportional to the amplitude of motion. Reed, in reference 15, points out that for actual s t ructures such as a space vehicle erected on the launch pad, a non- linear aerodynamic damping t e rm can give r i s e to a limit-amplitude sinusoidal oscilla- tion. An oscillation of this type has been observed on aeroelastic, ground-wind-load models of launch vehicles (ref. 16), and on other s t ructures (ref. 4).
This damping t e rm occurs at the Strouhal frequency
CON C LUS IONS
Analysis of the resul ts of a wind-tunnel study of the mean drag and unsteady lift forces on a stationary and oscillating circular cylinder in two-dimensional flow at high Reynolds numbers indicates the following conclusions:
1. The pressure distributions around the stationary cylinder at Reynolds numbers from 0.5 x lo6 to 8 X lo6 follow the trends established by previous investigators. higher (hitherto unexplored) Reynolds numbers from 8 X lo6 to 18 X lo6, there is no sig- nificant change in the pressure distributions.
At
2 . The mean drag coefficient on the stationary cylinder, at Mach numbers equal to or less than about 0.2, follows the trends established by previous investigators at Reynolds numbers f rom 0 . 5 x 10⁶ to 8 X lo6 and reaches a maximum of 0.54 at a Reynolds number of approximately 3 x 10⁶ and decreases slightly to 0.52 at a Reynolds number of 10 x 106.
3. At Reynolds numbers between 4 X lo6 and 8 X 10⁶ and Mach numbers above 0.2, there is a peak in the mean drag coefficient which becomes more pronounced as Mach number is increased from 0 .2 to 0 .4 .
4 . Oscillation of the cylinder in the l if t direction had no significant effect on the mean drag coefficient.
5. The unsteady lift force on the stationary cylinder can be categorized into three regimes dependent upon Reynolds number RN as follows: wide-band random (1.1 X lo6 < RN < 3.5 X 10⁶), narrow-band random (3.5 X 10⁶ < RN < 6.0 X lo6), and quasi-periodic (6.0 X 10⁶ < RN < 18.7 X 10⁶).
trends established by previous investigators at Reynolds numbers f rom about 3 X 10⁶ to 8 X 10⁶. At hitherto unexplored Reynolds numbers from 8 X lo6 to 17 X lo6, the Strouhal number is approximately constant at a value of about 0.3.
6. The Strouhal number of the unsteady lift on the stationary cylinder follows the
43

7. At Mach numbers equal to or less than 0.3, the root-mean-square unsteady lift coefficient on the stationary cylinder var ies over a wide range at Reynolds numbers f rom 1.4 x 10⁶ to 8 x 10⁶; then, the range narrows into a single-valued function which decreases slowly with higher Reynolds numbers. At a Mach number of 0.4, the root-mean-square lift coefficient is a single-valued function of Reynolds number with a rounded peak near a Reynolds number of 9 X lo6. drag data at this Mach number.
This peak corresponds roughly to the s imilar peaks in
8. A lift force due to cylinder oscillation is found to exist. When the cylinder is
This lift increases with increasing amplitude of oscillated at or near the aerodynamic Strouhal frequency for the stationary cylinder, there is a definite lift due to motion. cylinder oscillation building up to values several t imes the lift on the stationary cylinder. When the cylinder is oscillated at frequencies far removed from the aerodynamic Strouhal frequency of the stationary cylinder, there is no significant lift due to motion.
9. The unsteady lift due to motion of the cylinder has a character such that for motion a t frequencies below the aerodynamic Strouhal frequency (vortex-shedding fre- quency of the stationary cylinder), the unsteady lift is an unstable, negative aerodynamic damping force. damping force exhibit a limit-amplitude sinusoidal oscillation. cylinder motion passes through and above the aerodynamic Strouhal frequency of the sta- tionary cylinder, there is an abrupt change in the unsteady lift due to motion to a stable, positive damping force. Aerodynamic derivatives of the components (with respect to dis- placement) of the unsteady lift due to motion decrease nonlinearly with increasing ampli- tude of cylinder motion.
Actual flexible cylindrical s t ructures subjected to a negative aerodynamic As the frequency of
Langley Research Center, National Aeronautics and Space Administration,
Langley Station, Hampton, Va., October 1, 1968, 124-08-04-22-23.
44

APPENDIX A
ESTIMATION O F SOLID-BLOCKAGE INTERFERENCE
For these tests, the center s lots in the floor and ceiling of the tes t section were closed and the ratio of slotted area to solid area in the vicinity of the model was 0.0414. The size of the cylinder model is large in relation to the s ize of the tes t section, the ratio of the model frontal area to the cross-sectional area of the tunnel being 0.193. This ra t io is roughly the same as that for the model of reference 5. obtained in a closed tunnel, and corrections for wind-tunnel wall interference were neces- sary. The data for the present investigation were obtained from a two-dimensional model in a three-dimensional slotted tunnel. interference corrections for this case, it was possible to make an estimate of the solid- blockage interference by using the method of reference 17. was assumed to be two-dimensional with four equally spaced, equal-width slots in each side wall, ra ther than the actual tunnel configuration shown in figure 2. obtained from this estimate were as follows:
The data of reference 5 were
Although no theory exists fo r making wall-
For this estimate, the tunnel
The corrections
Corrected velocity at model = 0.997 x Measured free-s t ream velocity
Corrected mean drag = 1.008 X Measured mean drag
Since these estimated corrections a r e less than 1 percent of the measured quantities and since no acceptable theory exists for correcting the unsteady lift on the stationary o r oscillating cylinder, no wall-interference corrections have been made to the data of this investigation.
4 5

APPENDIX B
Acce le ra t ion s igna l
DETAILS OF INSTRUMENTATION AND DATA-REDUCTION PROCEDURES
Gain con t ro l
Instrumentation
The Inertia Compensated Balance (ICB) system, as utilized in this study, uses the signals f rom strain-gage force transducers and from an accelerometer located a t the center of the 2.33D-length instrumented section. The summed output of the strain-gage transducers in the lift direction measures both the unsteady aerodynamic forces and the inertia forces induced by model vibration o r oscillation. As discussed in reference 18, by subtracting a properly adjusted acceleration signal f rom the combined force trans- ducer signal, the model inertia loads sensed by the force transducers are compensated so that the unsteady aerodynamic forces can be measured directly. For the cylinder oscillation frequencies of this tes t (3 to 18.7 hertz), the instrumented cylinder section was effectively rigid so that the model inertia forces were considered to be caused by rigid-body motion only. A circuit schematic diagram of a typical ICB measurement sys- tem is shown in figure 25. In addition to the unsteady lift force, the mean drag force on the 2.33D instrumented section was measured by using force transducers oriented in the drag direction and located a t the top and bottom of the instrumented cylinder section.
A typical instrumentation block diagram for measuring unsteady lift and steady drag forces and lateral accelerations on the 2.33D cylinder section is presented in figure 26. As shown, the excitation and amplification of the transducers were accomplished by a ca r r i e r amplifier system. Amplitude and phase adjusting networks conditioned the sig- nals at the output of the c a r r i e r amplifier. The conditioned signals were then appropri- ately summed in operational amplifiers to produce signals in which inertia components have been effectively eliminated. Significant cross-axis signals were also removed in this summation process.
I F o r c e Gain P h a s e 1 signal con t ro l cnrre
I
output P h a s e i n v e r t e r s ignal
compensa ted ampl i f i e r
I I
Figure 25.- Circui t schematic diagram of a typical ICB measurement system.
46

APPENDIX B
The total and inertia-compensated force signals were amplified and fed to a num- ber of recording and computing devices, including a tape recorder, an oscillograph, a digital mean-square recorder, and "on-line" analysis equipment. (Another recorder handled the measured steady-state values of drag forces pr ior to reaching the carrier amplifier.) Displacement signals originating in the hydraulic shaker system were also inserted into the recorder and analysis equipment. Signals presented to the mean-square recorder and to the "on-line" analysis equipment were filtered to block the direct-current component and, in addition, were low-pass filtered to remove local model resonance sig- nals above 80 hertz at the mean-square recorder and above 40 hertz at the "on-line" analysis equipment.
Autocorrelation analysis was performed "on-line" by using a hybrid analog-digital computer (ref. 19). nature of the force signal. such as the predominant frequency of the unsteady aerodynamic forces.
This analysis gave a quantitative indication of the random o r periodic These autocorrelations also gave quantitative information
No attempt was made to measure local-dynamic-pressure fluctuations; however, average-static-pressure distributions were measured during the initial phase of the tes t program. A ring of 48 static-pressure orifices was installed at one longitudinal station on the model 1.14 diameters f rom the lower end of the model (test-section floor). The orifices were constructed of monel tubing with an inside diameter of 0.02 inch (0.508 mm) with one end inserted into a plug and flush mounted from the inside of the model to the outside skin. Flexible tubing led from the back of each orifice plug to a multiple-tube manometer board. readings of the 48 static-pressure measurements.
The manometer board was photographed to obtain simultaneous
Data-Reduction Procedures
A data-reduction block diagram is presented in figure 27, which shows schematically the types of analyses made of the measured experimental data as recorded on magnetic tape. The analyses shown in the blocks are discussed in the following subsections in t e rms of the equipment used, the analysis parameters , and the relative accuracy of the reduced data.
Mean square.- ~ The f i r s t s tep in the data analysis was to determine the mean-square value of aerodynamic lift as a function of time by arranging analog equipment to simulate the following equation:
- 2 FL (t) = 1'" F?(t)dt
2T t-T
The functional diagram for the mean-square analysis is shown in figure 28. The low-pass fi l ter , which was used to reduce a 60-hertz noise f rom the signal, was se t at a 40 hertz

APPENDIX B
*
I 1
Low-pass f i l t e r
I
I I Loop-recorder r e p r o d u c e r
Autocorre la t ion dens i ty a n a l y s i s ana lys i s
Probabi l i ty - 2 -- _:I
h i s to ry
Figure 27.- Data-reduction block diagram.
F r o m taoe
R e c o r d e r
Figure 28.- Functional diagram for mean-square analysis.
cut-off frequency ( -3 decibels at 40 hertz, and above 40 hertz the fi l ter cut-off ra te was 24 decibels per octave). and sent through the mean-square circuit of a true-mean-square meter. square output of the meter was then put through an averaging circuit consisting of another operational amplifier that had a t ime constant of 2.5 seconds. This continuous mean- square value was recorded on a s t r ip chart during the time-history sample period and was once more averaged manually to give a single mean-square value whose square root was taken as the root-mean-square value for the data sample. The accuracy of the anal- ysis equipment used for the mean-square value is within 512 percent of the measured value.
The filtered signal was amplified with an operational amplifier The mean-
Power spectral density.- After a review of the mean-square results, tape records of selected data samples were chosen for power-spectral-density analysis. The power spectra were obtained f rom analog analysis equipment. The functional diagram for the
49

APPENDIX B
power-spectral-density analyzer is presented in figure 29. Important real-t ime param- eters for the power-spectral-density analysis were as follows:
Sample length . . . . . . . . . . . . . . . . . . . . . . . . . . . . . . . . . . . 120 sec Filter bandwidth . . . . . . . . . . . . . . . . . . . . . . . . . . . . . . . . . 0.41 Hz Statistical degrees of freedom . . . . . . . . . . . . . . . . . . . . . . . . . . 98.2 Time constant of averaging c i rcu i t . . . . . . . . . . . . . . . . . . . . . . . . 128 sec Sweep rate. . . . . . . . . . . . . . . . . . . . . . . . . . . . . . . . . . 0.025 Hz/sec
All the data samples selected for analyses were re-recorded at a tape speed of 7 8
1- in./sec (4.76 cm/sec). The analyses were performed a t 32 t imes the recorded speed, and a correction factor for the frequency multiplication and bandwidth division was incorporated. erally within *12 percent in all the tes t samples where the data bandwidth was grea te r than four t imes the fi l ter bandwidth of the analyzer. analyses were accurate within 0.3 hertz.
The accuracy of the power-spectral-density analysis equipment was gen-
The indicated frequencies of the
Averaging Var iab le
r e c t i f i e r c i r c u i t I I
r-5 Osc i l l a to r Y-axis I
I I
p lo t t e r Frequency-
to-voltage conver t e r u X-axis
Figure 29.- Functional diagram for power-spectral-density analyzer.
Autocorrelation and probability density.- The nature of the force signal was inves- tigated further by determining the autocorrelation functions and probability densities of the unsteady lift force from the time-history data samples. These functions were com- puted with the use of the hybrid analog-digital computer.
The autocorrelation analysis performed in the analog-digital computer approxi- mates the following mathematical expression (ref. 20, p. 19) for the autocorrelation function:
T R(r) E lim $lo FL(t) FL(t + r)dt
T-o3
The approximation is in the form of a summation process where T does not approach infinity but is sufficiently large to enable the quantity under the integral sign, as
50

APPENDIX B
displayed graphically on an oscilloscope, to be almost constant, that is, asymptotically approaches a final value. This operation was either performed "on-line" while the time- history data sample was being obtained or after the test f rom tape records of the time- history data sample of the unsteady lift force FL.
The same analog-digital computer with an additional attachment was used to calcu- late the probability density function of the unsteady lift force from tape records of the time-history data samples. The mathematical expression approximated by the computer is given by the following equation (ref. 20, p. 15):
The computer output is displayed on an oscilloscope as ~ ( F L ) plotted against the instantaneous value of FL.
The instrumentation arrangement for these analyses was to play the lift-force sig- nal at real t ime through a low-pass filter (40 hertz) and through amplifiers into the hybrid analog-digital computer. probability-density analysis and the output of the computer was fed to an x-y plotter which graphed the function. functions was within *12 percent of the measured value.
The computer performed either the autocorrelation or
The basic accuracy of the equipment used to obtain these
~~~ Analysis of motion-dependent aerodynamic forces.- In order to gain insight into the basic nature of the unsteady lift due to motion, an analog analysis was made which resolved the unsteady lift force into i t s fundamental components in phase and 90° out of phase with displacement. With motion of the cylinder given by h(t) = ho cos wt, these components are
T F L , ~ e ( ~ ) = $ lo FL(t)cos w t dt
FL,Im(w) = $ loT FL(t)sin w t dt
where w is the frequency of the cylinder oscillation in radians per second. The func- tional diagram of the analog analyzer is shown in figure 30. displacement t ime histories were played from tape through matched amplifiers and matched fixed-band-pass filters (0.02 to 40 hertz). a tracking oscillator which automatically tracked the displacement frequency w and generated output signals proportional to s in wt and cos wt. The real and imaginary lift-force signals were then multiplied by the cos w t and s in w t signals, respectively, and these products were integrated along the length of the data sample (T = 100 seconds,
As shown, the lift force and
The displacement signal was sent to
51

APPENDIX B
C
Integrator e
Figure 30.- Functional diagram for analog resolution of lift force at frequency w into real and imaginary components with respect to displacement.
real time). Thus, any higher harmonic or random components of lift force not at the fundamental frequency of motion of the cylinder would be eliminated from the output by this averaging process. The resulting signals were proportional to the components of lift force that are in phase (real component) and 90° out of phase (imaginary component) with the sinusoidal cylinder motion.
52

REFERENCES
1. Goldman, R. L.: Karman Vortex Forces on the Vanguard Rocket. Shock Vib. Bull., No. 26, Pt. 11, U.S. Dep. Def., Dec. 1958, pp. 171-179.
2. Fung, Y. C.: Fluctuating Lift and Drag Acting on a Cylinder in a Flow at Super- critical Reynolds Numbers. J. Aerosp. Sci., vol. 27, no. 11, Nov. 1960, pp. 801-814.
3. Humphreys, John S.: On a Circular Cylinder in a Steady Wind at Transition Reynolds Numbers. J. Fluid Mech., vol. 9, pt. 4, Dec. 1960, pp. 603-612.
4. Scruton, C.: On the Wind-Excited Oscillations of Stacks, Towers and Masts. Paper 16, Brit . Nat. Phys. Lab., [June 19633.
* 5. Roshko, Anatol: Experiments on the Flow Past a Circular Cylinder at Very High
Reynolds Number. J. Fluid Mech., vol. 10, pt. 3, May 1961, pp. 345-356.
6. Muttray, H.: Die experimentellen Tatsachen des Widerstandes ohne Auftrieb. Handb. Experimentalphys., Bd. IV, 2. Teil, Akad. Verlagsgesellschaft M.B.H. (Leipzig), 1932, p. 316.
7. Schmidt, L. V.: Measurements of Fluctuating Air Loads on a Circular Cylinder. J. Aircraft, vol. 2, no. 1, Jan.-Feb. 1965, pp. 49-55.
8. Schmidt, Louis V.: Fluctuating Force Measurements Upon a Circular Cylinder at Reynolds Numbers up to 5 X lo6. Wind Load Problems in Relation to Launch Vehicles (Langley Research Center), June 7-8, 1966.
NASA paper presented at Meeting on Ground
9. Relf, E. F.; and Simmons, L. F. G.: The Frequency of the Eddies Generated by the Motion of Circular Cylinders Through a Fluid. R. & M. No. 917, Brit . A.R.C., 1924.
10. Delany, Noel K.; and Sorensen, Norman E.: Low-Speed Drag of Cylinders of Various Shapes. NACA T N 3038, 1953.
11. Bishop, R. E. D.; and Hassan, A. Y.: The Lift and Drag Forces on a Circular Cylinder Oscillating in a Flowing Fluid. Proc. Roy. SOC. (London), ser. A, vol. 277, no. 1368, Jan. 7, 1964, pp. 51-75.
12. Loving, Donald L.; and Katzoff, S.: The Fluorescent-Oil Film Method and Other Techniques fo r Boundary-Layer Flow Visualization. NASA MEMO 3-17-59L, 1959.
13. Morkovin, M. V.: Flow Around Circular Cylinder - A Kaleidoscope of Challenging Symposium on Fully Separated Flows, Arthur G. Hansen, ed., Fluid Phenomena.
h e r . SOC. Mech. Eng., May 18-20, 1964, pp. 102-118.
14. Schlichting, Hermann (J. Kestin, trans.): Boundary Layer Theory. Fourth ed., McGraw-Hill Book Co., Inc., c.1960.
53

15. Reed, Wilmer H., III: Models fo r Obtaining Effects of Ground Winds on Space Vehicles Erected on the Launch Pad. The Role of Simulation in Space Technology. Eng. Ext. Ser. Circ. No. 4, Pt. C, Virginia Polytech. Inst., Aug. 1964.
16. Jones, George W., Jr.; and Fa rmer , Moses G.: Wind-Tunnel Studies of Ground-Wind Loads on Saturn Launch Vehicles. J. Spacecraft Rockets, vol. 4, no. 2, Feb. 1967, pp. 219-223.
17. Davis, Don D., Jr.; and Moore, Dewey: Analytical Study of Blockage- and Lift- Interference Corrections for Slotted Tunnels Obtained by the Substitution of an Equivalent Homogeneous Boundary for the Discrete Slots. 1953.
NACA RM L53E07b,
18. Stahle, C. V.; Stouffer, C. G.; and Silver, W.: A Simplified Inertia-Compensated Balance Technique for Wind Tunnel Measurement of Launch Vehicle Random Buffet Excitation. Technology, RTD-TDR-63-4197, Pt. 11, U.S. Air Force, Mar. 1964, pp. 35-62.
Proceedings of Symposium on Aeroelastic & Dynamic Modeling
19. Saper, Louis M.: On-Line Auto- and Cross-Correlator Realized With Hybrid Com- puter Techniques. IEEE Int. Conv. Rec., vol. 11, pt. 9, 1963, pp. 120-130.
20. Bendat, Julius S.; and Piersol, Allan G.: Measurement and Analysis of Random Data. John Wiley & Sons, Inc., c.1966.
54

TABLE I.- MEAN DRAG COEFFICIENT FOR STATIONARY CYLINDER
(a) 2.33D instrumented cylinder section; gaps sealed
1
.493
.567
.584 ,615 .634 .631 ,635 . I O 2 ,743 .671 ,500 .545 .556 .547 .552 .582 .632 .632 .643 ,655 ,680 .I46 ,795 .84G .a10 .384 ,521 ,561 ,603 ,636 ,676 ,725 .812 ,661 .567 ,518 .538 ,526 .542 .531 .558 .553 .547 .558 .571
Air,
+eon,
M
.120
.167
.204
.236
.264
.289
.313
.342
.368
.330 ,119 ,167 ,187 ,204 ,236 .265 ,296 ,308 .323 ,333 ,344 ,369 ,377 .386 .388 .086 .146 .187 .221 ,250 .301 .3 53 ,404 ,099 .130 .158 .183 .208 .236 .257 .275 ,288 .305 .329 .353
1 atm
7 1 atrr
RN
2.38 X lo6 3.30 4.03 4.65 5.17 5.66 6.08 6.60 7.05 6.24 2.33 3.27 3.66 3.99 4.62 5.15 5.72 5.94 6.22 6.38 6.55 6.98 7.12 7.25 7.25 1.74 2.92 3.69 4.31 4.86 5.75 6.52 7.33 4.38 5.75 6.97 8.04 9.11 .0.33 .1.22 .1.95 .2.44 .3.16 .4.12 .5.10
!
CD
.576
.583
.573
.620
.617
.616
.466
.463
.511
.529 ,534 .545 .585 ,627 .541 .53 1 .550 ,556 .556 .580 .628 .577 .597 .604 .G20 .521 .596 ,566 .598 .622 .613 ,632 .676 ,688 .IO4 .474 .490 .541 .565 .583 .648 .651 .693 .590 .597
M
.356
.366
.384 ,400 .416 ,418 .099 .139 .167 ,212 .276 .334 ,382 ,418 .116 ,235 ,306 ,3 50 .3 50 .364 .416 ,229 ,186 .192 .131 .138 .184 ,237 ,259 ,290 ,316 ,330 ,374 .385 .390 .135 .185 .236 .274 .303 .363 .385 .410 .162 .218
RN
5.21 X lo6 5.62 6.26 6.88 7.51 7.57 4.57 6.40 7.67 9.64 2.42 4.86 6.84 8.27 5.12 0.25 3.17 4.96 4.96 5.47 7.55 0.82 8.84 9.11 6.27 3.25 4.47 5.72 6.22 6.93 7.49 7.82 8.77 9.00 9.10 3.38 4.61 5.66 6.54 7.18 8.49 8.95 9.47 3.92 5.26
res t medium md pressure
Freon, 1 atm
?reon /2 atr
CD
1.509 .537 .532 ,525 ,530 .557 .573 .594 .622 .636 .654 .676 .692 .694 .IO0 . IO7 ,781 .027 .588 ,601 .647 .631 .689 .577 .591 . I O 0 .157 ,208 ,228 .277 .318 .363 .402 .495 .535 .543 .509 .422 .642 .I18 ..266 ..545 ..856
M
.175
.163 ,164 .171 ,219 .231 .253 .282 .291 .318 .335 ,350 ,369 .379 .383 .400 .453 .500 .187 .248 .316 .315 .382 .184 .246 .312 .120 .173 .217 .257 ,284 .320 ,344 .371 .386 .421 .401 .288 .413 .457 .510 .553 ,603
RN
2.95 x 10f 2.75 2.77 2.89 3.67 3.87 1.22 1.69 1.84 5.26 5.54 5.75 6.04 6.19 5.25 5.38 7.14 7.78 3.10 1.10 5.19 5.20 6.21 2.90 3.82 1.81 .59 .84
1.05 1.24 1.36 1.53 1.63 1.75 1.82 1.96 1.90 1.41 2.08 2.29 2.59 2.77 3.02
55

TABLE I.- MEAN DRAG COEFFICIENT FOR STATIONARY CYLINDER - Concluded
(b) 2.33D instrumented cylinder section; gaps open
CD
0.489 .553 .579 .645 .654 .IO4 .637 .623 ,638 .673 .593 .625 .694 .a02 ,715 .628 .617 .632 .647 ,606 .I29 .I31 .626 .678 ,727 .I47 ,687 .626 .553 .557 .549 ,570 .573 .612 .633
- M
0.054 .OB8 .135 .178 .226 .291 .183 .212 .152 .273 .181 .229 .288 ,389 .067 .158 .208 .260 ,329 .132 .3 56 .3 19 .206 .293 .344 .469 .411 ,117 .154 .421 .206 .264 .309 .370 .397
__ RN
1.08 x 10⁶ 1.77 2.68 '
3.49 4.35 5.51 3.58 4.12 2.96 5.27 3.54 4.41 5.44 7.06
.66 1.54 2.03 2.54 3.23 1.31 3.54 3.18
.36
.52
.60
.80
.73 5.44 7.17
18.70 9.58
12.15 14.08 16.66 17.82
Test medium and pressure
Air, 1 atm
Air, 1/2 atm
Air, 1/10 atm
Freon, 1 atm
(c) Integrated pressure distribution; gaps open
'd
0.518 .537 .559 .583 .650 .605 .576 .598 .627 .5 59 ,584 .563 ,542 ,539 ,590 ,594 .541 .602 .644 .594 ,570 .623 .648 .683 .688 .532 .536 .584 ,543
-
__-- .509 .522 .566 ,593
~
C l
-0.020 .021
-.126
__
-.257 -.083 -.016 -.097 -.040 .005 .026
-.062 ,003 .lo6 ,074 ,051
-.159 .183
-.191 -.171 -.184
.064
.064 ,111 .062 .092
-.004 ,000
-.013 -.003
- _ _ - _ -.011 -.006 - .006 - .008
..
M
0.054 .OB8 .135 .178 .226 .351 ,183 ,212 ,278 .152 .273 ,067 .158 .208 ,260 ,329 .132 .354 .390 .319 .206 .293 .344 .469 .411 .177 ,309 .117 .154 ,421 .206 .264 .370 .397
- .
RN
1.08 x 10⁶ 1.77 2.68 3.49 4.35 6.51 3.58 4.12 5.33 2.96 5.27
.66 1.54 2.03 2.54 3.23 1.31 3.55 3.90 3.18
.36
.52 ,60 .80 .73
8.27 . 4.08 5.44 7.17 8.70 9.58 2.15 6.66 7.82
.. ~
56

TABLE II.- CD AND RN VALUES AT CONSTANT MACH NUMBER
FOR 2.33D INSTRUMENTED CYLINDER WITH GAPS SEALED
[From cross plots of da t a of table I(au
Air , 1 a tm Freon , 1 a t m 1 2
Freon, - a t m 1 10 Freon, - a t m Freon , 1 atm
M
0.10
0.15
0.20
0.25
0.30
0.35
0.40
0.4E
0.5a
0.5E
0.6C
RN CD
0.452 .472 .420
0.543 .534 .527
0.591 .540 .589
0.621 .57c . m a
0.632 .611 .66E
0.722 .7OC .725
---- 0.9OC
.80:
---- ---- ---- ----
CD
1.538 .494 ---- 1.535 .499 .540
1.535 .505 .540
1.540 .524 .546
1.550 .535 .553
1.570 .563 .573
3.608 .608 .608
---- ----
---- ----
CD CD RN RN
1.97 X l o6 1.95 2.00
1.96 X l o 6 1.93 1.97
3.95 x 10⁶ 3.91 3.95
4.92 X 10⁶ 4.87 4.86
5.84 X 10⁶ 5.80 5.70
6.74 X l o 6 6.66 6.48
- - - - - - - - - 7.47 x 10⁶ 7.27
--------- ------- -- - - - - - - - - - ---------
RN
4.45x 10⁶ 4.65
. - - - - - - - - -
6.60 X 10⁶ 6.88 6.55
8.76 X 10⁶ 9.09 8.73
10.92 X l o6 11.30 10.87
12.97 X l o 6 13.47 12.93
14.96 X 10⁶ 15.54 14.92
16.88 X 10⁶ 17.54 16.91
--------- - - - - - - - - - - - - - - - - - - - - -
- ------- ---
3.520 ---- ---- 3.540
.590
.587
0.575 .610 .609
0.619 .634 .641
0.671 .67C
----
0.73C .711 ---- 0.781
1.02E
---- ----
~-
1.338 .431 ----
1.42C .464
----
1.549 .50C ----
1.88 X l o 6 1.87 ----------
2.27 X l o 6 2.53 X l o 6
3.764
1.184
1.53C .
2.78 X l o 6 3.00 X l o6 1.81E
\
57
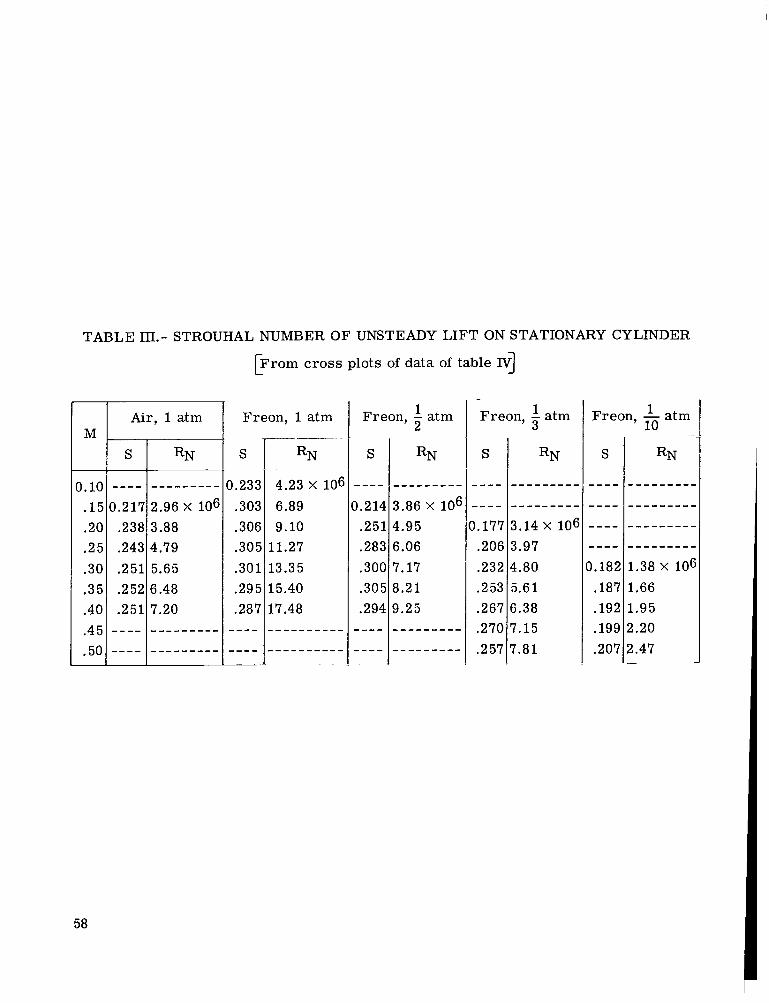
TABLE 111.- STROUHAL NUMBER OF UNSTEADY LIFT ON STATIONARY CYLINDER
M
1.10 .15 .20 .25 .30 .35 .40 .45 50
[From cross plots of data of table 4
S
---- 0.215
.23E
.243
.253
.252 ,251
---- _ _ _ _
1 Air, 1 atm
RN
Freon, 1 atm
S
0.233 .303 .306 .30E .301 .29E .287
---- ----
1 2
Freon, - atm Freon, - 1 atm 3
---- --------- 1.177 3.14 X 10⁶ .206 3.97 .232 4.80 .253 5.61 .267 6.38 .270 7.15 .257 7.81
10
58

TABLE IV.- ROOT-MEAN-SQUARE LIFT COEFFICIENT ON STATIONARY CYLINDER
I
RN
1.73 X 10⁶ 2.91 3.69 4.31 4.55 5.75 6.54 7.23 3.30 4.74 5.76 5.61 6.51 7.20 8.49 8.94
9.48 4.48
9.45
6.36 7.66 9.63
12.42 14.93 16.82 18.20
11.88
16.82
6.38
9.33
15.76
7.61
7.11 -
M
1.086 ,147 .187 .221 .251 .303 .353 .404 .130
.227
.234
.273
.304
.363
. l a 5
.3a5
.4oa
.410
.097
.137
.166
.211
.270
.330
.3ao
.410
.zoo
.262
.350
.160
.400
.450
.3ao
’t/sec
---- 167.1 213.5 252.7 287.8 348.1
468.4 407.1
64.3 92.5
113.7 118.0 138.6
184.3 154.5
196.0 209.0
49.7 69.6
----
84.1
138.0
193.8
107.0
170.3
211.4 102.6 133.1 179.3 193.5
204.7 232.1
84.2
V
n/sec ----- 50.93 65.07 77.02
106.10 124.08 142.77 19.60
34.66 35.97 42.24 47.09 56.17 59.74 63.70
87.72
28.19
---- 15.15 21.21 25.63 32.61 42.06 51.91 59.07 64.43 31.27 40.57 54.65 58.98 25.66 62.39 70.74
b r o m autocorrelation functions 3 c
q
PSf
10.9 31.3 50.7 70.0 89.5
128.0 170.0 117.0
9.6 19.7 29.5 30.0 41.1 50.6 71.5 80.2 90.3 91.0 10.2 20.3 29.6 47.4 78.7
117.3 150.7 177.5
73.1 129.5 150.2 29.6 60.2 76.3
43.8
N/m2
521.9 1498.7 2 427.5 3 351.6 4 285.3 6 128.7 8 139.6 0 390.0
459.7 943.2
1412 .5 1436.4 1 967.9 2 422.7 3 423.4 3 840.0 4 323.6 4 357.1
488.4 972.0
1417.3 2 269.5
5 616.4 7 215.6
3 768.2
a 498.7 2 097.2 3 500.0 6 200.5 7 191.6 1 4 1 7 . 3 2 882.4 3 653.3
Tes t medium and p r e s s u r e
Air, 1 a t m
?reon, 1/2 a t m
1 Freon, 1 a t m
I
Freon, 1/3 a t m
t
Tature of unsteady lift fo rce
( 4 ~~
WB WE3 WB NE3 NB NB NB NB WB NB NB NB QP QP QP QP QP QP
QP QP QP QP QP QP QP QP QP QP QP QP QP QP
WB
S
@) ---- 1.214 ,237 .241 .243 .247 .251 .251 ---- .243 .269 .25a .293 .299 .302 .294 .290 .289 .234 .295 .3oa .305 .299 .294 .291
.314
.302
.294
.292
.313
.255
.269
.zag
%, rms(0)
( 4 0.0628 .1001 .1250 .1420 .1510 .1180
.0489
.0705
.1080
,0863
.oam
.0929
.0906
.ogia
.1222
.1609
.1768
.20a6
. lo4 5
.0943 ,0932 .0618 .0534 .0516 .0921 .0937 .0575 .0565 .0516 ,0862 .0815 .0945 .1278
aThe abbreviations used in th i s column are defined as follows: WB - Wide-band random (autocorrelation function is descr ibed by no m o r e than one peak o ther
NE3 - Narrow-band random (autocorrelation function consis ts of m o r e than two consecutive t h a n t h e r = O peak)
peaks and dec reas ing amplitudes, with increas ing 7-displacement, of m o r e than 10 percent)
analysis - T-displacement range with constant amplitude within 10 percent at the l a rges t .r-displacement peaks)
QP - Quasi-periodic (autocorrelation function descr ibed by consistent peaks through en t i r e
bDetermined f r p m autocorrelation function of the l a r g e cylinder aerodynamic lift force. CLift coefficient de te rmined f r o m the lift fo rce 7 = 0 point of the au tocorre la t ion functions.
59

TABLE IV.- ROOT-MEAN-SQUARE LIFT COEFFICIENT ON STATIONARY CYLINDER - Concluded
RN
7.79 x l o t 3.06 4.16 5.18 5.18 6.19 5.17 6.08 8.43
10.23 13.23 14.94 15.48 17.60 4.98 3.90 5.31 1.88 1.42 2.09 2.30 2.57 2.79 3.01 2.53 2.97 3.82 4.90
10.83 8.87 9.15 5.32 6.17
~
M
I . 50( .18( .25C .3 1E .3 14 .381 .116 .138 .193 .234 .307 .350 .364 .417 .112 .161 .220 .399 .293 .415 .460 .506 .553 .601 .157 .187 .2 56 .318 .229 I 186 ,192 I 110 ,129
ft/sel
255.t 95.2
129. E 162.8 162.1 196.2 59.7 71.6 99.7
121.6 160.0 181.4 189.6 216.8 58.4 84.8
115.2 t06.8 151.3 t12.0 !3 5.3 !59.0 !84.2 108.6 81.8 96.9 28.4 60.2 16.1 94.8 98.0 56.6 65.6
V
n/sec
77.91 29.05 39.47 49.65 49.41 59.80 18.20 21.82 30.39 37.06 48.77 55.29 57.79 66.08 17.80 25.85 35.11 33.03 16.12 34.62 71.72 78.94 36.62 34.06 14.93 19.54 $9.14 L8.83 15.39 !8.90 !9.87 .7.25 !O.OO
PSf
91.1 13.1 25.( 39.: 38.6 56.: 14.f 20.E 40.3 59.3
lO1.E 129.5 140.7 182.4 13.9 15.4 29.4 17.8 10.0 20.0 24.5 30.2 36.2 42.3
9.7 13.5 23.3 38.6 58.1 39.1 41.7 14.0 18.8
N/m2
4 395.1 651.:
1 197.( 1876.6 1862.1 2 705.:
694.: 995.E
1 920.C 2 839.2 4 859.8 6 200.5 6 736.8 8 733.4
665.5 737.4
1407.7 852.3 478.8 957.6
1 173.1 1446.0 1733.3 3 025.3
464.4 646.4
1 115.6 L 848.2 ! 781.8 . 872.1
996.6 670.3 900.1
Tes t medium a n d p r e s s u r e
Freon , 1/3 a t n
I
Freon, 1/2 a tm
'reon, 1/10 a t m I
+eon, 1/3 a tm
Freon, 1 a t m
Nature of uns t eae lift fo rce
( 4
QP WB WB NB NB NB NB QP QP QP QP QP QP QP NB WB NB NB WB WB NB QP QP QP WB WB NB NB QP QP QP
QP NB
S (b)
1.24
.22r
.25
.23:
.26'
.25!
.29!
.30r
.30:
.29r .29E .29: .28( .24E .221 .267 .192 . i 8 a .2oa .203 .205 .221 .229 --- .175 ,173 ,226 ,301 308 306 255 307
n
"L,rms(C
( 4
0.3668 .0839 .1372 .1140 .1167 .0932 .0698 .0788 .0764 .0645 .0495 .0560 .0710 .0900 .0760 .1179 .0760 .0918 .0585 .0711 .0868 .7039 .7163 .6602 .0902 .1062 .1429 .1295 .0339 .0w0 .0665 .0710 .0578
a The abbreviations used in this column are defined as follows: WB - Wide-band random (autocorrelation function is descr ibed by no m o r e than one peak other
NB - Narrow-band random (autocorrelation function consis ts of m o r e than two consecutive than the T = 0 peak)
peaks and decreas ing amplitudes, with increas ing 7-displacement, of m o r e than 10 percent)
analysis - r-displacement range with constant amplitude within 10 percent a t the l a rges t r-displacement peaks)
Q P - Quasi-periodic (autocorrelation function descr ibed by consistent peaks through en t i r e
bDetermined f r o m autocorrelation function of the l a rge cylinder aerodynamic lift force. CLift coefficient determined f r o m the lift fo rce 7 = 0 point of the autocorrelation functions.
60

TABLE V. - REDUCED DATA FOR UNSTEADY LIFT ON OSCILLATING TWO-DIMENSIONAL CYLINDER
,0064 .0201 .0634 -.0025
6.15 X lo6 0.319
66.1 20.15 18.0 861.8’ 66.1 20.15 18.3 816.2
6.11 6.24 8.49 9.15 9.15 10.24 10.14 10.81 10.85 11.91 13.11 15.8 5.61 6.0 6.0 6.24 1.21 1.56 8.4 9.15 9.15 9.16 9.3 9.51 10.11 10.14 10.11 10.86 11.96 13.14 5.64 5.67 5.12
, 5.91 6.00 1 6.06 ,130
I
.129
.130
.360
.192
.192
.234
.221
.229 ,230 .26 .306 .35 ,231 ,136 .136 .130 ,303 .16 ,190 .192 .192 .193 2 0 .41 .233 2 2 8 ,228 .231 .26 .304 .235 .236 ,303 .135
1 .130 I I I I I I I I I I I
0.0035 0.958 1.031 1.177 ,911 .984 .905 .981 1.010 1.072 ,924 ,997 1.133 1 1.014
.0069 ,629 1.027 1.444 1.117 1.003 1.010 ,990 ,984 ,905
’ 1.082 ,849 ,741 .981 1.019 .993 ,921 ,984
,0139 ,909 ,964 .314
i .993
, , .a11
1.190 .I99 ,716 1.465 1.013 .992 1.106 .950 ,918 ,963 1.106 1.084
1.188 ,936 .go2 .I91 1.432 1.151 1.078 1.113 ,986 ,982 .911
1.196 .997 1.211 .916 1.013 1.660 1.402 1.523 1.162 .905 .I25
_ _ _ _
_ _ _ _
0.0454 68.5 0.2207 ,0235 67.0 ,1223 ,0164 -15.6 ,2101 ,0804 33.8 ,9214 ,0461 4.5 ,6563 ,0137 91.7 -.0056 ,0433 -26.2 ,5894 ,0286 -12.9 ,4381 ,0095 .8 ,1498 ,0190 -4.8 2.960 ,0303 -9.4 ,5227 ,0269 -37.2 4.196 .0428 -45.5 ----- ,0144 -6.2 .1915 ,0330 -1.5 ,4348 .0049 36.2 ,0519 ,0317 -12.6 ,4894 .0823 -9.8 1.084 ,0469 -55.2 ,3611 ,0503 -38.6 ,5391 ,0143 1.3 1.051 .0216 84.3 ,0297 .0194 2.9 ,2148 ,0332 19.1 ,0900
- - - - - - - - - - - - -. - .0139 -20.2 1.048 ,0183 -5.5 ,2862 .0708 -14.7 1.079 .0355 53.2 ,3386 .0306 -11.9 ,5227 .0968 3.9 1.887 .Of353 100.4 -.1569 .lo80 16.7 ,3291 .0011 ---- -.0199 .0246 100.6 ,0598 .0211! 12.8 ,0851
0.5625 ,2812 -.0585 ,6165 -.0721 ,1938 -.2894 -.lo06
,0016 -.2488 -.0851 -.3196 _ _ _ _ _ -.0213 -.0572 ,0386 -.lo90 -.la72 -.5196 -.4307 -.0212 ,3041 .0142 ,4657 -_.._
-.3852 -.0283 -.2835 ,4515 -.1101 -.1289 .E531 1.397 -.0106 ,3218 ,2752
39.21 15.903 15.91 5.944 20.91 -.9296 129.51 13.799 81.40 -1.424
- . I 6 4.158 66.05 -5.162 43.67 -1.594 13.15 ,0220 19.65 4.705 57.07 -1.488 27.32 -3.312 70.22 -11.40 36.11 -.649 28.49 -.596 1.68 ,198 24.02 -.E52 91.58 -2.516 21.87 -5.000 34.34 -4.361 69.12 -.222
2.08 3.397 13.36 ,110 7.22 5.948 -. - - - . -. -. - 58.92 -3.446 11.54 -.la2 53.15 -2.223 19.61 4.112 28.69 -.962 74.31 -.EO8 -1.07 6.118 13.66 9.163 -8.60 -.I30 2.59 2.214 4.09 2.105
0.0033 ,0033 ,0033 ,0034 ,0032 ,0034 ,0032 ,0034 ,0034 .0034 ,0028
.0034 ,0024 ,0066 .0062 .0064 ,0061 ,0049 ,0064 ,0063 ,0060 ,0066 ,0061 ,006 5
_ _ _ _ _ ,0065 ,0013 ,0010 ,0069 ,0056 ,0073 ,0134 ,0130 ,0118 ,0132 ,0135
0.253 0.264 ,291 ,288 ,339 ,288 ,271 ,302 ,300 ,305 ,216 ,305 ,301 ,305 ,308 ,305 ,327 ,305 .282 .305 ,304 .305 ,340 ,300 ,299 ,295 ,173 .215 ,303 .295 ,426 ,295 .339 ,288 ,301 ,300 .309 ,306 .302 ,305 ,300 ,305 .276 .305 ,330 ,305 ,259 .305 ,215 ,290 .301 ,305 ,329 ,305 ,303 ,305 ,281 ,305 ,304 ,309 ,298 ,300 ,250 ,215 .265 .275 .086 ,274 ,257 ,295 ,241 .290,
1.150 1 .06341 -2.3) ,8431 1 -.0332 i 20.841 -.131 I 8 8 , .0142 , ,3211 2901
0.0895 .0601 ,0584 ,1062 ,0116 ,0701 ,0130 ,0604 ,0582 .0601 .0633 .0553 .0635 ,0893 .0104 ,0678 ,0595 ,1071 ,0853 ,0786 ,0829 ,0691 ,0693 .0638
.0192 ,0634 ,0169 .0614 ,0631 .OB50 ,1054 ,1145 .OBI4 ,0681
_ _ _ _ _
0.0752 .0752 ,0152 .0125 . O l O l . O l O l .ON0 .0636 .0634 .0630 .0572 ,0510 _---- .0752 ,0152 ,0152 ,0152 .0148 .0741 .0729 . O l O l . O l O l .0706 . O l O O ,0692 ,0662 .0636 .Of335 .0629 .0512 .0512 .0152 .0152 ,0752 ,0152
,0617 ,0752 .On65 I ,0152

TABLE V.- REDUCED DATA FOR UNSTEADY LIFT ON OSCILLATING TWO-DIMENSIONAL CYLINDER - Concluded
0.0244 0.0961 66.3 20.21 ,0001 .0175 66.3 20.21 -.0034 .0262 154.6 147.12 .0136 ,0297 84.4 25.72 ,0607 -.0091 84.7 25.82 ,0474 ,0122 86.3 26.30
1 6.14 x 1061 0.378 I 0.0139 ' 0.580 I 19.2 919.3 19.2 919.31 51.2 2451.5 29.7 1422.0 29.8 11426.8 30.9 1479.5
I I I I . . t
, 6.24 6.24 7.21 7.60 7.62 7.9 8.4 9.15 9.15 9.15 9.30 10.17 10.74 10.74 10.80 13.23 6.11 6.24 6.24 8.40 I 8.46 9.15
I 9.16 9.3
, 10.17 10.83 9.15 14.79 15.18
' 10.77 9.15 9.16 10.24 8.34
,130 ' ,130 ,303 .16 .16 .16 ,192 ,192 ,192 .192 .20 .233 .228 229 ,229 ,307 .139 .130 .130 ,192 .193 ,192 .193 .20 ,233 229 ,192 347 359 .228 ,192 ,193 ,233 .191
1.021 1 ,864 1 ,647
.696 ' 1.006
1.134 ,990 ,984 ,905 1.088 ,997 ,987 .931 ! 1.072 .990 4 ,627
.0278 .847 ,864
1.177
,587 ,984
' 1.082 .993 ,806 ,990
.0556 ,984
.0050 1.041
.0050 1.000 ,0182 1.072 ,0197 ,905 .0197 1.082 ,0197 ,990 ,0329 ,993
I
I .987
-_-_ 1.229 . I66 1.297 1.180 1.224 1.220 1.034 1.629 1.027 1.098 1.673 1.644 1.186
,860 1.507 ,996 1.013 .922 1.914 1.712 1.137 2.112 1.458 2.291 1.488 2.443 3.495 _ _ _ _ _ _ _ _ 1.099 1.194 1.255 2.180 1.914
- - - - - - - - - ,:&;I 75.7 0.3243 ,0175' 89.6 ,0013 .0264 172.6 -.0454 .0327 65.4 ,1838 ,0614 -43.2 ,8203 .0489 14.4 ,6414 ,0663 -28.7 ,7984 ,1369 -1.1 1.936 .0523 86.2 ,0481 ,0481 .5 ,6803 .1369 5.5 1.947 .1239 -8.6 1.852 .0815 64.8 .5456 ,0380 6.2 ,5123 ,1084 -8.1 1.691 .0346 117.8 -.3163 .0403 93.6 -.0332 ,0536 92.2 -.0266 .1782 -17.1 2.266 .1343 -26.0 1.656 .0352 101.9 -.1484 ,1850 28.8 2.574 ,0849 1.2 1.202 ,1900 -5.0 2.104 .1100 78.8 ,3218 .1874 -4.8 2.960 .3149 52.1 4.373 .0163 -82.1 ----- .0206 -84.4 ----- .0519 5.0 ,8142 .0724 72.9 .3013 ,0630 -1.3 .E924 ,1788 -7.8 2.685 ,1531 -17.2 2.001
_ _ _ _ _ /_-----/___.__ 1.278 , 10.68 6.692
.2327 .06 1.685 ,3502 -3.598 4.412 .4014 11.39 3.957 -.1230 23.90 -5.70 ,1651 14.85 ,608 -.4362 26.32 -2.289 ,0184 56.34 ,0851 ,1383 1.67 4.090 ,0056 16.33 ,0216 .1857 53.09 ,806 ,2719 53.82 -1.286 1.159 15.31 5.175 -.0695 13.02 -.2811 -.2401 42.96 -.968 ,6012 -16.75 5.067 ,5346 -.544 1.393 ,1128 -.59 2.538 -.6942 29.63 -1.445 -.8080 26.33 -2.045 ,4602 -6.57 3.242 -.4653 37.60 -1.082 .0255 14.79 ,0499 -.2371 33.74 -.411 1.630 6.74 5.432 -.2488 37.10 -.504 -.E416 30.91 -.9486
3.00 -2.847 1.80 -2.441
_ _ _ _ _ _ _ _ _ _ -.0646 13.56 -.1711 ,9188 6.67 3.451 -.0198 14.50 -.0513 -.3652 51.61 -9.977 -.I3197 24.16 -1.190
_ _ _ _ _ 0.153 0.2641 ----- 0.0132 .0133 ,0126 ,0132 ,0134 ,0132 ,0121 .0135 .0133 ,0134 ,0139 ,0126 ,0140 ,0135 ,0137 .0136 .0264 .0211 .0250 ,0253 .0256 ,0269 ,0264 ,0306 ,0261 ,0272 ,0555 ,0048 .0077
,0118 ,0209 .0199 ,0188 ,0330 __
,294 ,288' 0.0924 ,249 .288 ,194 .300 .213 .306 ,308 .306 ,347 .306 ,302 ,305 .300 ,305 ,276 .305 ,332 .305 ,304 ,305 .301 ,305 .284 ,305 ,327 ,305 ,302 .305 ,188 ,300 .250 ,295 ,249 ,288 339 2 8 8 ,301 ,305 ,179 ,305 ,300 ,305 ,330 ,305 ,303 ,305 ,246 ,305 ,302 ,305 ,300 ,305 ,301 ,295 ,295 ,295 .321 ,305 ,276 ,305 ,330 ,305 ,302 ,305 .303 .305
,0576 ,0970 ,0873 ,0906 .0902 ,0754 ,1152 ,0726 ,0776 ,1171 ,1088 .0754 ,0631 ,0954 ,0507 ,0762 .Of393 ,1439 ,1248 ,0828 ,1493 ,1029 .1604 ,0985 .1542 ,2471 ,0590 ,0853 ,0698 ,0844 ,0886 ,1439 ,1399
0.0152 ,0752 .0752 ,0748 ,0740 ,0740 .0739 .0729 ,0707 .0701 ,0707 ,0700 .0662 ,0636 ,0734 ,0633 .0509 ,0752 ,0152 ,0752 ,0129 ,0728 .0707 ,0706 .0700 ,0662 ,0631 .0107
-____ _ _ _ _ _ ,0635 ,0707 .0706 ,0660 ,0731