AERC Report - Gokhale Institute of Politics and...
230
(Deemed to be University) Pune – 411 004 AERC Report
Transcript of AERC Report - Gokhale Institute of Politics and...
(Deemed to be University)Pune – 411 004
AERC Report

i
FOREWORD
India has made rapid strides in foodgrain production, especially after the mid-sixties
period, which was mainly due to the introduction of new farm technology, popularly known
as seed-fertilizer-water technology. Though the new farm technology had powerful impact on
food sector of the country, this impact was tardy and dismal in the case of pulse crops. This is
despite the fact that several policy initiatives, projects and programmes with respect to pulses
were undertaken in the past viz. All India Coordinated Pulses Improvement Project
(AICPIP), National Pulses Development Programme (NPDP), Technology Mission on Pulses
(TMOP), Centrally Sponsored Integrated Scheme of Oilseeds, Pulses, Oil palm and Maize
(ISOPOM), etc. Since these policies and programmes hardly led to any improvement in
pulses production of India, the National Development Council (NDC) resolved to launch a
Food Security Mission for rice, wheat and pulses, especially for raising the production levels
by 10 million tonnes for rice, 8 million tonnes for wheat and 2 million tonnes for pulses by
the end of the Eleventh Five Year Plan (2011-12).
As for pulses, the major areas of concern are the low yield levels, marginal lands
devoted to pulse cultivation, stagnation in production technology, severe abiotic (climate-
related) and biotic (insect, pest) stresses, volatility of prices and lack of effective
procurement. The present study, therefore, attempts to unravel the degree of importance of
these constraints and outline the prospects for pulses production in the state of Maharashtra.
The study also intends to assess the effectiveness of NFSM-Pulses on the pulse production in
Maharashtra. The study has shown positive impact of NFSM programme on pulses crops
cultivation in the state of Maharashtra since the element of profit involved in the cultivation
of pulses crops turned out to be much higher in the NFSM district as against the non-NFSM
district. The element of profit involved in the cultivation of pulses crops in NFSM district
was even higher than all other crops cultivated in the district. The plausible reasons for rise in
profit margins in the cultivation of pulses crops could be traced in rise in yield levels, higher
prices on offer for pulses, adoption of improved varieties of seeds, higher adoption of
recommended practices such as sowing, seed and other practices, and availability of several
other facilities to the farmers under the programme.
I hope the findings of the report would assume increasing significance, especially
with growing concern for pulses production and food and nutritional security in our country.
Gokhale Institute of Politics and Economics Rajas Parchure
(Deemed to be a University) Professor and Offg. Director
Pune 411 004
ii
PREFACE
The agricultural sector has always been an important component of the Indian
economy with period after mid-sixties being marked with significant expansion in
foodgrain output of the country due to introduction of new technology, popularly known
as seed-fertilizer-water technology. Though the new farm technology had a powerful
impact on the food sector of the country, the impact of new technology was tardy and
dismal in the case of pulses. In the race of output growth, pulses have lagged so far
behind that these can be categorized as ‘also ran’. This is despite the fact that several
policy initiatives, projects and programmes with respect to pulses were undertaken in the
past viz. All India Coordinated Pulses Improvement Project (AICPIP), National Pulses
Development Programme (NPDP), Technology Mission on Pulses (TMOP), Centrally
Sponsored Integrated Scheme of Oilseeds, Pulses, Oil palm and Maize (ISOPOM), etc.
Since these policies and programmes hardly led to any improvement in pulses production
of India, the National Development Council (NDC) in its 53rd
meeting held on 29th
May,
2007 resolved to launch a Food Security Mission for rice, wheat and pulses, especially
for raising the production levels by 10 million tonnes for rice, 8 million tonnes for wheat
and 2 million tonnes for pulses by the end of the Eleventh Five Year Plan (2011-12). In
view of achieving these targets and operationalising the resolution taken by NDC, the
‘National Food Security Mission (NFSM)’ was launched in 2007-08 as a Centrally
Sponsored Scheme. The NFSM comprises of three components, which include (a) NFSM
– Rice, (b) NFSM – Wheat, and (c) NFSM – Pulses.
At present, the major areas of concern in pulse cultivation are the low yield levels,
marginal lands devoted to pulse cultivation, stagnation in production technology, severe
abiotic (climate-related) and biotic (insect, pest) stresses, volatility of prices and lack of
effective procurement. The present study, therefore, attempts to unravel the degree of
importance of these constraints and outline the prospects for pulses production in the
state of Maharashtra. The study also intends to assess the effectiveness of NFSM-Pulses
on the pulse production in Maharashtra.
The study showed positive impact of NFSM programme on pulses crops
cultivation in the state of Maharashtra since the element of profit involved in the
cultivation of pulses crops turned out to be much higher in the NFSM district as against
the non-NFSM district. The element of profit involved in the cultivation of pulses crops
in NFSM district was even higher than all other crops cultivated in the district. Not only

iii
this, the net profit margins in the cultivation of pulses crops in NFSM district were
substantially high in 2008-09 as against 2006-07 and 2007-08. The plausible reasons for
rise in profit margins in the cultivation of pulses crops could be traced in rise in yield
levels, higher prices on offer for pulses, adoption of improved varieties of seeds, higher
adoption of recommended practices such as sowing, seed and other practices, and
availability of several other facilities to the farmers under the programme.
At the initial stage of this study, I had fruitful discussions with Mr. Prabhakar
Deshmukh, Agriculture Commissioner, Commissionrate of Agriculture, Government of
Maharashtra, Pune and other senior officers of the Department. I am extremely grateful to
them for providing inputs for this study. I am equally grateful to Mr. Jayant Deshmukh,
Director (Extension and Training), Commissionrate of Agriculture, GOM, Pune, Mr.
A.B. Kausale, Joint Director (Administration), and Mr. D.B. Deshmukh, Dy. Director
(Project) for not only supplying the requisite information but also extending all possible
help during the conduct of this study. I also extend special thanks to Mr. D.G. Mule,
District Agriculture Officer, Beed, Mr. R.R. Shinde, District Statistical Officer, Beed, Mr.
Vasant Rathor, Taluka Agriculture Officer, Majalgaon, Beed, Mr. K.S. Mule, District
Agriculture Officer, Amravati, Mrs. Gavli, District Statistical Officer, Amravati and Mr.
Uke, Taluka Agriculture Officer, Daryapur, Amravati for their support in this study.
I am greatly indebted to Prof. R.K. Parchure, officiating Director of the Gokhale
Institute of Politics and Economics, Pune for his constant encouragement and support
during the course of this study. I am also grateful to ESA, Department of Agriculture and
Cooperation, Ministry of Agriculture, GOI, for his continuous support and giving
approval to conduct the study. I wish to place my gratitude to Dr. Sangeeta Shroff,
Incharge, AERC, Pune, for her keen interest and providing necessary facilities in carrying
out this study. I also thank Dr. S.S. Kalamkar of the GIPE for his support in the study. I
extend special thanks to Dr. C.S.C. Sekhar, IEG, who is Coordinator of this study.
I hereby extend my hearty thanks to Mr. Chandrakant Kolekar for his support in
collection, inputting and analysis of data. I also extend my hearty thanks to Shri S. S.
Dete and Mr. Anil Memane for their support in collection of data for this study.
It gives me pleasure in extending thanks to my esteemed colleagues, both faculty
members and office staff, for their cooperation and support in completing the study.
March 7, 2011 Deepak Shah

iv
CONTENTS
Page No.
FOREWORD
PREFACE
i
ii
LIST OF TABLES ix
Chapter
I INTRODUCTION 1-11
1.1 Background 1
1.2 Pulses Development Programmes in India 2
1.3 Production Performance of Agriculture Sector: Recent Trends 2
1.4 Demand for Cereals and Pulses 3
1.5 National Food Security Mission 6
1.6 Objectives of the Study 7
1.7 Methodology 7
1.7.1 Sampling Design 7
1.7.2 Data Collection 9
1.7.3 Data Sources 10
1.7.4 Reference Period 10
1.8 Organization of the Study 10
II PULSES SECTOR IN THE STATE AND THE DISTRICT 12-38
2.1 Area under Important Crops 12
2.2 Growth Trends in Important Crops 14
2.3 Growth in GCA, NSA and Fertilizer Consumption 17
2.4 Area under Pulses in Maharashtra 19
2.5 Area, Production and Yield of Pulses Crops 19
2.6 Share of Districts in Area and Production of Pulses 24
2.7 District-wise Growth in A, P, Y of Pulses 28
III DEMOGRAPHIC PROFILE AND CROPPING PATTERN
OF THE STUDY REGION
39-65
3.1 General Overview: Maharashtra State 39
3.2 General Overview: Study Districts 42
3.3 Family Size of NFSM and Non-NFSM District Farmers 44
3.4 Educational Status of NFSM and Non-NFSM District Farmers 45
3.5 Caste Composition of NFSM and Non-NFSM Farmers 49

v
Chapter Page No
3.6 Irrigated Area in NFSM Amravati and Non-NFSM Beed District 51
3.7 Cropping Pattern of NFSM and Non-NFSM Farmers 53
3.8 Area under Pulses for NFSM and Non-NFSM Farmers 57
3.9 Share of Size-Groups in Pulse Farming: NDSM and Non-NFSM Districts 59
3.10 Irrigated Area under Pulses in NFSM and Non-NFSM Districts 61
IV ECONOMICS OF PULSES CULTIVATION 66-99
4.1 Profitability of Pulses and Other Crops in NFSM District 66
4.1.1 Economics of Pulses Crops in NFSM District 66
4.1.2 Economics of Other Major Crops in NFSM District 72
4.2 Profitability of Pulses and Other Crops in Non-NFSM District 80
4.2.1 Economics of Pulses Crops in Non-NFSM District 80
4.2.2 Economics of Other Major Crops in Non-NFSM District 86
V TECHNOLOGY ADOPTION, MARKETING AND OTHER ISSUES 100-129
5.1 Area Under Improved Varieties of Pulses: NFSM and Non-NFSM Districts 100
5.2 Knowledge of Improved Varieties in NFSM and Non-NFSM Districts 103
5.3 Recommended Practices in NFSM and Non-NFSM Districts 106
5.4 Problems with Improved Varieties of Pulses: NFSM & Non-NFSM Districts 110
5.5 Suggested Solutions for Improved Varieties: NFSM & Non-NFSM Districts 117
5.6 Marketing of Pulses Crops in NFSM and Non-NFSM Districts 121
5.7 Quantity of Pulses Marketed in NFSM and Non-NFSM Districts 126
VI FARMERS’ PERCEPTIONS 130-155
6.1 Major Pest Problems in NFSM and Non-NFSM Districts 130
6.2 Reasons for Growing Pulses Crops in NFSM and Non-NFSM Districts 133
6.3 Criteria for Pulses Cultivation in NFSM and Non-NFSM Districts 136
6.4 Reasons for Low Area under Pulses in NFSM and Non-NFSM Districts 138
6.5 Crops Grown on Inferior Quality of Lands: NFSM & Non-NFSM Districts 141
6.6 Problems with Pulses on Inferior Quality of Lands: NFSM & Non-NFSM 144
6.7 Reasons for Shifting from Pulses to Other Crops: NFSM & Non-NFSM 146
6.8 Farmers Willingness to Grow Pulses in NFSM and Non-NFSM Districts 149
6.9 Major Problems in Cultivating Pulses in NFSM and Non-NFSM Districts 150
6.10 Important Suggestion for Cultivating Pulses in NFSM and Non-NFSM 153
VII IMPACT OF NFSM-PULSES ON PULSES PRODUCTION 156-165
7.1 Farmers’ Awareness of NFSM-Pulses 156

vi
Chapter Page No.
7.2 Assistance Received under NFSM-Pulses 157
7.3 Type of Assistance received under NFSM-Pulses 157
7.4 Usefulness of NFSM-Pulses 158
7.5 Type of Usefulness of NFSM-Pulses 159
7.6 Area under Pulse Crops Before and After NFSM 160
7.7 Production of Pulse Crops Before and After NFSM 161
7.8 Increase in Area under Pulse Crops after NFSM 162
7.9 Extent of Increase in Area under Pulse Crops after NFSM 163
7.10 Suggestions for Improving NFSM – Pulses 163
VIII SUMMARY, CONCLUSIONS AND POLICY IMPLICATIONS 166-189
8.1 Backdrop 166
8.2 Objectives of the Study 167
8.3 Methodology 167
8.4 Major Findings 168
8.4.1 Status of Pulses Sector in Maharashtra 169
8.4.1.1 Area under Important Crops 169
8.4.1.2 Trend in Share of Important Crops in GCA 169
8.4.1.3 Growth Trends in Important Crops 170
8.4.1.4 Growth in GCA, NSA and Fertilizer Consumption 170
8.4.1.5 Area under Pulses in Maharashtra 171
8.4.1.6 Area, Production and Yield of Pulses Crops 171
8.4.1.7 Share of Districts in Area and Production of Pulses 171
8.4.1.8 District-wise Growth in A, P, Y of Pulses 172
8.4.2 Socio-economic Characteristics & Resource Endowments of Farmers 172
8.4.2.1 Family Size Composition of Farmers 173
8.4.2.2 Educational Status of Farmers 173
8.4.2.3 Caste Composition of Farmers 173
8.4.2.4 Irrigated Area in NFSM and Non-NFSM Districts 173
8.4.2.5 Cropping Pattern of Farmers 174
8.4.2.6 Area under Pulses for NFSM &Non-NFSM Farmers 174
8.4.2.7 Share of Size-Groups in Pulse Farming 175
8.4.2.8 Irrigated Area under Pulses 175
8.4.3 Economics of Pulses and Other Crops Cultivation 176
8.4.3.1 Economics of Pulses Crops in NFSM District 176

vii
Chapter Page No.
8.4.3.2 Economics of Other Major Crops in NFSM District 177
8.4.3.3 Economics of Pulses Crops in Non-NFSM District 178
8.4.3.4 Economics of Other Major Crops in Non-NFSM District 178
8.4.4 Technology Adoption and Marketing 179
8.4.4.1 Area Under Improved Varieties of Pulses 179
8.4.4.2 Knowledge of Improved Varieties of Pulses 180
8.4.4.3 Recommended Practices in NFSM & Non-NFSM 180
8.4.4.4 Problems with Improved Varieties of Pulses 181
8.4.4.5 Suggested Solution for Improved Varieties of Pulses 181
8.4.4.6 Marketing of Pulses Crops 181
8.4.4.7 Quantity of Pulses Marketed 182
8.4.5 Farmers’ Perceptions for Cultivation of Pulses 182
8.4.5.1 Major Pest Problems in Pulses Cultivation 182
8.4.5.2 Reasons for Growing Pulses Crops 182
8.4.5.3 Criteria for Pulses Cultivation 183
8.4.5.4 Reasons for Low Area under Pulses 183
8.4.5.5 Crops Grown on Inferior Quality of Land 183
8.4.5.6 Problems with Pulses on Inferior Quality of Land 184
8.4.5.7 Reasons for Shifting from Pulses to Other Crops 184
8.4.5.8 Farmers Willingness to Grow Pulses 184
8.4.5.9 Major Problems in Cultivating Pulses 185
8.4.5.10 Important Suggestion for Cultivating Pulses 185
8.4.6 Impact of NFSM-Pulses 185
8.4.6.1 Farmers’ Awareness of NFSM-Pulses 185
8.4.6.2 Assistance Received under NFSM-Pulses 186
8.4.6.3 Type of Assistance received under NFSM-Pulses 186
8.4.6.4 Usefulness of NFSM-Pulses 186
8.4.6.5 Type of Usefulness of NFSM-Pulses 186
8.4.6.6 Area under Pulse Crops Before and After NFSM 186
8.4.6.7 Production of Pulse Crops Before and After NFSM 187
8.4.6.8 Increase in Area under Pulses after NFSM 187
8.4.6.9 Extent of Increase in Area under Pulses after NFSM 187
8.4.6.10 Suggestions for Improving NFSM-Pulses 187
8.5 Conclusions and Policy Implications 188

viii
Chapter Page No.
References 190
APPENDIX 191-212
ANNEXURE I 213
ANNEXURE II 214
ix
LIST OF TABLES
Table No Title Page No
1.1 Production Performance of Important Crops during 10th
Plan 3
1.2 Projected Demand for Foodgrains on the Behaviouristic Approach 4
1.3 Demand Projections for the Terminal Year of 11th
Five Year Plan 4
1.4 Sampled Farmers from the NFSM District of Amravati and Non-
NFSM District of Beed
9
2.1 Area under Important Crops in Maharashtra: (Average of 2003-04 to
2007-08)
13
2.1 (a) Share of Important Major Crops in GCA in Maharashtra: 1996-97 to
2007-08
14
2.2 Compound Annual Growth Rates (CAGR) over 1997-2008 (1996-97 to
2007-08) of Area, Production, Yield of Important Crops in
Maharashtra
15
2.3 Growth in Important Variables in Maharashtra 17
2.4 Area under Important Pulses in Maharashtra: (Average of 2003-04 to
2007-08)
19
2.5 Area, Production, Yield and Irrigated Area under Pulses in
Maharashtra: Mung
20
2.5 (a) Area, Production, Yield and Irrigated Area under Pulses in
Maharashtra: Tur
21
2.5 (b) Area, Production, Yield and Irrigated Area under Pulses in
Maharashtra: Udid
22
2.5 (c) Area, Production, Yield and Irrigated Area under Pulses in
Maharashtra: Gram
22
2.5 (d) Area, Production, Yield and Irrigated Area under Pulses in
Maharashtra: Total Pulses
23
2.6 Share of Districts in Total Area and Production of All Major Pulses
Crops in Maharashtra: Average of 1996-97 to 2007-08
25
2.6 (a) Share of Districts in Total Area and Production of Total Pulses Crops
in Maharashtra: Average of 1996-97 to 2007-08
27
2.7 Compound Annual Growth Rates (CAGR) over 1997-2008 (1996-97 to
2007-08) of Area, Production, Yield of Important Pulses Crops in
Maharashtra: Mung
29
2.8 Compound Annual Growth Rates (CAGR) over 1997-2008 (1996-97 to
2007-08) of Area, Production, Yield of Important Pulses Crops in
Maharashtra: Tur
31

x
Table No Title Page No
2.9 Compound Annual Growth Rates (CAGR) over 1997-2008 (1996-97 to
2007-08) of Area, Production, Yield of Important Pulses Crops in
Maharashtra: Udid
33
2.10 Compound Annual Growth Rates (CAGR) over 1997-2008 (1996-97 to
2007-08) of Area, Production, Yield of Important Pulses Crops in
Maharashtra: Gram
35
2.11 Compound Annual Growth Rates (CAGR) over 1997-2008 (1996-97 to
2007-08) of Area, Production, Yield of Important Pulses Crops in
Maharashtra: Total Pulses
37
3.1 Family Size Composition of NFSM Amravati District 44
3.2 Family Size Composition of Non-NFSM Beed District 44
3.3 Table 3.3: Education Status of Head of Household of NFSM Amravati
District
46
3.3 (a) % Distribution of Education Status of Head of Household of NFSM
Amravati District
46
3.3 (b) Education Profile of the Adult Population in NFSM Amravati District 46
3.3 (c) % Distribution Education Profile of the Adult Population in NFSM
Amravati District
47
3.4 Education Status of Head of Household of Non-NFSM Beed District 47
3.4 (a) % Distribution of Education Status of Head of Household of Non-
NFSM Beed District
48
3.4 (b) Education Profile of the Adult Population in Non-NFSM Beed District 48
3.4 (c) % Distribution Education Profile of the Adult Population in Non-
NFSM Beed District
49
3.5 Caste Composition of Farmers in NFSM Amravati District 50
3.5 (a) % Distribution of Caste Composition of Farmers in NFSM Amravati
District
50
3.6 Caste Composition of Farmers in Non-NFSM Beed District 50
3.6 (a) % Distribution of Caste Composition of Farmers in Non-NFSM Beed
District
51
3.7 Irrigation Details for NFSM Amravati District 51
3.7 (a) % Distribution of Irrigated Area by Source in NFSM Amravati District 52
3.8 Irrigation Details for Non-NFSM Beed District 52
3.8 (a) % Distribution of Irrigated Area by Source in Non-NFSM Beed
District
52
3.9 Cropping Pattern – Over All Seasons: NFSM Amravati District 54
3.9 (a) Cropping Pattern – Over All Seasons: NFSM Amravati District 54

xi
Table No Title Page No
3.10 Cropping Pattern – Over All Seasons: Non-NFSM Beed District 55
3.10 (a) Cropping Pattern – Over All Seasons: Non-NFSM Beed District 56
3.11 Area Under Pulses: Over All Seasons: NFSM Amravati District 58
3.11 (a) % Distribution of Area Under Pulses: Over All Seasons: NFSM
Amravati District
58
3.12 Area Under Pulses: Over All Seasons: Non-NFSM Beed District 59
3.12 (a) Distribution of Area Under Pulses: Over All Seasons: Non-NFSM
Beed District
59
3.13 Share of Different Size-Groups in Pulse Farming: Over All Seasons:
NFSM Amravati District
60
3.14 Share of Different Size-Groups in Pulse Farming: Over All Seasons:
Non-NFSM Beed District
60
3.15 Percentage of Irrigated Area under Pulses: Over All Seasons: NFSM
Amravati District
61
3.16 Percentage of Irrigated Area under Pulses: Over All Seasons: Non-
NFSM Beed District
62
3.17 Crop-wise Share in Un-irrigated Area – Over All Seasons: NFSM
Amravati District
63
3.18 Crop-wise Share in Irrigated Area – Over All Seasons: Non-NFSM
Beed District
64
4.1 Profitability in Mung Crop Farming: NFSM Amravati District 67
4.2 Profitability in Tur Crop Farming: NFSM Amravati District 68
4.3 Profitability in Gram Crop Farming: NFSM Amravati District 69
4.4 Profitability in Total Pulses Crops Farming: NFSM Amravati District 70
4.5 Profitability in Soybean Crop Farming: NFSM Amravati District 72
4.6 Profitability in Kharif Jowar Crop Farming: NFSM Amravati District 73
4.7 Profitability in Cotton Crop Farming: NFSM Amravati District 74
4.8 Profitability in Bajra Crop Farming: NFSM Amravati District 75
4.9 Profitability in Kharif Sunflower Farming: NFSM Amravati District 76
4.10 Profitability in Ladyfinger Crop Farming: NFSM Amravati District 77
4.11 Profitability in Rabi Sunflower Crop Farming: NFSM Amravati District 78
4.12 Profitability in All Other Crop Farming: NFSM Amravati District 79
4.13 Profitability in Mung Crop Farming: Non-NFSM Beed District 81
4.14 Profitability in Tur Crop Farming: Non-NFSM Beed District 82
4.15 Profitability in Gram Crop Farming: Non-NFSM Beed District 83
4.16 Profitability in Total Pulses Crops Farming: Non-NFSM Beed District 84

xii
Table No Title Page No
4.17 Profitability in Soybean Crop Farming: Non-NFSM Beed District 87
4.18 Profitability in Kharif Jowar Crop Farming: Non-NFSM Beed District 88
4.19 Profitability in Cotton Crop Farming: Non-NFSM Beed District 89
4.20 Profitability in Bajra Crop Farming: Non-NFSM Beed District 90
4.21 Profitability in Rabi Jowar Crop Farming: Non-NFSM Beed District 91
4.22 Profitability in Wheat Crop Farming: Non-NFSM Beed District 92
4.23 Profitability in Kardi Crop Farming: Non-NFSM Beed District 93
4.24 Profitability in Onion Crop Farming: Non-NFSM Beed District 94
4.25 Profitability in Sugarcane Crop Farming: Non-NFSM Beed District 95
4.26 Profitability in Banana Crop Farming: Non-NFSM Beed District 96
4.27 Profitability in All Other Crops Farming: Non-NFSM Beed District 97
5.1 Households Reporting Area Under Improved Varieties of Pulses:
NFSM Amravati District
101
5.1 (a) Area under Improved Varieties of Pulses: NFSM Amravati District –
for 2008-09
101
5.2 Households Reporting Area Under Improved Varieties of Pulses: Non--
NFSM Beed District
102
5.2 (a) Area under Improved Varieties of Pulses: Noon-NFSM Beed District –
for 2008-09
103
5.3 Knowledge of Improved Varieties of Pulses: NFSM Amravati District 104
5.3 (a) Source of Knowledge of Improved Varieties of Pulses: NFSM
Amravati District
104
5.3 (b) % Distribution of Source of Knowledge of Improved Varieties: NFSM
Amravati District
104
5.4 Knowledge of Improved Varieties of Pulses: Non-NFSM Beed District 105
5.4 (a) Source of Knowledge of Improved Varieties of Pulses: Non-NFSM
Beed District
105
5.4 (b) % Distribution of Source of Knowledge of Improved Varieties: Non-
NFSM Beed District
105
5.5 Recommended Practices in Pulses Crops: NFSM Amravati District 107
5.5 (a) % of Households Following Recommended Practices: NFSM Amravati
District
107
5.6 Recommended Practices in Pulses Crop: Non-NFSM Beed District 109
5.6 (a) % of Households Following Recommended Practices: Non-NFSM
Beed District
109
5.7 Households Reporting Problems with Improved Varieties of Pulses:
NFSM Amravati District
112
xiii
Table No Title Page No
5.7 (a) % Distribution of Households Reporting Problems with Improved
Varieties of Pulses: NFSM Amravati District
112
5.8 Households Reporting Problems with Improved Varieties of Pulses:
Non-NFSM Beed District
115
5.8 (a) % Distribution of Households Reporting Problems with Improved
Varieties of Pulses: Non-NFSM Beed District
115
5.9 Suggested Solutions for Improved Varieties of Pulses: NFSM Amravati
District
118
5.9 (a) % Distribution of Suggested Solutions for Improved Varieties: NFSM
Amravati District
119
5.10 Suggested Solutions for Improved Varieties of Pulses: Non-NFSM
Beed District
120
5.10 (a) % Distribution of Suggested Solutions for Improved Varieties: Non-
NFSM Beed District
120
5.11 No. of Households Marketing Pulses through Various Channels:
NFSM Amravati District
122
5.11 (a) % of Total Households in the Size Group Marketing Pulses through
Various Channels: NFSM Amravati District
123
5.12 No. of Households Marketing Pulses through Various Channels: Non-
NFSM Beed District
124
5.12 (a) % of Total Households in the Size Group Marketing Pulses through
Various Channels: Beed District
125
5.13 Quantity of Pulses Sold through Various Channels: NFSM Amravati
District
127
5.14 Quantity of Pulses Sold through Various Channels: Non-NFSM Beed
District
128
5.15 Government (NAFED) Procurement of Pulses from Farmers: NFSM
Amravati District
129
5.16 Government (NAFED) Procurement of Pulses from Farmers: Non-
NFSM Beed District
129
6.1 Major Pest Problems faced in Pulses: NFSM Amravati District 131
6.2 Major Pest Problems faced in Pulses: Non-NFSM Beed District 132
6.3 Reasons for Growing Pulses: NFSM Amravati District 134
6.3 (a) Reasons for Growing Pulses: Size-group-wise: NFSM Amravati
District
134
6.4 Reasons for Growing Pulses: Non-NFSM Beed District 135
6.4 (a) Reasons for Growing Pulses: Size-group-wise: Non-NFSM Beed
District
135

xiv
Table No Title Page No
6.5 Criteria Used While Opting to Grow Pulses: NFSM Amravati District 136
6.5 (a) Criteria Used While Opting to Grow Pulses: NFSM Amravati District 137
6.6 Criteria Used While Opting to Grow Pulses: Non-NFSM Beed District 137
6.6 (a) Criteria Used While Opting to Grow Pulses: Non-NFSM Beed District 138
6.7 Reasons for Low Area under Pulses: NFSM Amravati District 139
6.7 (a) Reasons for Low Area under Pulses: Size-group-wise: NFSM
Amravati District
139
6.8 Reasons for Low Area under Pulses: Non-NFSM Beed District 140
6.8 (a) Reasons for Low Area under Pulses: Size-group-wise: Non-NFSM
Beed District
140
6.9 Crops Grown on Inferior Quality Lands: Size-group-wise: NFSM
Amravati District
142
6.9 (a) Crops Grown on Inferior Quality Lands: Size-group-wise: NFSM
Amravati District
142
6.10 Crops Grown on Inferior Quality Lands: Size-group-wise: Non-NFSM
Beed District
143
6.10 (a) Crops Grown on Inferior Quality Lands: Size-group-wise: Non-NFSM
Beed District
143
6.11 Problems of Growing Pulses on Inferior Quality Land : NFSM
Amravati District
144
6.11 (a) Problems of Growing Pulses on Inferior Quality Land: Size-group-
wise: NFSM Amravati District
145
6.12 Problems of Growing Pulses on Inferior Quality Land: Non-NFSM
Beed District
145
6.12 (a) Problems of Growing Pulses on Inferior Quality Land: Size-group-
wise: Non-NFSM Beed District
146
6.13 Reasons for Shifting from Pulses o Other Crops: NFSM Amravati
District
147
6.13 (a) Reasons for Shifting from Pulses o Other Crops: Size-group-wise:
NFSM Amravati District
147
6.14 Reasons for Shifting from Pulses to Other Crops: Non-NFSM Beed
District
148
6.14 (a) Reasons for Shifting from Pulses to Other Crops: Size-group-wise:
Non-NFSM Beed District
148
6.15 Farmers Willing to Grow Pulses if Assured Market is Provided: NFSM
Amravati District
150
6.16 Farmers Willing to Grow Pulses if Assured Market is Provided: Non-
NFSM Beed District
150

xv
Table No Title Page No
6.17 Major Problems in Cultivating Pulses: NFSM Amravati District 151
6.17 (a) % Distribution of Major Problems in Cultivating Pulses: NFSM
Amravati District
151
6.18 Major Problems in Cultivating Pulses: Non-NFSM Beed District 152
6.18 (a) % Distribution of Major Problems in Cultivating Pulses: Non-NFSM
Beed District
152
6.19 Important Suggestions from the Farmers for Cultivating Pulses: NFSM
Amravati District
154
6.19 (a) % Distribution of Important Suggestions from the Farmers for
Cultivating Pulses: NFSM Amravati District
154
6.20 Important Suggestions from the Farmers for Cultivating Pulses: Non-
NFSM Beed District
154
6.20 (a) % Distribution of Important Suggestions from the Farmers for
Cultivating Pulses: Non-NFSM Beed District
155
7.1 Farmers’ Awareness of NFSM – Pulses: NFSM Amravati District 156
7.2 Received any Assistance Under NFSM – Pulses: NFSM Amravati
District
157
7.3 Distribution of Households by Type of Assistance: NFSM Amravati
District
158
7.4 Usefulness of NFSM – Pulses: NFSM Amravati District 159
7.5 Distribution by Type of Uses– Pulses: NFSM Amravati District 159
7.6 Area under Pulse Crops Before and After NFSM: NFSM Amravati
District
160
7.6 (a) Area under Pulse Crops Before and After NFSM: NFSM Amravati
District
160
7.7 Production of Pulse Crops Before and After NFSM: NFSM Amravati
District
161
7.7 (a) Production of Pulse Crops Before and After NFSM: NFSM Amravati
District
162
7.8 Increase in Area under Pulses after NFSM: Farmers’ Perception
(Amravati District)
162
7.9 Distribution by Extent of Increase: Farmers’ Perception (Amravati
District)
163
7.10 Suggestions for Improving NFSM – Pulses: Farmers’ Perception
(Amravati District)
164

1
CHAPTER – I
INTRODUCTION
1.1 Background
The agricultural sector has always been an important component of the Indian
economy with period after mid-sixties being marked with significant expansion in
foodgrain output of the country due to introduction of new technology, popularly known
as seed-fertilizer-water technology. Though before the mid-sixties increase in foodgrain
output in the country came mostly from the growth of the cultivated area and extension of
irrigation, ever since mid-sixties the new farm technology symbolized by HYV seeds and
use of chemical fertilizer has been relied upon to get the desired increase in production.
Though the new farm technology had a powerful impact on the food sector of the
country, this technology revolution could gain momentum only in some select regions of
the country and that too with respect to some cereal crops like rice and wheat. The impact
of new technology was tardy and dismal in the case of pulses. In fact, in the race of
output growth, pulses have lagged so far behind that these can be categorized as ‘also
ran’ (Shah, 2003). A number of earlier studies have also shown a sluggish and erratic
growth in pulses and coarse cereal production, though most of the studies are area
specific (Moorti et. al. 1991; Bhatia, 1991, Shah, 1997). In the late 1970’s and early
1980’s, several studies raised concerns about a possible deceleration in the growth of
foodgrain production, indicating a decline in the momentum of the green revolution and
possible exhaustion of the potential of available technology (Alagh and Sharma, 1980;
Desai and Namboodiri, 1983). Dantwala (1978) found that the HYV technology brought
about significant improvement in the productivity of cereal crops, but its overall effect on
foodgrain production, especially when evaluated in per capita terms, was not significant.
A significant section also showed serious doubts about the productivity of modern inputs
that are used in increasing quantities to sustain growth. The Government of India is now
giving top priority for boosting the production of pulses in the country with the objective
of meeting their domestic requirement and also to reduce their import bill.
Notably, India is reckoned as the largest producer and consumer of pulses in the
world, accounting for about 25 per cent of global production, 27 per cent of consumption,
and 34 percent of food use (Price et. al., 2003). Nevertheless, India is also the top
importer pulses in the world with 11 per cent share in world pulse imports during 1995-

2
2001, though imports accounting for about 6 per cent of domestic consumption. Since
pulse production in India has fluctuated widely with no long-term trend, this has led to
steady decline in the per capita availability of pulses over the past 20 years or so. The per
capita per day availability of pulses in India declined from 45.5 grams in 1978 to 41.1
grams in 1990 and further to 31.5 grams in 2005. This is despite the fact that a number of
programmes were initiated in the past to meet the rising demand of pulses owing to ever
increasing human population in the country.
1.2 Pulses Development Programmes in India
In view of unabated population increase, various programmes with respect to
pulses were launched during various plan periods. A Centrally Sponsored Pulses
Development Scheme was initiated from the Fourth Plan (1969-70 to 1973-74) with the
introduction of production technologies and improved varieties amongst the farmers.
Further, considering the quantum leap witnessed by the wheat and rice production in
India in the aftermath of green revolution, a National Pulse Development Programme,
covering almost 13 states, was set up in 1986 with the aim of introducing improved
technologies to the farmers. The success of National Pulse Development Programme led
to introduction of Technology Mission 1986 in order to boost the oilseeds sector in Indian
economy, and pulses too came under this programme. It is to be noted that the previous
National Pulses Development Project (NPDP) that was merged with the earlier Centrally
Sponsored Scheme on pulses became a boon for the farming communities when the
Ministry of Agriculture, Government of India launched it from the seventh plan onwards.
In order to supplement the efforts under NPDP, a Special Food Grain Production
Program (SFPP) on Pulses was also implemented during 1988-89 on a 100 per cent
Central assistance basis. It deserves mention here that under the Government of India-
UNDP Cooperation 1997-2003, Pulses Sector was identified as “Priority Sector” with
focus on strengthening this sector on priority basis.
1.3 Production Performance of Agriculture Sector: Recent Trends
Although the main stay of the Indian economy is the agriculture sector since it
contributes nearly 18 per cent of India’s Gross Domestic Products (GDP) and provides
employment to 57 per cent of the country’s work force and livelihood security to more
than 650 million people, the average annual growth rate in agriculture and allied activities
declined sharply from 4.7 per cent during the Eighth Plan (1992-97) to 2.1 per cent
during the Ninth Plan (1997-2002) and further to 1.2 per cent during the period 2002-05,

3
i.e. the first three years of the 10th
Five Year Plan 2002-07. (Shah, 2009) The agricultural
growth rate in the year 2004-05 was estimated at 1.1 per cent, especially in view of the
high base of the previous year, though the first year of the Tenth Five Year Plan
registered a negative – 7.0 per cent growth. In fact, the performance of Indian agriculture
was most impressive during the Sixth Plan when the growth of agriculture and allied
sector led the overall growth of the economy. However, in the subsequent plans the
growth of agriculture and that of non-agriculture moved in different trajectories.
The slowing down in the growth of agricultural sector translated into subdued
production response. Our country faced severe draught in 2002-03 that caused sharp fall
in the production, and unlike in the decade of eighties, the production could not be
revived. The 10th
plan target of foodgrain production of 230 million tonnes turned out to
be an ambitious target. In three out of first four years of the 10th
Plan, the foodgrain
production remained lower than the benchmark production of 2001-02, with the
exception of 2003-04, when a record production of 213.9 million was achieved (Table
1.1). This achievement could be attributed to favourable rainfall that helped to achieve a
record output of 37.6 million tonnes of coarse cereals.
Table 1.1: Production Performance of Important Crops during 10th
Plan
Production (Million Tonnes)
Year Foodgrain Rice Wheat Coarse
Cereals
Pulses Oilseeds Sugarcane Cotton
2001-02 212.85 93.24 72.77 33.37 13.37 20.66 297.21 10.00
2002-03 174.77 71.83 65.76 26.07 11.13 14.84 287.38 8.62
2003-04 213.19 88.53 72.16 37.60 14.91 25.19 233.86 13.73
2004-05 198.36 85.13 68.64 33.46 13.13 24.35 237.09 16.43
2005-06 208.30 91.03 69.48 34.67 13.11 27.73 278.39 19.57
Source: Directorate of Economics and Statistics (DES)
The pulses production in the country during the 10th
Plan remained at the same
around 14 million tonnes, which has been noticed for the past decades. India has not
shown any meaningful gain in pulses production over the past four decades as the earlier
estimates reveal that in 1958-59 also India produced 13.5 million tonnes of pulses.
However, it is to be noted that throughout 10th
Plan a consistent import substitution of
pulses took place that could be described as a phenomenon unprecedented compared to
earlier plan period.
1.4 Demand for Cereals and Pulses
The tenth plan estimates reported by the Planning Commission, GOI, with respect
to demand for cereals and pulses in India are based on extrapolation of per capita income

4
of Rs.1585 for the year 1999-2000 till the terminal year of 10th
plan, assuming a growth
rate of 4.7 per cent at constant prices, which stands as the actual growth rate in per capita
income achieved since 1994-95. The total demand for pulses for 2006-07 was worked out
at 19.24 million tonnes, which stood at 15.91 million tonnes in 2002-03 (Table 1.2). The
demand for foodgrains for the terminal year of the 10th
five-year plan was estimated at
235.98 million tonnes, which stood at 211.36 million tonnes in 2002-03.
Table 1.2: Projected Demand for Foodgrains on the Behaviouristic Approach
(Assuming that entire per capita incomes goes towards expenditure)
Year
Projected
Population
(Million)
Per Capita
Income at
1999-2000
Prices (Rs.)
Per Capita
Demand of
Cereals for
Human
Consumption
(kg/year)
Cereal
Demand
for
Human
Consum
ption
Total Cereal
Demand
Including
Seed, Feed
& Wastage
Per
Capita
Demand
for
Pulses
(kg/year)
Total
Demand for
Pulses
Including
Seed, Feed &
Wastage
Total
Foodgrains
Demand
2001-02 1033.52 17376 161.25 14.68
2002-03 1053.16 18193 162.39 171.02 195.45 15.10 15.91 211.36
2003-04 1073.17 19048 163.53 175.50 200.57 15.55 16.68 217.25
2004-05 1093.56 19943 164.68 180.09 205.82 16.00 17.49 223.31
2005-06 1114.33 20880 165.84 184.81 211.21 16.46 18.35 229.55
2006-07 1135.51 21862 167.01 189.65 216.74 16.94 19.24 235.98
Source: Tenth Five Year Plan Document, Planning Commission, Government of India, New Delhi
Since the current production estimates of foodgrains are lower than the projected
demand estimates, there is need to enhance supply of foodgrains and slow down the rate
of population growth. Equally important is the need to reduce losses of grains incurred
during various harvest and post-harvest operations that account for a significant share in
total foodgrain production (Shah, 2009). Foodgrains are not only used for human
consumption but also for meeting other requirements like quantity used as seed; quantity
supplied to various livestock and poultry birds as feed, etc.
As per the Report of the Working Group on Crop Husbandry, Agricultural Inputs,
Demand and Supply Projections and Agricultural Statistics for the Eleventh Five Year
Plan (2007-12), the foodgrains requirement under the three scenarios viz. household
approach, normative approach and behaviouristic approach, would be 217 million tonnes,
244 million tonnes and 244 million tonnes, respectively (Table 1.3).
Table 1.3: Demand Projections for the Terminal Year of 11th
Five Year Plan
Crops Demand in Million Tonnes
Cereals 224
Pulses 20
Total Foodgrains 244
Oilseeds 53/36
Sugarcane 322
Cotton 28.7 million bales of 170 kg each
Jute and Mesta 9.87 million bales of 180 kg each

5
As against the demand, the supply for 2011-12 (following alternative approach)
would be 214-240 million tonnes of food grains, 45 million tonnes of oilseeds, 278-334
million tonnes of sugarcane, 16-50 million bales of cotton, 11 million bales of jute and
mesta. Thus, the supply assessment would improve self sufficiency level in edible oils
from existing 55 per cent to 80 per cent. However, the supply of pulses may not catch up
with the demand and there is possibility of deficit in this respect.
It is to be noted that earlier though the Government had introduced a number of
crop-oriented schemes to improve the output of pulses and coarse cereals, the success of
Government schemes depended on the extent of adoption as the farmers grow these crops
on poor and unirrigated land with generally low levels of inputs like fertilizers,
pesticides, etc. Added to this, pulses crops are more susceptible to pest and disease than
cereal crops and, thus, involving high risk. However, in order to augment pulses
production in the country, Sidhu and Sidhu (1991) had put forward a number of
suggestions, which encompass development of draught-disease-and past resistant high
yielding varieties of pulses for different agro-climatic regions, diversification of
agriculture through introduction of pulses crops in wheat-paddy monoculture, etc. On the
other hand, Kadrekar (1991) had suggested a number of strategies to increase pulses
production, especially, in the state of Maharashtra with major emphasis on protective
irrigation, soil fertility management, improved crop production technique, plant
protection measures, and diversification of cropping pattern. However, these strategies
and schemes could not yield the desired results so far as pulses and coarse cereal
production in the country are concerned. The low level of technology adoption in pulses
could be the major reason for poor performance of pulses crops in the country.
One of the major issues raised in the 11th
Plan Approach Paper is the food
security. In view of the food security consideration and large existing potential available
in eastern and central parts of India, the Central Government has launched the National
Food Security Mission (NFSM) as a Central sector scheme in mission-mode aimed at
increasing foodgrains production by at least 20 million tonnes by the end of Eleventh
Plan. The major thrust of this programme is on increasing seed replacement and the
replacement of older varieties by newer ones. One of the major features of this is that it
offers much more than what earlier programmes offered, especially with respect to
capacity building, monitoring and planning. The execution of the programme would be
within the district planning framework.

6
1.5 National Food Security Mission
The National Development Council (NDC) in its 53rd
meeting held on 29th
May,
2007 resolved to launch a Food Security Mission for rice, wheat and pulses, especially
for raising the production levels by 10 million tonnes for rice, 8 million tonnes for wheat
and 2 million tonnes for pulses by the end of the Eleventh Five Year Plan (2011-12). In
view of achieving these targets and operationalising the resolution taken by NDC, the
‘National Food Security Mission (NFSM)’ was launched in 2007-08 as a Centrally
Sponsored Scheme. The NFSM comprises of three components, which include (a) NFSM
– Rice, (b) NFSM – Wheat, and (c) NFSM – Pulses.
The NFSM has been initiated with the chief objectives of: (a) raising the level of
production of rice, wheat and pulses through area expansion and productivity
enhancement in a sustainable manner, (b) restoring soil fertility and productivity at the
individual farm level, (c) creating employment opportunities, (d) enhancing farm level
economy, i.e. farm profits, to restore confidence amongst the farmers. In order to achieve
these objectives, a number of strategies have been formulated that mainly encompass: (i)
implementation of the scheme in a mission mode approach through active engagement of
all the stakeholders at various levels, (ii) promotion and extension of improved
technologies with respect to seed, Integrated Nutrient Management (INM), including
micronutrients, soil amendments, Integrated Pest Management (IPM), and resource
conservation technologies, and also capacity building of the farmers, (iii) close
monitoring of flow of funds to ensure that interventions reach the target beneficiaries on
time, (iv) integration of various proposed intervention with the district plan and fixing
targets for each identified district, and (v) constant monitoring and concurrent evaluation
for assessing the impact of the interventions for a result oriented approach by the
implementing agencies.
There are some 136 district of India included in NFSM – Rice, 141 districts in
NFSM – Wheat, and 171 districts in NFSM –Pulses. The largest numbers of districts are
included under NFSM-Pulses mainly owing to the fact that the production of pulses has
remained stagnant in the country for past decades in spite of the fact that India happens to
be the largest producer and consumer of pulses. Due to sluggish and erratic growth, the
net per capita per day availability of pulses in India declined from 60 grams in 1951 to 31
grams in 2008. This is despite the fact that several policy initiatives, projects and
programmes with respect to pulses were undertaken in the past viz. All India Coordinated

7
Pulses Improvement Project (AICPIP), National Pulses Development Programme
(NPDP), Technology Mission on Pulses (TMOP), Centrally Sponsored Integrated
Scheme of Oilseeds, Pulses, Oil palm and Maize (ISOPOM), etc. These policies and
programmes hardly led to any improvement in pulses production of India. In order to
raise pulses production by 2 million tonnes by the end of 2011-12, the existing pulses
related programmes were replaced by NFSM-pulses.
At present, the major areas of concern in pulse cultivation are the low yield levels,
marginal lands devoted to pulse cultivation, stagnation in production technology, severe
abiotic (climate-related) and biotic (insect, pest) stresses, volatility of prices and lack of
effective procurement. The present study, therefore, attempts to unravel the degree of
importance of these constraints and outline the prospects for pulses production in the
state of Maharashtra. The study also intends to assess the effectiveness of NFSM-Pulses,
if any, on the pulse production in Maharashtra.
1.6 Objectives of the Study
The study has been undertaken with the following specific objectives:
1. To analyze returns from cultivation of pulses vis-à-vis competing crops
2. To analyze the other major problems and prospects for pulse cultivation, and
3. To assess the impact, if any, of NFSM-Pulses
1.7 Methodology
The methodology includes criteria used for the selection of NFSM and non-
NFSM study districts in the state of Maharashtra, selection of sampled villages and
farmers, and analysis using primary and secondary data, aside from data sources.
1.7.1 Sampling Design
At present, there are 33 pulse-growing districts in the state of Maharashtra.
Among these districts, 18 are covered under National Food Security Mission for Pulse
crops. The NFSM districts for pulses crops mainly encompass Ahmednagar, Akola,
Amravati, Aurangabad, Buldhana, Chandrapur, Hingoli, Jalgaon, Jalna, Latur, Nagpur,
Nanded, Nashik, Osmanabad, Parbhani, Wardha, Washim, and Yavatmal. The non-
NFSM district in the state of Maharashtra include Thane, Raigad, Ratnagiri, Sindhudurg,
Dhule, Nandurbar, Pune, Solapur, Satara, Sangli, Kolhapur, Beed, Bhandara, Gondia and
Gadchiroli. Since the present investigation is confined to the selection of one district from
the umbrella of districts covered under NFSM and another one from the umbrella of
districts not covered under NFSM, the districts under NFSM and non-NFSM were
8
arranged in descending order based on area allocation under pulses crops in 2008-09. The
figures relating to area allocation under pulses crops in 2008-09 for each district were
obtained from the office of Director of Agriculture (Extension and Training –1),
Commissionerate of Agriculture, Maharashtra State, Pune. Amravati under the umbrella
of NFSM districts of Maharashtra showed the highest area allocation under pulses crops
in 2008-09, accounting for 7.28 per cent share in total area allocation under pulses crops
in the State. The district of Amravati was, therefore, selected for the present investigation
and it was considered as sampled NFSM district of Maharashtra. Similarly, Beed under
the umbrella of non-NFSM districts of Maharashtra showed the highest area allocation
under pulses crops in 2008-09, accounting for 3.47 per cent share in total area allocation
under pulses crops in the State. The district of Beed was, therefore, selected for the
present investigation and it was treated as sampled non-NFSM district of Maharashtra.
After selection of NFSM and non-NFSM districts in the state of Maharashtra, the
subsequent selection followed selection of talukas within the selected districts. In order to
select a taluka within the selected districts, a similar procedure was followed and the
talukas of Daryapur in Amravati district and Majalgaon in Beed district were selected for
the further selection of village within the selected talukas. Since the present study is
confined to the selection of only one village from the selected NFSM district of Amravati
and non-NFSM district of Beed, the village of Ramagad from Amravati district and
Majalgaon from Beed district were further selected randomly for the present investigation
subject to the condition that they should be having sufficient area allocation under pulses
crops and that farmers belonging to the selected villages should be having cultivation of
some other competing field and other crops with a view to evaluate the actual impact of
NFSM on pulses vis-à-vis other crops.
A complete enumeration of the two selected villages drawn from the NFSM
district of Amravati and non-NFSM district of Beed was done with view to further
categorization of farmers into marginal (less than 1 hectare), small (1 to 2 hectares),
medium (2-4 hectares) and large (above 4 hectares). Since 50 sampled farmers were
supposed to be selected from each of the sampled two villages belonging to the NFSM
district of Amravati and non-NFSM district of Beed, the probability proportion to sample
size technique was used for further selection of farmers under each of the land holding
size category from the selected sampled villages. The number of sampled
households/farmers in the selected Ramagad village encompassed 15 in marginal

9
category, 19 in small, 10 in medium and 6 in large category with a sum of 50 farmers
drawn from the district of Amravati. Similarly, the number of sampled
households/farmers in the selected Majalgaon village encompassed 14 in marginal
category, 17 in small, 13 in medium and 6 in large category with a sum of 50 farmers
drawn from the district of Beed (Table 1.4).
Table 1.4: Sampled Farmers from the NFSM District of Amravati and Non-NFSM District of Beed
NFSM Amravati District Non-NFSM Beed District H.H. Category
Total No. of Farmers Sampled Farmers Total No. of Farmers Sampled Farmers
Marginal 47 15 278 14
Small 60 19 327 17
Medium 30 10 252 13
Large 18 6 129 6
Total 155 50 986 50
Thus, altogether 50 sampled farmers from NFSM district of Amravati and 50
sampled farmers from non-NFSM district of Beed with a sum of 100 sampled farmers
from the state of Maharashtra were selected for the present investigation.
1.7.2 Data Collection
Primary data from the sampled farmers belonging to NFSM district of Amravati
and non-NFSM district of Beed were collected through the well structured schedule by
personal interview method. In-depth information related to family size and composition,
education status, caste composition, land use pattern, cropping pattern, irrigated area,
sources of irrigation, cost and return structure for various pulses and other crops,
knowledge about improved varieties of pulses, sources of knowledge, area under
improved varieties of pulses, recommended practices followed by farmers in the
cultivation of pulses in terms of sowing practices, seed practices, and other practices,
problems with improved varieties of pulses, suggested solutions for improved varieties of
pulses, etc, farmers’ perceptions with respect to pest problems in the cultivation of
various pulses crops, reasons for cultivation of various pulses crops, criteria used for
allocation of area under pulses crops cultivation, problems confronted in terms of
cultivation of pulses on inferior quality of land, reasons for not growing pulses on
irrigated land, reasons for shifting area from other crops to pulses or vis-a-versa, farmers’
willingness to grow pulses under assured market conditions, farmers’ opinion regarding
problems in the cultivation of pulses, and their suggested solutions with respect to
cultivation of various pulses crops, farmers’ awareness of NFSM for pulses, assistance
received and the type of assistance, usefulness of the assistance, area allocation under
10
pulse crops before and after NFSM programme, production of pulses crops before and
after NFSM programme, increase in area under pulses after NFSM programme, extent of
increase in area under pulse crops, and their major suggestions for improving NFSM-
Pulses programme, etc. was collected from each of the sampled farmers drawn from the
NFSM district of Amravati and non-NFSM district of Beed.
1.7.3 Data Sources
In addition to the collection of primary data from the sampled
households/farmers, secondary data related to various performance indicators viz. area,
production and productivity of various important crops cultivated in the state of
Maharashtra encompassing the period between 1996-97 and 2007-8 were collected from
‘Statistical Division, Commissionerate of Agriculture, Government of Maharashtra,
Pune’. In addition to this, secondary data with respect to broad quantitative parameters of
agricultural sector of the State viz. Gross Cropped Area (GCA), Net Sown Area (NSA),
Net Irrigated Area (NIA), Gross Irrigated Area (GIA), fertilizer consumption in the State,
etc., were also collected from various secondary sources such as “Economic Survey of
Maharashtra”, Directorate of Economics & Statistics, Planning Department, Government
of Maharashtra, Mumbai, “Season and Crop Report”, Commissionerate of Agriculture,
Government of Maharashtra, Pune’.
1.7.4 Reference Period
The reference period for the primary data survey was the period from 2006-07 to
2008-09. The comparative economics (costs and returns) of pulse crops cultivation vis-à-
vis other competing crops cultivation was analyzed for the period from 2006-07 to 2008-
09. The increase in area under pulses, if any, for 2008-09 (after the operationalisation of
NFSM) was also assessed in the present investigation.
1.8 Organization of the Study
The study is organized in VIII chapters. After this introductory Chapter I focusing
on significance of pulses sector in national economy, initiation of various programmes
relating to pulses sector, reasons for launching NFSM-Pulses, and various other
concurrent issues coupled with need of the present study, objectives and methodology of
the study, etc., the analysis with respect to secondary data is presented in Chapter II,
which not only provides information relating to trend estimates for pulses vis-à-vis other
crops cultivated in the state of Maharashtra but also trends with respect to broad
quantitative parameters of agricultural sector of the State. Since the socio-economic

11
characteristics of farmers have a profound influence on the decision making process and
profitability of crop enterprise, the Chapter III deals with the socio-economic profile of
sampled farmers with focus on their family size and composition, education status, caste
composition, land use pattern, cropping pattern, irrigated area, sources of irrigation, etc.
The Chapter IV evaluates the cost and return structure in the cultivation various pulses
crops vis-à-vis other crops cultivated on the farms belonging to NFSM district of
Amravati and non-NFSM district of Beed with a view to assess the extent of profit
margin involved in the cultivation of these crops. The major focus of Chapter V is on
ascertaining responses of sampled farmers with respect to knowledge about improved
varieties of pulses, sources of knowledge, area under improved varieties of pulses,
recommended practices followed by them in the cultivation of pulses, problems with
improved varieties of pulses, suggested solutions for improved varieties of pulses, etc. In
Chapter VI, an attempt is made to analyse the opinion of the sampled farmers with
respect to the major pest problems faced by them, reasons for their cultivation of various
pulses crops, criteria used to allocate area under pulses crops, problems confronted in
pulses cultivation, reasons for shifting area from other crops to pulses, etc. The Chapter
VII mainly evaluates the impact of National Food Security Mission (NFSM) on pulse
crop production with the help of assessing the responses of the sampled farmers with
respect to their awareness of NFSM for pulses, assistance received and the type of
assistance, usefulness of the assistance, area allocation under pulse crops before and after
NFSM programme, production of pulses crops before and after NFSM programme,
increase in area under pulses after NFSM programme, extent of increase in area under
pulse crops, etc. The Chapter VIII summarises the key findings of the study with a
synthesis of policy implications and conclusions arising out of the present investigation.
***********

12
CHAPTER – II
PULSES SECTOR IN THE STATE AND THE DISTRICTS
This chapter provides an insight into the estimates relating to area, production and
productivity of various important crops cultivated in the state of Maharashtra
encompassing the period between 1996-97 and 2007-8. Although growth estimates with
respect to area, production and productivity have been evaluated in general for all the
important crops cultivated in the state of Maharashtra, the primary focus is on evaluating
these growth estimates for various pulses crops, in particular, cultivated across various
districts and regions/divisions of the State during the period from 1996-97 to 2007-08,
and also evaluating share of different districts in pulses crops acreage and production in
the State during the given period of time. This chapter also evaluates trends with respect
to broad quantitative parameters of agricultural sector of the State viz. Gross Cropped
Area (GCA), Net Sown Area (NSA), Net Irrigated Area (NIA), Gross Irrigated Area
(GIA), fertilizer consumption in the State, etc., especially for the period between 1996-97
and 2007-08, besides providing estimates relating to the extent of availability of irrigation
for pulses crops in the State. The major thrust of this chapter is, therefore, on providing
information relating to trend estimates for pulses vis-à-vis other crops cultivated in the
state of Maharashtra, especially during the past one decade.
2.1 Area under Important Crops
The average Gross Cropped Area (GCA) in Maharashtra during the last five years
encompassing the period between 2003-04 and 2007-08 was estimated at 22.47 million
hectares, which included 40.81 per cent area under cereals and 16.15 per cent area under
pulses with a sum of 56.96 per cent area under foodgrains (Table 2.1). The share of other
important crops in GCA of Maharashtra during the same period was estimated at 2.86 per
cent for sugarcane, 13.16 per cent for cotton, 15.52 per cent for oilseeds, and 11.51 per
cent for the crops other than listed in Table 2.1, which chiefly included horticultural
crops. Among various pulses crops, kharif pulses like mung, tur and udid accounted for
10.04 per cent share in GCA of Maharashtra during the given period of time, whereas
rabi pulses like gram showed a share of 4.72 per cent in the same during the given period.
Some other kharif and rabi pulses not enlisted in Table 2.1 accounted for the remaining
1.39 per cent share in GCA of Maharashtra during the given period of time.

13
Table 2.1: Area under Important Crops in Maharashtra: (Average of 2003-04 to 2007-08)
(Area in ‘00’ Hectare)
Crops Area Under the Crop % of Area to GCA
Paddy 15310 6.81
Wheat 9674 4.31
Bajra 14046 6.25
Maize 5045 2.25
T. Jowar 45403 20.21
Ragi 1383 0.62
Total Cereals 91678 40.81
Mung 6248 2.78
Tur 11004 4.90
Udid 5307 2.36
Gram 10614 4.72
Total Pulses 36275 16.15
Foodgrains 127953 56.96
Sugarcane 6423 2.86
Cotton 29558 13.16
Oilseeds 34862 15.52
Others 25855 11.51
Total (GCA) 224650 100.00
Source: Computation are based on the figures/data obtained from ‘Statistical Division, Commissionerate of
Agriculture, Government of Maharashtra, Pune’
In the case of cereal crops, kharif and rabi jowar put together accounted for as
much as 20.21 per cent share in GCA of Maharashtra between 2003-04 and 2007-08. The
other important cereal crops cultivated in Maharashtra were paddy and bajra, each
accounting for 6-7 per cent share in GCA of Maharashtra during the given period of time.
The share of wheat and maize in GCA of Maharashtra was estimated at 4.31 per cent and
2.25 per cent, respectively, during the given period. A marginal presence of ragi was also
noticed in the cropping pattern of Maharashtra, which accounted for only 0.62 per cent
share in GCA of the State during the period between 2003-04 and 2007-08. Thus, the
area predominance or cropping pattern in Maharashtra was found to be invariably in
favour of cultivating jowar among cereals and tur and gram among pulses crops.
Another important feature of the last one decade is the falling share of cereals and
rising share of oilseeds in GCA of Maharashtra (Table 2.1 (a)). The share of cereal crops
in GCA of the State has fallen from 48 per cent in 1996-97 to about 40 per cent in 2007-
08. On the other hand, the share of pulses in GCA of the State has remained by and large
same, and hovered at around 16-17 per cent during the past one decade or so. As a result,
the share of foodgrains in GCA of the State has dropped from 63 per cent in 1996-97 to
about 58 per cent in 2007-08. The oilseed crops have shown rise in their share in GCA of
the State, which increased from 12 per cent in 1996-97 to nearly 17 per cent in 2007-08.
The share of cotton in GCA of the State has remained at around 13-14 per cent between

14
1996-97 and 2007-08. Similarly, share of sugarcane in GCA of the State has remained by
and large constant, and hovered at around 3-4 per cent during the past one decade.
Table 2.1(a): Share of Important Major Crops in GCA in Maharashtra: 1996-97 to 2007-08
(in per cent)
Year Cereals Pulses Foodgrains Sugarcane Cotton Oilseeds Others Total
1996-97 47.67 15.40 63.07 2.88 14.32 12.02 7.70 100.00
1997-98 46.67 16.15 62.83 2.33 14.49 12.51 7.85 100.00
1998-99 45.15 16.71 61.86 2.83 14.94 12.58 7.79 100.00
1999-00 44.73 16.66 61.39 3.10 14.92 12.48 8.11 100.00
2000-01 44.16 16.20 60.36 3.06 13.85 11.62 11.11 100.00
2001-02 41.96 15.71 57.67 2.96 13.86 10.64 14.87 100.00
2002-03 41.23 15.84 57.07 2.56 12.51 11.11 16.75 100.00
2003-04 38.58 15.49 54.07 1.99 12.45 12.44 19.04 100.00
2004-05 41.17 15.14 56.31 1.46 12.69 14.87 14.67 100.00
2005-06 41.24 15.21 56.46 2.22 12.75 16.22 12.36 100.00
2006-07 42.63 16.97 59.60 3.76 13.77 17.12 5.75 100.00
2007-08 40.39 17.91 58.29 4.82 14.10 16.88 5.90 100.00
Source: Computation are based on the figures/data obtained from ‘Statistical Division, Commissionerate of
Agriculture, Government of Maharashtra, Pune’
The past one decade also shows significantly high fluctuations in terms of share
of other crops in GCA of Maharashtra. The share of other crops in GCA of Maharashtra
has fluctuated from as low as 6 per cent in 2007-08 to as high as 19 per cent in 2003-04.
The possible explanation for this could be fluctuations in share of oilseeds, cotton and
foodgrain crops in GCA of the State during the past one decade or so.
2.2 Growth Trends in Important Crops
Growth rate estimates with respect to area, production and yield of various
important crops cultivated in the state of Maharashtra are provided in Table 2.2, which
clearly show varied rates of growth in these parameters for foodgrain, sugarcane, cotton
and oilseed crops during the period between 1996-97 and 2007-08.
Foodgrain crops in general have shown negative growth in their area and positive
growth in their production and yield levels with yield registering faster growth than
production during the past one decade or so. The negative area growth of foodgrains
during the period between 1996-97 and 2007-08 is noticed mainly due to fall in area
under various course cereals in the State during this period. Some of the course cereals
like bajra, jowar and ragi have shown significant fall in their area between 1996-97 and
2007-08. It was only in the case of maize that area growth in the State was positive and
significantly high during the past decade or so. The negative growth in are under jowar in
Maharashtra is a matter of concern since it is one of the major foodgrain crops cultivated
in the State, accounting for as much as 20 per cent share in GCA of the State. The pulse

15
crops of Maharashtra in general have shown a positive area growth mainly due to
significantly high growth in area under gram and tur during the period between 1996-97
and 2007-08. However, among pulses, mung and udid have shown a negative area growth
during the past decade. As for other crops, the area under cotton is seen to have
marginally declined, whereas sugarcane and oilseeds have recorded positive growth in
their area during the given period of time.
Table 2.2: Compound Annual Growth Rates (CAGR) over 1997-2008 (1996-97 to 2007-08) of Area,
Production, Yield of Important Crops in Maharashtra
Area Production Yield Crops
CAGR (%) T-Value (%)CAGR T-Value (%)CAGR T-Value
Paddy 0.19 2.05 0.72 0.57 0.53 0.43
Wheat 2.17 1.20 5.18 1.94 2.94**
2.26
Bajra -3.25* 5.47 -3.43
** 2.26 -0.19 0.15
Maize 10.41* 15.50 15.95
* 8.76 5.02
* 2.78
T. Jowar -1.84* 4.37 -2.94
** 2.37 -1.11 0.90
Ragi -1.91* 10.88 -2.07 2.02 -0.17 0.17
Total Cereals -0.94* 2.96 0.13 0.10 1.08 0.99
Mung -1.01 1.36 -0.96 0.43 0.06 0.03
Tur 0.87* 3.66 3.74 1.79 2.84 1.42
Udid -0.59 0.87 -1.45 0.76 -0.86 0.53
Gram 4.76* 3.76 7.51
* 3.01 2.63 1.84
Total Pulses 0.79 1.95 2.91 1.70 2.11 1.40
Foodgrains -0.47 1.59 0.56 0.45 1.04 0.94
Sugarcane 1.59 0.59 1.97 0.62 0.37 0.35
Cotton -0.54 1.19 7.41* 2.96 8.00
* 3.52
Oilseeds 3.87* 3.99 6.79
* 4.79 2.81
** 2.35
Others 1.27 0.35 - - - - Total (GCA) 0.49
* 4.97 - - - - Source: Computation are based on the figures/data obtained from ‘Statistical Division, Commissionerate of
Agriculture, Government of Maharashtra, Pune’
Note: * and ** represent significance of growth rates at 1 and 5 per cent level of probability
In the state of Maharashtra, although total pulses have recorded an area growth of
0.79 per cent per annum between 1996-97 and 2007-08, this growth in area under pulses
is seen to have been offset by 0.94 per cent annual decline in area under total cereal
crops, resulting in net decline in area under foodgrains at the rate of 0.47 per annum
during the same period. The rise in area under pulses crops is mainly due to 4.76 per cent
annual growth in area under gram and 0.87 per cent annual growth in area under tur since
mung and udid have shown an annual decline in their area at the rate of 1.01 per cent and
0.59 per cent, respectively, during the period between 1996-97 and 2007-08. Sharper
decline in area is noticed in the case of bajra and jowar, which have recorded decline in
their area at the rate of 3.25 per cent and 1.84 per cent, respectively, during the given
period of time.

16
Notably, despite decline in area, majority of foodgrain crops in Maharashtra have
registered a reasonable growth in their production due to rise in their yield levels. For
instance, between 1996-97 and 2007-08, the production of various foodgrains grew at the
rate of 0.56 per cent per annum, which was mainly due to 1.04 per cent annual growth in
their yield levels as the area under these crops declined at the rate of 0.47 per cent per
annum. This is also concomitant from the fact that in spite of 0.94 per cent annual decline
in area under cereal crops, their production grew at the rate of 0.13 per cent per annum
mainly due to 1.08 per cent annual growth in their yield levels during the last one decade.
In the case of pulses, much of the production expansion was due to yield growth rather
than area growth. The production of various pulses in Maharashtra grew at the rate of 2.9
per cent between 1996-97 and 2007-08, which was due to 2.11 per cent annual growth in
their yield levels as the area growth under pulses stood at only 0.79 per cent per annum
during this period.
Interestingly, despite 0.54 per cent annual decline in area under cotton crop, its
production in Maharashtra grew at an alarming rate of 7.4 per cent per annum between
1996-97 and 2007-08, which was mainly owing to 8.0 per cent annual growth in its yield
level during this period. The higher production growth for cotton crop could be attributed
to farmers’ higher dependence on cultivation of Bt cotton, which is high yielding crop.
Another interesting feature of Table 2.2 is the very high growth in area, production and
yield of oilseed crops in Maharashtra. Between 1996-97 and 2007-08, various oilseeds in
Maharashtra showed an annual growth rate of 3.8 per cent in their area, 6.79 per cent in
production and 2.8 per cent in their yield levels. Thus, the production expansion of
oilseeds in Maharashtra is noticed due to area expansion rather than yield, though yield
has also contributed significantly towards rise in oilseed production. Sugarcane crop in
Maharashtra has also shown a positive growth in its area, production and yield during the
last one decade with growth in area being faster than yield growth.
Although the general trend in Maharashtra shows a positive production growth in
cereals, pulses, sugarcane, cotton and oilseed crops during the last one decade or so,
which could be attributed to their higher yield growth, the negative feature of agriculture
sector of Maharashtra is the negative growth in area, production and yield of bajra and
jowar among cereals and udid among pulses. Not only the production of jowar in the
State has fallen from 62 lakh tonnes in 1996-97 to 40 lakh tonnes in 2007-08 but its area
17
also come down from 56 lakh hectares to 41 lakh hectares during this period. This has
adversely affected share of cereals in GCA of Maharashtra.
In fact, the major reason for the falling share of cereals in GCA of Maharashtra
over the last one decade is the sharp decline in share of jowar in GCA of the State, which
has come down from 26 per cent in 1996-97 to as low as 18 per cent in 2007-08. The
share of bajra in GCA of Maharashtra has come down from 9 per cent in 1996-97 to 6 per
cent in 2007-08. Consequently, cereal crops have shown a decline in their share in GCA
of Maharashtra, which has come down from 48 per cent in 1996-97 to 40 per cent in
2007-08. Since Maharashtra is one of the leading producers of jowar in the country,
corrective measures need to be initiated to augment area and production of this important
course cereal in the State. Corrective measures also need to be applied in the case of udid
and bajra so that their production can be augmented.
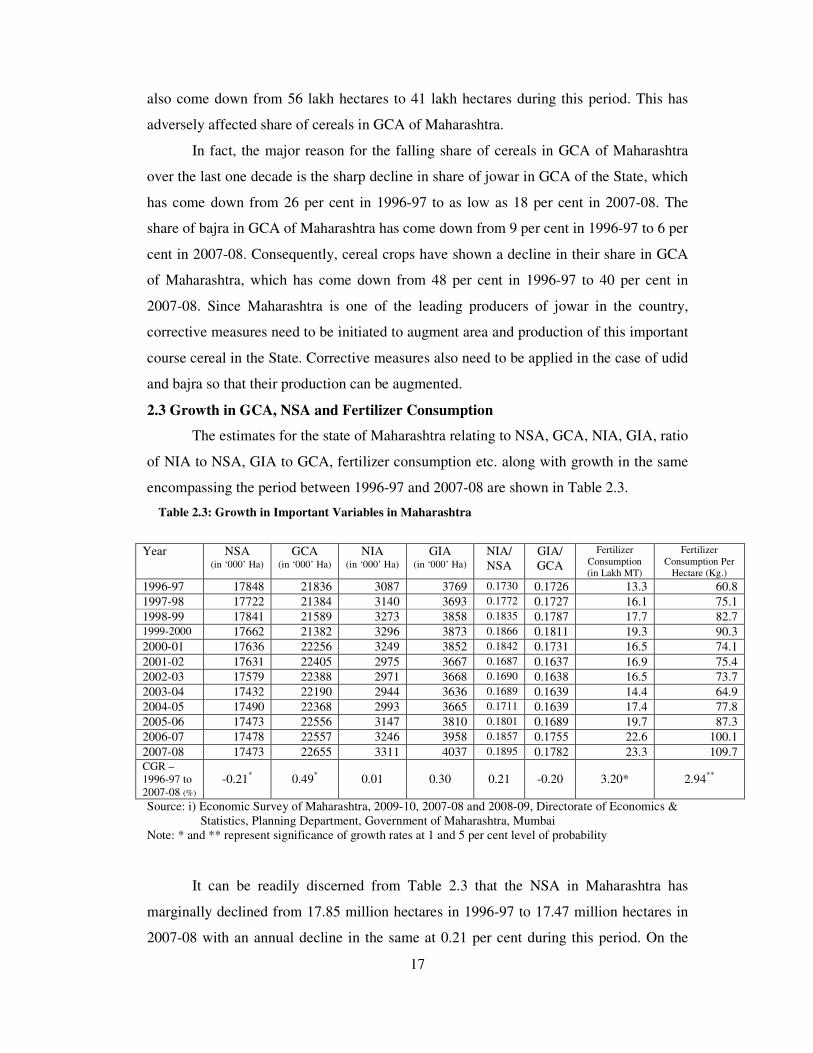
2.3 Growth in GCA, NSA and Fertilizer Consumption
The estimates for the state of Maharashtra relating to NSA, GCA, NIA, GIA, ratio
of NIA to NSA, GIA to GCA, fertilizer consumption etc. along with growth in the same
encompassing the period between 1996-97 and 2007-08 are shown in Table 2.3.
Table 2.3: Growth in Important Variables in Maharashtra
Year NSA
(in ‘000’ Ha)
GCA (in ‘000’ Ha)
NIA (in ‘000’ Ha)
GIA (in ‘000’ Ha)
NIA/
NSA
GIA/
GCA
Fertilizer
Consumption
(in Lakh MT)
Fertilizer
Consumption Per
Hectare (Kg.)
1996-97 17848 21836 3087 3769 0.1730 0.1726 13.3 60.8
1997-98 17722 21384 3140 3693 0.1772 0.1727 16.1 75.1
1998-99 17841 21589 3273 3858 0.1835 0.1787 17.7 82.7
1999-2000 17662 21382 3296 3873 0.1866 0.1811 19.3 90.3
2000-01 17636 22256 3249 3852 0.1842 0.1731 16.5 74.1
2001-02 17631 22405 2975 3667 0.1687 0.1637 16.9 75.4
2002-03 17579 22388 2971 3668 0.1690 0.1638 16.5 73.7
2003-04 17432 22190 2944 3636 0.1689 0.1639 14.4 64.9
2004-05 17490 22368 2993 3665 0.1711 0.1639 17.4 77.8
2005-06 17473 22556 3147 3810 0.1801 0.1689 19.7 87.3
2006-07 17478 22557 3246 3958 0.1857 0.1755 22.6 100.1
2007-08 17473 22655 3311 4037 0.1895 0.1782 23.3 109.7 CGR –
1996-97 to
2007-08 (%)
-0.21* 0.49
* 0.01 0.30 0.21 -0.20 3.20*
2.94
**
Source: i) Economic Survey of Maharashtra, 2009-10, 2007-08 and 2008-09, Directorate of Economics &
Statistics, Planning Department, Government of Maharashtra, Mumbai
Note: * and ** represent significance of growth rates at 1 and 5 per cent level of probability
It can be readily discerned from Table 2.3 that the NSA in Maharashtra has
marginally declined from 17.85 million hectares in 1996-97 to 17.47 million hectares in
2007-08 with an annual decline in the same at 0.21 per cent during this period. On the

18
other hand, the GCA of the State has increased from 21.84 million hectares in 1996-97 to
22.66 million hectares in 2007-08 with an annual growth in the same at 0.49 per cent.
More perceptible increase in GCA of Maharashtra is noticed after 1999-2000. As against
NSA and GCA, the NIA in Maharashtra has fluctuated considerably over the past one
decade. The NIA in Maharashtra though increased from 3.09 million hectares in 1996-97
to 3.30 million hectares in 1999-2000, a decline in the same was noticed after 1999-2000
so much so that it declined to 2.99 million hectares by 2004-05. However, the NIA in
Maharashtra again increased to 3.31 million hectares in 2007-08. Due to significant
fluctuation in NIA over time, there was hardly any overall annual growth in the same
during the period from 1996-97 to 2007-08. However, like GCA, the GIA in Maharashtra
increased from 3.77 million hectares in 1996-97 to 4.04 million hectares in 2007-08 with
an annual growth in the same at 0.30 per cent during this period.
Another important feature of Table 2.3 is the increase in share of NIA in NSA of
Maharashtra, which increased from 17.30 per cent in 1996-97 to 18.95 per cent in 2007-
08 with an annual growth in the same at 0.21 per cent during this period. Contrary to this,
the share of GIA in GCA of Maharashtra though increased from 17.26 per cent in 1996-
97 to 18.11 per cent in 1999-2000, it steadily declined subsequently so much so that it
was estimated at 16.39 per cent in 2005-08. The share of GIA in GCA of the State again
increased after 2005-06 and it was estimated at 17.82 per cent in 2007-08. Due to
fluctuating nature of share of GIA in GCA, there was overall annual decline in the same
to the tune of 0.20 per cent between 1996-97 and 2007-08. In contrast to the growth in
NSA and NIA, the fertilizer consumption in Maharashtra has increased significantly over
time. The consumption of fertilizer in Maharashtra has increased from 13.3 lakh MT in
1996-97 to 16.5 lakh MT in 2002-03, and further to 23.3 lakh MT in 2007-08 with an
annual growth in the same at 3.20 per cent between 1996-97 and 2007-08. The per
hectare fertilizer consumption in Maharashtra has almost doubled between 1996-97 and
2007-08. The per hectare fertilizer consumption in Maharashtra has grown from 61 kg in
1996-97 to as much as 110 kg in 2007-08, showing an annual growth in the same at 2.94
per cent between 1996-97 and 2007-08.
The estimates shown in Table 2.3 clearly underscore the fact that the state of
Maharashtra has shown significant progress not only in terms of rise in GCA but also
with respect to GIA and consumption of fertilizer over time since GCA, GIA and extent
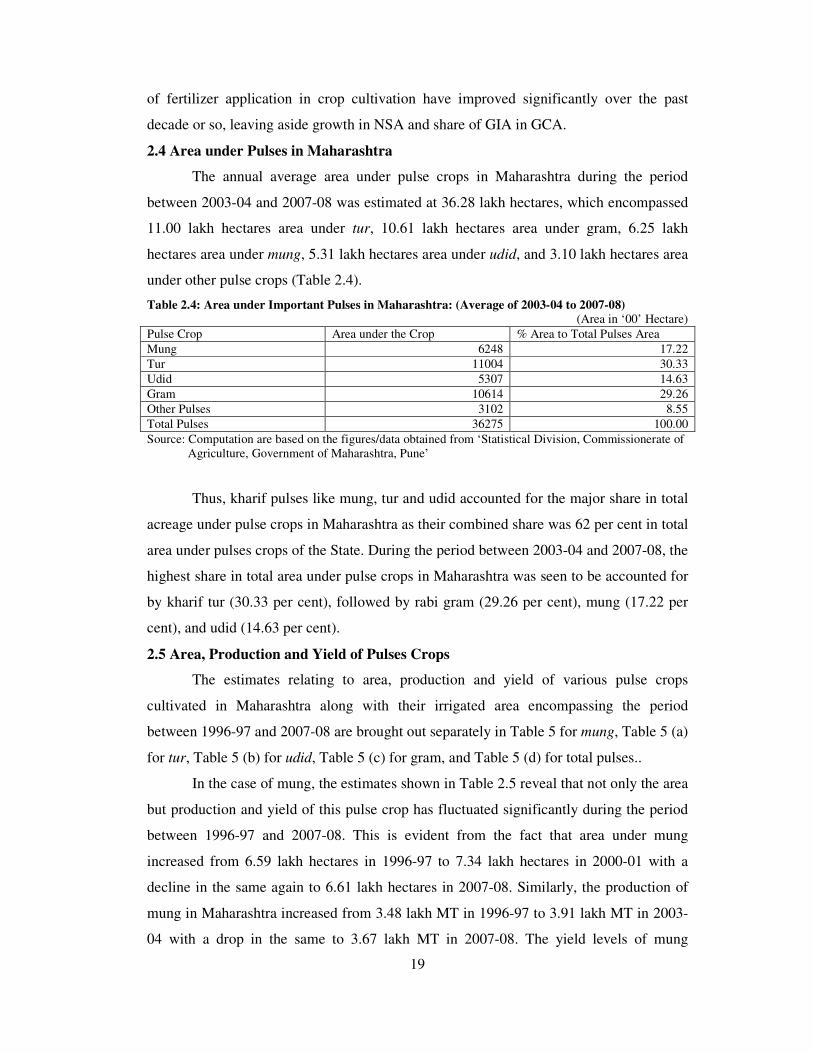
19
of fertilizer application in crop cultivation have improved significantly over the past
decade or so, leaving aside growth in NSA and share of GIA in GCA.
2.4 Area under Pulses in Maharashtra
The annual average area under pulse crops in Maharashtra during the period
between 2003-04 and 2007-08 was estimated at 36.28 lakh hectares, which encompassed
11.00 lakh hectares area under tur, 10.61 lakh hectares area under gram, 6.25 lakh
hectares area under mung, 5.31 lakh hectares area under udid, and 3.10 lakh hectares area
under other pulse crops (Table 2.4).
Table 2.4: Area under Important Pulses in Maharashtra: (Average of 2003-04 to 2007-08)
(Area in ‘00’ Hectare)
Pulse Crop Area under the Crop % Area to Total Pulses Area
Mung 6248 17.22
Tur 11004 30.33
Udid 5307 14.63
Gram 10614 29.26
Other Pulses 3102 8.55
Total Pulses 36275 100.00
Source: Computation are based on the figures/data obtained from ‘Statistical Division, Commissionerate of
Agriculture, Government of Maharashtra, Pune’
Thus, kharif pulses like mung, tur and udid accounted for the major share in total
acreage under pulse crops in Maharashtra as their combined share was 62 per cent in total
area under pulses crops of the State. During the period between 2003-04 and 2007-08, the
highest share in total area under pulse crops in Maharashtra was seen to be accounted for
by kharif tur (30.33 per cent), followed by rabi gram (29.26 per cent), mung (17.22 per
cent), and udid (14.63 per cent).
2.5 Area, Production and Yield of Pulses Crops
The estimates relating to area, production and yield of various pulse crops
cultivated in Maharashtra along with their irrigated area encompassing the period
between 1996-97 and 2007-08 are brought out separately in Table 5 for mung, Table 5 (a)
for tur, Table 5 (b) for udid, Table 5 (c) for gram, and Table 5 (d) for total pulses..
In the case of mung, the estimates shown in Table 2.5 reveal that not only the area
but production and yield of this pulse crop has fluctuated significantly during the period
between 1996-97 and 2007-08. This is evident from the fact that area under mung
increased from 6.59 lakh hectares in 1996-97 to 7.34 lakh hectares in 2000-01 with a
decline in the same again to 6.61 lakh hectares in 2007-08. Similarly, the production of
mung in Maharashtra increased from 3.48 lakh MT in 1996-97 to 3.91 lakh MT in 2003-
04 with a drop in the same to 3.67 lakh MT in 2007-08. The yield levels of mung

20
fluctuated more rapidly than its area and production. The yield level of mung dropped
from 529 kg/ha in 1996-97 to 300 kg/ha in 1997-98, which increased again to 566 kg/ha
in 1998-99 but dropped to 347 kg/ha in 2005-06 with an increase in the same to 556
kg/ha in 2007-08.
Table 2.5: Area, Production, Yield and Irrigated Area under Pulses in Maharashtra: Mung
(Area in ‘00’Ha; Production in ‘00’ MT tonnes; Productivity in Kg/Ha)
Year Area Production Yield Irrigated Area Area under Improved Varieties
1996-97 6587 3482 529 21 NA
1997-98 6472 1939 300 20 NA
1998-99 6711 3800 566 22 NA
1999-00 6684 3127 468 26 NA
2000-01 7342 2598 354 32 NA
2001-02 7232 2968 410 33 NA
2002-03 7117 3437 483 NA NA
2003-04 7001 3905 558 NA NA
2004-05 6560 2278 347 NA NA
2005-06 5338 1891 354 NA NA
2006-07 5731 2361 412 NA NA
2007-08 6608 3671 556 NA NA
Source: i) Based on the figures/data obtained from ‘Statistical Division, Commissionerate of Agriculture,
Government of Maharashtra, Pune’
ii) ‘Season and Crop Report’, 1996-97, 1997-98, 1999-2000, 2000-01, 2001-02, Commissionerate
of Agriculture, Government of Maharashtra, Pune’
Very high yield level fluctuation in mung is disquieting feature of the pulse sector
of the State as it not only affects production of the crop but also its supply to the urban as
well as rural population. The yield level of mung in the State has to be made stable to
make its steady production level, and also with respect to its supply to the consuming
population at reasonable price.
Interestingly, despite the fact that area under mung in Maharashtra has stagnated
over time, the irrigated area under the crop in the State increased with a rise in the same
from 2100 hectares in 1996-97 to 3300 hectares in 2001-02. It may be mentioned that
estimates relating to irrigated area under various pulse crops in Maharashtra are available
only up to 2001-02 and, thereafter, such estimates are not available for any of the pulse
crop cultivated in the State. As for area under improved varieties of pulses in
Maharashtra, the estimates in this respect are not so far available.
Unlike mung, the area under tur in Maharashtra increased from 10.56 lakh
hectares in 1996-97 to 11.59 lakh hectares in 2007-08 (Table 2.5 (a)). The expansion in
production and yield of tur was noticed to be sharper than area expansion under the crop.
The production of tur in Maharashtra increased from 7.13 lakh MT in 1996-97 to 10.76
lakh MT in 2007-08. Similarly, the increase in yield level of tur in Maharashtra was

21
found to be from 675 kg/ha in 1996-97 to 928 kg/ha in 2007-08. However, the irrigated
area under tur was found to decline from about 18,000 hectare in 1996-97 to 16,900
hectares in 2001-02.
Table 5 (a): Area, Production, Yield and Irrigated Area under Pulses in Maharashtra: Tur
(Area in ‘00’Ha; Production in ‘00’ MT tonnes; Productivity in Kg/Ha)
Year Area Production Yield Irrigated Area Area under Improved Varieties
1996-97 10555 7126 675 180 NA
1997-98 10053 3491 347 186 NA
1998-99 10379 8388 808 188 NA
1999-00 10400 8680 835 191 NA
2000-01 10965 6668 608 180 NA
2001-02 10173 7706 757 169 NA
2002-03 10599 7771 733 NA NA
2003-04 10463 6930 662 NA NA
2004-05 10740 6582 613 NA NA
2005-06 10999 7922 720 NA NA
2006-07 11226 8146 726 NA NA
2007-08 11591 10757 928 NA NA
Source: i) Based on the figures/data obtained from ‘Statistical Division, Commissionerate of Agriculture,
Government of Maharashtra, Pune’
ii) ‘Season and Crop Report’, 1996-97, 1997-98, 1999-2000, 2000-01, 2001-02, Commissionerate
of Agriculture, Government of Maharashtra, Pune’
In general, tur crop in Maharashtra has shown quite impressive performance in
terms of rise in area under the crop as well as expansion in production and yield levels
during the past decade or so, leaving aside the area of the crop under irrigation, which has
dropped in course of time.
Another pulse crop cultivated in Maharashtra that has shown quite discouraging
performance in terms of area, production and yield over the past one decade is the udid.
The area under udid was found to decline from 5.42 lakh hectares in 1996-97 to 4.68 lakh
hectares in 2006-07 with an increase in the same to 5.64 lakh hectares in 2007-08 (Table
2.5 (b)). Similarly, the production of udid in Maharashtra declined from 3.31 lakh MT in
1996-97 to 2.00 lakh MT in 2006-07 with a rise in the same to 3.20 lakh MT in 2007-08.
The yield level of udid dropped from 611 kg/ha in 1996-97 to 362 kg/ha in 2000-01 with
a rise in the same to 568 kg/ha in 2007-08. In fact, udid crop in Maharashtra has shown
sharp fluctuations not only in its area but also in production and yield levels during the
period between 1996-97 and 2007-08. As a result, there has been negative annual growth
in area, production and yield of udid in Maharashtra during the period between 1996-97
and 2007-08, with production showing sharper annual decline than area due to
significantly high negative growth in yield of the crop during this period (Table 2.2).
Further, the irrigated area under udid was found to be negligible in Maharashtra. The

22
performance of udid crop in Maharashtra over the last one decade, therefore, has been
disappointing, which require corrective measures.
Table 2.5 (b): Area, Production, Yield and Irrigated Area under Pulses in Maharashtra: Udid
(Area in ‘00’Ha; Production in ‘00’ MT tonnes; Productivity in Kg/Ha)
Year Area Production Yield Irrigated Area Area under Improved Varieties
1996-97 5416 3307 611 3 NA
1997-98 5338 2147 402 3 NA
1998-99 5524 3373 611 3 NA
1999-00 5573 2737 491 4 NA
2000-01 5927 2143 362 6 NA
2001-02 5997 2626 438 6 NA
2002-03 6002 3109 518 NA NA
2003-04 6007 3592 598 NA NA
2004-05 5305 2165 408 NA NA
2005-06 4684 1987 424 NA NA
2006-07 4900 1997 408 NA NA
2007-08 5638 3202 568 NA NA
Source: i) Based on the figures/data obtained from ‘Statistical Division, Commissionerate of Agriculture,
Government of Maharashtra, Pune’
ii) ‘Season and Crop Report’, 1996-97, 1997-98, 1999-2000, 2000-01, 2001-02, Commissionerate
of Agriculture, Government of Maharashtra, Pune’
Among various pulses crops cultivated in Maharashtra, gram is noticed to be the
only crop, which has shown sharp increase in area, production and yield during the past
one decade. Between 1996-97 and 2007-08, while area under gram has nearly doubled,
the rise in production for this crop is found to be more than two and a half folds during
this period. The area under gram in Maharashtra increased from 6.96 lakh hectares in
1996-97 to as much as 13.53 lakh hectares in 2007-08 (Table 2.5 (c)). The expansion in
production of gram in Maharashtra was sharper and it increased from 4.63 lakh MT in
1996-97 to as much as 11.16 lakh MT in 2007-08. As against expansion in area and
production, the rise in yield level of gram was slower and it increased from 666 kg/ha in
1996-97 to 824 kg/ha in 2007-08.
Table 2.5 (c): Area, Production, Yield and Irrigated Area under Pulses in Maharashtra: Gram (Area in ‘00’Ha; Production in ‘00’ MT tonnes; Productivity in Kg/Ha)
Year Area Production Yield Irrigated Area Area under Improved Varieties
1996-97 6957 4630 666 2420 NA
1997-98 7068 2842 402 2473 NA
1998-99 9049 5632 622 2559 NA
1999-00 9118 5865 643 2448 NA
2000-01 7892 4121 522 2297 NA
2001-02 7563 4505 596 1941 NA
2002-03 7962 4211 529 NA NA
2003-04 7952 4211 530 NA NA
2004-05 8299 4662 562 NA NA
2005-06 10204 7052 691 NA NA
2006-07 13081 9251 707 NA NA
2007-08 13533 11157 824 NA NA
Source: i) Based on the figures/data obtained from ‘Statistical Division, Commissionerate of Agriculture,
Government of Maharashtra, Pune’
ii) ‘Season and Crop Report’, 1996-97, 1997-98, 1999-2000, 2000-01, 2001-02, Commissionerate
of Agriculture, Government of Maharashtra, Pune’
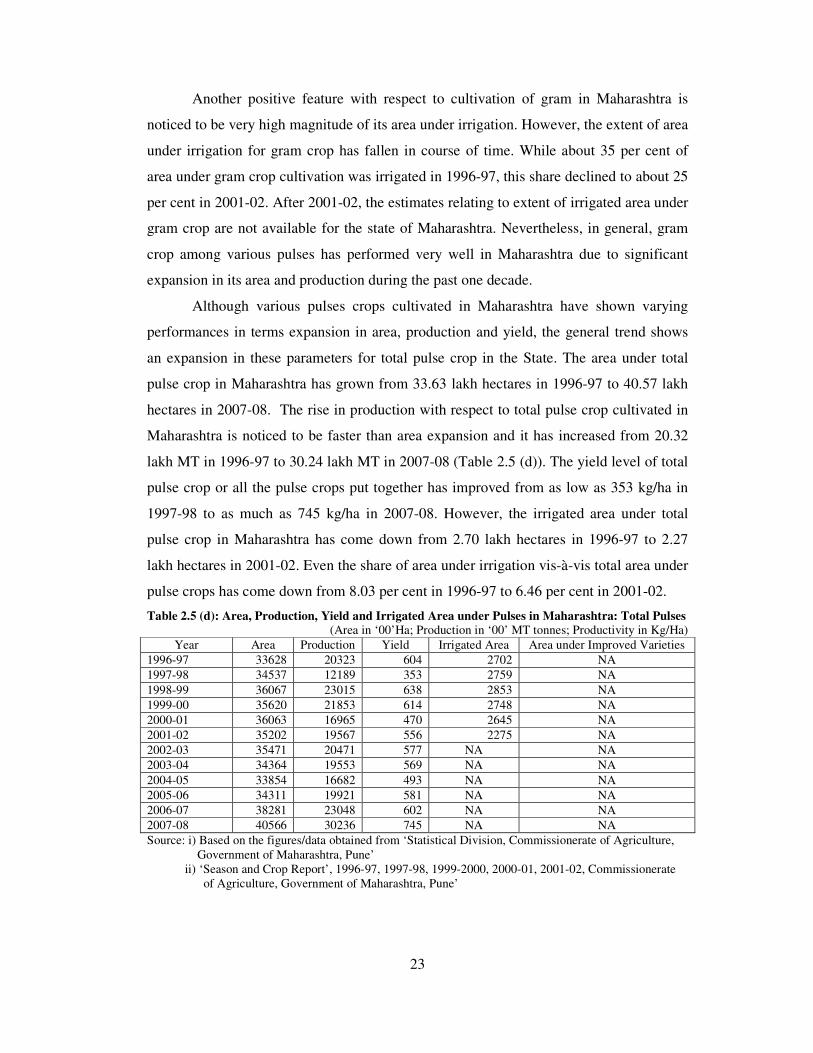
23
Another positive feature with respect to cultivation of gram in Maharashtra is
noticed to be very high magnitude of its area under irrigation. However, the extent of area
under irrigation for gram crop has fallen in course of time. While about 35 per cent of
area under gram crop cultivation was irrigated in 1996-97, this share declined to about 25
per cent in 2001-02. After 2001-02, the estimates relating to extent of irrigated area under
gram crop are not available for the state of Maharashtra. Nevertheless, in general, gram
crop among various pulses has performed very well in Maharashtra due to significant
expansion in its area and production during the past one decade.
Although various pulses crops cultivated in Maharashtra have shown varying
performances in terms expansion in area, production and yield, the general trend shows
an expansion in these parameters for total pulse crop in the State. The area under total
pulse crop in Maharashtra has grown from 33.63 lakh hectares in 1996-97 to 40.57 lakh
hectares in 2007-08. The rise in production with respect to total pulse crop cultivated in
Maharashtra is noticed to be faster than area expansion and it has increased from 20.32
lakh MT in 1996-97 to 30.24 lakh MT in 2007-08 (Table 2.5 (d)). The yield level of total
pulse crop or all the pulse crops put together has improved from as low as 353 kg/ha in
1997-98 to as much as 745 kg/ha in 2007-08. However, the irrigated area under total
pulse crop in Maharashtra has come down from 2.70 lakh hectares in 1996-97 to 2.27
lakh hectares in 2001-02. Even the share of area under irrigation vis-à-vis total area under
pulse crops has come down from 8.03 per cent in 1996-97 to 6.46 per cent in 2001-02.
Table 2.5 (d): Area, Production, Yield and Irrigated Area under Pulses in Maharashtra: Total Pulses
(Area in ‘00’Ha; Production in ‘00’ MT tonnes; Productivity in Kg/Ha)
Year Area Production Yield Irrigated Area Area under Improved Varieties
1996-97 33628 20323 604 2702 NA
1997-98 34537 12189 353 2759 NA
1998-99 36067 23015 638 2853 NA
1999-00 35620 21853 614 2748 NA
2000-01 36063 16965 470 2645 NA
2001-02 35202 19567 556 2275 NA
2002-03 35471 20471 577 NA NA
2003-04 34364 19553 569 NA NA
2004-05 33854 16682 493 NA NA
2005-06 34311 19921 581 NA NA
2006-07 38281 23048 602 NA NA
2007-08 40566 30236 745 NA NA
Source: i) Based on the figures/data obtained from ‘Statistical Division, Commissionerate of Agriculture,
Government of Maharashtra, Pune’
ii) ‘Season and Crop Report’, 1996-97, 1997-98, 1999-2000, 2000-01, 2001-02, Commissionerate
of Agriculture, Government of Maharashtra, Pune’

24
Despite very low proportion of area under irrigation, pulse crops in Maharashtra,
in general, have performed very well with respect to growth in their area, production and
yield during the past one decade or so. This holds specifically true in the case of some of
the pulse crops like gram and tur, which occupy major share in total pulse crop
cultivation in the State.
2.6 Share of Districts in Area and Production of Pulses
Although pulse crops are cultivated across almost all the districts of Maharashtra,
their concentration is noticed mainly in those districts that either lack in terms of
irrigation facilities or completely fall under rainfed conditions. At present, there are 34
districts in Maharashtra and these districts belong to eight divisions of the State viz.
Konkan, Nashik, Pune, Kolhapur, Aurangabad, Latur, Amravati and Nagpur. The
districts belonging to Amravati, Latur, Aurangabad, Nagpur and Nashik account for bulk
of the area and production of various pulse crops in the state of Maharashtra. The annual
average estimates of area and production of various pulse crops cultivated in various
districts of Maharashtra during the period between 1996-97 and 2007-08 are brought out
separately for mung, tur, udid and gram in Table 2.6 and for total pulses in Table 2.6 (a).
The annual average area under mung crop in Maharashtra during the period
between 1996-97 and 2007-08 was estimated at 6.62 lakh hectares. The annual average
production of mung crop during the same period was estimated at 2.96 lakh MT (Table
2.6). The districts belonging to Amravati, Latur and Nashik divisions accounted for bulk
of the area and production of mung crop in the State during the given period of time. The
districts belonging to these three divisions put together showed as much as more than 80
per cent share in total area and production of mung crop in Maharashtra between 1996-97
and 2007-08. Another division showing significant share in terms of area and production
of mung in Maharashtra was Aurangabad. The districts belonging to Aurangabad showed
about 11 per cent share in total area and production of mung crop in the State. The
remaining area and production of mung in Maharashtra was accounted for by other
divisions viz. Konkan, Kolhapur, Pune and Nagpur.
The area and production concentration of tur was noticed in those districts that
belonged to Amravati, Latur, Nagpur and Aurangabad divisions of Maharashtra. The
annual average area under tur crop was estimated at 10.68 lakh hectares and production at
7.51 lakh MT during the period between 1996-97 and 2007-08. The districts belonging to
Amravati, Latur, Nagpur and Aurangabad divisions alone accounted for 87 per cent of

25
total area and 91 per cent of total production of tur crop during the given period of time.
Another division showing significant share in area and production of tur crop was Nashik
Among various districts, the highest area under tur crop in Maharashtra was noticed in
Amravati district with a share of about 9 per cent in total area of the crop. Similarly,
Amravati district also showed highest production of tur crop with share of about 11 per
cent in total production of the crop in Maharashtra.
Table 2.6: Share of Districts in Total Area and Production of All Major Pulses Crops in
Maharashtra: Average of 1996-97 to 2007-08 (Area in ‘00’Ha; Production in ‘00’ MT tonnes; Share in %)
Districts/
Divisions Mung Tur Udid Gram
Area Share Prod. Share Area Share Prod. Share Area Share Prod. Share Area Share Prod. Share
Thane 7 0.10 4 0.14 29 0.27 16 0.21 50 0.90 39 1.43 39 0.43 26 0.45
Raigad 4 0.06 2 0.07 11 0.10 6 0.08 7 0.13 6 0.21 19 0.21 13 0.22
Ratnagiri 2 0.03 1 0.05 5 0.05 3 0.04 4 0.07 4 0.15 0 0.00 0 0.00
Sindhudurg 1 0.02 1 0.04 0 0.00 0 0.00 4 0.06 3 0.10 0 0.00 0 0.00
Konkan Div. 347 5.24 341 11.55 45 0.42 25 0.33 64 1.16 51 1.89 60 0.66 39 0.69
Nashik 88 1.33 63 2.14 90 0.85 53 0.71 124 2.25 94 3.49 426 4.70 260 4.58
Dhule 238 3.60 163 5.51 115 1.08 58 0.78 134 2.43 99 3.67 177 1.96 129 2.27
Nandurbar 161 2.43 96 3.24 233 2.18 108 1.44 202 3.65 125 4.63 150 1.65 101 1.77
Jalgaon 377 5.71 190 6.43 264 2.47 166 2.20 579 10.48 309 11.46 473 5.22 402 7.09
Nashik Div. 864 13.07 512 17.32 703 6.58 365 4.86 1002 18.13 603 22.35 1200 13.25 874 15.39
Ahmednagar 148 2.24 64 2.17 160 1.50 78 1.04 40 0.72 16 0.61 624 6.89 367 6.46
Pune 71 1.07 32 1.09 41 0.38 23 0.30 23 0.42 17 0.64 486 5.36 297 5.24
Solapur 30 0.45 16 0.56 240 2.24 83 1.10 48 0.86 27 1.02 386 4.26 213 3.74
Pune Div. 249 3.76 113 3.83 440 4.12 184 2.44 111 2.00 61 2.26 1495 16.51 877 15.44
Satara 52 0.79 28 0.96 63 0.59 25 0.34 45 0.82 28 1.03 248 2.74 153 2.69
Sangli 62 0.94 30 1.01 123 1.15 50 0.66 74 1.34 46 1.71 277 3.06 198 3.48
Kolhapur 22 0.33 11 0.36 28 0.26 11 0.15 30 0.55 18 0.66 113 1.25 84 1.48
Kolhapur Div. 136 2.06 69 2.33 214 2.00 86 1.15 150 2.71 92 3.40 638 7.05 435 7.65
Aurangabad 125 1.89 58 1.96 413 3.87 186 2.47 62 1.13 40 1.48 417 4.61 247 4.36
Jalna 506 7.65 229 7.74 474 4.44 262 3.49 177 3.21 92 3.42 153 1.68 89 1.56
Beed 125 1.88 48 1.63 489 4.58 242 3.22 96 1.74 45 1.66 278 3.07 146 2.57
Aurangabad Div. 756 11.42 335 11.33 1376 12.89 690 9.18 335 6.07 177 6.56 848 9.36 482 8.49
Latur 257 3.88 65 2.20 714 6.69 525 6.98 753 13.62 227 8.41 405 4.47 218 3.84
Osmanabad 180 2.73 51 1.73 820 7.68 472 6.28 436 7.90 143 5.28 544 6.01 271 4.78
Nanded 379 5.73 157 5.31 526 4.92 398 5.30 550 9.95 257 9.51 364 4.02 218 3.83
Parbhani 677 10.23 213 7.20 599 5.61 302 4.02 184 3.34 67 2.49 461 5.09 246 4.33
Hingoli 218 3.30 97 3.28 258 2.41 194 2.58 182 3.29 82 3.05 269 2.97 162 2.86
Latur Div. 1693 25.59 576 19.50 2811 26.32 1857 24.71 2062 37.31 764 28.31 1985 21.92 1088 19.17
Buldhana 737 11.15 366 12.40 604 5.66 425 5.65 686 12.41 345 12.78 395 4.37 270 4.75
Akola 684 10.34 319 10.79 544 5.09 479 6.37 270 4.89 150 5.57 391 4.32 283 4.98
Washim 479 7.24 275 9.30 431 4.03 402 5.34 524 9.48 323 11.97 331 3.66 223 3.92
Amravati 604 9.13 228 7.72 917 8.59 806 10.73 82 1.48 36 1.32 501 5.53 397 6.99
Yavatmal 413 6.24 184 6.23 1199 11.23 1154 15.36 206 3.73 98 3.63 287 3.17 205 3.61
Amravati Div. 2918 44.10 1372 46.44 3695 34.60 3202 42.61 1667 30.17 889 32.92 1873 20.68 1352 23.81
Wardha 10 0.16 5 0.16 537 5.03 522 6.94 5 0.09 2 0.08 230 2.54 133 2.34
Nagpur 26 0.39 11 0.36 514 4.81 338 4.50 24 0.44 10 0.36 422 4.65 251 4.43
Bhandara 37 0.57 15 0.52 77 0.72 57 0.76 51 0.92 24 0.90 66 0.73 32 0.55
Gondia 17 0.25 10 0.32 44 0.41 37 0.49 9 0.17 4 0.14 33 0.36 15 0.26
Chandrapur 45 0.68 20 0.68 269 2.52 145 1.93 34 0.62 16 0.61 178 1.97 87 1.53
Gadchiroli 18 0.27 8 0.27 23 0.21 17 0.22 16 0.29 8 0.28 36 0.39 16 0.29
Nagpur Div. 150 2.27 67 2.26 1459 13.67 1106 14.72 135 2.45 62 2.31 957 10.56 531 9.36
Maharashtra 6615 100.0 2955 100.0 10679 100.0 7514 100.0 5526 100.0 2699 100.0 9057 100.0 5678 100.0
Source: Computation are based on the figures/data obtained from ‘Statistical Division, Commissionerate of
Agriculture, Government of Maharashtra, Pune’
26
The cultivation of udid was mainly confined to Amravati, Latur and Nashik
divisions. During the period between 1996-97 and 2007-08, the annual average area
under udid crop in Maharashtra was estimated at 5.53 lakh hectares and production at
2.70 lakh MT. The districts belonging to Amravati, Latur and Nashik showed bulk of the
area and production of udid crop in Maharashtra with their combined share being 86 per
cent in terms of area and 84 per cent with respect to production udid in Maharashtra.
Some of the districts like Latur, Osmanabad, Buldhana, Nanded, and Jalgaon showed as
much as 10-12 per cent share in total area and production of udid in Maharashtra. Thus,
cultivation of udid was not only confined to few divisions but also quite a few districts of
Maharashtra as majority of the districts in the State had marginal presence in terms of its
cultivation and contribution towards total production.
Unlike mung, tur and udid, the rabi pulse like gram was found to be cultivated in
most of the districts of Maharashtra. However, its concentration in terms of area and
production was found in those districts that belonged to Amravati, Latur, Pune, Nashik,
and Nagpur divisions of Maharashtra. During the period between 1996-97 and 2007-08,
out of the total annual average area of 9.06 lakh hectares under gram crop, 21 per cent
belonged to Amravati division, 22 per cent to Latur, 17 per cent to Pune, 13 per cent to
Nashik and 11 per cent to Nagpur division of Maharashtra. Similarly, during the same
period, out of the total annual production of 5.68 lakh MT of gram crop, 24 per cent
belonged to Amravati division, 19 per cent to Latur, 15 per cent each to Pune and Nashik
divisions, and 9 per cent to Nagpur division of Maharashtra. Thus, the districts belonging
to Amravati, Latur, Pune, Nashik and Nagpur divisions showed 83 per cent share in area
and production gram crop in Maharashtra during the given period of time.
In general, pulse crop cultivation in Maharashtra was confined mainly to five
divisions of Maharashtra viz. Amravati, Latur, Aurangabad, Nashik and Nagpur. The
districts belonging to these five divisions showed as much as 85 per cent share in total
area and 87 per cent share in total production of total pulse crops of Maharashtra (Table
2.6 (a)). During the period between 1996-97 and 2007-08, out of the total annual average
area of 35.66 lakh hectares under total pulse crops, 28 per cent area belonged to Amravati
division, 24 per cent to Latur, 10 per cent to Aurangabad, 12 per cent to Nashik and 10
per cent to Nagpur division of Maharashtra. Similarly, during the same period, out of the
total annual production of 20.32 lakh MT of total pulse crop, 33 per cent production
belonged to Amravati division, 22 per cent to Latur, 9 per cent to Aurangabad, 13 per

27
cent to Nashik, and 10 per cent to Nagpur division of Maharashtra. This clearly shows
predominance of Amravati and Latur divisions not only in terms of area but also
production of pulse crop in Maharashtra. The combined share of Amravati and Latur
divisions in terms of both area and production of pulse crops is more than 50 per cent in
Maharashtra with rest area and production being accounted for by other divisions.
Table 2. 6 (a): Share of Districts in Total Area and Production of Total Pulses Crops in
Maharashtra: Average of 1996-97 to 2007-08 (Area in ‘00’Ha; Production in ‘00’ MT tonnes; Share in %)
Total Pulses Total Pulses Districts/Divisions
Area % Share Production % Share
Thane 182 0.51 110 0.54
Raigad 125 0.35 62 0.30
Ratnagiri 63 0.18 31 0.15
Sindhudurg 47 0.13 22 0.11
Konkan Division 416 1.17 225 1.11
Nashik 1003 2.81 579 2.85
Dhule 821 2.30 491 2.42
Nandurbar 862 2.42 464 2.28
Jalgaon 1774 4.97 1101 5.42
Nashik Division 4312 12.09 2546 12.53
Ahmednagar 1182 3.31 600 2.95
Pune 832 2.33 451 2.22
Solapur 866 2.43 400 1.97
Pune Division 2880 8.08 1451 7.14
Satara 883 2.47 425 2.09
Sangli 881 2.47 454 2.24
Kolhapur 262 0.74 151 0.74
Kolhapur Division 2026 5.68 1030 5.07
Aurangabad 1109 3.11 570 2.80
Jalna 1450 4.07 734 3.61
Beed 1103 3.09 530 2.61
Aurangabad Division 3662 10.27 1833 9.02
Latur 2202 6.17 1075 5.29
Osmanabad 2025 5.68 977 4.81
Nanded 1842 5.16 1057 5.20
Parbhani 1954 5.48 854 4.21
Hingoli 944 2.65 549 2.70
Latur Division 8744 24.52 4419 21.75
Buldhana 2548 7.14 1391 6.84
Akola 1910 5.36 1230 6.05
Washim 1773 4.97 1218 5.99
Amravati 2148 6.02 1477 7.27
Yavatmal 2129 5.97 1641 8.08
Amravati Division 10133 28.41 6742 33.18
Wardha 796 2.23 636 3.13
Nagpur 1073 3.01 1022 5.03
Bhandara 435 1.22 217 1.07
Gondia 186 0.52 98 0.48
Chandrapur 815 2.29 379 1.87
Gadchiroli 231 0.65 104 0.51
Nagpur Division 3490 9.79 2073 10.20
Maharashtra State 35664 100.00 20319 100.00
Source: Computation are based on the figures/data obtained from ‘Statistical Division, Commissionerate of
Agriculture, Government of Maharashtra, Pune’

28
As for area and production of pulse crops in Maharashtra, some of the districts
alone have shown very high share. Important among these are Buldhana, Amravati and
Yavatmal districts belonging to Amravati division, and Latur, Osmanabad, Nanded and
Parbhani districts belonging to Latur division of Maharashtra. These districts alone have
shown 5-6 per cent share in area and production of pulse crop in Maharashtra during the
period between 1996-97 and 2007-08. The districts belonging to Konkan division have
shown the lowest share in terms of area and production of pulse crop in Maharashtra
during the given period of time.
2.7 District-wise Growth in A, P, Y of Pulses
District-wise growth rate estimates with respect to area, production and yield of
various pulses crops cultivated in Maharashtra during the period between 1996-97 and
2007-08 are brought out separately for mung, tur, udid and gram, and also for total pulses
cultivated in the State. The annual average growth rate estimates with respect to area,
production and yield of mung crop for different districts as well as divisions of
Maharashtra encompassing the period from 1996-97 to 2007-08 are shown in Table 2.7.
The observance of trend over the last one decade shows negative area growth for
mung crop across almost all the districts of Maharashtra with negative annual growth in
area under mung crop being sharper in districts like Bhandara, Chandrapur, Gadchiroli,
Kolhapur, Raigad, and Thane. These districts have shown 15-30 per cent annual decline
in area under mung crop in Maharashtra. In fact, districts belonging to Nagpur and
Konkan divisions have shown very high magnitude of annual decline in area under mung
crop in Maharashtra, which may not be a matter of serious concern due to their very low
share in total area under mung crop of the State. However, decline in area under mung
crop in districts belonging to Amravati and Latur divisions is certainly a matter of
concern due to their significantly high share in total area under mung crop of the State.
Although Nashik division of Maharashtra shows 1.00 per cent annual growth in area
under mung crop in Maharashtra during the period between 1996-97 and 2007-08, the
annual decline in area under this crop at the rate of 2.81 per cent in Amravati division,
0.62 per cent in Latur division, and 3.43 per cent in Aurangabad division has resulted in
overall annual decline in area under mung crop in Maharashtra at the rate of 1.01 per cent
during this period, indicating the positive annual growth in area under mung crop in
Nashik division being nullifying due to negative annual growth in the same in majority of
the districts of Maharashtra during the given period of time.
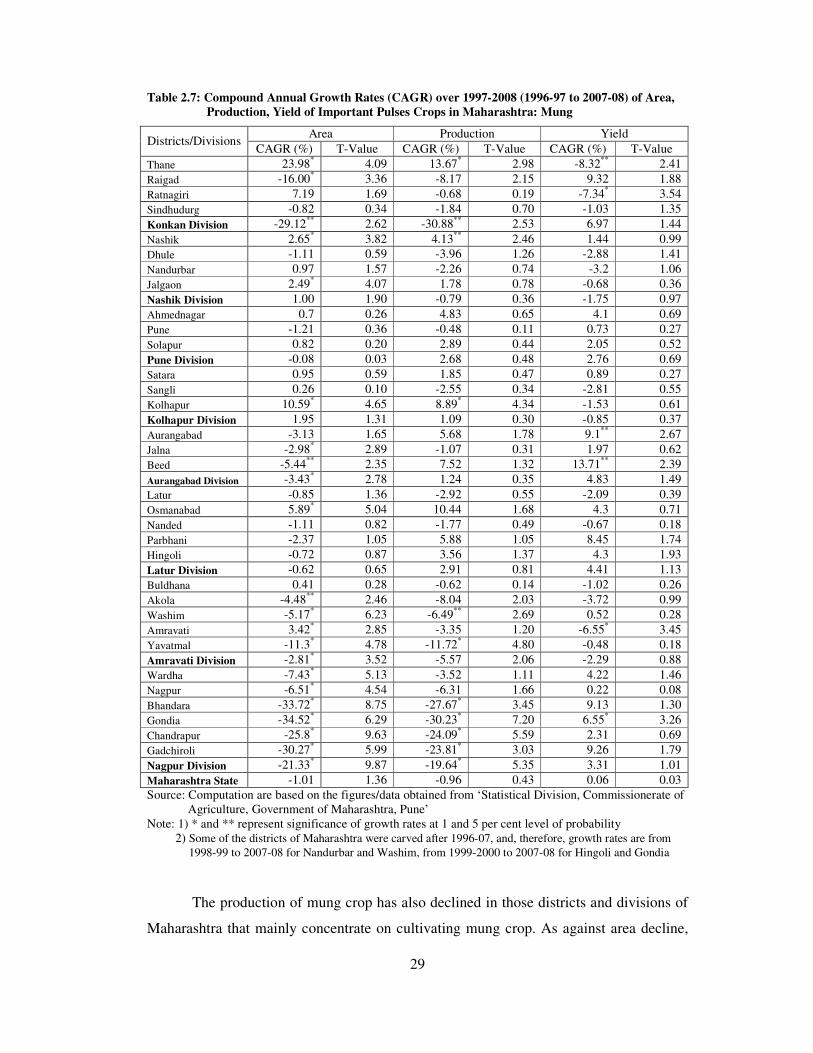
29
Table 2.7: Compound Annual Growth Rates (CAGR) over 1997-2008 (1996-97 to 2007-08) of Area,
Production, Yield of Important Pulses Crops in Maharashtra: Mung
Area Production Yield Districts/Divisions
CAGR (%) T-Value CAGR (%) T-Value CAGR (%) T-Value
Thane 23.98* 4.09 13.67
* 2.98 -8.32
** 2.41
Raigad -16.00* 3.36 -8.17 2.15 9.32 1.88
Ratnagiri 7.19 1.69 -0.68 0.19 -7.34* 3.54
Sindhudurg -0.82 0.34 -1.84 0.70 -1.03 1.35
Konkan Division -29.12** 2.62 -30.88** 2.53 6.97 1.44
Nashik 2.65* 3.82 4.13
** 2.46 1.44 0.99
Dhule -1.11 0.59 -3.96 1.26 -2.88 1.41
Nandurbar 0.97 1.57 -2.26 0.74 -3.2 1.06
Jalgaon 2.49* 4.07 1.78 0.78 -0.68 0.36
Nashik Division 1.00 1.90 -0.79 0.36 -1.75 0.97
Ahmednagar 0.7 0.26 4.83 0.65 4.1 0.69
Pune -1.21 0.36 -0.48 0.11 0.73 0.27
Solapur 0.82 0.20 2.89 0.44 2.05 0.52
Pune Division -0.08 0.03 2.68 0.48 2.76 0.69
Satara 0.95 0.59 1.85 0.47 0.89 0.27
Sangli 0.26 0.10 -2.55 0.34 -2.81 0.55
Kolhapur 10.59* 4.65 8.89
* 4.34 -1.53 0.61
Kolhapur Division 1.95 1.31 1.09 0.30 -0.85 0.37
Aurangabad -3.13 1.65 5.68 1.78 9.1**
2.67
Jalna -2.98* 2.89 -1.07 0.31 1.97 0.62
Beed -5.44**
2.35 7.52 1.32 13.71**
2.39
Aurangabad Division -3.43* 2.78 1.24 0.35 4.83 1.49
Latur -0.85 1.36 -2.92 0.55 -2.09 0.39
Osmanabad 5.89* 5.04 10.44 1.68 4.3 0.71
Nanded -1.11 0.82 -1.77 0.49 -0.67 0.18
Parbhani -2.37 1.05 5.88 1.05 8.45 1.74
Hingoli -0.72 0.87 3.56 1.37 4.3 1.93
Latur Division -0.62 0.65 2.91 0.81 4.41 1.13
Buldhana 0.41 0.28 -0.62 0.14 -1.02 0.26
Akola -4.48**
2.46 -8.04 2.03 -3.72 0.99
Washim -5.17* 6.23 -6.49
** 2.69 0.52 0.28
Amravati 3.42* 2.85 -3.35 1.20 -6.55
* 3.45
Yavatmal -11.3* 4.78 -11.72
* 4.80 -0.48 0.18
Amravati Division -2.81* 3.52 -5.57 2.06 -2.29 0.88
Wardha -7.43* 5.13 -3.52 1.11 4.22 1.46
Nagpur -6.51* 4.54 -6.31 1.66 0.22 0.08
Bhandara -33.72* 8.75 -27.67
* 3.45 9.13 1.30
Gondia -34.52* 6.29 -30.23
* 7.20 6.55
* 3.26
Chandrapur -25.8* 9.63 -24.09
* 5.59 2.31 0.69
Gadchiroli -30.27* 5.99 -23.81* 3.03 9.26 1.79
Nagpur Division -21.33* 9.87 -19.64
* 5.35 3.31 1.01
Maharashtra State -1.01 1.36 -0.96 0.43 0.06 0.03
Source: Computation are based on the figures/data obtained from ‘Statistical Division, Commissionerate of
Agriculture, Government of Maharashtra, Pune’
Note: 1) * and ** represent significance of growth rates at 1 and 5 per cent level of probability
2) Some of the districts of Maharashtra were carved after 1996-07, and, therefore, growth rates are from
1998-99 to 2007-08 for Nandurbar and Washim, from 1999-2000 to 2007-08 for Hingoli and Gondia
The production of mung crop has also declined in those districts and divisions of
Maharashtra that mainly concentrate on cultivating mung crop. As against area decline,

30
the annual decline in production of mung crop in Amravati division of Maharashtra is
noticed to be sharper at 5.57 per cent during the period between 1996-97 and 2007-08.
However, districts belonging to Latur division of Maharashtra have shown a positive 2.91
per cent annual growth in production of mung during the period between 1996-97 and
2007-08 despite 0.62 per cent annual decline in area during this period, which should be
attributed to 4.41 per cent annual yield growth of mung in this division during this period.
Even districts belonging to Aurangabad division have shown 1.24 per cent annual growth
in production of mung despite 3.43 per cent annual decline in area under this crop during
the given period of time, which again can be attributed to 4.83 per cent annual yield
growth of mung in this division during the given period. However, despite positive and
significantly high annual production growth of mung in districts belonging to Latur and
Aurangabad divisions, the overall annual production growth in mung crop turned out to
be negative and estimated at 0.96 per cent between 1996-97 and 2007-08 mainly due to
sharp annual decline in production of mung in almost all the districts belonging to
Amravati division, which alone account for more than 46 per cent share in total
production of mung crop of Maharashtra. The marginal positive annual yield growth of
mung between 1996-97 and 2007-08 has not made any effect in production growth of this
crop in Maharashtra during the given period of time.
As against the fall in area under mung, the area under tur crop in Maharashtra has
increased significantly with an annual growth rate of 0.87 per cent between 1996-97 and
2007-08, which could be attributed to higher growth in area under this crop in districts
belonging to Amravati, Latur, Nagpur and Aurangabad divisions that account for major
share in total area under tur crop of the State (Table 2.8). Although some of the districts
of Maharashtra show very high negative area growth under tur crop, this negative area
growth has not affected overall annual growth in area under tur crop in Maharashtra
mainly due to the fact that the share of these districts is not much in total area of tur crop
under cultivation in the State.
Interestingly, the production and yield growth of tur in Maharashtra is much faster
than area growth under the crop during the period between 1996-97 and 2007-08. The
annual production expansion of tur crop in Maharashtra at the rate of 3.74 per cent during
the given period of time is mainly contributed by districts that have significant presence
of the cultivation of tur crop viz. Nagpur, Wardha, Parbhani, Nanded, Osmanabad, Latur,
Jalna, Beed and Aurangabad. These districts have shown 5-10 per cent annual production

31
growth of tur during the past one-decade. However, some of the major tur crop producing
districts like Amravati and Yavatmal showed less than 1 per cent annual production
growth of tur mainly due to negative yield growth of the crop during the given period.
Table 2.8: Compound Annual Growth Rates (CAGR) over 1997-2008 (1996-97 to 2007-08) of Area,
Production, Yield of Important Pulses Crops in Maharashtra: Tur
Area Production Yield Districts/Divisions
CAGR (%) T-Value CAGR (%) T-Value CAGR (%) T-Value
Thane -0.22 0.33 1.95 1.16 2.17 1.45
Raigad -0.77 1.00 1.01 0.50 1.79 1.17
Ratnagiri 2.55* 3.08 4.47
** 2.61 1.87 0.98
Sindhudurg - - - - - -
Konkan Division -0.05 0.11 1.99 1.19 2.04 1.36
Nashik 1.64* 4.25 5.45** 2.40 3.75 1.78
Dhule -5.81 1.46 -3.18 0.48 2.8 0.88
Nandurbar 1.89* 4.63 0.56 0.20 -1.3 0.50
Jalgaon 2.48* 5.38 7.89
* 3.55 5.29
** 2.27
Nashik Division 0.14 0.17 4.84* 3.02 2.48 1.61
Ahmednagar -5.85* 3.91 -7.41 2.16 -1.66 0.68
Pune -2.41** 2.62 -1.83 0.65 0.6 0.22
Solapur -5.96 1.25 -2.57 0.30 3.61 0.76
Pune Division -5.61 2.10 -4.4 1.03 1.28 0.60
Satara -4.43* 3.32 -3.14 1.05 1.35 0.71
Sangli -0.09 0.04 1.39 0.36 1.48 0.78
Kolhapur 0.38 0.28 1.8 0.70 1.41 0.78
Kolhapur Division -1.27 0.79 0.13 0.04 1.42 0.75
Aurangabad -0.95 0.89 9.29 1.94 10.33**
2.43
Jalna 2.35* 3.76 10.9
* 2.98 8.35
** 2.52
Beed 0.24 0.37 8.06 1.73 7.8 1.84
Aurangabad Division 0.57 0.86 9.46**
2.41 8.84**
2.54
Latur -0.15 0.31 10.58 1.36 10.75 1.41
Osmanabad 1.94* 2.78 10.75 1.43 8.64 1.18
Nanded 2.03* 4.64 6.36 1.19 4.24 0.85
Parbhani -1.72 1.15 5.46 0.92 7.3 1.19
Hingoli -0.27 0.48 8.99* 5.50 9.29
* 6.50
Latur Division 0.51 0.44 10.29 1.65 9.03 1.43
Buldhana 0.45 0.77 1.84 0.70 1.39 0.59
Akola -0.98 0.56 -2.03 0.91 -1.06 0.53
Washim 3.54* 9.72 2.1 1.94 -1.39 1.22
Amravati 0.55 0.89 0.82 0.61 0.26 0.21
Yavatmal 0.62 1.08 0.43 0.22 -0.19 0.10
Amravati Division 0.57**
2.53 1.38 0.97 0.04 0.03
Wardha 1.94* 3.00 4.93 1.39 2.93 0.82
Nagpur 0.61* 2.89 4.51 1.21 3.88 1.05
Bhandara -1.1 0.63 1.47 0.51 2.59 0.83
Gondia 2.74* 6.37 -0.41 0.31 -3.07
** 2.34
Chandrapur -0.58 0.71 -2.5 0.72 -1.92 0.60
Gadchiroli -0.5 0.23 2.13 0.71 2.65 0.82
Nagpur Division 0.89 1.85 3.66 1.19 2.55 0.82
Maharashtra State 0.87* 3.66 3.74 1.79 2.84 1.42
Source: Computation are based on the figures/data obtained from ‘Statistical Division, Commissionerate of
Agriculture, Government of Maharashtra, Pune’
Note: 1) * and ** represent significance of growth rates at 1 and 5 per cent level of probability
2) Some of the districts of Maharashtra were carved after 1996-07, and, therefore, growth rates are from
1998-99 to 2007-08 for Nandurbar and Washim, from 1999-2000 to 2007-08 for Hingoli and Gondia

32
In fact, all the districts belonging to Latur division showed very high production
and yield growth of tur during the period between 1996-97 and 2007-08. Contrary to this,
the districts belonging to Amravati division showed either negative yield growth of tur or
positive but very low production growth of the crop during the given period of time. The
yield growth of tur estimated at 2.84 per cent per annum for the state of Maharashtra
during the period between 1996-97 and 2007-08 was mainly due very high annual yield
growth of this crop in Latur division of the State as Amravati division showed hardly any
yield growth of tur during the given period of time. However, the annual yield growth of
tur was found to be very high in some other districts belonging to Aurangabad and
Nashik division. For instance, Jalgaon district not only showed positive and significantly
high area growth of tur but also substantially high production and yield growth of this
important pulse crop cultivated in the district. The districts belonging to Aurangabad
division like Aurangabad, Jalna and Beed showed 8-10 per annual yield growth of tur
between 1996-97 and 2007-08. Similarly, the districts belonging to Latur like Parbhani,
Osmanabad and Latur showed 7-11 per cent annual yield growth of tur during the same
period. Such high yield growth of tur in these districts, therefore, translated into
significantly high overall yield growth of the crop for the state of Maharashtra.
In terms of growth in area, production and yield, the most disappointing
performance was noticed in the case udid crop cultivation in Maharashtra, which not only
showed negative area growth but also negative growth in terms of production and yield of
the crop during the period between 1996-97 and 2007-08 (Table 2.9). While the area
under udid crop in Maharashtra declined at the rate of 0.59 per cent per annum during the
period between 1996-97 and 2007-08, this decline in production was at the rate of 1.45
per cent per annum during the same period. The decline in yield of udid in Maharashtra
turned out to be at the rate of 0.86 per cent per annum during the given period of time.
In the cultivation of udid crop in Maharashtra, the districts belonging to Amravati,
Latur and Nashik divisions account for more than 80 per cent share in area and
production of the crop. In this sequel, the districts of Amravati division alone account for
more than 30 per cent share in total area and production of udid crop in Maharashtra, and
these districts have shown very sharp annual decline in area and production of udid crop
during the period between 1996-97 and 2007-08 with an annual decline of 3.4 per cent in
area and 4.5 per cent in production during the same period. The districts of Amravati
have not only shown negative area and production growth of udid crop but also negative

33
yield growth of the crop. The yield of udid crop in districts belonging to Amravati
division is estimated to have declined at the rate of 1.1 per cent per annum during the
period between 1996-97 and 2007-08.
Table 2.9: Compound Annual Growth Rates (CAGR) over 1997-2008 (1996-97 to 2007-08) of Area,
Production, Yield of Important Pulses Crops in Maharashtra: Udid
Area Production Yield Districts/Divisions
CAGR (%) T-Value CAGR (%) T-Value CAGR (%) T-Value
Thane 0.38 0.62 0.44 0.29 0.06 0.04
Raigad -2.44 1.50 -2.08 1.02 0.37 0.28
Ratnagiri 7.01* 3.04 -1.7 0.29 -8.14 1.42
Sindhudurg 1.21 0.96 3.54 1.90 2.3 2.14
Konkan Division 0.33 0.62 -0.47 0.29 -0.8 0.52
Nashik -0.23 0.44 3.71** 2.43 3.95* 2.72
Dhule -6.35 1.72 -10.24 2.15 -4.16 1.51
Nandurbar -2.45* 4.58 -4.69 1.65 -2.3 0.87
Jalgaon 1.02 2.21 -0.44 0.14 -1.45 0.49
Nashik Division 0.23 0.69 -1.41 0.56 -1.63 0.72
Ahmednagar 15.39* 6.66 13.16* 4.32 -1.94 0.60
Pune -0.06 0.07 2.2 1.01 2.26 1.34
Solapur 14.53* 3.36 16.91 1.75 2.08 0.30
Pune Division 11.19* 5.00 11.41
* 2.96 0.21 0.07
Satara 3.55* 4.47 -0.25 0.11 -3.67 1.82
Sangli 1.27 0.39 -1.35 0.12 -2.58 0.33
Kolhapur -1.06 0.80 -1.85 0.54 -0.8 0.27
Kolhapur Division 1.61 0.96 0.28 0.08 -1.3 0.58
Aurangabad -5.61* 5.73 -3.25 1.14 2.49 0.87
Jalna 1.82 1.98 2.89 0.90 1.05 0.36
Beed 0.53 0.27 14.79* 3.15 14.18
* 3.23
Aurangabad Division 0.09 0.09 3.55 1.40 3.47 1.53
Latur -2.14 1.78 -6.91 1.48 -4.87 1.00
Osmanabad 6.61* 6.02 7.13 1.16 0.48 0.08
Nanded 1.7 1.46 0 0.00 -1.67 0.49
Parbhani -3.13 1.66 -0.79 0.17 2.41 0.56
Hingoli 0.44 0.43 8.87* 2.91 8.4
* 3.53
Latur Division 1.56 1.52 1.04 0.29 -0.51 0.15
Buldhana -1.48 1.43 -3.3 0.72 -1.85 0.46
Akola -10.63** 2.65 -15.52* 3.29 -5.47 1.48
Washim -5.26* 4.67 -4.84 2.05 0.44 0.24
Amravati -2.39 1.28 -6.52 1.92 -4.23 1.84
Yavatmal -7.44* 3.83 -6.94 1.85 0.55 0.18
Amravati Division -3.4* 3.47 -4.46 1.49 -1.1 0.44
Wardha -3.84 1.60 -0.89 0.21 3.07 0.92
Nagpur -7.09* 8.12 -3.59 1.25 3.76 1.35
Bhandara -37.88* 6.94 -37.97
* 6.68 -0.15 0.11
Gondia -18.6* 7.34 -18.07
* 5.43 0.66 0.40
Chandrapur -29.95* 9.46 -32.04
* 9.85 -2.99 1.42
Gadchiroli -28.5* 7.38 -28.09
* 7.47 0.57 0.79
Nagpur Division -22.11* 9.37 -22.28* 7.87 -0.22 0.16
Maharashtra State -0.59 0.87 -1.45 0.76 -0.86 0.53
Source: Computation are based on the figures/data obtained from ‘Statistical Division, Commissionerate of
Agriculture, Government of Maharashtra, Pune’
Note: 1) * and ** represent significance of growth rates at 1 and 5 per cent level of probability
2) Some of the districts of Maharashtra were carved after 1996-07, and, therefore, growth rates are from
1998-99 to 2007-08 for Nandurbar and Washim, from 1999-2000 to 2007-08 for Hingoli and Gondia

34
In contrast to Amravati division, the division of Latur has shown positive area and
production growth and negative yield growth of udid crop. The districts belonging to
Latur division have shown area expansion under udid crop at the rate of 1.56 per cent per
annum and production expansion at the rate of 1.04 per cent per annum between 1996-97
and 2007-08. The yield level of udid crop in Latur division has declined at the rate of
0.51 per annum during the given period of time.
Like Amravati division, the districts belonging to Nashik have also shown
negative production and yield growth of udid crop. However, there has been positive area
growth under udid crop in Nashik division. The districts belonging to Nashik division
have shown decline in area under udid crop at the rate of 1.41 per cent per annum and
decline in yield at the rate of 1.63 per cent per annum between 1996-97 and 2007-08. On
the other hand, area under udid crop in Nashik division has grown at the rate of 0.23 per
cent per annum during the above period of time.
Although there has been positive area growth of udid crop in Latur and Nashik
divisions of Maharashtra, the negative growth in the same in Amravati division
outweighed positive area growth, and, consequently, overall area under udid crop in
Maharashtra declined between 1996-97 and 2007-08. Similarly, the positive production
growth of udid crop in Latur division could not offset overall production decline in the
same for the state of Maharashtra as negative production growth of udid in Amravati and
Nashik divisions outweighed positive production growth of udid in Latur division.
Among various pulse crops, gram was found to be the only crop that showed
positive area, production and yield growth for the state of Maharashtra during the period
between 1996-97 and 2007-08 with production growth being faster than area and yield
growth of gram during this period (Table 2.10). All the districts of Maharashtra have
shown significant annual growth in area, production and yield of gram crop during the
given period of time with the exception of districts like Bhandara, Kolhapur, Jalgaon,
Dhule, Nashik and Raigad, which showed negative area growth under gram between
1996-97 and 2007-08. However, the negative area growth of gram crop in these districts
has not affected the overall rise in area under the crop since these districts have very
marginal presence in terms of gram crop cultivation. In general, the area under gram crop
cultivation in Maharashtra has grown at 3-6 per cent per annum across various gram
producing divisions of Maharashtra with an overall growth rate in the same at 4.76 per
cent per annum between 1996-97 and 2007-08. During the same period, the production of

35
gram crop in Maharashtra increased at the rate of 7.51 per cent per annum. In this sequel,
the districts belonging to divisions like Nagpur, Amravati, Latur, Pune and Nashik have
shown as much as more than 10 per cent annual growth in gram crop production.
Table 2.10: Compound Annual Growth Rates (CAGR) over 1997-2008 (1996-97 to 2007-08) of Area,
Production, Yield of Important Pulses Crops in Maharashtra: Gram
Area Production Yield Districts/Divisions
CAGR (%) T-Value CAGR (%) T-Value CAGR (%) T-Value
Thane 0.93 0.55 2.3 1.32 1.35 1.20
Raigad -3.82 1.89 -2.42 1.13 1.46 1.36
Ratnagiri - - - - - -
Sindhudurg - - - - - -
Konkan Division -1.03 0.53 0.23 0.12 1.28 1.16
Nashik -2.4 1.07 -0.5 0.15 1.94 1.44
Dhule -0.09 0.03 2.05 0.51 2.14 1.19
Nandurbar 0.63 0.32 3.45 1.18 2.79 1.17
Jalgaon -1.47 0.70 2.32 1.11 3.84* 3.73
Nashik Division -0.57 0.30 2.48 1.02 3.07* 2.77
Ahmednagar 6.42* 4.33 7.85** 2.52 1.35 0.61
Pune 0.92 0.60 1.03 0.40 0.11 0.05
Solapur 0.92 0.49 1.76 0.30 0.83 0.18
Pune Division 3.09**
2.26 3.91 1.17 0.8 0.32
Satara 2.38 1.02 3.63 1.13 1.22 0.62
Sangli 1.28 0.88 0.64 0.23 -0.62 0.34
Kolhapur -1.42 0.98 1.06 0.72 2.52* 3.56
Kolhapur Division 1.31 0.83 1.88 0.83 0.56 0.43
Aurangabad 1.16 0.71 6.46 1.93 5.23**
2.33
Jalna 1.19 1.21 6.46**
2.47 5.21* 2.67
Beed 7.48* 5.55 11.15
* 3.53 3.41 1.66
Aurangabad Division 3.12* 2.98 7.72
* 2.74 4.46
** 2.25
Latur 6.48* 7.08 11.36* 3.44 4.59 1.50
Osmanabad 4.41* 4.77 9.3 1.80 4.69 0.96
Nanded 7.02* 3.54 13.76
* 3.87 6.3
* 2.69
Parbhani 1.33 0.78 4.03 1.30 2.67 1.15
Hingoli 5.29* 4.27 10.83
* 5.80 5.26
* 5.61
Latur Division 6.00* 8.40 11.01
* 3.74 4.73 1.94
Buldhana 7.13** 2.24 6.57 1.22 -0.52 0.20
Akola 5.76 1.58 9.2 1.51 3.25 1.06
Washim 12.19* 5.82 11.03
** 2.66 -1.03 0.48
Amravati 4.63 1.78 8.3 2.21 3.51 1.72
Yavatmal 14.5* 3.63 20.31
* 4.21 5.08
** 2.44
Amravati Division 9.13* 3.26 11.38
** 2.53 2.06 0.99
Wardha 8.67* 6.04 13* 4.75 3.98 1.67
Nagpur 6.56* 3.71 10.22* 3.97 3.44 1.57
Bhandara -4.27 1.05 0.1 0.02 4.56 1.89
Gondia 1.98 0.82 3.96 0.82 1.94 0.70
Chandrapur 9.4* 4.50 13.38
* 4.91 3.64 1.53
Gadchiroli -2.4 0.67 -1.94 0.39 0.47 0.17
Nagpur Division 6.45* 4.48 10.38* 4.34 3.69 1.73
Maharashtra State 4.76* 3.76 7.51* 3.01 2.63 1.84
Source: Computation are based on the figures/data obtained from ‘Statistical Division, Commissionerate of
Agriculture, Government of Maharashtra, Pune’
Note: 1) * and ** represent significance of growth rates at 1 and 5 per cent level of probability
2) Some of the districts of Maharashtra were carved after 1996-07, and, therefore, growth rates are from
1998-99 to 2007-08 for Nandurbar and Washim, from 1999-2000 to 2007-08 for Hingoli and Gondia

36
The substantial yield growth of gram is noticed in those districts that belonged to
Amravati, Latur, Aurangabad and Nashik divisions of Maharashtra. About 2-5 per cent
annual yield growth rates of gram in districts belonging to Amravati, Latur, Aurangabad
and Nashik divisions of Maharashtra have ultimately resulted in 2.63 per cent annual
yield growth of gram crop for the state of Maharashtra during the period between 1996-
97 and 2007-08. In fact, gram happens to be the only rabi pulse crop, which is cultivated
in almost all the districts of Maharashtra with the sole exception of some of the districts
of Konkan division of Maharashtra. However, different divisions have not only shown
varying level of their share in area and production of the crop but also varying annual
growth with respect to area, production yield of gram crop during the past one decade.
It is to be noted that though mung and udid crops showed negative area,
production and yield growth, the positive area, production and yield growth of tur and
gram have ultimately led to significant expansion in area, production and yield of total
pulse crop in the state of Maharashtra during the period between 1996-97 and 2007-08.
This is mainly due to the fact that tur and gram account for more than 60 per cent share in
total area under pulse crops of Maharashtra, and that these two important pulse crops
have shown significant growth in their area production and yield during the past one
decade. District-wise annual growth rate estimates with respect to area, production and
yield of total pulse crops in Maharashtra encompassing the period between 1996-97 and
2007-08 are shown in Table 2.11.
In the state of Maharashtra, the districts belonging to Nagpur, Amravati, Latur,
Aurangabad and Nashik divisions account for more than 90 per cent area and production
of pulse crops. Although Nashik and Aurangabad divisions have shown a decline in area
under total pulse crop cultivation during the period between 1996-97 and 2007-08, this
decline in area has not affected the overall expansion of area under pulse crops for the
state of Maharashtra as divisions like Nagpur, Amravati and Latur are marked with about
1 per cent annual growth in area under pulse crops during this period. As a result, the area
under various pulse crops in Maharashtra has grown at the rate of 0.79 per cent per
annum between 1996-97 and 2007-08. Similarly, the production of pulse crops in
Maharashtra has increased at the growth rate of 2.91 per cent per annum during the
period between 1996-97 and 2007-08, mainly due to 2-5 per cent annual growth in pulse
crop production during this period in districts belonging to Nagpur, Amravati, Latur,
Aurangabad and Nashik divisions of Maharashtra. The yield growth of total pulses in

37
Maharashtra is estimated at 2.11 per cent per annum between 1996-97 and 2007-08,
which could be attributed to substantial annual growth in yield level of pulses in districts
belonging to Aurangabad, Nashik and Nagpur divisions of the State.
Table 2.11: Compound Annual Growth Rates (CAGR) over 1997-2008 (1996-97 to 2007-08) of Area,
Production, Yield of Important Pulses Crops in Maharashtra: Total Pulses
Area Production Yield Districts/Divisions
CAGR (%) T-Value CAGR (%) T-Value CAGR (%) T-Value
Thane 2.35 2.12 2.46* 2.84 0.1 0.11
Raigad 3.4* 3.26 2.5
** 2.25 -0.87 1.28
Ratnagiri 9.15* 4.45 6.17
** 2.58 -2.73 1.19
Sindhudurg 15.36* 4.94 14.53
* 4.70 -0.72 0.52
Konkan Division 4.72* 3.96 3.76* 4.00 -0.92 1.08
Nashik -2.02** 2.24 0.39 0.22 2.46 2.22
Dhule -4.56 2.12 -4.37 1.31 0.2 0.13
Nandurbar -1.01 2.05 -1.39 0.79 -0.38 0.21
Jalgaon 0.19 0.49 1.72 1.02 1.53 0.96
Nashik Division -0.32 0.79 0.78 0.55 1.1 0.83
Ahmednagar 1.25 0.88 3.34 1.13 2.07 1.09
Pune 0.39 0.27 0.54 0.28 0.15 0.18
Solapur -3.13 1.29 -0.26 0.05 2.96 0.96
Pune Division -0.39 0.25 1.46 0.49 1.86 1.14
Satara -2.74 1.64 -2.5 1.18 0.26 0.22
Sangli -1.81 0.81 -0.4 0.10 1.44 0.66
Kolhapur 0.29 0.40 1.76** 2.30 1.46 1.73
Kolhapur Division -1.95 1.31 -0.87 0.37 1.1 0.91
Aurangabad -1.62* 2.69 5.29 1.97 7.02
* 3.08
Jalna -1.2* 3.65 3.3 1.24 4.55 1.88
Beed 1.36 1.72 7.82* 2.84 6.37
** 2.46
Aurangabad Division -0.55 1.27 5.27 2.15 5.86 2.66
Latur -0.04 0.08 3.91 1.01 3.95 0.99
Osmanabad 3.71* 10.48 9.36 1.83 5.46 1.10
Nanded 2.39* 3.39 5.06 1.34 2.61 0.78
Parbhani -1.25 0.85 4.44 1.11 5.76 1.52
Hingoli 1.5**
2.45 8.74* 4.93 7.12
* 5.60
Latur Division 2.14* 5.29 7.4 2.00 5.15 1.44
Buldhana 1 0.89 1.27 0.39 0.26 0.09
Akola -2.31 0.96 -2.51 0.75 -0.21 0.09
Washim 0.36 0.60 0.27 0.15 -0.09 0.07
Amravati 2.1* 3.27 2.23 1.19 0.13 0.09
Yavatmal 0.09 0.13 1.24 0.63 1.15 0.62
Amravati Division 1.31**
2.64 1.88 0.93 0.56 0.33
Wardha 3.33* 5.50 6.1 2.06 2.69 0.93
Nagpur 1.9 1.99 2.82 0.46 0.91 0.14
Bhandara -7.9* 3.23 -6.12 1.93 1.94 1.21
Gondia 1.03 0.75 -0.77 0.37 -1.78 1.80
Chandrapur 0.73 0.50 -0.09 0.03 -0.81 0.43
Gadchiroli -1.22 0.80 -1.95 0.74 -0.73 0.39
Nagpur Division 0.86 0.86 2.94 1.39 2.06 1.05
Maharashtra State 0.79 1.95 2.91 1.70 2.11 1.40
Source: Computation are based on the figures/data obtained from ‘Statistical Division, Commissionerate of
Agriculture, Government of Maharashtra, Pune’
Note: 1) * and ** represent significance of growth rates at 1 and 5 per cent level of probability
2) Some of the districts of Maharashtra were carved after 1996-07, and, therefore, growth rates are from
1998-99 to 2007-08 for Nandurbar and Washim, from 1999-2000 to 2007-08 for Hingoli and Gondia

38
The overall analysis drawn from growth trends with respect to area, production
and yield of various pulses crops cultivated in Maharashtra clearly bring us closer to the
fact that the pulse sector of Maharashtra has performed very well during the past one
decade as major pulse crops like kharif tur and rabi gram cultivated in the State showed
positive and significantly high area, production and yield growth during this period.
However, negative growth rates associated with mung and udid with respect to their area,
production and yield could be considered as a matter of concern, though these declining
trends in area production and yield of mung and udid crops have not affected overall rise
in area, production and yield of total pulse crops cultivated in Maharashtra during the
period between 1996-97 and 2007-08. Another positive feature of pulse sector of
Maharashtra is the rising share of pulse crops in GCA of Maharashtra in the face of
falling share of cereals in GCA of the State, especially in more recent times. Not only
this, the yield growth of pulse crops is found to be even higher than sugarcane and cotton
crop cultivated in the state of Maharashtra. Even the production growth of pulse crop is
noticed to be higher than production growth of sugarcane during the past one decade.
However, the pulse sector of Maharashtra has to still do lot of catching especially when
some of the pulse crops like mung and udid are showing negative growth in their area,
production and yield. Since the demand for these two pulses has always exceeded supply,
there is need to bring more area under mung and udid crop cultivation in order to
augment their production in the state of Maharashtra. Equally important is the
improvement in yield levels of mung and udid crop as they have been showing negative
yield growth in Maharashtra over the past one decade.
************

39
CHAPTER – III
DEMOGRAPHIC PROFILE AND CROPPING PATTERN
OF THE STUDY REGION
This chapter mainly deals with the socio-economic profile of sampled farmers
drawn from the NFSM district of Amravati and non-NFSM district of Beed since the
socio-economic characteristics of farmers have a profound influence on the decision
making process and profitability of crop enterprise. The resource endowments have been
compared for different categories of sampled farmers belonging to Amravati and Beed
districts of Maharashtra. The information relating to family size and composition,
education status, caste composition, land use pattern, cropping pattern, irrigated area,
sources of irrigation, etc. has been analysed and discussed for various categories of
sampled farmers of Amravati and Beed districts. The knowledge of the background of the
sampled farmers is essential since the viability of any enterprise heavily depends on the
favorable attitudinal changes towards adoption of superior technical inputs or technique
of production, which in turn, depends on technical skills and resource position of the
farmers. Apart from providing general background information of the sampled farmers,
this chapter also provides a general overview of Maharashtra and also the selected
sampled districts of the state of Maharashtra.
3.1 General Overview: Maharashtra State
Maharashtra, positioned between 160.4
/ and 22
0.1
/ North Latitude and 72
0.6
/ and
800.9
/ East Longitudes, and located on the west coast abutting the Arabian Sea and carved
out as a linguistic entity of Marathi speaking people, is the second largest state in terms
of population and the third largest in terms of area. As per 2001 census figures,
Maharashtra accounted for 9.42 per cent of total human population of India with its
spread over 3,07,713 square kilometers. The per capita income of Maharashtra is
estimated to be 40 per cent higher than the all-India average. Secondary and tertiary
sectors account for significant share in total annual income of Maharashtra. Agriculture
has not only made the state self-sufficient in foodgrains but also an inclination towards
cultivation of commercial crops has also given rise to a vibrant agro-processing industry
in the state, though mostly confined to sugarcane and to some extent cotton and fruits and

40
vegetables. The extensive cultivation of sugarcane in western region of the state has
reduced the scope for equity in sharing a precarious resource, i.e., water for irrigation.
Maharashtra also occupies second position in India in terms of urban population
with about 43 out of every 100 persons living in towns and cities. States like Gujarat,
Madhya Pradesh, Chhatisgarh, Andhra Pradesh and Karnataka surround the state of
Maharashtra. It has 720 km long coastline stretched from Daman in the north to Goa in
the south. It falls in the resource development zone called the Western Plateau and Hill
Regions, which is one of the 15 such zones of India divided on the basis of agro-climatic
features. Maharashtra’s topography is diverse. It is classified into five broad regional
groups such as Greater Mumbai, Western Maharashtra, Marathwada, Konkan and
Vidarbha, and six revenue divisions for administrative purposes like Navi Mumbai,
Nashik, Pune, Aurangabad, Nagpur and Amravati. All the 35 districts of Maharashtra are
divided amongst these six divisions.
Konkan division consists of Mumbai, Thane, Raigad, Ratnagiri and Sindhudurg
districts on the coast where landholdings are small but evenly distributed with no
irrigation facilities. Nashik, Dhule, Nandurbar, Jalgaon and Ahmednagar districts with
characteristics like large tribal population, large landholdings, high level of landlessness,
forests, a few fertile tracts and good rainfall comprise the Nashik division. Pune division
is comprised of Pune, Sangli, Satara, Kolhapur and Solapur districts and witnesses
relatively lower rainfall with its smaller landholding being served by canal and wells. The
districts belonging to Marathwada region like Aurangabad, Jalna, Parbhani, Hingoli,
Nanded, Osmanabad, Beed and Latur constitute the Aurangabad division and are
culturally well tied as all of them represent the erstwhile State of Hyderabad. The region
is rocky and dry with low and uncertain rainfall, large landholdings and some
landlessness. One part of Vidarbha region comprising Buldhana, Akola, Amravati,
Washim and Yavatmal districts is administered by Amravati division and rest of this
region comprising Nagpur, Wardha, Bhandara, Gondia, Chandrapur and Gadchiroli
districts stands governed by Nagpur division. The two divisions of Vidarbha cover part of
a plateau characterized by deep block soil, assured rainfall, medium and large
landholdings, and high levels of landlessness. The districts like Bhandara, Gondia,
Chandrapur and Gadchiroli have a large tribal population and forest cover.
The total human population of Maharashtra stood at 7,89,37,000 according to
1991 census and 9,68,79,000 as per 2001 census with 61 per cent population belonging to

41
rural and 39 per cent to urban area. These estimates are concomitant of the fact that there
has been 23 per cent rise in human population in Maharashtra in 2001 over 1991-census
figures. The population density in the state has also grown from 257 persons per square
km in 1991 to 315 persons per square km in 2001.
The state of Maharashtra is comprised of 336 towns, 326 talukas, 43,027 villages
and 1,53,44,435 households with 60 per cent belonging to rural and 40 per cent to urban
areas. Out of the total human population, around 11 per cent belong to scheduled castes
and 9 per cent to scheduled tribes. The overall literacy rate of Maharashtra is relatively
high among males as compared to females. The literacy rate of Maharashtra among males
is found to be 86 per cent in contrast to 67 per cent among females. Further, occupational
break-up of Maharashtra reveals that out of the total population, about 57 per cent are
non-workers, 4 per cent marginal workers and 39 per cent main workers with 13 per cent
cultivators and 11 per cent agricultural labourers. The remaining 15 per cent of total 39
per cent working population of Maharashtra are engaged in other activities such as
livestock, forestry, fishing, horticulture, etc., activities, mining and quarrying,
manufacturing, processing, repairing, etc., construction, trade and commerce, transport,
storage and communication, etc.
Maharashtra’s net sown area stands at around 1,77,44,000 hectares, of which 18.5
per cent is irrigated. Well irrigation accounts for around 55 per cent of the total irrigated
area of Maharashtra. The lower proportion of area under irrigation renders agriculture
vulnerable to draughts, resulting in periodic fluctuation in farm output, which in a normal
year is only 90 per cent of the State’s total foodgrain requirement. The cropping intensity
of Maharashtra is relatively higher than irrigation intensity.
In spite of Maharashtra’s higher level of economic growth and despite being one
of the higher-income States with growth rates exceeding several other States,
Maharashtra was ranked third among 17 states in 1991 in terms of Human Development
Index (HDI) with a HDI value of 0.532.
Though India has become self sufficient in foodgrains production in spite of
tremendous increase in population, mere self sufficiency in agriculture is not the chief
objective of Maharashtra, which accords higher priority to assuring more remunerative
net income to the farmers through efficient and sustainable use of available resources.
The state has been implementing various schemes from time to time not only to increase
agricultural production and exports but also to encourage agro-processing industries with

42
a view to reap the benefits of liberalized economy and global trade. Agricultural
department in the state is firmly heading towards economic progress along with self-
sufficiency through agriculture with the ultimate goal of achieving important position in
the global agriculture produce market. The innovative horticulture plantation scheme
under employment guarantee scheme implemented by the state is a part of this policy.
3.2 General Overview: Study Districts
The NFSM Amravati district is situated between 200.32
/ and 21
0.46
/ North
Latitudes and 760.37
/ and 78
0.27
/ East Longitudes. This essentially indicates that
Amravati District is located in the Deccan plateau. The district occupies an area of
12,235 km². The district is bounded by Betul district of Madhya Pradesh in the north, and
by the districts of Maharashtra like Nagpur in the northeast, Wardha in the east, Yavatmal
in the south, Washim in the southwest, and Akola and Buldhana in the wsst. The
Amravati district is divided into 14 Talukas namely, Dharni, Chikhaldara, Ajangaon,
Achalpur, Chandurbajar, Morshi, Barud, Tivsa, Amravati, Bhatkuli, Daryapur, Nandgaon
Khed, Chandur (Rly), Dhamangaon (Rly), and six sub-divisions viz. Amravati, Daryapur,
Achalpur, Morshi, Dharni and Chandur (Rly).
Amravati is one of the most fertile districts of the Vidharva region. Agriculture
assumes prime importance in the economy of the district since it is the main occupation
of people. Rainfall plays an important role in determining cropping pattern of the district.
In 2008, the minimum rainfall of 389.00 mm was noticed in Achalpur center and
maximum of 1212.20 mm in Chikhaldara center during the period between June and
September. Average annual rainfall in the district stands at 841.80 mm. Soils along the
banks of rivers are deep and clayey. The main rivers in Amravati district are Tapi, Purna,
Chandrabhaga, Pedhi, Wardha and Shahanoor, whereas the dams in Amravati District
include Upper Wardha Project, Lower Wardha Project, Chandrabhaga Project, Bembala
Project, Sapan Project, and Purna Project.
The 2001 census figures reveal the total human population of Amravati district to
be 26,06,063 persons with 65 per cent of it belonging to rural and 35 per cent to urban
area. For every 1000 male population of the district, the female population works out at
938. The literacy rate of the district stands at 82.54 per cent with 79.2 per cent rural and
88.8 per cent in urban area. The male literacy is noticed to be higher at 88.91 per cent as
against female literacy of 75.73 per cent. The major crops cultivated in Amravati district
encompass wheat, gram, cotton, jowar, tur, mung, sesamum, gram, sunflower, orange,

43
groundnut, soybean, chilli, banana and orange. The general profile of Amravati district
also shows several schemes being implemented by the department of agriculture, which
among others mainly include: (a) integrated Watershed Development Programme, (b)
Fruit Cultivation under EGS, and (c) National Agriculture Insurance scheme, and (d)
scheme of National food Security Mission for pulse crops.
The non-NFSM Beed district is situated in the Deccan black basalt stone, ranges
of Balaghat that constitutes main range from Ahmednagar in the west, to the border of
district Beed in the East. This range divides the district into two parts. The plain area in
the North is called as Gangathadi (bank of Ganga-Godavari) and the higher part is called
as Ghat at Balaghat. The district is positioned between 180.3
/ and 19
0.3
/ North Latitude
and 740.5
/ and 76
0.6
/ East Longitude. The district receives about 666 mm annual average
rainfalls. The district encompasses 1365 villages, 11 talukas, 11 Panchayat Samitees,
1018 Grampanchayat and is spread over 10,615 square km.
As per 2001 census figures, the total human population of Beed district is 2,160
thousand persons. About 82 per cent of the total human population of Ahmednagar
district belongs to rural area and the remaining 18 per cent to urban area. The sex ratio is
noticed to be invariably in favour of males. The female population of Ahmednagar
district works out at 904 for every 1000 males. The literacy rate of the district stands at
60.48 per cent with male literacy being 80.69 per cent and female literacy being 55.38 per
cent. As per recent estimates, the district encompasses 1069 thousand hectares of
geographical area, 881 thousand hectares of cropped area, 961 thousand hectares of net
sown area, and 305 thousand hectares of total irrigated area. The major crops cultivated
in Beed district encompass wheat, paddy, kharif jowar, gram, tur, mung, udid, sugarcane,
chilli, onion, tomato, cotton, groundnut, sunflower, sesamum, etc. The statistics also
reveal that by the end of June 2002, some 3 major and 16 medium irrigation projects
were completed in the district of Beed.
Having provided broad overview with respect to the state of Maharashtra and also
for the study NFSM and non-NFSM districts, especially in terms of their population,
geographical position, soil type, extent of irrigation, rainfall, implementation of various
schemes, and the crops under cultivation, the subsequent section chiefly throws light on
the estimates relating to socio-economic status of sampled farmers and their land
utilization and cropping pattern with extension to area under irrigation for various crops
for the sampled districts of the state of Maharashtra.

44
3.3 Family Size of NFSM and Non-NFSM District Farmers
Running a crop enterprise is generally a labour intensive operation where the
composition and size of the family of a farmer are important considerations. The viability
of a crop enterprise at village level often depends on such important factors. Information
on family size of sampled farmers of NFSM district of Amravati and non-NFSM district
of Beed is presented in Table 3.1 and Table 3.2.
The average size of family consisted of 5 persons with 4 adults and 1 child in the
case of sampled farmers drawn from Amravati district since 50 sampled farmers
consisted of 249 family members encompassing 197 persons belonging to adult males
and females and 52 children (Table 3.1). The sex ratio of adults was invariably in favour
of males in this district. All the categories of sampled farmers belonging to Amravati
district showed a family size of 5 persons with by and large same number of adult and
child population on an average per household basis.
Table 3.1: Family Size Composition of NFSM Amravati District
Adults Category
Sample
Size Males Females Total Children Total
Marginal 15 29 26 55 17 72
Small 19 44 36 80 15 95
Medium 10 21 18 39 12 51
Large 6 11 12 23 8 31
Total 50 105 92 197 52 249
In the case of sampled farmers belonging to Beed district, the average family size
consisted of nearly 6 members with 5 adult males and females and one child. This was
mainly due to the fact that the 50 sampled farmers of this district had 277 members
encompassing 206 persons belonging to adult males and females and 71 children (Table
3.2). The sex ratio of adults was again invariably in favour of males in Beed district. The
family size for the sampled farmers belonging to Beed district was estimated at 5 persons
for marginal and small category, nearly 6 for medium and 8 for large category with an
overall average of the same at nearly 6 persons for the average category of farmers
belonging to non-NFSM district of Beed.
Table 3.2: Family Size Composition of Non-NFSM Beed District
Adults Category
Sample
Size Males Females Total Children Total
Marginal 14 26 20 46 24 70
Small 17 35 32 67 22 89
Medium 13 31 28 59 13 72
Large 6 15 19 34 12 46
Total 50 107 99 206 71 277

45
Thus, the family size of sampled farmers of Amravati and Beed district differed
considerably. While the family size of sampled farmers belonging to Amravati district
remained by and large same at 5 persons for various categories of farmers, the size of
family was found to increase from 5 to 8 persons with an average of 6 persons in the case
of sampled farmers belonging to Beed district, showing a rise in family size with the
increase in land holding size of farmers.
3.4 Educational Status of NFSM and Non-NFSM District Farmers
The standard of education has a definite bearing on a farmer’s response to
improved technology and extension services. A responsive and enlightened farmer only
acts to improve technology and market performance because of his higher motivation that
helps him to take effective managerial decisions to contribute more to the market, to
diversify his farm business and thereby, to earn more. Such motivated responsive farmers
are very much needed to run any professional enterprise that warrants quality managerial
inputs. In a village set up, the decision maker of a family is usually either its head or any
other elderly economically active person of this family. All decisions regarding primary
and secondary occupations that should be practiced by a family are taken by such a
person. However, the level of education of other members of the family could be equally
important in the decision making process if they have motivation towards gaining
knowledge about modern techniques of production. Since such decision makers have
important roles in determining the health of a crop enterprise, it was thought prudent and
desirable to ascertain the education level of such members in case of producer family.
Information relating to the educational status of head of the household and also
the education profile of adult population encompassing males and females is provided in
Table 3.3 for the sampled farmers belonging to Amravati district and in Table 3.4 in the
case of sampled farmers of Beed district.
The educational status of head of the household was found to be quite high in the
case of sampled farmers of Amravati district as 41 out of 50 heads of households’
attained education either up to secondary level or beyond (Table 3.3). Among various
categories of farmers of Amravati district, the marginal category showed higher number
of their heads attaining education up to secondary and higher level as compared to other
categories of farmers since 14 out of 15 heads for marginal category, 16 out of 19 heads
of small, 6 out of 10 heads of medium category, and 5 out of 6 heads of large category
had obtained education up to secondary and above level. There were only two heads of

46
households in Amravati district who turned out to be illiterate. In this sequel, 7 heads of
households in Amravati district attained education up to primary level.
Table 3.3: Education Status of Head of Household of NFSM Amravati District
Category Sample Size Illiterates Primary Secondary and Above Total
Marginal 15 1 - 14 15
Small 19 1 2 16 19
Medium 10 - 4 6 10
Large 6 - 1 5 6
Total 50 2 7 41 50
As for educational status, about 93 per cent heads of households in marginal
category, 84 per cent in small, 60 per cent in medium and 83 per cent in large category
attained education up to secondary and higher level in the NFSM district of Amravati
(Table 3.3 (a)). The general trend in Amravati district showed that 82 per cent heads of
households had attained education up to secondary and above level, 14 per cent up to
primary level and 4 per cent did not attain any education and turned out to be illiterate.
Table 3.3 (a): % Distribution of Education Status of Head of Household of NFSM Amravati District (Percent Distribution)
Category Sample Size Illiterates Primary Secondary and Above Total
Marginal 15 6.67 - 93.33 100.00
Small 19 5.26 10.53 84.21 100.00
Medium 10 - 40.00 60.00 100.00
Large 6 - 16.67 83.33 100.00
Total 50 4.00 14.00 82.00 100.00
The education profile of adult population among the sampled farmers of Amravati
district was also high as 153 out of 197 adult members in this district had attained
education up to secondary and higher level with small large category of farmers showing
higher number of their members attaining education up to secondary and above level as
compared to marginal and medium category (Table 3.3 (b)). In Amravati district, 24 out
of 197 adult members were illiterate, whereas 20 out 197 adult members attained
education up to primary level.
Table 3.3 (b): Education Profile of the Adult Population in NFSM Amravati District
Category Sample Size Illiterates Primary Secondary and Above Total
Marginal 15 7 6 42 55
Small 19 7 5 68 80
Medium 10 8 7 24 39
Large 6 2 2 19 23
Total 50 24 20 153 197
The percentage distribution of education profile of adult population belonging to
NFSM Amravati district revealed that 78 per cent members of sampled farmers in general
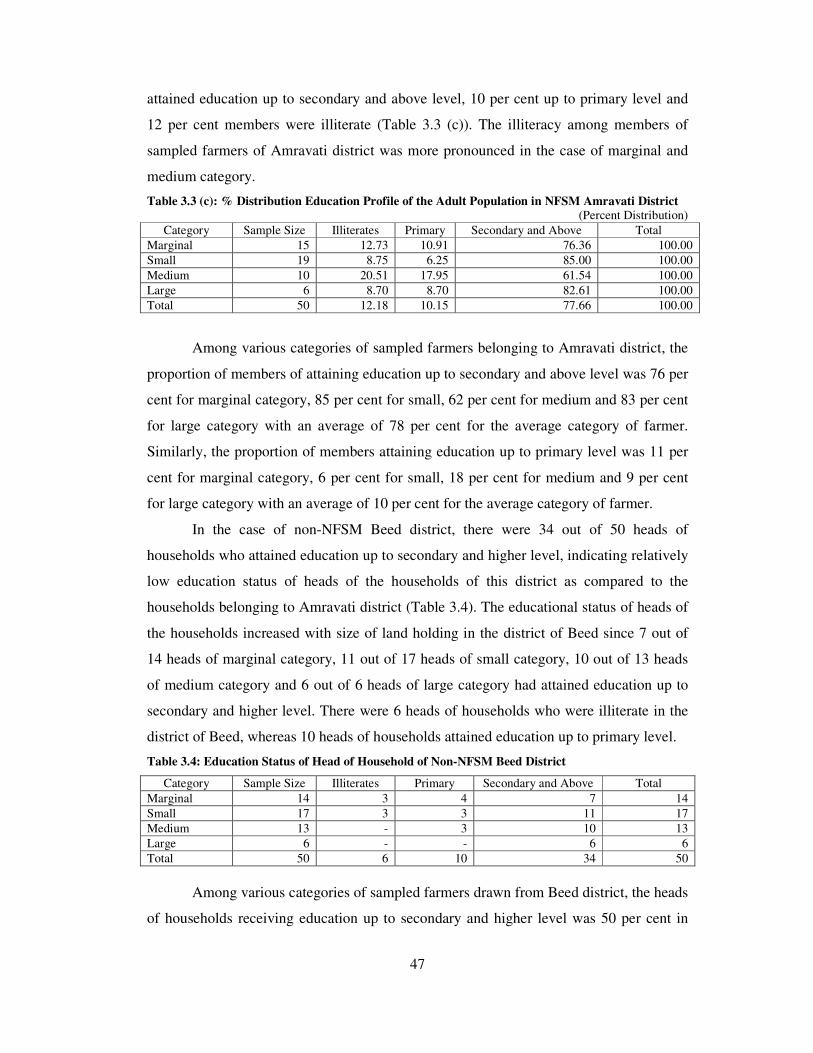
47
attained education up to secondary and above level, 10 per cent up to primary level and
12 per cent members were illiterate (Table 3.3 (c)). The illiteracy among members of
sampled farmers of Amravati district was more pronounced in the case of marginal and
medium category.
Table 3.3 (c): % Distribution Education Profile of the Adult Population in NFSM Amravati District (Percent Distribution)
Category Sample Size Illiterates Primary Secondary and Above Total
Marginal 15 12.73 10.91 76.36 100.00
Small 19 8.75 6.25 85.00 100.00
Medium 10 20.51 17.95 61.54 100.00
Large 6 8.70 8.70 82.61 100.00
Total 50 12.18 10.15 77.66 100.00
Among various categories of sampled farmers belonging to Amravati district, the
proportion of members of attaining education up to secondary and above level was 76 per
cent for marginal category, 85 per cent for small, 62 per cent for medium and 83 per cent
for large category with an average of 78 per cent for the average category of farmer.
Similarly, the proportion of members attaining education up to primary level was 11 per
cent for marginal category, 6 per cent for small, 18 per cent for medium and 9 per cent
for large category with an average of 10 per cent for the average category of farmer.
In the case of non-NFSM Beed district, there were 34 out of 50 heads of
households who attained education up to secondary and higher level, indicating relatively
low education status of heads of the households of this district as compared to the
households belonging to Amravati district (Table 3.4). The educational status of heads of
the households increased with size of land holding in the district of Beed since 7 out of
14 heads of marginal category, 11 out of 17 heads of small category, 10 out of 13 heads
of medium category and 6 out of 6 heads of large category had attained education up to
secondary and higher level. There were 6 heads of households who were illiterate in the
district of Beed, whereas 10 heads of households attained education up to primary level.
Table 3.4: Education Status of Head of Household of Non-NFSM Beed District
Category Sample Size Illiterates Primary Secondary and Above Total
Marginal 14 3 4 7 14
Small 17 3 3 11 17
Medium 13 - 3 10 13
Large 6 - - 6 6
Total 50 6 10 34 50
Among various categories of sampled farmers drawn from Beed district, the heads
of households receiving education up to secondary and higher level was 50 per cent in

48
marginal category, 65 per cent in small, 77 per cent in medium and 100 per cent in large
category with an average of 64 per cent for the average category of farmers, indicating
rise in proportion of heads of households receiving education up to secondary and higher
level with the rise in their land holding size (Table 3.4 (a)). The proportion of heads of
households attaining education up to primary level was found to be 20 per cent in Beed
district, whereas 12 per cent of heads of households did not attain any education and
turned out to be illiterate.
Table 3.4 (a): % Distribution of Education Status of Head of Household of Non-NFSM Beed District (Percent Distribution)
Category Sample Size Illiterates Primary Secondary and Above Total
Marginal 14 21.43 28.57 50.00 100.00
Small 17 17.65 17.65 64.71 100.00
Medium 13 - 23.08 76.92 100.00
Large 6 - - 100.00 100.00
Total 50 12.00 20.00 68.00 100.00
The overall education profile of adult population of sampled farmers drawn from
Beed district showed that out of 206 adult members, 136 attained education up to
secondary and higher level, 33 up to primary level and 37 adult members did not receive
any education (Table 3.4 (b)). Among various categories, adult members of sampled
farmers drawn from Beed district showed trend similar to the education level of their
heads of the households as members receiving education up to secondary and higher level
was 22 out of 46 in marginal category, 44 out of 67 in small, 43 out of 59 in medium, and
27 out of 34 in large category with a sum of 136 out of 206 in the case of average
category of farmer. In Beed district, 37 out of 206 adult members did not receive any
formal education, whereas 33 adult members received education up to primary level.
Table 3.4 (b): Education Profile of the Adult Population in Non-NFSM Beed District
Category Sample Size Illiterates Primary Secondary and Above Total
Marginal 14 15 9 22 46
Small 17 10 13 44 67
Medium 13 9 7 43 59
Large 6 3 4 27 34
Total 50 37 33 136 206
In the non-NFSM district of Beed, the proportion of adult population receiving
education up to secondary and higher level increased with the rise in land holding size of
farmers as it was noticed to be 48 per cent for marginal category, 66 per cent for small,
73 per cent for medium and 79 per cent for large category with an average of 66 per cent
for the average category of farmers (Table 3.4 (c)). A negative trend in this respect was
noticed for those adult members who received education up to primary level or did not

49
receive any education as proportion of adult members receiving education up to primary
level declined with the rise in land holding size of farmers, and the proportion of illiterate
adult members also declined with the rise in land holding size of sampled farmers. .
Table 3.4 (c): % Distribution Education Profile of the Adult Population in Non-NFSM Beed District (Percent Distribution)
Category Sample Size Illiterates Primary Secondary and Above Total
Marginal 14 32.61 19.57 47.83 100.00
Small 17 14.93 19.40 65.67 100.00
Medium 13 15.25 11.86 72.88 100.00
Large 6 8.82 11.76 79.41 100.00
Total 50 17.96 16.02 66.02 100.00
The general trend in Beed district showed that about 66 per cent of adult members
belonging to sampled farmers received education up to secondary and higher level, 16 per
cent up to primary level and the remaining 18 per cent did not receive any formal
education and, therefore, were treated as illiterate.
The foregoing observations clearly underscore the fact that the sampled farmers
belonging to NFSM Amravati district were relatively more educated as compared to their
counterpart in non-NFSM Beed district. While about 82 per cent head of the sampled
households of Amravati district received education up to secondary and higher level, this
proportion for Beed district stood at only 68 per cent. Even the adult members of sampled
households showed higher educational status in Amravati district as 77 per cent adult
members of sampled households of Amravati district attained education up to secondary
and higher level, whereas this proportion for Beed district was only 66 per cent. The
illiteracy among heads of households was found to be more in the district of Beed as
against Amravati district. Similarly, the illiteracy among adult members was more
pronounced in the case of Beed district as compared to Amravati district. However, the
proportion of head of the households attaining education up to primary level was
relatively higher in Beed district as compared to Amravati district, which also held true in
the case of adult population.
3.5 Caste Composition of NFSM and Non-NFSM Farmers
Information relating to caste composition of various categories of sampled
farmers drawn from the NFSM district of Amravati and non-NFSM district of Beed is
provided in Table 3.5 and Table 3.6.
In the case of NFSM district of Amravati, majority of the sampled farmers
belonged to Other Backward Class (OBC) since 37 out of 50 sampled farmers belonged

50
to this category (Table 3.5). The number of sampled farmers belonging to Scheduled
Caste (SC) and Scheduled Tribe (ST) was 7 and 5, respectively, whereas only 1 sampled
farmer belonged to general category in the district of Amravati. Large, medium and small
category invariably showed higher number of farmers belonging to OBC category in the
district of Amravati.
Table 3.5: Caste Composition of Farmers in NFSM Amravati District
Category Sample Size SC ST OBC Others Total
Marginal 15 6 3 6 - 15
Small 19 1 1 17 - 19
Medium 10 - 1 8 1 10
Large 6 - - 6 - 6
Total 50 7 5 37 1 50
A further analysis with respect to cast composition revealed that 74 per cent of the
total sampled farmers of Amravati district belonged to OBC category, 10 per cent to ST,
14 per cent to SC and 2 per cent to general category (Table 3.5 (a)). Among various
categories of sampled farmers drawn from Amravati district, the proportion of farmers
belonging to OBC category was 100 per cent for large category, 80 per cent for medium,
89 per cent for small and 40 per cent for marginal category.
Table 3.5 (a): % Distribution of Caste Composition of Farmers in NFSM Amravati District
Category Sample Size SC ST OBC Others Total
Marginal 15 40.00 20.00 40.00 - 100.00
Small 19 5.26 5.26 89.47 - 100.00
Medium 10 - 10.00 80.00 10.00 100.00
Large 6 - - 100.00 - 100.00
Total 50 14.00 10.00 74.00 2.00 100.00
As for the non-NFSM district of Beed, as many as 41 out of 50 sampled farmers
belonged to general category, 4 to OBC and 5 to SC category (Table 3.6). Interestingly,
all the sampled farmers in small and large category belonged to general category in the
district of Beed.
Table 3.6: Caste Composition of Farmers in Non-NFSM Beed District
Category Sample Size SC ST OBC Others Total
Marginal 14 5 - 2 7 14
Small 17 - - - 17 17
Medium 13 - - 2 11 13
Large 6 - - - 6 6
Total 50 5 - 4 41 50
As for per cent distribution, about 82 per cent of the total sampled farmers of
Beed district belonged to general category, 8 per cent to OBC and 10 per cent to SC
category (Table 3.6 (a)). Among various categories of sampled farmers drawn from Beed

51
district, the proportion of farmers belonging to general category was 100 per cent for
large category, 85 per cent for medium, 100 per cent for small and 50 per cent for
marginal category. In the district of Beed, a significant proportion of marginal category
of farmers belonged to SC category.
Table 3.6 (a): % Distribution of Caste Composition of Farmers in Non-NFSM Beed District
Category Sample Size SC ST OBC Others Total
Marginal 14 35.71 - 14.29 50.00 100.00
Small 17 - - - 100.00 100.00
Medium 13 - - 15.38 84.62 100.00
Large 6 - - - 100.00 100.00
Total 50 10.00 - 8.00 82.00 100.00
Thus, two differing scenarios emerged in terms of caste composition of sampled
farmers drawn from the NFSM district of Amravati and non-NFSM district of Beed.
While majority of the sampled farmers in Amravati district belonged to the category of
OBC, the district of Beed was found to show a significant proportion of total sampled
farmers belonging to general category since 74 per cent of total sampled farmers in
Amravati district belonged to OBC category and 82 per cent of sampled farmers of Beed
district belonged to general category.
3.6 Irrigated Area in NFSM Amravati and Non-NFSM Beed District
Details regarding extent of area under irrigation and sources of irrigation on the
farms belonging to sampled farmers of NFSM district of Amravati and non-NFSM
district of Beed are provided in Table 3.7 and 3.8.
In the district of Amravati, the total operational holding was estimated at 30.65
acres for marginal category, 68.58 acres for small, 71.00 acres for medium and 76.56
acres for large category with a sum of 246.79 acres for all the sampled farmers put
together. All the categories of sampled farmers belonging to Amravati district showed
their entire area under rainfed conditions (Table 3.7). The area under irrigation was,
therefore, nil in the NFSM district of Amravati as the entire area of sampled farmers of
this district was unirrigated (Table 3.7 (a)).
Table 3.7: Irrigation Details for NFSM Amravati District
(Area in Acres)
Irrigated Category Sample Size
Canal Tubewell Tank Others Total Unirrigated Total
Marginal 15 - - - - - 30.65 30.65
Small 19 - - - - - 68.58 68.58
Medium 10 - - - - - 71.00 71.00
Large 6 - - - - - 76.56 76.56
Total 50 - - - - - 246.79 246.79

52
Table 3.7 (a): % Distribution of Irrigated Area by Source in NFSM Amravati District
Irrigated Category Sample Size
Canal Tubewell Tank Others Total Unirrigated Total
Marginal 15 - - - - - 100.00 100.00
Small 19 - - - - - 100.00 100.00
Medium 10 - - - - - 100.00 100.00
Large 6 - - - - - 100.00 100.00
Total 50 - - - - - 100.00 100.00
As for the non-NFSM district of Beed, the total operational holding was estimated
at 27.88 acres for marginal category, 73.25 acres for small, 92.43 acres for medium and
185.25 acres for large category with a sum of 378.81 acres for all the sampled farmers put
together (Table 3.8). The unirrigated area in the district of Beed was estimated at 27.88
acres for marginal category, 59.25 acres for small, 71.43 acres for medium and 100.25
acres for large category with a sum of 258.81 acres for all the sampled farmers put
together. In general, the area under irrigation with respect to average category of sampled
farmers of Beed district was found to be 31.68 per cent of the total operational holding
with large farmers showing higher proportion of their operational holding under irrigation
since proportion of irrigated area to total operational holding was found to be 45.88 per
cent for large category, 22.72 per cent for medium and 19.11 per cent for the small
category of farmers (Table 3.8 (a)).
Table 3.8: Irrigation Details for Non-NFSM Beed District (Area in Acres)
Irrigated Category Sample Size
Canal Tubewell Tank Others Total Unirrigated Total
Marginal 14 - - - - - 27.88 27.88
Small 17 - - - 14.00 14.00 59.25 73.25
Medium 13 - - - 21.00 21.00 71.43 92.43
Large 6 - 15.00 - 70.00 85.00 100.25 185.25
Total 50 - 15.00 - 105.00 120.00 258.81 378.81
Note: Other irrigated include area irrigated by open well in the case of small category, and open well and
river lift for medium and large categories of farmers
Table 3.8 (a): % Distribution of Irrigated Area by Source in Non-NFSM Beed District
Irrigated Category Sample Size
Canal Tubewell Tank Others Total Unirrigated Total
Marginal 15 - - - - - 100.00 100.00
Small 19 - - - 19.11 19.11 80.89 100.00
Medium 10 - - - 22.72 22.72 77.28 100.00
Large 6 - 8.10 - 37.79 45.88 54.12 100.00
Total 50 - 3.96 - 27.72 31.68 68.32 100.00
In the case of non-NFSM district of Beed, about 4 per cent of the total operational
holding of average category of sampled farmers was under tubewell irrigation and 28 per

53
cent under other sources of irrigation that encompassed open well and river lift. Tubewell
irrigation was noticed only in the case of medium category of sampled farmers who
showed 8 per cent of their operational holding under this source of irrigation. Majority of
the farmers belonging to the district of Beed showed open well and river lift as the major
source of irrigation since other source of irrigation accounted for 38 per cent of the total
operational holding in the case of large category, 23 per cent for medium category and 19
per cent for large category with an average of 28 per cent for the average category of
sampled farmers of Beed district.
Thus, the irrigation status was found to be entirely different in the NFSM district
of Amravati and non-NFSM district of Beed. While the entire area of sampled farmers in
Amravati district was under unirrigated or rainfed conditions, the sampled farmers of
non-NFSM Beed district showed 32 per cent of their total operational holding under
irrigation and 68 per cent under rainfed conditions. In the non-NFSM district of Beed,
open well and river lift were the main sources of irrigation. The irrigated area under open
well and river lift accounted for as much as 28 per cent share in total operational holding
of the average category of sampled farmers of Beed district. The area under tubewell
irrigation was only 4 per cent for the average category of sampled farmers of Beed
district. The marginal category of sampled farmers of Beed district showed their entire
area under rainfed conditions.
3.7 Cropping Pattern of NFSM and Non-NFSM Farmers
Cropping pattern assumes considerable significance in determining farmer’s net
annual income through crop husbandry. Though farmers prefer to grow those crops that
yield higher net returns, they are constrained to grow several high value field crops due to
varied agro-climatic conditions as well as topography and soil type across various regions
or within the same region. In general, the cropping pattern of irrigated area differs from
the cropping pattern of un-irrigated area. While on one hand, high value commercial field
crops are usually grown under irrigated conditions, low value subsistence crops, on the
other hand, find place under rainfed conditions. However, there are several important
course cereal and pulses crops like jowar, mung, tur, etc. that find place in terms of
output and area allocation even under dry or rainfed conditions. The information on
average area allocation (average of 2006-07, 2007-08, 2008-09) under different crops
grown under different seasons by the sampled farmers of NFSM district of Amravati and
non-NFSM district of Beed is provided in Table 3.9 and Table 3.10. The cropping pattern

54
of various categories of sampled farmers of Amravati and Beed districts for individual
years of 2006-07, 2007-08 and 2008-09 is brought out in Appendix 1 and 2.
In the NFSM district of Amravati, the cropping pattern of sampled farmers was
seen to be in favour of cultivating soybean, jowar, cotton, bajra, sunflower, ladyfinger,
mung and tur in kharif season and gram and sunflower in rabi season. All the categories
of sampled farmers put together of Amravati district showed a net sown area of 227.74
acres in kharif season, which encompassed 167.06 acres of area under pulse crops like
mung and tur, and 60.67 acres area under other crops like soybean, jowar, cotton, bajra
and some other crops viz. sunflower and ladyfinger (Table 3.9). The net sown area with
all the sampled farmers of Amravati district put together was estimated at 158.23 acres in
rabi season, which encompassed 149.69 acres under gram and 8.54 acres under other crop
like sunflower. Thus, pulses crops predominated in the cropping pattern of sampled
farmers of Amravati district since the average category of farmer of this district showed
73 per cent of net sown area under pulses crops in kharif season and as high as 95 per
cent in rabi season (Table 3.9 (a)). The other crops that dominated the cropping pattern of
sampled farmers of Amravati district in kharif season were cotton and jower with a share
of 8-9 per cent in the net sown area of the average category of farmers.
Table 3.9: Cropping Pattern – Over All Seasons: NFSM Amravati District (Area in Acres; Average of 2006-07, 2007-08, 2008-09)
Area Sown
Kharif Season Rabi Season
Other Crops Pulses Pulse Other Category
Soybean Jowar Cotton Bajra Others Total Mung Tur Total G.
Total Gram
Sunflo
wer Total
G.
Total
Marginal 2.75 1.33 1.00 - 0.67 5.75 19.25 1.58 20.83 26.58 21.33 2.42 23.75 50.33
Small 3.52 4.49 5.23 0.87 4.24 18.34 39.45 5.22 44.66 63.00 39.69 1.79 41.48 104.48
Medium 3.50 5.25 7.00 - 3.00 18.75 44.08 5.42 49.50 68.25 43.17 2.00 45.17 113.42
Large 4.33 6.50 6.67 - 0.33 17.83 47.40 4.67 52.07 69.90 45.50 2.33 47.83 117.73
Total 14.10 17.57 19.90 0.87 8.24 60.67 150.18 16.88 167.06 227.74 149.69 8.54 158.23 385.97
Note: In 2007-08 ‘Others’ under other crops include Kharif Sunflower and in 2008-09, ‘Others’ under
other crops include Kharif Sunflower and Ladyfinger
Table 3.9 (a): Cropping Pattern – Over All Seasons: NFSM Amravati District
(% of Total Area Sown; Average of 2006-07, 2007-08, 2008-09)
Area Sown
Kharif Season Rabi Season
Other Crops Pulses Pulse Other Category
Soybean Jowar Cotton Bajra Others Total Mung Tur Total G.
Total Gram
Sunflo
wer Total
Marginal 10.35 5.00 3.76 - 2.52 21.63 72.42 5.94 78.37 100.00 89.81 10.19 100.00
Small 5.59 7.13 8.30 1.38 6.73 29.11 62.62 8.29 70.89 100.00 95.68 4.32 100.00
Medium 5.13 7.69 10.26 - 4.40 27.47 64.59 7.94 72.53 100.00 95.57 4.43 100.00
Large 6.19 9.30 9.54 - 0.47 25.51 67.81 6.68 74.49 100.00 95.13 4.87 100.00
Total 6.19 7.71 8.74 0.38 3.62 26.64 65.94 7.41 73.36 100.00 94.60 5.40 100.00
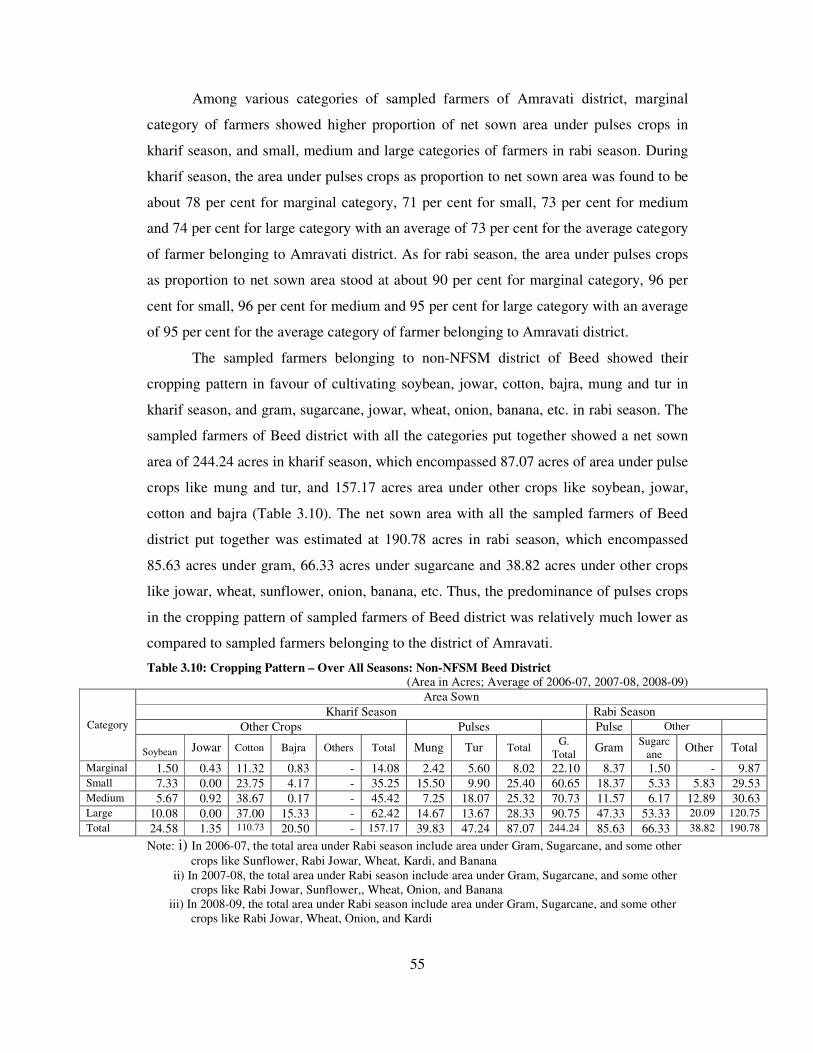
55
Among various categories of sampled farmers of Amravati district, marginal
category of farmers showed higher proportion of net sown area under pulses crops in
kharif season, and small, medium and large categories of farmers in rabi season. During
kharif season, the area under pulses crops as proportion to net sown area was found to be
about 78 per cent for marginal category, 71 per cent for small, 73 per cent for medium
and 74 per cent for large category with an average of 73 per cent for the average category
of farmer belonging to Amravati district. As for rabi season, the area under pulses crops
as proportion to net sown area stood at about 90 per cent for marginal category, 96 per
cent for small, 96 per cent for medium and 95 per cent for large category with an average
of 95 per cent for the average category of farmer belonging to Amravati district.
The sampled farmers belonging to non-NFSM district of Beed showed their
cropping pattern in favour of cultivating soybean, jowar, cotton, bajra, mung and tur in
kharif season, and gram, sugarcane, jowar, wheat, onion, banana, etc. in rabi season. The
sampled farmers of Beed district with all the categories put together showed a net sown
area of 244.24 acres in kharif season, which encompassed 87.07 acres of area under pulse
crops like mung and tur, and 157.17 acres area under other crops like soybean, jowar,
cotton and bajra (Table 3.10). The net sown area with all the sampled farmers of Beed
district put together was estimated at 190.78 acres in rabi season, which encompassed
85.63 acres under gram, 66.33 acres under sugarcane and 38.82 acres under other crops
like jowar, wheat, sunflower, onion, banana, etc. Thus, the predominance of pulses crops
in the cropping pattern of sampled farmers of Beed district was relatively much lower as
compared to sampled farmers belonging to the district of Amravati.
Table 3.10: Cropping Pattern – Over All Seasons: Non-NFSM Beed District (Area in Acres; Average of 2006-07, 2007-08, 2008-09)
Area Sown
Kharif Season Rabi Season
Other Crops Pulses Pulse Other Category
Soybean Jowar Cotton Bajra Others Total Mung Tur Total G.
Total Gram
Sugarc
ane Other Total
Marginal 1.50 0.43 11.32 0.83 - 14.08 2.42 5.60 8.02 22.10 8.37 1.50 - 9.87
Small 7.33 0.00 23.75 4.17 - 35.25 15.50 9.90 25.40 60.65 18.37 5.33 5.83 29.53
Medium 5.67 0.92 38.67 0.17 - 45.42 7.25 18.07 25.32 70.73 11.57 6.17 12.89 30.63
Large 10.08 0.00 37.00 15.33 - 62.42 14.67 13.67 28.33 90.75 47.33 53.33 20.09 120.75
Total 24.58 1.35 110.73 20.50 - 157.17 39.83 47.24 87.07 244.24 85.63 66.33 38.82 190.78
Note: i) In 2006-07, the total area under Rabi season include area under Gram, Sugarcane, and some other
crops like Sunflower, Rabi Jowar, Wheat, Kardi, and Banana ii) In 2007-08, the total area under Rabi season include area under Gram, Sugarcane, and some other
crops like Rabi Jowar, Sunflower,, Wheat, Onion, and Banana
iii) In 2008-09, the total area under Rabi season include area under Gram, Sugarcane, and some other
crops like Rabi Jowar, Wheat, Onion, and Kardi

56
The average category of farmer in Beed district showed 36 per cent of net sown
area under pulses crops in kharif season and 45 per cent in rabi season (Table 3.10 (a)). In
the non-NFSM district of Beed, the major crop that predominated in the cropping pattern
of sampled farmers during kharif season was cotton, which alone accounted for 45 per
cent share in the net sown area of the average category of farmers. During rabi season,
sugarcane accounted for as much as 35 per cent share in the net sown area of the average
category of farmer belonging to Beed district.
Table 3.10 (a): Cropping Pattern – Over All Seasons: Non-NFSM Beed District (% of Total Area Sown; Average of 2006-07, 2007-08, 2008-09)
Area Sown
Kharif Season Rabi Season
Other Crops Pulses Pulse Other Category
Soybean Jowar Cotton Bajra Others Total Mung Tur Total G.
Total Gram
Sugarc
ane Other Total
Marginal 6.79 1.95 51.22 3.76 - 63.71 10.95 25.34 36.29 100.00 84.80 15.20 - 100.00
Small 12.09 0.00 39.16 6.88 - 58.12 25.56 16.32 41.88 100.00 62.21 18.05 19.74 100.00
Medium 8.02 1.30 54.67 0.24 - 64.22 10.25 25.55 35.80 100.00 37.77 20.14 42.09 100.00
Large 11.11 0.00 40.77 16.89 - 68.78 16.17 15.06 31.22 100.00 39.20 44.17 16.63 100.00
Total 10.06 0.55 45.34 8.39 - 64.35 16.31 19.34 35.65 100.00 44.88 34.77 20.35 100.00
Note: i) In 2006-07, the total area under Rabi season include area under Gram, Sugarcane, and some other
crops like Sunflower, Rabi Jowar, Wheat, Kardi, and Banana ii) In 2007-08, the total area under Rabi season include area under Gram, Sugarcane, and some other
crops like Rabi Jowar, Sunflower,, Wheat, Onion, and Banana
iii) In 2008-09, the total area under Rabi season include area under Gram, Sugarcane, and some other
crops like Rabi Jowar, Wheat, Onion, and Kardi
As for various categories of sampled farmers belonging to Beed district, medium
category of farmers showed higher proportion of net sown area under pulses crops in
kharif season, and marginal and small categories of farmers in rabi season. During kharif
season, the area under pulses crops as proportion to net sown area was found to be about
36 per cent for marginal category, 42 per cent for small, 36 per cent for medium and 31
per cent for large category with an average of 36 per cent for the average category of
farmer belonging to Beed district. In the case of rabi season, the area under pulses crops
as proportion to net sown area was estimated at about 85 per cent for marginal category,
62 per cent for small, 38 per cent for medium and 39 per cent for large category with an
average of 45 per cent for the average category of farmer belonging to Beed district. The
large category of farmers of Beed district showed significantly high acreage under
sugarcane crop in rabi season as 44 per cent of the net sown area of large category was
under sugarcane during this season. Similarly, medium category of farmers of Beed
district showed significantly high acreage under cotton crop in kharif season since 55 per
cent of the net sown area of medium category was under cotton during this season.

57
The foregoing observations bring us closer to the fact that the cropping pattern of
sampled farmers drawn from the NFSM district of Amravati and non-NFSM district of
Beed differed significantly. While pulses crops predominated the cropping pattern of
sampled farmers of Amravati district during both kharif and rabi seasons, the area
predominance with respect to pulses crops was less for the sampled farmers drawn from
the district of Beed. This is concomitant from the fact that the average category of farmer
belonging to Amravati district showed 73 per cent of the net sown area under pulses
crops in kharif season and 95 per cent in rabi season, whereas these proportions in the
district of Beed were worked out at 36 per cent and 45 per cent. The average category of
sampled farmers belonging to the district of Beed had about 45 per cent of net sown area
under cotton crop in kharif season and 35 per cent of the net sown area under sugarcane
in rabi season. In the case of non-NFSM district of Beed, some other rabi crops like
jowar, banana, wheat, onion, etc. accounted for significant share in net sown area for the
average category of sampled farmers.
3.8 Area under Pulses for NFSM and Non-NFSM Farmers
The empirical estimates with respect to average area (average of 2006-07, 2007-
08, 2008-09) under pulses crops during kharif and rabi seasons across various categories
of sampled farmers drawn from the NFSM district of Amravati and non-NFSM district of
Beed are provided in Table 3.11 and Table 3.12.
In the NFSM district of Amravati, the average area under pulses encompassing
the period between 2006-07 and 2008-09 was estimated at 167.06 acres in kharif season
and 149.09 acres in rabi season for all the sampled farmers put together drawn from the
district of Amravati, which included 150.18 acres of area under mung and 16.88 acres of
area under tur in kharif season and entire 149.09 acres of area under gram in rabi season
(Table 3.11). The area under mung and tur in kharif season and gram in rabi season
increased with the increase in land holding size of sampled farmers of Amravati district.
However, the proportion of area under mung to net sown area under pulses crops stood at
92 per cent for marginal category, 88 per cent for small, 89 per cent for medium and 91
per cent for large category with an overall average of 90 per cent for the average category
of farmers drawn from the district of Amravati, whereas for tur crop this proportion was
estimated at 8 per cent for marginal category, 12 per cent for small, 11 per cent for
medium and 9 per cent for large category with an overall average of 10 per cent for the
average category of farmers. In the case of rabi season, the entire net sown area under

58
pulse crop was found to be under gram crop for various categories of sampled farmers
drawn from the district of Amravati (Table 3.11 (a)).
Table 3.11: Area Under Pulses: Over All Seasons: NFSM Amravati District
(Area in Acres; Average of 2006-07, 2007-08, 2008-09) Area Sown
Kharif Season Rabi Season Category
Mung Tur Total Gram Total
Marginal 19.25 1.58 20.83 21.33 21.33
Small 39.45 5.22 44.66 39.69 39.69
Medium 44.08 5.42 49.50 43.17 43.17
Large 47.40 4.67 52.07 45.50 45.50
Total 150.18 16.88 167.06 149.69 149.69
Table 3.11 (a): % Distribution of Area Under Pulses: Over All Seasons: NFSM Amravati District
(Area in Acres; Average of 2006-07, 2007-08, 2008-09) Area Sown
Kharif Season Rabi Season Category
Mung Tur Total Gram Total
Marginal 92.41 7.59 100.00 100.00 100.00
Small 88.33 11.69 100.00 100.00 100.00
Medium 89.05 10.95 100.00 100.00 100.00
Large 91.03 8.97 100.00 100.00 100.00
Total 89.90 10.10 100.00 100.00 100.00
As for the non-NFSM district of Beed, the average area under pulses for the
period between 2006-07 and 2008-09 was estimated at 87.07 acres in kharif season and
85.63 acres in rabi season for all the sampled farmers put together drawn from the district
of Beed, which encompassed 39.83 acres of area under mung and 47.24 acres of area
under tur in kharif season and entire 85.63 acres of area under gram in rabi season (Table
3.12). In general, the area under pulses increased with the increase in land holding size of
sampled farmers of Beed district, particularly in kharif season. However, the proportion
of area under mung to net sown area under pulses in kharif season stood at 30 per cent for
marginal category, 61 per cent for small, 29 per cent for medium and 52 per cent for large
category with an overall average of 46 per cent for the average category of farmers drawn
from the district of Beed, whereas for tur crop this proportion was estimated at 70 per
cent for marginal category, 39 per cent for small, 71 per cent for medium and 48 per cent
for large category with an overall average of 54 per cent for the average category of
farmers. In the case of rabi season, the entire net sown area of pulse crop was found to be
under gram crop for various categories of sampled farmers drawn from the district of
Beed (Table 3.12 (a)). Therefore, in the non-NFSM district of Beed, tur crop in kharif
season and gram in rabi season cornered significantly high share in net pulses sown area
of the sampled farmers for the respective seasons.
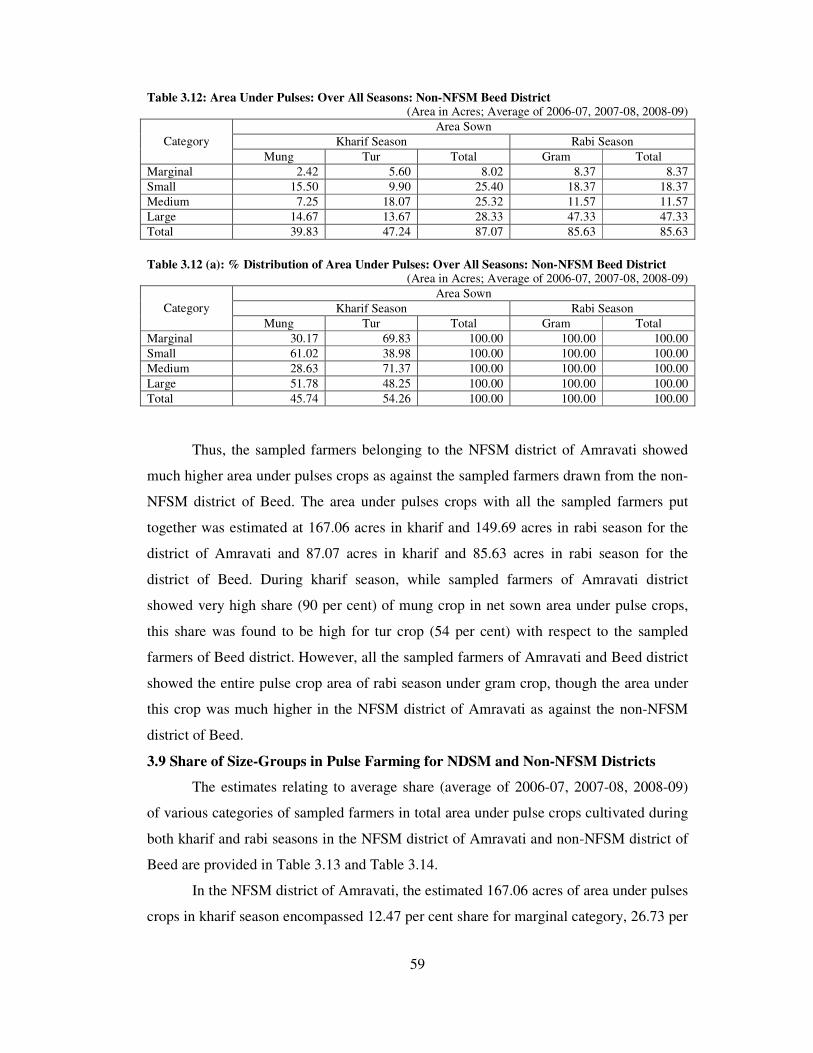
59
Table 3.12: Area Under Pulses: Over All Seasons: Non-NFSM Beed District (Area in Acres; Average of 2006-07, 2007-08, 2008-09)
Area Sown
Kharif Season Rabi Season Category
Mung Tur Total Gram Total
Marginal 2.42 5.60 8.02 8.37 8.37
Small 15.50 9.90 25.40 18.37 18.37
Medium 7.25 18.07 25.32 11.57 11.57
Large 14.67 13.67 28.33 47.33 47.33
Total 39.83 47.24 87.07 85.63 85.63
Table 3.12 (a): % Distribution of Area Under Pulses: Over All Seasons: Non-NFSM Beed District
(Area in Acres; Average of 2006-07, 2007-08, 2008-09) Area Sown
Kharif Season Rabi Season Category
Mung Tur Total Gram Total
Marginal 30.17 69.83 100.00 100.00 100.00
Small 61.02 38.98 100.00 100.00 100.00
Medium 28.63 71.37 100.00 100.00 100.00
Large 51.78 48.25 100.00 100.00 100.00
Total 45.74 54.26 100.00 100.00 100.00
Thus, the sampled farmers belonging to the NFSM district of Amravati showed
much higher area under pulses crops as against the sampled farmers drawn from the non-
NFSM district of Beed. The area under pulses crops with all the sampled farmers put
together was estimated at 167.06 acres in kharif and 149.69 acres in rabi season for the
district of Amravati and 87.07 acres in kharif and 85.63 acres in rabi season for the
district of Beed. During kharif season, while sampled farmers of Amravati district
showed very high share (90 per cent) of mung crop in net sown area under pulse crops,
this share was found to be high for tur crop (54 per cent) with respect to the sampled
farmers of Beed district. However, all the sampled farmers of Amravati and Beed district
showed the entire pulse crop area of rabi season under gram crop, though the area under
this crop was much higher in the NFSM district of Amravati as against the non-NFSM
district of Beed.
3.9 Share of Size-Groups in Pulse Farming for NDSM and Non-NFSM Districts
The estimates relating to average share (average of 2006-07, 2007-08, 2008-09)
of various categories of sampled farmers in total area under pulse crops cultivated during
both kharif and rabi seasons in the NFSM district of Amravati and non-NFSM district of
Beed are provided in Table 3.13 and Table 3.14.
In the NFSM district of Amravati, the estimated 167.06 acres of area under pulses
crops in kharif season encompassed 12.47 per cent share for marginal category, 26.73 per

60
cent share for small, 29.63 per cent share for medium and 31.17 per cent share for large
category of sampled farmers, showing a rise in share in total area under kharif pulse crops
with the rise in land holding size of farmers (Table 3.13). Similarly, the estimated 149.69
acres of area under pulses crops in rabi season in Amravati district encompassed 14.25
per cent share for marginal category, 26.51 per cent share for small, 28.84 per cent share
for medium and 30.40 per cent share for large category of sampled farmers, showing an
increase in share in total area under rabi pulse crops with the increase in land holding size
of farmers (Table 3.13).
Table 3.13: Share of Different Size-Groups in Pulse Farming: Over All Seasons: NFSM Amravati District
(Area in Acres; Average of 2006-07, 2007-08, 2008-09) Area Sown
Kharif Season Rabi Season Category
Total Area Under
Pulses
% Share in Total
Area
Total Area Under
Pulses
% Share in Total
Area
Marginal 20.83 12.47 21.33 14.25
Small 44.66 26.73 39.69 26.51
Medium 49.50 29.63 43.17 28.84
Large 52.07 31.17 45.50 30.40
Total 167.06 100.00 149.69 100.00
In the total area under pulses crops in kharif season estimated at 87.07 acres in the
non-NFSM district of Beed, while the marginal category of sampled farmers showed a
share of 9.21 per cent, 29.17 per cent share was accounted for by small category, 29.08
per cent share by medium category and 32.54 per cent by large category of sampled
farmers, indicating a rise in share in total area under kharif pulse crops with the rise in
land holding size of farmers (Table 3.14). However, in the total area under pulses crops in
rabi season estimated at 85.63 acres in the non-NFSM district of Beed, the marginal,
small, medium and large category of farmers showed a share of 9.77 per cent, 21.45 per
cent, 13.51 per cent and 55.27 per cent, respectively, indicating higher share of large
category of sampled farmers in total area under pulse crops grown during rabi season.
Table 3.14: Share of Different Size-Groups in Pulse Farming: Over All Seasons: Non-NFSM Beed District
(Area in Acres; Average of 2006-07, 2007-08, 2008-09) Area Sown
Kharif Season Rabi Season Category
Total Area Under
Pulses
% Share in Total
Area
Total Area Under
Pulses
% Share in Total
Area
Marginal 8.02 9.21 8.37 9.77
Small 25.40 29.17 18.37 21.45
Medium 25.32 29.08 11.57 13.51
Large 28.33 32.54 47.33 55.27
Total 87.07 100.00 85.63 100.00

61
Thus, the sampled farmers of NFSM district of Amravati and non-NFSM district
of Beed showed a rise in their share in total area under pulses crops cultivated during
kharif and rabi seasons with the rise in their land holding size. In the NFSM district of
Amravati, the share of marginal, small, medium and large category in total area under
pulses crops was estimated at 12.47 per cent, 26.73 per cent, 29.63 per cent and 31.17 per
cent, respectively, in kharif season and, 14.25 per cent, 26.51 per cent, 28.84 per cent,
and 30.40 per cent, respectively, in rabi season. As for the non-NFSM district of Beed,
the share of marginal, small, medium and large category in total area under pulses crops
was estimated at 9.21 per cent, 29.17 per cent, 29.08 per cent and 32.54 per cent,
respectively, in kharif season and, 9.77 per cent, 21.45 per cent, 13.51 per cent, and 55.27
per cent, respectively, in rabi season.
3.10 Irrigated Area under Pulses in NFSM and Non-NFSM Districts
The estimates relating to the extent of average (average of 2006-07, 2007-08,
2008-09) area under irrigation for various pulses crops cultivated during kharif and rabi
seasons by various categories of sampled farmers of NFSM district of Amravati and non-
NFSM district of Beed are provided in Table 3.15 and 3.16.
In the NFSM district of Amravati, although the net sown area under pulses crops
with all the sampled farmers put together stood at 167.06 acres in kharif season and
149.69 acres in rabi season, the entire area under pulses crops during both kharif and rabi
seasons was found to be rainfed or unirrigated, and, therefore, the proportion of irrigated
area to net sown area with respect to pulses crops was nil in this district (Table 3.15).
Table 3.15: Percentage of Irrigated Area under Pulses: Over All Seasons: NFSM Amravati District
(Area in Acres; Average of 2006-07, 2007-08, 2008-09) Irrigated Area
Kharif Season Rabi Season Category
Mung Tur Total Gram Total
Marginal - - - - -
Small - - - - -
Medium - - - - -
Large - - - - -
Total - - - - -
Total Area Under the Crop
Marginal 19.25 1.58 20.83 21.33 21.33
Small 39.45 5.22 44.66 39.69 39.69
Medium 44.08 5.42 49.50 43.17 43.17
Large 47.40 4.67 52.07 45.50 45.50
Total 150.18 16.88 167.06 149.69 149.69
% of Irrigated Area
Marginal - - - - -
Small - - - - -
Medium - - - - -
Large - - - - -
Total - - - - -
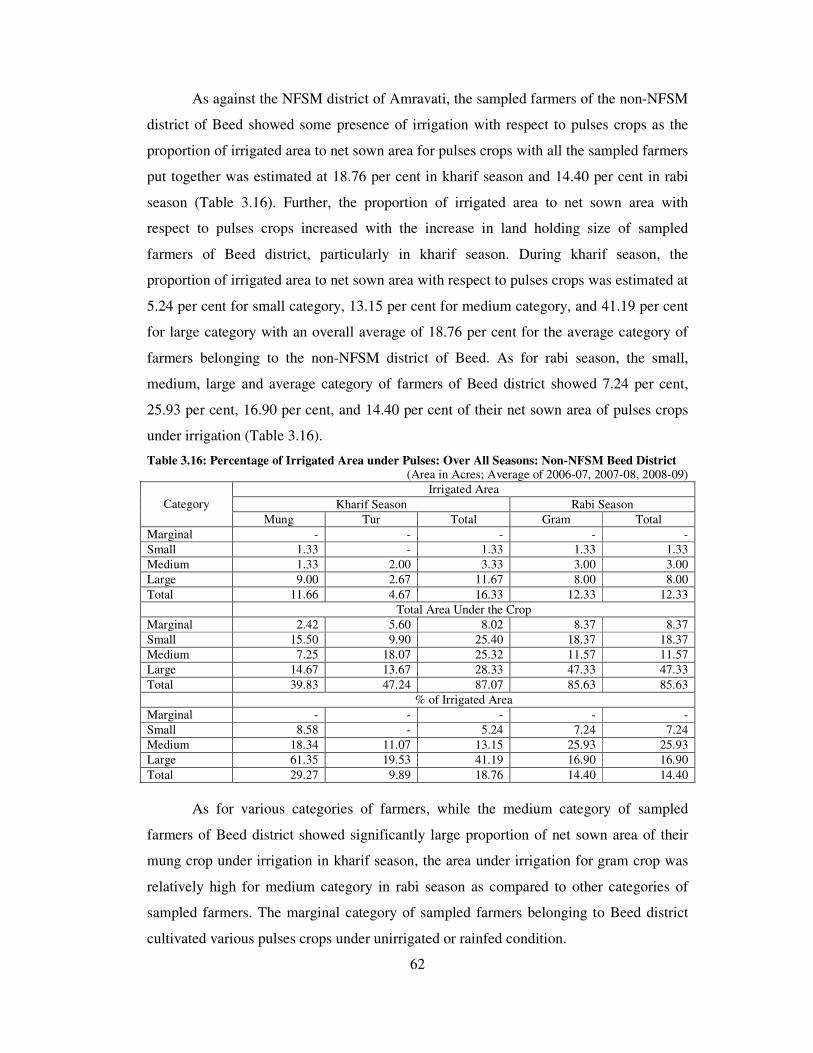
62
As against the NFSM district of Amravati, the sampled farmers of the non-NFSM
district of Beed showed some presence of irrigation with respect to pulses crops as the
proportion of irrigated area to net sown area for pulses crops with all the sampled farmers
put together was estimated at 18.76 per cent in kharif season and 14.40 per cent in rabi
season (Table 3.16). Further, the proportion of irrigated area to net sown area with
respect to pulses crops increased with the increase in land holding size of sampled
farmers of Beed district, particularly in kharif season. During kharif season, the
proportion of irrigated area to net sown area with respect to pulses crops was estimated at
5.24 per cent for small category, 13.15 per cent for medium category, and 41.19 per cent
for large category with an overall average of 18.76 per cent for the average category of
farmers belonging to the non-NFSM district of Beed. As for rabi season, the small,
medium, large and average category of farmers of Beed district showed 7.24 per cent,
25.93 per cent, 16.90 per cent, and 14.40 per cent of their net sown area of pulses crops
under irrigation (Table 3.16).
Table 3.16: Percentage of Irrigated Area under Pulses: Over All Seasons: Non-NFSM Beed District (Area in Acres; Average of 2006-07, 2007-08, 2008-09)
Irrigated Area
Kharif Season Rabi Season Category
Mung Tur Total Gram Total
Marginal - - - - -
Small 1.33 - 1.33 1.33 1.33
Medium 1.33 2.00 3.33 3.00 3.00
Large 9.00 2.67 11.67 8.00 8.00
Total 11.66 4.67 16.33 12.33 12.33
Total Area Under the Crop
Marginal 2.42 5.60 8.02 8.37 8.37
Small 15.50 9.90 25.40 18.37 18.37
Medium 7.25 18.07 25.32 11.57 11.57
Large 14.67 13.67 28.33 47.33 47.33
Total 39.83 47.24 87.07 85.63 85.63
% of Irrigated Area
Marginal - - - - -
Small 8.58 - 5.24 7.24 7.24
Medium 18.34 11.07 13.15 25.93 25.93
Large 61.35 19.53 41.19 16.90 16.90
Total 29.27 9.89 18.76 14.40 14.40
As for various categories of farmers, while the medium category of sampled
farmers of Beed district showed significantly large proportion of net sown area of their
mung crop under irrigation in kharif season, the area under irrigation for gram crop was
relatively high for medium category in rabi season as compared to other categories of
sampled farmers. The marginal category of sampled farmers belonging to Beed district
cultivated various pulses crops under unirrigated or rainfed condition.

63
The foregoing observation presented us with two differing scenarios. While the
sampled farmers belonging to the NFSM district cultivated various pulses crops under
rainfed conditions, the cultivation of these crops by the sampled farmers of non-NFSM
district of Beed was under both irrigated and unirrigated conditions. However, the extent
of area under irrigation with respect to pulses crops was very low in Beed district, and, in
general, the proportion of irrigated area to net sown area for pulses crops with all the
sampled farmers put together stood at 18.76 per cent in kharif season and 14.40 per cent
in rabi season. It was only in the case of mung that about 61 per cent of net sown area
was under irrigation in the case of large category of sampled farmers belonging to the
non-NFSM district of Beed.
A further analysis is presented with respect to area under various crops, including
crops other than pulses like soybean, jowar, cotton, bajra, sugarcane, etc. and the share of
these crops in gross irrigated area (GIA) of the sampled farmers belonging to the NFSM
district of Amravati and non-NFSM district of Beed, and these estimates (average of
2006-07, 2007-08, 2008-09) are brought out in Table 3.17 and 3.18.
It is to be noted that since all the crops cultivated by sampled farmers belonging
to NFSM district of Amravati were under rainfed conditions, the estimates presented in
Table 3.17 pertain to area under various crops cultivated during kharif and rabi seasons
and the share of these crops in net sown area under kharif and rabi seasons. These
estimates have already been presented in Table 3.9 and Table 3.9 (a) and discussed under
cropping pattern with respect to sampled farmers of NFSM district of Amravati.
Table 3.17: Crop-wise Share in Un-irrigated Area – Over All Seasons: NFSM Amravati District
(Area in Acres; Average of 2006-07, 2007-08, 2008-09)
Total Area Un-irrigated
Kharif Season Rabi Season
Other Crops Pulses Pulse Other Category
Soybean Jowar Cotton Bajra Others Total Mung Tur Total G.
Total Gram
Sunflo
wer Total
Marginal 2.75 1.33 1.00 - 0.67 5.75 19.25 1.58 20.83 26.58 21.33 2.42 23.75
Small 3.52 4.49 5.23 0.87 4.24 18.34 39.45 5.22 44.66 63.00 39.69 1.79 41.48
Medium 3.50 5.25 7.00 - 3.00 18.75 44.08 5.42 49.50 68.25 43.17 2.00 45.17
Large 4.33 6.50 6.67 - 0.33 17.83 47.40 4.67 52.07 69.90 45.50 2.33 47.83
Total 14.10 17.57 19.90 0.87 8.24 60.67 150.18 16.88 167.06 227.74 149.69 8.54 158.23
% of Area Un-irrigated
Marginal 10.35 5.00 3.76 - 2.52 21.63 72.42 5.94 78.37 100.00 89.81 10.19 100.00
Small 5.59 7.13 8.30 1.38 6.73 29.11 62.62 8.29 70.89 100.00 95.68 4.32 100.00
Medium 5.13 7.69 10.26 - 4.40 27.47 64.59 7.94 72.53 100.00 95.57 4.43 100.00
Large 6.19 9.30 9.54 - 0.47 25.51 67.81 6.68 74.49 100.00 95.13 4.87 100.00
Total 6.19 7.71 8.74 0.38 3.62 26.64 65.94 7.41 73.36 100.00 94.60 5.40 100.00
Note: 1) In 2007-08 ‘Others’ under other crops include Kharif Sunflower and in 2008-09, ‘Others’ under
other crops include Kharif Sunflower and Ladyfinger 2) All the crops cultivated in Amravati district are under un-irrigated conditions and, therefore, share
is worked out in Un-irrigated Area
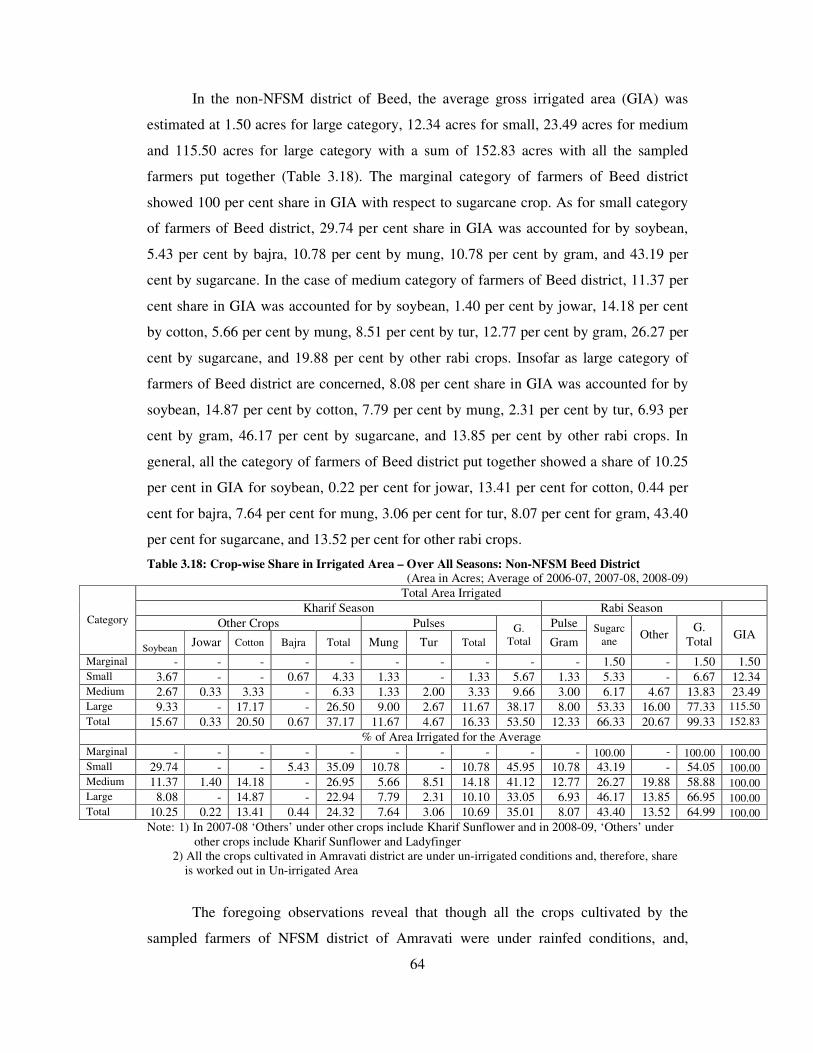
64
In the non-NFSM district of Beed, the average gross irrigated area (GIA) was
estimated at 1.50 acres for large category, 12.34 acres for small, 23.49 acres for medium
and 115.50 acres for large category with a sum of 152.83 acres with all the sampled
farmers put together (Table 3.18). The marginal category of farmers of Beed district
showed 100 per cent share in GIA with respect to sugarcane crop. As for small category
of farmers of Beed district, 29.74 per cent share in GIA was accounted for by soybean,
5.43 per cent by bajra, 10.78 per cent by mung, 10.78 per cent by gram, and 43.19 per
cent by sugarcane. In the case of medium category of farmers of Beed district, 11.37 per
cent share in GIA was accounted for by soybean, 1.40 per cent by jowar, 14.18 per cent
by cotton, 5.66 per cent by mung, 8.51 per cent by tur, 12.77 per cent by gram, 26.27 per
cent by sugarcane, and 19.88 per cent by other rabi crops. Insofar as large category of
farmers of Beed district are concerned, 8.08 per cent share in GIA was accounted for by
soybean, 14.87 per cent by cotton, 7.79 per cent by mung, 2.31 per cent by tur, 6.93 per
cent by gram, 46.17 per cent by sugarcane, and 13.85 per cent by other rabi crops. In
general, all the category of farmers of Beed district put together showed a share of 10.25
per cent in GIA for soybean, 0.22 per cent for jowar, 13.41 per cent for cotton, 0.44 per
cent for bajra, 7.64 per cent for mung, 3.06 per cent for tur, 8.07 per cent for gram, 43.40
per cent for sugarcane, and 13.52 per cent for other rabi crops.
Table 3.18: Crop-wise Share in Irrigated Area – Over All Seasons: Non-NFSM Beed District
(Area in Acres; Average of 2006-07, 2007-08, 2008-09)
Total Area Irrigated
Kharif Season Rabi Season
Other Crops Pulses Pulse Category
Soybean Jowar Cotton Bajra Total Mung Tur Total
G.
Total Gram
Sugarc
ane Other
G.
Total GIA
Marginal - - - - - - - - - - 1.50 - 1.50 1.50
Small 3.67 - - 0.67 4.33 1.33 - 1.33 5.67 1.33 5.33 - 6.67 12.34 Medium 2.67 0.33 3.33 - 6.33 1.33 2.00 3.33 9.66 3.00 6.17 4.67 13.83 23.49 Large 9.33 - 17.17 - 26.50 9.00 2.67 11.67 38.17 8.00 53.33 16.00 77.33 115.50
Total 15.67 0.33 20.50 0.67 37.17 11.67 4.67 16.33 53.50 12.33 66.33 20.67 99.33 152.83
% of Area Irrigated for the Average
Marginal - - - - - - - - - - 100.00 - 100.00 100.00
Small 29.74 - - 5.43 35.09 10.78 - 10.78 45.95 10.78 43.19 - 54.05 100.00
Medium 11.37 1.40 14.18 - 26.95 5.66 8.51 14.18 41.12 12.77 26.27 19.88 58.88 100.00
Large 8.08 - 14.87 - 22.94 7.79 2.31 10.10 33.05 6.93 46.17 13.85 66.95 100.00
Total 10.25 0.22 13.41 0.44 24.32 7.64 3.06 10.69 35.01 8.07 43.40 13.52 64.99 100.00
Note: 1) In 2007-08 ‘Others’ under other crops include Kharif Sunflower and in 2008-09, ‘Others’ under
other crops include Kharif Sunflower and Ladyfinger 2) All the crops cultivated in Amravati district are under un-irrigated conditions and, therefore, share
is worked out in Un-irrigated Area
The foregoing observations reveal that though all the crops cultivated by the
sampled farmers of NFSM district of Amravati were under rainfed conditions, and,
65
therefore, GIA in this district stood nil, the sampled farmers of non-NFSM district Beed,
however, showed some irrigated area under various crops during both kharif and rabi
seasons, and, the GIA in this district was estimated at 152.83 acres for the all the sampled
farmers put together, which encompassed 10.25 per cent area under soybean, 0.22 per
cent under jowar, 13.41 per cent under cotton, 0.44 per cent under bajra, 7.64 per cent
under mung, 3.06 per cent under tur, 8.07 per cent under gram, 43.40 per cent under
sugarcane, and 13.52 per cent under other rabi crops like jowar, wheat, onion, banana,
etc. The area under pulses crops was not much under irrigated conditions in the district of
Beed as the share of kharif pulses in GIA for all the sampled farmers put together stood at
10.69 per cent, and this share with respect to rabi pulses like gram was estimated at only
8.07 per cent. In fact, other crops cornered major share in GIA for various categories of
farmers of Beed district since the share of other kharif crops in GIA was 35 per cent and
other rabi crops accounted for as much as 65 per cent share in GIA for all the sampled
farmers of non-NFSM district of Beed. Among various crops, sugarcane alone accounted
for 43 per cent share in GIA with respect to the sampled farmers of Beed. Thus, area
under irrigation differed significantly across various crops cultivated by the sampled
farmers drawn from the non-NFSM district of Beed.
***********
66
CHAPTER – IV
ECONOMICS OF PULSES CULTIVATION
Having discussed and evaluated in brief the underlying growth trends in area,
production and productivity of various important crops cultivated in the state of
Maharashtra with focus on various pulses crops and trends in various other quantitative
parameters of agricultural sector of the State in chapter II and socio-economic
characteristics, cropping pattern, land utilization pattern, irrigation status, etc. of various
categories of sampled farmers belonging to NFSM district of Amravati and non-NFSM
district of Beed in chapter III, this chapter examines the extent of profit involved in the
cultivation of pulses crops vis-à-vis other crops in both NFSM district of Amravati and
non-NFSM district of Beed. The economics of cultivation of pulses crops vis-à-vis other
crops is evaluated for all the categories of sampled farmers with respect to three reference
years viz. 2006-07, 2007-08 and 2008-09. The reference years 2006-07 and 2007-08
represent the scenario obtaining in terms of profitability of crops before initiation of
NFSM for pulses crops and the reference year 2008-09 shows the scenario obtaining in
this respect after the initiation of NFSM for pulses crops, i.e. the impact of the
programme. This chapter initially begins with profitability of crops cultivated on the
sampled farms of NFSM and non-NFSM districts and subsequently compares the
economics of various crops in NFSM vis-à-vis non-NFSM districts.
4.1 Profitability of Pulses and Other Crops in NFSM District
In the NFSM district of Amravati, the sampled farmers were found to cultivate
not only various pulses crops like mung, tur and gram but also various other crops viz.
soybean, jowar, cotton, bajra, kharif sunflower, ladyfinger, and rabi sunflower. The cost
and return structure for three reference years viz. 2006-07, 2007-08 and 2008-09 has been
evaluated for all these crops cultivated by the sampled farmers belonging to the NFSM
district of Amravati with a view to examine the magnitude of income generation in the
cultivation of pulses crops vis-à-vis other crops.
4.1.1 Economics of Pulses Crops in NFSM District
The pulses crops cultivated by the sampled farmers drawn from the NFSM district
of Amravati included mung and tur in kharif season and gram in rabi season. The
estimates relating to gross returns, paid out cost, net returns, per hectare gross and net

67
returns, per quintal gross and net returns, and value of marketed surplus for various pulse
crops viz. mung, tur and gram, and also for total pulse crops with respect to various
categories of sampled farmers of Amravati district for the reference years 2006-07, 2007-
08 and 2008-09 are brought out in Table 4.1, Table 4.2, Table 4.3 and Table 4.4.
In the cultivation of mung crop, an increasing trend was noticed in terms per
hectare gross and net returns from 2006-07 to 2007-08 and from 2007-08 to 2008-09,
indicating a steady increase in the same throughout the period between 2006-07 and
2008-09 (Table 4.1). All the categories of sampled farmers of Amravati district showed
an increase in per hectare gross and net returns for mung crop during the given period of
time. Even per quintal returns from mung crop increased during the period between 2006-
07 and 2008-09 across all the categories of sampled farmers of Amravati district.
Table 4.1: Profitability in Mung Crop Farming: NFSM Amravati District (Area in Acres; Return, Value and Costs in Rupees)
Category/
Year
Area Gross
Returns
Total
Paid out
Cost
Net
Returns
Gross
Returns
per
Acre
Gross
Returns
per
Hectare
Net
Returns
per
Acre
Net
Returns
per
Hectare
Gross
Returns
Per
Quintal
Net
Returns
per
Quintal
Value of
Marketed
Surplus
Marginal
2006-07 19.20 128996 71761 57235 6718.54 16796.35 2980.99 7452.47 3583.22 1589.86 115943.50
2007-08 17.50 139428 72568 66860 7967.31 19918.29 3820.57 9551.43 3873.00 1857.22 121810.00
2008-09 21.05 198623 92403 106220 9435.77 23589.43 5046.08 12615.20 4053.53 2167.76 179660.25
Small
2006-07 45.78 336543 179708 156835 7351.31 18378.28 3425.84 8564.60 3698.27 1723.46 292986.00
2007-08 35.70 300112 154855 145257 8406.50 21016.25 4068.82 10172.06 3847.59 1862.27 261030.00
2008-09 36.86 379571 175037 204534 10297.64 25744.10 5548.94 13872.35 4264.84 2298.13 333189.50
Medium
2006-07 43.00 338595 179900 158695 7874.30 19685.76 3690.58 9226.45 3847.67 1803.35 282340.00
2007-08 49.50 407854 228484 179370 8239.47 20598.69 3623.64 9059.09 3959.75 1741.46 362710.00
2008-09 39.75 412070 200748 211322 10366.54 25916.35 5316.28 13290.69 4337.58 2224.44 362232.00
Large
2006-07 41.20 315114 171084 144030 7648.40 19121.00 3495.87 8739.68 3796.55 1735.30 274350.00
2007-08 43.00 354880 190650 164230 8253.02 20632.56 3819.30 9548.26 3943.11 1824.78 323170.00
2008-09 58.00 579028 284930 294108 9983.24 24958.10 5070.83 12677.07 4386.58 2228.09 514734.00
Total
2006-07 149.18 1119225 602453 516772 7502.51 18756.28 3464.08 8660.21 3755.79 1734.13 966062.50
2007-08 145.70 1197212 646557 550655 8216.97 20542.42 3779.38 9448.44 3899.71 1793.66 1063895.00
2008-09 155.66 1569580 753117 816463 10083.39 25208.47 5245.17 13112.92 4300.22 2236.88 1390319.00
Note: Gross Returns = Value of Main Product (Production * Price) + Value of by-product
Net Returns = Gross Returns – Paid-out Costs
Value of Marketed Surplus = Quantity Sold * Price
Gross Returns / Hectare = Gross Returns / Area Sown under the Crop
Gross Returns / Quintal = Gross Returns / Production of the Crop
Although cost and return structure for mung crop differed across various
categories of sampled farmers drawn from the district of Amravati, the per hectare net
return from gram crop cultivation for the average category of farmer was estimated at

68
Rs.8,660 in 2006-07, Rs.9,448 in 2007-08, and Rs.13,113 in 2008-09. The per quintal net
return in the cultivation of gram crop for the average category of farmer was estimated at
Rs.1,734 in 2006-07, Rs.1,794 in 2007-08, and Rs.2,237 in 2008-09. The per hectare
value of marketed surplus of mung crop for the average category of farmers of Amravati
district increased from Rs.16,190 in 2006-07 to Rs.18,255 in 2007-08, and further to
Rs.22,329 in 2008-09, showing a sharp rise in the same between 2006-07 and 2008-09.
The pulse crop like tur also showed an increase in per hectare gross and net
returns, and also per quintal gross and net returns from 2006-07 to 2007-08 and from
2007-08 to 2008-09 for all the categories of sampled farmers drawn from the district of
Amravati. The net returns from tur crop cultivation on per hectare basis and on per
quintal basis were substantially high in 2008-09 as compared to the reference years 2006-
07 and 2007-08 (Table 4.2).
Table 4.2: Profitability in Tur Crop Farming: NFSM Amravati District (Area in Acres; Return, Value and Costs in Rupees)
Category/
Year
Area Gross
Returns
Total
Paid out
Cost
Net
Returns
Gross
Returns
per
Acre
Gross
Returns
per
Hectare
Net
Returns
per
Acre
Net
Returns
per
Hectare
Gross
Returns
Per
Quintal
Net
Returns
per
Quintal
Value of
Marketed
Surplus
Marginal
2006-07 1.25 13500 5756 7744 10800.00 27000.00 6195.20 15488.00 2700.00 1548.80 11250.00
2007-08 2.50 28550 12035 16515 11420.00 28550.00 6606.00 16515.00 2855.00 1651.50 27000.00
2008-09 1.00 14650 5363 9287 14650.00 36625.00 9287.00 23217.50 2930.00 1857.40 13750.00
Small
2006-07 5.70 67056 27064 39992 11764.21 29410.53 7016.14 17540.35 2853.45 1701.79 58638.00
2007-08 4.00 49258 21171 28087 12314.50 30786.25 7021.75 17554.38 3078.62 1755.44 45151.50
2008-09 5.95 89150 33541 55609 14983.19 37457.98 9346.05 23365.13 3128.07 1951.19 85699.50
Medium
2006-07 8.00 87743 42260 45483 10967.88 27419.69 5685.37 14213.44 2974.34 1541.80 68967.50
2007-08 3.75 40256 20318 19938 10734.93 26837.33 5316.80 13292.00 2981.93 1476.89 36309.00
2008-09 4.50 71840 25868 45972 15964.44 39911.11 10216.00 25540.00 3265.45 2089.64 59755.00
Large
2006-07 4.50 52456 22730 29726 11656.89 29142.22 6605.78 16514.44 2914.22 1651.44 47039.00
2007-08 7.50 88090 39988 48102 11745.33 29363.33 6413.60 16034.00 2936.33 1603.40 83490.00
2008-09 2.00 33600 11800 21800 16800.00 42000.00 10900.00 27250.00 3360.00 2180.00 28800.00
Total
2006-07 19.45 220746 97810 122936 11349.41 28373.52 6320.62 15801.54 2904.55 1617.58 186041.50
2007-08 17.75 206159 93511 112648 11614.59 29036.48 6346.37 15865.92 2951.93 1620.83 192005.50
2008-09 13.45 207695 76571 131124 15442.01 38605.02 9749.00 24372.49 3170.92 2001.89 188374.50
Note: Gross Returns = Value of Main Product (Production * Price) + Value of by-product
Net Returns = Gross Returns – Paid-out Costs
Value of Marketed Surplus = Quantity Sold * Price
Gross Returns / Hectare = Gross Returns / Area Sown under the Crop
Gross Returns / Quintal = Gross Returns / Production of the Crop
The area allocation under tur crop was not much in the NFSM district of
Amravati. However, the cost and return structure for tur varied across different categories
of sampled farmers of Amravati district. Although the per hectare and per quintal net

69
returns for tur crop increased with the increase in land holding size of sampled farmers of
NFSM district of Amravati, the general trend showed that the average category of
sampled farmers in Amravati district generated per hectare net return from tur crop
cultivation to the tune of Rs.15,802 in 2006-07, Rs.15,866 in 2007-08, and Rs.24,372 in
2008-09, showing a sharp increase in per hectare net returns from tur crop cultivation in
2008-09 as compared to 2006-07 and 2007-08. The per quintal net return in tur crop
cultivation for the average category of farmer of Amravati district was estimated at
Rs.1,618 in 2006-07, Rs.1,621 in 2007-08, and Rs.2,002 in 2008-09. The per hectare
value of marketed surplus of tur for the average category of farmers was estimated at
Rs.23,913 in 2006-07, Rs.27,043 in 2007-08, and Rs.35,014 in 2008-09, showing a sharp
rise in the same in 2008-09 as compared to the reference years 2006-07 and 2007-08.
Like mung crop in kharif season, the gram crop cultivated during rabi season
showed significant area allocation of the sampled farmers of Amravati district. The gram
crop also showed an increase in per hectare net returns and per quintal net returns with
the increase in land holding size of sampled farmers belonging to NFSM district of
Amravati (Table 4.3).
Table 4.3: Profitability in Gram Crop Farming: NFSM Amravati District (Area in Acres; Return, Value and Costs in Rupees)
Category/
Year
Area Gross
Returns
Total
Paid out
Cost
Net
Returns
Gross
Returns
per Acre
Gross
Returns
per
Hectare
Net
Returns
per Acre
Net
Returns
per
Hectare
Gross
Returns
Per
Quintal
Net
Returns
per
Quintal
Value of
Marketed
Surplus
Marginal
2006-07 22.20 150635 86027 64608 6785.36 16963.40 2910.27 7275.68 2063.49 885.04 126017.50
2007-08 21.75 223454 92600 130854 10273.75 25684.37 6016.28 15040.69 2327.65 964.58 191313.00
2008-09 20.05 239984 92953 147031 11969.28 29923.19 7333.22 18333.04 2499.83 1531.57 211731.00
Small
2006-07 43.58 319651 181807 137844 7334.81 18337.02 3163.01 7907.53 2102.97 906.87 269382.00
2007-08 37.62 374778 167648 207130 9962.20 24905.50 5505.85 13764.62 2372.01 1310.95 318222.00
2008-09 37.86 459788 190021 269767 12144.43 30361.07 7125.38 17813.46 2642.46 1550.39 406944.00
Medium
2006-07 39.00 287397 166825 120572 7369.15 18422.88 3091.59 7728.97 2097.79 880.09 235582.00
2007-08 49.50 487827 223125 264702 9855.09 24637.73 5347.52 13368.79 2334.10 1266.52 429585.00
2008-09 41.00 537156 199490 337666 13101.37 32753.41 8235.76 20589.39 2633.12 1655.23 470118.00
Large 2006-07 31.50 260010 137550 122460 8254.29 20635.71 3887.62 9719.05 2166.75 1020.50 219417.00
2007-08 43.00 425912 195950 229962 9904.93 24762.33 5347.95 13369.88 2392.76 1291.92 387688.00
2008-09 62.00 858247 306070 552177 13842.69 34606.73 8906.08 22265.20 2707.40 1741.88 779891.00
Total
2006-07 136.28 1017611 572208 445403 7467.06 18667.65 3268.29 8170.73 2111.23 924.07 850302.00
2007-08 151.87 1512016 679323 832693 9955.99 24889.97 5482.93 13707.33 2358.84 1299.05 1326696.00
2008-09 160.91 2095148 788534 1306614 13020.62 32551.55 8120.15 20300.39 2648.73 1651.85 1868192.00
Note: Gross Returns = Value of Main Product (Production * Price) + Value of by-product
Net Returns = Gross Returns – Paid-out Costs
Value of Marketed Surplus = Quantity Sold * Price
Gross Returns / Hectare = Gross Returns / Area Sown under the Crop
Gross Returns / Quintal = Gross Returns / Production of the Crop

70
It is to be further noted that all the categories of sampled farmers of Amravati
district showed more than two folds rise in per hectare net returns from gram crop in
2008-09 as compared to 2006-07 (Table 4.3). Even per quintal net returns from gram
crop was more than one and a half times in 2008-09 over that of 2006-07 and this held
true for all the categories of sampled farmers of Amravati district. The per hectare net
returns from gram crop for the average category of farmer of Amravati district was
estimated at Rs.8,171 in 2006-07, which increased to Rs.13,707 in 2007-08, and further
to Rs.20,300 in 2008-09. Similarly, the per quintal net returns from gram crop for the
average category of farmer of Amravati district was estimated at Rs.924 in 2006-07,
which increased to Rs.1,299 in 2007-08, and further to Rs.1,652 in 2008-09. The
plausible reason for higher per hectare and per quintal net returns in 2008-09 over that of
2006-07 could be rise in yield and prices of gram crop.
The cost and return estimates with respect to total pulses encompassing kharif
mung and tur and rabi gram for various categories of sampled farmers of Amravati
district coupled with gross and net returns per quintal and value of marketed surplus of
total pulses crops are provided in Table 4.4.
Table 4.4: Profitability in Total Pulses Crops Farming: NFSM Amravati District (Area in Acres; Return, Value and Costs in Rupees)
Category/
Year
Area Gross
Returns
Total
Paid out
Cost
Net
Returns
Gross
Returns
per
Acre
Gross
Returns
per
Hectare
Net
Returns
per
Acre
Net
Returns
per
Hectare
Gross
Returns
Per
Quintal
Net
Returns
per
Quintal
Value of
Marketed
Surplus
Marginal
2006-07 42.65 293131 163544 129587 6872.94 17182.36 3038.38 7595.96 2571.32 1136.73 253211.00
2007-08 41.75 391432 177203 214229 9375.62 23439.04 5131.23 12828.08 2756.56 1508.65 340123.00
2008-09 42.10 453257 190719 262538 10766.20 26915.50 6236.06 15590.14 3021.71 1750.25 405141.25
Small
2006-07 95.06 723250 388579 334671 7608.35 19020.88 3520.63 8801.57 2713.88 1255.8 621006.00
2007-08 77.32 724148 343674 380474 9365.60 23413.99 4920.77 12301.93 287360 1509.82 624403.50
2008-09 80.67 928509 398599 529910 11509.97 28774.92 6568.86 16422.15 3185.28 1817.87 825833.00
Medium 2006-07 90.00 713735 388985 324750 7930.39 19825.97 3608.33 9020.83 2804.46 1276.03 586889.50
2007-08 102.75 935937 471927 464010 9108.88 22772.19 4515.91 11289.78 2875.38 1425.53 828604.00
2008-09 85.25 1021066 426106 594960 11977.31 29943.28 6979.00 17447.51 3180.89 1853.46 892105.00
Large
2006-07 77.20 627580 331364 296216 8129.27 20323.19 3836.99 9592.49 2839.73 1340.34 540806.00
2007-08 93.50 868882 426588 442294 9292.86 23232.14 4730.42 11826.04 2915.71 1484.21 794348.00
2008-09 122.00 1470875 602800 868085 12056.35 30140.88 7115.45 17788.63 3204.52 1891.25 1323425.00
Total
2006-07 304.91 2357582 1272471 1085111 7732.06 19330.15 3558.79 8896.98 2754.18 1267.65 2002406.00
2007-08 315.32 2915387 1419391 1495996 9245.80 23114.51 4744.37 11860.93 2865.25 1470.27 2582596.50
2008-09 330.02 3872423 1618222 2254201 11733.90 29334.76 6830.50 17076.25 3170.22 1845.44 3446885.50
Note: Gross Returns = Value of Main Product (Production * Price) + Value of by-product
Net Returns = Gross Returns – Paid-out Costs
Value of Marketed Surplus = Quantity Sold * Price
Gross Returns / Hectare = Gross Returns / Area Sown under the Crop
Gross Returns / Quintal = Gross Returns / Production of the Crop

71
In terms of profitability, total pulses crops cultivated by various categories of
sampled farmers showed a trend similar to individual pulses crops viz. mung, tur and
gram. The extent of per hectare returns from total pulses for various categories of farmers
of Amravati district was found to increase from 2006-07 to 2007-08, and from 2007-08 to
2008-09. Even per quintal net returns from total pulses crops farming for various
categories of sampled farmers of Amravati district followed a rising trend throughout the
period between 2006-07 and 2008-09. The total pulse crop also showed an increase in per
hectare net returns and per quintal net returns with the increase in land holding size of
sampled farmers belonging to NFSM district of Amravati. The per hectare net returns
from total pulses crops for the average category of farmer of Amravati district was
estimated at Rs.8,897 in 2006-07, which increased to Rs.11,861 in 2007-08, and further
to Rs.17,076 in 2008-09. Similarly, the per quintal net returns from total pulses crops for
the average category of farmer belonging to NFSM district of Amravati was estimated at
Rs.1,268 in 2006-07, which increased to Rs.1,470 in 2007-08, and further to Rs.1,845 in
2008-09. The per hectare value of marketed surplus of with respect to total pulses crops
for the average category of farmers of Amravati district was estimated at Rs.16,418 in
2006-07, Rs.20,476 in 2007-08, and Rs.26,111 in 2008-09, showing a sharp rise in the
same in 2008-09 over that of 2006-07 and 2007-08. The per hectare value of marketed
surplus with respect to total pulses crops for the average category of sampled farmers of
Amravati district, therefore, increased by 24.72 per cent in 2007-08 over that of 2006-07,
27.52 per cent in 2008-09 over that of 2007-08, and by 59.04 per cent in 2008-09 over
that of 2006-07, showing a significant rise in the same during the period between 2006-
07 and 2009-8-09.
Thus, in the total pulses farming, the average category of sampled farmer of
Amravati district generated 33.31 per cent higher per hectare net returns in 2007-08 over
that of 2006-07, 43.97 per cent in 2008-09 over that of 2007-08, and 91.93 per cent
higher net returns in 2008-09 over that of 2006-07. Similarly, in the total pulses farming,
the average category of sampled farmer of Amravati district generated 15.98 per cent
higher per quintal net return in 2007-08 over that of 2006-07, 25.52 per cent in 2008-09
over that of 2007-08, and 45.58 per cent higher net returns in 2008-09 over that of 2006-
07. The rise in yield level and higher prices on offer for pulses crops in Amravati district
could be the reasons for higher amount of net profit generated from pulses crop farming
since both net returns per hectare and per quintal from total pulses crops increased

72
substantially in 2008-09 over that of 2006-07, which also show positive impact of NFSM
programme on pulses farming in the NFSM district of Amravati of Maharashtra.
4.1.2 Economics of Other Major Crops in NFSM District
The cropping pattern revealed that the other crops cultivated by the sampled
farmers drawn from the NFSM district of Amravati encompassed soybean, kharif jowar,
cotton, bajra, kharif sunflower, kharif ladyfinger, and rabi sunflower. The estimates
relating to gross returns, paid out cost, net returns, per hectare gross and net returns, per
quintal gross and net returns, and value of marketed surplus of these crops for various
categories of sampled farmers of Amravati district for the reference years 2006-07, 2007-
08 and 2008-09 are brought out separately in Tables 4.5, Table 4.6, Table 4.7, Table 4.8,
Table 4.9, Table 4.10, and Table 4.11. These estimates for the given reference years with
respect to all other crops put together for various categories of sampled farmers of
Amravati district are presented in Table 4.12.
The estimates relating to costs and returns and the value of marketed surplus of
soybean crop cultivated on the sampled farms belonging to the farmers of Amravati
district for 2006-07, 2007-08 and 2008-09 are presented in Table 4.5.
Table 4.5: Profitability in Soybean Crop Farming: NFSM Amravati District (Area in Acres; Return, Value and Costs in Rupees)
Category/
Year
Area Gross
Returns
Total
Paid out
Cost
Net
Returns
Gross
Returns
per
Acre
Gross
Returns
per
Hectare
Net
Returns
per
Acre
Net
Returns
per
Hectare
Gross
Returns
Per
Quintal
Net
Returns
per
Quintal
Value of
Marketed
Surplus
Marginal
2006-07 5.75 55550 28944 26606 9660.86 24152.17 4627.13 11567.82 2020.00 967.49 66330.00
2007-08 1.00 11300 4650 6650 11300.00 28250.00 6650.00 16625.00 2260.00 1330.00 11000.00
2008-09 1.50 19600 7658 11942 13066.67 32666.67 7961.33 19903.33 1960.00 1194.20 19000.00
Small
2006-07 5.00 51697 23425 28272 10339.40 25848.50 5654.40 14136.00 2110.08 1153.96 50396.50
2007-08 1.75 20450 9338 11112 11685.71 29214.29 6349.71 15874.29 2272.22 1234.67 19800.00
2008-09 3.80 48447 20411 28036 12749.21 31873.03 7377.89 18444.74 2106.39 1218.96 46897.00
Medium 2006-07 2.00 22700 9500 13200 11350.00 28375.00 6600.00 16500.00 2063.64 1200.00 22000.00
2007-08 3.00 34500 16350 18150 11500.00 28750.00 6050.00 15125.00 2156.25 1134.38 33600.00
2008-09 5.50 69715 30825 38890 12675.45 31688.64 7070.90 17677.27 2112.58 1178.48 67815.00
Large
2006-07 6.00 64212 31300 32912 10702.00 26755.00 5485.33 13713.33 2071.35 1061.68 63612.00
2007-08 - - - - - - - - - - -
2008-09 7.00 84193 39510 44683 12027.57 30068.93 6383.29 15958.21 2158.79 1145.72 81393.00
Total
2006-07 18.75 192118 93169 98949 10246.29 25615.73 5277.28 13193.20 2065.78 1063.97 187405.00
2007-08 5.75 66260 30338 35922 11523.48 28808.70 6247.30 15618.26 2208.67 1197.40 64410.00
2008-09 17.80 221995 98404 123591 12471.63 31179.07 6943.31 17358.29 2114.24 1177.06 215145.00
Note: Gross Returns = Value of Main Product (Production * Price) + Value of by-product
Net Returns = Gross Returns – Paid-out Costs
Value of Marketed Surplus = Quantity Sold * Price
Gross Returns / Hectare = Gross Returns / Area Sown under the Crop
Gross Returns / Quintal = Gross Returns / Production of the Crop

73
The sampled farmers of Amravati district devoted some area under soybean
cultivation though their major cultivation practice was confined to pulses. The cultivation
of soybean was found to be a profitable proposition as the average category of sampled
farmers belonging to the NFSM district derived a per hectare net return to the tune of
Rs.13,193 in 2006-07, Rs.15,618 in 2007-08 and Rs.17,538 in 2008-09, showing a rise in
net profitability of the crop in every successive years (Table 4.5). However, the average
category of sampled farmer of Amravati showed by and large the same net returns per
quintal from soybean crop cultivation as the net returns in this respect stood at Rs.1,064
in 2006-07, Rs.1,197 in 2007-08 and Rs.1,177 in 2008-09. However, the per hectare
value of marketed surplus for soybean with respect to average category of sampled
farmers of Amravati district increased from Rs.24,987 in 2006-07 to Rs.28,004 in 2007-
08, and further to Rs.30,217 in 2008-09, showing about 21 per cent net rise in per hectare
value of marketed surplus of soybean in 2008-09 over that of 2006-07.
The cost and return estimates along with value of marketed surplus with respect to
kharif jowar cultivated on the farms belonging to sampled farmers of Amravati district
for the reference years 2006-07, 2007-08, and 2008-09 are furnished in Table 4.6.
Table 4.6: Profitability in Kharif Jowar Crop Farming: NFSM Amravati District (Area in Acres; Return, Value and Costs in Rupees)
Category/
Year
Area Gross
Returns
Total
Paid out
Cost
Net
Returns
Gross
Returns
per
Acre
Gross
Returns
per
Hectare
Net
Returns
per
Acre
Net
Returns
per
Hectare
Gross
Returns
Per
Quintal
Net
Returns
per
Quintal
Value of
Marketed
Surplus
Marginal
2006-07 - - - - - - - - - - -
2007-08 3.00 12893 6220 6673 4297.67 10744.17 2224.33 5560.83 889.17 460.21 4755.00
2008-09 1.00 4100 2125 1975 4100.00 10250.00 1975.00 4937.50 820.00 395.00 -
Small
2006-07 6.96 28742 14242 14500 4129.60 10323.99 2083.33 5208.33 809.63 408.45 3624.00
2007-08 4.00 15597 8420 7177 3899.25 9748.13 1794.25 4485.63 820.89 377.74 5176.00
2008-09 2.50 12450 6018 6432 4980.00 12450.00 2572.80 6432.00 830.00 428.80 -
Medium 2006-07 9.00 35100 16235 18865 3900.00 9750.00 2096.11 5240.28 797.73 428.75 5625.00
2007-08 2.75 11597 6194 5403 4217.09 10542.73 1964.73 4911.82 828.14 385.93 -
2008-09 4.00 19956 10390 9566 4989.00 12472.50 2391.50 5978.75 831.50 398.58 1288.00
Large
2006-07 - - - - - - - - - - -
2007-08 15.00 64964 32465 32499 4330.93 10827.33 2166.60 5416.50 902.28 451.38 19860.00
2008-09 4.50 22550 11385 11165 5011.11 12527.78 2481.11 6202.78 835.19 413.52 2600.00
Total
2006-07 15.96 63872 30477 33395 4002.01 10005.01 2092.42 5231.05 803.42 420.06 9240.00
2007-08 24.75 106395 53299 53096 4298.79 10746.97 2145.29 5363.23 890.33 444.32 29620.50
2008-09 12.00 59024 29918 29106 4918.67 12296.67 2425.50 6063.75 831.32 409.94 3864.00
Note: Gross Returns = Value of Main Product (Production * Price) + Value of by-product
Net Returns = Gross Returns – Paid-out Costs
Value of Marketed Surplus = Quantity Sold * Price
Gross Returns / Hectare = Gross Returns / Area Sown under the Crop
Gross Returns / Quintal = Gross Returns / Production of the Crop
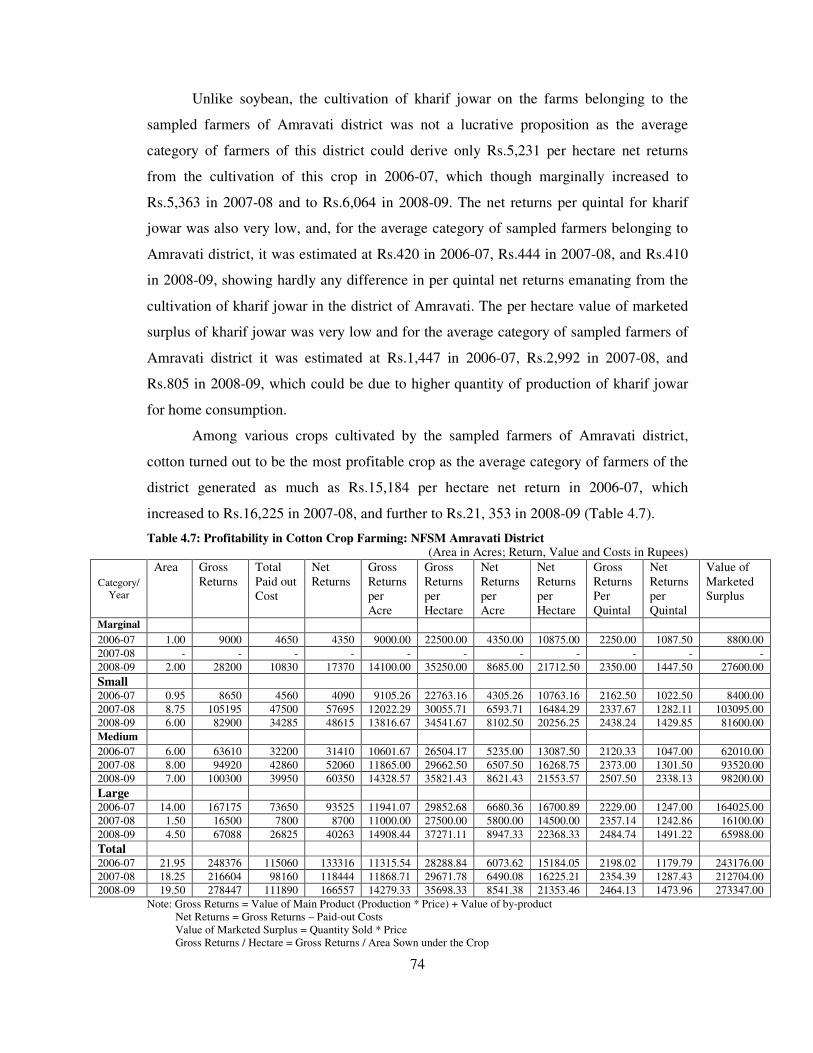
74
Unlike soybean, the cultivation of kharif jowar on the farms belonging to the
sampled farmers of Amravati district was not a lucrative proposition as the average
category of farmers of this district could derive only Rs.5,231 per hectare net returns
from the cultivation of this crop in 2006-07, which though marginally increased to
Rs.5,363 in 2007-08 and to Rs.6,064 in 2008-09. The net returns per quintal for kharif
jowar was also very low, and, for the average category of sampled farmers belonging to
Amravati district, it was estimated at Rs.420 in 2006-07, Rs.444 in 2007-08, and Rs.410
in 2008-09, showing hardly any difference in per quintal net returns emanating from the
cultivation of kharif jowar in the district of Amravati. The per hectare value of marketed
surplus of kharif jowar was very low and for the average category of sampled farmers of
Amravati district it was estimated at Rs.1,447 in 2006-07, Rs.2,992 in 2007-08, and
Rs.805 in 2008-09, which could be due to higher quantity of production of kharif jowar
for home consumption.
Among various crops cultivated by the sampled farmers of Amravati district,
cotton turned out to be the most profitable crop as the average category of farmers of the
district generated as much as Rs.15,184 per hectare net return in 2006-07, which
increased to Rs.16,225 in 2007-08, and further to Rs.21, 353 in 2008-09 (Table 4.7).
Table 4.7: Profitability in Cotton Crop Farming: NFSM Amravati District (Area in Acres; Return, Value and Costs in Rupees)
Category/
Year
Area Gross
Returns
Total
Paid out
Cost
Net
Returns
Gross
Returns
per
Acre
Gross
Returns
per
Hectare
Net
Returns
per
Acre
Net
Returns
per
Hectare
Gross
Returns
Per
Quintal
Net
Returns
per
Quintal
Value of
Marketed
Surplus
Marginal 2006-07 1.00 9000 4650 4350 9000.00 22500.00 4350.00 10875.00 2250.00 1087.50 8800.00
2007-08 - - - - - - - - - - -
2008-09 2.00 28200 10830 17370 14100.00 35250.00 8685.00 21712.50 2350.00 1447.50 27600.00
Small 2006-07 0.95 8650 4560 4090 9105.26 22763.16 4305.26 10763.16 2162.50 1022.50 8400.00
2007-08 8.75 105195 47500 57695 12022.29 30055.71 6593.71 16484.29 2337.67 1282.11 103095.00
2008-09 6.00 82900 34285 48615 13816.67 34541.67 8102.50 20256.25 2438.24 1429.85 81600.00
Medium
2006-07 6.00 63610 32200 31410 10601.67 26504.17 5235.00 13087.50 2120.33 1047.00 62010.00
2007-08 8.00 94920 42860 52060 11865.00 29662.50 6507.50 16268.75 2373.00 1301.50 93520.00
2008-09 7.00 100300 39950 60350 14328.57 35821.43 8621.43 21553.57 2507.50 2338.13 98200.00
Large 2006-07 14.00 167175 73650 93525 11941.07 29852.68 6680.36 16700.89 2229.00 1247.00 164025.00
2007-08 1.50 16500 7800 8700 11000.00 27500.00 5800.00 14500.00 2357.14 1242.86 16100.00
2008-09 4.50 67088 26825 40263 14908.44 37271.11 8947.33 22368.33 2484.74 1491.22 65988.00
Total
2006-07 21.95 248376 115060 133316 11315.54 28288.84 6073.62 15184.05 2198.02 1179.79 243176.00
2007-08 18.25 216604 98160 118444 11868.71 29671.78 6490.08 16225.21 2354.39 1287.43 212704.00
2008-09 19.50 278447 111890 166557 14279.33 35698.33 8541.38 21353.46 2464.13 1473.96 273347.00
Note: Gross Returns = Value of Main Product (Production * Price) + Value of by-product
Net Returns = Gross Returns – Paid-out Costs
Value of Marketed Surplus = Quantity Sold * Price
Gross Returns / Hectare = Gross Returns / Area Sown under the Crop

75
The per quintal net return from cotton crop for the average category of farmers
belonging to Amravati district was estimated at Rs.1,180 in 2006-07, Rs.1,287 in 2007-
08, and Rs.1,474 in 2008-09. The value of per hectare marketed surplus of cotton crop for
the average category of sampled farmers of Amravati district was found to increase from
Rs.27,697 in 2006-07 to Rs.29,138 in 2007-08, and further to Rs.35,044 in 2008-09,
showing a rise in marketed surplus value of cotton crop to the tune of 26.53 per cent in
2008-09 over that of 2006-07. The rise in per hectare net returns for cotton crop for the
average category of sampled farmers of Amravati district was 41 per cent in 2008-09
over that of 2006-07, and on per quintal basis this rise in net return stood at 25 per cent.
In general, per hectare and per quintal net returns from cotton crop in Amravati district
increased with the increase in land holding size of sampled farmers.
The sampled farmers of Amravati district, particularly small category, allocated
very marginal area under bajra crop. The profitability in the cultivation of bajra crop was
very low, and the small category of farmers of Amravati district generated only Rs.2,260
per hectare net return in 2006-07, which increased to Rs.3,238 in 2007-08 (Table 4.8).
Table 4.8 Profitability in Bajra Crop Farming: NFSM Amravati District (Area in Acres; Return, Value and Costs in Rupees)
Category/
Year
Area Gross
Returns
Total
Paid out
Cost
Net
Returns
Gross
Returns
per
Acre
Gross
Returns
per
Hectare
Net
Returns
per
Acre
Net
Returns
per
Hectare
Gross
Returns
Per
Quintal
Net
Returns
per
Quintal
Value of
Marketed
Surplus
Marginal
2006-07 - - - - - - - - - - -
2007-08 - - - - - - - - - - -
2008-09 - - - - - - - - - - -
Small
2006-07 1.30 2625 1450 1175 2019.23 5048.08 903.85 2259.62 750.00 335.71 1375.00
2007-08 1.30 3400 1716 1684 2615.38 6538.46 1295.38 3238.46 850.00 421.00 2100.00
2008-09 - - - - - - - - - - -
Medium
2006-07 - - - - - - - - - - -
2007-08 - - - - - - - - - - -
2008-09 - - - - - - - - - - -
Large
2006-07 - - - - - - - - - - -
2007-08 - - - - - - - - - - -
2008-09 - - - - - - - - - - -
Total
2006-07 1.30 2625 1450 1175 2019.23 5048.08 903.85 2259.62 750.00 335.71 1375.00
2007-08 1.30 3400 1716 1684 2615.38 6538.46 1295.38 3238.46 850.00 421.00 2100.00
2008-09 - - - - - - - - - - -
Note: Gross Returns = Value of Main Product (Production * Price) + Value of by-product
Net Returns = Gross Returns – Paid-out Costs
Value of Marketed Surplus = Quantity Sold * Price
Gross Returns / Hectare = Gross Returns / Area Sown under the Crop
Gross Returns / Quintal = Gross Returns / Production of the Crop

76
The per quintal net return from bajra crop was also very low and the small
category of farmers of Amravati district obtained only Rs.336 net returns from one
quintal bajra crop in 2006-07, which though marginally increased to Rs.421 in 2007-08.
The value of per hectare marketed surplus for bajra crop was estimated at only Rs.2,644
in 2006-07, and Rs.4,038 in 2007-08. The cultivation of bajra crop on the farms of small
category of sampled farmers of Amravati district was mainly for family consumption
purpose and, therefore, despite very low returns, these farmers cultivated bajra crop.
Another crop generating significant net returns on the farms belonging to sampled
farmers of Amravati district was kharif Sunflower. The average category of sampled
farmers received by and large same per hectare net returns from kharif sunflower
cultivation in 2007-08 and 2008-09, which hovered at around Rs.10,000 (Table 4.9).
Even per quintal net return from kharif sunflower for the average category of farmers of
Amravati district was same and it hovered at around Rs.1,200 in 2007-08 and 2008-09.
However, the per hectare value of marketed surplus with respect to kharif sunflower crop
marginally increased from Rs.15,580 in 2007-08 to Rs.16,828 in 2008-09.
Table 4.9: Profitability in Kharif Sunflower Farming: NFSM Amravati District (Area in Acres; Return, Value and Costs in Rupees)
Category/
Year
Area Gross
Returns
Total
Paid out
Cost
Net
Returns
Gross
Returns
per
Acre
Gross
Returns
per
Hectare
Net
Returns
per
Acre
Net
Returns
per
Hectare
Gross
Returns
Per
Quintal
Net
Returns
per
Quintal
Value of
Marketed
Surplus
Marginal
2006-07 - - - - - - - - - - -
2007-08 - - - - - - - - - - -
2008-09 2.00 11600 5200 6400 5800.00 14500.00 3200.00 8000.00 1933.33 1066.67 11400.00
Small
2006-07 - - - - - - - - - - -
2007-08 4.06 24500 9947 14553 6034.48 15086.21 3584.48 8961.21 2041.67 1212.75 24000.00
2008-09 4.50 33055 12175 20880 7345.56 18363.89 4640.00 11600.00 2132.58 1347.10 32255.50
Medium
2006-07 - - - - - - - - - - -
2007-08 2.00 12800 4500 8300 6400.00 16000.00 4150.00 10375.00 1828.57 1185.71 12600.00
2008-09 7.00 48090 19750 28340 6870.00 17175.00 4048.57 10121.43 2185.91 1288.18 47190.00
Large
2006-07 - - - - - - - - - - -
2007-08 1.00 7550 2400 5150 7550.00 18875.00 5150.00 12875.00 1887.50 1287.50 7400.00
2008-09 - - - - - - - - - - -
Total
2006-07 - - - - - - - - - - -
2007-08 7.06 44849 16847 28002 6352.55 15881.37 3966.29 9915.72 1949.96 1217.48 43999.00
2008-09 13.50 92772 37125 55647 6872.00 17180.00 4122.00 10305.00 2132.69 1279.24 90871.50
Note: Gross Returns = Value of Main Product (Production * Price) + Value of by-product
Net Returns = Gross Returns – Paid-out Costs
Value of Marketed Surplus = Quantity Sold * Price
Gross Returns / Hectare = Gross Returns / Area Sown under the Crop
Gross Returns / Quintal = Gross Returns / Production of the Crop
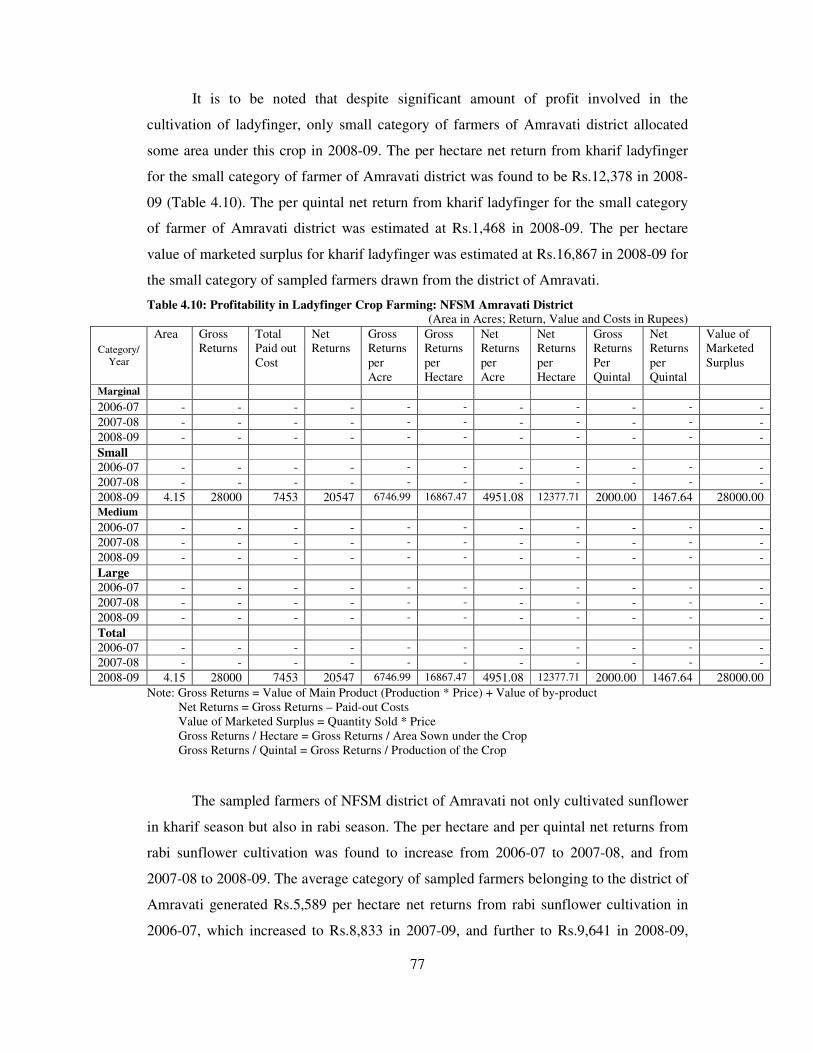
77
It is to be noted that despite significant amount of profit involved in the
cultivation of ladyfinger, only small category of farmers of Amravati district allocated
some area under this crop in 2008-09. The per hectare net return from kharif ladyfinger
for the small category of farmer of Amravati district was found to be Rs.12,378 in 2008-
09 (Table 4.10). The per quintal net return from kharif ladyfinger for the small category
of farmer of Amravati district was estimated at Rs.1,468 in 2008-09. The per hectare
value of marketed surplus for kharif ladyfinger was estimated at Rs.16,867 in 2008-09 for
the small category of sampled farmers drawn from the district of Amravati.
Table 4.10: Profitability in Ladyfinger Crop Farming: NFSM Amravati District
(Area in Acres; Return, Value and Costs in Rupees)
Category/
Year
Area Gross
Returns
Total
Paid out
Cost
Net
Returns
Gross
Returns
per
Acre
Gross
Returns
per
Hectare
Net
Returns
per
Acre
Net
Returns
per
Hectare
Gross
Returns
Per
Quintal
Net
Returns
per
Quintal
Value of
Marketed
Surplus
Marginal
2006-07 - - - - - - - - - - -
2007-08 - - - - - - - - - - -
2008-09 - - - - - - - - - - -
Small
2006-07 - - - - - - - - - - -
2007-08 - - - - - - - - - - -
2008-09 4.15 28000 7453 20547 6746.99 16867.47 4951.08 12377.71 2000.00 1467.64 28000.00
Medium
2006-07 - - - - - - - - - - -
2007-08 - - - - - - - - - - -
2008-09 - - - - - - - - - - -
Large
2006-07 - - - - - - - - - - -
2007-08 - - - - - - - - - - -
2008-09 - - - - - - - - - - -
Total
2006-07 - - - - - - - - - - -
2007-08 - - - - - - - - - - -
2008-09 4.15 28000 7453 20547 6746.99 16867.47 4951.08 12377.71 2000.00 1467.64 28000.00
Note: Gross Returns = Value of Main Product (Production * Price) + Value of by-product
Net Returns = Gross Returns – Paid-out Costs
Value of Marketed Surplus = Quantity Sold * Price
Gross Returns / Hectare = Gross Returns / Area Sown under the Crop
Gross Returns / Quintal = Gross Returns / Production of the Crop
The sampled farmers of NFSM district of Amravati not only cultivated sunflower
in kharif season but also in rabi season. The per hectare and per quintal net returns from
rabi sunflower cultivation was found to increase from 2006-07 to 2007-08, and from
2007-08 to 2008-09. The average category of sampled farmers belonging to the district of
Amravati generated Rs.5,589 per hectare net returns from rabi sunflower cultivation in
2006-07, which increased to Rs.8,833 in 2007-09, and further to Rs.9,641 in 2008-09,

78
showing about 72 per cent rise in net returns from this crop in 2008-09 over that of 2006-
07 (Table 4.11). The net returns per quintal for rabi sunflower was quite reasonable, and,
for the average category of sampled farmers belonging to Amravati district, it was
estimated at Rs.903 in 2006-07, Rs.1,178 in 2007-08, and Rs.1,254 in 2008-09, showing
about 39 per cent rise in per quintal net returns from this crop in 2008-09 over that of
2006-07. The per hectare value of marketed surplus with respect to rabi sunflower crop
for the average category of sampled farmers belonging to the district of Amravati was
estimated at Rs.10,239 in 2006-07, Rs.14,250 in 2007-08, and Rs.16,147 in 2008-09,
showing about 58 per cent rise in value of marketed surplus of rabi sunflower in 2008-09
over that of 2006-07.
Table 4.11: Profitability in Rabi Sunflower Crop Farming: NFSM Amravati District (Area in Acres; Return, Value and Costs in Rupees)
Category/
Year
Area Gross
Returns
Total
Paid out
Cost
Net
Returns
Gross
Returns
per
Acre
Gross
Returns
per
Hectare
Net
Returns
per
Acre
Net
Returns
per
Hectare
Gross
Returns
Per
Quintal
Net
Returns
per
Quintal
Value of
Marketed
Surplus
Marginal
2006-07 2.25 9800 4725 5075 4355.56 10888.89 2255.56 5638.89 1633.33 845.83 9600.00
2007-08 3.00 16650 7400 9250 5550.00 13875.00 3083.33 7708.33 1850.00 1027.78 16200.00
2008-09 2.00 11600 5450 6150 5800.00 14500.00 3075.00 7687.50 1933.33 1025.00 11400.00
Small
2006-07 - - - - - - - - - - -
2007-08 2.00 11450 4300 7150 5725.00 14312.50 3575.00 8937.50 1908.33 1191.67 11100.00
2008-09 3.38 26396 9764 16632 7809.47 19523.67 4920.71 12301.78 2449.67 1386.00 25896.00
Medium
2006-07 - - - - - - - - - - -
2007-08 - - - - - - - - - - -
2008-09 6.00 38200 15900 22300 6366.67 1591.67 3716.67 9291.67 2247.06 1311.76 37400.00
Large
2006-07 3.00 12300 5640 6660 4100.00 10250.00 2220.00 5550.00 1757.14 951.43 11900.00
2007-08 4.00 24600 9200 15400 6150.00 15375.00 3850.00 9625.00 2050.00 1283.33 24000.00
2008-09 - - - - - - - - - - -
Total
2006-07 5.25 22102 10365 11737 4209.90 10524.76 2235.62 5589.05 1700.15 902.85 21502.00
2007-08 9.00 52700 20900 31800 5855.56 14638.89 3533.33 8833.33 1951.85 1177.78 51300.00
2008-09 11.38 75000 31114 43886 6590.51 16476.27 3856.41 9641.04 2142.86 1253.89 73500.00
Note: Gross Returns = Value of Main Product (Production * Price) + Value of by-product
Net Returns = Gross Returns – Paid-out Costs
Value of Marketed Surplus = Quantity Sold * Price
Gross Returns / Hectare = Gross Returns / Area Sown under the Crop
Gross Returns / Quintal = Gross Returns / Production of the Crop
Although sampled farmers belonging to the NFSM district of Amravati cultivated
a number of other crops viz. soybean, kharif jowar, cotton, bajra, kharif and rabi
sunflower, etc., the amount of per hectare as well as per quintal net returns varied
significantly across these crops, and due to significantly high element of profit involved
in the cultivation of soybean, cotton, kharif and rabi sunflower, the per hectare net returns
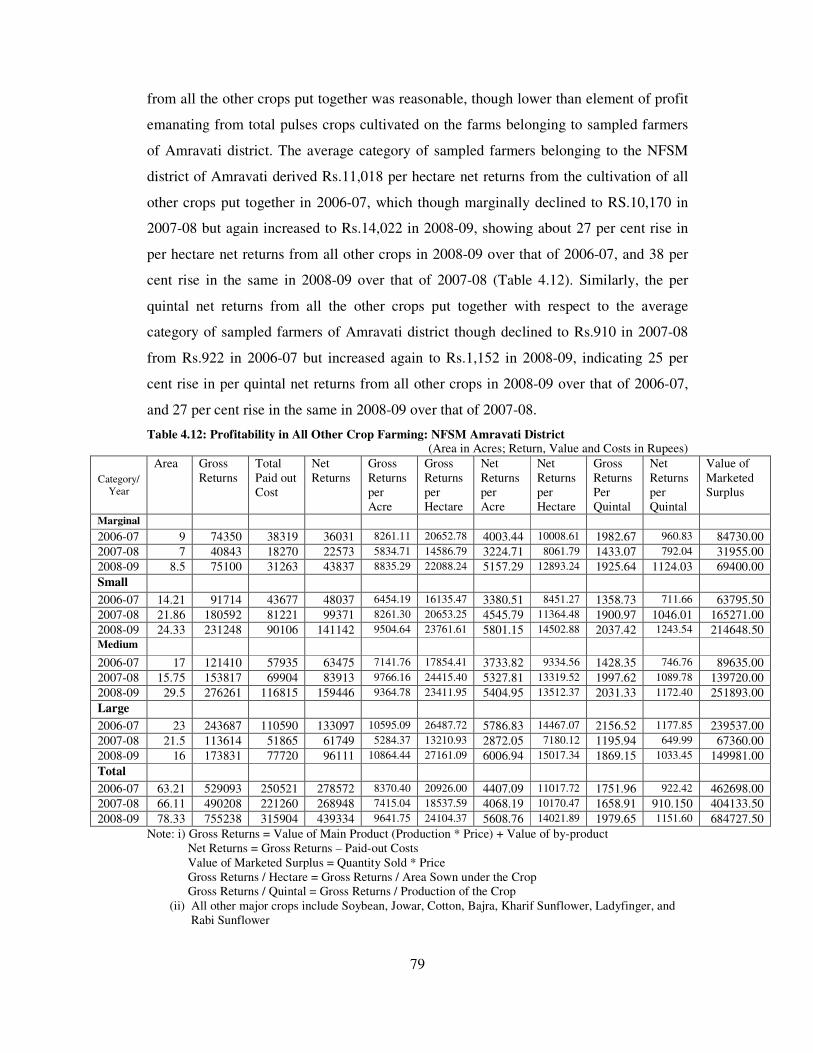
79
from all the other crops put together was reasonable, though lower than element of profit
emanating from total pulses crops cultivated on the farms belonging to sampled farmers
of Amravati district. The average category of sampled farmers belonging to the NFSM
district of Amravati derived Rs.11,018 per hectare net returns from the cultivation of all
other crops put together in 2006-07, which though marginally declined to RS.10,170 in
2007-08 but again increased to Rs.14,022 in 2008-09, showing about 27 per cent rise in
per hectare net returns from all other crops in 2008-09 over that of 2006-07, and 38 per
cent rise in the same in 2008-09 over that of 2007-08 (Table 4.12). Similarly, the per
quintal net returns from all the other crops put together with respect to the average
category of sampled farmers of Amravati district though declined to Rs.910 in 2007-08
from Rs.922 in 2006-07 but increased again to Rs.1,152 in 2008-09, indicating 25 per
cent rise in per quintal net returns from all other crops in 2008-09 over that of 2006-07,
and 27 per cent rise in the same in 2008-09 over that of 2007-08.
Table 4.12: Profitability in All Other Crop Farming: NFSM Amravati District (Area in Acres; Return, Value and Costs in Rupees)
Category/
Year
Area Gross
Returns
Total
Paid out
Cost
Net
Returns
Gross
Returns
per
Acre
Gross
Returns
per
Hectare
Net
Returns
per
Acre
Net
Returns
per
Hectare
Gross
Returns
Per
Quintal
Net
Returns
per
Quintal
Value of
Marketed
Surplus
Marginal
2006-07 9 74350 38319 36031 8261.11 20652.78 4003.44 10008.61 1982.67 960.83 84730.00
2007-08 7 40843 18270 22573 5834.71 14586.79 3224.71 8061.79 1433.07 792.04 31955.00
2008-09 8.5 75100 31263 43837 8835.29 22088.24 5157.29 12893.24 1925.64 1124.03 69400.00
Small 2006-07 14.21 91714 43677 48037 6454.19 16135.47 3380.51 8451.27 1358.73 711.66 63795.50
2007-08 21.86 180592 81221 99371 8261.30 20653.25 4545.79 11364.48 1900.97 1046.01 165271.00
2008-09 24.33 231248 90106 141142 9504.64 23761.61 5801.15 14502.88 2037.42 1243.54 214648.50
Medium 2006-07 17 121410 57935 63475 7141.76 17854.41 3733.82 9334.56 1428.35 746.76 89635.00
2007-08 15.75 153817 69904 83913 9766.16 24415.40 5327.81 13319.52 1997.62 1089.78 139720.00
2008-09 29.5 276261 116815 159446 9364.78 23411.95 5404.95 13512.37 2031.33 1172.40 251893.00
Large 2006-07 23 243687 110590 133097 10595.09 26487.72 5786.83 14467.07 2156.52 1177.85 239537.00
2007-08 21.5 113614 51865 61749 5284.37 13210.93 2872.05 7180.12 1195.94 649.99 67360.00
2008-09 16 173831 77720 96111 10864.44 27161.09 6006.94 15017.34 1869.15 1033.45 149981.00
Total 2006-07 63.21 529093 250521 278572 8370.40 20926.00 4407.09 11017.72 1751.96 922.42 462698.00
2007-08 66.11 490208 221260 268948 7415.04 18537.59 4068.19 10170.47 1658.91 910.150 404133.50
2008-09 78.33 755238 315904 439334 9641.75 24104.37 5608.76 14021.89 1979.65 1151.60 684727.50
Note: i) Gross Returns = Value of Main Product (Production * Price) + Value of by-product
Net Returns = Gross Returns – Paid-out Costs
Value of Marketed Surplus = Quantity Sold * Price
Gross Returns / Hectare = Gross Returns / Area Sown under the Crop
Gross Returns / Quintal = Gross Returns / Production of the Crop
(ii) All other major crops include Soybean, Jowar, Cotton, Bajra, Kharif Sunflower, Ladyfinger, and
Rabi Sunflower
80
The per hectare value of marketed surplus of all other crops put together for the
average category of sampled farmers of Amravati district was estimated at Rs.18,300 in
2006-07, Rs.15,283 in 2007-08, and Rs.21,854 in 2008-09, showing an increase in per
hectare value of marketed of all other crops put together to the tune of 19 per cent in
2008-09 over that of 2006-07, and 43 per cent in 2008-09 over that of 2007-08.
Thus, the average category of sampled farmers belonging to the NFSM district of
Amravati derived much higher per hectare net returns from the cultivation of pulses crops
as compared to other crops since the per hectare net returns for total pulses crops turned
out be Rs.8,897 in 2006-07, Rs.11,861 in 2007-08, and Rs.17,076 in 2008-09 as against
per hectare net returns from all other crops estimated at Rs.11,012 in 2006-07, Rs.10,170
in 2007-08, and Rs.14,022 in 2008-09. Even per quintal net return was substantially high
in the case of pulses crop farming vis-à-vis all other crop farming since the average
category of sampled farmer of Amravati district showed a net per quintal return in total
pulses crop farming to the tune of Rs.1,238 in 2006-07, Rs.1,470 in 2007-08, and
Rs.1,845 in 2008-09 as against per quintal net returns from all other crops estimated at
Rs.922 in 2006-07, Rs.910 in 2007-08, and at Rs.1,152 in 2008-09. These estimates
clearly show positive impact of NFSM programme on pulses crop farming as the net
returns from pulses crops are much as against other crops cultivated by the sampled
farmers of Amravati district, especially in 2008-09.
4.2 Profitability of Pulses and Other Crops in Non-NFSM District
The sampled farmers belonging to non-NFSM district of Beed were found to
cultivate large number of crops that not only included various pulses crops like mung, tur
and gram but a spectrum of other crops like soybean, kharif jowar, cotton, bajra, rabi
jowar, wheat, kardi, onion, sugarcane, and banana. The cropping pattern of sampled
farmers of non-NFSM district of Beed was, therefore, more diversified with varied area
allocation under various crops. The amount of profit involved in the cultivation of these
crops was evaluated separately for each crop by taking into account their cost and return
structure for three reference years viz. 2006-07, 2007-08 and 2008-09, and this analysis
was performed for all the sampled farmers drawn from the non-NFSM district of Beed.
4.2.1 Economics of Pulses Crops in Non-NFSM District
The pulses crops cultivated by the sampled farmers of non-NFSM district of Beed
encompassed mung and tur in kharif season and gram in rabi season. The estimates
relating to gross returns, paid out cost, net returns, per hectare gross and net returns, per

81
quintal gross and net returns coupled with and value of marketed surplus for various
pulse crops viz. mung, tur and gram, and also for total pulse crops with respect to various
categories of sampled farmers of Beed district for the reference years 2006-07, 2007-08
and 2008-09 are furnished in Table 4.13, Table 4.14, Table 4.15 and Table 4.16.
Although the sampled farmers of non-NFSM district of Beed allocated significant
area under mung crop cultivation, the profitability in the cultivation of this crop differed
across various categories of farmers. However, in general, the average category of
sampled farmer of Beed district showed a net per hectare return from mung crop
cultivation to the tune of Rs.8,851 in 2006-07, Rs.9,238 in 2007-08, and Rs.13,212 in
2008-09, indicating about 49 per cent higher net return in mung crop cultivation in 2008-
09 over that of 2006-07 (Table 4.13). The returns from mung crop not only increased on
per hectare basis but also on per quintal basis during the period between 2006-07 and
2008-09. In the case of average category of sampled farmer of Beed district, the per
quintal net return from mung crop was estimated at Rs.1,364 in 2006-07, Rs.1,273 in
2007-08, and Rs.1,750 in 2008-09, showing 28 per cent rise per quintal net return from
mung crop in 2008-09 over that of 2006-07.
Table 4.13: Profitability in Mung Crop Farming: Non-NFSM Beed District (Area in Acres; Return, Value and Costs in Rupees)
Category/
Year
Area Gross
Returns
Total
Paid out
Cost
Net
Returns
Gross
Returns
per
Acre
Gross
Returns
per
Hectare
Net
Returns
per
Acre
Net
Returns
per
Hectare
Gross
Returns
Per
Quintal
Net
Returns
per
Quintal
Value of
Marketed
Surplus
Marginal
2006-07 3.50 32178 19165 13013 9193.57 22983.93 3718.00 9295.00 3387.16 1369.79 31302.50
2007-08 1.75 16700 10271 6429 9542.86 23857.14 3673.71 9184.29 3711.11 1428.67 14444.00
2008-09 2.00 21406 12020 9386 10703.00 26757.50 4693.00 11735.50 3892.00 1706.55 20850.50
Small
2006-07 12.00 108510 64010 53160 9042.50 22606.25 4430.00 11075.00 3444.76 1687.62 96860.00
2007-08 11.50 113436 69515 43921 9864.00 24660.00 3819.22 9548.04 3694.98 1430.65 94162.80
2008-09 23.00 277072 159663 117409 12046.61 30116.52 5104.74 12761.85 4166.50 1765.55 237060.00
Medium 2006-07 6.75 60020 38138 21882 8891.85 22229.63 3241.78 8104.44 3429.71 1250.40 48053.00
2007-08 3.00 35000 23550 11450 11666.67 29166.67 3816.67 9541.67 3888.89 1272.22 30400.00
2008-09 12.00 157148 95950 61198 13095.67 32739.17 5099.83 12749.58 4247.24 1654.00 141236.00
Large
2006-07 8.00 70400 42700 27700 8800.00 22000.00 3462.50 8656.25 3520.00 1385.00 64600.00
2007-08 23.00 264510 180970 83540 11500.43 28751.09 3632.17 9080.43 3778.71 1193.43 247431.00
2008-09 13.00 180948 104700 76248 13919.08 34797.69 5865.23 14663.08 4308.29 1815.43 162431.50
Total
2006-07 30.25 271108 164013 107095 8962.25 22405.62 3540.33 8850.83 3453.61 1364.27 240768.00
2007-08 39.25 429645 284306 145339 10946.37 27365.92 3702.90 9238.47 3762.22 1272.67 386294.40
2008-09 50.00 636573 372333 264240 12731.46 31828.65 5284.80 13212.00 4215.72 1749.93 561522.00
Note: Gross Returns = Value of Main Product (Production * Price) + Value of by-product
Net Returns = Gross Returns – Paid-out Costs
Value of Marketed Surplus = Quantity Sold * Price
Gross Returns / Hectare = Gross Returns / Area Sown under the Crop
Gross Returns / Quintal = Gross Returns / Production of the Crop

82
A significant rise in per hectare value of marketed surplus of mung crop was also
seen during the period between 2006-07 and 2008-09. For the average category of
farmers of Beed district, the per hectare value of marketed surplus of mung crop
increased from Rs.19,898 in 2006-07 to Rs.24,605 in 2007-08, and further to Rs.28,076
in 2008-09, showing a steady increase in per hectare value of marketed surplus of mung
crop during the period between 2006-07 and 2008-09.
All the categories of sampled farmers drawn from the non-NFSM district of Beed
were also found to cultivate tur crop on their farms and area allocation under this crop
was quite high for various categories of farmers. Although no discernable trend was
noticed in terms of net returns emanating in the cultivation of tur crop across various
categories of farmers, the average category of sampled farmer of Beed district showed an
increase in per hectare net returns from tur crop from Rs.14,083 in 2006-07 to Rs.14,386
in 2007-08, and further to Rs.17,302 in 2008-09 (Table 4.14). The average category of
sampled farmer of Beed district showed a marginal decline in per quintal net returns from
tur crop from Rs.1,449 in 2006-07 to Rs.1,419 in 2007-08 with an increase in the same to
Rs.1,674 in 2008-09, showing an overall rise in per quintal net returns from tur crop of
the order of 16 per cent in 2008-09 over that of 2006-07.
Table 4.14: Profitability in Tur Crop Farming: Non-NFSM Beed District (Area in Acres; Return, Value and Costs in Rupees)
Category/
Year
Area Gross
Returns
Total
Paid out
Cost
Net
Returns
Gross
Returns
per
Acre
Gross
Returns
per
Hectare
Net
Returns
per
Acre
Net
Returns
per
Hectare
Gross
Returns
Per
Quintal
Net
Returns
per
Quintal
Value of
Marketed
Surplus
Marginal 2006-07 7.52 93209 47347 45862 12394.81 30987.03 6098.67 15246.68 3270.49 1661.30 66987.00
2007-08 2.27 23202 9062 14140 10221.15 25552.86 6229.07 15572.69 2508.32 1528.65 17088.25
2008-09 7.02 87422 41662 45760 12453.28 31133.19 6518.52 16296.30 3014.55 1577.93 75285.00
Small 2006-07 9.60 108784 56222 52562 11331.67 28329.17 5475.21 13688.02 2825.56 1365.25 83506.50
2007-08 10.85 132891 58376 74515 12248.02 30620.05 6867.74 17169.35 2857.87 1602.47 111397.00
2008-09 9.25 121558 59165 62393 13141.41 32853.51 6745.19 16862.97 3116.87 1599.82 104020.00
Medium
2006-07 18.50 197330 95623 101707 10666.49 26666.22 5497.68 13744.19 2819.00 1452.96 164625.00
2007-08 23.45 280659 161809 118850 11968.40 29921.00 5068.23 12670.58 2938.84 1244.50 239682.00
2008-09 12.25 163813 80090 83723 13372.49 33431.22 6834.53 17086.33 3212.02 1641.63 142429.50
Large 2006-07 9.25 104071 51435 52636 11250.92 28127.30 5690.38 14225.95 2890.86 1462.11 89463.00
2007-08 16.00 180004 85000 95004 11250.25 28125.63 5937.75 14844.38 2903.29 1532.32 159036.00
2008-09 15.75 212132 97625 114507 13468.70 33671.75 7270.29 18175.71 3314.56 1789.17 183454.00
Total
2006-07 44.87 503393 250626 252767 11218.92 28047.30 5633.32 14083.30 2909.79 1448.71 404866.00
2007-08 52.57 616755 314247 302508 11732.07 29330.18 5754.38 14385.96 2892.17 1418.56 526765.00
2008-09 44.27 584925 278542 306383 13212.67 33031.68 6920.78 17301.95 3196.31 1674.22 505206.00
Note: Gross Returns = Value of Main Product (Production * Price) + Value of by-product
Net Returns = Gross Returns – Paid-out Costs
Value of Marketed Surplus = Quantity Sold * Price
Gross Returns / Hectare = Gross Returns / Area Sown under the Crop
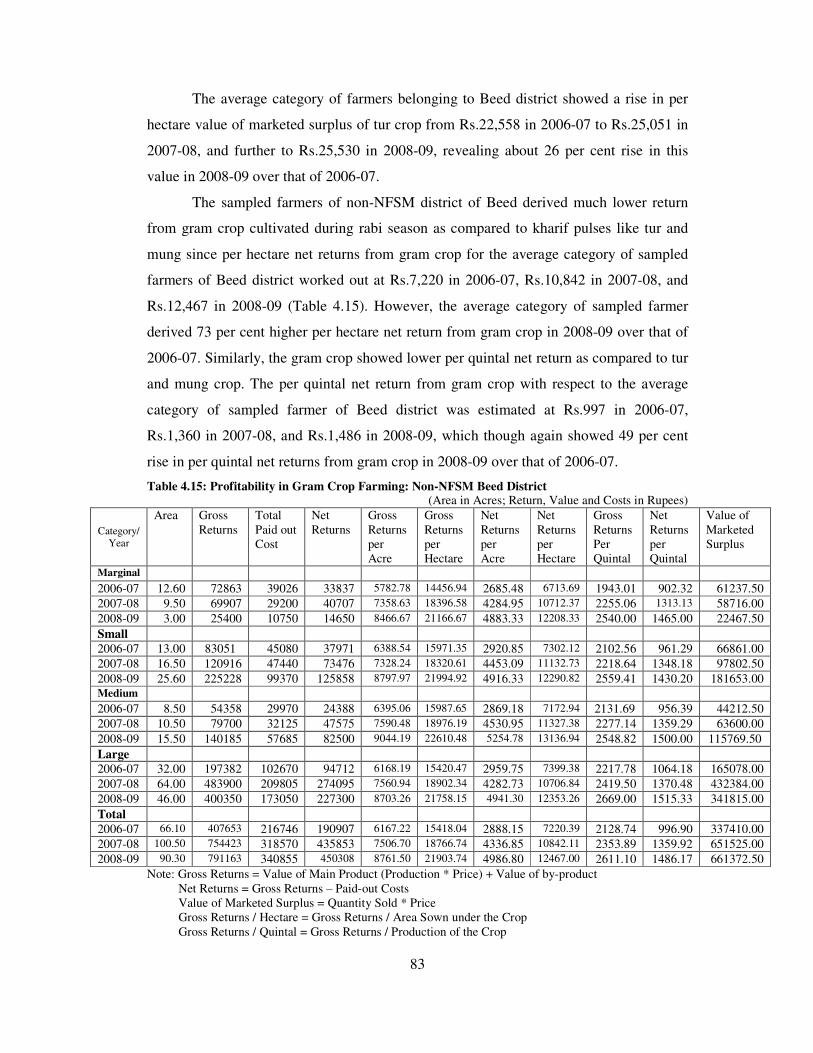
83
The average category of farmers belonging to Beed district showed a rise in per
hectare value of marketed surplus of tur crop from Rs.22,558 in 2006-07 to Rs.25,051 in
2007-08, and further to Rs.25,530 in 2008-09, revealing about 26 per cent rise in this
value in 2008-09 over that of 2006-07.
The sampled farmers of non-NFSM district of Beed derived much lower return
from gram crop cultivated during rabi season as compared to kharif pulses like tur and
mung since per hectare net returns from gram crop for the average category of sampled
farmers of Beed district worked out at Rs.7,220 in 2006-07, Rs.10,842 in 2007-08, and
Rs.12,467 in 2008-09 (Table 4.15). However, the average category of sampled farmer
derived 73 per cent higher per hectare net return from gram crop in 2008-09 over that of
2006-07. Similarly, the gram crop showed lower per quintal net return as compared to tur
and mung crop. The per quintal net return from gram crop with respect to the average
category of sampled farmer of Beed district was estimated at Rs.997 in 2006-07,
Rs.1,360 in 2007-08, and Rs.1,486 in 2008-09, which though again showed 49 per cent
rise in per quintal net returns from gram crop in 2008-09 over that of 2006-07.
Table 4.15: Profitability in Gram Crop Farming: Non-NFSM Beed District (Area in Acres; Return, Value and Costs in Rupees)
Category/
Year
Area Gross
Returns
Total
Paid out
Cost
Net
Returns
Gross
Returns
per
Acre
Gross
Returns
per
Hectare
Net
Returns
per
Acre
Net
Returns
per
Hectare
Gross
Returns
Per
Quintal
Net
Returns
per
Quintal
Value of
Marketed
Surplus
Marginal
2006-07 12.60 72863 39026 33837 5782.78 14456.94 2685.48 6713.69 1943.01 902.32 61237.50
2007-08 9.50 69907 29200 40707 7358.63 18396.58 4284.95 10712.37 2255.06 1313.13 58716.00
2008-09 3.00 25400 10750 14650 8466.67 21166.67 4883.33 12208.33 2540.00 1465.00 22467.50
Small
2006-07 13.00 83051 45080 37971 6388.54 15971.35 2920.85 7302.12 2102.56 961.29 66861.00
2007-08 16.50 120916 47440 73476 7328.24 18320.61 4453.09 11132.73 2218.64 1348.18 97802.50
2008-09 25.60 225228 99370 125858 8797.97 21994.92 4916.33 12290.82 2559.41 1430.20 181653.00
Medium
2006-07 8.50 54358 29970 24388 6395.06 15987.65 2869.18 7172.94 2131.69 956.39 44212.50
2007-08 10.50 79700 32125 47575 7590.48 18976.19 4530.95 11327.38 2277.14 1359.29 63600.00
2008-09 15.50 140185 57685 82500 9044.19 22610.48 5254.78 13136.94 2548.82 1500.00 115769.50
Large
2006-07 32.00 197382 102670 94712 6168.19 15420.47 2959.75 7399.38 2217.78 1064.18 165078.00
2007-08 64.00 483900 209805 274095 7560.94 18902.34 4282.73 10706.84 2419.50 1370.48 432384.00
2008-09 46.00 400350 173050 227300 8703.26 21758.15 4941.30 12353.26 2669.00 1515.33 341815.00
Total
2006-07 66.10 407653 216746 190907 6167.22 15418.04 2888.15 7220.39 2128.74 996.90 337410.00
2007-08 100.50 754423 318570 435853 7506.70 18766.74 4336.85 10842.11 2353.89 1359.92 651525.00
2008-09 90.30 791163 340855 450308 8761.50 21903.74 4986.80 12467.00 2611.10 1486.17 661372.50
Note: Gross Returns = Value of Main Product (Production * Price) + Value of by-product
Net Returns = Gross Returns – Paid-out Costs
Value of Marketed Surplus = Quantity Sold * Price
Gross Returns / Hectare = Gross Returns / Area Sown under the Crop
Gross Returns / Quintal = Gross Returns / Production of the Crop

84
Like tur and mung, the gram crop showed a steady increase in per hectare value of
marketed surplus, which, for the average category of sampled farmers of Beed district,
increased from Rs.12,761 in 2006-07 to Rs.16,207 in 2007-08, and further to Rs.18,310
in 2008-09, revealing 43 per cent rise in the same in 2008-09 over that of 2006-07. A
greater rise in per hectare value of marketed surplus of gram crop was noticed in 2007-08
over that of 2006-07 as against rise in the same between 2007-08 and 2008-09.
Although various pulses crops cultivated on farms belonging to sampled farmers
of non-NFSM district of Beed showed varied net returns with tur crop showing higher per
hectare net returns and mung showing higher per quintal net returns, the general scenario
with all the pulses crops put together reveled a steady rise in per hectare as well per
quintal net returns during the period between 2006-07 and 2008-09 with rise in the same
being more sharp between 2007-08 and 2008-09. The average category of farmer of Beed
district showed an increase in per hectare net returns from total pulses crops from
Rs.9,750 in 2006-07 to Rs.11,487 in 2007-08, and further to Rs.13,829 in 2008-09,
showing 42 per cent rise in per hectare net returns from total pulses crops cultivation in
2008-09 over that of 2006-07 (Table 4.16).
Table 4.16: Profitability in Total Pulses Crops Farming: Non-NFSM Beed District (Area in Acres; Return, Value and Costs in Rupees)
Category/
Year
Area Gross
Returns
Total
Paid out
Cost
Net
Returns
Gross
Returns
per
Acre
Gross
Returns
per
Hectare
Net
Returns
per
Acre
Net
Returns
per
Hectare
Gross
Returns
Per
Quintal
Net
Returns
per
Quintal
Value of
Marketed
Surplus
Marginal
2006-07 23.62 198250 105538 92712 8393.31 20983.28 3925.15 9812.87 2625.83 1227.97 159527
2007-08 13.52 109809 48533 61276 8121.97 20304.92 4532.25 11330.62 2453.83 1369.3 90248.25
2008-09 12.02 134228 64432 69796 11167.05 27917.64 5806.66 14516.64 3016.36 1568.44 118603
Small
2006-07 34.6 300345 165312 143693 8680.49 21701.23 4152.98 10382.44 2742.88 1312.26 247227.5
2007-08 38.85 367243 175331 191912 9452.84 23632.11 4939.82 12349.55 2788.48 1457.19 303362.3
2008-09 57.85 623858 318198 305660 10784.06 26960.16 5283.66 13209.16 3224.07 1579.64 522733
Medium 2006-07 33.75 311708 163731 147977 9235.79 23089.48 4384.50 10961.26 2758.48 1309.53 256890.5
2007-08 36.95 395359 217484 177875 10699.84 26749.59 4813.94 12034.84 2834.11 1275.09 333682
2008-09 39.75 461146 233725 227421 11601.16 29002.89 5721.28 14303.21 3224.8 1590.36 399435
Large
2006-07 49.25 371853 196805 175048 7550.31 18875.79 3554.27 8885.69 2795.89 1316.15 319141
2007-08 103 928414 475775 452639 9013.73 22534.32 4394.55 10986.38 2796.43 1363.37 838851
2008-09 74.75 793430 375375 418055 10614.45 26536.12 5592.71 13981.77 3099.34 1633.03 687700.5
Total
2006-07 141.22 1182154 631385 550769 8371.01 20927.52 3900.08 9750.19 2668.52 1243.27 983044
2007-08 192.32 1800823 917123 883700 9363.68 23409.20 4594.95 11487.36 2779.26 1363.84 1564584.4
2008-09 184.57 2012661 991730 1020931 10904.59 27261.49 5531.40 13828.51 3159.59 1602.72 1728100.5
Note: Gross Returns = Value of Main Product (Production * Price) + Value of by-product
Net Returns = Gross Returns – Paid-out Costs
Value of Marketed Surplus = Quantity Sold * Price
Gross Returns / Hectare = Gross Returns / Area Sown under the Crop
Gross Returns / Quintal = Gross Returns / Production of the Crop

85
As for the average category of sampled farmers belonging to non-NFSM district
of Beed, the total pulses crops yielded a per quintal net returns to the tune of Rs.1,243 in
2006-07, Rs.1,364 in 2007-08, and Rs.1,603 in 2008-09, revealing 10 per cent rise in per
quintal net returns from total pulse crops in 2007-08 over that of 2006-07, 18 per cent rise
in the same in 2008-09 over that of 2007-08, and 29 per cent rise in the same in 2008-09
over that of 2006-07. The average category of sampled farmers of Beed district showed
an increase in per hectare value of marketed surplus with respect to total pulses crops
from Rs.17.403 in 2006-07 to Rs.20,338 in 2007-08, and further to Rs.23,407 in 2008-09,
showing 34 per cent rise in per hectare value of marketed surplus from total pulses crops
in 2008-09 over that of 2006-07.
It is to be noted that tough pulses crop farming was lucrative proposition in both
NFSM district of Amravati and non-NFSM district of Beed, the amount of net profit
involved in the cultivation of pulses crops stood at much higher in the NFSM district of
Amravati as against the non-NFSM district of Beed. The extent of net returns per hectare
as well as per quintal from pulses crops stood at quite high in 2008-09 as compared to
2007-08 and 2006-09, especially in the NFSM district of Amravati.
The pulses crops like tur yielded the highest net returns per hectare as against
mung and gram crop in both NFSM district of Amravati and non-NFSM district of Beed.
Although the element of net per hectare profit in tur crop cultivation for the average
category of farmers of NFSM district of Amravati was worked out at Rs.15,802 in 2006-
07, Rs.15,866 in 2007-08, and as much as Rs.24,372 in 2008-09, the similar estimates
with respect to tur crop in the non-NFSM district of Beed stood at Rs.14,083 in 2006-07,
Rs.14,386 in 2007-08, and Rs.17,302 in 2008-09. The next important pulse crop
generating substantial profit in its cultivation was rabi gram, which, on an average,
yielded a net per hectare return to the tune of Rs.8,170 in 2006-07, Rs.13,707 in 2007-08,
and Rs.20,300 in 2008-09 in the NFSM district of Amravati as against estimates in this
respect generated in non-NFSM district of Beed, which showed a net per hectare return
from gram crop cultivation to the tune of Rs.7,220 in 2006-07,Rs.10,842 in 2007-08, and
Rs.12,467 in 2008-09. The pulse crop like mung yielded the lowest per hectare returns on
the farms belonging to both sampled farmers of NFSM district of Amravati and non-
NFSM district of Beed. The element of per hectare profit involved in the cultivation of
mung crop in the NFSM district of Amravati, on an average, was estimated at Rs.8,660 in
2006-07, Rs.9,448 in 2007-08, and Rs.13,113 in 2008-09 as against net per hectare return
86
emanating from this crop to the tune of Rs.8,851 in 2006-07, 9,238 in 2007-08, and
Rs.13,212 in 2008-09. Even for the total pulses crops, the element of per hectare net
return was substantially high in the NFSM district of Amravati as against the non-NFSM
district of Beed since the extent of per hectare net profit from pulses crops, on an average,
was Rs.8,897 in 2006-07, Rs.11,861 in 2007-08, and Rs.17,076 in 2008-09 as against
similar figures estimated for the non-NFSM district of Beed at Rs.9,750 in 2006-07,
Rs.11,487 in 2007-08, and Rs.13,829 in 2008-09. These estimates clearly bring us closer
to the fact that not only various pulses crops cultivated in NFSM district of Amravati
yielded higher net returns as against pulses crops cultivated in non-NFSM district of
Beed but the rise in the element of profit in pulses crop cultivation in 2008-09 vis-à-vis
2007-08 and 2006-07 was quite substantial in NFSM district of Amravati as against its
counterpart in non-NFSM district of Beed, which clearly show a positive impact of
NFSM programme in the NFSM district of Amravati.
4.2.2 Economics of Other Major Crops in Non-NFSM District
The cropping pattern of sampled farmers drawn from the non-NFSM district of
Beed was mainly dominated by other crops as compared to pulses crops. The other crops
cultivated on the farms belonging to the non-NFSM district of Beed included soybean,
kharif jowar, cotton, bajra, rabi jowar, wheat, kardi, onion, sugarcane and banana. The
estimates relating to gross returns, paid out cost, net returns, per hectare gross and net
returns, per quintal gross and net returns, and value of marketed surplus of these crops for
various categories of sampled farmers of Beed district for the reference years 2006-07,
2007-08 and 2008-09 are brought out separately in Tables 4.17, Table 4.18, Table 4.19,
Table 4.20, Table 4.21, Table 4.22, and Table 4.23, Table 4.24, Table 4.25, and Table
4.26. The cost and return estimates along with value of marketed surplus for the given
reference years with respect to all other crops put together for various categories of
sampled farmers of Beed district are furnished in Table 4.27.
It is to be noted that some of the other crops were common in the cropping pattern
of sampled farmers of NFSM district of Amravati and non-NFSM district of Beed, and
these crops mainly included soybean, kharif jowar, cotton and bajra. However, the
element of profit involved in their cultivation widely differed in the NFSM district of
Amravati and non-NFSM district of Beed. The estimated per hectare and per quintal net
returns coupled with value of marketed surplus of soybean crop cultivated on the farms
belonging to non-NFSM district of Beed are brought out in Table 4.17.

87
Although per hectare net returns from soybean crop varied significantly across
various categories of sampled farmers of Beed district, an increase in the same was
noticed with the increase in land holding size of sampled farmers throughout the period
between 2006-07 and 2007-08. However, the average category of sampled farmer drawn
from the non-NFSM district of Beed showed per hectare net return from soybean crop to
the tune of Rs.11,915 in 2006-07, Rs.14,363 in 2007-08, and Rs.15,141 in 2008-09,
showing overall rise in the same of the order of 27 per cent in 2008-09 over that of 2006-
07. As regards net return from soybean crop on per quintal basis, the average category of
sampled farmer of Beed district showed a return of the order of Rs.895 in 2006-07,
Rs.975 in 2007-08, and Rs.983 in 2008-09, revealing hardly much difference in net
returns per quintal from soybean crop during the period between 2006-07 and 2007-08.
However, the per hectare value of marketed surplus of soybean increased substantially as
the average category of sampled farmer of Beed district showed an increase in this value
from Rs.24,441 in 2006-07 to Rs.29,478 in 2007-08, and further to Rs.30,075 in 2008-09,
showing an overall increase in the same to the tune of 23 per cent in 2008-09 over that of
2006-07 with increase in this value being more sharp in 2007-08 over that of 2006-07.
Table 4.17: Profitability in Soybean Crop Farming: Non-NFSM Beed District (Area in Acres; Return, Value and Costs in Rupees)
Category/
Year
Area Gross
Returns
Total
Paid out
Cost
Net
Returns
Gross
Returns
per
Acre
Gross
Returns
per
Hectare
Net
Returns
per
Acre
Net
Returns
per
Hectare
Gross
Returns
Per
Quintal
Net
Returns
per
Quintal
Value of
Marketed
Surplus
Marginal
2006-07 4.50 33221 17575 15646 7382.44 18456.11 3476.89 8692.22 1748.47 823.47 31996.00
2007-08 - - - - - - - - - - -
2008-09 - - - - - - - - - - -
Small
2006-07 7.00 64694 36150 28544 9242.00 23105.00 4077.71 10194.29 1902.76 839.53 60753.00
2007-08 11.00 131040 66150 64890 11912.73 29781.82 5899.09 14747.73 2080.00 1030.00 124845.00
2008-09 4.00 47950 26200 21750 11987.50 29968.75 5437.50 13593.75 1997.92 906.25 46800.00
Medium
2006-07 9.00 99090 53850 45240 11010.00 27525.00 5026.67 12566.67 1942.94 887.06 92610.00
2007-08 5.00 67852 38550 29302 13570.40 33926.00 5860.40 14651.00 2188.77 945.23 66402.00
2008-09 3.00 36875 18750 18125 12291.67 30729.17 6041.67 15104.67 2048.61 1006.94 36000.00
Large
2006-07 18.00 204168 110100 94068 11342.67 28356.67 5226.00 13065.00 2021.46 931.37 190896.00
2007-08 7.25 91232 51850 39382 12583.72 31459.31 5432.00 13580.00 2121.67 915.86 82960.00
2008-09 5.00 67050 34250 32800 13410.00 33525.00 6560.00 16400.00 2095.31 1025.00 61500.00
Total
2006-07 38.50 401173 217675 183498 10420.08 26050.19 4766.18 11915.45 1956.94 895.11 376398.00
2007-08 23.25 290124 156550 133574 12478.45 31196.13 5745.12 14362.80 2117.69 974.99 274142.50
2008-09 12.00 151875 79200 72675 12656.25 31640.63 6056.25 15140.63 2052.36 982.09 144360.00 Note: Gross Returns = Value of Main Product (Production * Price) + Value of by-product
Net Returns = Gross Returns – Paid-out Costs
Value of Marketed Surplus = Quantity Sold * Price
Gross Returns / Hectare = Gross Returns / Area Sown under the Crop

88
The marginal and medium categories of sampled farmers belonging to the non-
NFSM district of Beed were found to allocate very small area under kharif jowar
cultivation despite very low profit margin involved in its cultivation. The per hectare net
profit margin in the cultivation of kharif jowar for the average category of farmer
belonging to Beed district was estimated at Rs.6,529 in 2007-08 and Rs.6,175 in 2008-09,
reveling a 5 per cent decline in profit margin from kharif jowar cultivation in 2008-09
over that of 2007-08 (Table 4.18). The margin of profit from kharif jowar cultivation on
per quintal basis also declined in 2008-09 over that of 2007-08 since per quintal net
return from kharif jowar cultivation for the average category of sampled farmer of Beed
district was estimated at Rs.499 in 2007-08 and Rs.453 in 2008-09, showing about 9 per
cent decline in per quintal net returns from kharif jowar in 2008-09 over that of 2007-08.
The decline in per quintal net return from kharif jowar was, therefore, sharper than
decline in per hectare net return from this crop. The per hectare value of marketed surplus
with respect to kharif jowar was very low as it stood at only Rs.6,423 in 2007-08 for the
average category of sampled farmer of Beed district. The major reason for the lower per
hectare value of marketed surplus of kharif jowar was the fact that sampled farmers
cultivated this crop mainly for home consumption and not for the purpose of marketing.
Table 4.18: Profitability in Kharif Jowar Crop Farming: Non-NFSM Beed District (Area in Acres; Return, Value and Costs in Rupees)
Category/
Year
Area Gross
Returns
Total
Paid out
Cost
Net
Returns
Gross
Returns
per
Acre
Gross
Returns
per
Hectare
Net
Returns
per
Acre
Net
Returns
per
Hectare
Gross
Returns
Per
Quintal
Net
Returns
per
Quintal
Value of
Marketed
Surplus
Marginal 2006-07 - - - - - - - - - - -
2007-08 0.30 1520 630 890 5066.67 12666.67 2966.67 7416.67 844.44 494.44 -
2008-09 1.00 5250 2350 2900 5250.00 13125.00 2900.00 7250.00 875.00 483.33 -
Small 2006-07 - - - - - - - - - - -
2007-08 - - - - - - - - - - -
2008-09 - - - - - - - - - - -
Medium
2006-07 - - - - - - - - - - -
2007-08 1.00 4475 1970 2505 4475.00 11187.50 2505.00 6262.50 895.00 501.00 3375.00
2008-09 1.75 7700 3808 3892 4400.00 11000.00 2224.00 5560.00 855.56 432.44 -
Large 2006-07 - - - - - - - - - - -
2007-08 - - - - - - - - - - -
2008-09 - - - - - - - - - - -
Total
2006-07 - - - - - - - - - - -
2007-08 1.30 5995 2600 3395 4611.54 11528.85 2611.54 6528.85 881.62 499.26 3340.00
2008-09 2.75 12950 6158 6792 4709.09 11772.73 2469.82 6174.55 863.33 452.80 -
Note: Gross Returns = Value of Main Product (Production * Price) + Value of by-product
Net Returns = Gross Returns – Paid-out Costs
Value of Marketed Surplus = Quantity Sold * Price
Gross Returns / Hectare = Gross Returns / Area Sown under the Crop

89
Another very important crop cultivated on the farms of sampled farmers
belonging to the non-NFSM district of Beed was cotton since all the sampled farmers
allocated substantial area under this crop due to high element of profit margin involved in
its cultivation. In the cultivation of cotton crop, the average category of sampled farmer
drawn from the non-NFSM district of Beed generated per hectare net return of the order
of Rs.14,014 in 2006-07, Rs.15,417 in 2007-08, and Rs.16,659 in 2008-09, showing only
19 per cent overall increase in net per hectare return from cotton crop cultivation in 2008-
09 over that of 2006-07 (Table 4.19). Further, the average category of sampled farmer of
Beed district by and large generated same per quintal net return from cotton crop in 2006-
07, 2007-08 and 2008-09 since it was estimated at Rs.1,026 in 2006-07, Rs.1,097 in
2007-08, and Rs.1,103 in 2008-09, showing hardly any difference in per quintal net
returns from cotton crop. However, the average category of sampled farmer of Beed
district showed an increase in per hectare value of marketed surplus from cotton crop,
which increased from Rs.29,568 in 2006-07 to Rs.32,495 in 2007-08, and further to
Rs.34,693 in 2008-09, recording about 17 per cent overall rise in per hectare value of
marketed surplus from cotton crop in 2008-09 over that of 2006-07.
Table 4.19: Profitability in Cotton Crop Farming: Non-NFSM Beed District (Area in Acres; Return, Value and Costs in Rupees)
Category/
Year
Area Gross
Returns
Total
Paid out
Cost
Net
Returns
Gross
Returns
per
Acre
Gross
Returns
per
Hectare
Net
Returns
per
Acre
Net
Returns
per
Hectare
Gross
Returns
Per
Quintal
Net
Returns
per
Quintal
Value of
Marketed
Surplus
Marginal
2006-07 6.75 61312 36088 25224 9083.26 22708.15 3736.89 9342.22 2189.71 900.86 59612.00
2007-08 12.95 167298 90083 77215 12918.76 32296.91 5962.55 14906.37 2307.56 1065.03 163922.50
2008-09 14.25 201415 102038 99377 14134.39 35335.96 6973.82 17434.56 2237.94 1104.19 197640.00
Small
2006-07 27.00 348835 193935 154900 12919.81 32299.54 5737.04 14342.59 2250.55 999.35 340981.50
2007-08 22.50 296760 160625 136135 13189.33 32973.33 6050.44 15126.11 2364.62 1084.74 291034.50
2008-09 21.75 313352 164263 149089 14406.99 36017.47 6854.67 17136.67 2329.75 1108.47 307601.50
Medium
2006-07 36.00 404784 249290 155494 11244.00 28110.00 4319.28 10798.19 2199.91 845.08 395784.00
2007-08 41.00 558157 297975 260182 13613.59 34033.96 6345.90 15864.76 2355.09 1097.81 547707.00
2008-09 39.00 533060 297915 235145 13668.21 34170.51 6029.36 15073.40 2390.40 1009.21 546385.00
Large
2006-07 52.00 656680 309800 346880 12628.46 31571.15 6670.77 16676.92 2203.62 1164.03 643680.00
2007-08 18.00 229532 120600 108932 12751.78 31879.44 6051.78 15129.44 2390.96 1134.71 224832.00
2008-09 41.00 568914 303000 265914 13875.95 34689.88 6485.71 16214.27 2341.21 1094.30 558414.00
Total
2006-07 121.75 1471611 789113 682498 12087.15 30217.89 5605.73 14014.33 2212.95 1026.31 1439971.50
2007-08 94.45 1251746 669283 582463 13253.00 33132.50 6166.89 15417.23 2357.34 1096.92 1227672.00
2008-09 116.00 1640191 867215 772976 14139.58 35348.94 6663.59 16658.97 2341.46 1103.46 1609749.00
Note: Gross Returns = Value of Main Product (Production * Price) + Value of by-product
Net Returns = Gross Returns – Paid-out Costs
Value of Marketed Surplus = Quantity Sold * Price
Gross Returns / Hectare = Gross Returns / Area Sown under the Crop
Gross Returns / Quintal = Gross Returns / Production of the Crop
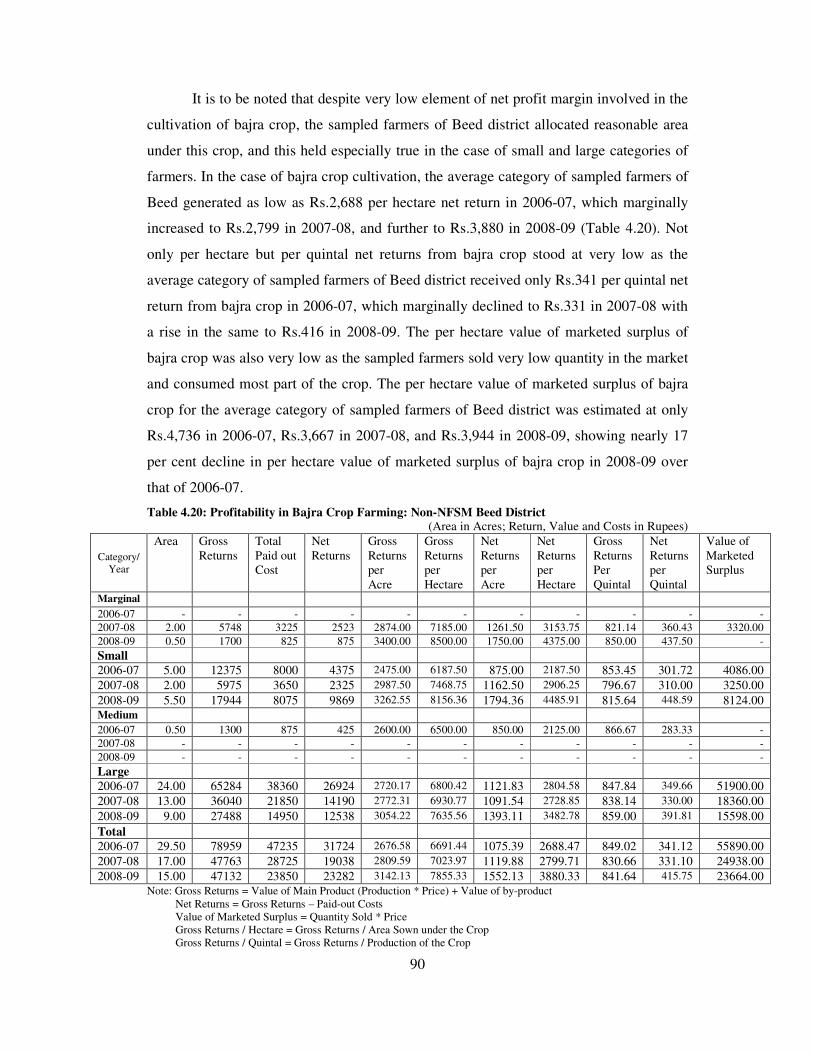
90
It is to be noted that despite very low element of net profit margin involved in the
cultivation of bajra crop, the sampled farmers of Beed district allocated reasonable area
under this crop, and this held especially true in the case of small and large categories of
farmers. In the case of bajra crop cultivation, the average category of sampled farmers of
Beed generated as low as Rs.2,688 per hectare net return in 2006-07, which marginally
increased to Rs.2,799 in 2007-08, and further to Rs.3,880 in 2008-09 (Table 4.20). Not
only per hectare but per quintal net returns from bajra crop stood at very low as the
average category of sampled farmers of Beed district received only Rs.341 per quintal net
return from bajra crop in 2006-07, which marginally declined to Rs.331 in 2007-08 with
a rise in the same to Rs.416 in 2008-09. The per hectare value of marketed surplus of
bajra crop was also very low as the sampled farmers sold very low quantity in the market
and consumed most part of the crop. The per hectare value of marketed surplus of bajra
crop for the average category of sampled farmers of Beed district was estimated at only
Rs.4,736 in 2006-07, Rs.3,667 in 2007-08, and Rs.3,944 in 2008-09, showing nearly 17
per cent decline in per hectare value of marketed surplus of bajra crop in 2008-09 over
that of 2006-07.
Table 4.20: Profitability in Bajra Crop Farming: Non-NFSM Beed District (Area in Acres; Return, Value and Costs in Rupees)
Category/
Year
Area Gross
Returns
Total
Paid out
Cost
Net
Returns
Gross
Returns
per
Acre
Gross
Returns
per
Hectare
Net
Returns
per
Acre
Net
Returns
per
Hectare
Gross
Returns
Per
Quintal
Net
Returns
per
Quintal
Value of
Marketed
Surplus
Marginal 2006-07 - - - - - - - - - - -
2007-08 2.00 5748 3225 2523 2874.00 7185.00 1261.50 3153.75 821.14 360.43 3320.00
2008-09 0.50 1700 825 875 3400.00 8500.00 1750.00 4375.00 850.00 437.50 -
Small
2006-07 5.00 12375 8000 4375 2475.00 6187.50 875.00 2187.50 853.45 301.72 4086.00
2007-08 2.00 5975 3650 2325 2987.50 7468.75 1162.50 2906.25 796.67 310.00 3250.00
2008-09 5.50 17944 8075 9869 3262.55 8156.36 1794.36 4485.91 815.64 448.59 8124.00
Medium 2006-07 0.50 1300 875 425 2600.00 6500.00 850.00 2125.00 866.67 283.33 -
2007-08 - - - - - - - - - - -
2008-09 - - - - - - - - - - -
Large
2006-07 24.00 65284 38360 26924 2720.17 6800.42 1121.83 2804.58 847.84 349.66 51900.00
2007-08 13.00 36040 21850 14190 2772.31 6930.77 1091.54 2728.85 838.14 330.00 18360.00
2008-09 9.00 27488 14950 12538 3054.22 7635.56 1393.11 3482.78 859.00 391.81 15598.00
Total
2006-07 29.50 78959 47235 31724 2676.58 6691.44 1075.39 2688.47 849.02 341.12 55890.00
2007-08 17.00 47763 28725 19038 2809.59 7023.97 1119.88 2799.71 830.66 331.10 24938.00
2008-09 15.00 47132 23850 23282 3142.13 7855.33 1552.13 3880.33 841.64 415.75 23664.00
Note: Gross Returns = Value of Main Product (Production * Price) + Value of by-product
Net Returns = Gross Returns – Paid-out Costs
Value of Marketed Surplus = Quantity Sold * Price
Gross Returns / Hectare = Gross Returns / Area Sown under the Crop
Gross Returns / Quintal = Gross Returns / Production of the Crop
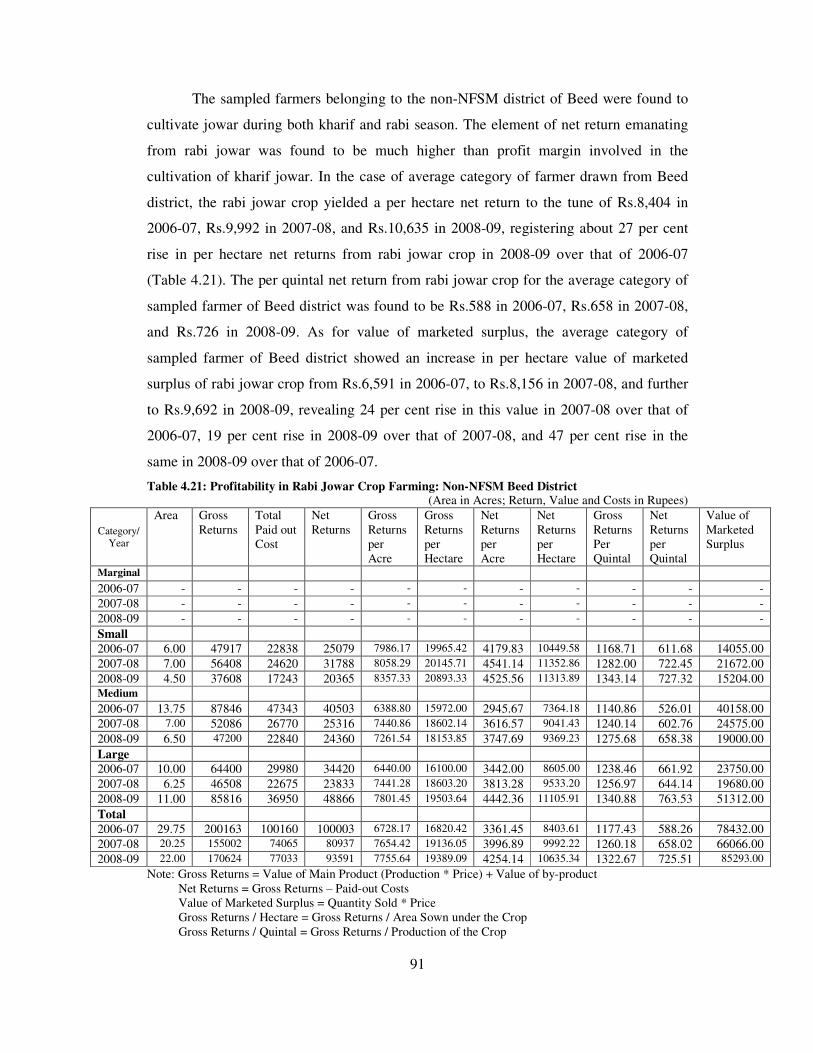
91
The sampled farmers belonging to the non-NFSM district of Beed were found to
cultivate jowar during both kharif and rabi season. The element of net return emanating
from rabi jowar was found to be much higher than profit margin involved in the
cultivation of kharif jowar. In the case of average category of farmer drawn from Beed
district, the rabi jowar crop yielded a per hectare net return to the tune of Rs.8,404 in
2006-07, Rs.9,992 in 2007-08, and Rs.10,635 in 2008-09, registering about 27 per cent
rise in per hectare net returns from rabi jowar crop in 2008-09 over that of 2006-07
(Table 4.21). The per quintal net return from rabi jowar crop for the average category of
sampled farmer of Beed district was found to be Rs.588 in 2006-07, Rs.658 in 2007-08,
and Rs.726 in 2008-09. As for value of marketed surplus, the average category of
sampled farmer of Beed district showed an increase in per hectare value of marketed
surplus of rabi jowar crop from Rs.6,591 in 2006-07, to Rs.8,156 in 2007-08, and further
to Rs.9,692 in 2008-09, revealing 24 per cent rise in this value in 2007-08 over that of
2006-07, 19 per cent rise in 2008-09 over that of 2007-08, and 47 per cent rise in the
same in 2008-09 over that of 2006-07.
Table 4.21: Profitability in Rabi Jowar Crop Farming: Non-NFSM Beed District (Area in Acres; Return, Value and Costs in Rupees)
Category/
Year
Area Gross
Returns
Total
Paid out
Cost
Net
Returns
Gross
Returns
per
Acre
Gross
Returns
per
Hectare
Net
Returns
per
Acre
Net
Returns
per
Hectare
Gross
Returns
Per
Quintal
Net
Returns
per
Quintal
Value of
Marketed
Surplus
Marginal
2006-07 - - - - - - - - - - -
2007-08 - - - - - - - - - - -
2008-09 - - - - - - - - - - -
Small
2006-07 6.00 47917 22838 25079 7986.17 19965.42 4179.83 10449.58 1168.71 611.68 14055.00
2007-08 7.00 56408 24620 31788 8058.29 20145.71 4541.14 11352.86 1282.00 722.45 21672.00
2008-09 4.50 37608 17243 20365 8357.33 20893.33 4525.56 11313.89 1343.14 727.32 15204.00
Medium
2006-07 13.75 87846 47343 40503 6388.80 15972.00 2945.67 7364.18 1140.86 526.01 40158.00
2007-08 7.00 52086 26770 25316 7440.86 18602.14 3616.57 9041.43 1240.14 602.76 24575.00
2008-09 6.50 47200 22840 24360 7261.54 18153.85 3747.69 9369.23 1275.68 658.38 19000.00
Large
2006-07 10.00 64400 29980 34420 6440.00 16100.00 3442.00 8605.00 1238.46 661.92 23750.00
2007-08 6.25 46508 22675 23833 7441.28 18603.20 3813.28 9533.20 1256.97 644.14 19680.00
2008-09 11.00 85816 36950 48866 7801.45 19503.64 4442.36 11105.91 1340.88 763.53 51312.00
Total
2006-07 29.75 200163 100160 100003 6728.17 16820.42 3361.45 8403.61 1177.43 588.26 78432.00
2007-08 20.25 155002 74065 80937 7654.42 19136.05 3996.89 9992.22 1260.18 658.02 66066.00
2008-09 22.00 170624 77033 93591 7755.64 19389.09 4254.14 10635.34 1322.67 725.51 85293.00
Note: Gross Returns = Value of Main Product (Production * Price) + Value of by-product
Net Returns = Gross Returns – Paid-out Costs
Value of Marketed Surplus = Quantity Sold * Price
Gross Returns / Hectare = Gross Returns / Area Sown under the Crop
Gross Returns / Quintal = Gross Returns / Production of the Crop

92
The medium and large categories of sampled farmers belonging to the non-NFSM
district of Beed were also found to cultivate wheat crop on their farms and some of the
large category of farmers, in particular, had allocated significant area under its cultivation
despite not very high returns emanating from this crop vis-à-vis cotton and pulses crops.
The extent of per hectare net returns emanating from wheat crop for the average category
of sampled farmers of Beed district was found to be Rs.6,375 in 2006-07, Rs.7,025 in
2007-08, and Rs.8,195 in 2008-09. Further, in the cultivation of wheat crop, the average
category of farmer received Rs.546 per quintal net return in 2006-07, Rs.562 in 2007-08
and Rs.617 in 2008-09, revealing hardly any rise in per quintal net returns from wheat
crop during the period between 2006-07 and 2008-09 (Table 4.22). Nonetheless, the per
hectare value of marketed surplus of wheat crop for the average category of sampled
farmer increased from Rs.9,000 in 2006-07 to Rs.12,500 in 2007-08, and further to
Rs.13,125 in 2008-09, recording 46 per cent rise in per hectare value of marketed surplus
of wheat crop in 2008-09 over that of 2006-07. The cultivation of wheat crop on the
farms of sampled farmers of Beed district was partly for family consumption purpose and
partly for the marketing purpose.
Table 4.22: Profitability in Wheat Crop Farming: Non-NFSM Beed District (Area in Acres; Return, Value and Costs in Rupees)
Category/
Year
Area Gross
Returns
Total
Paid out
Cost
Net
Returns
Gross
Returns
per
Acre
Gross
Returns
per
Hectare
Net
Returns
per
Acre
Net
Returns
per
Hectare
Gross
Returns
Per
Quintal
Net
Returns
per
Quintal
Value of
Marketed
Surplus
Marginal 2006-07 - - - - - - - - - - -
2007-08 - - - - - - - - - - -
2008-09 - - - - - - - - - - -
Small
2006-07 - - - - - - - - - - -
2007-08 - - - - - - - - - - -
2008-09 - - - - - - - - - - -
Medium
2006-07 3.00 14400 6750 7650 4800.00 12000.00 2550.00 6375.00 1028.57 546.43 10800.00
2007-08 - - - - - - - - - - -
2008-09 2.00 12400 5550 6850 6200.00 15500.00 3425.00 8562.50 1127.27 622.73 9000.00
Large
2006-07 - - - - - - - - - - -
2007-08 10.00 56200 28100 28100 5620.00 14050.00 2810.00 7025.00 1124.00 562.00 50000.00
2008-09 6.00 37075 17700 19375 6179.17 15447.92 3229.17 8072.92 1176.98 615.08 33075.00
Total
2006-07 3.00 14400 6750 7650 4800.00 12000.00 2550.00 6375.00 1028.57 546.43 10800.00
2007-08 10.00 56200 28100 28100 5620.00 14050.00 2810.00 7025.00 1124.00 562.00 50000.00
2008-09 8.00 49475 23250 26225 6184.38 15460.94 3278.13 8195.31 1164.12 617.06 41998.50
Note: Gross Returns = Value of Main Product (Production * Price) + Value of by-product
Net Returns = Gross Returns – Paid-out Costs
Value of Marketed Surplus = Quantity Sold * Price
Gross Returns / Hectare = Gross Returns / Area Sown under the Crop
Gross Returns / Quintal = Gross Returns / Production of the Crop

93
Another crop cultivated by the medium and large categories of sampled farmers
of Beed district was noticed to be kardi, though area allocation under this crop stood at
very low. It seems the cultivation of this crop was mainly for family consumption
purpose since the marketing of this crop did not take place in 2008-09 despite its
cultivation by the sampled farmers. In the cultivation of kardi crop, the average category
of sampled farmer of Beed district could generate per hectare net returns to the tune of
only Rs.5,036 in 2006-07 and Rs.5,063 in 2008-09, showing hardly any difference in per
hectare net returns from this crop during 2006-07 and 2008-09 (Table 4.23). Further, the
per quintal net return from kardi crop was also very low since the average category of
sampled farmers could receive only Rs.722 per quintal net returns from this crop in 2006-
07 and Rs.810 in 2008-09. The per hectare value of marketed surplus with respect to
kardi crop was estimated at Rs.3,913 in 2006-07 despite per hectare gross return from the
same to the tune of Rs.11,957 in 2006-07. The lower per hectare value of marketed
surplus of kardi crop was mainly due to very low quantity of the crop being marketed and
major portion of the crop being used for home consumption.
Table 4.23: Profitability in Kardi Crop Farming: Non-NFSM Beed District (Area in Acres; Return, Value and Costs in Rupees)
Category/
Year
Area Gross
Returns
Total
Paid out
Cost
Net
Returns
Gross
Returns
per
Acre
Gross
Returns
per
Hectare
Net
Returns
per
Acre
Net
Returns
per
Hectare
Gross
Returns
Per
Quintal
Net
Returns
per
Quintal
Value of
Marketed
Surplus
Marginal
2006-07 - - - - - - - - - - -
2007-08 - - - - - - - - - - -
2008-09 - - - - - - - - - - -
Small
2006-07 - - - - - - - - - - -
2007-08 - - - - - - - - - - -
2008-09 - - - - - - - - - - -
Medium
2006-07 1.45 7400 4350 3050 5103.45 12758.62 2103.45 5258.62 1850.00 762.50 -
2007-08 - - - - - - - - - - -
2008-09 - - - - - - - - - - -
Large
2006-07 2.00 9100 5200 3900 4550.00 11375.00 1950.00 4875.00 1820.00 780.00 5400.00
2007-08 - - - - - - - - - - -
2008-09 1.00 4750 2725 2025 4750.00 11875.00 2025.00 5062.50 1900.00 810.00 -
Total
2006-07 3.45 16500 9550 6950 4782.61 11956.52 2014.49 5036.23 1833.33 772.22 5400.00
2007-08 - - - - - - - - - - -
2008-09 1.00 4750 2725 2025 4750.00 11875.00 2025.00 5062.50 1900.00 810.00 -
Note: Gross Returns = Value of Main Product (Production * Price) + Value of by-product
Net Returns = Gross Returns – Paid-out Costs
Value of Marketed Surplus = Quantity Sold * Price
Gross Returns / Hectare = Gross Returns / Area Sown under the Crop
Gross Returns / Quintal = Gross Returns / Production of the Crop

94
Despite the fact that onion crop involves high element of profit, only large
category of sampled farmers belonging to non-NFSM district of Beed allocated some
area under onion crop cultivation. The large category of sampled farmers of Beed district
generated as much as Rs.54,375 net returns from one hectare onion farm in 2007-08 and
Rs.64,063 in 2008-09, showing about 18 per cent increase in per hectare net returns from
onion crop cultivation in 2008-09 over that of 2007-08 (Table 4.24). The per quintal net
return from onion crop cultivation for the large category of farmer was estimated at
Rs.335 in 2007-08 and Rs.387 in 2008-09. The per hectare value of marketed surplus of
onion crop was significantly high and it stood at as much as Rs.97,500 in 2007-08 and
Rs.1,15,938 in 2008-09. Very high fluctuation in the prices of onion crop could be the
reason for lower allocation of area under this crop, apart from lack of irrigation facilities
in the non-NFSM district of Beed.
Table 4.24: Profitability in Onion Crop Farming: Non-NFSM Beed District (Area in Acres; Return, Value and Costs in Rupees)
Category/
Year
Area Gross
Returns
Total
Paid out
Cost
Net
Returns
Gross
Returns
per
Acre
Gross
Returns
per
Hectare
Net
Returns
per
Acre
Net
Returns
per
Hectare
Gross
Returns
Per
Quintal
Net
Returns
per
Quintal
Value of
Marketed
Surplus
Marginal
2006-07 - - - - - - - - - - -
2007-08 - - - - - - - - - - -
2008-09 - - - - - - - - - - -
Small
2006-07 - - - - - - - - - - -
2007-08 - - - - - - - - - - -
2008-09 - - - - - - - - - - -
Medium
2006-07 - - - - - - - - - - -
2007-08 - - - - - - - - - - -
2008-09 - - - - - - - - - - -
Large
2006-07 - - - - - - - - - - -
2007-08 10.00 390000 172500 217500 39000.00 97500.00 21750.00 54375.00 600.00 334.62 390000.00
2008-09 4.00 185500 83000 102500 46375.00 115937.50 25625.00 64062.50 700.00 386.79 185500.00
Total
2006-07 - - - - - - - - - - -
2007-08 10.00 390000 172500 217500 39000.00 97500.00 21750.00 54375.00 600.00 334.62 390000.00
2008-09 4.00 185500 83000 102500 46375.00 115937.50 25625.00 64062.50 700.00 386.79 185500.00
Note: Gross Returns = Value of Main Product (Production * Price) + Value of by-product
Net Returns = Gross Returns – Paid-out Costs
Value of Marketed Surplus = Quantity Sold * Price
Gross Returns / Hectare = Gross Returns / Area Sown under the Crop
Gross Returns / Quintal = Gross Returns / Production of the Crop
Another very important crop cultivated by the sampled farmers belonging to non-
NFSM district of Beed was sugarcane since all the categories of farmers allocated

95
reasonable area under sugarcane cultivation, and among various farmers large category,
in particular, devoted substantial area under sugarcane crop cultivation. Higher area
allocation under sugarcane crop cultivation was mainly due to very high element of profit
involved in its cultivation. In order to cultivate sugarcane crop, the sampled farmers
belonging to non-NFSM district of Beed mainly used open well and river lift sources of
irrigation since other sources of irrigation were not available for the sampled farmers
drawn from Beed district. However, a decline in per hectare net return from sugarcane
crop cultivation was noticed during the period between 2006-07 and 2008-09. Even per
quintal net return from sugarcane cultivation declined during this period. Although there
were large variations in terms of per hectare net returns from sugarcane crop cultivation
across various categories of farmers, the average category of sampled farmer of non-
NFSM district of Beed generated as much as Rs.39,460 per hectare net return from
sugarcane crop cultivation in 2006-07, Rs.35,752 in 2007-08 and Rs.35,134 in 2008-09,
showing about 11 per cent decline in per hectare net returns in sugarcane crop cultivation
in 2008-09 over that of 2006-07 (Table 4.25).
Table 4.25: Profitability in Sugarcane Crop Farming: Non-NFSM Beed District (Area in Acres; Return, Value and Costs in Rupees)
Category/
Year
Area Gross
Returns
Total
Paid out
Cost
Net
Returns
Gross
Returns
per
Acre
Gross
Returns
per
Hectare
Net
Returns
per
Acre
Net
Returns
per
Hectare
Gross
Returns
Per
Quintal
Net
Returns
per
Quintal
Value of
Marketed
Surplus
Marginal
2006-07 1.50 42759 24300 18459 28506.00 71265.00 12306 30765.00 95.02 41.02 40500.00
2007-08 1.50 42900 27000 15900 28600.00 71500.00 10600.00 26500.00 95.33 35.33 40500.00
2008-09 1.50 57500 35700 21800 38333.33 95833.33 14533.33 36333.33 115.00 43.60 55000.00
Small
2006-07 5.00 169000 91750 77250 33800.00 84500.00 15450.00 38625.00 99.41 45.44 161500.00
2007-08 8.00 269000 163250 105750 33625.00 84062.50 13218.75 33046.88 99.63 39.17 256500.00
2008-09 3.00 123900 78000 45900 41300.00 103250.00 15300.00 38250.00 112.64 41.73 118800.00
Medium
2006-07 3.50 122250 68250 54000 34928.57 87321.43 15428.57 38571.43 94.04 41.54 117000.00
2007-08 5.50 220200 136550 83650 40036.36 100090.91 15209.09 38022.73 100.09 38.02 211200.00
2008-09 9.50 436250 278400 157850 45921.05 114802.63 16615.79 41539.47 111.86 40.47 421200.00
Large
2006-07 65.00 2532100 1498000 1034100 38955.38 97388.46 15909.23 39773.08 97.76 39.93 2434600.00
2007-08 52.00 2092250 1339400 752850 40235.58 100588.94 14477.88 36194.71 100.83 36.28 2012750.00
2008-09 43.00 1878000 1302500 575500 43674.42 109186.05 13383.72 33459.30 112.12 34.36 1809000.00
Total
2006-07 75.00 2866109 1682300 1183809 38214.79 95536.97 15784.12 39460.30 97.65 40.33 2758900.00
2007-08 67.00 2624350 1666200 958150 39169.40 97923.51 14300.75 35751.87 100.55 36.71 2531700.00
2008-09 57.00 2495650 1694600 801050 43783.33 109458.33 14053.51 35133.77 112.16 36.00 2403000.00
Note: Gross Returns = Value of Main Product (Production * Price) + Value of by-product
Net Returns = Gross Returns – Paid-out Costs
Value of Marketed Surplus = Quantity Sold * Price
Gross Returns / Hectare = Gross Returns / Area Sown under the Crop
Gross Returns / Quintal = Gross Returns / Production of the Crop

96
As for returns per quintal, the average category of sampled farmers of Beed
district received Rs.40 as per quintal net returns from sugarcane crop cultivation in 2006-
07, Rs.37 in 2007-08, and Rs.36 in 2008-09. The per hectare value of marketed surplus of
sugarcane crop for the average category of sampled farmers of Beed district was
estimated at Rs.91,963 in 2006-07, Rs.94,466 in 2007-08 and Rs.1,05,395 in 2008-09,
recording about 15 per cent rise in per hectare value of marketed surplus of sugarcane in
2008-09 over that of 2006-07.
Another crop having very marginal presence in the cropping pattern of sampled
farmers belonging to non-NFSM district of Beed was banana, which was specifically
cultivated by medium category of sampled farmers in 2006-07 and 2007-08. The
estimated per hectare net return from banana crop cultivation for medium category of
farmer of Beed district was found to be Rs.36,250 in 2006-07 ad Rs.39,125 in 2007-08,
showing about 8 per cent rise in per hectare return from banana crop in 2007-08 over that
of 2006-07 (Table 4.26). Nevertheless, the medium category of farmers of Beed district
growing banana crop received by and large same per quintal net returns from banana crop
in 2006-07 and 2007-08, which hovered at around Rs.121.
Table 4.26: Profitability in Banana Crop Farming: Non-NFSM Beed District (Area in Acres; Return, Value and Costs in Rupees)
Category/
Year
Area Gross
Returns
Total
Paid out
Cost
Net
Returns
Gross
Returns
per
Acre
Gross
Returns
per
Hectare
Net
Returns
per
Acre
Net
Returns
per
Hectare
Gross
Returns
Per
Quintal
Net
Returns
per
Quintal
Value of
Marketed
Surplus
Marginal 2006-07 - - - - - - - - - - -
2007-08 - - - - - - - - - - -
2008-09 - - - - - - - - - - -
Small
2006-07 - - - - - - - - - - -
2007-08 - - - - - - - - - - -
2008-09 - - - - - - - - - - -
Medium
2006-07 2.50 95000 58750 36250 38000.00 95000.00 14500.00 36250.00 316.67 120.83 90000.00
2007-08 2.50 116000 76875 39125 46400.00 116000.00 15650.00 39125 362.50 122.27 112000.00
2008-09 - - - - - - - - - - -
Large
2006-07 - - - - - - - - - - -
2007-08 - - - - - - - - - - -
2008-09 - - - - - - - - - - -
Total
2006-07 2.50 95000 58750 36250 38000.00 95000.00 14500.00 36250.00 316.67 120.83 90000.00
2007-08 2.50 116000 76875 39125 46400.00 116000.00 15650.00 39125.00 362.50 122.27 112000.00
2008-09 - - - - - - - - - - -
Note: Gross Returns = Value of Main Product (Production * Price) + Value of by-product
Net Returns = Gross Returns – Paid-out Costs
Value of Marketed Surplus = Quantity Sold * Price
Gross Returns / Hectare = Gross Returns / Area Sown under the Crop
Gross Returns / Quintal = Gross Returns / Production of the Crop
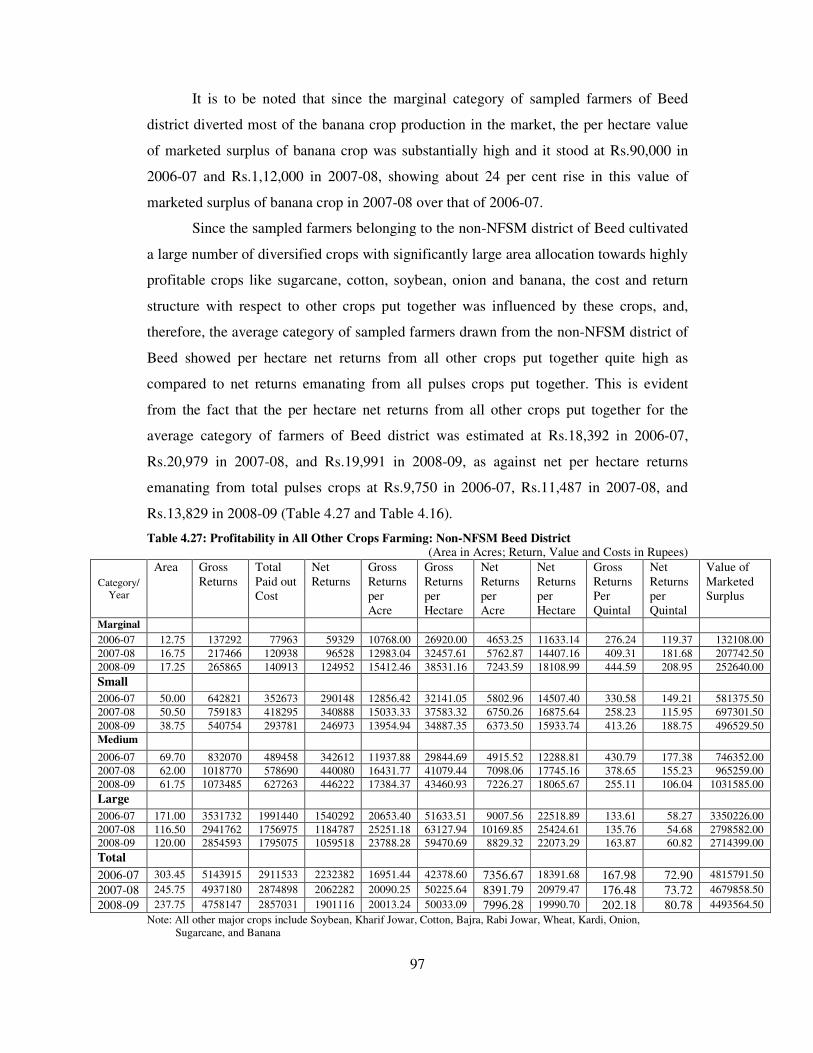
97
It is to be noted that since the marginal category of sampled farmers of Beed
district diverted most of the banana crop production in the market, the per hectare value
of marketed surplus of banana crop was substantially high and it stood at Rs.90,000 in
2006-07 and Rs.1,12,000 in 2007-08, showing about 24 per cent rise in this value of
marketed surplus of banana crop in 2007-08 over that of 2006-07.
Since the sampled farmers belonging to the non-NFSM district of Beed cultivated
a large number of diversified crops with significantly large area allocation towards highly
profitable crops like sugarcane, cotton, soybean, onion and banana, the cost and return
structure with respect to other crops put together was influenced by these crops, and,
therefore, the average category of sampled farmers drawn from the non-NFSM district of
Beed showed per hectare net returns from all other crops put together quite high as
compared to net returns emanating from all pulses crops put together. This is evident
from the fact that the per hectare net returns from all other crops put together for the
average category of farmers of Beed district was estimated at Rs.18,392 in 2006-07,
Rs.20,979 in 2007-08, and Rs.19,991 in 2008-09, as against net per hectare returns
emanating from total pulses crops at Rs.9,750 in 2006-07, Rs.11,487 in 2007-08, and
Rs.13,829 in 2008-09 (Table 4.27 and Table 4.16).
Table 4.27: Profitability in All Other Crops Farming: Non-NFSM Beed District (Area in Acres; Return, Value and Costs in Rupees)
Category/
Year
Area Gross
Returns
Total
Paid out
Cost
Net
Returns
Gross
Returns
per
Acre
Gross
Returns
per
Hectare
Net
Returns
per
Acre
Net
Returns
per
Hectare
Gross
Returns
Per
Quintal
Net
Returns
per
Quintal
Value of
Marketed
Surplus
Marginal 2006-07 12.75 137292 77963 59329 10768.00 26920.00 4653.25 11633.14 276.24 119.37 132108.00
2007-08 16.75 217466 120938 96528 12983.04 32457.61 5762.87 14407.16 409.31 181.68 207742.50
2008-09 17.25 265865 140913 124952 15412.46 38531.16 7243.59 18108.99 444.59 208.95 252640.00
Small 2006-07 50.00 642821 352673 290148 12856.42 32141.05 5802.96 14507.40 330.58 149.21 581375.50
2007-08 50.50 759183 418295 340888 15033.33 37583.32 6750.26 16875.64 258.23 115.95 697301.50
2008-09 38.75 540754 293781 246973 13954.94 34887.35 6373.50 15933.74 413.26 188.75 496529.50
Medium 2006-07 69.70 832070 489458 342612 11937.88 29844.69 4915.52 12288.81 430.79 177.38 746352.00
2007-08 62.00 1018770 578690 440080 16431.77 41079.44 7098.06 17745.16 378.65 155.23 965259.00
2008-09 61.75 1073485 627263 446222 17384.37 43460.93 7226.27 18065.67 255.11 106.04 1031585.00
Large 2006-07 171.00 3531732 1991440 1540292 20653.40 51633.51 9007.56 22518.89 133.61 58.27 3350226.00
2007-08 116.50 2941762 1756975 1184787 25251.18 63127.94 10169.85 25424.61 135.76 54.68 2798582.00
2008-09 120.00 2854593 1795075 1059518 23788.28 59470.69 8829.32 22073.29 163.87 60.82 2714399.00
Total 2006-07 303.45 5143915 2911533 2232382 16951.44 42378.60 7356.67 18391.68 167.98 72.90 4815791.50
2007-08 245.75 4937180 2874898 2062282 20090.25 50225.64 8391.79 20979.47 176.48 73.72 4679858.50
2008-09 237.75 4758147 2857031 1901116 20013.24 50033.09 7996.28 19990.70 202.18 80.78 4493564.50
Note: All other major crops include Soybean, Kharif Jowar, Cotton, Bajra, Rabi Jowar, Wheat, Kardi, Onion,
Sugarcane, and Banana
98
It could be further noted that with all the other crops put together the average
category of sampled farmers of the non-NFSM district of Beed received Rs.72.90 per
quintal net returns in 2006-07, Rs.73.72 in 2007-08, and Rs.80.78 in 2008-09, as against
per quintal net returns emanating from total pulses crops at Rs.1,243 in 2006-07,
Rs.1,364 in 2007-08, and Rs.1,603 in 2008-09. The net per quintal net returns from all
other crops turned out to be much lower as against per quintal net returns emanating from
total pulses crops mainly owing to the fact that sugarcane crop cornered significant area
allocation of sampled farmers of Beed district and the prices of sugarcane crop varied
from Rs.90-100 per quintal, which had significant bearing on per quintal net returns from
all other crops put together in the case of non-NFSM district of Beed. Generally, price of
sugarcane crop is reported on per ton basis. However, in this study, the price of sugarcane
crop is converted into per quintal basis with a view to keep uniformity since prices of
other crops are reported in per quintal basis. The lower per quintal price of or net return
from sugarcane has, therefore, greatly influenced the overall per quintal net returns from
all other crops put together.
As for all other crops put together, the per hectare value of marketed surplus for
the average category of farmers drawn from the non-NFSM district of Beed was
estimated at Rs.39,675 in 2006-07, Rs.47,608 in 2007-08, and Rs.47,251 in 2008-09,
showing about 19 per cent rise in this value in 2008-09 over that of 2006-07.
The foregoing observations further reveal that the element of profit involved in
the cultivation of all other crops put together was much higher in the non-NFSM district
of Beed as against the NFSM district of Amravati. This is concomitant from the fact that
the average category of farmers drawn from non-NFSM district of Beed generated per
hectare net returns from all other crops put together to the tune of Rs.18,392 in 2006-07,
Rs.20,979 in 2007-08, and Rs.19,991 in 2008-09 as against corresponding figures for all
other crops in NFSM district of Amravati estimated at Rs.11,017 in 2006-07, Rs.10,170
in 2007-08, and Rs.14,022 in 2008-09. In dismal contrast to this, the element of profit
involved in the cultivation of all pulses crops put together was much higher in the NFSM
district of Amravati as against the non-NFSM district of Beed since the average category
of sampled farmers belonging to NFSM district of Amravati derived per hectare net
returns from all pulses crops put together of the order of Rs.8,897 in 2006-07, Rs.11,861
in 2007-08, and Rs.17,076 in 2008-09 as against corresponding figures for all pulses
crops in non-NFSM district of Beed estimated at Rs.9,750 in 2006-07, Rs.11,487 in

99
2007-08, and Rs.13,829 in 2008-09. The comparative analysis drawn from the NFSM
district of Amravati and non-NFSM district of Beed clearly shows positive impact of
NFSM programme in raising various pulses crops since the net returns from these crops
are not only higher in NFSM district of Amravati as against non-NFSM district of Beed
but net returns from pulses have grown very sharply in 2008-09 over that of 2007-08,
especially in NFSM district of Amravati. In fact, the farmers belonging to NFSM district
of Amravati derived 44 per cent higher net returns from pulses crop cultivation in 2008-
09 over that of 2007-08 as against only 20 per cent higher net returns being generated
from pulses crop cultivation in non-NFSM district of Beed in 2008-09 over that of 2007-
08. However, the scenario with respect to all other crops was entirely different and
sampled farmers of non-NFSM district derived much higher returns from these crops as
compared to their counterpart in NFSM district of Amravati.
*********

100
CHAPTER – V
TECHNOLOGY ADOPTION, MARKETING AND OTHER ISSUES
The major focus of this chapter is on ascertaining responses of sampled farmers of
NFSM district of Amravati and non-NFSM district of Beed, especially with respect to
knowledge about improved varieties of pulses, sources of knowledge, area under
improved varieties of pulses, recommended practices followed by them in the cultivation
of pulses in terms of sowing practices, seed practices, and other practices, problems with
improved varieties of pulses, suggested solutions for improved varieties of pulses, etc.
The other aspects covered in this chapter are relating to responses of sampled farmers of
NFSM district of Amravati and non-NFSM district of Beed in terms of channels of
marketing of pulses crops followed by them, quantity of various pulses crops sold
through various channels, extent of government procurement of pulses crops, etc. The
major thrust of this chapter is, therefore, on assessing the extent of involvement of the
sampled farmers drawn from the NFSM district of Amravati and non-NFSM district of
Beed in terms of adoption of improved technology for pulses crops and marketing of
these crops through various channels, apart from assessing the extent of government
procurement with respect to pulses crops.
5.1 Area Under Improved Varieties of Pulses in NFSM and Non-NFSM Districts
The responses of the sampled farmers drawn from the NFSM district of Amravati
and non-NFSM district of Beed with respect to area allocation under improved as well as
traditional varieties of pulses are brought out in Table 5.1 and Table 5.2.
In the NFSM district of Amravati, about 78 per cent of total sampled households
were reported to have area under improved varieties of mung crop. The proportion of
sampled households reporting area under improved varieties of mung crop increased with
the increase in land holding size of farmers. Similarly, about 74 per cent of the total
sampled households of Amravati district had reported area under improved varieties of
gram crop with rise in this proportion with the increase in land holding size of farmers.
As for tur crop, about 30 per cent of total sampled households of Amravati district had
reported area under improved varieties with medium and small category of farmers
showing higher proportions in this respect as against marginal and large category of
farmers (Table 5.1).

101
Table 5.1: Households Reporting Area Under Improved Varieties of Pulses: NFSM Amravati District
Pulse Crop No. of Households Reporting
Area Under Improved Varieties
Total No. of Households
in the Size Group
% of Households
Reporting
Mung
Marginal 11 15 73.33
Small 13 19 68.42
Medium 9 10 90.00
Large 6 6 100.00
All 39 50 78.00
Gram
Marginal 10 15 66.67
Small 13 19 68.42
Medium 8 10 80.00
Large 6 6 100.00
All 37 50 74.00
Tur
Marginal 2 15 13.33
Small 7 19 36.84
Medium 4 10 40.00
Large 2 6 33.33
All 15 50 30.00
The NFSM district of Amravati further showed that the area under improved
varieties as proportion to net sown area of mung crop was 100 per cent for marginal
category, 84 per cent for small, 91 per cent for medium and 100 per cent for large
category with an overall average of 94 per cent for the average category of sampled
farmers, whereas these proportions for gram crop stood at 100 per cent, 100 per cent, 85
per cent, 100 per cent, and 96 per cent, respectively (Table 5.1 (a)).
Table 5.1 (a): Area under Improved Varieties of Pulses: NFSM Amravati District – for 2008-09 (Area in Acre)
Pulse Crop Total Area
under the Crop
Area under
Traditional Varieties
Area Under
Improved Varieties
% of Area Under
Improved Varieties
Mung
Marginal 21.05 - 21.05 100.00
Small 36.86 6.00 30.86 83.72
Medium 39.75 3.75 36.00 90.57
Large 58.00 - 58.00 100.00
All 155.66 9.75 145.90 93.73
Gram
Marginal 20.05 - 20.05 100.00
Small 37.86 - 37.86 100.00
Medium 41.00 6 35.00 85.37
Large 62.00 - 62.00 100.00
All 160.91 6.00 154.91 96.27
Tur
Marginal 1.00 - 1.00 100.00
Small 5.95 2.00 3.95 66.39
Medium 4.50 1.25 3.25 72.22
Large 2.00 - 2.00 100.00
All 13.45 3.25 10.20 75.84

102
The proportion of area under improved varieties to net sown area with respect to
tur crop in Amravati district was worked out at 100 per cent for marginal category, 66 per
cent for small, 72 per cent for medium and 100 per cent for large category with an overall
average of 76 per cent for the average category of farmer drawn from the NSFM district
of Amravati. Thus, among various pulse crops, gram and mung showed higher proportion
of net sown area under improved varieties.
As for pulses crops, in the non-NFSM district of Beed, the proportion of
households to total sampled households reporting area under improved varieties was 30
per cent in the case of mung crop, 60 per cent for gram and 66 per cent for tur crop
(Table 5.2). There was a rising trend in the proportion of households to total sampled
households showing area under improved varieties of pulses with the rise in land holding
size of sampled households belonging to the non-NFSM district of Beed.
Table 5.2: Households Reporting Area Under Improved Varieties of Pulses: Non--NFSM Beed District
Pulse Crop No. of Households Reporting
Area Under Improved Varieties
Total No. of Households
in the Size Group
% of Households
Reporting
Mung
Marginal 2 14 14.29
Small 8 17 47.06
Medium 3 13 23.08
Large 2 6 33.33
All 15 50 30.00
Gram
Marginal 3 14 21.43
Small 13 17 76.47
Medium 8 13 61.54
Large 6 6 100.00
All 30 50 60.00
Tur
Marginal 9 14 64.29
Small 11 17 64.71
Medium 8 13 61.54
Large 5 6 83.33
All 33 50 66.00
In the non-NFSM district of Beed, the proportion of area under improved varieties
to net sown area of mung crop was 100 per cent for marginal category, 79 per cent for
small, 100 per cent for medium and 85 per cent for large category with an overall average
of 87 per cent for the average category of farmer drawn from the non-NSFM district of
Beed (Table 5.2 (a)). Interestingly, all sampled farmers of non-NFSM district of Beed
showed their entire net sown area of gram crop under improved varieties. However, in the
case of gram crop cultivated in non-NFSM district of Beed, the proportion of area under

103
improved varieties to net sown area was 57 per cent for marginal category, 40 per cent
for small, 100 per cent for medium and 100 per cent for large category with an overall
average of 81 per cent for the average category of farmers.
Table 5.2 (a): Area under Improved Varieties of Pulses: Noon-NFSM Beed District – for 2008-09
(Area in Acre)
Pulse Crop Total Area
under the Crop
Area under
Traditional Varieties
Area Under
Improved Varieties
% of Area Under
Improved Varieties
Mung
Marginal 2.00 - 2.00 100.00
Small 23.00 4.75 18.25 79.35
Medium 12.00 - 12.00 100.00
Large 1300 2.00 11.00 84.62
All 50.00 6.75 43.25 86.50
Gram
Marginal 3.00 - 3.00 100.00 Small 25.60 - 25.60 100.00 Medium 15.70 - 15.70 100.00 Large 46.00 - 46.00 100.00 All 90.30 - 90.30 100.00 Tur
Marginal 7.02 3.00 4.02 57.26
Small 9.25 5.50 3.75 40.54
Medium 12.25 - 12.25 100.00
Large 15.75 - 15.75 100.00
All 44.27 8.50 35.77 80.80
Thus, among various pulse crops cultivated in the non-NFSM district of Beed,
while gram crop showed 100 per cent of the net sown area under improved varieties, this
proportion stood at 87 per cent for mung crop and 81 per cent for tur crop.
In general, the sampled farmers of NFSM district of Amravati showed higher
proportion of net shown area of mung crop under improved varieties as compared to the
sampled farmers belonging to non-NFSM district of Beed. Contrary to this, the sampled
farmers of non-NFSM district of Beed showed higher proportion on net sown area of
gram crop and tur crop under improved varieties as against the sampled farmers drawn
from the NFSM district of Amravati.
5.2 Knowledge of Improved Varieties in NFSM and Non-NFSM Districts
The responses with respect to knowledge of improved varieties of pulses and
sources of knowledge were recorded for all the categories of sampled farmers belonging
to NFSM district of Amravati and non-NFSM district of Beed, and these responses have
been brought out in Table 5.3 and 5.4.
In the NFSM district of Amravati, the proportion of farmers to the total number of
sampled farmers showing knowledge about improved varieties of pulses were 80 per cent

104
in marginal category, 84 per cent in small, 90 per cent in medium and 83 per cent in large
category with an overall average of 84 per cent for the average category of farmer
belonging to this district (Table 5.3).
Table 5.3: Knowledge of Improved Varieties of Pulses: NFSM Amravati District
Category No. of Farmers Aware
of Improved Varieties
Total No. of Farmers in
the Size group
% of Farmers Aware of
Improved Varieties
Marginal 12 15 80.00
Small 16 19 84.21
Medium 9 10 90.00
Large 5 6 83.33
Total 42 50 84.00
The farmers belonging to NFSM district of Amravati mainly acquired knowledge
about improved varieties of pulses from extension agents, neighbours and also some
other sources like relatives and distant friends, newspaper, etc. As for the sources of
knowledge, about 50 per cent of sampled households of NFSM district of Amravati
received knowledge about improved varieties of pulses from extension agents, 43 per
cent from neighbours, 5 per cent from relatives, friends, etc. and 2 per cent from
newspaper/media (Table 5.3 (a) and Table 5.3 (b)). The proportion of farmers to the total
number of sampled farmers (only reported cases) receiving knowledge about improved
varieties of pulses from extension agent increased with the increase in land holding size
of sampled farmers of NFSM district of Amravati.
Table 5.3 (a): Source of Knowledge of Improved Varieties of Pulses: NFSM Amravati District
Category Extension Agent Neighbours Newspaper /Media Others Total
Marginal 5 5 1 1 12
Small 9 7 - - 16
Medium 4 4 - 1 9
Large 3 2 - - 5
Total 21 18 1 2 42
Table 5.3 (b): % Distribution of Source of Knowledge of Improved Varieties: NFSM Amravati District
Category Extension Agent Neighbours Newspaper /Media Others Total
Marginal 41.67 41.67 8.33 8.33 100.00
Small 56.25 43.75 - - 100.00
Medium 44.44 44.44 - 11.11 100.00
Large 60.00 40.00 - - 100.00
Total 50.00 42.86 2.38 4.76 100.00
As for non-NFSM district of Beed, the proportion of farmers to the total number
of sampled farmers showing knowledge about improved varieties of pulses were 64 per
cent in marginal category, 100 per cent in small, 54 per cent in medium and 100 per cent
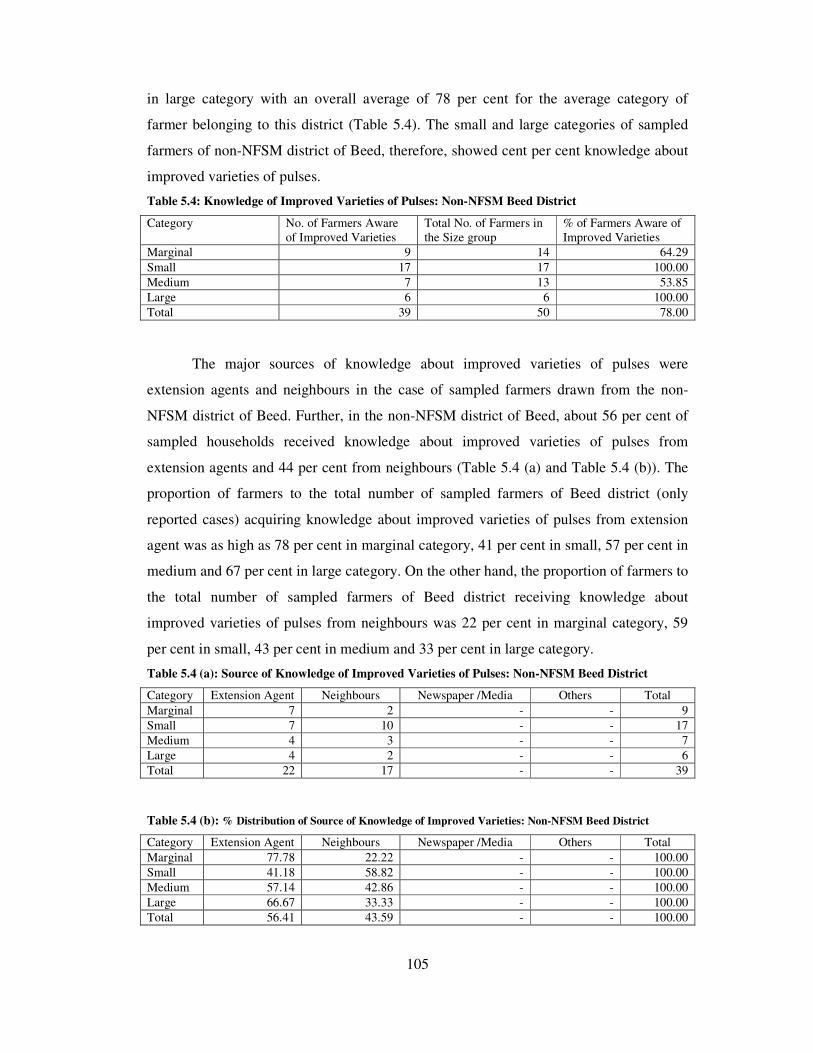
105
in large category with an overall average of 78 per cent for the average category of
farmer belonging to this district (Table 5.4). The small and large categories of sampled
farmers of non-NFSM district of Beed, therefore, showed cent per cent knowledge about
improved varieties of pulses.
Table 5.4: Knowledge of Improved Varieties of Pulses: Non-NFSM Beed District
Category No. of Farmers Aware
of Improved Varieties
Total No. of Farmers in
the Size group
% of Farmers Aware of
Improved Varieties
Marginal 9 14 64.29
Small 17 17 100.00
Medium 7 13 53.85
Large 6 6 100.00
Total 39 50 78.00
The major sources of knowledge about improved varieties of pulses were
extension agents and neighbours in the case of sampled farmers drawn from the non-
NFSM district of Beed. Further, in the non-NFSM district of Beed, about 56 per cent of
sampled households received knowledge about improved varieties of pulses from
extension agents and 44 per cent from neighbours (Table 5.4 (a) and Table 5.4 (b)). The
proportion of farmers to the total number of sampled farmers of Beed district (only
reported cases) acquiring knowledge about improved varieties of pulses from extension
agent was as high as 78 per cent in marginal category, 41 per cent in small, 57 per cent in
medium and 67 per cent in large category. On the other hand, the proportion of farmers to
the total number of sampled farmers of Beed district receiving knowledge about
improved varieties of pulses from neighbours was 22 per cent in marginal category, 59
per cent in small, 43 per cent in medium and 33 per cent in large category.
Table 5.4 (a): Source of Knowledge of Improved Varieties of Pulses: Non-NFSM Beed District
Category Extension Agent Neighbours Newspaper /Media Others Total
Marginal 7 2 - - 9
Small 7 10 - - 17
Medium 4 3 - - 7
Large 4 2 - - 6
Total 22 17 - - 39
Table 5.4 (b): % Distribution of Source of Knowledge of Improved Varieties: Non-NFSM Beed District
Category Extension Agent Neighbours Newspaper /Media Others Total
Marginal 77.78 22.22 - - 100.00
Small 41.18 58.82 - - 100.00
Medium 57.14 42.86 - - 100.00
Large 66.67 33.33 - - 100.00
Total 56.41 43.59 - - 100.00

106
A comparative analysis revealed that about 84 per net of the total number of
sampled farmers of NFSM district of Amravati and 78 per cent of the non-NFSM district
of Beed had acquired knowledge about improved varieties of pulses. Extension agents
and neighbours were the major sources of knowledge about improved varieties of pulses
in the case of both NFSM district of Amravati and non-NFSM district of Beed. In the
case of NFSM district of Amravati, 50 per cent of the sampled farmers received
knowledge about improved varieties of pulses from extension agents, 43 per cent from
neighbours, and remaining 7 per cent from other sources like friend, relatives, media, etc.
As for non-NFSM district of Beed, 56 per cent of the total sampled farmers acquired
knowledge about improved varieties of pulses from extension agents and 44 per cent
from neighbours, showing higher proportion in this respect from extension agents.
5.3 Recommended Practices in NFSM and Non-NFSM Districts
Although there are some standard package of practices with respect to various
crops, farmers in most cases do not follow these practices either due to their ignorance
about these practices or due to some other handicaps like variations in soil type,
availability of irrigation facilities, topography, agro-climatic differences, etc. As a result,
the productivity of crops remains subdued and also returns from the crop. In order to
evaluate the extent of technology adoption by the sampled farmers belonging to NFSM
district of Amravati and non-NFSM district of Beed, their responses were recorded,
especially with respect to sowing practices like time of sowing, no. of tillage, etc., seed
practices like seed treatment, seed rate, line/broadcasting, insertion of seed at appropriate
depth, etc., and other practices like application of organic manure, chemical fertilizer, no.
of weeding and interculture, no. of irrigation, application of plant protection measures,
etc. The responses of the sampled farmers of NFSM district of Amravati and non-NFSM
district of Beed with respect to sowing, seed and other practices followed by them in the
cultivation of various pulses crops are presented in Table 5.5 and 5.6.
Majority of the sampled farmers drawn from the NFSM district of Amravati were
found to follow recommended sowing, seed and other practices, especially in the
cultivation of pulses crops like mung and gram but not tur crop. In the cultivation of
mung crop, 74 per cent of the total number of sampled farmers belonging to the NFSM
district of Amravati were noticed to follow recommended sowing practices, 68 per cent
followed recommended seed practices and 46-70 per cent followed recommended other
practices like application of organic manure, use of chemical fertilizer, application of

107
plant protection measures, etc. (Table 5.5 and Table 5.5 (a)). Similarly, in the cultivation
of gram crop, 70 per cent of the sampled farmers drawn from the NFSM district of
Amravati were found to follow recommended sowing practices, 56 per cent followed
recommended seed practices and 26-70 per cent followed recommended other practices
like application of organic manure, chemical fertilizer, plant protection measures, etc.
Table 5.5: Recommended Practices in Pulses Crops: NFSM Amravati District
Followed Some Practice
Other Practices Category Sowing
Practices Seed Practices Organic
Manure
Chemical
Fertilizer
Plant
Protection
Not Followed
Any Practice
Mung
Marginal 12 13 10 14 11 1
Small 12 11 9 9 6 7
Medium 8 6 2 7 4 2
Large 5 4 2 5 3 1
Total 37 34 23 35 24 11
Gram
Marginal 11 11 3 12 9 3
Small 11 11 5 12 7 7
Medium 8 4 3 7 4 2
Large 5 2 2 4 3 1
Total 35 28 13 35 23 13
Tur
Marginal 3 3 1 3 3 12
Small 5 6 3 5 5 13
Medium 3 3 1 3 2 7
Large 2 1 1 3 1 3
Total 13 13 6 14 11 35
Table 5.5 (a): % of Households Following Recommended Practices: NFSM Amravati District (in Per cent)
Followed Some Practice
Other Practices Category Sowing
Practices Seed Practices Organic
Manure
Chemical
Fertilizer
Plant
Protection
Not Followed
Any Practice
Mung
Marginal 80.00 86.67 66.67 93.33 73.33 6.67
Small 63.16 57.89 47.37 47.37 31.58 36.84
Medium 80.00 60.00 20.00 70.00 40.00 20.00
Large 83.33 66.67 33.33 83.33 50.00 16.67
Total 74.00 68.00 46.00 70.00 48.00 22.00
Gram
Marginal 73.33 73.33 20.00 80.00 60.00 20.00
Small 57.89 57.89 26.32 63.16 36.84 36.84
Medium 80.00 40.00 30.00 70.00 40.00 20.00
Large 83.33 33.33 33.33 66.67 50.00 16.67
Total 70.00 56.00 26.00 70.00 46.00 26.00
Tur
Marginal 20.00 20.00 6.67 20.00 20.00 80.00
Small 26.32 31.58 15.79 26.32 26.32 68.42
Medium 30.00 30.00 10.00 30.00 20.00 70.00
Large 33.33 16.67 16.67 50.00 16.67 50.00
Total 26.00 26.00 12.00 28.00 22.00 70.00

108
In contrast to mung and gram crops, the extent of recommended practices
followed in the cultivation of tur crop was very less as only 26 per cent of the total
number of sampled farmers drawn from the NFSM district of Amravati followed
recommended sowing practices and seed practices and 12-28 per cent followed
recommended other practices like application of organic manure, chemical fertilizer,
plant protection measures, etc. In the NFSM district of Amravati, while about 22 per cent
of the total sampled farmers did not follow any recommended practices in the cultivation
of mung, this proportion with respect gram crop was 26 per cent, and for tur crop it stood
at as high as 70 per cent. In fact, in the case of tur crop, the proportion of total sampled
farmers not following any recommended practice declined with the increase in land
holding size of sampled farmers belonging to the NFSM district of Amravati.
In terms of adoption of technology, the scenario obtaining in the non-NFSM
district of Beed was different as against the scenario obtaining in NFSM district of
Amravati. In the cultivation of mung crop, while 68 per cent of the sampled farmers
belonging to non-NFSM district of Beed did not follow any recommended practices, the
remaining 32 per cent of the total sampled households of this district followed one or the
other recommended practices (Table 5.6 and Table 5.6 (a)). This is concomitant from the
fact that, in the cultivation of mung crop, the recommended sowing practices were
followed by 32 per cent of the total sampled households of non-NFSM Beed district,
recommended seed practices by 26 per cent of households, and recommended other
practices by 18-30 per cent of sampled households. Small and large categories of sampled
households belonging to non-NFSM district of Beed were more positively inclined
towards adoption of recommended practices with respect to mung crop cultivation.
As for gram crop cultivation, about 60 per cent of the total number of sampled
farmers drawn from the non-NFSM district of Beed followed recommended sowing
practices, 52 per cent followed recommended seed practices and 26-70 per cent followed
recommended other practices like application of organic manure, chemical fertilizer,
plant protection measures, etc., and 40 per cent did not follow any recommended
practices. Interestingly, in the non-NFSM district of Beed, all the large category of
sampled farmers followed recommended sowing and seed practices.
In the case of tur crop cultivation, about 64 per cent of the total number of
sampled farmers of non-NFSM district of Beed followed recommended sowing practices,
60 per cent followed recommended seed practices and 34-58 per cent followed

109
recommended other practices like application of organic manure, chemical fertilizer,
plant protection measures, etc., and 36 per cent did not follow any recommended
practices (Table 5.6 and Table 5.6 (a)).. Further, like gram crop, the adoption of
technology in the case of tur crop cultivation was quite high among large category of
sampled farmers of non-NFSM district of Beed since all the sampled large farmers of this
district followed recommended sowing and seed practices, and also recommended uses of
chemical fertilizer as the response in these respect was cent per cent for large category.
Table 5.6: Recommended Practices in Pulses Crop: Non-NFSM Beed District
Followed Some Practice
Other Practices Category
Sowing Practices Seed Practices Organic
Manure
Chemical
Fertilizer
Plant
Protection
Not Followed
Any Practice
Mung
Marginal 2 2 1 1 1 12
Small 9 6 8 9 3 8
Medium 2 2 2 2 2 11
Large 3 3 3 3 3 3
Total 16 13 14 15 9 34
Gram
Marginal 4 4 1 4 - 10
Small 13 9 8 12 3 4
Medium 7 7 2 6 5 6
Large 6 6 - 5 4 -
Total 30 26 11 27 12 20
Tur
Marginal 8 8 3 6 4 6
Small 12 10 10 11 4 5
Medium 6 6 5 6 5 7
Large 6 6 4 6 4 -
Total 32 30 22 29 17 18
Table 5.6 (a): % of Households Following Recommended Practices: Non-NFSM Beed District (in Per cent)
Followed Some Practice
Other Practices Category
Sowing Practices Seed Practices Organic
Manure
Chemical
Fertilizer
Plant
Protection
Not Followed
Any Practice
Mung
Marginal 14.29 14.29 7.14 7.14 7.14 85.71
Small 52.94 35.29 47.06 52.94 17.65 47.06
Medium 15.38 15.38 15.38 15.38 15.38 84.62
Large 50.00 50.00 50.00 50.00 50.00 50.00
Total 32.00 26.00 28.00 30.00 18.00 68.00
Gram
Marginal 28.57 28.57 7.14 28.57 0.00 71.43
Small 76.47 52.94 47.06 70.59 17.65 23.53
Medium 53.85 53.85 15.38 46.15 38.46 46.15
Large 100.00 100.00 - 83.33 66.67 -
Total 60.00 52.00 22.00 54.00 24.00 40.00
Tur
Marginal 57.14 57.14 21.43 42.86 28.57 42.86
Small 70.59 58.82 58.82 64.71 23.53 29.41
Medium 46.15 46.15 38.46 46.15 38.46 53.85
Large 100.00 100.00 66.67 100.00 66.67 -
Total 64.00 60.00 44.00 58.00 34.00 36.00

110
In terms of technology adoption with respect to pulses crops, two differing view
emerged in the NFSM district of Amravati and non-NFSM district of Beed. While
majority of the sampled farmers belonging to the NFSM district of Amravati followed
recommended sowing, seed and other practices in the cultivation of mung and gram crop,
this was not the case in the cultivation of tur crop by them as most of the sampled farmers
of the NFSM district of Amravati neither followed any of the recommended sowing
practices nor recommended seed and other practices like application of organic manure
and chemical fertilizer, etc. It was only in the case of large farmers that recommended
practices in terms of use of chemical fertilizer was followed on reasonably higher scale.
On the other hand, in the case of non-NFSM district of Beed, though majority of the
sampled farmers did not follow any recommended practices in the case of mung crop
cultivation, the cultivation of other pulses crops like gram and tur was followed as per the
recommended practices since 60 per cent of the sampled households of non-NFSM
district of Beed favoured their view in terms of following recommended practices in the
cultivation of gram crop and 64 per cent in the cultivation of tur crop.
5.4 Problems with Improved Varieties of Pulses in NFSM and Non-NFSM Districts
Although improved varieties of pulses are favoured by the farmers due to their
higher levels of yield, there are number of problems in the cultivation of these high
yielding pulses crops. Various categories of farmers encounter with different kinds of
problems in the cultivation of improved varieties of pulses. The responses of the sampled
farmers belonging to the NFSM district of Amravati and non-NFSM district of Beed
were also recorded in terms of various problems faced by them in the cultivation various
pulses crops and these problems were then ranked from 1 to 6. The reported responses
with respect to major problems faced by the sampled farmers of NFSM district of
Amravati and non-NFSM district of Beed in the cultivation various pulses crops and their
ranking in this respect are brought out in Table 5.7 and Table 5.8 with all the categories
of sampled farmers put together. The household category-wise and crop-wise reported
responses in terms of problems faced by sampled farmers of NFSM district of Amravati
and non-NFSM district of Beed and their ranking are provided in Appendix from 3 to 8.
In the cultivation of improved varieties of pulses crops, the major problems
encountered by the sampled farmers of NFSM district of Amravati and non-NFSM
district of Beed were: (a) non availability of improved varieties, (b) availability of
improved varieties but not on time, (c) higher expenses involved in improved varieties,

111
(d) improved varieties requiring larger doses of other inputs, (e) much lower yield than
expected, and (f) inadequacy of pest resistance measures towards cultivation of improved
varieties of pulses crop. The sampled farmers of NFSM district of Amravati and non-
NFSM district of Beed aired varying opinion about these six major problems faced by
them in the cultivation of improved varieties of pulses crops.
In the cultivation of mung crop in the NFSM district of Amravati, non availability
of improved varieties was one of the major problems and this problem was ranked 1 by
19 per cent of the total sampled households, ranked 2 by 11 per cent households, ranked 3
by 26 per cent households, ranked 4 by 15 per cent households, ranked 5 by 19 per cent
households, and ranked 6 by 11 per cent households (Table 5.7 and Table 5.7 (a)).
Untimely availability of improved variety of mung crop was another problem faced by
the farmers and 21 per cent of the total sampled households ranked this problem as no. 1,
11 per cent as no. 2, 14 per cent as no.3, 32 per cent as no. 4, 14 per cent as no. 5, and 7
per cent as no. 6. Expensive nature of improved variety of mung crop was the thirds
problem and it was ranked 1 and 2 by 34 per cent of sampled households, ranked 3 by 13
per cent households and ranked 4 by 16 per cent households. The improved variety of
mung crop requiring large doses of other inputs was the fourth problem faced by the
sampled households of NFSM district of Amravati and this problem was ranked 1 by 32
per cent of households, ranked 2 by 26 per cent households, and ranked 5 by 29 per cent
households. Much lower yield than expected was the fifth major problem faced by the
sampled cultivators of mung crop drawn from the NFSM district of Amravati and this
problem acquired 2nd
ranking by 25 per cent households, 3rd
ranking by 31 per cent
households and 5th
ranking by 19 per cent households. Inadequacy of pest resistance
measures towards cultivation of improved varieties of mung crop was the sixth problem
faced by the cultivators of this crop belonging to the NFSM district of Amravati and this
problem acquired 6th
ranking by 50 per cent households, and 1st and 4
th ranking by 14 per
cent households of Amravati district.
As for the cultivation of improved varieties of gram crap in the NFSM district of
Amravati, the problem of non-availability of improved varieties was assigned 3rd
ranking
by 26 per cent of total sampled households, 4th
ranking by 30 per cent households and 5th
ranking by 22 per cent households. The problem relating to untimely availability
improved varieties of gram crop was assigned 2nd
ranking by 22 per cent households, 4th
ranking by 29 per cent households and 5th
ranking by 18 per cent households.
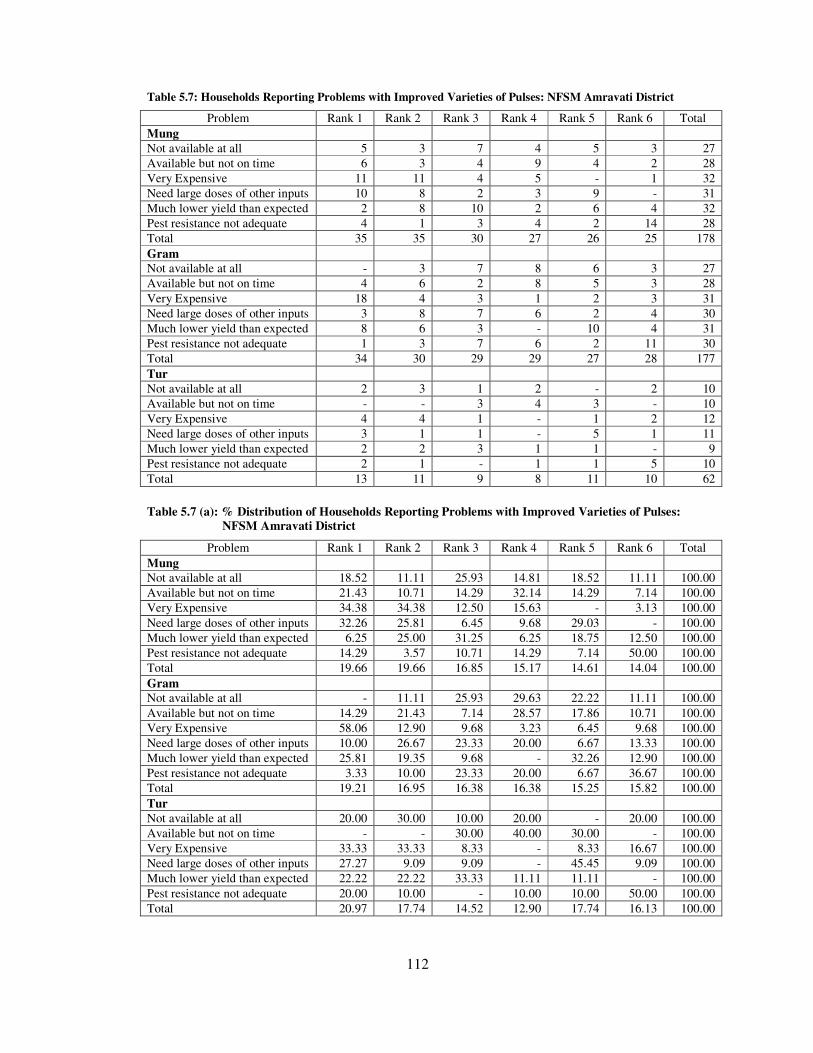
112
Table 5.7: Households Reporting Problems with Improved Varieties of Pulses: NFSM Amravati District
Problem Rank 1 Rank 2 Rank 3 Rank 4 Rank 5 Rank 6 Total
Mung
Not available at all 5 3 7 4 5 3 27
Available but not on time 6 3 4 9 4 2 28
Very Expensive 11 11 4 5 - 1 32
Need large doses of other inputs 10 8 2 3 9 - 31
Much lower yield than expected 2 8 10 2 6 4 32
Pest resistance not adequate 4 1 3 4 2 14 28
Total 35 35 30 27 26 25 178
Gram
Not available at all - 3 7 8 6 3 27
Available but not on time 4 6 2 8 5 3 28
Very Expensive 18 4 3 1 2 3 31
Need large doses of other inputs 3 8 7 6 2 4 30
Much lower yield than expected 8 6 3 - 10 4 31
Pest resistance not adequate 1 3 7 6 2 11 30
Total 34 30 29 29 27 28 177
Tur
Not available at all 2 3 1 2 - 2 10
Available but not on time - - 3 4 3 - 10
Very Expensive 4 4 1 - 1 2 12
Need large doses of other inputs 3 1 1 - 5 1 11
Much lower yield than expected 2 2 3 1 1 - 9
Pest resistance not adequate 2 1 - 1 1 5 10
Total 13 11 9 8 11 10 62
Table 5.7 (a): % Distribution of Households Reporting Problems with Improved Varieties of Pulses:
NFSM Amravati District
Problem Rank 1 Rank 2 Rank 3 Rank 4 Rank 5 Rank 6 Total
Mung
Not available at all 18.52 11.11 25.93 14.81 18.52 11.11 100.00
Available but not on time 21.43 10.71 14.29 32.14 14.29 7.14 100.00
Very Expensive 34.38 34.38 12.50 15.63 - 3.13 100.00
Need large doses of other inputs 32.26 25.81 6.45 9.68 29.03 - 100.00
Much lower yield than expected 6.25 25.00 31.25 6.25 18.75 12.50 100.00
Pest resistance not adequate 14.29 3.57 10.71 14.29 7.14 50.00 100.00
Total 19.66 19.66 16.85 15.17 14.61 14.04 100.00
Gram
Not available at all - 11.11 25.93 29.63 22.22 11.11 100.00
Available but not on time 14.29 21.43 7.14 28.57 17.86 10.71 100.00
Very Expensive 58.06 12.90 9.68 3.23 6.45 9.68 100.00
Need large doses of other inputs 10.00 26.67 23.33 20.00 6.67 13.33 100.00
Much lower yield than expected 25.81 19.35 9.68 - 32.26 12.90 100.00
Pest resistance not adequate 3.33 10.00 23.33 20.00 6.67 36.67 100.00
Total 19.21 16.95 16.38 16.38 15.25 15.82 100.00
Tur
Not available at all 20.00 30.00 10.00 20.00 - 20.00 100.00
Available but not on time - - 30.00 40.00 30.00 - 100.00
Very Expensive 33.33 33.33 8.33 - 8.33 16.67 100.00
Need large doses of other inputs 27.27 9.09 9.09 - 45.45 9.09 100.00
Much lower yield than expected 22.22 22.22 33.33 11.11 11.11 - 100.00
Pest resistance not adequate 20.00 10.00 - 10.00 10.00 50.00 100.00
Total 20.97 17.74 14.52 12.90 17.74 16.13 100.00

113
The problem of expensive nature of improved varieties of gram crop was assigned
1st ranking by 58 per cent of the sampled households belonging to NFSM district of
Amravati, 2nd
ranking by 12 per cent households and 3rd
ranking by 10 per cent
households. Improved varieties of gram crop requiring large doses of other inputs was the
fourth problem, which was assigned 1st ranking by 10 per cent households, 2
nd ranking by
27 per cent households, 3rd
ranking by 23 per cent households and 4th
ranking by 20 per
cent households. The fifth problem relating to lower yields from improved varieties of
gram crop was assigned 1st ranking by 26 per cent households, 2
nd ranking by 19 per cent
households, and 5th
ranking by 32 per cent households of NFSM district of Amravati. The
sixth problem relating to inadequacy of pest resistance with respect to gram crop was
assigned 1st ranking only by 3 per cent of sampled households, 2
nd ranking by 10 per cent
of households, 3rd
ranking by 23 per cent households, 4th
ranking by 20 per cent
households, 5th
ranking by 7 per cent households and 6th
ranking by 37 per cent of
sampled households of Amravati district.
In the case of improved varieties of tur crop cultivation on the farms of sampled
households of NFSM district of Amravati, the non availability of improved variety was
assigned 1st ranking by 20 per cent households, 2
nd ranking by 30 per cent households, 4
th
ranking by 20 per cent households and 6th
ranking by another 20 per cent households.
The second problem relating to untimely availability of improved variety of tur crop was
accorded 3rd
ranking by 30 per cent households, 4th
ranking by 40 per cent households,
and 5th
ranking by remaining 30 per cent households belonging to the NFSM district of
Amravati. Very expensive nature of improved variety of tur crop was found to be another
major problem and it was assigned 1st ranking by 33 per cent households, 2
nd ranking by
another 33 per cent households, and 6th
ranking by 17 per cent households. Improved
varieties requiring large doses of other inputs was the fourth major problem in the
cultivation of tur crop on the farms of sampled households of NFSM district of Amravati
and this problem was assigned 1st ranking by 27 per cent households and 5
th ranking by
45 per cent households. Much lower yield than expected was the fifth problem in the
cultivation of tur crop and it was assigned 1st ranking by 22 per cent households, 2
nd
ranking by another 22 per cent households, and 3rd
ranking by 33 per cent households.
The sixth problem relating to inadequacy of pest resistance with respect to tur crop was
assigned 1st ranking by 20 per cent households and 6
th ranking by 50 per cent sampled
households belonging to the NFSM district of Amravati.

114
Insofar as non-NFSM district of Beed is concerned, the problem relating to non
availability of improved varieties of mung crop was assigned much lower ranking as this
problem was assigned 4th
ranking by 27 per cent households, 5th
ranking by another 27
per cent households, and 6th
ranking by another 27 per cent households. The second
problem relating to untimely availability of improved variety also received lower ranking
as this problem was ranked 3rd
by 27 per cent households and ranked 4th
by 36 per cent
households. Very expensive nature of improved varieties of mung crop was the third
problem and it was assigned 2nd
ranking by 18 per cent households, 3rd
ranking by 27 per
cent households and 5th
ranking by another 27 per cent households. Improved varieties of
mung crop requiring large doses of other inputs was identified as the major problem and
it was assigned 1st ranking by 36 per cent households and 2
nd ranking by 27 per cent
households (Table 5.8 and Table 5.8 (a)). Lower availability of yield with respect to
improved varieties of mung crop was identified as the fifth problem and it was assigned
2nd
ranking 27 per cent households and 4th
ranking by another 27 per cent households.
In the cultivation of improved varieties of gram crop on the farms belonging to
the households of non-NFSM district of Beed, the problem relating to non availability of
improved varieties was assigned 1st ranking by 14 per cent households, 2
nd ranking by 24
per cent households, and 5th
ranking by 33 per cent households. The second problem
relating to untimely availability of improved variety was accorded 1st ranking by 29 per
cent households and 3rd
ranking by another 29 per cent households. Very expensive
nature of improved variety was the 3rd
problem that was assigned 1st ranking by 24 per
cent households, 2nd
ranking by 33 per cent households and 3rd
ranking by 19 per cent
households. The problem relating to improved variety of gram crop requiring large doses
of other inputs received much lower ranking as it received 4th
ranking by 52 per cent
households and 5th
ranking by 19 per cent households. The fifth problem relating to lower
yield of improved variety was assigned 1st ranking by 29 per cent households, 3
rd ranking
by another 29 per cent households, and 5th
ranking by another 29 per cent households.
As for the cultivation of improved varieties of tur crop on the farms belonging to
the households of non-NFSM district of Beed, the problem relating non availability of
improved varieties was assigned 1st ranking by 21 per cent households, 3
rd ranking by 28
per cent households, and 4th
ranking by 24 per cent households. The problem of untimely
availability of improved variety was accorded 1st ranking by 24 per cent households, 2
nd
ranking by 21 per cent households and 5th
ranking by another 21 per cent households.
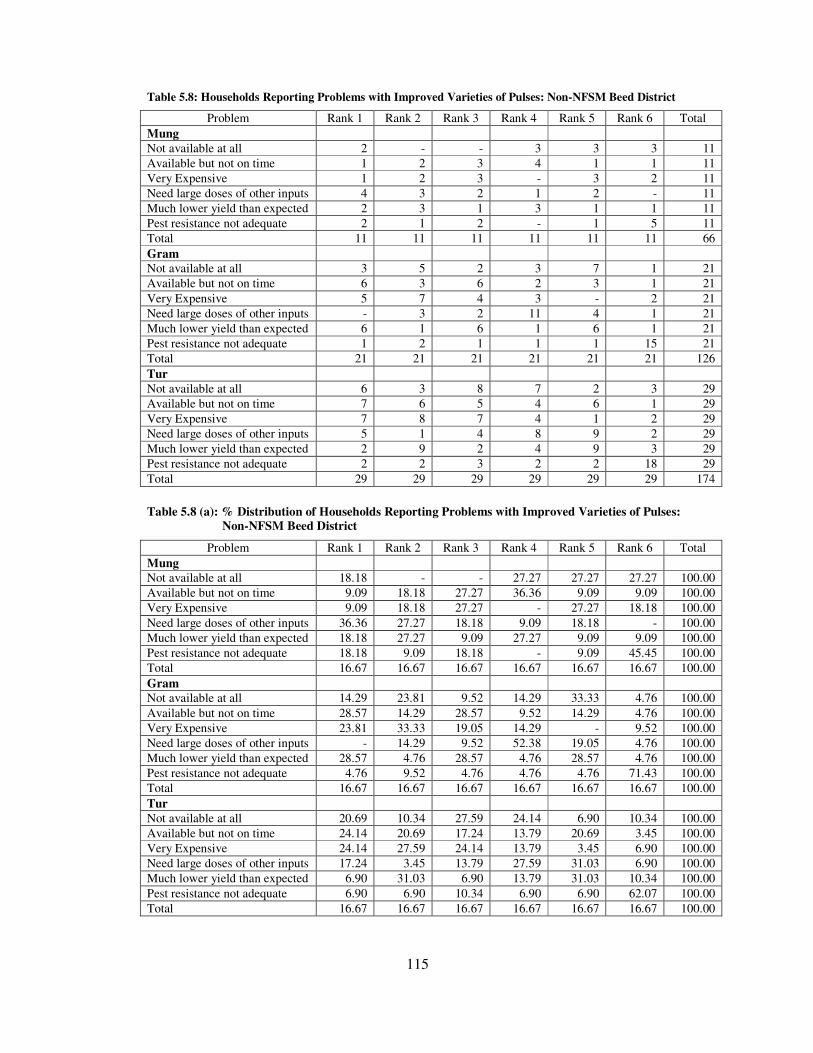
115
Table 5.8: Households Reporting Problems with Improved Varieties of Pulses: Non-NFSM Beed District
Problem Rank 1 Rank 2 Rank 3 Rank 4 Rank 5 Rank 6 Total
Mung
Not available at all 2 - - 3 3 3 11
Available but not on time 1 2 3 4 1 1 11
Very Expensive 1 2 3 - 3 2 11
Need large doses of other inputs 4 3 2 1 2 - 11
Much lower yield than expected 2 3 1 3 1 1 11
Pest resistance not adequate 2 1 2 - 1 5 11
Total 11 11 11 11 11 11 66
Gram
Not available at all 3 5 2 3 7 1 21
Available but not on time 6 3 6 2 3 1 21
Very Expensive 5 7 4 3 - 2 21
Need large doses of other inputs - 3 2 11 4 1 21
Much lower yield than expected 6 1 6 1 6 1 21
Pest resistance not adequate 1 2 1 1 1 15 21
Total 21 21 21 21 21 21 126
Tur
Not available at all 6 3 8 7 2 3 29
Available but not on time 7 6 5 4 6 1 29
Very Expensive 7 8 7 4 1 2 29
Need large doses of other inputs 5 1 4 8 9 2 29
Much lower yield than expected 2 9 2 4 9 3 29
Pest resistance not adequate 2 2 3 2 2 18 29
Total 29 29 29 29 29 29 174
Table 5.8 (a): % Distribution of Households Reporting Problems with Improved Varieties of Pulses:
Non-NFSM Beed District
Problem Rank 1 Rank 2 Rank 3 Rank 4 Rank 5 Rank 6 Total
Mung
Not available at all 18.18 - - 27.27 27.27 27.27 100.00
Available but not on time 9.09 18.18 27.27 36.36 9.09 9.09 100.00
Very Expensive 9.09 18.18 27.27 - 27.27 18.18 100.00
Need large doses of other inputs 36.36 27.27 18.18 9.09 18.18 - 100.00
Much lower yield than expected 18.18 27.27 9.09 27.27 9.09 9.09 100.00
Pest resistance not adequate 18.18 9.09 18.18 - 9.09 45.45 100.00
Total 16.67 16.67 16.67 16.67 16.67 16.67 100.00
Gram
Not available at all 14.29 23.81 9.52 14.29 33.33 4.76 100.00
Available but not on time 28.57 14.29 28.57 9.52 14.29 4.76 100.00
Very Expensive 23.81 33.33 19.05 14.29 - 9.52 100.00
Need large doses of other inputs - 14.29 9.52 52.38 19.05 4.76 100.00
Much lower yield than expected 28.57 4.76 28.57 4.76 28.57 4.76 100.00
Pest resistance not adequate 4.76 9.52 4.76 4.76 4.76 71.43 100.00
Total 16.67 16.67 16.67 16.67 16.67 16.67 100.00
Tur
Not available at all 20.69 10.34 27.59 24.14 6.90 10.34 100.00
Available but not on time 24.14 20.69 17.24 13.79 20.69 3.45 100.00
Very Expensive 24.14 27.59 24.14 13.79 3.45 6.90 100.00
Need large doses of other inputs 17.24 3.45 13.79 27.59 31.03 6.90 100.00
Much lower yield than expected 6.90 31.03 6.90 13.79 31.03 10.34 100.00
Pest resistance not adequate 6.90 6.90 10.34 6.90 6.90 62.07 100.00
Total 16.67 16.67 16.67 16.67 16.67 16.67 100.00
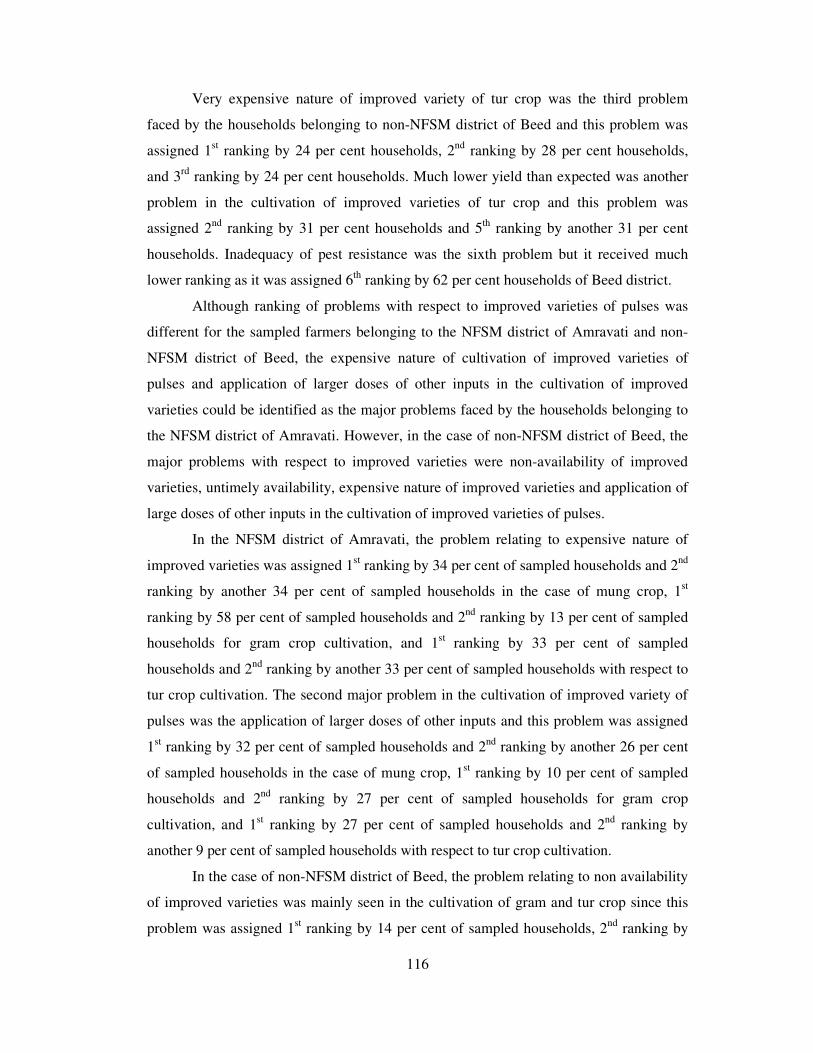
116
Very expensive nature of improved variety of tur crop was the third problem
faced by the households belonging to non-NFSM district of Beed and this problem was
assigned 1st ranking by 24 per cent households, 2
nd ranking by 28 per cent households,
and 3rd
ranking by 24 per cent households. Much lower yield than expected was another
problem in the cultivation of improved varieties of tur crop and this problem was
assigned 2nd
ranking by 31 per cent households and 5th
ranking by another 31 per cent
households. Inadequacy of pest resistance was the sixth problem but it received much
lower ranking as it was assigned 6th
ranking by 62 per cent households of Beed district.
Although ranking of problems with respect to improved varieties of pulses was
different for the sampled farmers belonging to the NFSM district of Amravati and non-
NFSM district of Beed, the expensive nature of cultivation of improved varieties of
pulses and application of larger doses of other inputs in the cultivation of improved
varieties could be identified as the major problems faced by the households belonging to
the NFSM district of Amravati. However, in the case of non-NFSM district of Beed, the
major problems with respect to improved varieties were non-availability of improved
varieties, untimely availability, expensive nature of improved varieties and application of
large doses of other inputs in the cultivation of improved varieties of pulses.
In the NFSM district of Amravati, the problem relating to expensive nature of
improved varieties was assigned 1st ranking by 34 per cent of sampled households and 2
nd
ranking by another 34 per cent of sampled households in the case of mung crop, 1st
ranking by 58 per cent of sampled households and 2nd
ranking by 13 per cent of sampled
households for gram crop cultivation, and 1st ranking by 33 per cent of sampled
households and 2nd
ranking by another 33 per cent of sampled households with respect to
tur crop cultivation. The second major problem in the cultivation of improved variety of
pulses was the application of larger doses of other inputs and this problem was assigned
1st ranking by 32 per cent of sampled households and 2
nd ranking by another 26 per cent
of sampled households in the case of mung crop, 1st ranking by 10 per cent of sampled
households and 2nd
ranking by 27 per cent of sampled households for gram crop
cultivation, and 1st ranking by 27 per cent of sampled households and 2
nd ranking by
another 9 per cent of sampled households with respect to tur crop cultivation.
In the case of non-NFSM district of Beed, the problem relating to non availability
of improved varieties was mainly seen in the cultivation of gram and tur crop since this
problem was assigned 1st ranking by 14 per cent of sampled households, 2
nd ranking by

117
24 per cent of sampled households and 5th
ranking by 33 per cent of sampled households
in the case of gram crop, and 1st ranking by 21 per cent of sampled households, 3
rd
ranking by 28 per cent households, and 4th
ranking by 24 per cent of sampled households
as for the tur crop cultivation. The problem of untimely availability of improved varieties
was also seen in the case of gram and tur crop cultivation since this problem was assigned
1st ranking by 29 per cent of sampled households, 2
nd ranking by 14 per cent of sampled
households and 3rd
ranking by 29 per cent of sampled households in the case of gram
crop, and 1st ranking by 24 per cent of sampled households, 2
nd ranking by 21 per cent of
sampled households, and 3rd
ranking by 17 per cent of sampled households as for the tur
crop cultivation. The problem relating to very expensive nature of cultivation of
improved varieties was also noticed in the case of gram and tur crop as majority of the
sampled households of non-NFSM district of Beed assigned very high ranking to this
problem. The problem relating to application of large doses of other inputs was seen in
the case of cultivation of improved variety of mung crop and this problem was assigned
1st ranking 36 per cent of sampled households and 2
nd ranking by 27 per cent of sampled
households belonging to the non-NFSM district of Beed.
5.5 Suggested Solutions for Improved Varieties in NFSM and Non-NFSM Districts
There were some six major problems with respect to the cultivation of improved
varieties of pulses in the NFSM district of Amravati and non-NFSM district of Beed and
various categories of sampled households cultivating these improved varieties of pulses
had aired their various views in terms of these problems that were recorded and analysed
in the previous section. However, suggestions of these sampled households were also
sought to overcome problems in the cultivation of improved varieties of pulses and these
suggestions mainly revolved around: (a) cheaper availability of seeds, (b) timely
availability of seeds, and (c) subsidy involved in the purchase of such seeds. The
suggestions extended by various categories of sampled households belonging to the
NFSM district of Amravati and non-NFSM district of Beed with respect to improved
varieties of pulses were recorded and analysed and an analysis in this respect with all the
various categories of sampled households put together for the NFSM district of Amravati
and non-NFSM district of Beed are provided in Table 5.9 and Table 5.10. The household
category-wise and crop-wise reported responses in terms of suggestions extended by
sampled households of NFSM district of Amravati and non-NFSM district of Beed and
their ranking in this respect are provided in Appendix from 9 to 14.

118
In the case of mung crop cultivated in the NFSM district of Amravati, while
suggestion like cheaper availability of improved varieties of seeds acquired higher
ranking and was assigned 1st ranking by 38 per cent of sampled households, 2
nd ranking
by 32 per cent of sampled households, and 3rd
ranking by 29 per cent of sampled
households, the ranking with respect to suggestion like timely availability of improved
variety of seeds stood at lower and it was assigned 1st ranking by 27 per cent of sampled
households, 2nd
ranking by 33 per cent of sampled households, and 3rd
ranking by 40 per
cent of sampled households (Table 5.9 and Table 5.9 (a)). Among various suggestions
with respect to improved varieties of pulses, involvement of subsidy in the purchase of
seed was favoured most and this suggestion was assigned 1st ranking by 41 per cent of
sampled households, 2nd
ranking by 35 per cent of sampled households, and 3rd
ranking
by 24 per cent of sampled households.
As for gram crop cultivated in the NFSM district of Amravati, cheaper
availability of improved varieties of seeds and their timely availability received lower
ranking and involvement of subsidy in the purchase of improved varieties of seeds
received higher ranking from the sampled households. For instance, cheaper availability
of improved varieties of seeds was accorded 2nd
ranking by 55 per cent of sampled
households, whereas timely availability of improved varieties of seeds received 3rd
ranking from 61 per cent of sampled households. The involvement of subsidy in the
purchase of improved varieties of seeds was accorded 1st ranking by 53 per cent of
sampled households.
Table 5.9: Suggested Solutions for Improved Varieties of Pulses: NFSM Amravati District
Problems Rank 1 Rank 2 Rank 3 Rank 4 Total
Mung
Cheaper availability of seeds 13 11 10 - 34
Timely availability of seeds 8 10 12 - 30
Subsidy 14 12 8 - 34
Any other (Specify) - - - - -
Total 35 33 30 - 98
Gram
Cheaper availability of seeds 9 17 6 - 32
Timely availability of seeds 6 6 19 - 31
Subsidy 18 6 10 - 34
Any other (Specify) - - - - -
Total 33 29 35 - 97
Tur
Cheaper availability of seeds 3 4 5 - 12
Timely availability of seeds 2 6 3 - 11
Subsidy 6 - 5 - 11
Any other (Specify) - - - - -
Total 11 10 13 - 34

119
Table 5.9 (a): % Distribution of Suggested Solutions for Improved Varieties: NFSM Amravati District
Problems Rank 1 Rank 2 Rank 3 Rank 4 Total
Mung
Cheaper availability of seeds 38.24 32.35 29.41 - 100.00
Timely availability of seeds 26.67 33.33 40.00 - 100.00
Subsidy 41.18 35.29 23.53 - 100.00
Any other (Specify) - - - - -
Total 35.71 33.67 30.61 - 100.00
Gram
Cheaper availability of seeds 28.13 53.13 18.75 - 100.00
Timely availability of seeds 19.35 19.35 61.29 - 100.00
Subsidy 52.94 17.65 29.41 - 100.00
Any other (Specify) - - - - -
Total 34.02 29.90 36.08 - 100.00
Tur
Cheaper availability of seeds 25.00 33.33 41.67 - 100.00
Timely availability of seeds 18.18 54.55 27.27 - 100.00
Subsidy 54.55 - 45.45 - 100.00
Any other (Specify) - - - - -
Total 32.35 29.41 38.24 - 100.00
In the case of tur crop cultivated on the farms belonging to sampled farmers of
NFSM district of Amravati, suggestions like involvement of subsidy in the purchase of
improved varieties of seeds was accorded high ranking by the sampled households and
cheaper availability of improved varieties of seeds and their timely availability got lower
ranking in this respect. About 55 per cent of sampled households of Amravati district
gave 1st ranking to involvement of subsidy in the purchase of improved varieties of seeds,
and 55 per cent of sampled households gave 2nd
ranking to timely availability of
improved varieties of seeds, whereas 3rd
ranking was assigned to cheaper availability of
seeds by 42 per cent of sampled households of Amravati district.
In the non-NFSM district of Beed, suggestions like timely availability of
improved varieties of seeds in the case of mung crop, cheaper availability of improved
varieties of seeds and involvement of subsidy in the purchase of improved varieties of
seeds for gram crop and cheaper availability of improved varieties of seeds for tur crop
were accorded high ranking by the sampled households. For instance, timely availability
of improved varieties of mung crop seeds was favoured by 64 per cent of sampled
households and they assigned this suggestion as 1st ranking. Cheaper availability of
improved varieties of gram crop seed was favoured by 52 per cent households and they
assigned this suggestion as 2nd
ranking. Involvement of subsidy in the purchase of
improved varieties of gram crop seeds was favoured by 48 per cent households and they
assigned this suggestion as 1st ranking. In the case of tur crop cultivated on the farms

120
belonging to sampled households of non-NFSM district of Beed, the suggestion like
cheaper availability of improved varieties of seeds ranked higher and 45 per cent of
sampled households accorded 1st ranking to this suggestion (Table 5.10 and Table 5.10
(a)). Timely availability of improved varieties of tur crop seeds was favoured by 35 per
cent of sampled households of Beed district and they assigned this suggestion as 1st
ranking. Another 35 per cent of sampled households of non-NFSM district of Beed also
favoured timely availability of improved varieties of tur crop seeds and they assigned this
suggestion as 2nd
ranking.
Table 5.10: Suggested Solutions for Improved Varieties of Pulses: Non-NFSM Beed District
Problems Rank 1 Rank 2 Rank 3 Rank 4 Total
Mung
Cheaper availability of seeds 2 4 5 - 11
Timely availability of seeds 7 2 2 - 11
Subsidy 2 5 4 - 11
Any other (Specify) - - - - -
Total 11 11 11 - 33
Gram
Cheaper availability of seeds 5 11 5 - 21
Timely availability of seeds 6 5 10 - 21
Subsidy 10 5 6 - 21
Any other (Specify) - - - - -
Total 21 21 21 - 63
Tur
Cheaper availability of seeds 13 7 9 - 29
Timely availability of seeds 10 10 9 - 29
Subsidy 6 12 11 - 29
Any other (Specify) - - - - -
Total 29 29 29 - 87
Table 5.10 (a): % Distribution of Suggested Solutions for Improved Varieties: Non-NFSM Beed District
Problems Rank 1 Rank 2 Rank 3 Rank 4 Total
Mung
Cheaper availability of seeds 18.18 36.36 45.45 - 100.00
Timely availability of seeds 63.64 18.18 18.18 - 100.00
Subsidy 18.18 45.45 36.36 - 100.00
Any other (Specify) - - - - -
Total 33.33 33.33 33.33 - 100.00
Gram
Cheaper availability of seeds 23.81 52.38 23.81 - 100.00
Timely availability of seeds 28.57 23.81 47.62 - 100.00
Subsidy 47.62 23.81 28.57 - 100.00
Any other (Specify) - - - - -
Total 33.33 33.33 33.33 - 100.00
Tur
Cheaper availability of seeds 44.83 24.14 31.03 - 100.00
Timely availability of seeds 34.48 34.48 31.03 - 100.00
Subsidy 20.69 41.38 37.93 - 100.00
Any other (Specify) - - - - -
Total 33.33 33.33 33.33 - 100.00

121
The households belonging to NFSM district of Amravati and non-NFSM district
of Beed accorded different rankings to various suggestions with respect to the improved
varieties of pulses crops seeds. While majority of the sampled households of NFSM
district of Amravati favoured involvement of an element of subsidy in the purchase of
improved varieties of mung, gram and tur crop seeds, the suggestions of sampled
households of non-NFSM district was in favour of timely availability of improved
varieties of seeds in the case of mung crop and cheaper availability of improved varieties
of seeds with respect to tur crop. The ranking of suggestion like involvement of an
element of subsidy in the purchase of improved varieties was high in the case of gram
crop cultivated on the farms belonging sampled households of non-NFSM district of
Beed. In the NFSM district of Amravati, the suggestion like involvement of an element of
subsidy in the purchase of improved varieties of seeds was assigned 1st ranking by 55 per
cent of tur crop cultivators, 53 per cent of gram crop cultivators and 41 per cent of mung
crop cultivators. On the other hand, in the non-NFSM district of Beed, the first
suggestion of cheaper availability of improved variety of seeds was assigned 1st ranking
by 45 per cent of tur crop cultivators, 24 per cent of gram crop cultivators and 18 per cent
of mung crop cultivators. The second suggestion of timely availability of improved
varieties of seeds was assigned 1st ranking by 64 per cent of mung crop cultivators, 29 per
cent of gram crop cultivators, and 34 per cent of tur crop cultivators. The thirds
suggestion of involvement of subsidy in the purchase of improved varieties was assigned
1st ranking in the case of gram crop by 48 per cent of the sampled households belonging
to the non-NFSM district of Beed. Thus, the ranking of suggestions with respect to
improved varieties of pulses crops seeds differed across various sampled households
drawn from the NFSM district of Amravati and non-NFSM district of Beed.
5.6 Marketing of Pulses Crops in NFSM and Non-NFSM Districts
It is widely believed that the marketing of pulses crops is not very complex
process due to their less perishability. However, an efficient marketing system for pulses
crops implies improving various marketing functions involved in the diversion of
produce from the farmer to the ultimate consumer. Although there can be several
channels through which pulses crops may move from producers to consumers, the
farmers are generally seen to sell their pulses crops produce either in the village market
itself or divert it through commission agents or sell it through regulated markets. Farmers
are also seen to sell their pulses crops produce directly to the government agencies like

122
NAFED. In the NFSM district of Amravati and non-NFSM district of Beed, the sampled
households were seen to sell their pulses crops produce through various channels.
The estimates relating to numerical strength of various categories of sampled
households selling their pulses crops produce through various channels and proportion of
households to total sampled households selling their produce through various channels
for the NFSM district of Amravati and non-NFSM district of Beed encompassing the
years 2007-08 and 2008-09 are brought out in Table 5.11 and Table 5.12.
In the NFSM district of Amravati, about 51 per cent of the total sampled
households sold their mung crop produce through regulated market, 33 per cent through
commission agents and 16 per cent through village markets during both 2007-08 and
2008-09 (Table 5.11 and Table 5.11 a)).
Table 5.11: No. of Households Marketing Pulses through Various Channels: NFSM Amravati District
Category Village
Market
Commission
Agent
Regulated
market
Govt. Agencies
(NAFED)
Others Total
2007-08
Mung
Marginal 2 - 7 - - 9
Small 4 5 6 - - 15
Medium - 5 5 - - 10
Large - 3 2 - - 5
All 6 13 20 - - 39
Gram
Marginal 2 - 9 - - 11
Small 3 4 5 12
Medium - 5 4 - - 9
Large - 3 2 - - 5
All 5 12 20 - - 37
Tur
Marginal 1 1 1 - - 3
Small - 1 4 - - 5
Medium - - 3 - - 3
Large - 1 2 - - 3
All 1 3 10 - - 14
2008-09
Mung
Marginal 3 1 7 - - 11
Small 4 5 7 - - 16
Medium - 5 5 - - 10
Large - 3 3 - - 6
All 7 14 22 - - 43
Gram
Marginal 2 1 7 - - 10
Small 3 4 3 10
Medium - 4 5 - - 9
Large - 3 3 - - 6
All 5 12 18 - - 35
Tur
Marginal 1 - 1 - - 2
Small 1 1 5 - - 7
Medium - - 5 - - 5
Large - 1 1 - - 2
All 2 2 12 - - 16

123
Table 5.11 (a): % of Total Households in the Size Group Marketing Pulses through Various
Channels: NFSM Amravati District
Category Village
Market
Commission
Agent
Regulated
market
Govt. Agencies
(NAFED)
Others Total
2007-08
Mung
Marginal 22.22 - 77.78 - - 100.00
Small 26.67 33.33 40.00 - - 100.00
Medium - 50.00 50.00 - - 100.00
Large - 60.00 40.00 - - 100.00
All 15.38 33.33 51.28 - - 100.00
Gram
Marginal 18.18 - 81.82 - - 100.00
Small 25.00 33.33 41.67 - - 100.00
Medium - 55.56 44.44 - - 100.00
Large - 60.00 40.00 - - 100.00
All 13.51 32.43 54.05 - - 100.00
Tur
Marginal 33.33 33.33 33.33 - - 100.00
Small - 20.00 80.00 - - 100.00
Medium - - 100.00 - - 100.00
Large 33.33 66.67 - - 100.00
All 7.14 21.43 71.43 - - 100.00
2008-09
Mung
Marginal 27.27 9.09 63.64 - - 100.00
Small 25.00 31.25 43.75 - - 100.00
Medium - 50.00 50.00 - - 100.00
Large - 50.00 50.00 - - 100.00
All 16.28 32.56 51.16 - - 100.00
Gram
Marginal 20.00 10.00 70.00 - - 100.00
Small 30.00 40.00 30.00 - - 100.00
Medium - 44.44 55.56 - - 100.00
Large - 50.00 50.00 - - 100.00
All 14.29 34.29 51.43 - - 100.00
Tur
Marginal 50.00 - 50.00 - - 100.00
Small 14.29 14.29 71.43 - - 100.00
Medium - - 100.00 - - 100.00
Large - 50.00 50.00 - - 100.00
All 12.50 12.50 75.00 - - 100.00
The major marketing of gram crop was also performed through regulated markets
since about 54 per cent of the total sampled households of NFSM district of Amravati
sold their gram crop produce through regulated market, 32 per cent through commission
agents and 14 per cent through village markets during 2007-08 and 51 per cent through
regulated markets, 32 per cent through commission agents and 16 per cent through
village market during 2008-09. Similarly, in the NFSM district of Amravati, about 71 per
cent of the total sampled households sold their tur crop produce through regulated
market, 21 per cent through commission agents and 7 per cent through village markets
during 2007-08 and 75 per cent through regulated markets, 13 per cent through
commission agents and 12 per cent through village markets during 2008-09.

124
As for the non-NFSM district of Beed, nearly 92 per cent of the households sold
their mung crop produce through regulated market and remaining 8 per cent through
commission agents during 2007-08, and 94 per cent through regulated markets and 6 per
cent through commission agents during 2008-09 (Table 5.12 and Table 5.12 a)).
Similarly, in the case of gram crop, about 91 per cent of the households sold their
produce through regulated market and 9 per cent through commission agents during
2007-08 and 95 per cent through regulated markets and 5 per cent through commission
agents during 2008-09. In the case of tur crop, the produce was sold through regulated
markets since 93 per cent of the households sold their tur crop produce through regulated
market and 7 per cent through commission agents during 2007-08 and 86 per cent
through regulated markets and 14 per cent through commission agents during 2008-09.
Table 5.12: No. of Households Marketing Pulses through Various Channels: Non-NFSM Beed District
Category Village
Market
Commission
Agent
Regulated
market
Govt. Agencies
(NAFED)
Others Total
2007-08
Mung
Marginal - - 2 - - 2
Small - 1 5 - - 6
Medium - - 1 - - 1
Large - - 3 - - 3
All - 1 11 - - 12
Gram
Marginal - 1 5 - - 6
Small - 1 8 - - 9
Medium - - 3 - - 3
Large - - 5 - - 5
All - 2 21 - - 23
Tur
Marginal - 2 3 - - 5
Small - - 8 - - 8
Medium - - 12 - - 12
Large - - 3 - - 3
All - 2 26 - - 28
2008-09
Mung
Marginal - - 2 - - 2
Small - 1 7 - - 8
Medium - - 3 - - 3
Large - - 3 - - 3
All - 1 15 - - 16
Gram
Marginal - - 5 - - 5
Small - 1 8 - - 9
Medium - - 3 - - 3
Large - - 5 - - 5
All - 1 21 - - 22
Tur
Marginal - 3 8 - - 11
Small - 1 5 - - 6
Medium - - 8 - - 8
Large - - 4 - - 4
All - 4 25 - - 29
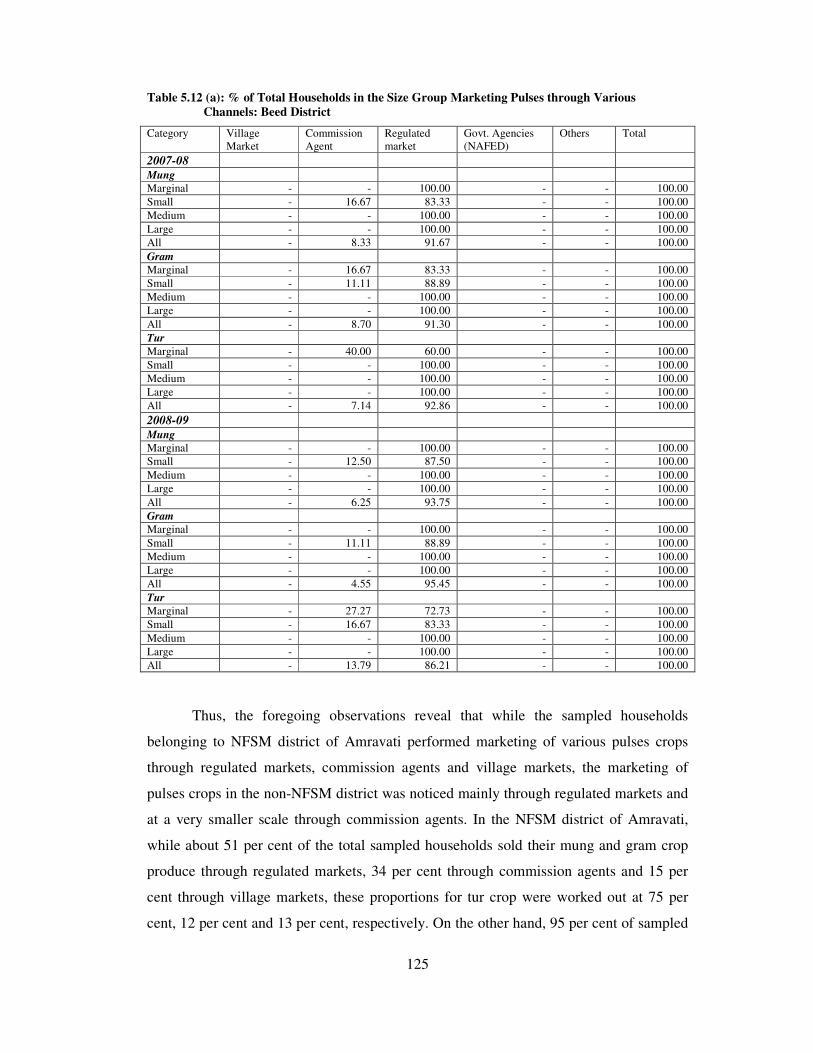
125
Table 5.12 (a): % of Total Households in the Size Group Marketing Pulses through Various
Channels: Beed District
Category Village
Market
Commission
Agent
Regulated
market
Govt. Agencies
(NAFED)
Others Total
2007-08
Mung
Marginal - - 100.00 - - 100.00
Small - 16.67 83.33 - - 100.00
Medium - - 100.00 - - 100.00
Large - - 100.00 - - 100.00
All - 8.33 91.67 - - 100.00
Gram
Marginal - 16.67 83.33 - - 100.00
Small - 11.11 88.89 - - 100.00
Medium - - 100.00 - - 100.00
Large - - 100.00 - - 100.00
All - 8.70 91.30 - - 100.00
Tur
Marginal - 40.00 60.00 - - 100.00
Small - - 100.00 - - 100.00
Medium - - 100.00 - - 100.00
Large - - 100.00 - - 100.00
All - 7.14 92.86 - - 100.00
2008-09
Mung
Marginal - - 100.00 - - 100.00
Small - 12.50 87.50 - - 100.00
Medium - - 100.00 - - 100.00
Large - - 100.00 - - 100.00
All - 6.25 93.75 - - 100.00
Gram
Marginal - - 100.00 - - 100.00
Small - 11.11 88.89 - - 100.00
Medium - - 100.00 - - 100.00
Large - - 100.00 - - 100.00
All - 4.55 95.45 - - 100.00
Tur
Marginal - 27.27 72.73 - - 100.00
Small - 16.67 83.33 - - 100.00
Medium - - 100.00 - - 100.00
Large - - 100.00 - - 100.00
All - 13.79 86.21 - - 100.00
Thus, the foregoing observations reveal that while the sampled households
belonging to NFSM district of Amravati performed marketing of various pulses crops
through regulated markets, commission agents and village markets, the marketing of
pulses crops in the non-NFSM district was noticed mainly through regulated markets and
at a very smaller scale through commission agents. In the NFSM district of Amravati,
while about 51 per cent of the total sampled households sold their mung and gram crop
produce through regulated markets, 34 per cent through commission agents and 15 per
cent through village markets, these proportions for tur crop were worked out at 75 per
cent, 12 per cent and 13 per cent, respectively. On the other hand, 95 per cent of sampled

126
households of non-NFSM district of Beed sold their mung and gram crop produce
through regulated markets and remaining 5 per cent through commission agents. In the
non-NFSM district of Beed, the proportion of households to total sampled households
selling their tur crop produce through regulated market was 86 per cent with remaining
14 per cent selling their produce through commission agents.
5.7 Quantity of Pulses Marketed in NFSM and Non-NFSM Districts
The estimates relating to total quantum of marketed surplus of various pulses
crops and the share of various channels in the marketed surplus coupled with average
selling price of the produce for various categories of sampled households belonging to
the NFSM district of Amravati and non-NFSM district of Beed for the reference years
2007-08 and 2008-09 are provided in Table 5.13 and 5.14.
During 2007-08, the total marketed surplus with all the sampled farmers of NFSM
district of Amravati put together was estimated at 283 quintals for mung crop, 596
quintals for gram, and 69 quintals for tur crop. In the NFSM district of Amravati, the
quantity of marketed surplus sold was found to be 47.43 per cent through regulated
market, 41.59 per cent through commission agents, 10.97 per cent through village market
in the case of mung crop, 48.15 per cent through regulated market, 44.46 per cent through
commission agents, and 7.38 per cent through village market for gram crop, and 78.10
per cent through regulated market, 18.98 per cent through commission agents, and 2.92
per cent through village market in the case of tur crop (Table 5.13).
In the NFSM district of Amravati, during 2008-09, the total marketed surplus with
all the sampled farmers put together was estimated at 333 quintals for mung crop, 739
quintals for gram, and 62 quintals for tur crop. Further, in the NFSM district of Amravati,
the quantity of marketed surplus diverted was noticed to be 51.39 per cent through
regulated market, 38.26 per cent through commission agents, 10.35 per cent through
village market in the case of mung crop, 57.24 per cent through regulated market, 35.99
per cent through commission agents, and 6.77 per cent through village market for gram
crop, and 84.55 per cent through regulated market, 9.76 per cent through commission
agents, and 5.69 per cent through village market in the case of tur crop.
The major marketed surplus of pulses crops in the NFSM district of Amravati
with all the sampled farmers put together was, therefore, sold through regulated market
during both 2007-08 and 2008-09 with share of regulated market in marketed surplus of
mung, gram and tur during 2008-09 being 51 per cent, 57 per cent and 85 per cent.

127
Table 5.13: Quantity of Pulses Sold through Various Channels: NFSM Amravati District (Quantity Sold in Quintals; Price in Rs./ Quintal)
Village Market Comm. Agent Regulated market Govt. Agency Others Total Category
Qty
Sold
Price Qty
Sold
Price Qty
Sold
Price Qty
Sold
Price Qty
Sold
Price Qty
Sold
Price
2007-08
Mung
Marginal 10.00 3150 - - 22.50 3956 - - - - 32.50 3742
Small 21.00 3152 24.50 3990 24.50 4006 - - - - 70.00 3729
Medium - - 54.00 3741 41.00 3788 - - - - 95.00 3771
Large - - 39.00 3797 46.00 3800 - - - - 85.00 3802
All 31.00 3152 117.50 3841 134.00 3860 - - - - 282.50 3766
Gram
Marginal 18.00 2567 - - 69.00 2114 - - - - 87.00 2199
Small 26.00 2565 51.00 2184 65.00 2163 - - - - 142.00 2241
Medium - - 130.00 2118 65.00 2369 - - - - 195.00 2203
Large - - 84.00 2067 88.00 2445 - - - - 172.00 2254
All 44.00 2566 265.00 2115 287.00 2285 - - - - 596.00 2226
Tur
Marginal 2.00 2500 4.00 2700 4.00 2800 - - - - 10.00 2700
Small - - 4.00 2800 11.50 2967 - - - - 15.50 2915
Medium - - - - 13.00 2785 - - - - 13.00 2785
Large - - 5.00 2800 25.00 2780 - - - - 30.00 2783
All 2.00 2500 13.00 2769 53.50 2828 - - - - 68.50 2803
2008-09
Mung
Marginal 14.00 3693 4.00 3500 27.75 4073 - - - - 45.75 3927
Small 20.50 4015 23.50 4121 36.50 4221 - - - - 80.50 4139
Medium - - 46.00 4239 40.00 4183 - - - - 86.00 4214
Large - - 54.00 4122 67.00 4300 - - - - 121.00 4254
All 34.50 3884 127.50 4145 171.25 4219 - - - - 333.25 4172
Gram
Marginal 18.00 2500 9.00 2400 62.00 2342 - - - - 89.00 2379
Small 32.00 2658 49.00 2390 81.00 2528 - - - - 162.00 2512
Medium - - 80.00 2460 107.00 2556 - - - - 187.00 2514
Large - - 128.00 2600 173.00 2584 - - - - 301.00 2591
All 50.00 2601 266.00 2512 423.00 2531 - - - - 739.00 2528
Tur
Marginal 2.50 2800 - - 2.50 2700 - - - - 5.00 2750
Small 1.00 3200 2.00 3000 25.50 2983 - - - - 28.50 3007
Medium - - - - 19.00 3145 - - - - 19.00 3145
Large - - 4.00 3200 5.00 3200 - - - - 9.00 3200
All 3.50 2914 6.00 3133 52.00 3053 - - - - 61.50 3063
In the case of non-NFSM district of Beed, during 2007-08, the total marketed
surplus with all the sampled farmers of non-NFSM district of Beed put together was
estimated at 114 quintals for mung crop, 198 quintals for gram, and 192 quintals for tur
crop. In the non-NFSM district of Beed, the quantity of marketed surplus sold was found
to be 90.89 per cent through regulated market and 8.81 per cent through commission
agents in the case of mung crop, 96.81 per cent through regulated market and 3.19 per

128
cent through commission agents for gram crop, and 97.66 per cent through regulated
market and 2.34 per cent through commission agents in the case of tur crop (Table 5.14).
As against 2007-08, during 2008-09, in the non-NFSM district of Beed, the total
marketed surplus with all the sampled farmers put together was estimated at 138 quintals
for mung crop, 271 quintals for gram, and 166 quintals for tur crop. In the non-NFSM
district of Beed, the quantity of marketed surplus diverted was noticed to be 92.75 per
cent through regulated market and 7.25 per cent through commission agents in the case of
mung crop, 95.93 per cent through regulated market and 4.07 per cent through
commission agents for gram crop, and 93.36 per cent through regulated market and 6.64
per cent through commission agents in the case of tur crop.
Table 5.14: Quantity of Pulses Sold through Various Channels: Non-NFSM Beed District (Quantity Sold in Quintals; Price in Rs./ Quintal)
Village Market Comm. Agent Regulated market Govt. Agency Others Total Category
Qty
Sold
Price Qty
Sold
Price Qty
Sold
Price Qty
Sold
Price Qty
Sold
Price Qty
Sold
Price
2007-08
Mung
Marginal - - - - 4.00 3563 - - - - 4.00 3742
Small - - 10.00 3700 24.50 3567 - - - - 34.50 3606
Medium - - - - 8.00 3800 - - - - 8.00 3771
Large - - - - 67.00 3701 - - - - 67.00 3802
All - - 10.00 3700 103.00 3672 - - - - 113.50 3674
Gram
Marginal - - 6.50 2200 21.50 2065 - - - - 28.00 2096
Small - - 3.00 2400 44.50 2040 - - - - 47.50 2063
Medium - - - - 30.00 2110 - - - - 30.00 2100
Large - - - - 192.00 2250 - - - - 192.00 2250
All - - 9.50 2263 288.00 2189 - - - - 297.50 2191
Tur
Marginal - - 4.50 2589 2.75 2709 - - - - 7.25 2635
Small - - - - 41.00 2710 - - - - 41.00 2710
Medium - - - - 86.00 2780 - - - - 86.00 2780
Large - - - - 58.00 2724 - - - - 58.00 2724
All - - 4.50 2589 187.75 2746 - - - - 192.25 2742
2008-09
Mung
Marginal - - - - 5.50 3791 - - - - 5.50 3791
Small - - 10.00 3700 50.00 4005 - - - - 60.00 3954
Medium - - - - 34.00 4154 - - - - 34.00 4154
Large - - - - 38.50 4222 - - - - 38.50 4222
All - - 10.00 3700 128.00 4101 - - - - 138.00 4072
Gram
Marginal - - - - 9.50 2363 - - - - 9.50 2363
Small - - 11.00 2400 64.50 2395 - - - - 75.50 2396
Medium - - - - 48.50 2389 - - - - 48.50 2389
Large - - - - 137.00 2504 - - - - 137.00 2504
All - - 11.00 2400 259.50 2450 - - - - 270.50 2448
Tur
Marginal - - 8.50 3000 17.75 2799 - - - - 26.25 2864
Small - - 2.50 3300 32.50 3031 - - - - 35.00 3050
Medium - - - - 46.50 3061 - - - - 46.50 3061
Large - - - - 58.00 3155 - - - - 58.00 3155
All - - 11.00 3068 154.75 3060 - - - - 165.75 3061

129
It could be further noted from Table 5.15 and Table 5.16 that none of the sampled
farmer belonging to NFSM district of Amravati and non-NFSM district of Beed sold any
of their pulses crops to the government agency like NAFED, and therefore, government
procurement in this respect remained nil in the NFSM district of Amravati and non-
NFSM district of Beed.
Table 5.15: Government (NAFED) Procurement of Pulses from Farmers: NFSM Amravati District
Category No. of Farmers from
Whom Procured
Total No. of Farmers in
the Size Group
% of Farmers from
Whom Procured
Marginal 15
Small 19
Medium 10
Large 6
All
NIL
50
NIL
Table 5.16: Government (NAFED) Procurement of Pulses from Farmers: Non-NFSM Beed District
Category No. of Farmers from
Whom Procured
Total No. of Farmers in
the Size Group
% of Farmers from
Whom Procured
Marginal 14
Small 17
Medium 13
Large 6
All
NIL
50
NIL
A comparative analysis with respect to marketing of pulses crops revealed that the
sampled farmers belonging to the non-NFSM district of Beed mostly depended on
regulated markets for the marketing of their pulses crops since the share of regulated
markets in total marketed surplus of mung, gram and tur crop in this district during 2008-
09 stood at 93 per cent, 96 per cent and 93 per cent, respectively, with share of
commission agents in total marketed surplus of mung, gram and tur being 7 per cent, 4
per cent and 7 per cent, respectively. Contrary to non-NFSM district of Beed, the
sampled farmers of NFSM district of Amravati also sold their marketed surplus of pulses
crops through village markets, apart from selling their marketed surplus through
regulated markets and commission agents. However, the major marketed surplus of
pulses crops in the NFSM district of Amravati with all the sampled farmers put together
was diverted through regulated markets only with share of regulated markets in marketed
surplus of mung, gram and tur during 2008-09 being 51 per cent, 57 per cent and 85 per
cent, respectively, and the share of commission agents in this respect being 38 per cent,
36 per cent and 10 per cent, respectively, with village markets showing very little share.
********

130
CHAPTER – VI
FARMERS’ PERCEPTIONS
This chapter is chiefly focused on recording and analysing the opinion of the
sampled farmers drawn from the NFSM district of Amravati and non-NFSM district of
Beed with respect to the major pest problems faced by them in the cultivation of various
pulses crops, reasons for their cultivation of various pulses crops, criteria used by them
for allocation of area under pulses crops cultivation, problems confronted by them in
terms of cultivation of pulses on inferior quality of land, reasons for not growing pulses
on irrigated land, reasons for shifting area from other crops to pulses or vis-a-versa, their
willingness to grow pulses under assured market conditions, their opinion regarding
problems in the cultivation of pulses, and their suggested solutions with respect to
cultivation of various pulses crops. This chapter, therefore, mainly analyses producer
farmers’ response with respect to the cultivation of various pulses crops, reasons for their
cultivation, problems in their cultivation and suggested remedial measures with respect to
their cultivation. Analysis of responses of farmers with respect to various queries raised
in terms of the cultivation of pulses crops is essential to judge the impact of NFSM
programme on farming community with a view to augment pulses production to meet
ever-growing demand for these crops from both urban and rural population of India.
6.1 Major Pest Problems in NFSM and Non-NFSM Districts
The sampled farmers belonging to the NFSM district of Amravati and non-NFSM
district of Beed faced some pest problems in the cultivation of various pulses crops.
Although there could be many pests like pod borer, pod fly, wilt, root rot, nematodes,
etc., the sampled farmers were seen to be mainly affected by pod borer, pod fly and wilt.
The perceptions of the sampled farmers drawn from the NFSM district of Amravati and
non-NFSM district of Beed with respect to the type of pests affecting their pulses crops
and the extent of loss of the pulses crops are brought out in Table 6.1 and 6.2.
In the NFSM district of Amravati, the proportions of sampled farmers affected by
various pests was found to be 80 per cent by pod borer, 93 per cent by pod fly and 13 per
cent by wilt for marginal category, 79 per cent by pod borer, 84 per cent by pod fly and
47 per cent by wilt for small category, 60 per cent by pod borer, 80 per cent by pod fly
and 50 per cent by wilt for medium category and 50 per cent by pod borer, 100 per cent
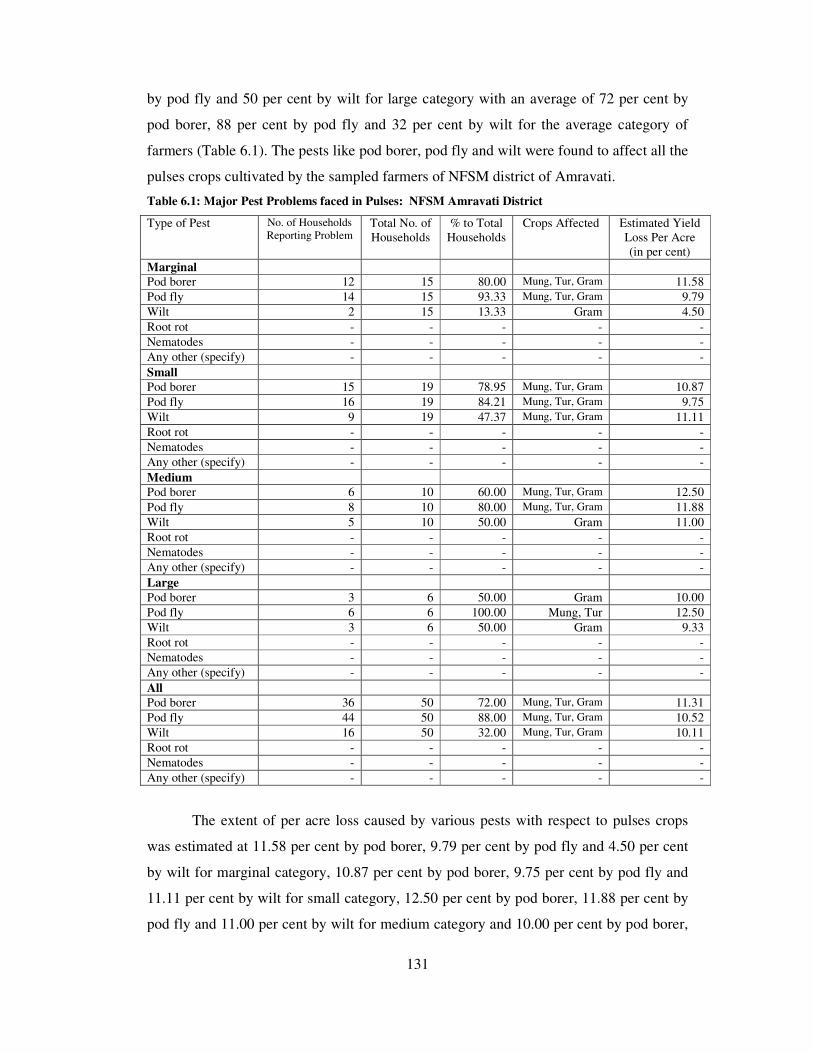
131
by pod fly and 50 per cent by wilt for large category with an average of 72 per cent by
pod borer, 88 per cent by pod fly and 32 per cent by wilt for the average category of
farmers (Table 6.1). The pests like pod borer, pod fly and wilt were found to affect all the
pulses crops cultivated by the sampled farmers of NFSM district of Amravati.
Table 6.1: Major Pest Problems faced in Pulses: NFSM Amravati District
Type of Pest No. of Households
Reporting Problem Total No. of
Households
% to Total
Households
Crops Affected Estimated Yield
Loss Per Acre
(in per cent)
Marginal
Pod borer 12 15 80.00 Mung, Tur, Gram 11.58
Pod fly 14 15 93.33 Mung, Tur, Gram 9.79
Wilt 2 15 13.33 Gram 4.50
Root rot - - - - -
Nematodes - - - - -
Any other (specify) - - - - -
Small
Pod borer 15 19 78.95 Mung, Tur, Gram 10.87
Pod fly 16 19 84.21 Mung, Tur, Gram 9.75
Wilt 9 19 47.37 Mung, Tur, Gram 11.11
Root rot - - - - -
Nematodes - - - - -
Any other (specify) - - - - -
Medium
Pod borer 6 10 60.00 Mung, Tur, Gram 12.50
Pod fly 8 10 80.00 Mung, Tur, Gram 11.88
Wilt 5 10 50.00 Gram 11.00
Root rot - - - - -
Nematodes - - - - -
Any other (specify) - - - - -
Large
Pod borer 3 6 50.00 Gram 10.00
Pod fly 6 6 100.00 Mung, Tur 12.50
Wilt 3 6 50.00 Gram 9.33
Root rot - - - - -
Nematodes - - - - -
Any other (specify) - - - - -
All
Pod borer 36 50 72.00 Mung, Tur, Gram 11.31
Pod fly 44 50 88.00 Mung, Tur, Gram 10.52
Wilt 16 50 32.00 Mung, Tur, Gram 10.11
Root rot - - - - -
Nematodes - - - - -
Any other (specify) - - - - -
The extent of per acre loss caused by various pests with respect to pulses crops
was estimated at 11.58 per cent by pod borer, 9.79 per cent by pod fly and 4.50 per cent
by wilt for marginal category, 10.87 per cent by pod borer, 9.75 per cent by pod fly and
11.11 per cent by wilt for small category, 12.50 per cent by pod borer, 11.88 per cent by
pod fly and 11.00 per cent by wilt for medium category and 10.00 per cent by pod borer,
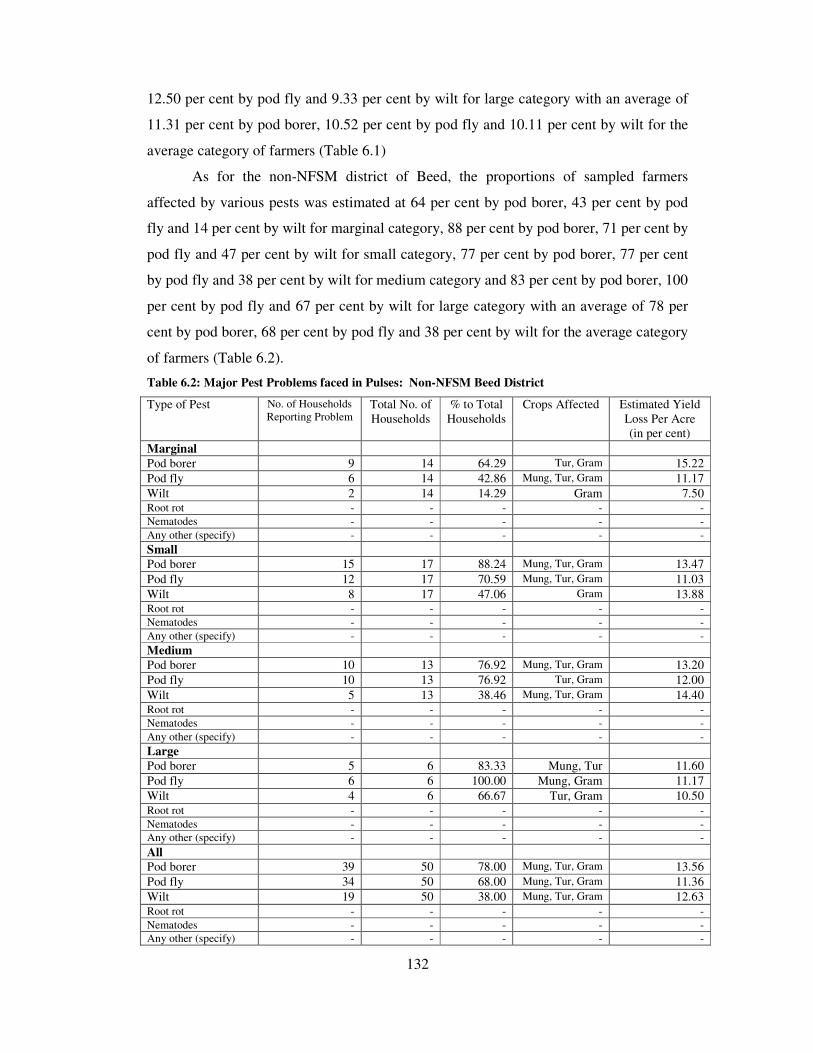
132
12.50 per cent by pod fly and 9.33 per cent by wilt for large category with an average of
11.31 per cent by pod borer, 10.52 per cent by pod fly and 10.11 per cent by wilt for the
average category of farmers (Table 6.1)
As for the non-NFSM district of Beed, the proportions of sampled farmers
affected by various pests was estimated at 64 per cent by pod borer, 43 per cent by pod
fly and 14 per cent by wilt for marginal category, 88 per cent by pod borer, 71 per cent by
pod fly and 47 per cent by wilt for small category, 77 per cent by pod borer, 77 per cent
by pod fly and 38 per cent by wilt for medium category and 83 per cent by pod borer, 100
per cent by pod fly and 67 per cent by wilt for large category with an average of 78 per
cent by pod borer, 68 per cent by pod fly and 38 per cent by wilt for the average category
of farmers (Table 6.2).
Table 6.2: Major Pest Problems faced in Pulses: Non-NFSM Beed District
Type of Pest No. of Households
Reporting Problem Total No. of
Households
% to Total
Households
Crops Affected Estimated Yield
Loss Per Acre
(in per cent)
Marginal
Pod borer 9 14 64.29 Tur, Gram 15.22
Pod fly 6 14 42.86 Mung, Tur, Gram 11.17
Wilt 2 14 14.29 Gram 7.50 Root rot - - - - -
Nematodes - - - - -
Any other (specify) - - - - -
Small
Pod borer 15 17 88.24 Mung, Tur, Gram 13.47
Pod fly 12 17 70.59 Mung, Tur, Gram 11.03
Wilt 8 17 47.06 Gram 13.88 Root rot - - - - -
Nematodes - - - - -
Any other (specify) - - - - -
Medium
Pod borer 10 13 76.92 Mung, Tur, Gram 13.20
Pod fly 10 13 76.92 Tur, Gram 12.00
Wilt 5 13 38.46 Mung, Tur, Gram 14.40 Root rot - - - - -
Nematodes - - - - -
Any other (specify) - - - - -
Large
Pod borer 5 6 83.33 Mung, Tur 11.60
Pod fly 6 6 100.00 Mung, Gram 11.17
Wilt 4 6 66.67 Tur, Gram 10.50
Root rot - - - - -
Nematodes - - - - -
Any other (specify) - - - - -
All
Pod borer 39 50 78.00 Mung, Tur, Gram 13.56
Pod fly 34 50 68.00 Mung, Tur, Gram 11.36
Wilt 19 50 38.00 Mung, Tur, Gram 12.63
Root rot - - - - -
Nematodes - - - - -
Any other (specify) - - - - -

133
The pests like pod borer, pod fly and wilt caused considerable damage to all the
pulses crops cultivated by the sampled farmers of non-NFSM district of Beed with
proportion of farmers affected by pests being higher in large category.
In the non-NFSM district of Beed, the extent of per acre loss caused by various
pests with respect to pulses crops was estimated at 15.22 per cent by pod borer, 11.17 per
cent by pod fly and 7.50 per cent by wilt for marginal category, 13.47 per cent by pod
borer, 11.03 per cent by pod fly and 13.88 per cent by wilt for small category, 13.20 per
cent by pod borer, 12.00 per cent by pod fly and 14.00 per cent by wilt for medium
category and 11.60 per cent by pod borer, 11.17 per cent by pod fly and 10.50 per cent by
wilt for large category with an average of 13.56 per cent by pod borer, 11.36 per cent by
pod fly and 12.63 per cent by wilt for the average category of farmers (Table 6.2).
A comparative analysis between NFSM district of Amravati and non-NFSM
district of Beed revealed that the extent of per acre loss cased by various pests with
respect to pulses crops was higher in the non-NFSM district of Beed as against NFSM
district of Amravati since per acre losses caused by various pests with respect to pulses
crops for the average category of farmers was estimated at 11.31 per cent by pod borer,
10.52 per cent by pod fly and 10.11 per cent by wilt in the NFSM district of Amravati
and 13.56 per cent by pod borer, 11.36 per cent by pod fly and 12.63 per cent by wilt in
the non-NFSM district of Beed. Both NFSM district of Amravati and non-NFSM district
of Beed showed mung, tur and gram as the pulses crops being affected by various pests.
6.2 Reasons for Growing Pulses Crops in NFSM and Non-NFSM Districts
At the time of survey, the sampled farmers drawn from the NFSM district of
Amravati and non-NFSM district of Beed were asked to indicate the reasons that weighed
in favour of cultivation various pulses crops. The perceptions with respect to reasons for
growing various pulses crops were recorded and analysed, and these perceptions for the
sampled farmers of NFSM district of Amravati and non-NFSM district of Beed are
presented in Table 6.3 and Table 6.4.
Profitability was found to be the major reason for the cultivation of pulses by
various categories of sampled households drawn from the NFSM district of Amravati
since 74 per cent of the total sampled households of this district aired their view in favour
of this reason, whereas 12 of the sampled households aired their view in favour of home
consumption, 2 per cent in favour of inferior quality of land and 12 per cent in favour of
lack of irrigation facilities (Table 6.3 and Table 6.3 (a)).

134
Table 6.3: Reasons for Growing Pulses: NFSM Amravati District (No. of Households)
Reasons Total No. of Households % of Total Households
Home Consumption 6 12.00
Animal Feed - -
Inferior Quality of Land 1 2.00
Lack of Irrigation 6 12.00
Profitability 37 74.00
Any Other - -
Total 50 100.00
Table 6.3 (a): Reasons for Growing Pulses: Size-group-wise: NFSM Amravati District (No. of Households)
Reasons Household
Category Home
Consumption
Animal
Feed
Inferior Quality
of Land
Lack of
Irrigation
Profitability Any Other Total
Marginal 1 - - 2 12 - 15
Small 2 - - 3 14 - 19
Medium 2 - - 1 7 - 10
Large 1 - 1 - 4 - 6
All 6 - 1 6 37 - 50
Percentage to Total Farmers in the Size-group
Marginal 6.67 - - 13.33 80.00 - 100.00
Small 10.53 - - 15.79 73.68 - 100.00
Medium 20.00 - - 10.00 70.00 - 100.00
Large 16.67 - 16.67 - 66.67 - 100.00
All 12.00 - 2.00 12.00 74.00 - 100.00
Interestingly, the proportions of sampled households showing profitability as the
major reason for the cultivation of various pulses crops declined with the increase in land
holding size of sampled households of NFSM district of Amravati, whereas proportions
of households showing home consumption as the major reason for the cultivation of
various pulses crops increased with the increase in land holding size of sampled
households of this district.
Contrary to the NFSM district of Amravati, the sampled households belonging to
non-NFSM district of Beed showed profitability as well home consumption as the major
reasons for the cultivation of pulses crops on their farms since 48 per cent of the total
sampled farmers of Beed district favoured profitability as the major cause for cultivation
of pulses crops and another 46 per cent aired their view in favour of cultivation of pulses
for home consumption (Table 6.4 and Table 6.4 (a)). About 4 per cent of sampled
households of Beed district cultivated various pulses crops due to inferior quality of land
and 2 per cent due to lack of irrigation facilities. Interestingly, none of the sampled
households belonging to NFSM district of Amravati and non-NFSM district of Beed
showed animal feed as the reason for the cultivation of pulses crops on their farms.

135
Table 6.4: Reasons for Growing Pulses: Non-NFSM Beed District (No. of Households)
Reasons Total No. of Households % of Total Households
Home Consumption 23 46.00
Animal Feed - -
Inferior Quality of Land 2 4.00
Lack of Irrigation 1 2.00
Profitability 24 48.00
Any Other - -
Total 50 100.00
Table 6.4 (a): Reasons for Growing Pulses: Size-group-wise: Non-NFSM Beed District (No. of Households)
Reasons Household
Category Home
Consumption
Animal
Feed
Inferior Quality
of Land
Lack of
Irrigation
Profitability Any Other Total
Marginal 10 - - 1 3 - 14
Small 6 - 2 - 9 - 17
Medium 5 - - - 8 - 13
Large 2 - - - 4 - 6
All 23 - 2 1 24 - 50
Percentage to Total Farmers in the Size-group
Marginal 71.43 - - 7.14 21.43 - 100.00
Small 35.29 - 11.76 - 52.94 - 100.00
Medium 38.46 - - - 61.54 - 100.00
Large 33.33 - - - 66.67 - 100.00
All 46.00 - 4.00 2.00 48.00 - 100.00
As against the NFSM district of Amravati, the proportions of sampled households
showing profitability as the major reason for the cultivation of various pulses crops
increased with the increase in land holding size of sampled households of non-NFSM
district of Beed, and proportions of households showing home consumption as the major
reason for the cultivation of various pulses crops declined with the increase in land
holding size of sampled households of Beed district.
Thus, while the sampled households of NFSM district of Amravati showed
profitability as the major cause for growing pulses crops on their farms with 72 per cent
of sampled households airing their view in its favour, the reason for the cultivation of
various pulses crops in the non-NFSM district of Beed was found to be both home
consumption and profitability since 48 per cent of the total sampled households of Beed
district favoured profitability as the cause of cultivation of pulses crops and 46 per cent of
households of this district aired their view in favour of home consumption. Among
various categories of households, while the proportions of sampled households showing
profitability as the major reason for the cultivation of various pulses crops declined with
the increase in land holding size of households in Amravati district, a reverse trend was

136
noticed in the non-NFSM district of Beed. Similarly, while the proportion of sampled
households showing home consumption as the major cause for growing pulses crops
declined with the increase in land holding size of sampled households in non-NFSM
district of Beed, a reverse trend was noticed in the case of NFSM district of Amravati.
6.3 Criteria for Pulses Cultivation in NFSM and Non-NFSM Districts
There could be several criteria for the cultivation of pulses crops and important
among them are extent of rainfall, soil suitability, requirements for home consumption,
inferior quality of land, lack of irrigation facilities, etc. These criteria are generally used
while deciding area allocation under pulses crops. The responses of the sampled
households belonging to NFSM district of Amravati and non-NFSM district of Beed were
also sought with respect to the criteria used for the cultivation of pulses crops and these
responses are brought out in Table 6.5 and Table 6.6.
The sampled households drawn from the NFSM district of Amravati used rainfall
followed by soil suitability as the major criteria while allocating area under various
pulses crops cultivation since 68 per cent of the sampled households of this district
favoured rainfall as the criteria in deciding area under pulses crops and 20 per cent
sampled households aired their view in favour of soil suitability as the criteria in this
respect (Table 6.5 and Table 6.5 (a)). However, 6 per cent of total sampled households of
Amravati district aired their view in favour of home consumption, 2 per cent in favour of
inferior quality of land and 4 per cent favoured lack of irrigation as the criteria in
deciding area allocation under pulses crops.
Table 6.5: Criteria Used While Opting to Grow Pulses: NFSM Amravati District
Reasons Total No. of Farmers % of Farmers
Rainfall 34 68.00
Soil suitability 10 20.00
Home requirement 3 6.00
Inferior quality of land 1 2.00
Extent of irrigation 2 4.00
Any Other - -
Total 50 100.00
Among various categories of households, the proportions of households of NFSM
district of Amravati showing rainfall as the main criteria in deciding area allocation under
pulses crops was cent per cent in the case of large category, 60 per cent for marginal
category, 68 per cent for small category and 60 for medium category. The proportion of
sampled households showing soil suitability as the criteria in deciding area allocation
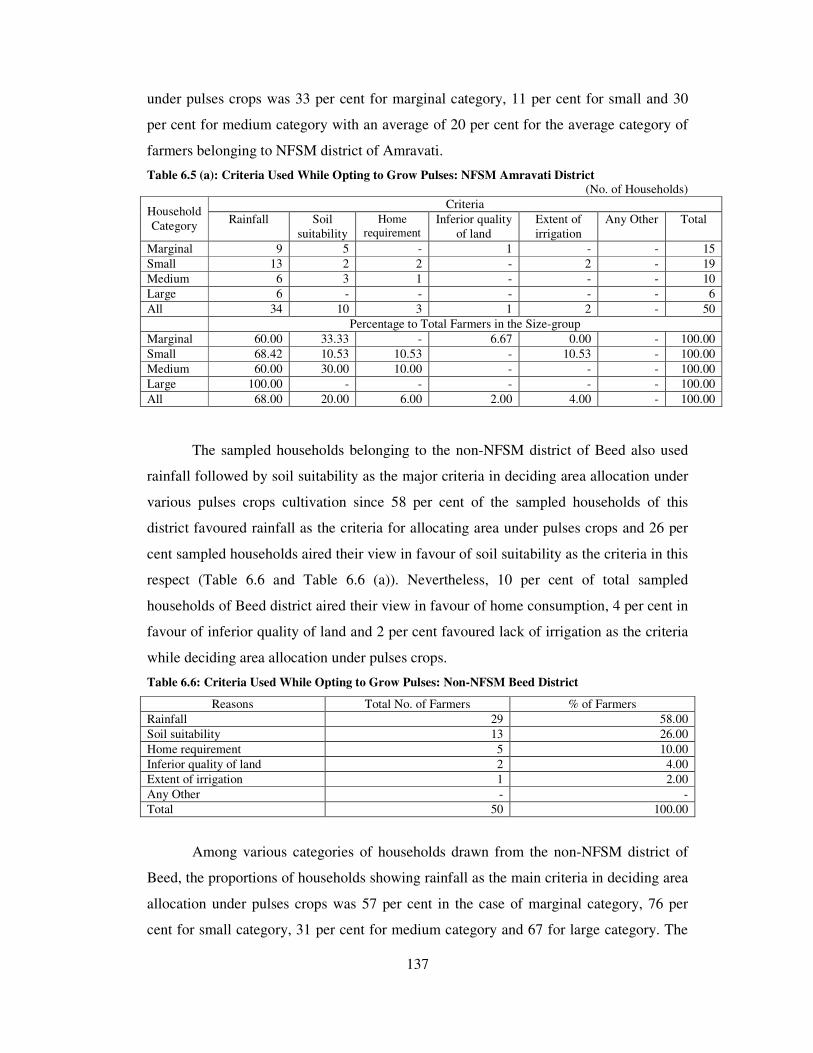
137
under pulses crops was 33 per cent for marginal category, 11 per cent for small and 30
per cent for medium category with an average of 20 per cent for the average category of
farmers belonging to NFSM district of Amravati.
Table 6.5 (a): Criteria Used While Opting to Grow Pulses: NFSM Amravati District
(No. of Households)
Criteria Household
Category Rainfall Soil
suitability
Home
requirement Inferior quality
of land
Extent of
irrigation
Any Other Total
Marginal 9 5 - 1 - - 15
Small 13 2 2 - 2 - 19
Medium 6 3 1 - - - 10
Large 6 - - - - - 6
All 34 10 3 1 2 - 50
Percentage to Total Farmers in the Size-group
Marginal 60.00 33.33 - 6.67 0.00 - 100.00
Small 68.42 10.53 10.53 - 10.53 - 100.00
Medium 60.00 30.00 10.00 - - - 100.00
Large 100.00 - - - - - 100.00
All 68.00 20.00 6.00 2.00 4.00 - 100.00
The sampled households belonging to the non-NFSM district of Beed also used
rainfall followed by soil suitability as the major criteria in deciding area allocation under
various pulses crops cultivation since 58 per cent of the sampled households of this
district favoured rainfall as the criteria for allocating area under pulses crops and 26 per
cent sampled households aired their view in favour of soil suitability as the criteria in this
respect (Table 6.6 and Table 6.6 (a)). Nevertheless, 10 per cent of total sampled
households of Beed district aired their view in favour of home consumption, 4 per cent in
favour of inferior quality of land and 2 per cent favoured lack of irrigation as the criteria
while deciding area allocation under pulses crops.
Table 6.6: Criteria Used While Opting to Grow Pulses: Non-NFSM Beed District
Reasons Total No. of Farmers % of Farmers
Rainfall 29 58.00
Soil suitability 13 26.00
Home requirement 5 10.00
Inferior quality of land 2 4.00
Extent of irrigation 1 2.00
Any Other - -
Total 50 100.00
Among various categories of households drawn from the non-NFSM district of
Beed, the proportions of households showing rainfall as the main criteria in deciding area
allocation under pulses crops was 57 per cent in the case of marginal category, 76 per
cent for small category, 31 per cent for medium category and 67 for large category. The
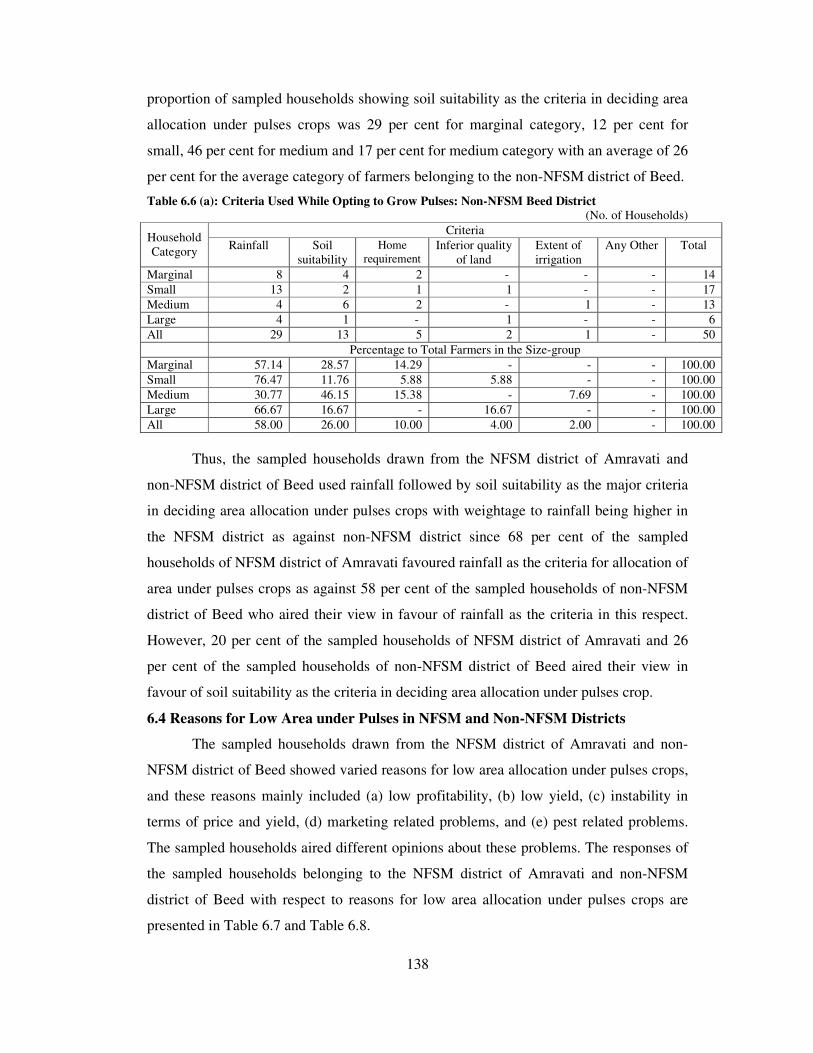
138
proportion of sampled households showing soil suitability as the criteria in deciding area
allocation under pulses crops was 29 per cent for marginal category, 12 per cent for
small, 46 per cent for medium and 17 per cent for medium category with an average of 26
per cent for the average category of farmers belonging to the non-NFSM district of Beed.
Table 6.6 (a): Criteria Used While Opting to Grow Pulses: Non-NFSM Beed District
(No. of Households)
Criteria Household
Category Rainfall Soil
suitability
Home
requirement Inferior quality
of land
Extent of
irrigation
Any Other Total
Marginal 8 4 2 - - - 14
Small 13 2 1 1 - - 17
Medium 4 6 2 - 1 - 13
Large 4 1 - 1 - - 6
All 29 13 5 2 1 - 50
Percentage to Total Farmers in the Size-group
Marginal 57.14 28.57 14.29 - - - 100.00
Small 76.47 11.76 5.88 5.88 - - 100.00
Medium 30.77 46.15 15.38 - 7.69 - 100.00
Large 66.67 16.67 - 16.67 - - 100.00
All 58.00 26.00 10.00 4.00 2.00 - 100.00
Thus, the sampled households drawn from the NFSM district of Amravati and
non-NFSM district of Beed used rainfall followed by soil suitability as the major criteria
in deciding area allocation under pulses crops with weightage to rainfall being higher in
the NFSM district as against non-NFSM district since 68 per cent of the sampled
households of NFSM district of Amravati favoured rainfall as the criteria for allocation of
area under pulses crops as against 58 per cent of the sampled households of non-NFSM
district of Beed who aired their view in favour of rainfall as the criteria in this respect.
However, 20 per cent of the sampled households of NFSM district of Amravati and 26
per cent of the sampled households of non-NFSM district of Beed aired their view in
favour of soil suitability as the criteria in deciding area allocation under pulses crop.
6.4 Reasons for Low Area under Pulses in NFSM and Non-NFSM Districts
The sampled households drawn from the NFSM district of Amravati and non-
NFSM district of Beed showed varied reasons for low area allocation under pulses crops,
and these reasons mainly included (a) low profitability, (b) low yield, (c) instability in
terms of price and yield, (d) marketing related problems, and (e) pest related problems.
The sampled households aired different opinions about these problems. The responses of
the sampled households belonging to the NFSM district of Amravati and non-NFSM
district of Beed with respect to reasons for low area allocation under pulses crops are
presented in Table 6.7 and Table 6.8.

139
In the NFSM district of Amravati, the reported responses of sampled households
were more or less equitably distributed across various reasons for low area allocation
under pulses crops since 28 per cent of sampled households showed yield and price
instability as the major reason for low area under pulses crops cultivation, whereas low
profitability was sighted as the major reason for low area under pulses crops by 22 per
cent of sampled households, pest related problems in this respect by 20 per cent of
sampled households, marketing related problems by 16 per cent of sampled households,
and low yield by 14 per cent of sampled households (Table 6.7 and Table 6.7 (a)).
Table 6.7: Reasons for Low Area under Pulses: NFSM Amravati District
Reasons Total No. of Farmers % of Farmers
Low Profitability 11 22.00
Low Yield 7 14.00
Instability (Yield or Price or Both) 14 28.00
Marketing Problem 8 16.00
Pest Problem 10 20.00
Any Other - -
Total 50 100.00
Table 6.7 (a): Reasons for Low Area under Pulses: Size-group-wise: NFSM Amravati District
(No. of Households) Reasons
Household
Category Low
Profitability
Low
Yield
Instability (Yield
or Price or Both)
Marketing
Problem
Pest
Problem
Any Other Total
Marginal 3 1 6 2 3 - 15
Small 6 - 5 4 4 - 19
Medium 1 3 1 2 3 - 10
Large 1 3 2 - - - 6
All 11 7 14 8 10 - 50
Percentage to Total Farmers in the Size-group
Marginal 20.00 6.67 40.00 13.33 20.00 - 100.00
Small 31.58 - 26.32 21.05 21.05 - 100.00
Medium 10.00 30.00 10.00 20.00 30.00 - 100.00
Large 16.67 50.00 33.33 - - - 100.00
All 22.00 14.00 28.00 16.00 20.00 - 100.00
Among various categories of sampled households of NFSM district of Amravati,
low profitability was shown as the major reason for low area under pulses crops by 20 per
cent households in marginal category, 32 per cent households in small category, 10 per
cent households in medium category and 17 per cent households in large category. The
proportions of households showing low yield as the major reason for low area under
pulses crops was 7 per cent in marginal category, 30 per cent in medium and 50 per cent
in large category. The proportions of households reporting yield and price instability as
the major reason for low area allocation under pulses crops was 40 per cent in marginal
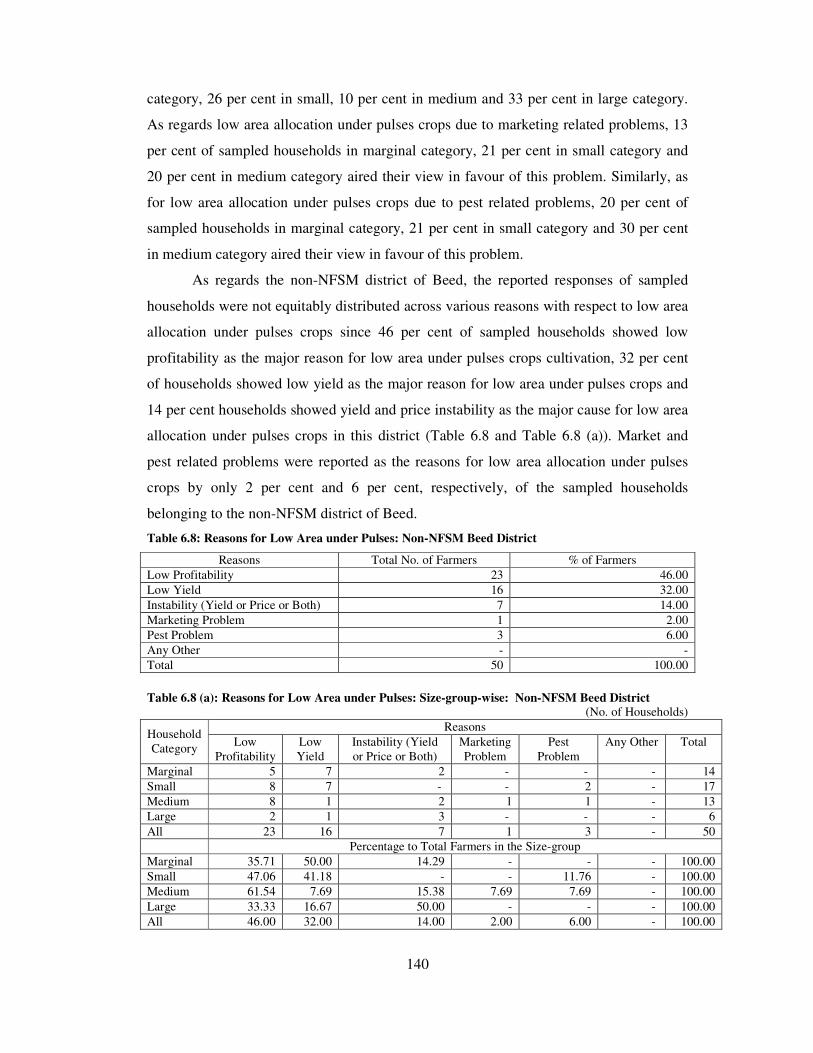
140
category, 26 per cent in small, 10 per cent in medium and 33 per cent in large category.
As regards low area allocation under pulses crops due to marketing related problems, 13
per cent of sampled households in marginal category, 21 per cent in small category and
20 per cent in medium category aired their view in favour of this problem. Similarly, as
for low area allocation under pulses crops due to pest related problems, 20 per cent of
sampled households in marginal category, 21 per cent in small category and 30 per cent
in medium category aired their view in favour of this problem.
As regards the non-NFSM district of Beed, the reported responses of sampled
households were not equitably distributed across various reasons with respect to low area
allocation under pulses crops since 46 per cent of sampled households showed low
profitability as the major reason for low area under pulses crops cultivation, 32 per cent
of households showed low yield as the major reason for low area under pulses crops and
14 per cent households showed yield and price instability as the major cause for low area
allocation under pulses crops in this district (Table 6.8 and Table 6.8 (a)). Market and
pest related problems were reported as the reasons for low area allocation under pulses
crops by only 2 per cent and 6 per cent, respectively, of the sampled households
belonging to the non-NFSM district of Beed.
Table 6.8: Reasons for Low Area under Pulses: Non-NFSM Beed District
Reasons Total No. of Farmers % of Farmers
Low Profitability 23 46.00
Low Yield 16 32.00
Instability (Yield or Price or Both) 7 14.00
Marketing Problem 1 2.00
Pest Problem 3 6.00
Any Other - -
Total 50 100.00
Table 6.8 (a): Reasons for Low Area under Pulses: Size-group-wise: Non-NFSM Beed District
(No. of Households) Reasons
Household
Category Low
Profitability
Low
Yield
Instability (Yield
or Price or Both)
Marketing
Problem
Pest
Problem
Any Other Total
Marginal 5 7 2 - - - 14
Small 8 7 - - 2 - 17
Medium 8 1 2 1 1 - 13
Large 2 1 3 - - - 6
All 23 16 7 1 3 - 50
Percentage to Total Farmers in the Size-group
Marginal 35.71 50.00 14.29 - - - 100.00
Small 47.06 41.18 - - 11.76 - 100.00
Medium 61.54 7.69 15.38 7.69 7.69 - 100.00
Large 33.33 16.67 50.00 - - - 100.00
All 46.00 32.00 14.00 2.00 6.00 - 100.00

141
Among various categories of sampled households belonging to the non-FSM
district of Beed, low profitability was shown as the major reason for low area under
pulses crops by 36 per cent households in marginal category, 47 per cent households in
small category, 62 per cent households in medium category and 33 per cent households in
large category. The proportions of households showing low yield as the major reason for
low area under pulses crops was 50 per cent in marginal category, 41 per cent in small, 8
per cent in medium and 17 per cent in large category. The proportions of households
reporting yield and price instability as the major reason for low area allocation under
pulses crops was 14 per cent in marginal category, 15 per cent in medium and 50 per cent
in large category. As for low area allocation under pulses crops due to marketing related
problems, only 8 per cent of sampled households in medium category aired their view in
favour of this problem. Similarly, as for low area allocation under pulses crops due to
pest related problems, only 12 per cent of sampled households in small category and 8
per cent in medium category aired their view in favour of this problem.
The analysis with respect to reported reasons for low area allocation under pulses
crops revealed that about 28 per cent of the sampled households of NFSM district of
Amravati district opted for low area allocation under pulses crops due to yield and price
instability, 22 per cent due to low profitability, 20 per cent due to pest related problems,
16 per cent due to marketing related problems, and 14 per cent due to low yield related
problem. In the case of non-NFSM district of Beed, about 46 per cent of the total sampled
households opted for low area allocation under pulses crops due to low profitability, 32
per cent due to low levels of yields, 14 per cent due to yield and price instabilities, 2 per
cent due to marketing related problems, and 6 per cent due to pest related problems.
6.5 Crops Grown on Inferior Quality of Lands in NFSM and Non-NFSM Districts
Generally, farmers allocate inferior quality of land in the cultivation of those
crops that do not require much investment but still yield reasonable returns, as they want
to optimize returns from their land resources. These crops could be those that mainly
depend on cultivation under rainfed conditions like vegetable crops, medicinal plants,
aromatic plants, fruits, flowers and sometimes, coarse cereals, superior cereals, pulses
and oilseeds. However, the sampled farmers belonging to the NFSM district of Amravati
and non-NFSM district of Beed were found to cultivate superior cereals, course cereals,
pulses, oilseeds and vegetable crops on their inferior quality of land. The reported
responses of the sampled households of NFSM district of Amravati and non-NFSM

142
district of Beed with respect to the type of crops grown by them on inferior quality of
land are brought out in Table 6.9 and Table 6.10.
In the NFSM district of Amravati, the inferior quality of land was used mainly for
the cultivation of pulses, oilseeds and vegetables since 38 per cent of the sampled
households used inferior quality of land for the cultivation of pulses, 28 per cent used it
for the cultivation of oilseeds and another 28 per cent used this land for the cultivation of
vegetables (Table 6.9 and Table 6.9 (a)). However, about 6 per cent of sampled
households also used inferior quality of land for the cultivation of course cereals.
Table 6.9: Crops Grown on Inferior Quality Lands: Size-group-wise: NFSM Amravati District
Reasons Total No. of Farmers % of Farmers
Superior Cereals - -
Course Cereals 3 6.0
Pulses 19 38.00
Oilseeds 14 28.00
Vegetables 14 28.00
Any Other - -
Total 50 100.00
Table 6.9 (a): Crops Grown on Inferior Quality Lands: Size-group-wise: NFSM Amravati District
(No. of Households) Crops Grown Household
Category Superior Cereals Course Cereals Pulses Oilseeds Vegetables Any Other Total
Marginal - 2 5 2 6 - 15
Small - 1 7 5 6 - 19
Medium - - 4 5 1 - 10
Large - - 3 2 1 - 6
All - 3 19 14 14 - 50
Percentage to Total Farmers in the Size-group
Marginal - 13.33 33.33 13.33 40.00 - 100.00
Small - 5.26 36.84 26.32 31.58 - 100.00
Medium - - 40.00 50.00 10.00 - 100.00
Large - - 50.00 33.33 16.67 - 100.00
All - 6.00 38.00 28.00 28.00 - 100.00
Among various categories, the proportion of households using inferior quality of
land for the cultivation of pulses increased with the increase in land holding size of the
households in the NFSM district of Amravati. Similarly, the proportion of households
using inferior quality of land for the cultivation of oilseeds also increased with the
increase in land holding size of the households in the NFSM district of Amravati with the
exception of large category where the proportion stood lower as compared to medium
category. On the other hand, the proportion of households using inferior quality of land
for the cultivation of vegetables decreased with the increase in land holding size of the
households in the NFSM district of Amravati with the exception of large category where
the proportion stood higher as compared to medium category.

143
In the non-NFSM district of Beed, the inferior quality of land was not only used
for the cultivation of pulses, oilseeds and vegetables but also course cereals and superior
cereals since 40 per cent of the sampled households of this district used inferior quality of
land for the cultivation of pulses, 26 per cent used it for the cultivation of course cereals,
16 per cent used it for the cultivation of vegetables, 10 per cent used it for the cultivation
of superior cereals and only 8 per cent of the sampled households used this land for the
cultivation of oilseeds (Table 6.10 and Table 6.10 (a)).
Table 6.10: Crops Grown on Inferior Quality Lands: Size-group-wise: Non-NFSM Beed District
Reasons Total No. of Farmers % of Farmers
Superior Cereals 5 10.00
Course Cereals 13 26.00
Pulses 20 40.00
Oilseeds 4 8.00
Vegetables 8 16.00
Any Other - -
Total 50 100.00
Table 6.10 (a): Crops Grown on Inferior Quality Lands: Size-group-wise: Non-NFSM Beed District
(No. of Households) Crops Grown Household
Category Superior Cereals Course Cereals Pulses Oilseeds Vegetables Any Other Total
Marginal 1 4 7 1 1 - 14
Small 1 2 7 2 5 - 17
Medium 2 5 4 - 2 - 13
Large 1 2 2 1 - - 6
All 5 13 20 4 8 - 50
Percentage to Total Farmers in the Size-group
Marginal 7.14 28.57 50.00 7.14 7.14 - 100.00
Small 5.88 11.76 41.18 11.76 29.41 - 100.00
Medium 15.38 38.46 30.77 - 15.38 - 100.00
Large 16.67 33.33 33.33 16.67 - - 100.00
All 10.00 26.00 40.00 8.00 16.00 - 100.00
In the non-NFSM district of Beed, the proportion of households using inferior
quality of land for the cultivation of pulses by and large declined with the increase in land
holding size of households, whereas this proportion with respect to superior cereals
increased with the increase in land holding size of households. Further, in the non-NFSM
district of Beed, the proportion of households using inferior quality of land for the
cultivation of course cereals was the highest for medium category and lowest for small
category, and for vegetables this proportion was the highest for small category and lowest
for marginal category. The proportion of households using inferior quality of land for the
cultivation of oilseeds increased with the increase in land holding size of sampled
households of non-NFSM district of Beed.

144
Thus, the sampled households belonging to NFSM district of Amravati mainly
used inferior quality of land for the cultivation of pulses, oilseeds and vegetable crops
since 38 per cent of the sampled households used this land for the cultivation of pulses,
28 per cent used it for the cultivation of oilseeds and another 28 per cent used this land
for the cultivation of vegetables. On the other hand, the inferior quality of land in non-
NFSM district of Beed was chiefly used for the cultivation of pulses, coarse cereals,
vegetables, oilseeds and also superior cereals since 40 per cent of the sampled households
of Beed district used inferior quality of land for the cultivation of pulses, 26 per cent used
it for the cultivation of course cereals, 16 per cent used it for the cultivation of vegetables,
10 per cent used it for the cultivation of superior cereals and 8 per cent used it for the
cultivation of oilseeds.
6.6 Problems with Pulses on Inferior Quality of Lands in NFSM and Non-NFSM Districts
The cultivation of pulses crops on inferior quality of land generally results in
either low yield or poor quality of grain or both low yield and poor quality of grain. The
reported responses of the sampled households drawn from the NFSM district of Amravati
and non-NFSM district of Beed with respect to problems faced by them in the cultivation
of pulses crops on inferior quality of land are presented in Table 6.11 and Table 6.12.
Majority of the sampled households belonging to the NFSM district of Amravati
had reported low yield and both poor quality of grain and low yield as the major
problems faced by them in the cultivation of pulses crops on inferior quality of land. The
proportion of sampled households to the total sampled households of Amravati district
reporting low yield as the major problem in the cultivation of pulses crops on inferior
quality of land was 47 per cent, whereas 34 per cent of the sampled households of this
district showed both poor grain quality and low yield as the major problem faced by them
in the cultivation of pulses crops on inferior quality of land (Table 6.11 and Table 6.11
(a)). About 18 per cent of the sampled households of NFSM district of Amravati aired
their view in favour of poor quality of grain as the major problem in the cultivation of
pulses crops on inferior quality of land.
Table 6.11: Problems of Growing Pulses on Inferior Quality Land : NFSM Amravati District
Reasons Total No. of Farmers % of Farmers
Yield is Low 18 47.37
Grain Quality is Poor 7 18.42
Both 1 and 2 13 34.21
Total 38 100.00
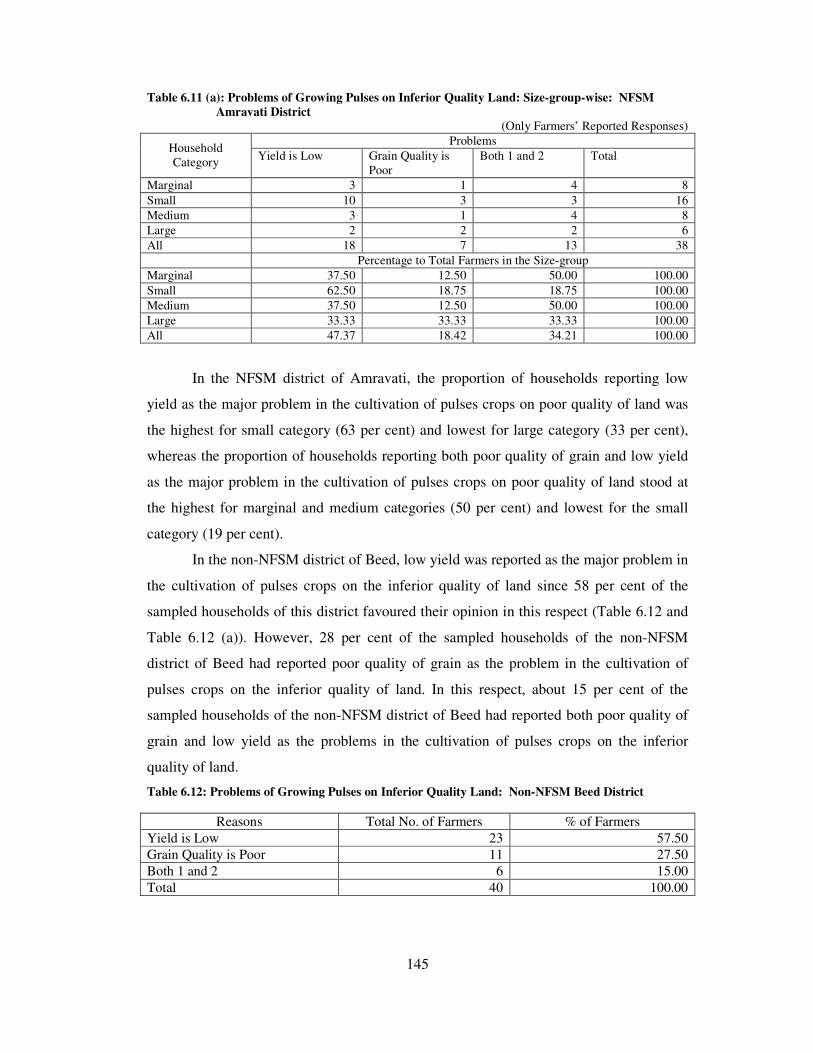
145
Table 6.11 (a): Problems of Growing Pulses on Inferior Quality Land: Size-group-wise: NFSM
Amravati District (Only Farmers’ Reported Responses)
Problems Household
Category Yield is Low Grain Quality is
Poor
Both 1 and 2 Total
Marginal 3 1 4 8
Small 10 3 3 16
Medium 3 1 4 8
Large 2 2 2 6
All 18 7 13 38
Percentage to Total Farmers in the Size-group
Marginal 37.50 12.50 50.00 100.00
Small 62.50 18.75 18.75 100.00
Medium 37.50 12.50 50.00 100.00
Large 33.33 33.33 33.33 100.00
All 47.37 18.42 34.21 100.00
In the NFSM district of Amravati, the proportion of households reporting low
yield as the major problem in the cultivation of pulses crops on poor quality of land was
the highest for small category (63 per cent) and lowest for large category (33 per cent),
whereas the proportion of households reporting both poor quality of grain and low yield
as the major problem in the cultivation of pulses crops on poor quality of land stood at
the highest for marginal and medium categories (50 per cent) and lowest for the small
category (19 per cent).
In the non-NFSM district of Beed, low yield was reported as the major problem in
the cultivation of pulses crops on the inferior quality of land since 58 per cent of the
sampled households of this district favoured their opinion in this respect (Table 6.12 and
Table 6.12 (a)). However, 28 per cent of the sampled households of the non-NFSM
district of Beed had reported poor quality of grain as the problem in the cultivation of
pulses crops on the inferior quality of land. In this respect, about 15 per cent of the
sampled households of the non-NFSM district of Beed had reported both poor quality of
grain and low yield as the problems in the cultivation of pulses crops on the inferior
quality of land.
Table 6.12: Problems of Growing Pulses on Inferior Quality Land: Non-NFSM Beed District
Reasons Total No. of Farmers % of Farmers
Yield is Low 23 57.50
Grain Quality is Poor 11 27.50
Both 1 and 2 6 15.00
Total 40 100.00
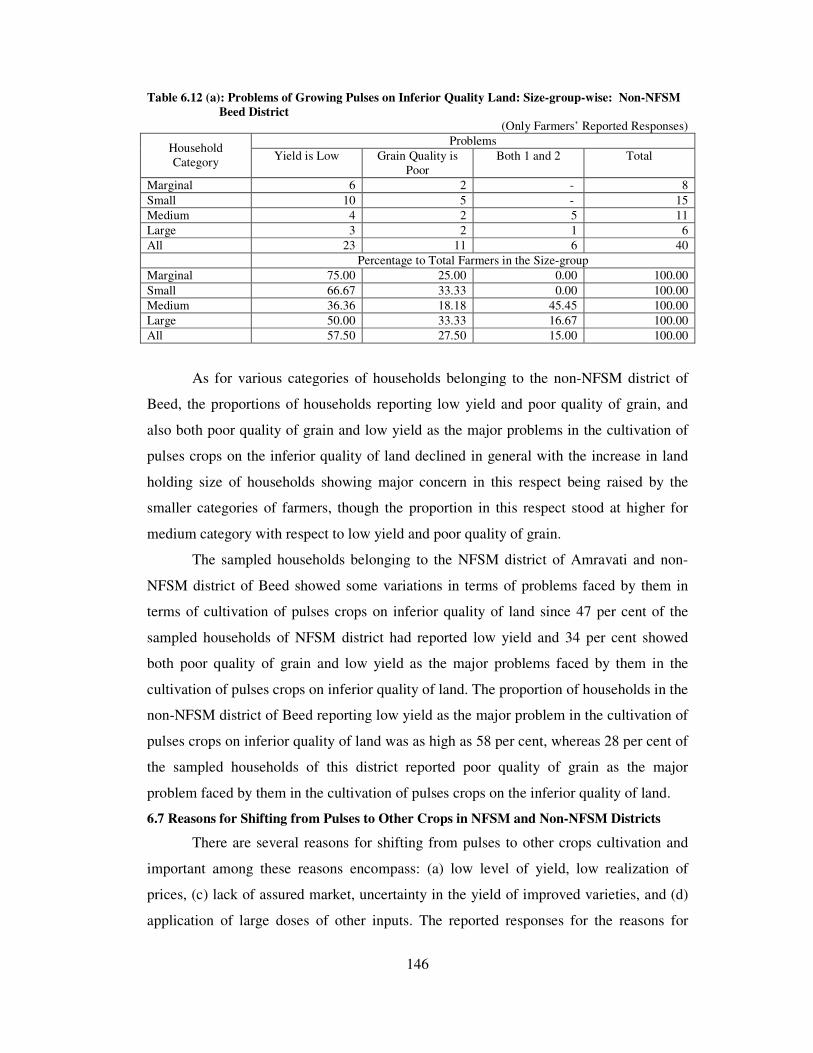
146
Table 6.12 (a): Problems of Growing Pulses on Inferior Quality Land: Size-group-wise: Non-NFSM
Beed District (Only Farmers’ Reported Responses)
Problems Household
Category Yield is Low Grain Quality is
Poor
Both 1 and 2 Total
Marginal 6 2 - 8
Small 10 5 - 15
Medium 4 2 5 11
Large 3 2 1 6
All 23 11 6 40
Percentage to Total Farmers in the Size-group
Marginal 75.00 25.00 0.00 100.00
Small 66.67 33.33 0.00 100.00
Medium 36.36 18.18 45.45 100.00
Large 50.00 33.33 16.67 100.00
All 57.50 27.50 15.00 100.00
As for various categories of households belonging to the non-NFSM district of
Beed, the proportions of households reporting low yield and poor quality of grain, and
also both poor quality of grain and low yield as the major problems in the cultivation of
pulses crops on the inferior quality of land declined in general with the increase in land
holding size of households showing major concern in this respect being raised by the
smaller categories of farmers, though the proportion in this respect stood at higher for
medium category with respect to low yield and poor quality of grain.
The sampled households belonging to the NFSM district of Amravati and non-
NFSM district of Beed showed some variations in terms of problems faced by them in
terms of cultivation of pulses crops on inferior quality of land since 47 per cent of the
sampled households of NFSM district had reported low yield and 34 per cent showed
both poor quality of grain and low yield as the major problems faced by them in the
cultivation of pulses crops on inferior quality of land. The proportion of households in the
non-NFSM district of Beed reporting low yield as the major problem in the cultivation of
pulses crops on inferior quality of land was as high as 58 per cent, whereas 28 per cent of
the sampled households of this district reported poor quality of grain as the major
problem faced by them in the cultivation of pulses crops on the inferior quality of land.
6.7 Reasons for Shifting from Pulses to Other Crops in NFSM and Non-NFSM Districts
There are several reasons for shifting from pulses to other crops cultivation and
important among these reasons encompass: (a) low level of yield, low realization of
prices, (c) lack of assured market, uncertainty in the yield of improved varieties, and (d)
application of large doses of other inputs. The reported responses for the reasons for
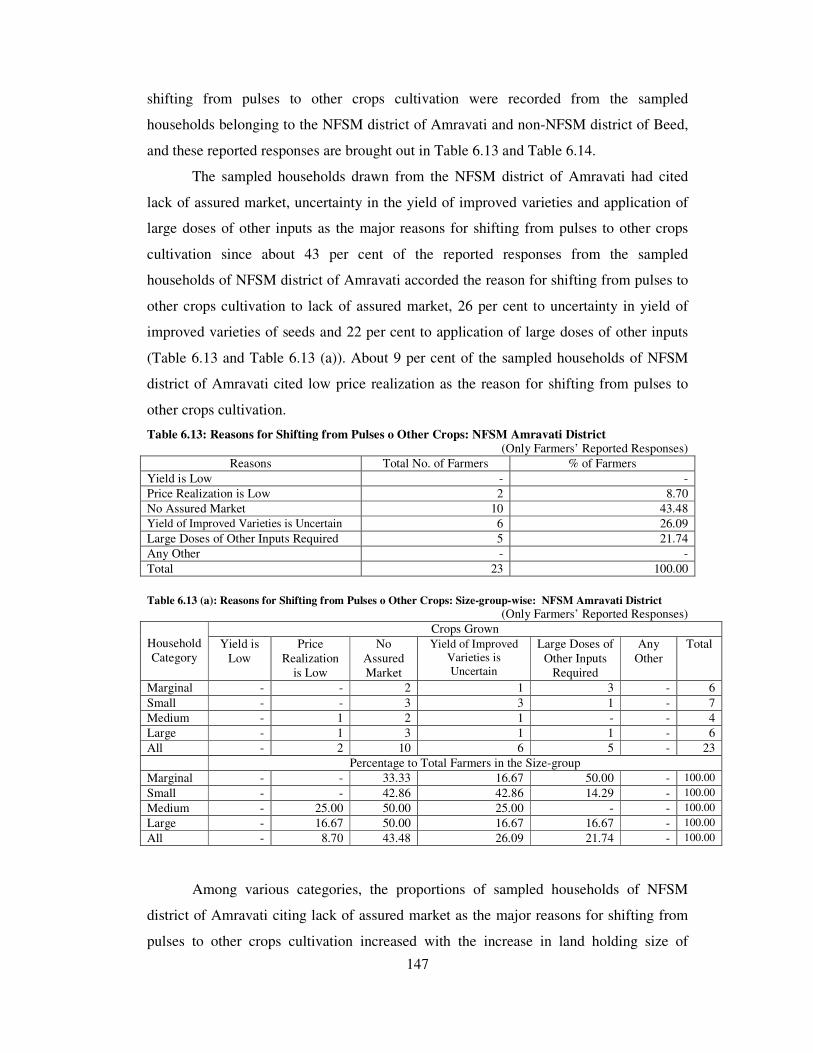
147
shifting from pulses to other crops cultivation were recorded from the sampled
households belonging to the NFSM district of Amravati and non-NFSM district of Beed,
and these reported responses are brought out in Table 6.13 and Table 6.14.
The sampled households drawn from the NFSM district of Amravati had cited
lack of assured market, uncertainty in the yield of improved varieties and application of
large doses of other inputs as the major reasons for shifting from pulses to other crops
cultivation since about 43 per cent of the reported responses from the sampled
households of NFSM district of Amravati accorded the reason for shifting from pulses to
other crops cultivation to lack of assured market, 26 per cent to uncertainty in yield of
improved varieties of seeds and 22 per cent to application of large doses of other inputs
(Table 6.13 and Table 6.13 (a)). About 9 per cent of the sampled households of NFSM
district of Amravati cited low price realization as the reason for shifting from pulses to
other crops cultivation.
Table 6.13: Reasons for Shifting from Pulses o Other Crops: NFSM Amravati District (Only Farmers’ Reported Responses)
Reasons Total No. of Farmers % of Farmers
Yield is Low - -
Price Realization is Low 2 8.70
No Assured Market 10 43.48
Yield of Improved Varieties is Uncertain 6 26.09
Large Doses of Other Inputs Required 5 21.74
Any Other - -
Total 23 100.00
Table 6.13 (a): Reasons for Shifting from Pulses o Other Crops: Size-group-wise: NFSM Amravati District
(Only Farmers’ Reported Responses) Crops Grown
Household
Category Yield is
Low
Price
Realization
is Low
No
Assured
Market
Yield of Improved
Varieties is
Uncertain
Large Doses of
Other Inputs
Required
Any
Other
Total
Marginal - - 2 1 3 - 6
Small - - 3 3 1 - 7
Medium - 1 2 1 - - 4
Large - 1 3 1 1 - 6
All - 2 10 6 5 - 23
Percentage to Total Farmers in the Size-group
Marginal - - 33.33 16.67 50.00 - 100.00
Small - - 42.86 42.86 14.29 - 100.00
Medium - 25.00 50.00 25.00 - - 100.00
Large - 16.67 50.00 16.67 16.67 - 100.00
All - 8.70 43.48 26.09 21.74 - 100.00
Among various categories, the proportions of sampled households of NFSM
district of Amravati citing lack of assured market as the major reasons for shifting from
pulses to other crops cultivation increased with the increase in land holding size of
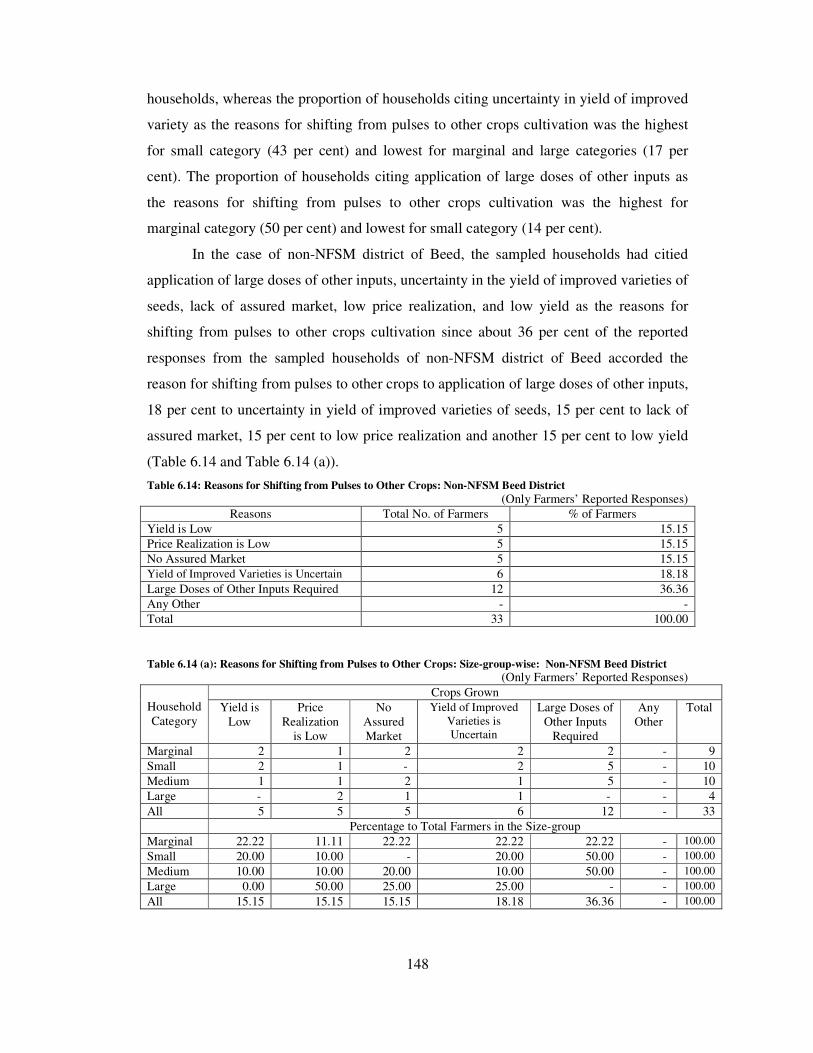
148
households, whereas the proportion of households citing uncertainty in yield of improved
variety as the reasons for shifting from pulses to other crops cultivation was the highest
for small category (43 per cent) and lowest for marginal and large categories (17 per
cent). The proportion of households citing application of large doses of other inputs as
the reasons for shifting from pulses to other crops cultivation was the highest for
marginal category (50 per cent) and lowest for small category (14 per cent).
In the case of non-NFSM district of Beed, the sampled households had citied
application of large doses of other inputs, uncertainty in the yield of improved varieties of
seeds, lack of assured market, low price realization, and low yield as the reasons for
shifting from pulses to other crops cultivation since about 36 per cent of the reported
responses from the sampled households of non-NFSM district of Beed accorded the
reason for shifting from pulses to other crops to application of large doses of other inputs,
18 per cent to uncertainty in yield of improved varieties of seeds, 15 per cent to lack of
assured market, 15 per cent to low price realization and another 15 per cent to low yield
(Table 6.14 and Table 6.14 (a)).
Table 6.14: Reasons for Shifting from Pulses to Other Crops: Non-NFSM Beed District
(Only Farmers’ Reported Responses) Reasons Total No. of Farmers % of Farmers
Yield is Low 5 15.15
Price Realization is Low 5 15.15
No Assured Market 5 15.15
Yield of Improved Varieties is Uncertain 6 18.18
Large Doses of Other Inputs Required 12 36.36
Any Other - -
Total 33 100.00
Table 6.14 (a): Reasons for Shifting from Pulses to Other Crops: Size-group-wise: Non-NFSM Beed District
(Only Farmers’ Reported Responses) Crops Grown
Household
Category Yield is
Low
Price
Realization
is Low
No
Assured
Market
Yield of Improved
Varieties is
Uncertain
Large Doses of
Other Inputs
Required
Any
Other
Total
Marginal 2 1 2 2 2 - 9
Small 2 1 - 2 5 - 10
Medium 1 1 2 1 5 - 10
Large - 2 1 1 - - 4
All 5 5 5 6 12 - 33
Percentage to Total Farmers in the Size-group
Marginal 22.22 11.11 22.22 22.22 22.22 - 100.00
Small 20.00 10.00 - 20.00 50.00 - 100.00
Medium 10.00 10.00 20.00 10.00 50.00 - 100.00
Large 0.00 50.00 25.00 25.00 - - 100.00
All 15.15 15.15 15.15 18.18 36.36 - 100.00
149
Among various categories, the proportions of sampled households of non-NFSM
district of Beed citing application of large doses of other inputs as the major reasons for
shifting from pulses to other crops cultivation increased with the increase in land holding
size of households, whereas the proportion of households citing low yield as the reason
for shifting from pulses to other crops cultivation declined with the increase in land
holding size of sampled households. The proportion of households citing uncertainty in
yield of improved varieties of seeds as the reason for shifting from pulses to other crops
cultivation was the highest for large category (25 per cent) and lowest for medium
category (10 per cent). The proportion of households citing low price realization as the
reason for shifting from pulses to other crops cultivation was the highest for large
category (50 per cent) and lowest for small and medium category (10 per cent). Similarly,
the proportion of households citing lack of assured market as the reason for shifting from
pulses to other crops cultivation was the highest for large category (25 per cent) and
lowest for medium category (20 per cent).
The foregoing observations revealed that while the reported responses of the
sampled households belonging to the NFSM district of Amravati with respect to reasons
for shifting from pulses to other crops were mainly confined to lack of assured market,
uncertainty in the yield of improved varieties of seeds and application of large doses of
other inputs, the sampled households of non-NFSM district of Beed had reported
application of large doses of other inputs, uncertainty in the yield of improved varieties of
seeds, lack of assured market, low price realization, and low yield as the reasons for
shifting from pulses to other crops cultivation. However, a couple of sampled households
of NFSM district of Amravati had also cited low price realization as the reason for
shifting from pulses to other crops cultivation.
6.8 Farmers Willingness to Grow Pulses in NFSM and Non-NFSM Districts
The perceptions of the sampled farmers drawn from the NFSM district of
Amravati and non-NFSM district of Beed were also ascertained with respect to their
willingness to grow pulses if assured market is provided, and these reported responses
have been presented in Table 6.15 and 6.16.
In the NFSM district of Amravati, the proportion of sampled households willing
to grow pulses under assured market conditions was found to be 93 per cent for marginal
category, 95 per cent for small, 100 per cent for medium and 100 per cent for large
category with an average of 96 per cent for the average category of farmers (Table 6.15).

150
Table 6.15: Farmers Willing to Grow Pulses if Assured Market is Provided: NFSM Amravati District
Household
Category No. of Farmers Willing
Total No. of Farmers in
the Size-group % of Farmers Willing
Marginal 14 15 93.33
Small 18 19 94.74
Medium 10 10 100.00
Large 6 6 100.00
All 48 50 96.00
Table 6.16: Farmers Willing to Grow Pulses if Assured Market is Provided: Non-NFSM Beed District
Household
Category No. of Farmers Willing
Total No. of Farmers in
the Size-group % of Farmers Willing
Marginal 13 14 92.86
Small 17 17 100.00
Medium 11 13 84.62
Large 6 6 100.00
All 47 50 94.00
As for the non-NFSM district of Beed, the proportion of sampled households
willing to grow pulses under assured market conditions was estimated at 93 per cent for
marginal category, 100 per cent for small, 85 per cent for medium and 100 per cent for
large category with an average of 94 per cent for the average category, showing cent per
cent proportion in this respect for small and large categories (Table 6.16).
A comparative analysis between the sampled farmers drawn from the NFSM
district of Amravati and non-NFSM district of Beed revealed that while all the medium
and large categories of sampled farmers of NFSM district of Amravati were willing to
grow pulses under assured market conditions, this willingness was cent per cent in the
case of small and large categories of sampled farmers in the case of non-NFSM district of
Beed. In general, about 96 per cent of the sampled farmers of the NFSM district of
Amravati were willing to grow pulses under assured market condition, whereas this
proportion for non-NFSM district of Beed stood at 94 per cent.
6.9 Major Problems in Cultivating Pulses in NFSM and Non-NFSM Districts
The sampled farmers were noticed to face several problems in the cultivation of
pulse crops and these problems mainly encompassed: (a) lack of irrigation facilities, (b)
lack of improved varieties, (c) lower yields, (d) incidence of high pests, (e) low market
price, (f) lack of assured market, and (g) provision of extension services. Perceptions of
the sampled farmers drawn from the NFSM district of Amravati and non-NFSM district
of Beed were, therefore, sought with respect to the problems faced by them in the
cultivation of pulse crops, and these perceptions were ranked from 1 to 7. The reported

151
perceptions with respect to major problems faced by the sampled farmers in the
cultivation various pulses crops and their ranking in this respect are brought out in Table
6.17 and Table 6.18 with all the categories of sampled farmers put together. The
household category-wise and reported perceptions in terms of problems faced by the
sampled farmers of NFSM district of Amravati and non-NFSM district of Beed and their
ranking in this respect are provided in Appendix 15 and 16.
In the NFSM district of Amravati, the problem relating to lack of irrigation
facilities was assigned 1st ranking by 48 per cent of sampled households, 2
nd ranking by
19 per cent of sampled households, and 3rd
ranking by 21 per cent of sampled
households. Lack of improved varieties of seeds was another problem in the cultivation
of pulse crops, which was assigned 1st ranking by 12 per cent of sampled households, 2
nd
ranking by 15 per cent of sampled households, 3rd
ranking by 24 per cent of sampled
households, 4th
ranking by 26 per cent of sampled households, and 5th
ranking by 15 per
cent of sampled households (Table 6.17 and Table 6.17 (a)). The problem relating to low
yield was assigned 1st ranking by 16 per cent of sampled households, 2
nd ranking by 34
per cent of sampled households, 3rd
ranking by 16 per cent of sampled households, and
4th
ranking by 18 per cent of sampled households. Another major problem in the
cultivation of pulses was low market prices, which was assigned 1st ranking by 27 per
cent of sampled households, 2nd
ranking by 16 per cent of sampled households, 3rd
ranking by 19 per cent of sampled households, and 5th
ranking by 22 per cent of sampled
households of NFSM district of Amravati.
Table 6.17: Major Problems in Cultivating Pulses: NFSM Amravati District
Problem Rank 1 Rank 2 Rank 3 Rank 4 Rank 5 Rank 6 Rank 7 Total
Lack of irrigation facilities 23 9 10 4 1 1 - 48
Lack of improved varieties 4 5 8 9 5 3 - 34
Lower yield 6 13 6 7 4 2 - 38
High pest incidence 5 11 9 8 12 2 - 47
Low market price 10 6 7 2 8 4 - 37
No assured market/procurement 1 5 7 6 4 19 - 42
Any other (Extension service) - - - - - - 2 2
Total 49 49 47 36 34 31 2 248
Table 6.17 (a): % Distribution of Major Problems in Cultivating Pulses: NFSM Amravati District
Problem Rank 1 Rank 2 Rank 3 Rank 4 Rank 5 Rank 6 Rank 7 Total
Lack of irrigation facilities 47.92 18.75 20.83 8.33 2.08 2.08 - 100.00
Lack of improved varieties 11.76 14.71 23.53 26.47 14.71 8.82 - 100.00
Lower yield 15.79 34.21 15.79 18.42 10.53 5.26 - 100.00
High pest incidence 10.64 23.40 19.15 17.02 25.53 4.26 - 100.00
Low market price 27.03 16.22 18.92 5.41 21.62 10.81 - 100.00
No assured market/procurement 2.38 11.90 16.67 14.29 9.52 45.24 - 100.00
Any other (Extension service) - - - - - - 100.00 100.00
Total 19.76 19.76 18.95 14.52 13.71 12.50 0.81 100.00

152
As for the non-NFSM district of Beed, the major problem in the cultivation of
pulse crops was lack of irrigation facilities, which was assigned 1st ranking by 22 per cent
of sampled households, 2nd
ranking by 42 per cent of sampled households, and 4th
ranking by 14 per cent of sampled households. Lack of improved varieties of seeds was
another problem in the cultivation of pulse crops, which was assigned 1st ranking by 22
per cent of sampled households, 3rd
ranking by 30 per cent of sampled households, and
4th
ranking by 26 per cent of sampled households (Table 6.18 and Table 6.18 (a)). Lower
level of yield was identified as the third problem in the cultivation of pulse crops in non-
NFSM district of Beed, which was assigned 1st ranking by 18 per cent of sampled
households, 2nd
ranking by another 18 per cent of sampled households, 3rd
ranking by 24
per cent of sampled households, and 4th
ranking by another 24 per cent of sampled
households. Low market price was cited as another problem in the cultivation of pulse
crops, which got 1st ranking by 28 per cent of sampled households and 5
th ranking by 32
per cent of sampled households.
Table 6.18: Major Problems in Cultivating Pulses: Non-NFSM Beed District
Problem Rank 1 Rank 2 Rank 3 Rank 4 Rank 5 Rank 6 Rank 7 Total
Lack of irrigation facilities 11 21 5 7 6 - - 50
Lack of improved varieties 11 6 15 13 4 1 - 50
Lower yield 9 9 12 12 7 1 - 50
High pest incidence 6 5 10 15 12 2 - 50
Low market price 14 4 7 3 16 6 - 50
No assured market/procurement 1 5 1 - 3 40 - 50
Any other (Extension service) - - - - - - - -
Total 50 50 50 50 50 50 - 300
Table 6.18 (a): % Distribution of Major Problems in Cultivating Pulses: Non-NFSM Beed District
Problem Rank 1 Rank 2 Rank 3 Rank 4 Rank 5 Rank 6 Rank 7 Total
Lack of irrigation facilities 22.00 42.00 10.00 14.00 12.00 - - 100.00
Lack of improved varieties 22.00 12.00 30.00 26.00 8.00 2.00 - 100.00
Lower yield 18.00 18.00 24.00 24.00 14.00 2.00 - 100.00
High pest incidence 12.00 10.00 20.00 30.00 24.00 4.00 - 100.00
Low market price 28.00 8.00 14.00 6.00 32.00 12.00 - 100.00
No assured market/procurement 2.00 10.00 2.00 - 6.00 80.00 - 100.00
Any other (Extension service) - - - - - - - -
Total 16.67 16.67 16.67 16.67 16.67 16.67 - 100.00
A comparative analysis between NFSM district of Amravati and non-NFSM
district of Beed with respect to the problems faced by the households in the cultivation of
pulse crops revealed that lack of irrigation facilities, lower yield and lower market prices
were the major problems faced by the sampled households belonging to the NFSM
district of Amravati, whereas sampled farmers of non-NFSM district of Beed showed
153
lack of irrigation, lack of improved varieties of seeds, lower yields and low market prices
as the major problems faced by them in the cultivation of pulse crops on their farms.
High incidence of pest was another major problem faced by the sampled households
belonging to the non-NFSM district of Beed.
6.10 Important Suggestion for Cultivating Pulses in NFSM and Non-NFSM Districts
In order to augment pulse production, the sampled farmers belonging to NFSM
district of Amravati and non-NFSM district of Beed aired their own suggestion, which
included:(a) improvement in irrigation facilities, (b) availability of high yielding varieties
of seeds, (c) availability of pest resistance varieties of seeds, (d) assured procurement
with MSP, (e) higher market price and (f) provision of extension services. Perceptions of
the sampled farmers drawn from the NFSM district of Amravati and non-NFSM district
of Beed with respect to the suggestions extended by them for the cultivation of pulse
crops along with ranking of various suggestions are brought out in Table 6.19 and Table
6.20 with all the categories of sampled farmers put together. The household category-
wise and reported perceptions in terms of suggestions extended by the sampled
households of NFSM district of Amravati and non-NFSM district of Beed and their
ranking in this respect are provided in Appendix 17 and 18.
In the NFSM district of Amravati, the major suggestion was with respect to
improvement in irrigation facilities since this suggestion received 1st ranking from 51 per
cent of sampled households, 2nd
ranking from 12 per cent of sampled households, and 3rd
ranking from 29 per cent of sampled households (Table 6.19 and Table 6.19 (a)).
Availability of high yielding varieties of seeds was another suggestion put forward by the
sampled farmers of NFSM district of Amravati and this suggestion received 1st ranking
from 20 per cent of sampled households, 2nd
ranking from 55 per cent of sampled
households and 3rd
ranking from 11 per cent of sampled households. Further, availability
of pest resistant varieties of seeds was also a suggestion put forward by the sampled
households and this suggestion received 2nd
ranking from 21 per cent of sampled
households, 3rd
ranking from 28 per cent of sampled households and 4th
ranking from
another 28 per cent of sampled households. Interestingly, higher market price for pulse
crops was supported by 25 per cent of the sampled households who assigned 1st ranking
to this suggestion. Similarly, provision of better extension services was supported by 50
per cent of the sampled households of NFSM district of Amravati who assigned 1st
ranking to this suggestion.

154
Table 6.19: Important Suggestions from the Farmers for Cultivating Pulses: NFSM Amravati District
Suggestions Rank 1 Rank 2 Rank 3 Rank 4 Rank 5 Rank 6 Total
Improving irrigation facilities 25 6 14 2 2 - 49
Availability of high yielding varieties 9 24 5 6 - - 44
Availability of pest resistant varieties 2 9 12 12 8 - 43
Assured procurement with MSP 1 4 8 15 15 - 43
Higher market price 12 7 9 7 12 1 48
Any other (Providing extension service) 1 - - - - 1 2
Total 50 50 48 42 37 2 229
Table 6.19 (a): % Distribution of Important Suggestions from the Farmers for Cultivating Pulses:
NFSM Amravati District
Suggestions Rank 1 Rank 2 Rank 3 Rank 4 Rank 5 Rank 6 Total Improving irrigation facilities 51.02 12.24 28.57 4.08 4.08 - 100.00
Availability of high yielding varieties 20.45 54.55 11.36 13.64 0.00 - 100.00
Availability of pest resistant varieties 4.65 20.93 27.91 27.91 18.60 - 100.00
Assured procurement with MSP 2.33 9.30 18.60 34.88 34.88 - 100.00
Higher market price 25.00 14.58 18.75 14.58 25.00 2.08 100.00
Any other (Providing extension service) 50.00 - - - - 50.00 100.00
Total 21.83 21.83 20.96 18.34 16.16 0.87 100.00
As for the non-NFSM district of Beed, the major suggestion was again in terms of
improvement in irrigation facilities since this suggestion received 1st ranking from 40 per
cent of the sampled households, 2nd
ranking from 28 per cent of the sampled households,
and 3rd
ranking from 18 per cent of sampled households (Table 6.20 and Table 6.20 (a)).
Availability of high yielding varieties of seeds was yet another suggestion put forward by
the sampled farmers of non-NFSM district of Beed and this suggestion received 1st
ranking from 16 per cent of the sampled households, 2nd
ranking from 26 per cent of the
sampled households, 3rd
ranking from 24 per cent of the sampled households and 4th
ranking from 26 per cent of the sampled households. The sampled households of non-
NFSM district of Beed also favoured availability of pest resistant varieties of seeds and
this suggestion received 2nd
ranking from 30 per cent of the sampled households, 3rd
ranking from 32 per cent of sampled households and 4th
ranking from another 20 per cent
of the sampled households. Availability of higher market price for pulse crops was
favoured by 38 per cent of the sampled households of non-NFSM district of Beed who
assigned 1st ranking to this suggestion.
Table 6.20: Important Suggestions from the Farmers for Cultivating Pulses: Non-NFSM Beed District
Suggestions Rank 1 Rank 2 Rank 3 Rank 4 Rank 5 Rank 6 Total
Improving irrigation facilities 20 14 9 5 2 - 50
Availability of high yielding varieties 8 13 12 13 4 - 50
Availability of pest resistant varieties 3 15 16 10 6 - 50
Assured procurement with MSP - 7 7 16 20 - 50
Higher market price 19 1 6 6 18 - 50
Any other (Providing extension service) - - - - - - -
Total 50 50 50 50 50 - 250

155
Table 6.20 (a): % Distribution of Important Suggestions from the Farmers for Cultivating Pulses:
Non-NFSM Beed District
Suggestions Rank 1 Rank 2 Rank 3 Rank 4 Rank 5 Rank 6 Total
Improving irrigation facilities 40.00 28.00 18.00 10.00 4.00 - 100.00
Availability of high yielding varieties 16.00 26.00 24.00 26.00 8.00 - 100.00
Availability of pest resistant varieties 6.00 30.00 32.00 20.00 12.00 - 100.00
Assured procurement with MSP - 14.00 14.00 32.00 40.00 - 100.00
Higher market price 38.00 2.00 12.00 12.00 36.00 - 100.00
Any other (Providing extension service) - - - - - - -
Total 20.00 20.00 20.00 20.00 20.00 - 100.00
The major suggestion of the sampled households belonging to the NFSM district
of Amravati and non-NFSM district of Beed with respect to pulse crops cultivation
mainly revolved around improvement in the existing irrigation facilities, availability of
high yielding varieties of seeds, availability of pest resistant varieties of seeds and
provision of higher market prices for various pulse crops since all these suggestions were
assigned 1st, 2
nd or 3
rd ranking by majority of the sampled households belonging to both
NFSM district of Amravati and non-NFSM district of Beed. Interestingly, 50 per cent of
the sampled households drawn from the NFSM district of Amravati aired their view in
favour of availability of better extension services as these households assigned 1st ranking
to this suggestion, though another 50 per cent of the sampled households of this district
assigned 6th
ranking to this suggestion.
************

156
CHAPTER – VII
IMPACT OF NFSM-PULSES ON PULSE PRODUCTION
This chapter mainly evaluates the impact of National Food Security Mission
(NFSM) on pulse crop production in the NFSM district of Amravati of Maharashtra. In
order to evaluate the impact of NFSM programme on pulse crop production, responses of
the sampled households belonging to the NFSM district of Amravati have been assessed
with respect to their awareness of NFSM for pulses, assistance received and the type of
assistance, usefulness of the assistance, area allocation under pulse crops before and after
NFSM programme, production of pulses crops before and after NFSM programme,
increase in area under pulses after NFSM programme, extent of increase in area under
pulse crops, and their major suggestions for improving NFSM-Pulses programme.
7.1 Farmers’ Awareness of NFSM-Pulses
The responses of various categories of sampled farmers drawn from the NFSM
district of Amravati in terms of their awareness about the NFSM programme for pulse
crops are brought out in Table 7.1.
Table 7.1: Farmers’ Awareness of NFSM – Pulses: NFSM Amravati District
Household
Category
No. of Households Aware Total No. of Households in
the Size-group
% of Household Aware
Marginal 10 15 66.67
Small 16 19 84.21
Medium 7 10 70.00
Large 5 6 83.33
All 38 50 76.00
Although NFSM programme has been initiated in India a few years ago, the
sampled farmers belonging to the NFSM district of Amravati were quite aware of this
programme since 76 per cent of the total sampled farmers of this district aired their view
in favour of their awareness of the programme and this proportion among various
categories stood at 67 per cent in marginal category, 84 per cent in small, 70 per cent in
medium and 83 per cent in large category with an average of 76 per cent for the average
category of farmers of the NFSM district of Amravati. Thus, large and small categories of
sampled farmers showed higher proportion as against marginal and medium category in
terms of their awareness of the programme.

157
7.2 Assistance Received under NFSM-Pulses
At the time of survey, various categories of sampled households belonging to the
NFSM district of Amravati were asked to indicate as to whether they received any
assistance under NFSM-pulses programme, and the responses in this respect received
from the sampled farmers are shown in Table 7.2.
Table 7.2: Received any Assistance Under NFSM – Pulses: NFSM Amravati District
Household
Category
No. of Households
Received Assistance
Total No. of Households in
the Size-group
% of Household Assisted
Marginal 10 15 66.67
Small 16 19 84.21
Medium 7 10 70.00
Large 5 6 83.33
All 38 50 76.00
The response with respect to assistance under NFSM-pulses programme was quite
positive since 76 per cent of the total sampled farmers belonging to the NFSM district of
Amravati aired their view in favour of receiving assistance under the programme and this
proportion among various categories stood at 67 per cent in marginal category, 84 per
cent in small, 70 per cent in medium and 83 per cent in large category with an average of
76 per cent for the average category of farmers of the NFSM district of Amravati,
showing higher proportion of small and large categories of farmers in terms of receiving
assistance under NFSM-pulses programme.
7.3 Type of Assistance received under NFSM-Pulses
Under NFSM-pulses, the farmers are provided various types of assistance and
these mainly include: (a) breeder/foundation/certified seeds, (b) assistance on Integrated
Nutrient Management (INM) – micronutrients/line/gypsum, etc., (c) assistance on
Integrated Pest Management (IPM) - micronutrients/line/gypsum IPM, (d) equipment like
seed drills, pumpsets, sprinklers, conoweeder, Knapp-sack sprayers, (e) demonstration of
new ICRISAT technologies or Bluebull menace, (f) training under Farmers’ Training
component, etc. The responses of the sampled households drawn from the NFSM district
of Amravati were recorded in terms of types of assistance received by them and these
responses for various categories of households are brought out in Table 7.3.
About 52 per cent of the total sampled households belonging to the NFSM district
of Amravati were found to air their view in favour of receiving improved varieties of
seeds of pulses crops under NFSM programme, 21 per cent received assistance on INM,
6 per cent received assistance on IPM, 17 per cent received various equipments, and

158
about 5 per cent received training under the programme. Among various categories, the
proportion of sampled households showing receipt of improved varieties of seeds of pulse
crops was 50 per cent in marginal category, 48 per cent in small, 55 per cent in medium
and 67 per cent in large category.
Table 7.3: Distribution of Households by Type of Assistance: NFSM Amravati District
No. of Households Assisted
Household
Category Seeds
Integrated
Nutrient
Management
(INM)
Integrated
Pest
Management
(IPM)
Equipment
like Seed
Drills, etc.
Demonstration Training Other Total
Marginal 10 4 2 3 - 1 - 20
Small 14 5 2 6 - 2 - 29
Medium 6 3 - 2 - - - 11
Large 4 2 - - - - - 6
All 34 14 4 11 - 3 - 66
% Farmers Assisted to Total Farmers in Size Group
Marginal 50.00 20.00 10.00 15.00 - 5.00 - 100.00
Small 48.28 17.24 6.90 20.69 - 6.90 - 100.00
Medium 54.55 27.27 - 18.18 - - - 100.00
Large 66.67 33.33 - - - - - 100.00
All 51.52 21.21 6.06 16.67 - 4.55 - 100.00
Note: There is overlapping of households as same household has received no. of assistance and, therefore,
the total is exceeding the actual sample size of households
The proportion of sampled households of NFSM district of Amravati airing their
view in terms of receiving assistance on INM was 20 per cent in marginal category, 17
per cent in small, 27 per cent in medium and 33 per cent in large category, showing a rise
in this proportion with the increase in land holding size of households. Similarly, the
proportion of sampled households airing their view in favour of receiving various
equipments under NFSM programme was 15 per cent in marginal category, 21 per cent in
small and 18 per cent in medium category. Thus, majority of the sampled households
belonging to the NFSM district of Amravati received some kind of assistance under
NFSM-pulses programme with higher perception in this respect being aired in favour of
receiving improved varieties of seeds of pulses crop.
7.4 Usefulness of NFSM-Pulses
The responses of the sampled households drawn from the NFSM district of
Amravati were also sought in terms of usefulness of NFSM-pulses programme and these
responses for various categories of sampled households are presented in Table 7.4.
Majority of the sampled households belonging to the NFSM district of Amravati
found NFSM programme for pulses very useful since 66 per cent of the total sampled
households belonging to the NFSM district of Amravati aired their view in favour of the

159
programme. Among various categories, the proportion of households finding NFSM
programme for pulses crops quite useful was 67 per cent in marginal category, 63 per
cent in small, 70 per cent in medium and 67 per cent in large category (Table 7.4).
Table 7.4: Usefulness of NFSM – Pulses: NFSM Amravati District
Household
Category
No. of Households Who
Found Useful
Total No. of Households in
the Size-group
% of Household
Marginal 10 15 66.67
Small 12 19 63.16
Medium 7 10 70.00
Large 4 6 66.67
All 33 50 66.00
Thus, by and large, all the categories of sampled households belonging to the
NFSM district of Amravati favoured the NFSM programme for pulses crops due to
various facilities extended to them under the programme that helped the farmers to raise
the productivity of their pulse crops cultivated under rainfed conditions.
7.5 Type of Usefulness of NFSM-Pulses
The major reasons that weighed in favour of the NFSM programme for pulses
crops were in terms of rise in yield levels of pulses crops, reduction in pest attacks,
reduction in drudgery, and increase in knowledge about better varieties and practices. The
responses of the sampled households belonging to the NFSM district of Amravati with
respect to various reasons for usefulness of the programme were also sought and these
responses for various categories of households are brought out in Table 7.5.
In the NFSM district of Amravati, about 34 per cent of the total sampled
households favoured the NFSM programme for pulses due to rise in yield levels of pulses
crops, 22 per cent due to reduction in pest attacks, 16 per cent due to reduction in
drudgery, and 28 per cent owing to their increased knowledge about better varieties and
practices (Table 7.5).
Table 7.5: Distribution by Type of Uses– Pulses: NFSM Amravati District
No. of Households by Type of Use Household
Category Higher
Yield
Reduced
Pest Attacks
Reduced
Drudgery
Increased Knowledge about
Better Varieties and Practices
Any
Other
Total
Marginal 10 7 5 7 - 29
Small 12 9 6 10 - 37
Medium 7 2 4 6 - 19
Large 4 3 1 4 - 12
All 33 21 16 27 - 97
% Households to Total Households in Size Group Marginal 34.48 24.14 17.24 24.14 - 100.00
Small 32.43 24.32 16.22 27.03 - 100.00
Medium 36.84 10.53 21.05 31.58 - 100.00
Large 33.33 25.00 8.33 33.33 - 100.00
All 34.02 21.65 16.49 27.84 - 100.00

160
Among various categories, marginal, small and large categories of households, in
particular, favoured the NFSM programme for pulses due to reduction in pest attacks,
whereas medium, small and marginal category of households favoured the programme
due to reduction in drudgery. However, all the categories of sampled households also
favoured the programme owing to the fact that it resulted in rise in yield levels of pulses
crops cultivated by them. Incidentally, the proportion of sampled households belonging
to NFSM district of Amravati airing their view in favour of acquiring increased
knowledge about better varieties and practices increased with the increase in land holding
size of households.
7.6 Area under Pulse Crops Before and After NFSM
The estimates relating to the average area allocation under various pulses crops
during 2006-07 and 2007-08, and the area allocation under pulses crops for the reference
year 2008-09 for various categories of sampled households drawn from the NFSM
district of Amravati are brought out in Table 7.6.
The average area allocation under mung crop during 2006-07 and 2008-09 with
all the sampled households belonging to the NFSM district of Amravati put together was
estimated at 147.44 acres, which increased to 155.66 acres in 2008-09. Similarly, the
average area allocation under gram crop during 2006-07 and 2008-09 with all the
sampled households belonging to the NFSM district of Amravati put together was
estimated at 144.08 acres, which increased to 160.91 acres in 2008-09. However, in the
case tur crop, the area allocation declined to 13.45 acres in 2008-09 from 18.60 acres
noticed during 2006-07 and 2007-08.
Table 7.6: Area under Pulse Crops Before and After NFSM: NFSM Amravati District
(As Calculated from Schedule: Area in Acres)
Mung Tur Gram Household
Category Average of 2006-
07 and 2007-08
200809 Average of 2006-
07 and 2007-08
200809 Average of 2006-
07 and 2007-08
200809
Marginal 18.35 21.05 1.88 1.00 21.98 20.05
Small 40.74 36.86 4.85 5.95 40.60 37.86
Medium 46.25 39.75 5.88 4.50 44.25 41.00
Large 42.10 58.00 6.00 2.00 37.25 62.00
All 147.44 155.66 18.60 13.45 144.08 160.91
Table 7.6 (a): Area under Pulse Crops Before and After NFSM: NFSM Amravati District (As Calculated from Schedule: Area in Acres)
Total Pulses Household
Category Average of 2006-07 and 2007-08 2008-09 % Increase
Marginal 42.21 42.1 -0.26
Small 86.19 80.67 -6.40
Medium 96.38 85.25 -11.55
Large 85.35 122 42.94
All 310.12 330.02 6.42

161
Thus, the sampled households drawn from the NFSM district of Amravati showed
a rise in area allocation under various pulses crops in 2008-09 as against average area
allocation under pulses crops during 2006-07 and 2007-08 with the exception of tur crop,
which showed a decline in area allocation in 2008-09 as against during 2006-07 and
2008-09. As a result, the total area under pulses crops with all the sampled households
belonging to NFSM district of Amravati increased to 330.02 acres, which was estimated
at 310.12 acres during 2006-07 and 2008-09, showing 6.42 per cent rise in area under
pulse crops in 2008-09 over that of 2006-07 and 2007-08 average estimate. This clearly
shows a positive impact of NFSM programme for pulses crops as the area allocation
under pulses crops after the initiation of programme has increased on the sampled farms.
7.7 Production of Pulse Crops Before and After NFSM
The estimates relating to the average production of various pulses crops during
2006-07 and 2007-08, and the production of pulses crops for the reference year 2008-09
for various categories of sampled households belonging to the NFSM district of Amravati
are presented in Table 7.7.
The average production of mung crop during 2006-07 and 2008-09 with all the
sampled households drawn from the NFSM district of Amravati put together was
estimated at 302.50 quintals, which rose to 365.00 quintals in 2008-09, showing 21 per
cent rise in the same in 2008-09 over that of the average production figures of the same
during 2006-07 and 2007-08. Similarly, the average production of gram crop during
2006-07 and 2008-09 with all the sampled households belonging to the NFSM district of
Amravati put together was estimated at 561.50 quintals, which increased to 791.00
quintals in 2008-09, showing 41 per cent rise in the same in 2008-09 over that of the
average production figures of the same during 2006-07 and 2007-08. Nevertheless, the
production of tur crop in 2008-09 was estimated at 65.50 quintals for all the sampled
farmers of NFSM district of Amravati put together, which actually stood at lower than
72.75 quintals estimated for the average production figures of tur crop for the years 2006-
07 and 2007-08 (Table 7.7).
Table 7.7: Production of Pulse Crops Before and After NFSM: NFSM Amravati District (As Calculated from Schedule: Production in Quintals)
Mung Tur Gram Household
Category Average of 2006-07
and 2007-08
200809 Average of 2006-07
and 2007-08
200809 Average of 2006-07
and 2007-08
200809
Marginal 36.00 49.00 7.50 5.00 84.50 96.00
Small 84.50 89.00 19.75 28.50 155.00 174.00
Medium 95.50 95.00 21.50 22.00 173.00 204.00
Large 86.50 132.00 24.00 10.00 149.00 317.00
All 302.50 365.00 72.75 65.50 561.50 791.00

162
Table 7.7 (a): Production of Pulse Crops Before and After NFSM: NFSM Amravati District (As Calculated from Schedule: Production in Quintals)
Total Pulses Household
Category Average of 2006-07 and 2007-08 2008-09 % Increase
Marginal 128.00 150.00 17.19
Small 259.25 291.50 12.44
Medium 290.00 321.00 10.69
Large 259.50 459.00 76.88
All 936.75 1221.50 30.40
The foregoing observations clearly revealed that the sampled households drawn
from the NFSM district of Amravati showed a substantial increase in production of
pulses crops in 2008-09 as compared to the average production figures for the years
2006-07 and 2007-08 with the only exception of tur crop, which actually showed a
decline in production in 2008-09 as against the average production during 2006-07 and
2008-09. As a consequence, the production of total pulses crops with all the sampled
households belonging to NFSM district of Amravati put together increased to 1221.50
quintals in 2008-09, which was estimated at 936.75 quintals during 2006-07 and 2008-09,
showing 30.40 per cent rise in production of total pulse crops in 2008-09 over that of
average production of pulses crops during 2006-07 and 2007-08. This once again clearly
shows a positive impact of NFSM programme on pulses crops as production of pulses
crops after the initiation of programme has increased on the sampled farms. Since rise in
production of pulses crops on the farms belonging to the sampled farmers of NFSM
district stood at much faster than area expansion in 2008-09 over that of the average of
2006-07 and 2007-08, this is a clear cut indication of rise in productivity level of pulse
crops cultivated on the sampled farm in 2008-09 over that of the average of 2006-07 and
2007-08, showing positive impact of NFSM programme on productivity levels of pulses
crops grown in the state of Maharashtra.
7.8 Increase in Area under Pulse Crops after NFSM
The responses of the sampled farmers drawn from the NFSM district of Amravati
were recorded with respect to rise in area under pulses after the initiation of NFSM
programme and these responses for various categories are brought out in Table 7.8.
Table 7.8: Increase in Area under Pulses after NFSM: Farmers’ Perception (Amravati District)
Household
Category
No. of Farmers Who
Reported Increase
Total No. of Farmers in the
Size-group
% of Farmers
Marginal 8 15 53.33
Small 9 19 47.37
Medium 4 10 40.00
Large 4 6 66.67
All 25 50 50.00

163
When the sampled farmers drawn from the NFSM district of Amravati were asked
to indicated as to whether the area allocation under pulses crops increased after the
initiation of NFSM programme for pulses crops, about 50 per cent of the total sampled
farmers aired positive response in this respect and among various categories this
proportion stood at 53 per cent in marginal category, 47 per cent in small, 40 per cent in
medium and 67 per cent in large category.
7.9 Extent of Increase in Area under Pulse Crops after NFSM
The estimates relating to extent of rise in area allocation under pulses on the farms
belonging to various categories of sampled farmers of NFSM district of Amravati are
presented in Table 7.9.
Table 7.9: Distribution by Extent of Increase: Farmers’ Perception (Amravati District)
No. of Households by Type of Use Household
Category 1% - 2% 2% - 5% 5% - 10% > 10% Total
Marginal - - - 8 8
Small - - 1 8 9
Medium - - 1 3 4
Large - 1 - 3 4
All - 1 2 22 25
% of Households to Total Households in Size Group
Marginal - - - 100.00 100.00
Small - - 11.11 88.89 100.00
Medium - - 25.00 75.00 100.00
Large - 25.00 - 75.00 100.00
All - 4.00 8.00 88.00 100.00
The estimates presented in Table 7.9 revealed that only 25 out of 50 sampled
households belonging to the NFSM district of Amravati aired their view in terms of rise
in area under pulses crops after initiation of NFSM programme for pulses crops and about
88 per cent of them showed more than 10 per cent rise in area under pulses crops on their
farms, 8 per cent showed 5-10 per cent rise in this respect, and 4 per cent showed 2-5 per
cent rise in area under pulses crops on their farms after initiation of NFSM programme
for pulses crops. The proportion of sampled farmers showing more than 10 per cent rise
in area under pulses crops declined with the increase in land holding size of farmers.
7.10 Suggestions for Improving NFSM – Pulses
The responses/perceptions of the sampled farmers drawn from the NFSM district
of Amravati were also sought with respect to their own suggestion extended in favour of
improving NFSM programme for pulses crops, especially with a view to make this
programme more useful and meaningful, and these suggestions obtained from various
categories of sampled farmers are presented in Table 7.10.

164
Table 7.10: Suggestions for Improving NFSM – Pulses: Farmers’ Perception (Amravati District)
Sr.
No.
Household
Category Suggestions
Marginal 1 Subsidy on fertilizer be provided.
2 Fertilizer should be provided on low price
3 Provide Irrigation
4 Provide Irrigation through Canal
5 Provide Improved Seeds and Implements
6 Provide Irrigation; Provide subsidy on Agri- Implements & subsidy on Pesticides
7 Provide Irrigation and give subsidy on Agri- Implements & subsidy on Fertilizers & Seeds.
8 Organize Camps for knowledge about the programme (NFSM)
9 Provide Irrigation and give subsidy on Agri- Implements & Seeds.
10 Provide Irrigation & Agri- Implements & give subsidy on Pesticides
11 Provide Irrigation and give subsidy on Agri- Implements, Fertilizers
12 Provide Irrigation and give subsidy on seeds and fertilizers; Good Market and price is required
13 Make available high yielding varieties of seeds; fertilizers on subsidized rate and on time
Small 1 Seeds and Fertilizers should be made available on low prices and on time.
2 Subsidy on Seed Prices; Fertilizers should be made available on low price.
3 Provide Irrigation
4 Provide Sprinkler set; Reduce intermediates or broker; give subsidy on newly arrived seeds
5 Provide a automatic pump set on subsided price for tur for spraying
6 Provide subsidy on Agri impalements & improved seeds; Give plant protection on subsidized rate.
7 Provide subsidy on seeds, Sprinkler Pump set and Pesticide; Provide farm pond on farm
8 Provide subsidy on seeds, Agri-Implements, and Fertilizers; Improve irrigation facilities.
9 Provide irrigation facilities
10 Make aware of NFSM programme to the people by arranging meetings with farmers;
Provide infrastructure, seeds, fertilizers and pest control on time with subsidy
11 Provide Agri implements, High yielding variety seeds; Fertilizers on subsidy; Give minimum support price
12 Provide High yield variety seeds, fertilizers on subsidy; give minimum support price
13 Provide Credit on time with less Interest rate; Provide Irrigation, fertilizers, seeds; Govt should buy pulses
14 Arrange meeting with farmers every month to provide information about the usefulness
of the programme; Provide micro finance at minimum rate; Give minimum support price.
Medium 1 Market prices be kept constant; Fertilizers prices should be less; Provide seeds on subsidy
2 Provide Irrigation facilities under the programme
3 Prices be kept constant
4 Provide plant Protection measures and Improved Implements on Subsidy
5 Provide seeds on subsidized rates
6 Provide seeds & fertilizers and provide Irrigation facilities
7 Provide seeds & fertilizers on subsidized rates; Provide irrigation facilities; Give remunerative price
8 Provide high yielding varieties of seeds & fertilizers: Give surety of minimum support price
Large 1 Seeds and fertilizers should be provided on subsidized rates at door steps
2 Seed prices should be less; Required active assistant who can spread information about the Govt. policies.
3 Seeds should be provide on subsidized rates; Market price should be constant
4 Provide seeds, fertilizers and pest control measures on subsidy
5 Provide seeds, fertilizers and pest control measures on subsidy; provide Irrigation
facilities; Increase market prices for pulses
Although various categories of sampled farmers drawn from the NFSM district of
Amravati had aired several suggestions to improve the existing NFSM programme for
pulses crops with a view to make the programme more useful to them, there was
165
considerable overlapping in these suggestions across various categories of sampled
farmers. The marginal category of sampled farmers aired their view in favour of
receiving subsidy on fertilizer, provision of fertilizer on low prices, provision of irrigation
facilities, provision of improved varieties of seeds and implements, provision of subsidy
on seeds, fertilizers, pesticides, implements, etc., organizing camps for the dissemination
of knowledge about NFSM, timely availability of seeds, fertilizers, pesticides and other
inputs, better marketing conditions, remunerative prices, etc.
In order to make NFSM programme for pulses more useful, the suggestions of
medium category of farmers were in favour of timely availability of various inputs,
subsidised prices of seeds, fertilizers, and other inputs, provision of irrigation facilities,
provision of sprinkler sets, subsidy on newly arrived improved seeds, provision of
automatic pump sets on subsidised rates for the purpose of spraying on tur crop,
provision of subsidy on agricultural implements, extension of plant protection measures
on subsidised rates, provision of pest control measures on subsidised rates, making aware
of NFSM programme through meetings with farmers, provision of credit facilities on low
rates of interests, timely availability of credit, etc.
The suggestions of medium category of farmers mainly encompassed those
facilities that included provision of seeds, fertilizers, pesticides, implements, pesticides,
plant protection measures, etc. on subsidised rates, extension of irrigation facilities, etc.
The suggestions of large category of farmers also by and large turned out to be same as
extended by small and medium categories and these suggestions included provision of
subsidy on seeds, fertilizers, pesticides, implements, pesticides, plant protection
measures, etc., provision of irrigation facilities, etc.
Thus, in order to improve NFSM programme for pulses and make it more useful,
the suggestions of the sampled farmers mainly revolved around extension of irrigation
facilities, provision of improved varieties of seeds on subsidised rates, an element of
subsidy with respect to other inputs like fertilizer, pesticides, implements and machinery,
pest control measures, plant protection measures, etc, assured and remunerative market
prices for various pulse crops, organizing meetings with the farmers to make them aware
about the programme, timely availability of seeds, fertilizers, and other inputs, provision
of automatic pump sets on subsidised rates for spraying in the cultivation of tur crop,
provision of farm pond, sprinkler sets, etc.
**********

166
CHAPTER – VIII
SUMMARY, CONCLUSION AND POLICY IMPLICATIONS
8.1 Backdrop
Food security of India is one of the major issues raised in the 11th
Plan Approach
paper. Very slow growth in agriculture sector of India has raised doubts about bridging
demand supply gaps in foodgrain production, which has remained erratic over the last
few years. This is despite the fact that there has still been large existing untapped
potential of foodgrains available in eastern and central parts of India. The National
Development Council (NDC), therefore, in its 53rd
meeting held on 29th
May, 2007
resolved to launch a Food Security Mission for rice, wheat and pulses with a view to raise
foodgrain production by at least 20 million tonnes by the end of Eleventh Plan, which
included 2 million tonnes rise in pulses production. In view of achieving the targets set
forth for the end of Eleventh Plan and operationalising the resolution taken by NDC, the
‘National Food Security Mission (NFSM)’ was launched in 2007-08 as a Centrally
Sponsored Scheme in mission-mode approach. The major thrust of this programme is on
increasing seed replacement and the replacement of older varieties by newer ones. One of
the major features of this is that it offers much more than what earlier programmes
offered, especially with respect to capacity building, monitoring and planning. The
execution of the programme remains within the district planning framework.
Although NFSM has been launched for rice, what and pulses, the largest numbers
of districts fall under NFSM-Pulses mainly owing to the fact that the production of pulses
has remained stagnant in the country for past decades in spite of India being the largest
producer and consumer of pulses. Due to sluggish and erratic growth, the net per capita
per day availability of pulses in India declined from 60 grams in 1951 to 31 grams in
2008. This is despite the fact that several policy initiatives, projects and programmes with
respect to pulses were undertaken in the past viz. All India Coordinated Pulses
Improvement Project (AICPIP), National Pulses Development Programme (NPDP),
Technology Mission on Pulses (TMOP), Centrally Sponsored Integrated Scheme of
Oilseeds, Pulses, Oil palm and Maize (ISOPOM), etc. These policies and programmes
hardly led to any improvement in pulses production of India. In order to raise pulses
production by 2 million tonnes by the end of 2011-12, the existing pulses related
programmes were replaced by NFSM-pulses.

167
The major areas of concern in pulse cultivation are the low yield levels, marginal
lands devoted to pulse cultivation, stagnation in production technology, severe abiotic
(climate-related) and biotic (insect, pest) stresses, volatility of prices and lack of effective
procurement. The present study, therefore, attempts to unravel the degree of importance
of these constraints and outline the prospects for pulses production in the state of
Maharashtra. The study also intends to assess the effectiveness of NFSM-Pulses, if any,
on the pulse production in Maharashtra.
8.2 Objectives of the Study
The study has been undertaken with the following specific objectives:
1. To analyze returns from cultivation of pulses vis-à-vis competing crops
2. To analyze the other major problems and prospects for pulse cultivation, and
3. To assess the impact, if any, of NFSM-Pulses
8.3 Methodology
The study is carried in two districts of Maharashtra – one covered under the
umbrella of NFSM and the other not falling under the preview of NFSM. At present,
there are 33 pulse growing districts in Maharashtra and 18 among them fall under the
preview of NFSM. In order to select the study districts, the NFSM and non-NFSM
districts were arranged in descending order based on area allocation under pulses crops in
2008-09. Amravati under the umbrella of NFSM districts of Maharashtra showed the
highest area allocation under pulses crops in 2008-09, accounting for 7.28 per cent share
in total area allocation under pulses crops in the State, and it was selected for the present
investigation and considered as sampled NFSM district of Maharashtra. Similarly, Beed
under the umbrella of non-NFSM districts of Maharashtra showed the highest area
allocation under pulses crops in 2008-09, accounting for 3.47 per cent share in total area
allocation under pulses crops in the State, and it was selected for the present investigation
and treated as sampled non-NFSM district of Maharashtra. It was decided to select one
Taluka from each of the selected sampled districts based similar criteria as followed in
the case of selection of districts in the State. The Talukas of Daryapur in Amravati district
and Majalgaon in Beed district showed significantly high area under pulses crops, and
these two Talukas were, therefore, further selected for the present investigation. The
study is confined to the selection of only one village from the NFSM district of Amravati
and non-NFSM district of Beed, and, therefore, the village of Ramagad from Amravati
district and Majalgaon from Beed district were further selected randomly for the present

168
investigation subject to the condition that they should be having sufficient area allocation
under pulses crops and that farmers belonging to the selected villages should be having
cultivation of some other competing field and other crops with a view to evaluate the
actual impact of NFSM on pulses vis-à-vis other crops.
In this study, it was decided to select 50 sampled farmers from the NFSM district
of Amravati and 50 from non-NFSM district of Beed. Therefore, a complete enumeration
of the two selected villages was done with view to further categorization of farmers into
marginal (less than 1 hectare), small (1 to 2 hectares), medium (2-4 hectares) and large
(above 4 hectares). The probability proportion to sample size technique was used for
further selection of farmers under each of the land holding size category from the selected
sampled villages. The number of sampled farmers in the selected Ramagad village
encompassed 15 in marginal category, 19 in small, 10 in medium and 6 in large category
with a sum of 50 farmers drawn from the district of Amravati. Similarly, the number of
sampled farmers in the selected Majalgaon village encompassed 14 in marginal category,
17 in small, 13 in medium and 6 in large category with a sum of 50 farmers.
Primary data from the sampled farmers belonging to NFSM district of Amravati
and non-NFSM district of Beed were collected through the well structured schedule by
personal interview method. In-depth information related to socio economic characteristics
of sampled farmers, cropping pattern, production and disposal of crops, cost and return
structure for various crops cultivated on the sampled farms, farmers’ perceptions
regarding various facilities extended under NFSM programme, farmers’ awareness of
NFSM for pulses, assistance received and the type of assistance, usefulness of the
assistance, area allocation under pulse crops before and after NFSM programme,
production of pulses crops before and after NFSM programme, increase in area under
pulses after NFSM programme, etc. was collected from each of the sampled farmers
drawn from the NFSM district of Amravati and non-NFSM district of Beed.
The reference period for the primary data survey was the period from 2006-07 to
2008-09. The comparative economics of pulse crops cultivation vis-à-vis other competing
crops cultivation was analyzed for the above period. The increase in area under pulses for
2008-09 was also assessed in the present investigation to evaluate impact of NFSM.
8.4 Major Findings
The major findings mainly revolve around status of pulses sector in various
districts of Maharashtra, insights into profitability of various crops cultivated on the

169
farms belonging to the sampled farmers of NFSM district of Amravati and non-NFSM
district of Beed, extent of technology adoption, pest problems, marketing aspects, opinion
survey, major problems and important suggestions, the effect of NFSM-Pulses, on area
and production of pulses, and the problems and suggestions for the improvement of
NFSM-Pulses programme.
8.4.1 Status of Pulses Sector in Maharashtra
Status of pulses sector in Maharashtra is evaluated in terms of to area, production
and productivity of various important crops cultivated in the state of Maharashtra
encompassing the period between 1996-97 and 2007-8, growth estimates for various
pulses crops, and trends with respect to broad quantitative parameters of agricultural
sector of the State.
8.4.1.1 Area under Important Crops
The average Gross Cropped Area (GCA) in Maharashtra during the last five years
encompassing the period between 2003-04 and 2007-08 was estimated at 22.47 million
hectares, which included 40.81 per cent area under cereals and 16.15 per cent area under
pulses with a sum of 56.96 per cent area under foodgrains. The share of other important
crops in GCA of Maharashtra during the same period was estimated at 2.86 per cent for
sugarcane, 13.16 per cent for cotton, 15.52 per cent for oilseeds, and 11.51 per cent for
other crops, which chiefly included horticultural crops. Among various pulses crops,
kharif pulses like mung, tur and udid accounted for 10.04 per cent share in GCA of
Maharashtra during the given period of time, whereas rabi pulses like gram showed a
share of 4.72 per cent in the same during the given period. Some other kharif and rabi
pulses accounted for the remaining 1.39 per cent share in GCA of Maharashtra.
8.4.1.2 Trend in Share of Important Crops in GCA
An important feature of the last one decade is the falling share of cereals and
rising share of oilseeds in GCA of Maharashtra. The share of cereal crops in GCA of the
State has fallen from 48 per cent in 1996-97 to about 40 per cent in 2007-08. On the other
hand, the share of pulses in GCA of the State has remained by and large same, and
hovered at around 16-17 per cent during the past one decade or so. As a result, the share
of foodgrains in GCA of the State has dropped from 63 per cent in 1996-97 to about 58
per cent in 2007-08. The oilseed crops have shown rise in their share in GCA of the State,
which increased from 12 per cent in 1996-97 to nearly 17 per cent in 2007-08. The share
of cotton in GCA of the State has remained at around 13-14 per cent between 1996-97
170
and 2007-08. Similarly, share of sugarcane in GCA of the State has remained by and
large constant, and hovered at around 3-4 per cent during the past one decade.
8.4.1.3 Growth Trends in Important Crops
Despite decline in area, majority of foodgrain crops in Maharashtra have
registered a reasonable growth in their production due to rise in their yield levels. For
instance, between 1996-97 and 2007-08, the production of various foodgrains grew at the
rate of 0.56 per cent per annum, which was mainly due to 1.04 per cent annual growth in
their yield levels as the area under these crops declined at the rate of 0.47 per cent per
annum. This is also concomitant from the fact that in spite of 0.94 per cent annual decline
in area under cereal crops, their production grew at the rate of 0.13 per cent per annum
mainly due to 1.08 per cent annual growth in their yield levels during the last one decade.
In the case of pulses, much of the production expansion was due to yield growth rather
than area growth. The production of various pulses in Maharashtra grew at the rate of 2.9
per cent between 1996-97 and 2007-08, which was due to 2.11 per cent annual growth in
their yield levels as the area growth under pulses stood at only 0.79 per cent per annum
during this period. Although the general trend in Maharashtra shows a positive
production growth in cereals, pulses, sugarcane, cotton and oilseed crops during the last
one decade or so, which could be attributed to their higher yield growth, the negative
feature of agriculture sector of Maharashtra is the negative growth in area, production and
yield of bajra and jowar among cereals and udid among pulses.
8.4.1.4 Growth in GCA, NSA and Fertilizer Consumption
The NSA in Maharashtra has marginally declined from 17.85 million hectares in
1996-97 to 17.47 million hectares in 2007-08 with an annual decline in the same at 0.21
per cent during this period. On the other hand, the GCA of the State has increased from
21.84 million hectares in 1996-97 to 22.66 million hectares in 2007-08 with an annual
growth in the same at 0.49 per cent. As against NSA and GCA, the NIA in Maharashtra
has fluctuated considerably over the past one decade. The NIA in Maharashtra though
increased from 3.09 million hectares in 1996-97 to 3.31 million hectares in 2007-08.
However, due to significant fluctuation in NIA over time, there was hardly any overall
annual growth in the same during the period from 1996-97 to 2007-08. The GIA in
Maharashtra increased from 3.77 million hectares in 1996-97 to 4.04 million hectares in
2007-08 with an annual growth in the same at 0.30 per cent during this period. The
estimates also show that the state of Maharashtra has shown significant progress not only

171
in terms of rise in GCA but also with respect to GIA and consumption of fertilizer over
time since GCA, GIA and extent of fertilizer application in crop cultivation have
improved significantly over the past decade or so, leaving aside growth in NSA and share
of GIA in GCA.
8.4.1.5 Area under Pulses in Maharashtra
The annual average area under pulse crops in Maharashtra during the period
between 2003-04 and 2007-08 was estimated at 36.28 lakh hectares, which encompassed
11.00 lakh hectares area under tur, 10.61 lakh hectares area under gram, 6.25 lakh
hectares area under mung, 5.31 lakh hectares area under udid, and 3.10 lakh hectares area
under other pulse crops. Thus, kharif pulses like mung, tur and udid accounted for the
major share in total acreage under pulse crops in Maharashtra as their combined share
was 62 per cent in total area under pulses crops of the State. During the period between
2003-04 and 2007-08, the highest share in total area under pulse crops in Maharashtra
was seen to be accounted for by kharif tur (30.33 per cent), followed by rabi gram (29.26
per cent), mung (17.22 per cent), and udid (14.63 per cent).
8.4.1.6 Area, Production and Yield of Pulses Crops
Although various pulses crops cultivated in Maharashtra have shown varying
performances in terms expansion in area, production and yield, the general trend shows
an expansion in these parameters for total pulse crop in the State. The area under total
pulse crop in Maharashtra has grown from 33.63 lakh hectares in 1996-97 to 40.57 lakh
hectares in 2007-08. The rise in production with respect to total pulse crop cultivated in
Maharashtra is noticed to be faster than area expansion and it has increased from 20.32
lakh MT in 1996-97 to 30.24 lakh MT in 2007-08. The yield level of total pulse crop or
all the pulse crops put together has improved from as low as 353 kg/ha in 1997-98 to as
much as 745 kg/ha in 2007-08. However, the irrigated area under total pulse crop in
Maharashtra has come down from 2.70 lakh hectares in 1996-97 to 2.27 lakh hectares in
2001-02. Even the share of area under irrigation vis-à-vis total area under pulse crops has
come down from 8.03 per cent in 1996-97 to 6.46 per cent in 2001-02.
8.4.1.7 Share of Districts in Area and Production of Pulses
Pulse crop cultivation in Maharashtra was confined mainly to five divisions of
Maharashtra viz. Amravati, Latur, Aurangabad, Nashik and Nagpur. The districts
belonging to these five divisions showed as much as 85 per cent share in total area and 87
per cent share in total production of total pulse crops of Maharashtra. During the period

172
between 1996-97 and 2007-08, out of the total annual average area of 35.66 lakh hectares
under total pulse crops, 28 per cent area belonged to Amravati division, 24 per cent to
Latur, 10 per cent to Aurangabad, 12 per cent to Nashik and 10 per cent to Nagpur
division of Maharashtra. Similarly, during the same period, out of the total annual
production of 20.32 lakh MT of total pulse crop, 33 per cent production belonged to
Amravati division, 22 per cent to Latur, 9 per cent to Aurangabad, 13 per cent to Nashik,
and 10 per cent to Nagpur division of Maharashtra. This clearly shows predominance of
Amravati and Latur divisions not only in terms of area but also production of pulse crop
in Maharashtra. The combined share of Amravati and Latur divisions in terms of both
area and production of pulse crops is more than 50 per cent in Maharashtra with rest area
and production being accounted for by other divisions.
8.4.1.8 District-wise Growth in A, P, Y of Pulses
The analysis drawn from growth trends with respect to area, production and yield
of various pulses crops cultivated in Maharashtra clearly show that the pulse sector of
Maharashtra has performed very well during the past one decade as major pulse crops
like kharif tur and rabi gram cultivated in the State showed positive and significantly high
area, production and yield growth during this period. However, negative growth rates
associated with mung and udid with respect to their area, production and yield could be
considered as a matter of concern, though these declining trends in area production and
yield of mung and udid crops have not affected overall rise in area, production and yield
of total pulse crops cultivated in Maharashtra during the period between 1996-97 and
2007-08. However, the pulse sector of Maharashtra has to still do lot of catching
especially when some of the pulse crops like mung and udid are showing negative growth
in their area, production and yield. Since the demand for these two pulses has always
exceeded supply, there is need to bring more area under mung and udid crop cultivation
in order to augment their production in the state of Maharashtra. Equally important is the
improvement in yield levels of mung and udid crop as they have been showing negative
yield growth in Maharashtra over the past one decade.
8.4.2 Socio-economic Characteristics and Resource Endowments of Farmers
The socio-economic characteristics and resource endowments of sampled farmers
of study districts are assesses with respect to their family size and composition, education
status, caste composition, land use pattern, cropping pattern, irrigated area, sources of
irrigation, etc.

173
8.4.2.1 Family Size Composition of Farmers
The average size of family consisted of 5 persons with 4 adults and 1 child in the
case of sampled farmers drawn from the NFSM district of Amravati since 50 sampled
farmers consisted of 249 family members encompassing 197 persons belonging to adult
males and females and 52 children. In the case of sampled farmers belonging to non-
NFSM district of Beed, the average family size consisted of nearly 6 members with 5
adult males and females and one child. This was mainly due to the fact that the 50
sampled farmers of this district had 277 members encompassing 206 persons belonging
to adult males and females and 71 children.
8.4.2.2 Educational Status of Farmers
The sampled farmers belonging to NFSM Amravati district were relatively more
educated as compared to their counterpart in non-NFSM Beed district. While about 82
per cent head of the sampled households of Amravati district received education up to
secondary and higher level, this proportion for Beed district stood at only 68 per cent.
Even the adult members of sampled households showed higher educational status in
Amravati district as 77 per cent adult members of sampled households of Amravati
district attained education up to secondary and higher level, whereas this proportion for
Beed district was only 66 per cent. The illiteracy among heads of households was found
to be more in the district of Beed as against Amravati district. Similarly, the illiteracy
among adult members was more pronounced in the case of Beed district as compared to
Amravati district.
8.4.2.3 Caste Composition of Farmers
Two differing scenarios emerged in terms of caste composition of sampled
farmers drawn from the NFSM district of Amravati and non-NFSM district of Beed.
While majority of the sampled farmers in Amravati district belonged to the category of
OBC, the district of Beed was found to show a significant proportion of total sampled
farmers belonging to general category since 74 per cent of total sampled farmers in
Amravati district belonged to OBC category and 82 per cent of sampled farmers of Beed
district belonged to general category.
8.4.2.4 Irrigated Area in NFSM and Non-NFSM Districts
The irrigation status was found to be entirely different in the NFSM district of
Amravati and non-NFSM district of Beed. While the entire area of sampled farmers in
Amravati district was under unirrigated or rainfed conditions, the sampled farmers of
174
non-NFSM district of Beed showed 32 per cent of their total operational holding under
irrigation and 68 per cent under rainfed conditions. In the non-NFSM district of Beed,
open well and river lift were the main sources of irrigation. The irrigated area under open
well and river lift accounted for as much as 28 per cent share in total operational holding
of the average category of sampled farmers of Beed district. The area under tubewell
irrigation was only 4 per cent for the average category of sampled farmers of Beed
district. The marginal category of sampled farmers of Beed district showed their entire
area under rainfed conditions.
8.4.2.5 Cropping Pattern of Farmers
The cropping pattern of sampled farmers drawn from the NFSM district of
Amravati and non-NFSM district of Beed differed significantly. While pulses crops
predominated the cropping pattern of sampled farmers of Amravati district during both
kharif and rabi seasons, the area predominance with respect to pulses crops was less for
the sampled farmers drawn from the district of Beed. This is concomitant from the fact
that the average category of farmer belonging to Amravati district showed 73 per cent of
the net sown area under pulses crops in kharif season and 95 per cent in rabi season,
whereas these proportions in the district of Beed were worked out at 36 per cent and 45
per cent. The average category of sampled farmers belonging to the district of Beed had
about 45 per cent of net sown area under cotton crop in kharif season and 35 per cent of
the net sown area under sugarcane in rabi season. In the case of non-NFSM district of
Beed, some other rabi crops like jowar, banana, wheat, onion, etc. accounted for
significant share in net sown area for the average category of sampled farmers.
8.4.2.6 Area under Pulses for NFSM and Non-NFSM Farmers
The sampled farmers of NFSM district of Amravati showed much higher area
under pulses crops as against the sampled farmers of non-NFSM district of Beed. The
area under pulses crops with all the sampled farmers put together was estimated at 167.06
acres in kharif and 149.69 acres in rabi season for the district of Amravati and 87.07 acres
in kharif and 85.63 acres in rabi season for the district of Beed. During kharif season,
while sampled farmers of Amravati district showed very high share (90 per cent) of mung
crop in net sown area under pulse crops, this share was found to be high for tur crop (54
per cent) in case of the sampled farmers of Beed district. However, all the sampled
farmers of Amravati and Beed district showed the entire pulse crop area of rabi season
under gram crop, though the area under this crop was much higher in Amravati District.

175
8.4.2.7 Share of Size-Groups in Pulse Farming
The sampled farmers of NFSM district of Amravati and non-NFSM district of
Beed showed a rise in their share in total area under pulses crops cultivated during kharif
and rabi seasons with the rise in their land holding size. In the NFSM district of
Amravati, the share of marginal, small, medium and large category in total area under
pulses crops was estimated at 12.47 per cent, 26.73 per cent, 29.63 per cent and 31.17 per
cent, respectively, in kharif season and, 14.25 per cent, 26.51 per cent, 28.84 per cent,
and 30.40 per cent, respectively, in rabi season. As for the non-NFSM district of Beed,
the share of marginal, small, medium and large category in total area under pulses crops
was estimated at 9.21 per cent, 29.17 per cent, 29.08 per cent and 32.54 per cent,
respectively, in kharif season and, 9.77 per cent, 21.45 per cent, 13.51 per cent, and 55.27
per cent, respectively, in rabi season.
8.4.2.8 Irrigated Area under Pulses
While the sampled farmers belonging to the NFSM district cultivated various
pulses crops under rainfed conditions, the cultivation of these crops by the sampled
farmers of non-NFSM district of Beed was under both irrigated and unirrigated
conditions. However, the extent of area under irrigation with respect to pulses crops was
very low in Beed district, and, in general, the proportion of irrigated area to net sown area
for pulses crops with all the sampled farmers put together stood at 18.76 per cent in
kharif season and 14.40 per cent in rabi season. It was only in the case of mung that about
61 per cent of net sown area was under irrigation in the case of large category of sampled
farmers belonging to the non-NFSM district of Beed.
It could be further noted that though all the crops cultivated by the sampled
farmers of NFSM district of Amravati were under rainfed conditions, and, therefore, GIA
in this district stood nil, the sampled farmers of non-NFSM district Beed, however,
showed some irrigated area under various crops during both kharif and rabi seasons, and,
the GIA in this district was estimated at 152.83 acres for the all the sampled farmers put
together, which encompassed 10.25 per cent area under soybean, 0.22 per cent under
jowar, 13.41 per cent under cotton, 0.44 per cent under bajra, 7.64 per cent under mung,
3.06 per cent under tur, 8.07 per cent under gram, 43.40 per cent under sugarcane, and
13.52 per cent under other rabi crops like jowar, wheat, onion, banana, etc. The area
under pulses crops was not much under irrigated conditions in the district of Beed as the
share of kharif pulses in GIA for all the sampled farmers put together stood at 10.69 per

176
cent, and this share with respect to rabi pulses like gram was estimated at only 8.07 per
cent. In fact, other crops cornered major share in GIA for various categories of farmers of
Beed district since the share of other kharif crops in GIA was 35 per cent and other rabi
crops accounted for as much as 65 per cent share in GIA.
8.4.3 Economics of Pulses and Other Crops Cultivation
The extent of profit involved in the cultivation of pulses crops vis-à-vis other
crops in both NFSM district of Amravati and non-NFSM district of Beed is evaluated for
three reference years viz. 2006-07, 2007-08 and 2008-09, where reference years 2006-07
and 2007-08 represent the scenario obtaining in terms of profitability of crops before
initiation of NFSM for pulses crops and the reference year 2008-09 shows the scenario
obtaining in this respect after the initiation of NFSM for pulses crops, i.e. the impact of
the NFSM programme.
8.4.3.1 Economics of Pulses Crops in NFSM District
In terms of profitability, total pulses crops encompassing kharif mung and tur and
rabi gram cultivated by various categories of sampled farmers showed a rising trend from
2006-07 to 2007-08, and from 2007-08 to 2008-09. Even per quintal net returns from
total pulses crops farming followed a rising trend throughout the period between 2006-07
and 2008-09. The total pulse crop also showed an increase in per hectare net returns and
per quintal net returns with the increase in land holding size of sampled farmers
belonging to NFSM district of Amravati. The per hectare net returns from total pulses
crops for the average category of farmer of Amravati district was estimated at Rs.8,897 in
2006-07, which increased to Rs.11,861 in 2007-08, and further to Rs.17,076 in 2008-09.
Similarly, the per quintal net returns from total pulses crops for the average category of
farmer belonging to NFSM district of Amravati was estimated at Rs.1,268 in 2006-07,
which increased to Rs.1,470 in 2007-08, and further to Rs.1,845 in 2008-09.
Thus, in the total pulses farming, the average category of sampled farmer of
Amravati district generated 33.31 per cent higher per hectare net returns in 2007-08 over
2006-07, 43.97 per cent in 2008-09 over 2007-08, and 91.93 per cent higher net returns in
2008-09 over 2006-07. Similarly, in the total pulses farming, the average category of
sampled farmer of Amravati district generated 15.98 per cent higher per quintal net return
in 2007-08 over that of 2006-07, 25.52 per cent in 2008-09 over that of 2007-08, and
45.58 per cent higher net returns in 2008-09 over that of 2006-07. The rise in yield level
and higher prices on offer for pulses crops in Amravati district could be the reasons for

177
higher amount of net profit generated from pulses crop farming since both net returns per
hectare and per quintal from total pulses crops increased substantially in 2008-09 over
that of 2006-07, which also show positive impact of NFSM programme on pulses
farming in the NFSM district of Amravati of Maharashtra.
8.4.3.2 Economics of Other Major Crops in NFSM District
Although sampled farmers belonging to the NFSM district of Amravati cultivated
a number of other crops viz. soybean, kharif jowar, cotton, bajra, kharif and rabi
sunflower, etc., the amount of per hectare as well as per quintal net returns varied
significantly across these crops, and due to significantly high element of profit involved
in the cultivation of soybean, cotton, kharif and rabi sunflower, the per hectare net returns
from all the other crops put together was reasonable, though lower than element of profit
emanating from total pulses crops cultivation. The average category of sampled farmers
belonging to the NFSM district of Amravati derived Rs.11,018 per hectare net returns
from the cultivation of all other crops put together in 2006-07, which though marginally
declined to RS.10,170 in 2007-08 but again increased to Rs.14,022 in 2008-09, showing
about 27 per cent rise in per hectare net returns from all other crops in 2008-09 over that
of 2006-07, and 38 per cent rise in the same in 2008-09 over that of 2007-08. Similarly,
the per quintal net returns from all the other crops put together with respect to the average
category of sampled farmers of Amravati district though declined to Rs.910 in 2007-08
from Rs.922 in 2006-07 but increased again to Rs.1,152 in 2008-09, indicating 25 per
cent rise in per quintal net returns from all other crops in 2008-09 over that of 2006-07,
and 27 per cent rise in the same in 2008-09 over that of 2007-08.
Thus, the average category of sampled farmers belonging to the NFSM district of
Amravati derived much higher per hectare net returns from the cultivation of pulses crops
as compared to other crops since the per hectare net returns for total pulses crops turned
out be Rs.8,897 in 2006-07, Rs.11,861 in 2007-08, and Rs.17,076 in 2008-09 as against
per hectare net returns from all other crops estimated at Rs.11,012 in 2006-07, Rs.10,170
in 2007-08, and Rs.14,022 in 2008-09. Even per quintal net return was substantially high
in the case of pulses crop farming vis-à-vis all other crop farming since the average
category of sampled farmer of Amravati district showed a net per quintal return in total
pulses crop farming to the tune of Rs.1,238 in 2006-07, Rs.1,470 in 2007-08, and
Rs.1,845 in 2008-09 as against per quintal net returns from all other crops estimated at
Rs.922 in 2006-07, Rs.910 in 2007-08, and at Rs.1,152 in 2008-09. These estimates

178
clearly show positive impact of NFSM programme on pulses crop farming as the net
returns from pulses crops are much as against other crops cultivated by the sampled
farmers of Amravati district, especially in 2008-09.
8.4.3.3 Economics of Pulses Crops in Non-NFSM District
Although pulses crop farming was lucrative proposition in both NFSM district of
Amravati and non-NFSM district of Beed, the amount of net profit involved in the
cultivation of pulses crops stood at much higher in the NFSM district of Amravati as
against the non-NFSM district of Beed. In the case of total pulses crops, the element of
per hectare net return from pulses crops in Amravati district, on an average, was
estimated at Rs.8,897 in 2006-07, Rs.11,861 in 2007-08, and Rs.17,076 in 2008-09 as
against similar figures estimated for the non-NFSM district of Beed at Rs.9,750 in 2006-
07, Rs.11,487 in 2007-08, and Rs.13,829 in 2008-09. Further, as for the average category
of sampled farmers belonging to non-NFSM district of Beed, the total pulses crops
yielded a per quintal net returns to the tune of Rs.1,243 in 2006-07, Rs.1,364 in 2007-08,
and Rs.1,603 in 2008-09. On the other hand, the average category of sampled farmer of
Amravati district showed a net per quintal return in total pulses crop farming to the tune
of Rs.1,238 in 2006-07, Rs.1,470 in 2007-08, and Rs.1,845 in 2008-09. These estimates
clearly bring us closer to the fact that not only various pulses crops cultivated in NFSM
district of Amravati yielded higher net returns as against pulses crops cultivated in non-
NFSM district of Beed but the rise in the element of profit in pulses crop cultivation in
2008-09 vis-à-vis 2007-08 and 2006-07 was quite substantial in NFSM district of
Amravati as against its counterpart in non-NFSM district of Beed, which clearly show a
positive impact of NFSM programme in the NFSM district of Amravati.
8.4.3.4 Economics of Other Major Crops in Non-NFSM District
Since the sampled farmers belonging to the non-NFSM district of Beed cultivated
a large number of diversified crops with significantly large area allocation towards highly
profitable crops like sugarcane, cotton, soybean, onion and banana, the cost and return
structure with respect to other crops put together was influenced by these crops. The
element of profit involved in the cultivation of all other crops put together was much
higher in the non-NFSM district of Beed as against the NFSM district of Amravati. This
is concomitant from the fact that the average category of farmers drawn from non-NFSM
district of Beed generated per hectare net returns from all other crops put together to the
tune of Rs.18,392 in 2006-07, Rs.20,979 in 2007-08, and Rs.19,991 in 2008-09 as against

179
corresponding figures for all other crops in NFSM district of Amravati estimated at
Rs.11,017 in 2006-07, Rs.10,170 in 2007-08, and Rs.14,022 in 2008-09. In dismal
contrast to this, the element of profit involved in the cultivation of all pulses crops put
together was much higher in the NFSM district of Amravati as against the non-NFSM
district of Beed since the average category of sampled farmers belonging to NFSM
district of Amravati derived per hectare net returns from all pulses crops put together of
the order of Rs.8,897 in 2006-07, Rs.11,861 in 2007-08, and Rs.17,076 in 2008-09 as
against corresponding figures for all pulses crops in non-NFSM district of Beed estimated
at Rs.9,750 in 2006-07, Rs.11,487 in 2007-08, and Rs.13,829 in 2008-09.
The comparative analysis drawn from the NFSM district of Amravati and non-
NFSM district of Beed clearly shows positive impact of NFSM programme in raising
various pulses crops since the net returns from these crops are not only higher in NFSM
district of Amravati as against non-NFSM district of Beed but net returns from pulses
have grown very sharply in 2008-09 over that of 2007-08, especially in NFSM district of
Amravati. In fact, the farmers belonging to NFSM district of Amravati derived 44 per
cent higher net returns from pulses crop cultivation in 2008-09 over that of 2007-08 as
against only 20 per cent higher net returns being generated from pulses crop cultivation in
non-NFSM district of Beed in 2008-09 over that of 2007-08. However, the scenario with
respect to all other crops was entirely different and sampled farmers of non-NFSM
district derived much higher returns from these crops as compared to their counterpart in
NFSM district of Amravati.
8.4.4 Technology Adoption and Marketing
In this study, the responses of sampled farmers with respect to knowledge about
improved varieties of pulses, sources of knowledge, area under improved varieties of
pulses, recommended practices followed by them in the cultivation of pulses in terms of
sowing practices, seed practices, and other practices, problems with improved varieties of
pulses, suggested solutions for improved varieties of pulses, channels of marketing of
pulses crops, quantity of pulses crops sold, extent of government procurement of pulses
crops, etc. have been assessed.
8.4.4.1 Area Under Improved Varieties of Pulses
In the NFSM district of Amravati, the proportion of households to total sampled
households reporting area under improved varieties was 78 per cent in the case of mung
crop, 74 per cent for gram and 30 per cent for tur crop. On the other hand, in the non-

180
NFSM district of Beed, the proportion of households to total sampled households
reporting area under improved varieties was 30 per cent in the case of mung crop, 60 per
cent for gram and 66 per cent for tur crop. Further, in NFSM district of Amravati, the
proportion of area under improved varieties to net sown area was worked out at 94 per
cent for mung, 96 per cent for gram, and 76 per cent for tur. Contrary to this, in the non-
NFSM district of Beed, the proportion of area under improved varieties to net sown area
was worked out at 87 per cent for mung, 100 per cent for gram, and 81 per cent for tur.
8.4.4.2 Knowledge of Improved Varieties of Pulses
About 84 per net of the total number of sampled farmers of NFSM district of
Amravati and 78 per cent of the non-NFSM district of Beed had acquired knowledge
about improved varieties of pulses. Extension agents and neighbours were the major
sources of knowledge about improved varieties of pulses in the case of both NFSM
district of Amravati and non-NFSM district of Beed. In the case of NFSM district of
Amravati, 50 per cent of the sampled farmers received knowledge about improved
varieties of pulses from extension agents, 43 per cent from neighbours, and remaining 7
per cent from other sources like friend, relatives, media, etc. As for non-NFSM district of
Beed, 56 per cent of the total sampled farmers acquired knowledge about improved
varieties of pulses from extension agents and 44 per cent from neighbours, showing
higher proportion in this respect from extension agents.
8.4.4.3 Recommended Practices in NFSM and Non-NFSM Districts
In terms of technology adoption with respect to pulses crops, while majority of
the sampled farmers belonging to the NFSM district of Amravati followed recommended
sowing, seed and other practices in the cultivation of mung and gram crop, this was not
the case in the cultivation of tur crop by them as most of the sampled farmers of the
NFSM district of Amravati neither followed any of the recommended sowing practices
nor recommended seed and other practices like application of organic manure and
chemical fertilizer, etc. It was only in the case of large farmers that recommended
practices in terms of use of chemical fertilizer for tur was followed on reasonably higher
scale. On the other hand, in the case of non-NFSM district of Beed, though majority of
the sampled farmers did not follow any recommended practices in the case of mung crop
cultivation, the cultivation of other pulses crops like gram and tur was followed as per the
recommended practices since 60 per cent of the sampled households of non-NFSM
district of Beed favoured their view in terms of following recommended practices in the
181
cultivation of gram crop and 64 per cent in the cultivation of tur crop, though this
proportion stood at 32 per cent for mung crop.
8.4.4.4 Problems with Improved Varieties of Pulses
The expensive nature of cultivation of improved varieties of pulses and
application of larger doses of other inputs in the cultivation of improved varieties were
identified as the major problems faced by the households belonging to the NFSM district
of Amravati. However, in the case of non-NFSM district of Beed, the major problems
with respect to improved varieties were non-availability of improved varieties of seeds,
untimely availability, expensive nature of improved varieties of seeds and application of
large doses of other inputs in the cultivation of improved varieties of pulses.
8.4.4.5 Suggested Solution for Improved Varieties of Pulses
The households belonging to NFSM district of Amravati and non-NFSM district
of Beed accorded different rankings to various suggestions with respect to the improved
varieties of pulses crops seeds. While majority of the sampled households of NFSM
district of Amravati favoured involvement of an element of subsidy in the purchase of
improved varieties of mung, gram and tur crop seeds, the suggestions of sampled
households of non-NFSM district was in favour of timely availability of improved
varieties of seeds in the case of mung crop and cheaper availability of improved varieties
of seeds with respect to tur crop.
8.4.4.6 Marketing of Pulses Crops
While the sampled households of NFSM district of Amravati performed
marketing of various pulses crops through regulated markets, commission agents and
village markets, the marketing of pulses crops in the non-NFSM district of Beed was
noticed mainly through regulated markets and at a very small scale through commission
agents. In the NFSM district of Amravati, while about 51 per cent of the total sampled
households sold their mung and gram crop produce through regulated markets, 34 per
cent through commission agents and 15 per cent through village markets, these
proportions for tur crop were worked out at 75 per cent, 12 per cent and 13 per cent,
respectively. On the other hand, 95 per cent of sampled households of non-NFSM district
of Beed sold their mung and gram crop produce through regulated markets and remaining
5 per cent through commission agents. In Need district, the proportion of households to
total sampled households selling their tur crop produce through regulated market was 86
per cent with remaining 14 per cent selling their produce through commission agents.

182
8.4.4.7 Quantity of Pulses Marketed
A comparative analysis with respect to marketing of pulses crops revealed that the
sampled farmers belonging to the non-NFSM district of Beed mostly depended on
regulated markets for the marketing of their pulses crops since the share of regulated
markets in total marketed surplus of mung, gram and tur crop in this district during 2008-
09 stood at 93 per cent, 96 per cent and 93 per cent, respectively, with share of
commission agents in total marketed surplus of mung, gram and tur being 7 per cent, 4
per cent and 7 per cent, respectively. Contrary to non-NFSM district of Beed, the
sampled farmers of NFSM district of Amravati also sold their marketed surplus of pulses
crops through village markets, apart from selling their marketed surplus through
regulated markets and commission agents. However, the major marketed surplus of
pulses crops in the NFSM district of Amravati with all the sampled farmers put together
was diverted through regulated markets only with share of regulated markets in marketed
surplus of mung, gram and tur during 2008-09 being 51 per cent, 57 per cent and 85 per
cent, respectively, and the share of commission agents in this respect being 38 per cent,
36 per cent and 10 per cent, respectively, with village markets showing very little share.
8.4.5 Farmers’ Perceptions for Cultivation of Pulses
In this study, farmers’ perceptions have been recorded and analysed with respect
to the cultivation of various pulses crops, reasons for their cultivation, problems in their
cultivation and suggested remedial measures with respect to their cultivation.
8.4.5.1 Major Pest Problems in Pulses Cultivation
A comparative analysis between NFSM district of Amravati and non-NFSM
district of Beed revealed that the extent of per acre loss cased by various pests with
respect to pulses crops was higher in the non-NFSM district of Beed as against NFSM
district of Amravati since per acre losses caused by various pests with respect to pulses
crops for the average category of farmers was estimated at 11.31 per cent by pod borer,
10.52 per cent by pod fly and 10.11 per cent by wilt in the NFSM district of Amravati
and 13.56 per cent by pod borer, 11.36 per cent by pod fly and 12.63 per cent by wilt in
the non-NFSM district of Beed. Both NFSM district of Amravati and non-NFSM district
of Beed showed mung, tur and gram as the pulses crops being affected by various pests.
8.4.5.2 Reasons for Growing Pulses Crops
While the sampled households of NFSM district of Amravati showed profitability
as the major cause for growing pulses crops on their farms with 72 per cent of sampled

183
households airing their view in its favour, the reason for the cultivation of various pulses
crops in the non-NFSM district of Beed was found to be both home consumption and
profitability since 48 per cent of the total sampled households of Beed district favoured
profitability as the cause of cultivation of pulses crops and 46 per cent of households of
this district aired their view in favour of home consumption.
8.4.5.3 Criteria for Pulses Cultivation
The sampled households drawn from the NFSM district of Amravati and non-
NFSM district of Beed used rainfall followed by soil suitability as the major criteria in
deciding area allocation under pulses crops with weightage to rainfall being higher in the
NFSM district as against non-NFSM district since 68 per cent of the sampled households
of NFSM district of Amravati favoured rainfall as the criteria for allocation of area under
pulses crops as against 58 per cent of the sampled households of non-NFSM district of
Beed who aired their view in favour of rainfall as the criteria in this respect. However, 20
per cent of the sampled households of NFSM district of Amravati and 26 per cent of the
sampled households of non-NFSM district of Beed aired their view in favour of soil
suitability as the criteria in deciding area allocation under pulses crop.
8.4.5.4 Reasons for Low Area under Pulses
The analysis with respect to reported reasons for low area allocation under pulses
crops revealed that about 28 per cent of the sampled households of NFSM district of
Amravati district opted for low area allocation under pulses crops due to yield and price
instability, 22 per cent due to low profitability, 20 per cent due to pest related problems,
16 per cent due to marketing related problems, and 14 per cent due to low yield related
problem. In the case of non-NFSM district of Beed, about 46 per cent of the total sampled
households opted for low area allocation under pulses crops due to low profitability, 32
per cent due to low levels of yields, 14 per cent due to yield and price instabilities, 2 per
cent due to marketing related problems, and 6 per cent due to pest related problems.
8.4.5.5 Crops Grown on Inferior Quality of Land
The sampled households belonging to NFSM district of Amravati mainly used
inferior quality of land for the cultivation of pulses, oilseeds and vegetable crops since 38
per cent of the sampled households used this land for the cultivation of pulses, 28 per
cent used it for the cultivation of oilseeds and another 28 per cent used this land for the
cultivation of vegetables. On the other hand, the inferior quality of land in non-NFSM
district of Beed was chiefly used for the cultivation of pulses, coarse cereals, vegetables,

184
oilseeds and also superior cereals since 40 per cent of the sampled households of Beed
district used inferior quality of land for the cultivation of pulses, 26 per cent used it for
the cultivation of course cereals, 16 per cent used it for the cultivation of vegetables, 10
per cent used it for the cultivation of superior cereals and 8 per cent used it for the
cultivation of oilseeds.
8.4.5.6 Problems with Pulses on Inferior Quality of Land
The sampled households belonging to the NFSM district of Amravati and non-
NFSM district of Beed showed some variations in terms of problems faced by them in
terms of cultivation of pulses crops on inferior quality of land since 47 per cent of the
sampled households of NFSM district had reported low yield and 34 per cent showed
both poor quality of grain and low yield as the major problems faced by them in the
cultivation of pulses crops on inferior quality of land. The proportion of households in the
non-NFSM district of Beed reporting low yield as the major problem in the cultivation of
pulses crops on inferior quality of land was as high as 58 per cent, whereas 28 per cent of
the sampled households of this district reported poor quality of grain as the major
problem faced by them in the cultivation of pulses crops on the inferior quality of land.
8.4.5.7 Reasons for Shifting from Pulses to Other Crops
While the reported responses of the sampled households belonging to the NFSM
district of Amravati with respect to reasons for shifting from pulses to other crops were
mainly confined to lack of assured market, uncertainty in the yield of improved varieties
of seeds and application of large doses of other inputs, the sampled households of non-
NFSM district of Beed had reported application of large doses of other inputs, uncertainty
in the yield of improved varieties of seeds, lack of assured market, low price realization,
and low yield as the reasons for shifting from pulses to other crops cultivation. However,
a couple of sampled households of NFSM district of Amravati had also cited low price
realization as the reason for shifting from pulses to other crops cultivation.
8.4.5.8 Farmers Willingness to Grow Pulses
A comparative analysis between the sampled farmers drawn from the NFSM
district of Amravati and non-NFSM district of Beed revealed that while all the medium
and large categories of sampled farmers of NFSM district of Amravati were willing to
grow pulses under assured market conditions, this willingness was cent per cent in the
case of small and large categories of sampled farmers in the case of non-NFSM district of
Beed. In general, about 96 per cent of the sampled farmers of the NFSM district of

185
Amravati were willing to grow pulses under assured market condition, whereas this
proportion for non-NFSM district of Beed stood at 94 per cent.
8.4.5.9 Major Problems in Cultivating Pulses
A comparative analysis between NFSM district of Amravati and non-NFSM
district of Beed with respect to the problems faced by the households in the cultivation of
pulse crops revealed that lack of irrigation facilities, lower yield and lower market prices
were the major problems faced by the sampled households belonging to the NFSM
district of Amravati, whereas sampled farmers of non-NFSM district of Beed showed
lack of irrigation, lack of improved varieties of seeds, lower yields and low market prices
as the major problems faced by them in the cultivation of pulse crops on their farms.
High incidence of pest was another major problem faced by the sampled households
belonging to the non-NFSM district of Beed.
8.4.5.10 Important Suggestion for Cultivating Pulses
The major suggestion of the sampled households belonging to the NFSM district
of Amravati and non-NFSM district of Beed with respect to pulse crops cultivation
mainly revolved around improvement in the existing irrigation facilities, availability of
high yielding varieties of seeds, availability of pest resistant varieties of seeds and
provision of higher market prices for various pulse crops since all these suggestions were
assigned 1st, 2
nd or 3
rd ranking by majority of the sampled households belonging to both
NFSM district of Amravati and non-NFSM district of Beed.
8.4.6 Impact of NFSM-Pulses
In order to evaluate impact of NFSM-pulses, responses of the sampled households
of NFSM district of Amravati have been assessed with respect to their awareness of
NFSM for pulses, assistance received and the type of assistance, usefulness of the
assistance, area allocation under pulse crops before and after NFSM programme,
production of pulses crops before and after NFSM programme, etc.
8.4.6.1 Farmers’ Awareness of NFSM-Pulses
The sampled farmers belonging to the NFSM district of Amravati were quite
aware of the NFSM-pulses programme since 76 per cent of the total sampled farmers of
this district aired their view in favour of their awareness of the programme and this
proportion among various categories stood at 67 per cent in marginal category, 84 per
cent in small, 70 per cent in medium and 83 per cent in large category with an average of
76 per cent for the average category of farmers of the NFSM district of Amravati.

186
8.4.6.2 Assistance Received under NFSM-Pulses
The response with respect to assistance under NFSM-pulses programme was quite
positive since 76 per cent of the total sampled farmers belonging to the NFSM district of
Amravati aired their view in favour of receiving assistance under the programme and this
proportion among various categories stood at 67 per cent in marginal category, 84 per
cent in small, 70 per cent in medium and 83 per cent in large category.
8.4.6.3 Type of Assistance received under NFSM-Pulses
About 52 per cent of the sampled households of NFSM district of Amravati were
found to air their view in favour of receiving improved varieties of seeds of pulses crops
under NFSM programme, 21 per cent received assistance on INM, 6 per cent received
assistance on IPM, 17 per cent received various equipments, and about 5 per cent
received training under the programme. The proportion of sampled households showing
receipt of improved varieties of seeds of pulse crops was 50 per cent in marginal
category, 48 per cent in small, 55 per cent in medium and 67 per cent in large category.
8.4.6.4 Usefulness of NFSM-Pulses
Majority of the sampled households belonging to the NFSM district of Amravati
found NFSM programme for pulses very useful since 66 per cent of the total sampled
households belonging to the NFSM district of Amravati aired their view in favour of the
programme. Among various categories, the proportion of households finding NFSM
programme for pulses crops quite useful was 67 per cent in marginal category, 63 per
cent in small, 70 per cent in medium and 67 per cent in large category.
8.4.6.5 Type of Usefulness of NFSM-Pulses
In the NFSM district of Amravati, about 34 per cent of the sampled households
favoured the NFSM programme for pulses due to rise in yield levels of pulses crops, 22
per cent due to reduction in pest attacks, 16 per cent due to reduction in drudgery, and 28
per cent owing to their increased knowledge about better varieties and practices.
8.4.6.6 Area under Pulse Crops Before and After NFSM
The sampled households of NFSM district of Amravati showed a rise in area
allocation under various pulses crops in 2008-09 as against average area allocation under
pulses crops during 2006-07 and 2007-08 with the exception of tur crop, which showed a
decline in area allocation in 2008-09 as against during 2006-07 and 2008-09. As a result,
the total area under pulses crops increased to 330.02 acres, which was estimated at
310.12 acres during 2006-07 and 2008-09, showing 6.42 per cent rise in area under pulse

187
crops in 2008-09 over that of 2006-07 and 2007-08 average estimate. This clearly shows
a positive impact of NFSM programme for pulses crops as the area allocation under
pulses crops after the initiation of programme has increased on the sampled farms.
8.4.6.7 Production of Pulse Crops Before and After NFSM
The production of total pulses crops with all the sampled households belonging to
NFSM district of Amravati put together increased to 1221.50 quintals in 2008-09, which
was estimated at 936.75 quintals during 2006-07 and 2008-09, showing 30.40 per cent
rise in production of total pulse crops in 2008-09 over that of average production of
pulses crops during 2006-07 and 2007-08. Since rise in production of pulses crops on the
farms of sampled farmers of NFSM district stood at much faster than area expansion in
2008-09 over that of the average of 2006-07 and 2007-08, this is a clear cut indication of
rise in productivity level of pulse crops cultivated on the sampled farm in 2008-09 over
that of the average of 2006-07 and 2007-08, showing positive impact of NFSM
programme on productivity levels of pulses crops grown in the state of Maharashtra.
8.4.6.8 Increase in Area under Pulses after NFSM
About 50 per cent of the total sampled households of NFSM district of Amravati
aired positive response in terms of rise in area under pulses crops after initiation of
NFSM programme for pulses, and among various categories this proportion stood at 53
per cent in marginal category, 47 per cent in small, 40 per cent in medium and 67 per cent
in large category.
8.4.6.9 Extent of Increase in Area under Pulses after NFSM
Only 25 out of 50 sampled households of NFSM district of Amravati aired their
view in terms of rise in area under pulses crops after initiation of NFSM programme for
pulses crops and about 88 per cent of them showed more than 10 per cent rise in area
under pulses crops on their farms, 8 per cent showed 5-10 per cent rise in this respect,
and 4 per cent showed 2-5 per cent rise in area under pulses crops on their farms after
initiation of NFSM programme for pulses crops.
8.4.6.10 Suggestions for Improving NFSM-Pulses
In order to improve NFSM programme for pulses and make it more useful, the
suggestions of the sampled farmers mainly revolved around extension of irrigation
facilities, provision of improved varieties of seeds on subsidised rates, an element of
subsidy with respect to other inputs like fertilizer, pesticides, implements and machinery,
pest control measures, plant protection measures, etc, assured and remunerative market

188
prices for various pulse crops, organizing meetings with the farmers to make them aware
about the programme, timely availability of seeds, fertilizers, and other inputs, provision
of automatic pump sets on subsidised rates for spraying in the cultivation of tur crop,
provision of farm pond, sprinkler sets, etc.
8.5 Conclusions and Policy Implications
The study showed positive impact of NFSM programme on pulses crops
cultivation in the state of Maharashtra since the element of profit involved in the
cultivation of pulses crops turned out to be much higher in the NFSM district as against
the non-NFSM district. The element of profit involved in the cultivation of pulses crops
in NFSM district was even higher than all other crops cultivated in the district. Not only
this, the net profit margins in the cultivation of pulses crops in NFSM district were
substantially high in 2008-09 as against 2006-07 and 2007-08. The plausible reasons for
rise in profit margins in the cultivation of pulses crops could be traced in rise in yield
levels, higher prices on offer for pulses, adoption of improved varieties of seeds in pulses
crops cultivation, area under improved varieties, higher adoption of recommended
practices such as sowing, seed and other practices, including application of organic
manure, chemical fertilizers, etc., assistance received under NFSM-pulses programme
viz. improved varieties of seeds like breeder/foundation/certified seeds, assistance on
Integrated Nutrient Management (INM) – micronutrients/line/gypsum, etc., assistance on
Integrated Pest Management (IPM) - micronutrients/line/gypsum IPM, provision of
equipment like seed drills, pumpsets, sprinklers, conoweeder, Knapp-sack sprayers,
participation of farmers in various training programmes, reasonably assured market for
the pulses produce, etc.
The farmers generated substantial profit from pulses crops despite the fact that all
these crops in NFSM district were cultivated under rainfed conditions. The farmers in
NFSM district showed 6 per cent rise in area and 30 per cent rise in production of pulse
crops in 2008-09 over that of 2006-07 and 2007-08 average, showing sharp rise in
productivity level of pulses crops in the study area. However, the farmers were found to
face some major problems in the cultivation of improved varieties of pulses, which
mainly encompassed pest and marketing related problems, lack of availability of
improved varieties, untimely availability, expensive nature of improved varieties of
seeds, application of large doses of other inputs in the cultivation of improved varieties of
pulses, etc. Therefore, in order to improve NFSM programme for pulses and make it

189
more useful, farmers aired their own suggestions and these suggestions included
extension of irrigation facilities, provision of improved varieties of seeds on subsidised
rates, an element of subsidy with respect to other inputs like fertilizer, pesticides,
implements and machinery, pest control measures, plant protection measures, etc, assured
and remunerative market prices for various pulse crops, organizing meetings with the
farmers to make them aware about the programme, timely availability of seeds,
fertilizers, and other inputs, provision of automatic pump sets on subsidised rates for
spraying in the cultivation of tur crop, provision of farm pond, sprinkler sets, etc.
It is to be noted that earlier Sidhu and Sidhu (1991) had put forward a number of
suggestions, which encompassed development of draught-disease-and past resistant high
yielding varieties of pulses for different agro-climatic regions, diversification of
agriculture through introduction of pulses crops in wheat-paddy monoculture, etc.
Similarly, Kadrekar (1991) had suggested a number of strategies to increase pulses
production, especially, in the state of Maharashtra with major emphasis on protective
irrigation, soil fertility management, improved crop production technique, plant
protection measures, and diversification of cropping pattern. However, these strategies
and schemes could not yield the desired results so far as pulses production in the country
is concerned. The low level of technology adoption in pulses was the major reason for
poor performance of pulses crops in the country. However, the initiation of NFSM-pulses
would certainly pay rich dividend since the major thrust of this programme is on
increasing seed replacement and the replacement of older varieties by newer ones. One of
the major features of this is that it offers much more than what earlier programmes
offered, especially with respect to capacity building, monitoring and planning. The
execution of the programme remains within the district planning framework.
Although NFSM-pulses was implemented in 18 districts of Maharashtra from rabi
season of 2007-08, the positive impact of the programme has led the State to include all
33 districts from 2010-11. However, it is too early to evaluate the impact of any
programme based on one year performance after the initiation of the programme. Such
impact assessment would be more meaningful if 3-5 years period is considered after the
initiation of the programme. This is concomitant from the fact that though study shows
reasonably higher returns from pulses crop cultivation in 2008-09 but the rainfall was
also favourable during this year in the state of Maharashtra, which might have also
favoured the farmers to cultivate pulses crops vis-à-vis other competing crops.

190
REFERENCES
Alagh, Y.K. and P.S. Sharma (1980), ‘Growth of Crop Production: 1960-61 to 1978-79 –
Is it Decelerating?’ Indian Journal of Agricultural Economics, Vol. 35, No. 2, pp. 104-
118.
Bhatia, M.S. (1991), ‘Economic Constraints in Increasing Pulses Production’,
Agricultural Situation in India, Vol. 46, No. 5, pp. 279-284.
Dantwala, M.L. (1978), ‘Future of Institutional Reform and Technical Change in Indian
Agricultural Development’, Economic and Political Weekly, Special Number (August),
1299-1306.
Desai, Gunvant M. and N.V. Namboodiri (1983), ‘The deceleration Hypothesis and Yield
– Increasing Inputs in Indian Agriculture, Indian Journal of Agricultural Economics, Vol.
38, No. 4, pp. 497-508.
Kadrekar, S.B. (1991), ‘Strategies for Increasing Production of Pulses and Oilseeds in the
Konkan Region of Maharashtra’, Agricultural Situation in India, Vol. 46, No. 5, pp. 237-
277.
Gregory K. Price, Rip Landes, and A. Govindan (2003), ‘India’s Pulse Sector: Results of
Field Research’, Electronic Outlook Report from the Economic Research Service, WRS-
03-01, United States Development of Agriculture, May 2003
Sidhu, D.S. and J.S. Sidhu (1991), ‘Pulses and Oilseeds in India-Trends and Policy
Suggestions, Agricultural Situation in India, Vol. 46, No. 5, pp. 285-290.
Shah, Deepak (1997), ‘Foodgrain Production in India: A Drive Towards Self -
Sufficiency’, Artha Vijnana, Vol. 39, No. 2, pp.219-239.
Shah, Deepak (2003), ‘Sustainability of Slow Growth Foodgrain Crops in Maharashtra:
Issues and Options’, Agricultural Situation in India, Vol. 60, No.6, October.
Shah, Deepak (2009), ‘An Estimation of Seed Feed Ratios and Waste Allowance for
Major Pulse Crop in Maharashtra’, Artha Vijnana, Vol. 51, No. 4, pp. 377-394.
Moorty, T.V., K.D. Sharma and D.R. Thakur (1991), ‘Trends in the Production of Pulses
and Oilseeds in Himachal Pradesh’, Agricultural Situation in India, Vol. 46, No. 5, pp.
303-308.

191
APPENDIX
Appendix 1: Cropping Pattern – Over All Seasons: NFSM Amravati District (Area in Acres)
Area Sown
Kharif Season Rabi Season
Other Crops Pulses Pulse Other Category
Soybean Jowar Cotton Bajra Others Total Mung Tur Total G.
Total Gram Sunflo
wer Total G.
Total
2006-07 Marginal 5.75 - 1.00 - - 6.75 19.20 1.25 20.45 27.20 22.20 2.25 24.45 51.65 Small 5.00 6.96 0.95 1.30 - 14.21 45.78 5.70 51.48 65.69 43.58 - 43.58 109.27
Medium 2.00 9.00 6.00 - - 17.00 43.00 8.00 51.00 68.00 39.00 - 39.00 107.00
Large 6.00 - 14.00 - - 20.00 41.20 4.50 45.70 65.70 31.50 3.00 34.50 100.20
Total 18.75 15.96 21.95 1.30 - 57.96 149.18 19.45 168.63 226.59 136.28 5.25 141.53 368.12
2007-08 Marginal 1.00 3.00 - - - 4.00 17.50 2.50 20.00 24.00 21.75 3.00 24.75 48.75 Small 1.75 4.00 8.75 1.30 4.06 19.86 35.70 4.00 39.70 59.56 37.62 2.00 39.62 99.18 Medium 3.00 2.75 8.00 - 2.00 15.75 49.50 3.75 53.25 69.00 49.50 - 49.50 118.50
Large - 15.00 1.50 - 1.00 17.50 43.00 7.50 50.50 68.00 43.00 4.00 47.00 1150
Total 5.75 24.75 18.25 1.30 7.06 57.11 145.70 17.75 163.45 220.56 151.87 9.00 160.87 381.43
2008-09 Marginal 1.50 1.00 2.00 - 2.00 6.50 21.05 1.00 22.05 28.55 20.05 2.00 22.05 50.60 Small 3.80 2.50 6.00 - 8.65 20.95 36.86 5.95 42.81 63.76 37.86 3.38 41.24 105.00
Medium 5.50 4.00 7.00 - 7.00 23.50 39.75 4.50 44.25 67.75 41.00 6.00 47.00 114.75
Large 7.00 4.50 4.50 - - 16.00 58.00 2.00 60.00 76.00 62.00 - 62.00 138.00
Total 17.80 12.00 19.50 - 17.65 66.95 155.66 13.45 169.11 236.06 160.91 11.38 172.29 408.35
Average Marginal 2.75 1.33 1.00 - 0.67 5.75 19.25 1.58 20.83 26.58 21.33 2.42 23.75 50.33 Small 3.52 4.49 5.23 0.87 4.24 18.34 39.45 5.22 44.66 63.00 39.69 1.79 41.48 104.48
Medium 3.50 5.25 7.00 - 3.00 18.75 44.08 5.42 49.50 68.25 43.17 2.00 45.17 113.42
Large 4.33 6.50 6.67 - 0.33 17.83 47.40 4.67 52.07 69.90 45.50 2.33 47.83 117.73
Total 14.10 17.57 19.90 0.87 8.24 60.67 150.18 16.88 167.06 227.74 149.69 8.54 158.23 385.97
Note: In 2007-08 ‘Others’ under other crops include Kharif Sunflower and in 2008-09, ‘Others’ under
other crops include Kharif Sunflower and Ladyfinger

192
Appendix 2: Cropping Pattern – Over All Seasons: Non-NFSM Beed District
(Area in Acres) Area Sown
Kharif Season Rabi Season
Other Crops Pulses Pulse Other Category
Soybean Jowar Cotton Bajra Others Total Mung Tur Total G.
Total Gram Sugarc
ane Total G.
Total
2006-07 Marginal 4.50 - 6.75 - - 11.25 3.50 7.52 11.02 22.27 12.60 1.50 14.10 36.37
Small 7.00 - 27.00 5.00 - 39 12.00 9.60 21.6 60.6 13.00 5.00 24.00 84.6
Medium 9.00 - 36.00 0.50 - 45.5 6.75 18.50 25.25 70.75 8.50 3.50 32.70 103.45
Large 18.00 - 52.00 24.00 - 94 8.00 9.25 17.25 111.25 32.00 65.00 109.00 220.25
Total 38.50 - 121.75 29.50 - 189.75 30.25 44.87 75.12 264.87 66.10 75.00 179.80 444.67
2007-08 Marginal - 0.30 12.95 2.00 - 15.25 1.75 2.27 4.02 19.27 9.50 1.50 11.00 30.27 Small 11.00 - 22.50 2.00 - 35.5 11.50 10.85 22.35 57.85 16.50 8.00 31.50 89.35
Medium 5.00 1.00 41.00 - - 47 3.00 23.45 26.45 73.45 10.50 5.50 25.50 98.95
Large 7.25 - 18.00 13.00 - 38.25 23.00 16.00 39 77.25 64.00 52.00 142.25 219.5
Total 23.25 1.30 94.45 17.00 - 136 39.25 52.57 91.82 227.82 100.50 67.00 210.25 438.07
2008-09 Marginal - 1.00 14.25 0.50 - 15.75 2.00 7.02 9.02 24.77 3.00 1.50 4.50 29.27 Small 4.00 - 21.75 5.50 - 31.25 23.00 9.25 32.25 63.5 25.60 3.00 33.10 96.6
Medium 3.00 1.75 39.00 - - 43.75 12.00 12.25 24.25 68 15.70 9.50 33.70 101.7
Large 5.00 - 41.00 9.00 - 55 13.00 15.75 28.75 83.75 46.00 43.00 111.00 194.75
Total 12.00 2.75 116.00 15.00 - 145.75 50.00 44.27 94.27 240.02 90.30 57.00 182.30 422.32
Average Marginal 1.50 0.43 11.32 0.83 0.00 14.08 2.42 5.60 8.02 22.10 8.37 1.50 9.87 31.97 Small 7.33 0.00 23.75 4.17 0.00 35.25 15.50 9.90 25.40 60.65 18.37 5.33 29.53 90.18
Medium 5.67 0.92 38.67 0.17 0.00 45.42 7.25 18.07 25.32 70.73 11.57 6.17 30.63 101.37
Large 10.08 0.00 37.00 15.33 0.00 62.42 14.67 13.67 28.33 90.75 47.33 53.33 120.75 211.50
Total 24.58 1.35 110.73 20.50 0.00 157.17 39.83 47.24 87.07 244.24 85.63 66.33 190.78 435.02
Note: i) In 2006-07, the total area under Rabi season include area under Gram, Sugarcane, and some other
crops like Sunflower, Rabi Jowar, Wheat, Kardi, and Banana ii) In 2007-08, the total area under Rabi season include area under Gram, Sugarcane, and some other
crops like Rabi Jowar, Sunflower,, Wheat, Onion, and Banana
iii) In 2008-09, the total area under Rabi season include area under Gram, Sugarcane, and some other
crops like Rabi Jowar, Wheat, Onion, and Kardi
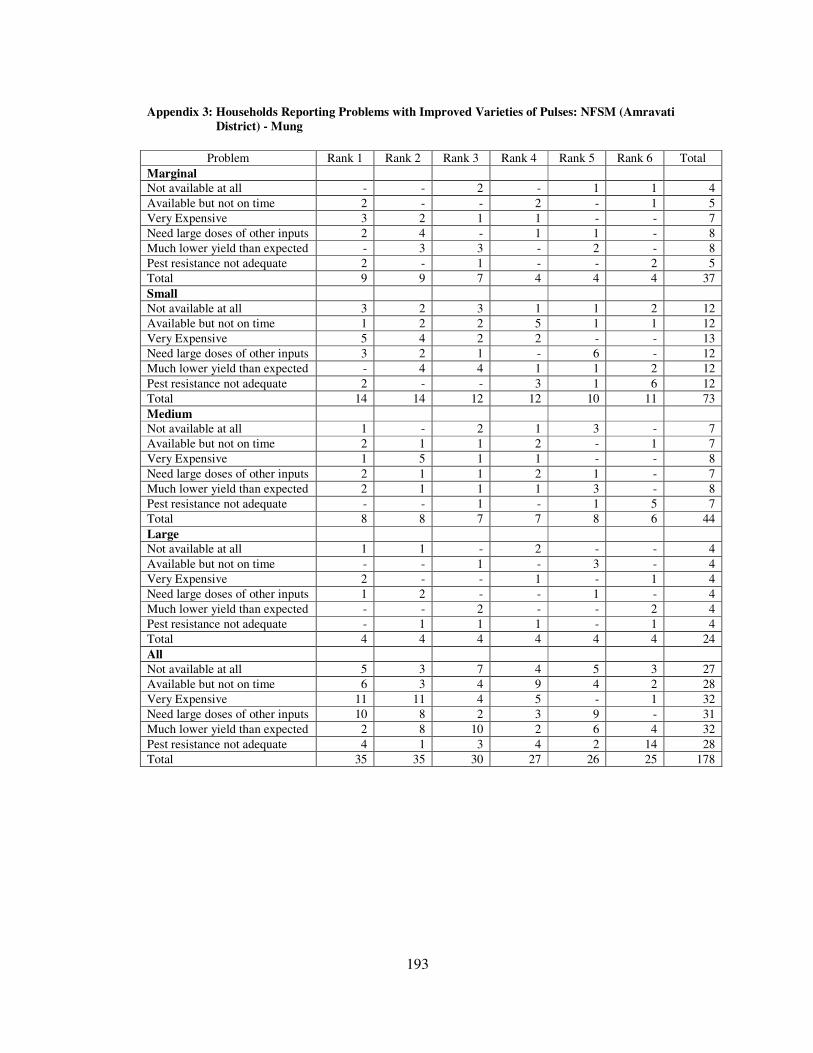
193
Appendix 3: Households Reporting Problems with Improved Varieties of Pulses: NFSM (Amravati
District) - Mung
Problem Rank 1 Rank 2 Rank 3 Rank 4 Rank 5 Rank 6 Total
Marginal
Not available at all - - 2 - 1 1 4
Available but not on time 2 - - 2 - 1 5
Very Expensive 3 2 1 1 - - 7
Need large doses of other inputs 2 4 - 1 1 - 8
Much lower yield than expected - 3 3 - 2 - 8
Pest resistance not adequate 2 - 1 - - 2 5
Total 9 9 7 4 4 4 37
Small
Not available at all 3 2 3 1 1 2 12
Available but not on time 1 2 2 5 1 1 12
Very Expensive 5 4 2 2 - - 13
Need large doses of other inputs 3 2 1 - 6 - 12
Much lower yield than expected - 4 4 1 1 2 12
Pest resistance not adequate 2 - - 3 1 6 12
Total 14 14 12 12 10 11 73
Medium
Not available at all 1 - 2 1 3 - 7
Available but not on time 2 1 1 2 - 1 7
Very Expensive 1 5 1 1 - - 8
Need large doses of other inputs 2 1 1 2 1 - 7
Much lower yield than expected 2 1 1 1 3 - 8
Pest resistance not adequate - - 1 - 1 5 7
Total 8 8 7 7 8 6 44
Large
Not available at all 1 1 - 2 - - 4
Available but not on time - - 1 - 3 - 4
Very Expensive 2 - - 1 - 1 4
Need large doses of other inputs 1 2 - - 1 - 4
Much lower yield than expected - - 2 - - 2 4
Pest resistance not adequate - 1 1 1 - 1 4
Total 4 4 4 4 4 4 24
All
Not available at all 5 3 7 4 5 3 27
Available but not on time 6 3 4 9 4 2 28
Very Expensive 11 11 4 5 - 1 32
Need large doses of other inputs 10 8 2 3 9 - 31
Much lower yield than expected 2 8 10 2 6 4 32
Pest resistance not adequate 4 1 3 4 2 14 28
Total 35 35 30 27 26 25 178

194
Appendix 4: Households Reporting Problems with Improved Varieties of Pulses: NFSM (Amravati
District) - Gram
Problem Rank 1 Rank 2 Rank 3 Rank 4 Rank 5 Rank 6 Total
Marginal
Not available at all - 1 3 1 1 - 6
Available but not on time 2 1 - 4 - - 7
Very Expensive 7 - 1 - - - 8
Need large doses of other inputs 1 3 1 1 2 1 9
Much lower yield than expected - 2 1 3 2 8
Pest resistance not adequate - 1 2 1 - 3 7
Total 10 8 8 7 6 6 45
Small
Not available at all - 2 1 4 2 1 10
Available but not on time 2 1 1 4 2 10
Very Expensive 5 1 1 1 2 1 11
Need large doses of other inputs 1 3 3 3 - - 10
Much lower yield than expected 6 2 1 - 2 1 12
Pest resistance not adequate - 2 4 1 - 5 12
Total 12 12 11 10 10 10 65
Medium
Not available at all - - 2 3 1 1 7
Available but not on time 1 3 1 1 1 - 7
Very Expensive 4 1 1 - - 2 8
Need large doses of other inputs 1 1 2 1 - 2 7
Much lower yield than expected 1 2 - - 4 - 7
Pest resistance not adequate 1 - - 2 1 3 7
Total 8 7 6 7 7 8 43
Large
Not available at all - - 1 - 2 1 4
Available but not on time 1 - 2 - 1 4
Very Expensive 2 2 - - - - 4
Need large doses of other inputs 1 1 1 - 1 4
Much lower yield than expected 1 - 1 1 1 4
Pest resistance not adequate - 1 2 1 - 4
Total 4 3 4 5 4 4 24
All
Not available at all - 3 7 8 6 3 27
Available but not on time 4 6 2 8 5 3 28
Very Expensive 18 4 3 1 2 3 31
Need large doses of other inputs 3 8 7 6 2 4 30
Much lower yield than expected 8 6 3 - 10 4 31
Pest resistance not adequate 1 3 7 6 2 11 30
Total 34 30 29 29 27 28 177

195
Appendix 5: Households Reporting Problems with Improved Varieties of Pulses: NFSM (Amravati
District) - Tur
Problem Rank 1 Rank 2 Rank 3 Rank 4 Rank 5 Rank 6 Total
Marginal
Not available at all - - - - - - -
Available but not on time - - - - - - -
Very Expensive - - - - - - -
Need large doses of other inputs - - - - - - -
Much lower yield than expected - - - - - - -
Pest resistance not adequate - - - - - - -
Total - - - - - - -
Small
Not available at all 1 2 1 1 - - 5
Available but not on time - 1 2 2 - 5
Very Expensive 3 2 - - - 1 6
Need large doses of other inputs - 1 1 - 4 - 6
Much lower yield than expected 2 - 1 1 - - 4
Pest resistance not adequate 1 - - - - 4 5
Total 7 5 4 4 6 5 31
Medium
Not available at all 1 - - 1 - 1 3
Available but not on time - - - 2 1 - 3
Very Expensive 1 1 1 1 4
Need large doses of other inputs 2 - - - 1 - 3
Much lower yield than expected - 1 2 - - - 3
Pest resistance not adequate - 1 - - 1 1 3
Total 4 3 3 3 3 3 19
Large
Not available at all - 1 - - - 1 2
Available but not on time - - 2 - - - 2
Very Expensive - 1 - - 1 - 2
Need large doses of other inputs 1 - - - - 1 2
Much lower yield than expected - 1 - - 1 - 2
Pest resistance not adequate 1 - - 1 - - 2
Total 2 3 2 1 2 2 12
All
Not available at all - 3 1 2 - 2 10
Available but not on time 4 - 3 4 3 - 10
Very Expensive 4 4 1 1 1 2 12
Need large doses of other inputs 3 1 1 - 2 1 11
Much lower yield than expected 2 2 3 1 - - 9
Pest resistance not adequate 2 1 - 1 6 5 10
Total 13 11 9 8 11 10 62

196
Appendix 6: Households Reporting Problems with Improved Varieties of Pulses: Non-NFSM (Beed
District) - Mung
Problem Rank 1 Rank 2 Rank 3 Rank 4 Rank 5 Rank 6 Total
Marginal
Not available at all - - - - - - -
Available but not on time - - - - - - -
Very Expensive - - - - - - -
Need large doses of other inputs - - - - - - -
Much lower yield than expected - - - - - - -
Pest resistance not adequate - - - - - - -
Total - - - - - - -
Small
Not available at all 1 - - 2 2 1 6
Available but not on time - 1 3 2 - - 6
Very Expensive 1 1 2 - 1 1 6
Need large doses of other inputs 2 2 - 1 1 - 6
Much lower yield than expected 1 2 - 1 1 1 6
Pest resistance not adequate 1 - 1 - 1 3 6
Total 6 6 6 6 6 6 36
Medium
Not available at all - - - 1 1 1 3
Available but not on time - - - 2 1 - 3
Very Expensive - 1 - - 1 1 3
Need large doses of other inputs 1 - 2 - - - 3
Much lower yield than expected 1 1 1 - - - 3
Pest resistance not adequate 1 1 - - - 1 3
Total 3 3 3 3 3 3 18
Large
Not available at all 1 - - - - 1 2
Available but not on time 1 1 - - - - 2
Very Expensive - 1 - 1 - 2
Need large doses of other inputs - 1 - 1 - 2
Much lower yield than expected - - - 2 - - 2
Pest resistance not adequate - - 1 1 2
Total 2 2 2 2 2 2 12
All
Not available at all 2 - - 3 3 3 11
Available but not on time 1 2 3 4 1 1 11
Very Expensive 1 2 3 - 3 2 11
Need large doses of other inputs 4 3 2 1 2 - 11
Much lower yield than expected 2 3 1 3 1 1 11
Pest resistance not adequate 2 1 2 - 1 5 11
Total 11 11 11 11 11 11 66

197
Appendix 7: Households Reporting Problems with Improved Varieties of Pulses: Non-NFSM (Beed
District) - Gram
Problem Rank 1 Rank 2 Rank 3 Rank 4 Rank 5 Rank 6 Total
Marginal
Not available at all - 2 - - 1 - 3
Available but not on time - - 1 1 1 - 3
Very Expensive 2 1 - - - - 3
Need large doses of other inputs - - 1 2 - - 3
Much lower yield than expected 1 - 1 - 1 - 3
Pest resistance not adequate - - - - - 3 3
Total 3 3 3 3 3 3 18
Small
Not available at all - 1 1 3 2 1 8
Available but not on time 2 1 3 - 1 1 8
Very Expensive - 4 2 1 - 1 8
Need large doses of other inputs - 2 1 3 2 - 8
Much lower yield than expected 5 - - - 2 1 8
Pest resistance not adequate 1 - 1 1 1 4 8
Total 8 8 8 8 8 8 48
Medium
Not available at all 3 - - - 3 - 6
Available but not on time 2 1 2 1 - - 6
Very Expensive 1 2 1 1 - 1 6
Need large doses of other inputs - - - 4 1 1 6
Much lower yield than expected - 1 3 - 2 - 6
Pest resistance not adequate - 2 - - - 4 6
Total 6 6 6 6 6 6 36
Large
Not available at all - 2 1 - 1 - 4
Available but not on time 2 1 - - 1 - 4
Very Expensive 2 - 1 1 - - 4
Need large doses of other inputs - 1 - 2 1 - 4
Much lower yield than expected - - 2 1 1 - 4
Pest resistance not adequate - - - - - 4 4
Total 4 4 4 4 4 4 24
All
Not available at all 3 5 2 3 7 1 21
Available but not on time 6 3 6 2 3 1 21
Very Expensive 5 7 4 3 - 2 21
Need large doses of other inputs - 3 2 11 4 1 21
Much lower yield than expected 6 1 6 1 6 1 21
Pest resistance not adequate 1 2 1 1 1 15 21
Total 21 21 21 21 21 21 126

198
Appendix 8: Households Reporting Problems with Improved Varieties of Pulses: Non-NFSM (Beed
District) - Tur
Problem Rank 1 Rank 2 Rank 3 Rank 4 Rank 5 Rank 6 Total
Marginal
Not available at all - 1 5 2 1 - 9
Available but not on time 4 3 1 - 1 - 9
Very Expensive 4 2 2 1 - - 9
Need large doses of other inputs 1 - - 5 3 - 9
Much lower yield than expected - 3 1 1 4 - 9
Pest resistance not adequate - - - - - 9 9
Total 9 9 9 9 9 9 54
Small
Not available at all 3 - 1 2 1 3 10
Available but not on time 1 2 2 4 1 10
Very Expensive 3 3 1 1 1 1 10
Need large doses of other inputs 2 - 4 1 2 1 10
Much lower yield than expected 1 4 1 2 1 1 10
Pest resistance not adequate 1 2 1 2 1 3 10
Total 10 10 10 10 10 10 60
Medium
Not available at all 3 - 1 1 - - 5
Available but not on time - 1 2 2 - - 5
Very Expensive - 3 - 1 - 1 5
Need large doses of other inputs 1 - - 1 2 1 5
Much lower yield than expected - 1 - - 2 2 5
Pest resistance not adequate 1 - 2 - 1 1 5
Total 5 5 5 5 5 5 30
Large
Not available at all - 2 1 2 - - 5
Available but not on time 3 1 - - 1 - 5
Very Expensive - - 4 1 - - 5
Need large doses of other inputs 1 1 - 1 2 - 5
Much lower yield than expected 1 1 - 1 2 - 5
Pest resistance not adequate - - - - - 5 5
Total 5 5 5 5 5 5 30
All
Not available at all - 3 8 7 2 3 29
Available but not on time 4 6 5 4 6 1 29
Very Expensive 7 8 7 1 1 2 29
Need large doses of other inputs 5 1 4 8 2 2 29
Much lower yield than expected 2 9 2 4 - 3 29
Pest resistance not adequate 2 2 3 2 6 18 29
Total 29 29 29 29 29 29 174

199
Appendix 9: Suggested Solutions for Improved Varieties: NFSM (Amravati District) - Mung
Problems Rank 1 Rank 2 Rank 3 Rank 4 Total
Marginal
Cheaper availability of seeds 4 3 1 - 8
Timely availability of seeds - 1 5 - 6
Subsidy 5 4 - - 9
Any other (Specify) - - - - -
Total 9 8 6 - 23
Small
Cheaper availability of seeds 5 4 5 - 14
Timely availability of seeds 3 5 5 - 13
Subsidy 6 5 3 - 14
Any other (Specify) - - - - -
Total 14 14 13 - 41
Medium
Cheaper availability of seeds 3 3 2 - 8
Timely availability of seeds 3 3 1 - 7
Subsidy 2 1 4 - 7
Any other (Specify) - - - - -
Total 8 7 7 - 22
Large
Cheaper availability of seeds 1 1 2 - 4
Timely availability of seeds 2 1 1 - 4
Subsidy 1 2 1 - 4
Any other (Specify) - - - - -
Total 4 4 4 - 12
All
Cheaper availability of seeds 13 11 10 - 34
Timely availability of seeds 8 10 12 - 30
Subsidy 14 7 8 - 34
Any other (Specify) - - - - -
Total 35 33 30 - 98

200
Appendix 10: Suggested Solutions for Improved Varieties : NFSM (Amravati District) - Gram
Problems Rank 1 Rank 2 Rank 3 Rank 4 Total
Marginal -
Cheaper availability of seeds 2 3 3 - 8
Timely availability of seeds 1 3 3 - 7
Subsidy 6 1 1 - 8
Any other (Specify) - - - - -
Total 9 7 7 23
Small -
Cheaper availability of seeds 3 7 1 - 11
Timely availability of seeds 1 1 9 - 11
Subsidy 8 3 1 - 12
Any other (Specify) - - - - -
Total 12 11 11 - 34
Medium - -
Cheaper availability of seeds 4 3 1 - 8
Timely availability of seeds 3 2 2 - 7
Subsidy 1 2 4 - 7
Any other (Specify) - - - - -
Total 8 7 7 - 22
Large
Cheaper availability of seeds - 4 - - 4
Timely availability of seeds 1 3 - 4
Subsidy 3 1 - 4
Any other (Specify) - - - - -
Total 4 4 4 12
All
Cheaper availability of seeds 9 17 6 - 31
Timely availability of seeds 6 6 19 - 29
Subsidy 18 6 3 - 31
Any other (Specify) - - - - -
Total 33 29 29 - 91

201
Appendix 11: Suggested Solutions for Improved Varieties: NFSM (Amravati District) - Tur
Problems Rank 1 Rank 2 Rank 3 Rank 4 Total
Marginal
Cheaper availability of seeds - - - - -
Timely availability of seeds - - - - -
Subsidy - - - - -
Any other (Specify) - - - - -
Total - - - - -
Small
Cheaper availability of seeds 1 3 2 - 6
Timely availability of seeds 2 3 1 - 6
Subsidy 3 - 3 - 6
Any other (Specify) -
Total 6 6 6 - 18
Medium 1
Cheaper availability of seeds 1 1 2 - 4
Timely availability of seeds - 1 2 - 3
Subsidy 2 1 - 3
Any other (Specify) - - - - -
Total 3 2 5 - 10
Large
Cheaper availability of seeds 1 1 - 2
Timely availability of seeds - 2 - - 2
Subsidy 1 1 - 2
Any other (Specify) - - - - -
Total 2 2 2 - 6
All
Cheaper availability of seeds 3 4 5 - 12
Timely availability of seeds 2 6 3 - 11
Subsidy 6 - 5 - 11
Any other (Specify) - - - - -
Total 11 10 13 - 34
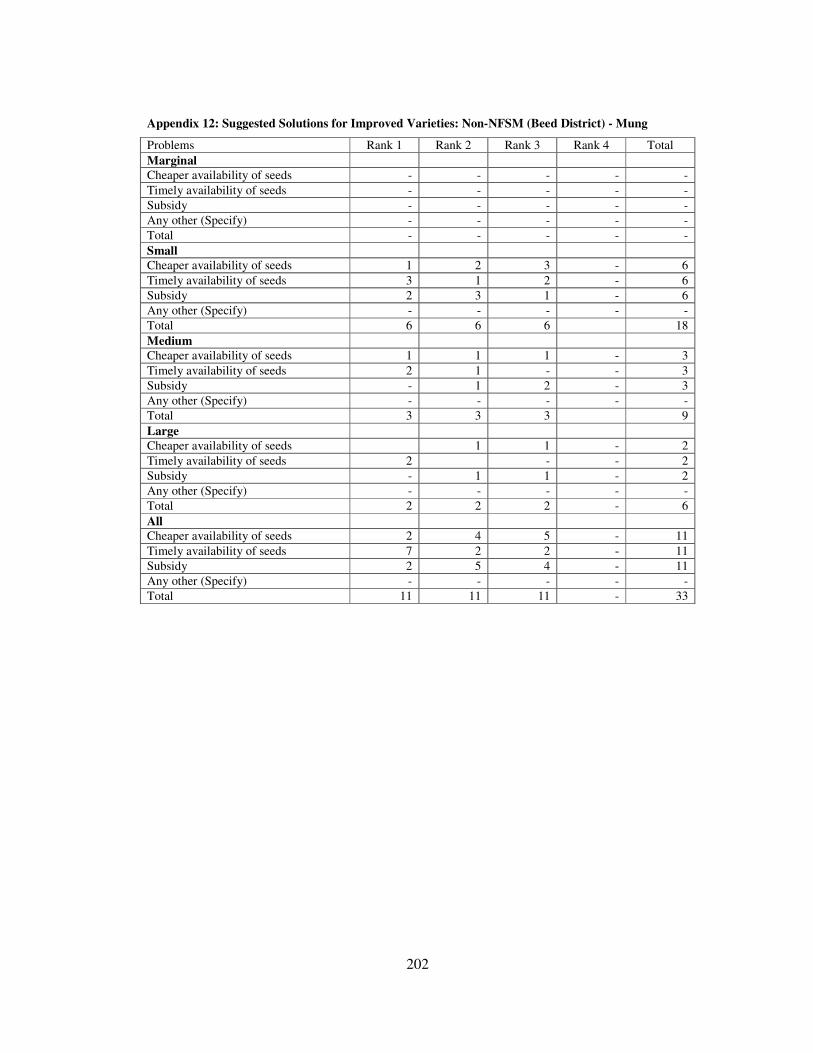
202
Appendix 12: Suggested Solutions for Improved Varieties: Non-NFSM (Beed District) - Mung
Problems Rank 1 Rank 2 Rank 3 Rank 4 Total
Marginal
Cheaper availability of seeds - - - - -
Timely availability of seeds - - - - -
Subsidy - - - - -
Any other (Specify) - - - - -
Total - - - - -
Small
Cheaper availability of seeds 1 2 3 - 6
Timely availability of seeds 3 1 2 - 6
Subsidy 2 3 1 - 6
Any other (Specify) - - - - -
Total 6 6 6 18
Medium
Cheaper availability of seeds 1 1 1 - 3
Timely availability of seeds 2 1 - - 3
Subsidy - 1 2 - 3
Any other (Specify) - - - - -
Total 3 3 3 9
Large
Cheaper availability of seeds 1 1 - 2
Timely availability of seeds 2 - - 2
Subsidy - 1 1 - 2
Any other (Specify) - - - - -
Total 2 2 2 - 6
All
Cheaper availability of seeds 2 4 5 - 11
Timely availability of seeds 7 2 2 - 11
Subsidy 2 5 4 - 11
Any other (Specify) - - - - -
Total 11 11 11 - 33

203
Appendix 13: Suggested Solutions for Improved Varieties: Non-NFSM (Beed District) - Gram
Problems Rank 1 Rank 2 Rank 3 Rank 4 Total
Marginal -
Cheaper availability of seeds - 3 - - 3
Timely availability of seeds - - 3 - 3
Subsidy 3 - - - 3
Any other (Specify) - - - - -
Total 3 3 3 - 9
Small
Cheaper availability of seeds 2 2 4 - 8
Timely availability of seeds 2 4 2 - 8
Subsidy 4 2 2 - 8
Any other (Specify) - - - - -
Total 8 8 8 - 24
Medium 1
Cheaper availability of seeds 3 3 - 6
Timely availability of seeds 3 1 2 - 6
Subsidy - 2 4 - 6
Any other (Specify) - - - - -
Total 6 6 6 - 18
Large
Cheaper availability of seeds 3 1 - 4
Timely availability of seeds 1 - 3 - 4
Subsidy 3 1 - - 4
Any other (Specify) - - - - -
Total 4 4 4 - 12
All
Cheaper availability of seeds 5 11 5 - 21
Timely availability of seeds 6 5 10 - 21
Subsidy 10 5 6 - 21
Any other (Specify) - - - - -
Total 21 21 21 - 63

204
Appendix 14: Suggested Solutions for Improved Varieties: Non-NFSM (Beed District) - Tur
Problems Rank 1 Rank 2 Rank 3 Rank 4 Total
Marginal
Cheaper availability of seeds 6 1 2 - 9
Timely availability of seeds 2 4 3 - 9
Subsidy 1 4 4 - 9
Any other (Specify) - - - - -
Total 9 9 9 - 27
Small
Cheaper availability of seeds 3 3 4 - 10
Timely availability of seeds 6 2 2 - 10
Subsidy 1 5 4 - 10
Any other (Specify) - - - - -
Total 10 10 10 - 30
Medium
Cheaper availability of seeds 2 - 3 - 5
Timely availability of seeds 1 3 1 - 5
Subsidy 2 2 1 - 5
Any other (Specify) - - - - -
Total 5 5 5 - 15
Large
Cheaper availability of seeds 2 3 - - 5
Timely availability of seeds 1 1 3 - 5
Subsidy 2 1 2 - 5
Any other (Specify) - - - - -
Total 5 5 5 - 15
All
Cheaper availability of seeds 13 7 9 - 29
Timely availability of seeds 10 10 9 - 29
Subsidy 6 12 11 - 29
Any other (Specify) - - - - -
Total 29 29 29 - 87

205
Appendix 15: Major Problems in Cultivating Pulses: NFSM Amravati District
Problem Rank 1 Rank 2 Rank 3 Rank 4 Rank 5 Rank 6 Rank 7 Total
Marginal
Lack of irrigation facilities 10 3 2 - - - - 15
Lack of improved varieties 2 1 1 2 1 - - 7
Lower yield 1 6 - 2 1 - - 10
High pest incidence 1 4 5 2 1 - - 13
Low market price 1 1 1 2 2 - 7
No assured market/procurement - - 5 2 2 3 - 12
Any other (Extension service) - - - - - - - -
Total 15 15 14 8 7 5 - 64
Small
Lack of irrigation facilities 8 3 5 1 - - - 17
Lack of improved varieties 1 1 5 5 2 - - 14
Lower yield 1 6 2 2 1 2 - 14
High pest incidence 2 2 3 3 6 2 - 18
Low market price 5 4 1 2 3 - 15
No assured market/procurement 1 2 1 1 1 9 - 15
Any other (Extension service) - - - - - - - -
Total 18 18 17 14 13 13 - 93
Medium
Lack of irrigation facilities 3 1 3 2 - 1 - 10
Lack of improved varieties 1 3 1 1 1 1 - 8
Lower yield 3 3 2 - - - 8
High pest incidence - 4 - 2 4 - 10
Low market price 3 - 2 - 2 2 - 9
No assured market/procurement - 2 1 1 1 4 - 9
Any other (Extension service) 1 1
Total 10 10 10 8 8 8 1 55
Large
Lack of irrigation facilities 2 2 - 1 1 - - 6
Lack of improved varieties - - 1 1 1 2 - 5
Lower yield 1 1 1 1 2 - - 6
High pest incidence 2 1 1 1 1 - - 6
Low market price 1 1 3 - 1 - - 6
No assured market/procurement - 1 - 2 - 3 - 6
Any other (Extension service) - - - - - - 1 1
Total 6 6 6 6 6 5 1 36
All
Lack of irrigation facilities 23 9 10 4 1 1 - 48
Lack of improved varieties 4 5 8 9 5 3 - 34
Lower yield 6 13 6 7 4 2 - 38
High pest incidence 5 11 9 8 12 2 - 47
Low market price 10 6 7 2 8 4 - 37
No assured market/procurement 1 5 7 6 4 19 - 42
Any other (Extension service) - - - - - - 2 2
Total 49 49 47 36 34 31 2 248

206
Appendix 15 (a): % Distribution of Major Problems in Cultivating Pulses: NFSM Amravati District
Problem Rank 1 Rank 2 Rank 3 Rank 4 Rank 5 Rank 6 Rank 7 Total
Marginal
Lack of irrigation facilities 66.67 20.00 13.33 - - - - 100.00
Lack of improved varieties 28.57 14.29 14.29 28.57 14.29 - - 100.00
Lower yield 10.00 60.00 - - 10.00 - - 100.00
High pest incidence 7.69 30.77 38.46 15.38 7.69 - - 100.00
Low market price 14.29 14.29 14.29 0.00 28.57 28.57 - 100.00
No assured market/procurement - - 41.67 16.67 16.67 25.00 - 100.00
Any other (Extension service) - - - - - - - -
Total 23.44 23.44 21.88 12.50 10.94 7.81 - 100.00
Small
Lack of irrigation facilities 47.06 17.65 29.41 5.88 - - - 100.00
Lack of improved varieties 7.14 7.14 35.71 35.71 14.29 - - 100.00
Lower yield 7.14 42.86 14.29 14.29 7.14 14.29 - 100.00
High pest incidence 11.11 11.11 16.67 16.67 33.33 11.11 - 100.00
Low market price 33.33 26.67 6.67 13.33 20.00 - - 100.00
No assured market/procurement 6.67 13.33 6.67 6.67 6.67 60.00 - 100.00
Any other (Extension service) -
Total 19.35 19.35 18.28 15.05 13.98 13.98 - 100.00
Medium
Lack of irrigation facilities 30.00 10.00 30.00 20.00 - 10.00 - 100.00
Lack of improved varieties 12.50 37.50 12.50 12.50 12.50 12.50 - 100.00
Lower yield 37.50 - 37.50 25.00 - - - 100.00
High pest incidence 0.00 40.00 0.00 20.00 40.00 - - 100.00
Low market price 33.33 0.00 22.22 0.00 22.22 22.22 - 100.00
No assured market/procurement 0.00 22.22 11.11 11.11 11.11 44.44 - 100.00
Any other (Extension service) - - - - - - 100.00 100.00
Total 18.18 18.18 18.18 14.55 14.55 14.55 1.82 100.00
Large
Lack of irrigation facilities 33.33 33.33 0.00 16.67 16.67 - - 100.00
Lack of improved varieties - - 20.00 20.00 20.00 40.00 - 100.00
Lower yield 16.67 16.67 16.67 16.67 33.33 - - 100.00
High pest incidence 33.33 16.67 16.67 16.67 16.67 - - 100.00
Low market price 16.67 16.67 50.00 0.00 16.67 - - 100.00
No assured market/procurement - 16.67 0.00 33.33 0.00 50.00 - 100.00
Any other (Extension service) 0.00 - - - - - 100.00 100.00
Total 16.67 16.67 16.67 16.67 16.67 13.89 2.78 100.00
All
Lack of irrigation facilities 47.92 18.75 20.83 8.33 2.08 2.08 - 100.00
Lack of improved varieties 11.76 14.71 23.53 26.47 14.71 8.82 - 100.00
Lower yield 15.79 34.21 15.79 18.42 10.53 5.26 - 100.00
High pest incidence 10.64 23.40 19.15 17.02 25.53 4.26 - 100.00
Low market price 27.03 16.22 18.92 5.41 21.62 10.81 - 100.00
No assured market/procurement 2.38 11.90 16.67 14.29 9.52 45.24 - 100.00
Any other (Extension service) - - - - - - 100.00 100.00
Total 19.76 19.76 18.95 14.52 13.71 12.50 0.81 100.00

207
Appendix 16: Major Problems in Cultivating Pulses: Non-NFSM Beed District
Problem Rank 1 Rank 2 Rank 3 Rank 4 Rank 5 Rank 6 Rank 7 Total
Marginal
Lack of irrigation facilities 6 3 1 4 - - - 14
Lack of improved varieties 2 2 3 4 3 - - 14
Lower yield 5 5 3 1 - - 14
High pest incidence 3 1 2 3 3 2 - 14
Low market price 5 1 2 - 7 1 - 14
No assured market/procurement - 2 1 - - 11 - 14
Any other (Extension service) - - - - - - -
Total 14 14 14 14 14 14 - 84
Small
Lack of irrigation facilities 1 13 - 1 2 - - 17
Lack of improved varieties 6 1 5 4 - 1 - 17
Lower yield 4 1 4 6 2 - - 17
High pest incidence 2 1 5 3 6 - - 17
Low market price 3 1 3 3 6 1 - 17
No assured market/procurement 1 - - - 1 15 - 17
Any other (Extension service) - - - - - - -
Total 17 17 17 17 17 17 - 102
Medium
Lack of irrigation facilities 2 4 3 1 3 - - 13
Lack of improved varieties 3 2 4 3 1 - - 13
Lower yield 4 3 2 2 1 1 - 13
High pest incidence - 1 2 7 3 - - 13
Low market price 4 2 2 - 4 1 - 13
No assured market/procurement - 1 - - 1 11 - 13
Any other (Extension service) - - - - - - -
Total 13 13 13 13 13 13 - 78
Large
Lack of irrigation facilities 2 1 1 1 1 - - 6
Lack of improved varieties - 1 3 2 - - - 6
Lower yield 1 - 1 1 3 - - 6
High pest incidence 1 2 1 2 - - - 6
Low market price 2 - - - 1 3 - 6
No assured market/procurement - 2 - - 1 3 - 6
Any other (Extension service) - - - - - - -
Total 6 6 6 6 6 6 - 36
All
Lack of irrigation facilities 11 21 5 7 6 - - 50
Lack of improved varieties 11 6 15 13 4 1 - 50
Lower yield 9 9 12 12 7 1 - 50
High pest incidence 6 5 10 15 12 2 - 50
Low market price 14 4 7 3 18 6 - 50
No assured market/procurement 1 5 1 - 3 40 - 50
Any other (Extension service) - - - - - - - -
Total 50 50 50 50 50 50 - 300

208
Appendix 16 (a) : % Distribution of Major Problems in Cultivating Pulses: Non-NFSM Beed District
Problem Rank 1 Rank 2 Rank 3 Rank 4 Rank 5 Rank 6 Rank 7 Total
Marginal
Lack of irrigation facilities 42.86 21.43 7.14 28.57 - - - 100.00
Lack of improved varieties 14.29 14.29 21.43 28.57 21.43 - - 100.00
Lower yield - 35.71 35.71 21.43 7.14 - - 100.00
High pest incidence 21.43 7.14 14.29 21.43 21.43 14.29 - 100.00
Low market price 35.71 7.14 14.29 - 50.00 7.14 - 100.00
No assured market/procurement - 14.29 7.14 - - 78.57 - 100.00
Any other (Extension service) - - - - - - - -
Total 16.67 16.67 16.67 16.67 16.67 16.67 - 100.00
Small
Lack of irrigation facilities 5.88 76.47 - 5.88 11.76 - - 100.00
Lack of improved varieties 35.29 5.88 29.41 23.53 - 5.88 - 100.00
Lower yield 23.53 5.88 23.53 35.29 11.76 - - 100.00
High pest incidence 11.76 5.88 29.41 17.65 35.29 - - 100.00
Low market price 17.65 5.88 17.65 17.65 35.29 5.88 - 100.00
No assured market/procurement 5.88 - - - 5.88 88.24 - 100.00
Any other (Extension service) - - - - - - - -
Total 16.67 16.67 16.67 16.67 16.67 16.67 - 100.00
Medium
Lack of irrigation facilities 15.38 30.77 23.08 7.69 23.08 - - 100.00
Lack of improved varieties 23.08 15.38 30.77 23.08 7.69 - - 100.00
Lower yield 30.77 23.08 15.38 15.38 7.69 7.69 - 100.00
High pest incidence - 7.69 15.38 53.85 23.08 - - 100.00
Low market price 30.77 15.38 15.38 - 30.77 7.69 - 100.00
No assured market/procurement - 7.69 - - 7.69 84.62 - 100.00
Any other (Extension service) - - - - - - - -
Total 16.67 16.67 16.67 16.67 16.67 16.67 - 100.00
Large
Lack of irrigation facilities 33.33 16.67 16.67 16.67 16.67 - - 100.00
Lack of improved varieties - 16.67 50.00 33.33 - - - 100.00
Lower yield 16.67 - 16.67 16.67 50.00 - - 100.00
High pest incidence 16.67 33.33 16.67 33.33 - - - 100.00
Low market price 33.33 - - - 16.67 50.00 - 100.00
No assured market/procurement - 33.33 - - 16.67 50.00 - 100.00
Any other (Extension service) - - - - - - - -
Total 16.67 16.67 16.67 16.67 16.67 16.67 - 100.00
All
Lack of irrigation facilities 22.00 42.00 10.00 14.00 12.00 - - 100.00
Lack of improved varieties 22.00 12.00 30.00 26.00 8.00 2.00 - 100.00
Lower yield 18.00 18.00 24.00 24.00 14.00 2.00 - 100.00
High pest incidence 12.00 10.00 20.00 30.00 24.00 4.00 - 100.00
Low market price 28.00 8.00 14.00 6.00 36.00 12.00 - 100.00
No assured market/procurement 2.00 10.00 2.00 - 6.00 80.00 - 100.00
Any other (Extension service) - - - - - - - -
Total 16.67 16.67 16.67 16.67 16.67 16.67 - 100.00

209
Appendix 17: Important Suggestions from the Farmers for Cultivating Pulses: NFSM Amravati District
Suggestions Rank 1 Rank 2 Rank 3 Rank 4 Rank 5 Rank 6 Total
Marginal
Improving irrigation facilities 11 2 2 - - - 15
Availability of high yielding varieties 1 8 1 2 - - 12
Availability of pest resistant varieties - 3 4 1 2 - 10
Assured procurement with MSP - 1 4 4 2 - 11
Higher market price 3 1 3 4 3 - 14
Any other (Providing extension service) - - - - - - -
Total 15 15 14 11 7 - 62
Small
Improving irrigation facilities 7 3 6 1 1 - 18
Availability of high yielding varieties 5 6 2 4 - 17
Availability of pest resistant varieties 1 2 4 7 3 - 17
Assured procurement with MSP 1 3 2 3 8 - 17
Higher market price 5 5 4 1 3 - 18
Any other (Providing extension service) - - - - - - -
Total 19 19 18 16 15 - 87
Medium
Improving irrigation facilities 4 - 6 - - - 10
Availability of high yielding varieties 2 7 - - - - 9
Availability of pest resistant varieties 1 3 2 3 1 - 10
Assured procurement with MSP - - - 6 3 - 9
Higher market price 2 - 2 - 5 1 10
Any other (Providing extension service) 1 - - - - 1 2
Total 10 10 10 9 9 2 50
Large
Improving irrigation facilities 3 1 - 1 1 - 6
Availability of high yielding varieties 1 3 2 - 6
Availability of pest resistant varieties - 1 2 1 2 - 6
Assured procurement with MSP - - 2 2 2 - 6
Higher market price 2 1 2 1 - 6
Any other (Providing extension service) - - - - - - -
Total 6 6 6 6 6 - 30
All
Improving irrigation facilities 25 6 14 2 2 - 49
Availability of high yielding varieties 9 24 5 6 - - 44
Availability of pest resistant varieties 2 9 12 12 8 - 43
Assured procurement with MSP 1 4 8 15 15 - 43
Higher market price 12 7 9 7 12 1 48
Any other (Providing extension service) 1 - - - - 1 2
Total 50 50 48 42 37 2 229

210
Appendix 17 (a): % Distribution of Important Suggestions from the Farmers for Cultivating Pulses:
NFSM Amravati District
Suggestions Rank 1 Rank 2 Rank 3 Rank 4 Rank 5 Rank 6 Total
Marginal
Improving irrigation facilities 73.33 13.33 13.33 - - - 100.00
Availability of high yielding varieties 8.33 66.67 8.33 16.67 - - 100.00
Availability of pest resistant varieties - 30.00 40.00 10.00 20.00 - 100.00
Assured procurement with MSP - 9.09 36.36 36.36 18.18 - 100.00
Higher market price 21.43 7.14 21.43 28.57 21.43 - 100.00
Any other (Providing extension service) - - - - - - -
Total 24.19 24.19 22.58 17.74 11.29 - 100.00
Small
Improving irrigation facilities 38.89 16.67 33.33 5.56 5.56 - 100.00
Availability of high yielding varieties 29.41 35.29 11.76 23.53 0.00 - 100.00
Availability of pest resistant varieties 5.88 11.76 23.53 41.18 17.65 - 100.00
Assured procurement with MSP 5.88 17.65 11.76 17.65 47.06 - 100.00
Higher market price 27.78 27.78 22.22 5.56 16.67 - 100.00
Any other (Providing extension service) - - - - - - -
Total 21.84 21.84 20.69 18.39 17.24 - 100.00
Medium
Improving irrigation facilities 40.00 0.00 60.00 - - - 100.00
Availability of high yielding varieties 22.22 77.78 - - - - 100.00
Availability of pest resistant varieties 10.00 30.00 20.00 30.00 10.00 - 100.00
Assured procurement with MSP - - - 66.67 33.33 - 100.00
Higher market price 20.00 - 20.00 - 50.00 10.00 100.00
Any other (Providing extension service) 50.00 - - - - 50.00 100.00
Total 20.00 20.00 20.00 18.00 18.00 4.00 100.00
Large
Improving irrigation facilities 50.00 16.67 0.00 16.67 16.67 - 100.00
Availability of high yielding varieties 16.67 50.00 33.33 - - - 100.00
Availability of pest resistant varieties - 16.67 33.33 16.67 33.33 - 100.00
Assured procurement with MSP - - 33.33 33.33 33.33 - 100.00
Higher market price 33.33 16.67 - 33.33 16.67 - 100.00
Any other (Providing extension service) - - - - - - -
Total 20.00 20.00 20.00 20.00 20.00 - 100.00
All
Improving irrigation facilities 51.02 12.24 28.57 4.08 4.08 - 100.00
Availability of high yielding varieties 20.45 54.55 11.36 13.64 0.00 - 100.00
Availability of pest resistant varieties 4.65 20.93 27.91 27.91 18.60 - 100.00
Assured procurement with MSP 2.33 9.30 18.60 34.88 34.88 - 100.00
Higher market price 25.00 14.58 18.75 14.58 25.00 2.08 100.00
Any other (Providing extension service) 50.00 - - - - 50.00 100.00
Total 21.83 21.83 20.96 18.34 16.16 0.87 100.00

211
Appendix 18: Important Suggestions from the Farmers for Cultivating Pulses: Non-NFSM Beed District
Suggestions Rank 1 Rank 2 Rank 3 Rank 4 Rank 5 Rank 6 Total
Marginal
Improving irrigation facilities 5 3 4 2 - - 14
Availability of high yielding varieties 2 4 4 4 - - 14
Availability of pest resistant varieties - 4 3 5 2 - 14
Assured procurement with MSP - 3 2 2 7 - 14
Higher market price 7 - 1 1 5 - 14
Any other (Providing extension service) - - - - - - -
Total 14 14 14 14 14 - 70
Small
Improving irrigation facilities 10 3 3 1 - - 17
Availability of high yielding varieties 3 3 5 5 1 - 17
Availability of pest resistant varieties 1 8 5 - 3 - 17
Assured procurement with MSP - 3 1 7 6 - 17
Higher market price 3 - 3 4 7 - 17
Any other (Providing extension service) - - - - - - -
Total 17 17 17 17 17 - 85
Medium -
Improving irrigation facilities 4 6 1 - 2 - 13
Availability of high yielding varieties 3 5 1 3 1 - 13
Availability of pest resistant varieties 1 1 7 3 1 - 13
Assured procurement with MSP - - 3 6 4 - 13
Higher market price 5 1 1 1 5 - 13
Any other (Providing extension service) - - - - - - -
Total 13 13 13 13 13 - 65
Large
Improving irrigation facilities 1 2 1 2 - - 6
Availability of high yielding varieties 1 2 1 2 - 6
Availability of pest resistant varieties 1 2 1 2 - - 6
Assured procurement with MSP - 1 1 1 3 - 6
Higher market price 4 - 1 - 1 - 6
Any other (Providing extension service) - - - - - - -
Total 6 6 6 6 6 - 30
All
Improving irrigation facilities 20 14 9 5 2 - 50
Availability of high yielding varieties 8 13 12 13 4 - 50
Availability of pest resistant varieties 3 15 16 10 6 - 50
Assured procurement with MSP - 7 7 16 20 - 50
Higher market price 19 1 6 6 18 - 50
Any other (Providing extension service) - - - - - - -
Total 50 50 50 50 50 - 250

212
Appendix 18 (a): % Distribution of Important Suggestions from the Farmers for Cultivating Pulses:
Non-NFSM Beed District
Suggestions Rank 1 Rank 2 Rank 3 Rank 4 Rank 5 Rank 6 Total
Marginal
Improving irrigation facilities 35.71 21.43 28.57 14.29 - - 100.00
Availability of high yielding varieties 14.29 28.57 28.57 28.57 - - 100.00
Availability of pest resistant varieties - 28.57 21.43 35.71 14.29 - 100.00
Assured procurement with MSP - 21.43 14.29 14.29 50.00 - 100.00
Higher market price 50.00 - 7.14 7.14 35.71 - 100.00
Any other (Providing extension service) - - - - - - -
Total 20.00 20.00 20.00 20.00 20.00 - 100.00
Small
Improving irrigation facilities 58.82 17.65 17.65 5.88 - - 100.00
Availability of high yielding varieties 17.65 17.65 29.41 29.41 5.88 - 100.00
Availability of pest resistant varieties 5.88 47.06 29.41 - 17.65 - 100.00
Assured procurement with MSP - 17.65 5.88 41.18 35.29 - 100.00
Higher market price 17.65 - 17.65 23.53 41.18 - 100.00
Any other (Providing extension service) - - - - - - -
Total 20.00 20.00 20.00 20.00 20.00 - 100.00
Medium
Improving irrigation facilities 30.77 46.15 7.69 - 15.38 - 100.00
Availability of high yielding varieties 23.08 38.46 7.69 23.08 7.69 - 100.00
Availability of pest resistant varieties 7.69 7.69 53.85 23.08 7.69 - 100.00
Assured procurement with MSP - - 23.08 46.15 30.77 - 100.00
Higher market price 38.46 7.69 7.69 7.69 38.46 - 100.00
Any other (Providing extension service) - - - - - - -
Total 20.00 20.00 20.00 20.00 20.00 - 100.00
Large
Improving irrigation facilities 16.67 33.33 16.67 33.33 - - 100.00
Availability of high yielding varieties - 16.67 33.33 16.67 33.33 - 100.00
Availability of pest resistant varieties 16.67 33.33 16.67 33.33 - - 100.00
Assured procurement with MSP - 16.67 16.67 16.67 50.00 - 100.00
Higher market price 66.67 - 16.67 - 16.67 - 100.00
Any other (Providing extension service) - - - - - - -
Total 20.00 20.00 20.00 20.00 20.00 - 100.00
All
Improving irrigation facilities 40.00 28.00 18.00 10.00 4.00 - 100.00
Availability of high yielding varieties 16.00 26.00 24.00 26.00 8.00 - 100.00
Availability of pest resistant varieties 6.00 30.00 32.00 20.00 12.00 - 100.00
Assured procurement with MSP - 14.00 14.00 32.00 40.00 - 100.00
Higher market price 38.00 2.00 12.00 12.00 36.00 - 100.00
Any other (Providing extension service) - - - - - - -
Total 20.00 20.00 20.00 20.00 20.00 - 100.00
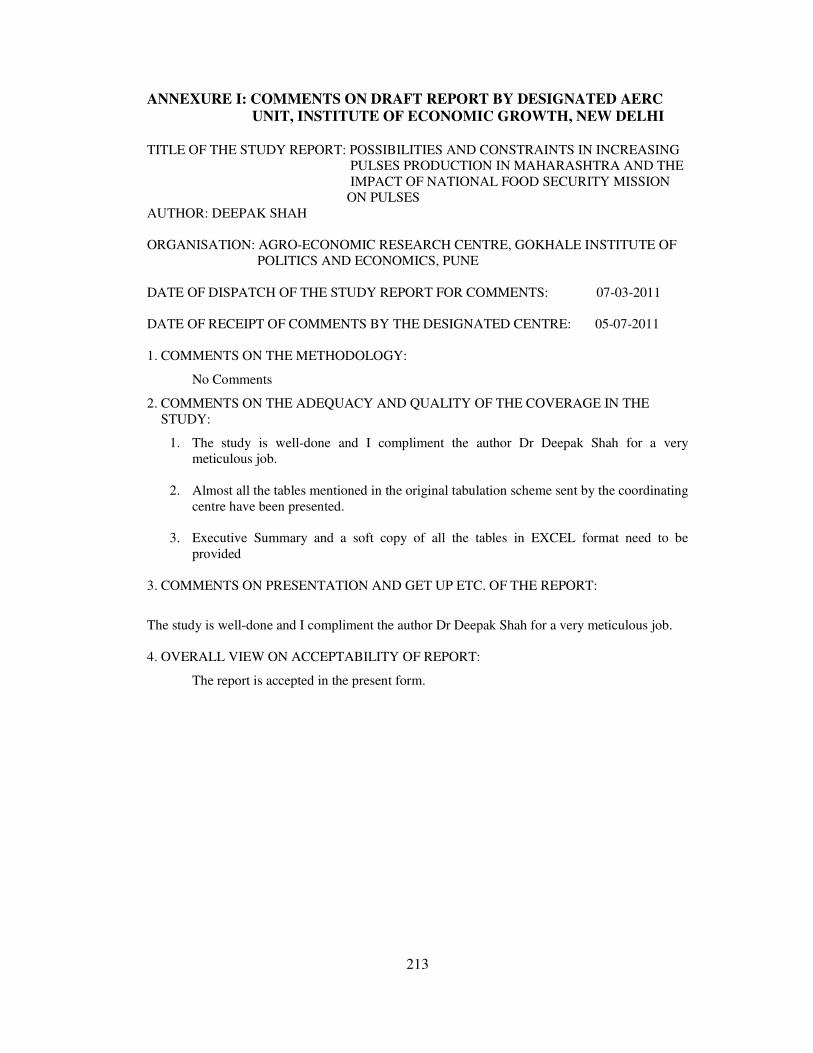
213
ANNEXURE I: COMMENTS ON DRAFT REPORT BY DESIGNATED AERC
UNIT, INSTITUTE OF ECONOMIC GROWTH, NEW DELHI TITLE OF THE STUDY REPORT: POSSIBILITIES AND CONSTRAINTS IN INCREASING
PULSES PRODUCTION IN MAHARASHTRA AND THE
IMPACT OF NATIONAL FOOD SECURITY MISSION
ON PULSES
AUTHOR: DEEPAK SHAH
ORGANISATION: AGRO-ECONOMIC RESEARCH CENTRE, GOKHALE INSTITUTE OF
POLITICS AND ECONOMICS, PUNE
DATE OF DISPATCH OF THE STUDY REPORT FOR COMMENTS: 07-03-2011
DATE OF RECEIPT OF COMMENTS BY THE DESIGNATED CENTRE: 05-07-2011
1. COMMENTS ON THE METHODOLOGY:
No Comments
2. COMMENTS ON THE ADEQUACY AND QUALITY OF THE COVERAGE IN THE
STUDY:
1. The study is well-done and I compliment the author Dr Deepak Shah for a very
meticulous job.
2. Almost all the tables mentioned in the original tabulation scheme sent by the coordinating
centre have been presented.
3. Executive Summary and a soft copy of all the tables in EXCEL format need to be
provided
3. COMMENTS ON PRESENTATION AND GET UP ETC. OF THE REPORT:
The study is well-done and I compliment the author Dr Deepak Shah for a very meticulous job.
4. OVERALL VIEW ON ACCEPTABILITY OF REPORT:
The report is accepted in the present form.

214
ANNEXURE II: ACTION TAKEN BY THE AUTHOR ON THE COMMENTS OF
THE DESIGNATED CENTRE FOR THE STUDY ENTITLED
“POSSIBILITIES AND CONSTRAINTS IN INCREASING PULSES PRODUCTION
IN MAHARASHTRA AND THE IMPACT OF NATIONAL
FOOD SECURITY MISSION ON PULSES “
The author is thankful to the reviewer for the keen interest taken and the suggestions
made by him on the report.
1. COMMENTS ON METHODOLOGY: No Revision Required
2. COMMENTS ON THE ADEQUACY AND QUALITY OF THE COVERAGE OF
OBJECTIVES IN THE STUDY:
No Revision Required
3. COMMENTS ON PRESENTATION OF GET UP ETC.:
No Revision Required
4. OVERALL VIEW ON THE ACCEPTABILITY OF THE REPORT:
The report is accepted in the present form.
July 6, 2011 Deepak Shah