AERC FinalReport 0015
19
1 ‘Optimal’ levels of alcohol consumption for men and women at different ages, and the all-cause mortality attributable to drinking Ian R. White, Dan R. Altmann and Kiran Nanchahal
-
Upload
macrocheilus -
Category
Documents
-
view
230 -
download
0
Transcript of AERC FinalReport 0015
8/9/2019 AERC FinalReport 0015
http://slidepdf.com/reader/full/aerc-finalreport-0015 1/19
1
‘Optimal’ levels of alcohol consumptionfor men and women at different ages,
and the all-cause mortality attributable to drinking
Ian R. White, Dan R. Altmann and Kiran Nanchahal
8/9/2019 AERC FinalReport 0015
http://slidepdf.com/reader/full/aerc-finalreport-0015 2/19
2
1. Summary
Background
Alcohol consumption increases the risk of a variety of diseases, but moderateconsumption decreases the risk of ischaemic heart disease. The relationshipbetween all-cause mortality and alcohol consumption is therefore U-shaped at olderages. We aimed to identify the level of alcohol consumption at which risk is least andthe level of alcohol consumption at which risk becomes large. We also quantified thedeaths and years of life lost that were attributable to alcohol consumption in Englandand Wales in 1997.
Methods
Reviews of the international literature provided models relating the risk of 15 causes
of death to alcohol consumption. Using data from England and Wales on drinkinghabits and on causes of death, we estimated the total risk of death for any level ofalcohol consumption for men and women of different ages.
From our models we estimated the nadir, the level of alcohol consumption at whichmortality is least. We also estimated the number of deaths and person-years of lifelost attributable to or prevented by any drinking, drinking more than recommendedlimits, drinking more than the nadir, and drinking less than the nadir.
Risk curves
The nadir was below 1 unit/week at ages 16-34 in men and at ages 16-54 in women.It increased with age, rising to 3 units/week in women aged over 65 and 8 units/weekin men aged over 65.
The level at which the mortality risk was increased by 5% above the nadir increasedfrom 8 units/week in women aged 16-24 to 20 units/week in women aged over 85,and from 5 units/week in men aged 16-24 to 34 units/week in men aged over 85.
Attributable deaths
If ischaemic heart disease is ignored, 4216 deaths in women and 9246 deaths inmen were attributable to drinking. Including the protective effect on ischaemic heartdisease gave a balance of 166 deaths or 0.1% of all deaths in women attributed toalcohol consumption, and 2030 deaths or 0.8% of all deaths in men prevented. The
ischaemic heart disease deaths tended to occur at older ages, so when weconsidered years of life lost to age 65, 5.6% of all years lost in women and 10.3% ofall years lost in men were attributed to alcohol consumption.
The Royal Colleges recommend limits of 21 units/week in men and 14 units/week inwomen1, and we calculated the total impact of drinking above these limits. In women,2346 deaths (0.8% of all deaths) and 4.0% of all years of life lost were attributable todrinking above these limits. In men the figures were 5491 deaths (2.1% of all deaths)and 8.5% of all years of life lost.
Conclusions
Although the overall mortality risks and benefits of alcohol consumption appearroughly equal, there is a large loss of life due to drinking above recommended limits.

8/9/2019 AERC FinalReport 0015
http://slidepdf.com/reader/full/aerc-finalreport-0015 3/19
3
We interpret the nadir as an ‘optimal’ level of alcohol consumption: it is substantiallylower than the recommended limits, especially in younger people. These findingsshould be combined with research on morbidity, disability and social consequencesof alcohol consumption to inform public health policy.
8/9/2019 AERC FinalReport 0015
http://slidepdf.com/reader/full/aerc-finalreport-0015 4/19
4
2. Introduction
Alcohol consumption is believed to have mixed effects on health:
• Risk of various cancers, hypertension, liver disease, and accidents andviolence all increase with increasing alcohol consumption
• Risk of ischaemic heart disease is lower in moderate drinkers than non-drinkers
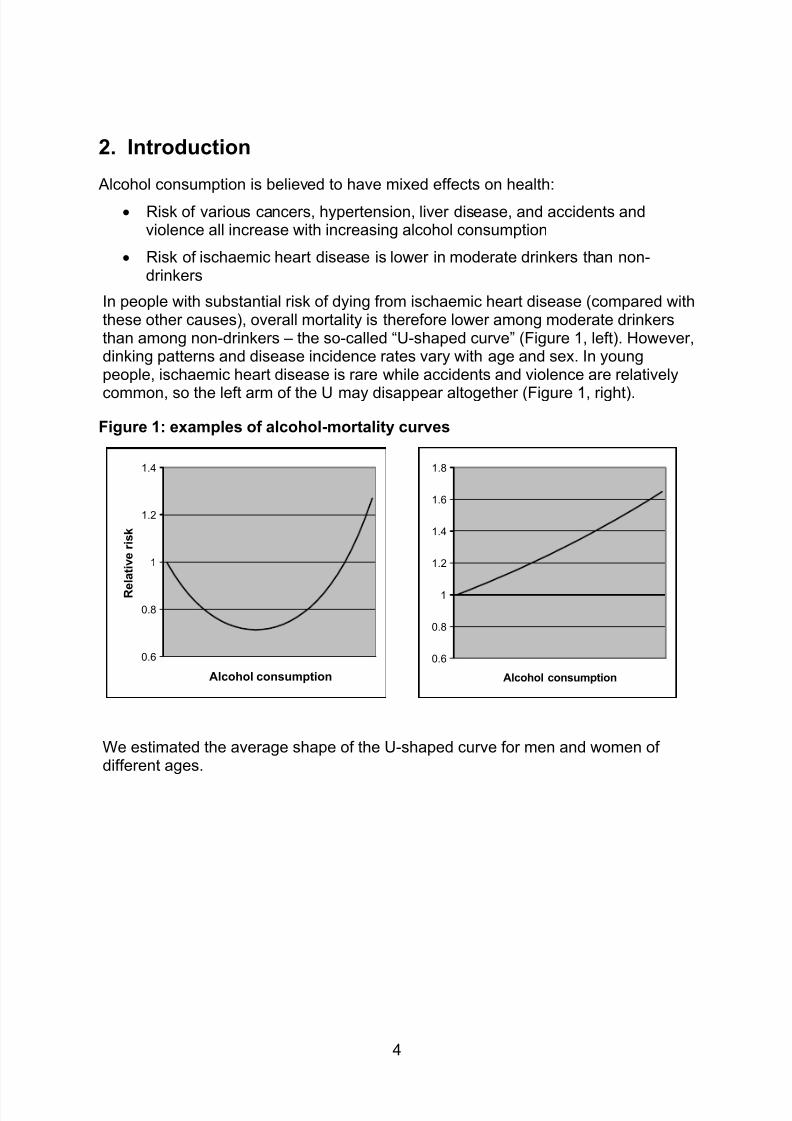
In people with substantial risk of dying from ischaemic heart disease (compared withthese other causes), overall mortality is therefore lower among moderate drinkersthan among non-drinkers – the so-called “U-shaped curve” (Figure 1, left). However,dinking patterns and disease incidence rates vary with age and sex. In youngpeople, ischaemic heart disease is rare while accidents and violence are relatively
common, so the left arm of the U may disappear altogether (Figure 1, right).
Figure 1: examples of alcohol-mortality curves
0.6
0.8
1
1.2
1.4
Alcohol consumption
R e
l a t i v e r i s k
0.6
0.8
1
1.2
1.4
1.6
1.8
Alcohol consumption
We estimated the average shape of the U-shaped curve for men and women ofdifferent ages.
8/9/2019 AERC FinalReport 0015
http://slidepdf.com/reader/full/aerc-finalreport-0015 5/19
5
3. Methods
We worked out the overall risk of death by combining the risks of 15 causes of deaththat are associated with alcohol consumption. To do this we used three sources ofdata:
• Relative risk functions. An Italian group recently reviewed the internationalepidemiological literature and published relative risk functions
2,3. These
describe the risk of each cause of death as a function of alcohol consumptioncompared with non-drinkers. In most cases they were taken to be the samefor men and women and for all ages. We adapted these relative risk functionsto England and Wales.
• Alcohol consumption by age and sex was derived from the 1996/7 General
Household Survey, in which participants reported number of units of alcoholconsumed per week. We take 1 unit of alcohol to be 9 grams of alcohol,roughly half a pint of beer, a small glass of wine or a tot of spirits.
• Deaths by age and sex for the 15 causes of death were taken from theOffice for National Statistics report for 1997.
We converted the relative risks to absolute risks and hence we worked out theoverall risk of death.
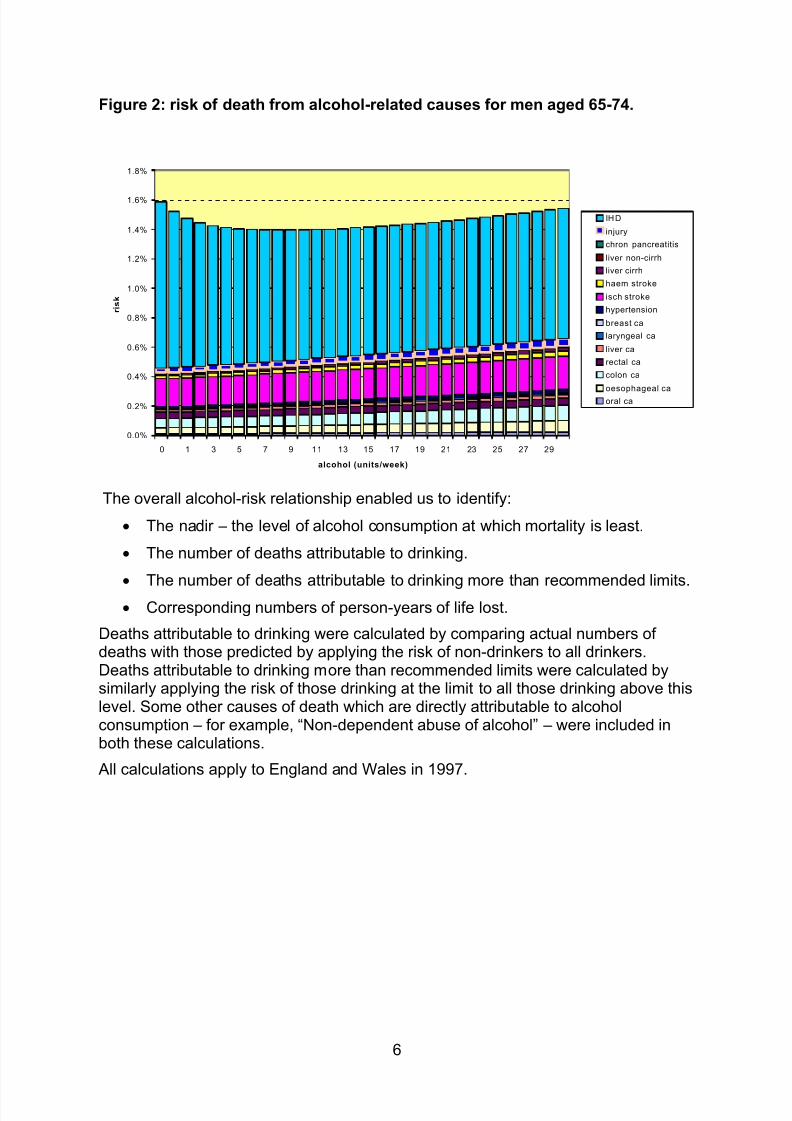
For example, for men aged 65-74, the overall risk of death as a function of alcoholconsumption was built up as shown in Figure 2. Each bar shows the absolute yearlyrisk of death divided into the 15 alcohol-related causes; for clarity, other causes of
death are excluded from this figure. Apart from ischaemic heart disease, all the barsincrease in size as alcohol consumption increases. The main risks, and the maincontributors to the extra risk in heavier consumers, are ischaemic stroke and cancerof the colon and oesophagus. However the decreasing size of the ischaemic heartdisease bar at lower levels of alcohol consumption gives an overall U-shaped curve.
8/9/2019 AERC FinalReport 0015
http://slidepdf.com/reader/full/aerc-finalreport-0015 6/19
6
Figure 2: risk of death from alcohol-related causes for men aged 65-74.
0.0%
0.2%
0.4%
0.6%
0.8%
1.0%
1.2%
1.4%
1.6%
1.8%
0 1 3 5 7 9 11 13 15 17 19 21 23 25 27 29
alcohol (units/week)
r i s k
IHD
injury
chron pancreatitis
liver non-cirrh
liver cirrh
haem stroke
isch stroke
hypertension
breast ca
laryngeal ca
liver ca
rectal ca
colon ca
oesophageal caoral ca
The overall alcohol-risk relationship enabled us to identify:
• The nadir – the level of alcohol consumption at which mortality is least.
• The number of deaths attributable to drinking.
• The number of deaths attributable to drinking more than recommended limits.
• Corresponding numbers of person-years of life lost.
Deaths attributable to drinking were calculated by comparing actual numbers ofdeaths with those predicted by applying the risk of non-drinkers to all drinkers.Deaths attributable to drinking more than recommended limits were calculated bysimilarly applying the risk of those drinking at the limit to all those drinking above thislevel. Some other causes of death which are directly attributable to alcoholconsumption – for example, “Non-dependent abuse of alcohol” – were included inboth these calculations.
All calculations apply to England and Wales in 1997.
8/9/2019 AERC FinalReport 0015
http://slidepdf.com/reader/full/aerc-finalreport-0015 7/19
7
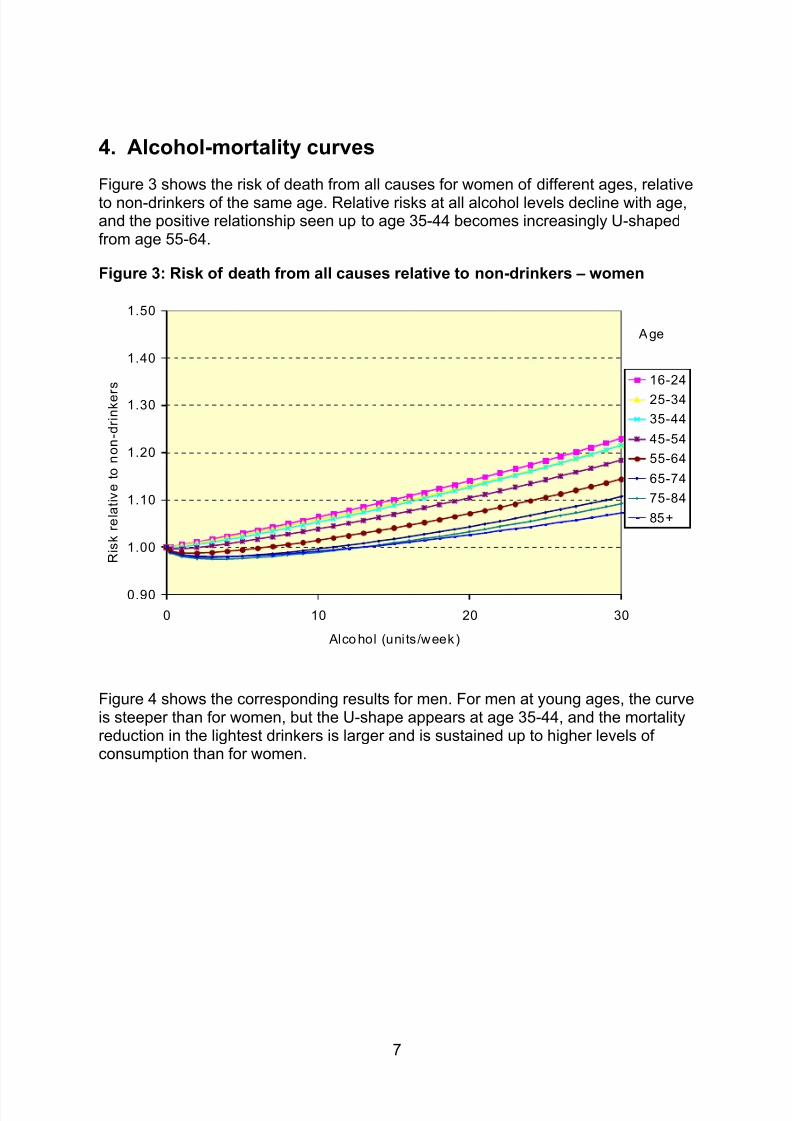
4. Alcohol-mortality curves
Figure 3 shows the risk of death from all causes for women of different ages, relativeto non-drinkers of the same age. Relative risks at all alcohol levels decline with age,and the positive relationship seen up to age 35-44 becomes increasingly U-shapedfrom age 55-64.
Figure 3: Risk of death from all causes relative to non-drinkers – women
0.90
1.00
1.10
1.20
1.30
1.40
1.50
0 10 20 30
Alco hol (units/week)
R i s k r e l a t i v e
t o
n o n - d r i n k e r
s 16-24
25-34
35-44
45-54
55-64
65-74
75-84
85+
Age
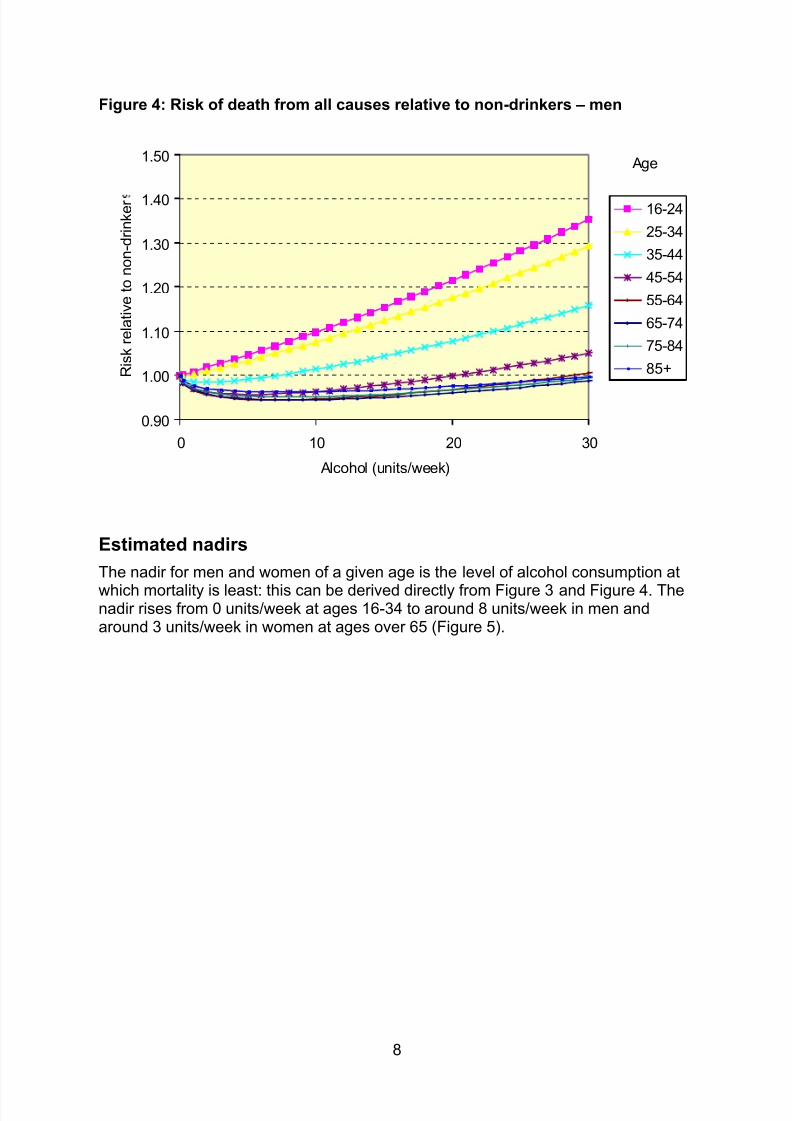
Figure 4 shows the corresponding results for men. For men at young ages, the curveis steeper than for women, but the U-shape appears at age 35-44, and the mortalityreduction in the lightest drinkers is larger and is sustained up to higher levels ofconsumption than for women.
8/9/2019 AERC FinalReport 0015
http://slidepdf.com/reader/full/aerc-finalreport-0015 8/19
8
Figure 4: Risk of death from all causes relative to non-drinkers – men
0.90
1.00
1.10
1.20
1.30
1.40
1.50
0 10 20 30
Alcohol (units/week)
R i s k r e l a t i v e t o n o n - d r i n k e r 16-24
25-34
35-44
45-54
55-64
65-74
75-84
85+
Age
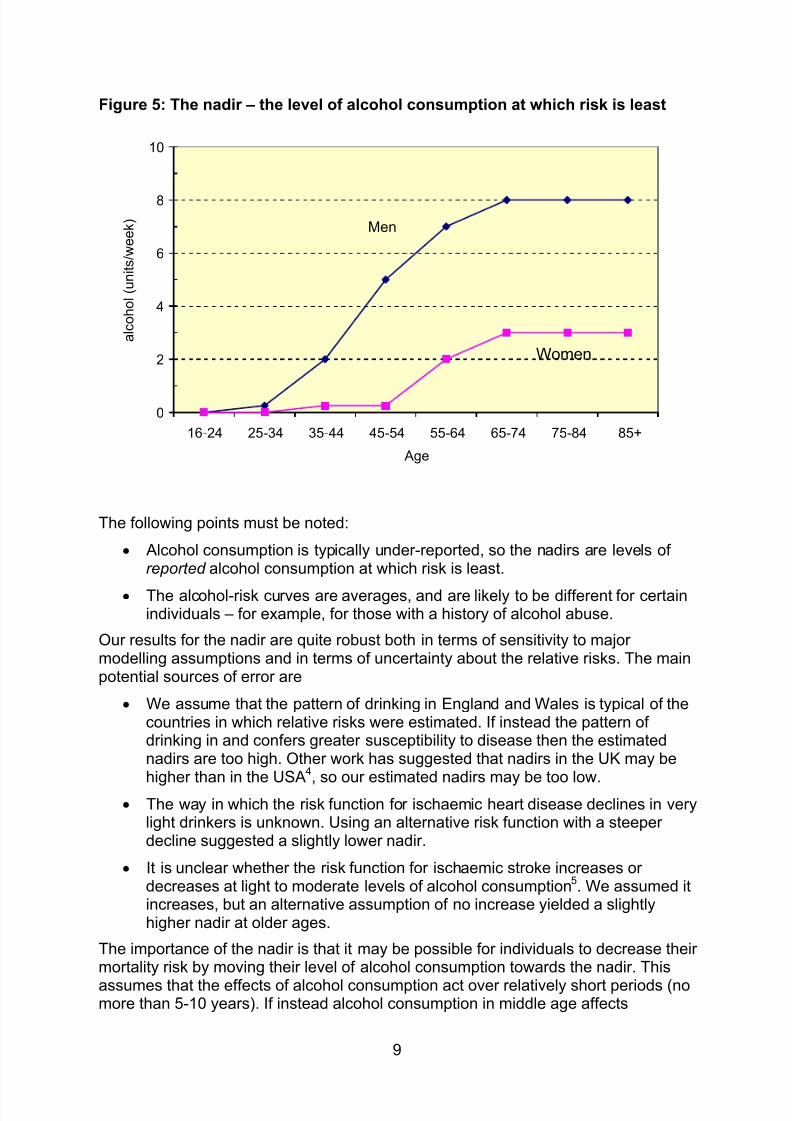
Estimated nadirs
The nadir for men and women of a given age is the level of alcohol consumption at
which mortality is least: this can be derived directly from Figure 3 and Figure 4. Thenadir rises from 0 units/week at ages 16-34 to around 8 units/week in men andaround 3 units/week in women at ages over 65 (Figure 5).
8/9/2019 AERC FinalReport 0015
http://slidepdf.com/reader/full/aerc-finalreport-0015 9/19
9
Figure 5: The nadir – the level of alcohol consumption at which risk is least
0
2
4
6
8
10
16-24 25-34 35-44 45-54 55-64 65-74 75-84 85+
Age
a l c o h o l ( u n i t s / w e e k )
Men
Women
The following points must be noted:
• Alcohol consumption is typically under-reported, so the nadirs are levels ofreported alcohol consumption at which risk is least.
• The alcohol-risk curves are averages, and are likely to be different for certainindividuals – for example, for those with a history of alcohol abuse.
Our results for the nadir are quite robust both in terms of sensitivity to majormodelling assumptions and in terms of uncertainty about the relative risks. The mainpotential sources of error are
• We assume that the pattern of drinking in England and Wales is typical of thecountries in which relative risks were estimated. If instead the pattern ofdrinking in and confers greater susceptibility to disease then the estimatednadirs are too high. Other work has suggested that nadirs in the UK may behigher than in the USA
4, so our estimated nadirs may be too low.
• The way in which the risk function for ischaemic heart disease declines in verylight drinkers is unknown. Using an alternative risk function with a steeperdecline suggested a slightly lower nadir.
• It is unclear whether the risk function for ischaemic stroke increases ordecreases at light to moderate levels of alcohol consumption
5. We assumed it
increases, but an alternative assumption of no increase yielded a slightlyhigher nadir at older ages.
The importance of the nadir is that it may be possible for individuals to decrease theirmortality risk by moving their level of alcohol consumption towards the nadir. This
assumes that the effects of alcohol consumption act over relatively short periods (nomore than 5-10 years). If instead alcohol consumption in middle age affects
8/9/2019 AERC FinalReport 0015
http://slidepdf.com/reader/full/aerc-finalreport-0015 10/19
10
ischaemic heart disease risk in old age then the optimum level of consumption wouldbe higher in middle age than we have estimated and lower in old age than we haveestimated. On the other hand, if alcohol consumption in middle age affects cancerrisk in later life, then the reverse is true.
When the nadir is above zero, there is also the potential for avoiding deaths if peopledrinking below the nadir increased their drinking to the nadir. In this scenarioischaemic heart disease deaths would decrease substantially and deaths from othercauses would increase slightly. However, many people drinking below the nadir havepersonal, religious or other health-related reasons for doing so.
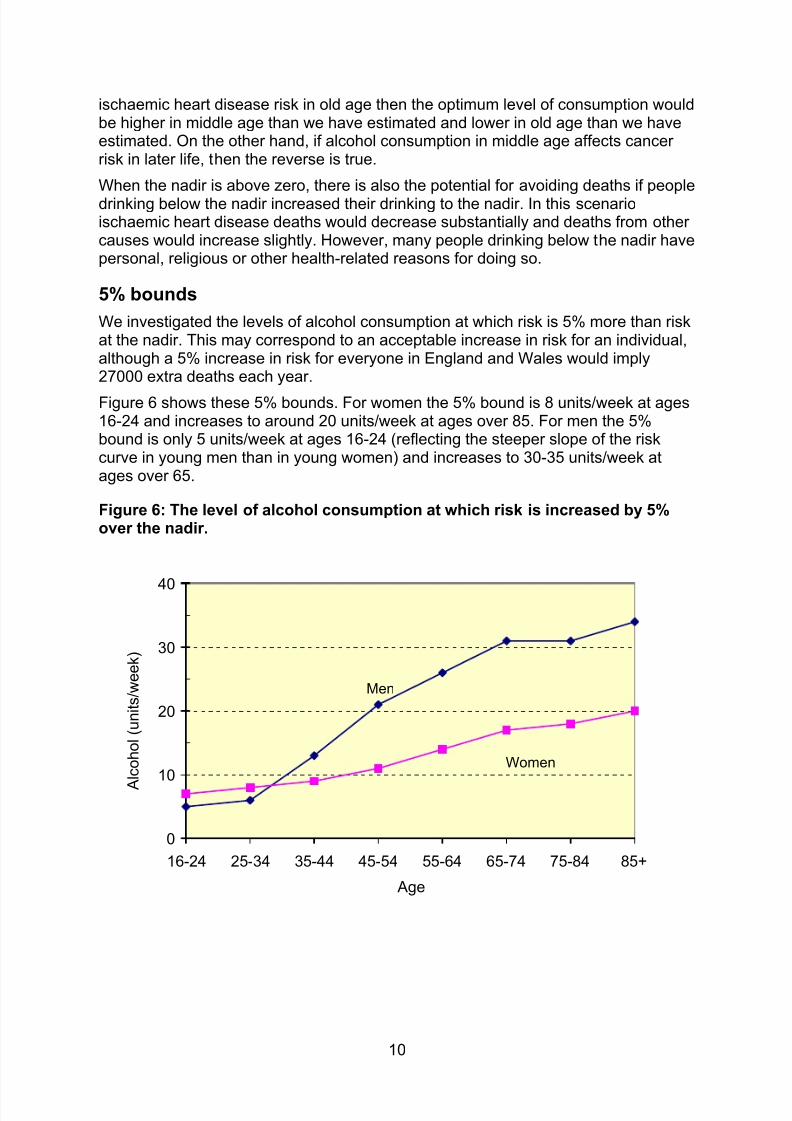
5% bounds
We investigated the levels of alcohol consumption at which risk is 5% more than riskat the nadir. This may correspond to an acceptable increase in risk for an individual,although a 5% increase in risk for everyone in England and Wales would imply27000 extra deaths each year.
Figure 6 shows these 5% bounds. For women the 5% bound is 8 units/week at ages16-24 and increases to around 20 units/week at ages over 85. For men the 5%bound is only 5 units/week at ages 16-24 (reflecting the steeper slope of the riskcurve in young men than in young women) and increases to 30-35 units/week atages over 65.
Figure 6: The level of alcohol consumption at which risk is increased by 5%over the nadir.
0
10
20
30
40
16-24 25-34 35-44 45-54 55-64 65-74 75-84 85+
Age
A
l c o h o l ( u n i t s / w e e k )
Men
Women
8/9/2019 AERC FinalReport 0015
http://slidepdf.com/reader/full/aerc-finalreport-0015 11/19
11
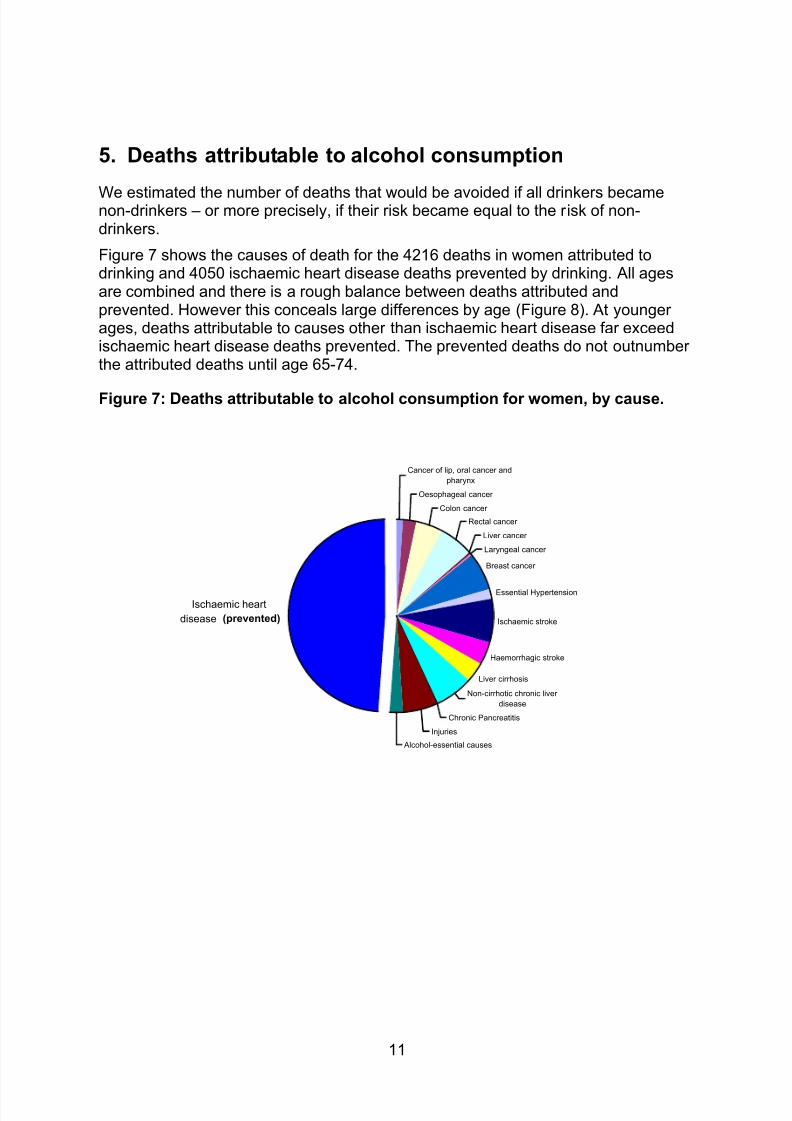
5. Deaths attributable to alcohol consumption
We estimated the number of deaths that would be avoided if all drinkers becamenon-drinkers – or more precisely, if their risk became equal to the risk of non-drinkers.
Figure 7 shows the causes of death for the 4216 deaths in women attributed todrinking and 4050 ischaemic heart disease deaths prevented by drinking. All agesare combined and there is a rough balance between deaths attributed andprevented. However this conceals large differences by age (Figure 8). At youngerages, deaths attributable to causes other than ischaemic heart disease far exceedischaemic heart disease deaths prevented. The prevented deaths do not outnumberthe attributed deaths until age 65-74.
Figure 7: Deaths attributable to alcohol consumption for women, by cause.
Cancer of lip, oral cancer and
pharynx
Oesophageal cancer
Colon cancer
Rectal cancer
Liver cancer
Laryngeal cancer
Breast cancer
Essential Hypertension
Ischaemic stroke
Haemorrhagic stroke
Liver cirrhosis
Non-cirrhotic chronic liver
disease
Chronic Pancreatitis
Injuries
Alcohol-essential causes
Ischaemic heart
disease (prevented)
8/9/2019 AERC FinalReport 0015
http://slidepdf.com/reader/full/aerc-finalreport-0015 12/19
12
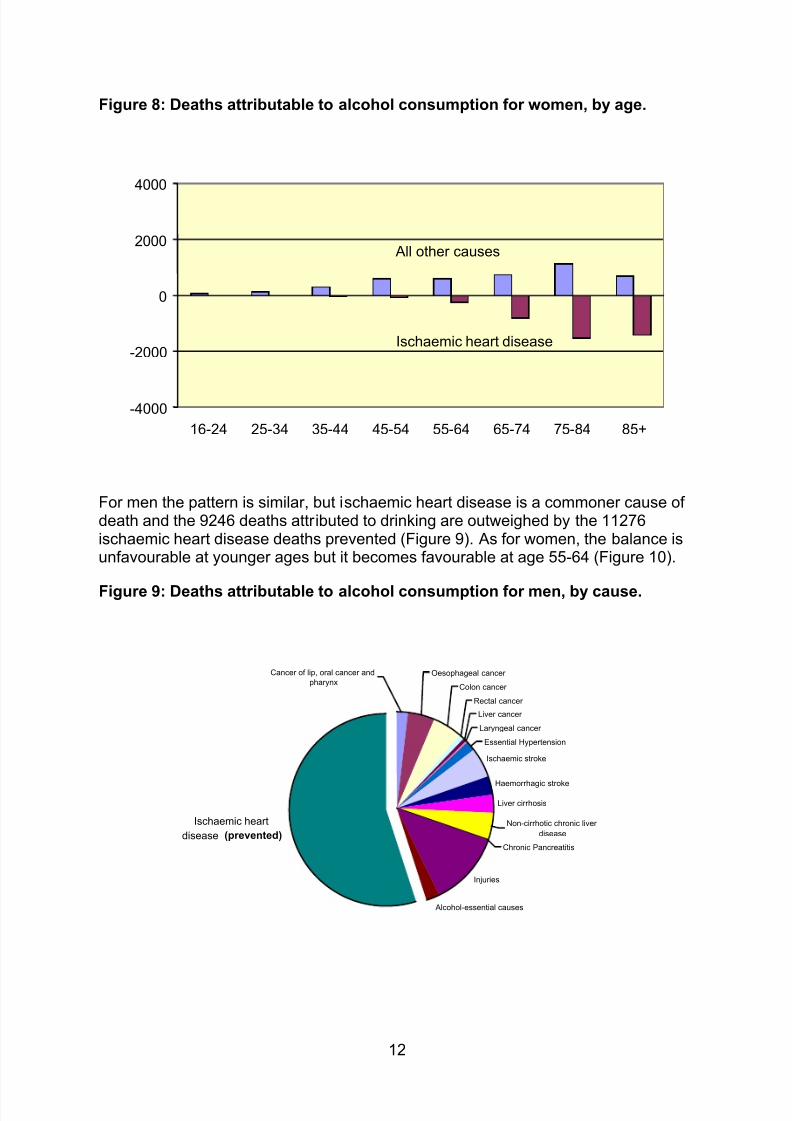
Figure 8: Deaths attributable to alcohol consumption for women, by age.
-4000
-2000
0
2000
4000
16-24 25-34 35-44 45-54 55-64 65-74 75-84 85+
All other causes
Ischaemic heart disease
For men the pattern is similar, but ischaemic heart disease is a commoner cause ofdeath and the 9246 deaths attributed to drinking are outweighed by the 11276ischaemic heart disease deaths prevented (Figure 9). As for women, the balance isunfavourable at younger ages but it becomes favourable at age 55-64 (Figure 10).
Figure 9: Deaths attributable to alcohol consumption for men, by cause.
Colon cancer
Rectal cancer
Liver cancer
Laryngeal cancer
Essential Hypertension
Ischaemic stroke
Haemorrhagic stroke
Liver cirrhosis
Non-cirrhotic chronic liver
disease
Chronic Pancreatitis
Injuries
Alcohol-essential causes
Ischaemic heart
disease (prevented)
Cancer of lip, oral cancer and
pharynxOesophageal cancer
8/9/2019 AERC FinalReport 0015
http://slidepdf.com/reader/full/aerc-finalreport-0015 13/19
13
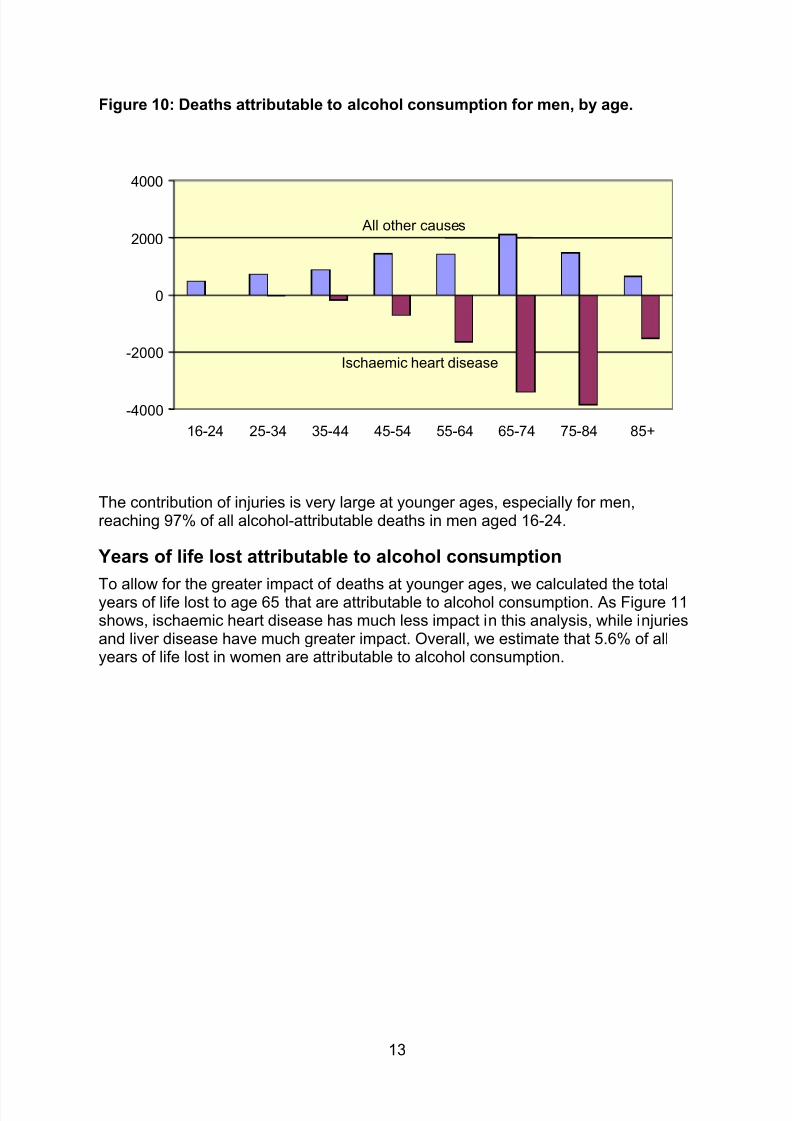
Figure 10: Deaths attributable to alcohol consumption for men, by age.
-4000
-2000
0
2000
4000
16-24 25-34 35-44 45-54 55-64 65-74 75-84 85+
All other causes
Ischaemic heart disease
The contribution of injuries is very large at younger ages, especially for men,reaching 97% of all alcohol-attributable deaths in men aged 16-24.
Years of life lost attributable to alcohol consumption
To allow for the greater impact of deaths at younger ages, we calculated the totalyears of life lost to age 65 that are attributable to alcohol consumption. As Figure 11shows, ischaemic heart disease has much less impact in this analysis, while injuriesand liver disease have much greater impact. Overall, we estimate that 5.6% of allyears of life lost in women are attributable to alcohol consumption.
8/9/2019 AERC FinalReport 0015
http://slidepdf.com/reader/full/aerc-finalreport-0015 14/19
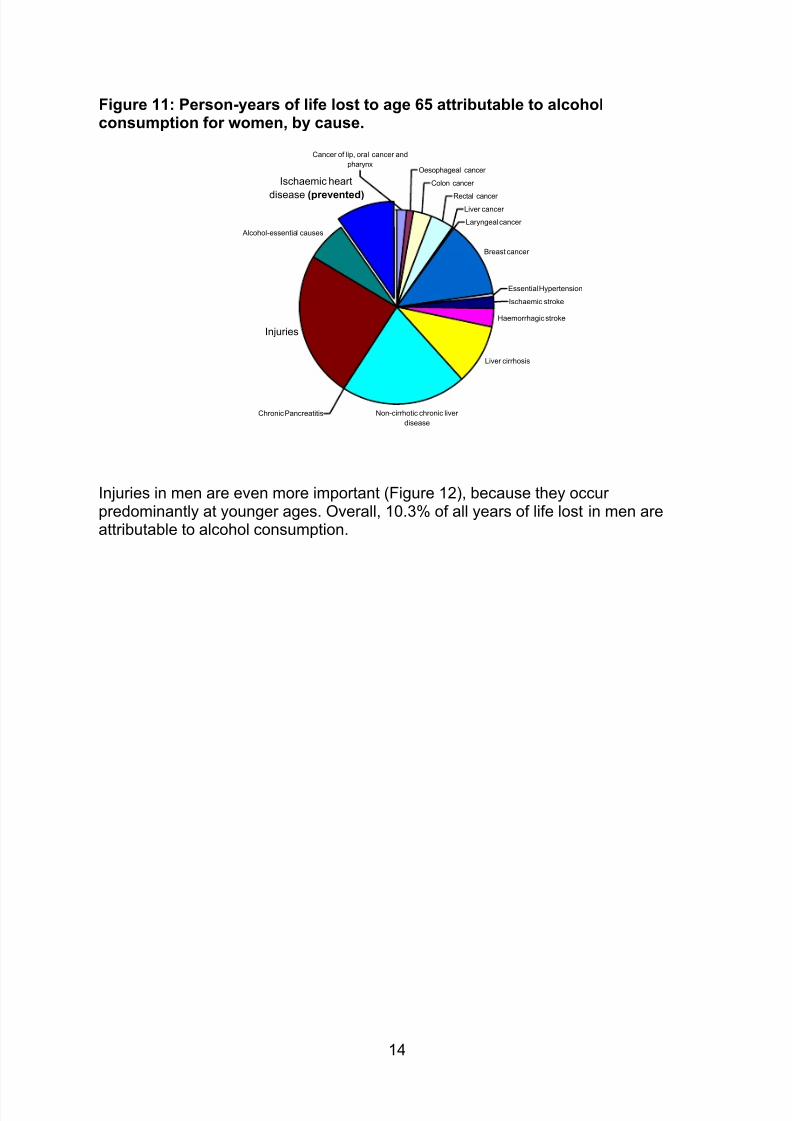
14
Figure 11: Person-years of life lost to age 65 attributable to alcoholconsumption for women, by cause.
Oesophageal cancer
Colon cancer
Rectal cancer
Liver cancer
Laryngeal cancer
Breast cancer
Essential Hypertension
Ischaemic stroke
Haemorrhagic stroke
Liver cirrhosis
Non-cirrhotic chronic liver
disease
Alcohol-essential causes
Chronic Pancreatitis
Cancer of lip, oral cancer and
pharynx
Injuries
Ischaemic heart
disease (prevented)
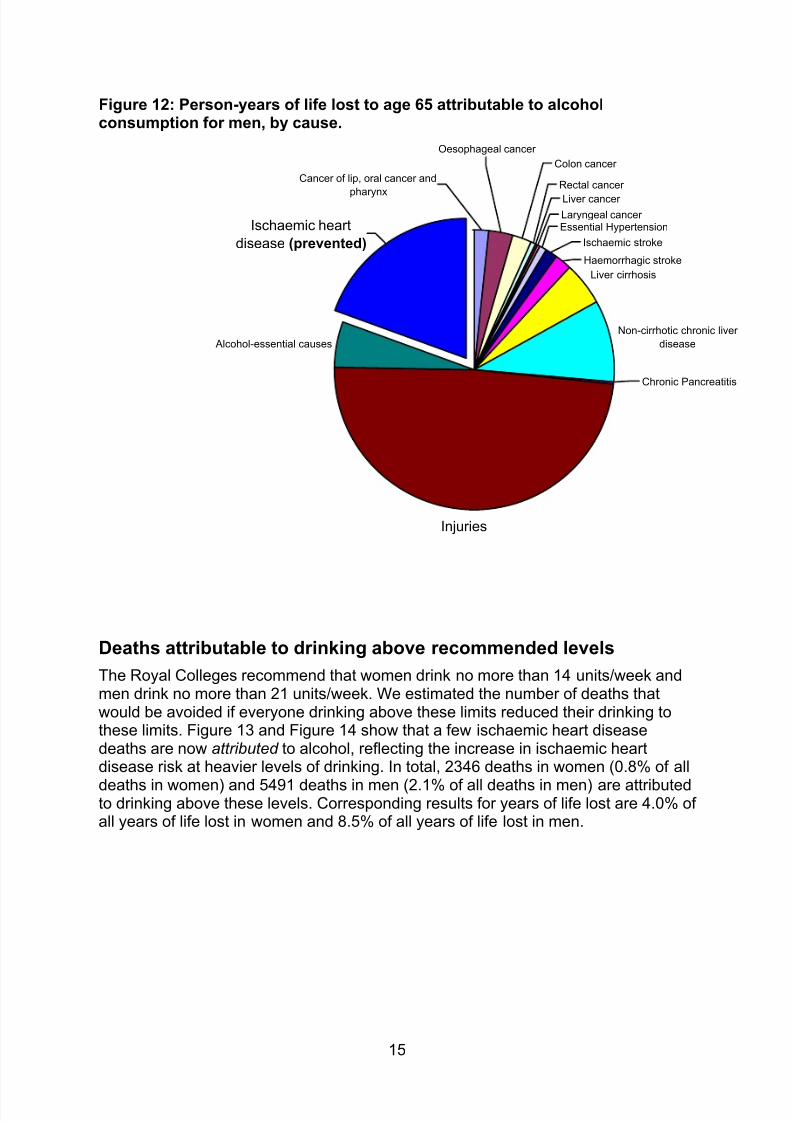
Injuries in men are even more important (Figure 12), because they occurpredominantly at younger ages. Overall, 10.3% of all years of life lost in men areattributable to alcohol consumption.
8/9/2019 AERC FinalReport 0015
http://slidepdf.com/reader/full/aerc-finalreport-0015 15/19
15
Figure 12: Person-years of life lost to age 65 attributable to alcoholconsumption for men, by cause.
Liver cirrhosis
Non-cirrhotic chronic liver
disease Alcohol-essential causes
Cancer of lip, oral cancer and
pharynx
Oesophageal cancer
Colon cancer
Haemorrhagic stroke
Essential HypertensionLaryngeal cancer
Rectal cancer
Liver cancer
Ischaemic stroke
Chronic Pancreatitis
Ischaemic heart
disease (prevented)
Injuries
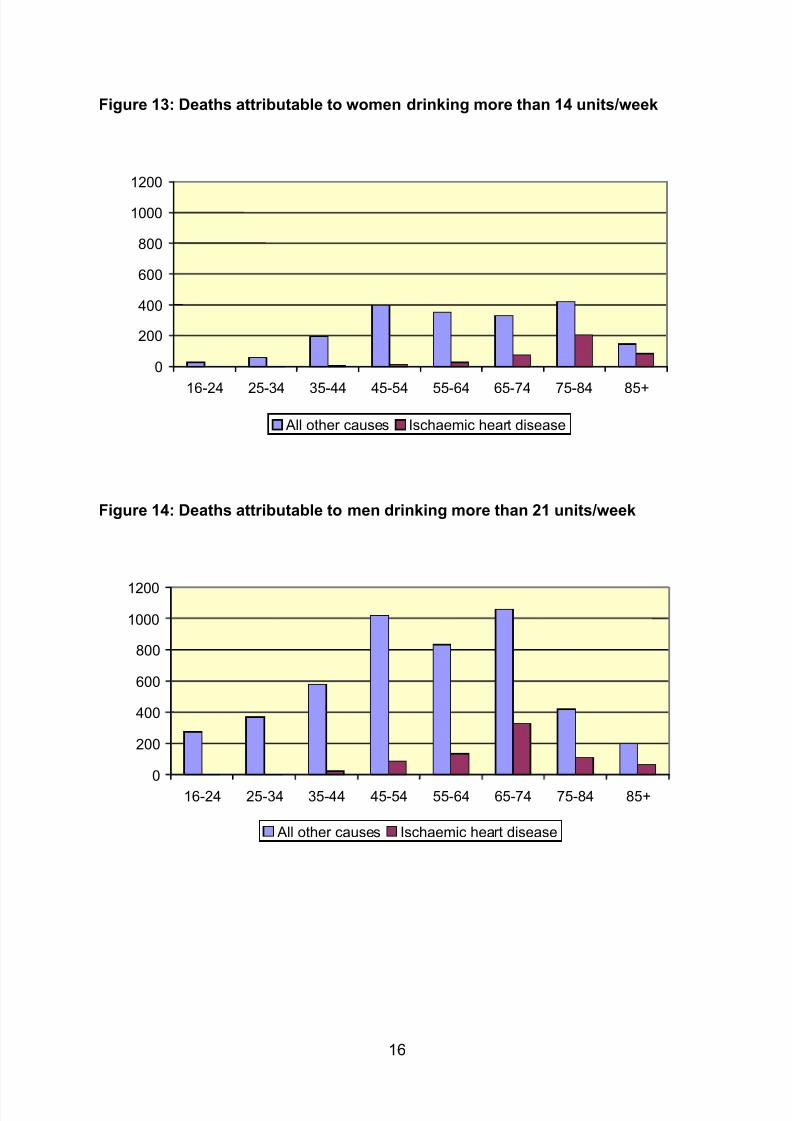
Deaths attributable to drinking above recommended levels
The Royal Colleges recommend that women drink no more than 14 units/week andmen drink no more than 21 units/week. We estimated the number of deaths thatwould be avoided if everyone drinking above these limits reduced their drinking tothese limits. Figure 13 and Figure 14 show that a few ischaemic heart diseasedeaths are now attributed to alcohol, reflecting the increase in ischaemic heartdisease risk at heavier levels of drinking. In total, 2346 deaths in women (0.8% of all
deaths in women) and 5491 deaths in men (2.1% of all deaths in men) are attributedto drinking above these levels. Corresponding results for years of life lost are 4.0% ofall years of life lost in women and 8.5% of all years of life lost in men.
8/9/2019 AERC FinalReport 0015
http://slidepdf.com/reader/full/aerc-finalreport-0015 16/19
16
Figure 13: Deaths attributable to women drinking more than 14 units/week
0
200
400
600
800
1000
1200
16-24
25-34
35-44 45-54 55-64 65-74 75-84
85+
All other causes Ischaemic heart disease
Figure 14: Deaths attributable to men drinking more than 21 units/week
0
200
400
600
800
1000
1200
16-24
25-34
35-44 45-54 55-64 65-74 75-84
85+
All other causes Ischaemic heart disease
8/9/2019 AERC FinalReport 0015
http://slidepdf.com/reader/full/aerc-finalreport-0015 17/19
17
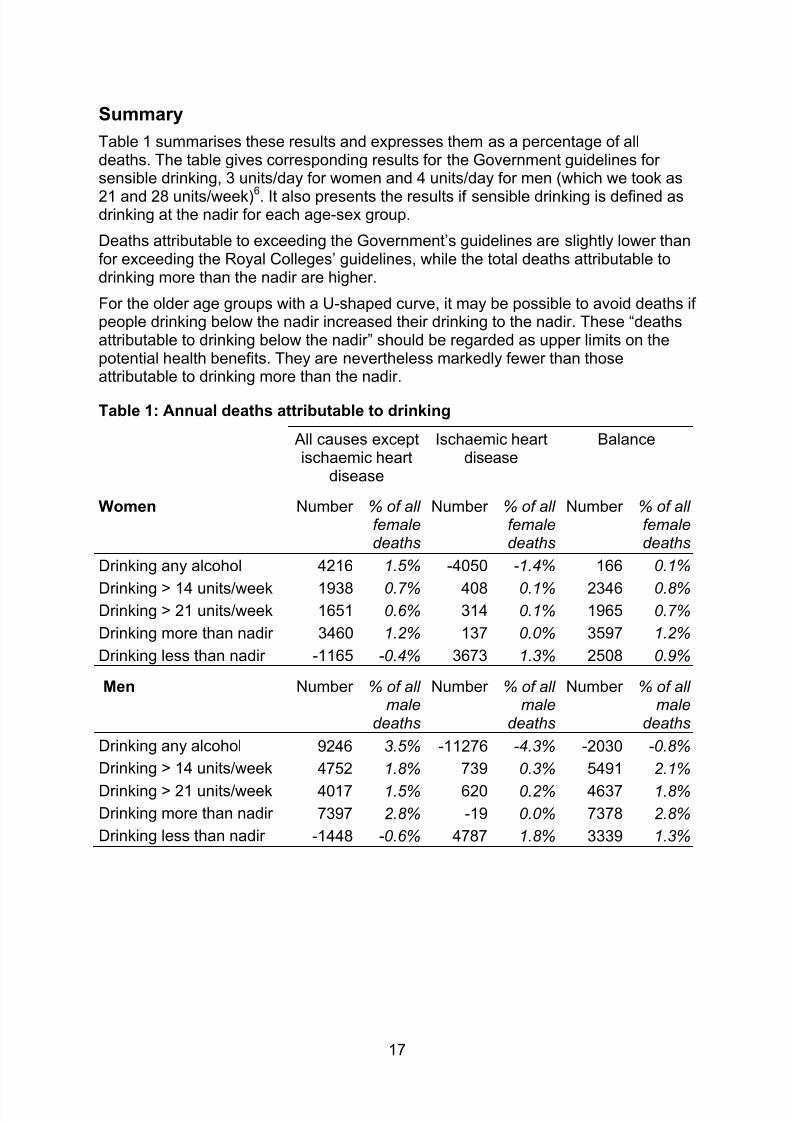
Summary
Table 1 summarises these results and expresses them as a percentage of alldeaths. The table gives corresponding results for the Government guidelines forsensible drinking, 3 units/day for women and 4 units/day for men (which we took as
21 and 28 units/week)6. It also presents the results if sensible drinking is defined asdrinking at the nadir for each age-sex group.
Deaths attributable to exceeding the Government’s guidelines are slightly lower thanfor exceeding the Royal Colleges’ guidelines, while the total deaths attributable todrinking more than the nadir are higher.
For the older age groups with a U-shaped curve, it may be possible to avoid deaths ifpeople drinking below the nadir increased their drinking to the nadir. These “deathsattributable to drinking below the nadir” should be regarded as upper limits on thepotential health benefits. They are nevertheless markedly fewer than thoseattributable to drinking more than the nadir.
Table 1: Annual deaths attributable to drinking
All causes exceptischaemic heart
disease
Ischaemic heartdisease
Balance
Women Number % of allfemaledeaths
Number % of allfemaledeaths
Number % of allfemaledeaths
Drinking any alcohol 4216 1.5% -4050 -1.4% 166 0.1%
Drinking > 14 units/week 1938 0.7% 408 0.1% 2346 0.8%Drinking > 21 units/week 1651 0.6% 314 0.1% 1965 0.7%
Drinking more than nadir 3460 1.2% 137 0.0% 3597 1.2%
Drinking less than nadir -1165 -0.4% 3673 1.3% 2508 0.9%
Men Number % of allmale
deaths
Number % of allmale
deaths
Number % of allmale
deaths
Drinking any alcohol 9246 3.5% -11276 -4.3% -2030 -0.8%
Drinking > 14 units/week 4752 1.8% 739 0.3% 5491 2.1%
Drinking > 21 units/week 4017 1.5% 620 0.2% 4637 1.8%
Drinking more than nadir 7397 2.8% -19 0.0% 7378 2.8%
Drinking less than nadir -1448 -0.6% 4787 1.8% 3339 1.3%
8/9/2019 AERC FinalReport 0015
http://slidepdf.com/reader/full/aerc-finalreport-0015 18/19
18
6. Public health implications
Our estimates of the nadir and the 5% bounds have implications for formulatingsensible drinking messages.
‘Optimal’ drinking can bring a reduction in overall mortality of up to 6% relative to notdrinking (in men aged 55-74). On the other hand, drinking at the Royal Colleges'recommended limit can carry a large increase in risk in younger people. At age 16-24, women have a 9% increase in risk and men have a 23% increase; at theGovernment's recommended limit these figures become 15% and 32%. Thus
• the sensible drinking message of the Royal Colleges allows some fairlysubstantial increases in risk;
• increases in risk are larger with the Government’s sensible drinking message;
• these increases in risk are especially large at younger ages in both men andwomen.
An evidence-based definition of sensible drinking could be drinking behaviour that isassociated with a mortality risk within 5% of the minimum risk for women or men of aparticular age. This view agrees closely with current sensible drinking messages forolder adults but not for younger adults. In this view, public health policy should aim toencourage
• women to drink no more than 1 unit/day up to age 44, no more than 2units/day up to age 74, and no more than 3 units/day over age 75.
• men to drink no more than 1 unit/day up to age 34, no more than 2 units/dayup to age 44, no more than 3 units/day up to age 54, no more than 4 units/dayup to age 84, and no more than 5 units/day over age 85.
The benefits of having different advice for younger people must of course bebalanced against the disadvantages of increased complexity of the message. Thecurrent increase in heavy drinking among younger women may well justify a specificmessage aimed at younger women.
Non-drinking men aged 55-84 also have risk slightly more than 5% above theminimum risk. We do not advocate encouraging these men to drink as this couldencourage heavier drinking, which carries a much greater overall public health
burden.
However, some caveats apply to these results. First, they should not be taken toapply to everyone: some individuals may have different alcohol-risk curves.Secondly, public health must take account of morbidity as well as mortality, eventhough the former is harder to measure. Rehm has observed that “alcohol world-wide accounted for ... 1.5% of all deaths, 2.1% of all life-years lost, and 6% of allyears lost to disability” so that a greater focus on disability is required.
7
8/9/2019 AERC FinalReport 0015
http://slidepdf.com/reader/full/aerc-finalreport-0015 19/19