AECI Ltd | Integrated Report and Annual Financial ... · integrated report and annual financial...
204
INTEGRATED REPORT AND ANNUAL FINANCIAL STATEMENTS 2015
Transcript of AECI Ltd | Integrated Report and Annual Financial ... · integrated report and annual financial...

INTEGRATED REPORT AND ANNUAL FIN
ANCIAL STATEMEN
TS 2015AECI LTD
INTEGRATEDREPORT AND
ANNUALFINANCIAL
STATEMENTS2015WWW.AECI.CO.ZA

GOINGG
DRIVING SOLUTIONS FOR A SUSTAINABLE FUTURE
BOLDB
PUSHING OUR PERFORMANCE ABOVE AND BEYOND
ENGAGEDE
BEING COMMITTED TO A CULTURE OF ACCOUNTABILITY, HONESTY AND INCLUSIVITY
GREEN
G
INNOVATIVEI
ACTIVELY CHALLENGING OURSELVES TO REINVENT WHO WE ARE, WHAT WE DO AND HOW WE DO IT
GREENG
RESPONSIBLER
ACTING IN A MANNER THAT IS MINDFUL OF ALL STAKEHOLDERS’ INTERESTS

Progress has been made in aligning the information contained in this integrated report with the six capitals of the International Integrated Reporting Council’s International <IR> Framework. The set of icons above has been incorporated into the narrative to highlight where the information touches on the respective capitals.
ICON GUIDE
FINANCIAL CAPITAL
MANUFACTURED CAPITAL
INTELLECTUAL CAPITAL
HUMAN CAPITAL
SOCIAL AND RELATIONSHIP CAPITAL
NATURAL CAPITAL
ii
aeci limited Incorporated in the Republic of South Africa (Registration Number 1924/002590/06) JSE share code: AFE ISIN code: ZAE000000220
CONTENTS
2ABOUTTHISREPORT
INNOVATIVE 24CHAIRMAN’SLETTERTOSTAKEHOLDERS 28CHIEFEXECUTIVE’SINNOVATIONREPORT 34CHIEFFINANCIALOFFICER’SFINANCIALCAPITALREPORT 42MANUFACTUREDCAPITALREPORT
ENGAGED 52 STAKEHOLDERENGAGEMENT 56 SOCIALANDETHICSCOMMITTEE’SREPORT
TOSTAKEHOLDERS 58HUMANCAPITAL 63 INTELLECTUALCAPITAL 65 SOCIALANDRELATIONSHIPCAPITAL
GOING GREEN 68NATURALCAPITAL 74 INDEPENDENTASSURANCEREPORTON
SELECTEDSUSTAINABILITYINFORMATION
RESPONSIBLE 78GOVERNANCEREPORT 85 AUDITCOMMITTEE’SREPORT
TOSTAKEHOLDERS 88REMUNERATIONREPORT102DIRECTORS’REPORT105 SHAREHOLDERANALYSIS110HISTORICALREVIEWS112 DECLARATIONBYTHEGROUP
COMPANYSECRETARY112 PREPARATIONOFANNUAL
FINANCIALSTATEMENTS113 INDEPENDENTAUDITOR’SREPORT114 BASISOFREPORTINGANDSIGNIFICANT
ACCOUNTINGPOLICIES125 FINANCIALSTATEMENTS192 NOTICEOFANNUALGENERALMEETING
ANDFORMOFPROXYIBC ADMINISTRATION
6 PROFILEANDSTRATEGY 8 SIXCAPITALSHIGHLIGHTS 10 STRATEGICISSUESANDASSOCIATEDRISKS 12RISKMANAGEMENT 14 WEALTHGENERATEDANDDISTRIBUTED
TOSTAKEHOLDERS 16 DIRECTORS,EXECUTIVECOMMITTEE
ANDSENIORMANAGERS
BOLD
1
The primary objective of integrated reporting is to demonstrate an organisation’s ability to create and sustain value over the short, medium and long term. This report aims to provide stakeholders with a greater understanding of the strategy, overall sustainability, operational performance, risks and opportunities, prospects and major impacts in economic, social and environmental terms of AECI Ltd (“the Company”) and its operating businesses (“the AECI Group” or “the Group”).
Issues which are identified as being of material significance to stakeholders guide integrated reporting. For the AECI Group, this identification is complicated by the diverse nature of its businesses. Accordingly AECI’s overall risk framework, which mirrors issues of interest and concern to the Company and its stakeholders, underpins the determination of materiality for the purposes of the content and layout of this integrated report.
The methodology and framework for risk management are based on the Committee of Sponsoring Organisation of the Treadway Commission and enhanced with the adoption of ISO 31000 for managing risks, and King III principles on the governance of risks.
Other than the risk management framework and feedback from stakeholder engagement, the reporting principles applied in the preparation of this report include: the Companies Act, No. 71 of 2008 (“the Companies Act”), in South Africa; the Listings Requirements of the JSE Limited (“JSE”); King III; the International Integrated Reporting Council’s International <IR> Framework; International Financial Reporting Standards (“IFRS”); the South African Institute of Chartered Accountants (“SAICA”) Financial Reporting Guides as issued by the Accounting Practices Committee and Financial Pronouncements as issued by the Financial Reporting Standards Council; the Carbon Disclosure Project (“CDP”) Climate Change and Water Programs; the international chemical industry’s Responsible Care programme, as well as AECI’s own internal reporting standards and its Memorandum of Incorporation (“MOI”).
SCOPE AND BOUNDARIESThe scope of this report includes all of AECI’s subsidiaries and joint arrangements. A list of principal subsidiaries is provided in note 34 and information on joint arrangements is in note 6. The report relates to the financial reporting period 1 January 2015 to 31 December 2015.
THIS INTEGRATED REPORT TO STAKEHOLDERS, FOR THE FINANCIAL YEAR ENDED 31 DECEMBER 2015, HAS BEEN PREPARED IN ACCORDANCE WITH THE PRINCIPLES CONTAINED IN THE KING REPORT ON GOVERNANCE FOR SOUTH AFRICA, 2009 (“KING III”), OTHER GUIDELINES AND REGULATORY REQUIREMENTS.
2
ABOUT THIS REPORT
STAKEHOLDER ENGAGEMENTThe AECI Group engages with a broad spectrum of stakeholders. These include employees, trade unions, shareholders and fund managers, financiers, customers, suppliers, technology and business partners, local and national government structures in countries where the Group operates, other regulatory and industry bodies, the communities in which the Group operates, special interest groups and the media.
The Company welcomes written comments and feedback from its stakeholders on this integrated report and on other general matters. These should be addressed to: The Group Company Secretary, AECI Ltd, Private Bag X21, Gallo Manor, 2052, or e-mailed to [email protected].
APPROVAL OF THE INTEGRATED REPORTThe Board acknowledges its responsibility to ensure the integrity of the integrated report. The Directors confirm that individually and collectively they have reviewed the content of the integrated report and believe it addresses material issues, as determined by using AECI’s risk framework as a screening mechanism, and is a fair presentation of the integrated performance of the Group.
The Board approved the release of the 2015 integrated report on 11 April 2016.
For and on behalf of the Board
Schalk Engelbrecht Mark Dytor Chairman Chief Executive
Woodmead, Sandton 11 April 2016
ASSURANCE AND COMPARABILITYThe Board of Directors (“the Board”) is required in terms of the Companies Act and the JSE Listings Requirements to prepare annual financial statements which fairly present the state of affairs of the Company and the Group as at the end of the financial year and of the profit or loss and the cash flows for that period, in conformity with IFRS. The external auditors are responsible for examining the financial statements of the Company and the Group and for expressing their opinion on these statements to shareholders. In addition, the external auditors must confirm whether the financial statements are in accordance with the Companies Act and IFRS.
Further progress has been made in aligning the information contained in this integrated report with the six capitals of the International Integrated Reporting Council’s International <IR> Framework. A set of icons has been incorporated into the narrative to highlight where the information touches on the respective capitals. A key explaining these icons can be found on page ii.
As in prior years, external assurance obtained in 2015 also included limited assurance on selected sustainability information which AECI believes is material in view of the nature of its businesses and the environment in which they operate.
The Group’s Internal Audit function appraises Group companies’ internal controls and submits its assessment of these to the Board on an annual basis. The management of each operating business also submits an annual self-assessment of internal controls (Internal Control Matrix) to the Audit Committee affirming that the systems of internal control, in entities for which they have responsibility, are adequate for their operations and are functioning effectively.
The combined assurance approach will continue to be assessed in future years to confirm the appropriate application of integrated reporting principles and the integrity of data contained in future reports.
There are no material changes to the content of this report compared to 2014’s integrated report. There is a continuing emphasis on providing more detailed information on the Company’s strategic direction and sustainability initiatives.
3
ABOUT THIS REPORT
BOLD
PROFILE AND STRATEGY 6
SIX CAPITALS HIGHLIGHTS 8
STRATEGIC ISSUES AND ASSOCIATED RISKS 10
RISK MANAGEMENT 12
WEALTH GENERATED AND DISTRIBUTED TO STAKEHOLDERS 14
NON-EXECUTIVE DIRECTORS 16
EXECUTIVE COMMITTEE 18
SENIOR MANAGERS 20
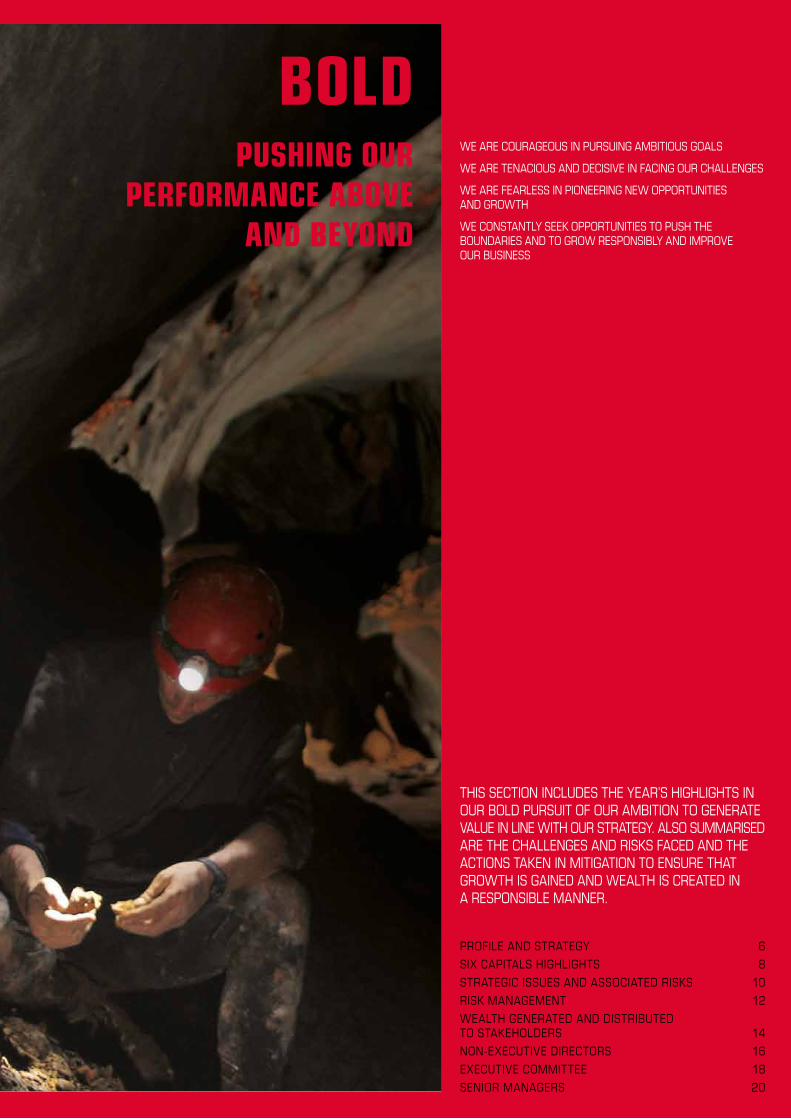
THIS SECTION INCLUDES THE YEAR’S HIGHLIGHTS IN OUR BOLD PURSUIT OF OUR AMBITION TO GENERATE VALUE IN LINE WITH OUR STRATEGY. ALSO SUMMARISED ARE THE CHALLENGES AND RISKS FACED AND THE ACTIONS TAKEN IN MITIGATION TO ENSURE THAT GROWTH IS GAINED AND WEALTH IS CREATED IN A RESPONSIBLE MANNER.
WE ARE COURAGEOUS IN PURSUING AMBITIOUS GOALS
WE ARE TENACIOUS AND DECISIVE IN FACING OUR CHALLENGES
WE ARE FEARLESS IN PIONEERING NEW OPPORTUNITIES AND GROWTH
WE CONSTANTLY SEEK OPPORTUNITIES TO PUSH THE BOUNDARIES AND TO GROW RESPONSIBLY AND IMPROVE OUR BUSINESS
PUSHING OUR PERFORMANCE ABOVE
AND BEYOND
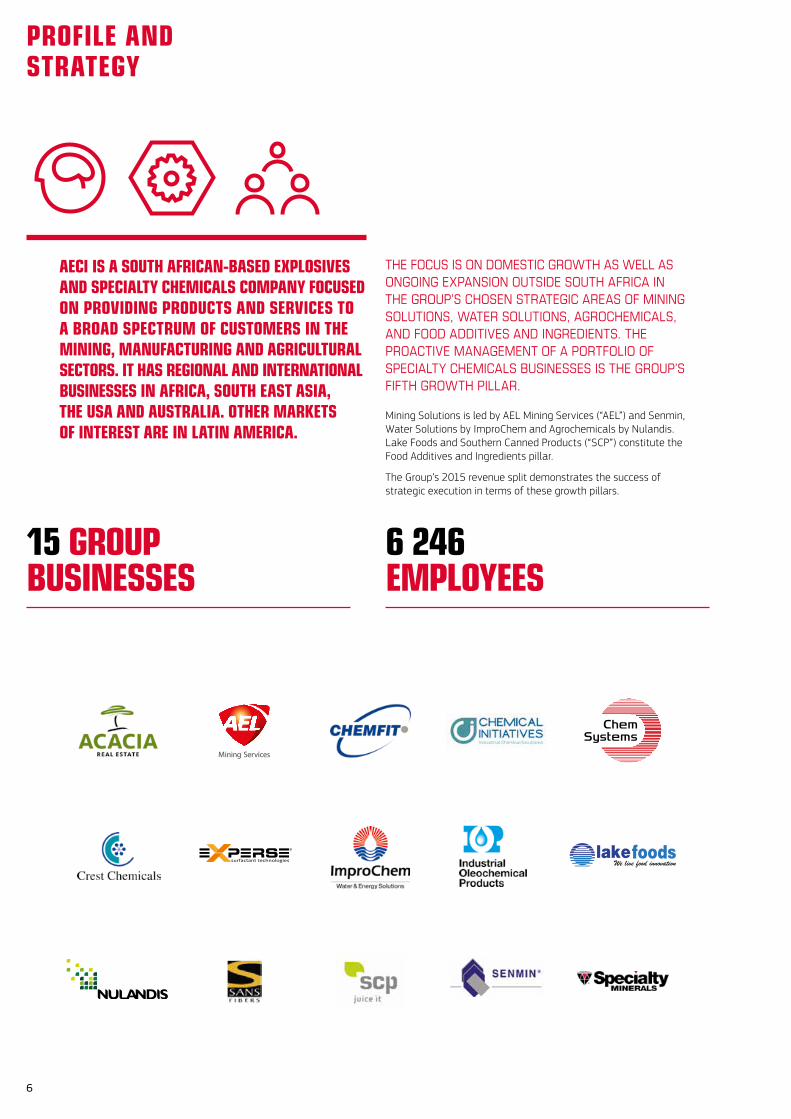
15 GROUP BUSINESSES
6 246 EMPLOYEES
THE FOCUS IS ON DOMESTIC GROWTH AS WELL AS ONGOING EXPANSION OUTSIDE SOUTH AFRICA IN THE GROUP’S CHOSEN STRATEGIC AREAS OF MINING SOLUTIONS, WATER SOLUTIONS, AGROCHEMICALS, AND FOOD ADDITIVES AND INGREDIENTS. THE PROACTIVE MANAGEMENT OF A PORTFOLIO OF SPECIALTY CHEMICALS BUSINESSES IS THE GROUP’S FIFTH GROWTH PILLAR.
Mining Solutions is led by AEL Mining Services (“AEL”) and Senmin, Water Solutions by ImproChem and Agrochemicals by Nulandis. Lake Foods and Southern Canned Products (“SCP”) constitute the Food Additives and Ingredients pillar.
The Group’s 2015 revenue split demonstrates the success of strategic execution in terms of these growth pillars.
AECI IS A SOUTH AFRICAN-BASED EXPLOSIVES AND SPECIALTY CHEMICALS COMPANY FOCUSED ON PROVIDING PRODUCTS AND SERVICES TO A BROAD SPECTRUM OF CUSTOMERS IN THE MINING, MANUFACTURING AND AGRICULTURAL SECTORS. IT HAS REGIONAL AND INTERNATIONAL BUSINESSES IN AFRICA, SOUTH EAST ASIA, THE USA AND AUSTRALIA. OTHER MARKETS OF INTEREST ARE IN LATIN AMERICA.
6
PROFILE AND STRATEGY
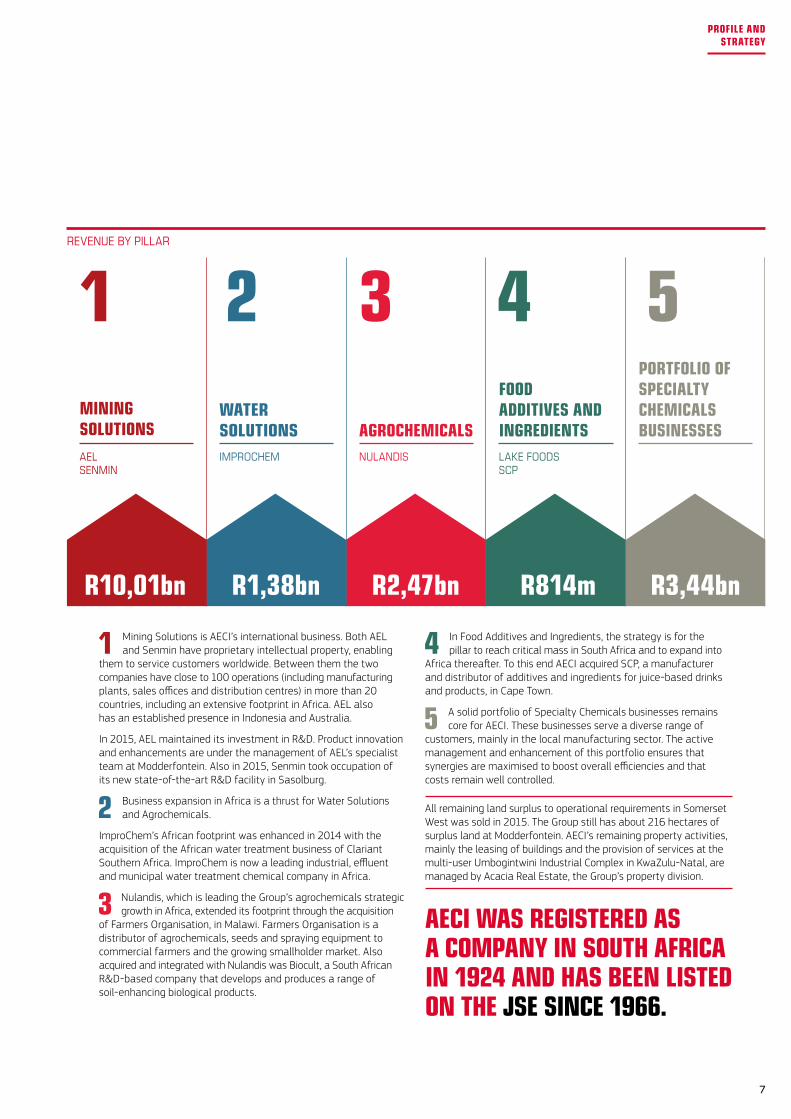
MININGSOLUTIONSAELSENMIN
R10,01bn
WATERSOLUTIONS
R1,38bn
AGROCHEMICALS
R2,47bn
FOODADDITIVES AND INGREDIENTS
R814m
PORTFOLIO OFSPECIALTYCHEMICALSBUSINESSES
R3,44bn
1 2 3 4 5
IMPROCHEM NULANDIS LAKE FOODSSCP
4 In Food Additives and Ingredients, the strategy is for the pillar to reach critical mass in South Africa and to expand into
Africa thereafter. To this end AECI acquired SCP, a manufacturer and distributor of additives and ingredients for juice-based drinks and products, in Cape Town.
5A solid portfolio of Specialty Chemicals businesses remains core for AECI. These businesses serve a diverse range of
customers, mainly in the local manufacturing sector. The active management and enhancement of this portfolio ensures that synergies are maximised to boost overall efficiencies and that costs remain well controlled.
All remaining land surplus to operational requirements in Somerset West was sold in 2015. The Group still has about 216 hectares of surplus land at Modderfontein. AECI’s remaining property activities, mainly the leasing of buildings and the provision of services at the multi-user Umbogintwini Industrial Complex in KwaZulu-Natal, are managed by Acacia Real Estate, the Group’s property division.
AECI WAS REGISTERED AS A COMPANY IN SOUTH AFRICA IN 1924 AND HAS BEEN LISTED ON THE JSE SINCE 1966.
1Mining Solutions is AECI’s international business. Both AEL and Senmin have proprietary intellectual property, enabling
them to service customers worldwide. Between them the two companies have close to 100 operations (including manufacturing plants, sales offices and distribution centres) in more than 20 countries, including an extensive footprint in Africa. AEL also has an established presence in Indonesia and Australia.
In 2015, AEL maintained its investment in R&D. Product innovation and enhancements are under the management of AEL’s specialist team at Modderfontein. Also in 2015, Senmin took occupation of its new state-of-the-art R&D facility in Sasolburg.
2Business expansion in Africa is a thrust for Water Solutions and Agrochemicals.
ImproChem’s African footprint was enhanced in 2014 with the acquisition of the African water treatment business of Clariant Southern Africa. ImproChem is now a leading industrial, effluent and municipal water treatment chemical company in Africa.
3Nulandis, which is leading the Group’s agrochemicals strategic growth in Africa, extended its footprint through the acquisition
of Farmers Organisation, in Malawi. Farmers Organisation is a distributor of agrochemicals, seeds and spraying equipment to commercial farmers and the growing smallholder market. Also acquired and integrated with Nulandis was Biocult, a South African R&D-based company that develops and produces a range of soil-enhancing biological products.
REVENUEBYPILLAR
7
PROFILE AND STRATEGY
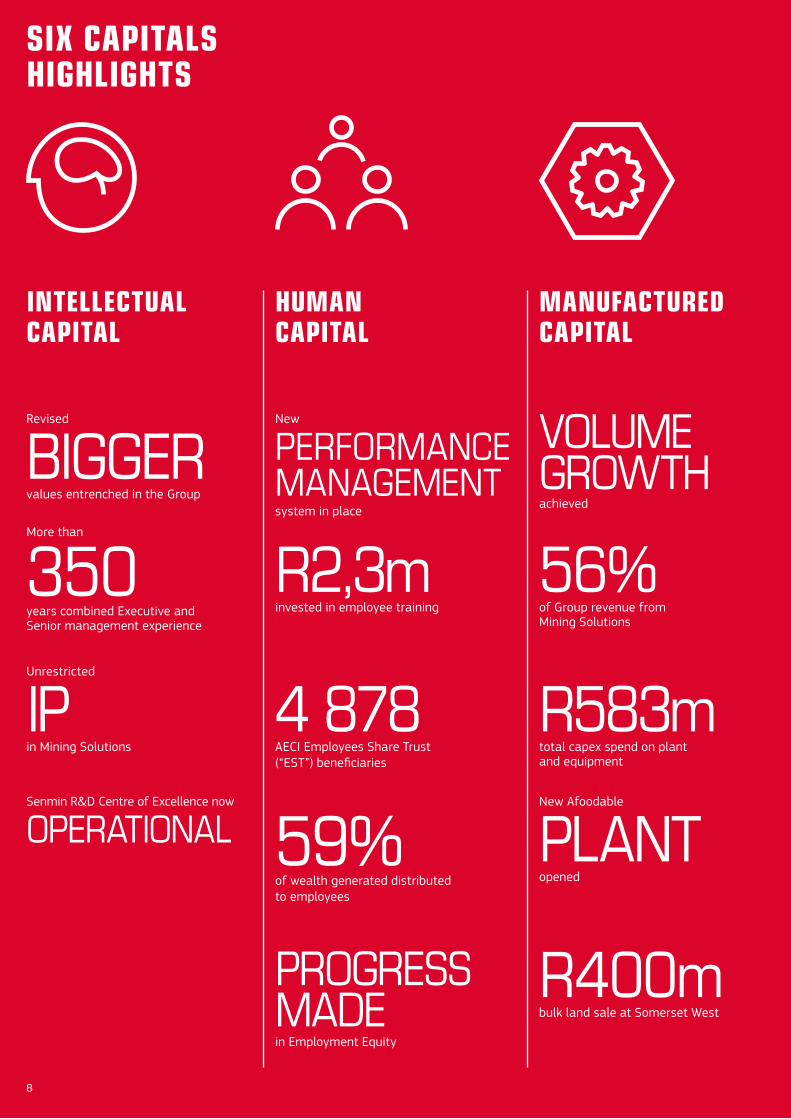
INTELLECTUAL CAPITAL
HUMAN CAPITAL
MANUFACTURED CAPITAL
R400m bulk land sale at Somerset West
VOLUME GROWTHachieved
PERFORMANCE MANAGEMENT
PROGRESS MADE
system in place
New
56% of Group revenue from Mining Solutions
350years combined Executive and Senior management experience
IPin Mining Solutions
values entrenched in the Group
Revised
Unrestricted
More than
BIGGER
R583mtotal capex spend on plant and equipment
Senmin R&D Centre of Excellence now
OPERATIONAL
invested in employee training
4 878AECI Employees Share Trust (“EST”) beneficiaries
PLANT New Afoodable
opened59%of wealth generated distributed to employees
in Employment Equity
R2,3m
8
SIX CAPITALS HIGHLIGHTS
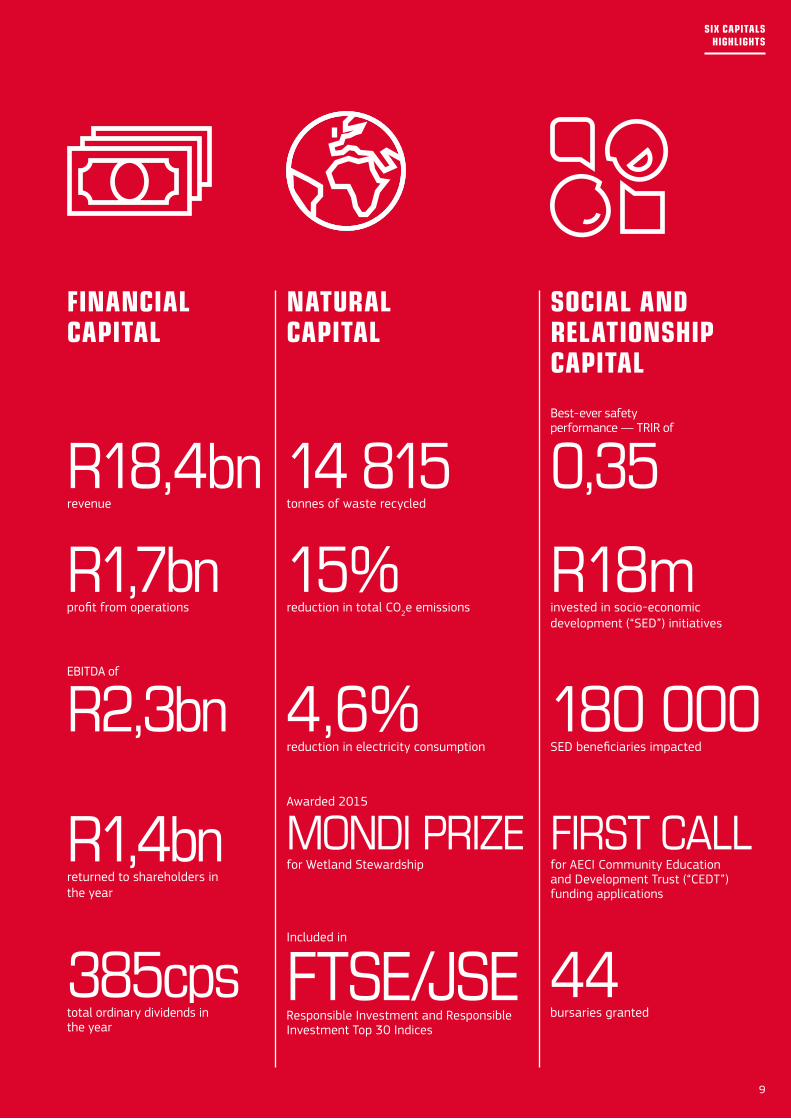
FINANCIAL CAPITAL
NATURAL CAPITAL
SOCIAL AND RELATIONSHIP CAPITAL
0,35Best-ever safety performance — TRIR of
R2,3bn EBITDA of
R18,4bn revenue
14 815 tonnes of waste recycled
44bursaries granted
FTSE/JSEResponsible Investment and Responsible Investment Top 30 Indices
R18minvested in socio-economic development (“SED”) initiatives
15%reduction in total CO2e emissions
180 000SED beneficiaries impacted
R1,7bn profit from operations
R1,4bn returned to shareholders in the year
4,6%reduction in electricity consumption
FIRST CALLfor AECI Community Education and Development Trust (“CEDT”) funding applications
MONDI PRIZEfor Wetland Stewardship
Awarded 2015
Included in
385cpstotal ordinary dividends in the year
9
SIX CAPITALS HIGHLIGHTS
RISK DESCRIPTION KEY CONTROLS/TREATMENTS
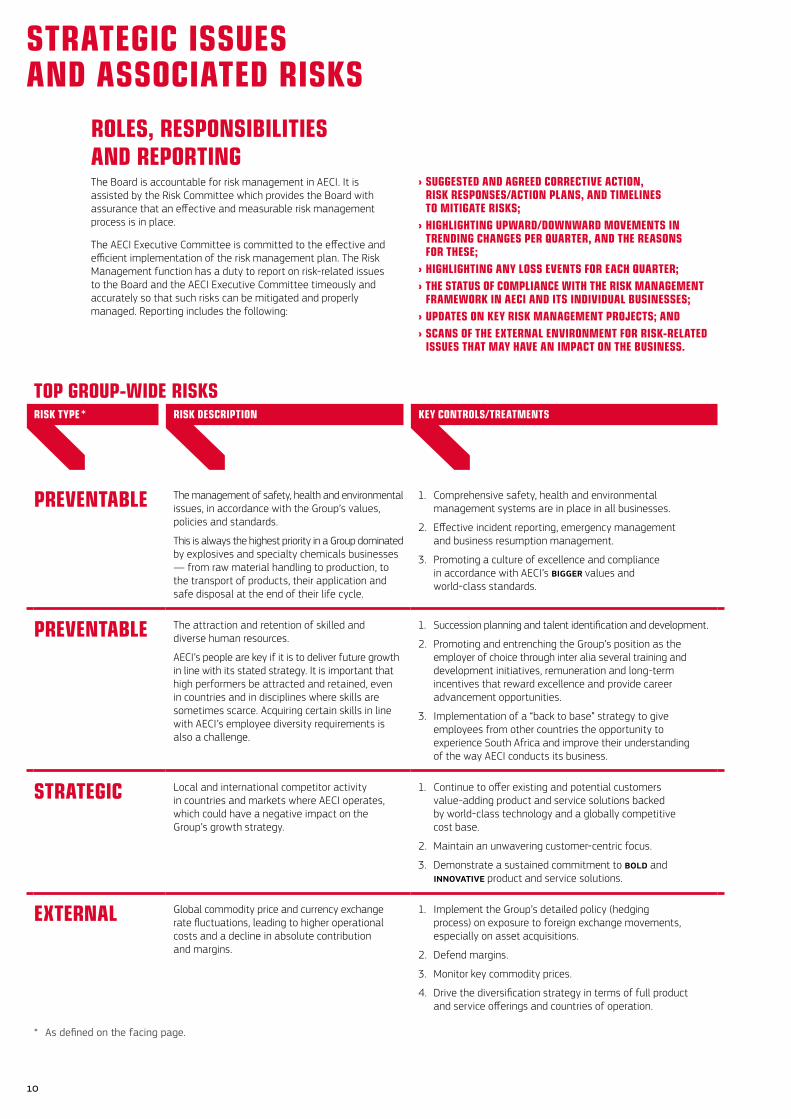
PREVENTABLE The management of safety, health and environmental issues, in accordance with the Group’s values, policies and standards.
This is always the highest priority in a Group dominated by explosives and specialty chemicals businesses — from raw material handling to production, to the transport of products, their application and safe disposal at the end of their life cycle.
1. Comprehensive safety, health and environmental management systems are in place in all businesses.
2. Effective incident reporting, emergency management and business resumption management.
3. Promoting a culture of excellence and compliance in accordance with AECI’s BIGGER values and world-class standards.
PREVENTABLE The attraction and retention of skilled and diverse human resources.
AECI’s people are key if it is to deliver future growth in line with its stated strategy. It is important that high performers be attracted and retained, even in countries and in disciplines where skills are sometimes scarce. Acquiring certain skills in line with AECI’s employee diversity requirements is also a challenge.
1. Succession planning and talent identification and development.
2. Promoting and entrenching the Group’s position as the employer of choice through inter alia several training and development initiatives, remuneration and long-term incentives that reward excellence and provide career advancement opportunities.
3. Implementation of a “back to base” strategy to give employees from other countries the opportunity to experience South Africa and improve their understanding of the way AECI conducts its business.
STRATEGIC Local and international competitor activity in countries and markets where AECI operates, which could have a negative impact on the Group’s growth strategy.
1. Continue to offer existing and potential customers value-adding product and service solutions backed by world-class technology and a globally competitive cost base.
2. Maintain an unwavering customer-centric focus.
3. Demonstrate a sustained commitment to BOLD and InnOvatIvE product and service solutions.
EXTERNAL Global commodity price and currency exchange rate fluctuations, leading to higher operational costs and a decline in absolute contribution and margins.
1. Implement the Group’s detailed policy (hedging process) on exposure to foreign exchange movements, especially on asset acquisitions.
2. Defend margins.
3. Monitor key commodity prices.
4. Drive the diversification strategy in terms of full product and service offerings and countries of operation.
ROLES, RESPONSIBILITIES AND REPORTINGThe Board is accountable for risk management in AECI. It is assisted by the Risk Committee which provides the Board with assurance that an effective and measurable risk management process is in place.
The AECI Executive Committee is committed to the effective and efficient implementation of the risk management plan. The Risk Management function has a duty to report on risk-related issues to the Board and the AECI Executive Committee timeously and accurately so that such risks can be mitigated and properly managed. Reporting includes the following:
TOP GROUP-WIDE RISKS
› SUGGESTED AND AGREED CORRECTIVE ACTION, RISK RESPONSES/ACTION PLANS, AND TIMELINES TO MITIGATE RISKS;
› HIGHLIGHTING UPWARD/DOWNWARD MOVEMENTS IN TRENDING CHANGES PER QUARTER, AND THE REASONS FOR THESE;
› HIGHLIGHTING ANY LOSS EVENTS FOR EACH QUARTER; › THE STATUS OF COMPLIANCE WITH THE RISK MANAGEMENT FRAMEWORK IN AECI AND ITS INDIVIDUAL BUSINESSES;
› UPDATES ON KEY RISK MANAGEMENT PROJECTS; AND › SCANS OF THE EXTERNAL ENVIRONMENT FOR RISK-RELATED ISSUES THAT MAY HAVE AN IMPACT ON THE BUSINESS.
RISK TYPE
* As defined on the facing page.
*
10
STRATEGIC ISSUES AND ASSOCIATED RISKS
RISK TYPE RISK DESCRIPTION KEY CONTROLS/TREATMENTS
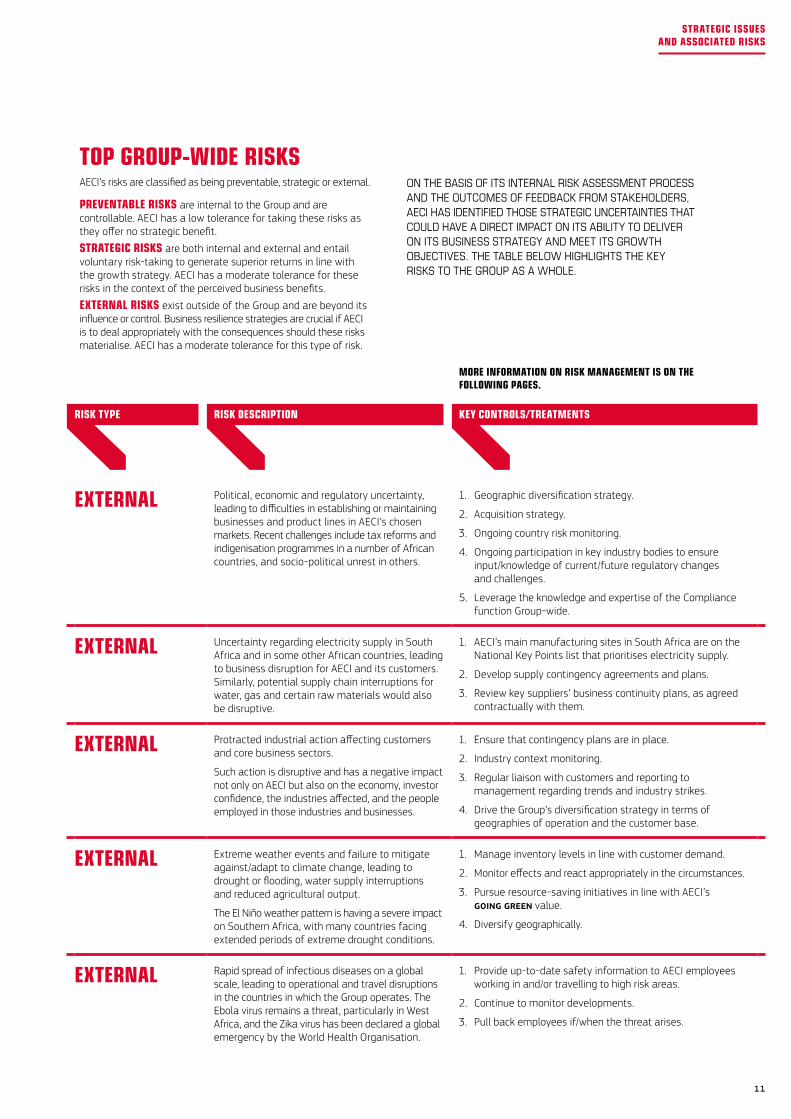
EXTERNAL Political, economic and regulatory uncertainty, leading to difficulties in establishing or maintaining businesses and product lines in AECI’s chosen markets. Recent challenges include tax reforms and indigenisation programmes in a number of African countries, and socio-political unrest in others.
1. Geographic diversification strategy.
2. Acquisition strategy.
3. Ongoing country risk monitoring.
4. Ongoing participation in key industry bodies to ensure input/knowledge of current/future regulatory changes and challenges.
5. Leverage the knowledge and expertise of the Compliance function Group-wide.
EXTERNAL Uncertainty regarding electricity supply in South Africa and in some other African countries, leading to business disruption for AECI and its customers. Similarly, potential supply chain interruptions for water, gas and certain raw materials would also be disruptive.
1. AECI’s main manufacturing sites in South Africa are on the National Key Points list that prioritises electricity supply.
2. Develop supply contingency agreements and plans.
3. Review key suppliers’ business continuity plans, as agreed contractually with them.
EXTERNAL Protracted industrial action affecting customers and core business sectors.
Such action is disruptive and has a negative impact not only on AECI but also on the economy, investor confidence, the industries affected, and the people employed in those industries and businesses.
1. Ensure that contingency plans are in place.
2. Industry context monitoring.
3. Regular liaison with customers and reporting to management regarding trends and industry strikes.
4. Drive the Group’s diversification strategy in terms of geographies of operation and the customer base.
EXTERNAL Extreme weather events and failure to mitigate against/adapt to climate change, leading to drought or flooding, water supply interruptions and reduced agricultural output.
The El Niño weather pattern is having a severe impact on Southern Africa, with many countries facing extended periods of extreme drought conditions.
1. Manage inventory levels in line with customer demand.
2. Monitor effects and react appropriately in the circumstances.
3. Pursue resource-saving initiatives in line with AECI’s GOInG GREEn value.
4. Diversify geographically.
EXTERNAL Rapid spread of infectious diseases on a global scale, leading to operational and travel disruptions in the countries in which the Group operates. The Ebola virus remains a threat, particularly in West Africa, and the Zika virus has been declared a global emergency by the World Health Organisation.
1. Provide up-to-date safety information to AECI employees working in and/or travelling to high risk areas.
2. Continue to monitor developments.
3. Pull back employees if/when the threat arises.
TOP GROUP-WIDE RISKSAECI’s risks are classified as being preventable, strategic or external.
PREVENTABLE RISKS are internal to the Group and are controllable. AECI has a low tolerance for taking these risks as they offer no strategic benefit.
STRATEGIC RISKS are both internal and external and entail voluntary risk-taking to generate superior returns in line with the growth strategy. AECI has a moderate tolerance for these risks in the context of the perceived business benefits.
EXTERNAL RISKS exist outside of the Group and are beyond its influence or control. Business resilience strategies are crucial if AECI is to deal appropriately with the consequences should these risks materialise. AECI has a moderate tolerance for this type of risk.
ON THE BASIS OF ITS INTERNAL RISK ASSESSMENT PROCESS AND THE OUTCOMES OF FEEDBACK FROM STAKEHOLDERS, AECI HAS IDENTIFIED THOSE STRATEGIC UNCERTAINTIES THAT COULD HAVE A DIRECT IMPACT ON ITS ABILITY TO DELIVER ON ITS BUSINESS STRATEGY AND MEET ITS GROWTH OBJECTIVES. THE TABLE BELOW HIGHLIGHTS THE KEY RISKS TO THE GROUP AS A WHOLE.
MORE INFORMATION ON RISK MANAGEMENT IS ON THE FOLLOWING PAGES.
11
STRATEGIC ISSUES AND ASSOCIATED RISKS
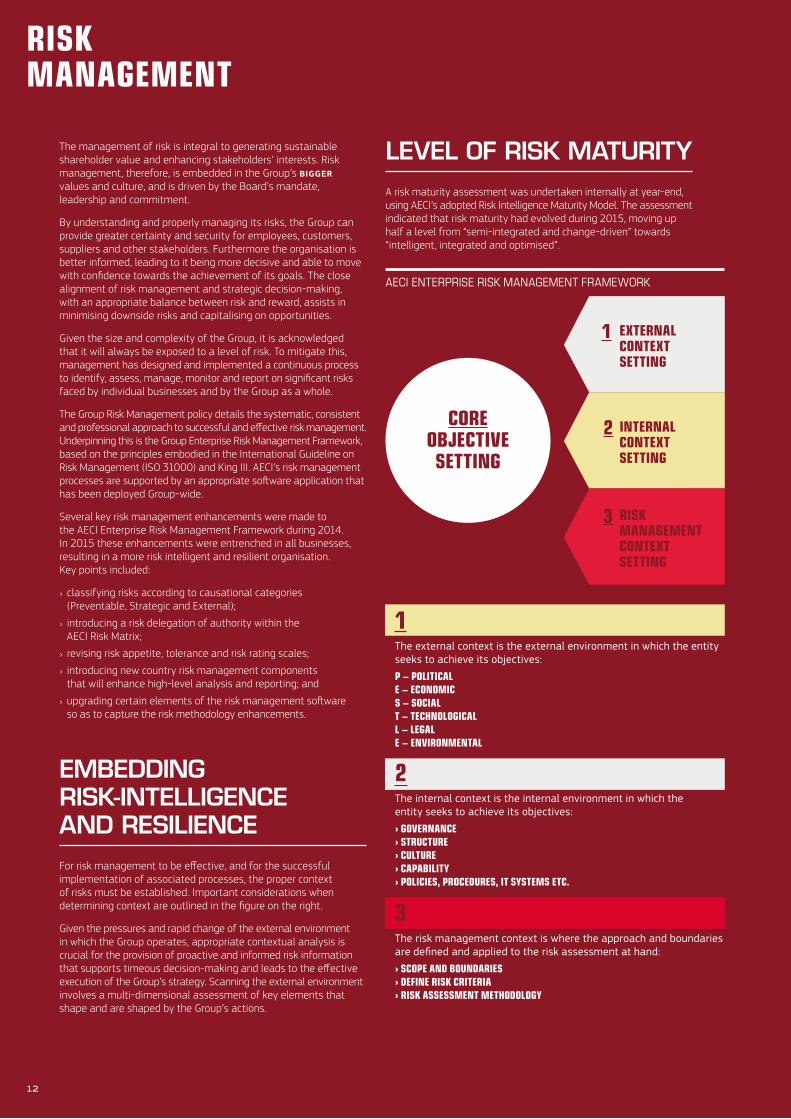
COREOBJECTIVESETTING
EXTERNALCONTEXTSETTING
1
INTERNALCONTEXTSETTING
2
RISK MANAGEMENT CONTEXTSETTING
3
AECIENTERPRISERISKMANAGEMENTFRAMEWORK
1The external context is the external environment in which the entity seeks to achieve its objectives:
P − POLITICALE − ECONOMICS − SOCIALT − TECHNOLOGICALL − LEGALE − ENVIRONMENTAL
2The internal context is the internal environment in which the entity seeks to achieve its objectives:
› GOVERNANCE› STRUCTURE› CULTURE› CAPABILITY› POLICIES, PROCEDURES, IT SYSTEMS ETC.
3The risk management context is where the approach and boundaries are defined and applied to the risk assessment at hand:
› SCOPE AND BOUNDARIES› DEFINE RISK CRITERIA› RISK ASSESSMENT METHODOLOGY
LEVEL OF RISK MATURITYA risk maturity assessment was undertaken internally at year-end, using AECI’s adopted Risk Intelligence Maturity Model. The assessment indicated that risk maturity had evolved during 2015, moving up half a level from “semi-integrated and change-driven” towards “intelligent, integrated and optimised”.
The management of risk is integral to generating sustainable shareholder value and enhancing stakeholders’ interests. Risk management, therefore, is embedded in the Group’s BIGGER values and culture, and is driven by the Board’s mandate, leadership and commitment.
By understanding and properly managing its risks, the Group can provide greater certainty and security for employees, customers, suppliers and other stakeholders. Furthermore the organisation is better informed, leading to it being more decisive and able to move with confidence towards the achievement of its goals. The close alignment of risk management and strategic decision-making, with an appropriate balance between risk and reward, assists in minimising downside risks and capitalising on opportunities.
Given the size and complexity of the Group, it is acknowledged that it will always be exposed to a level of risk. To mitigate this, management has designed and implemented a continuous process to identify, assess, manage, monitor and report on significant risks faced by individual businesses and by the Group as a whole.
The Group Risk Management policy details the systematic, consistent and professional approach to successful and effective risk management. Underpinning this is the Group Enterprise Risk Management Framework, based on the principles embodied in the International Guideline on Risk Management (ISO 31000) and King III. AECI’s risk management processes are supported by an appropriate software application that has been deployed Group-wide.
Several key risk management enhancements were made to the AECI Enterprise Risk Management Framework during 2014. In 2015 these enhancements were entrenched in all businesses, resulting in a more risk intelligent and resilient organisation. Key points included:
› classifying risks according to causational categories (Preventable, Strategic and External);
› introducing a risk delegation of authority within the AECI Risk Matrix;
› revising risk appetite, tolerance and risk rating scales;
› introducing new country risk management components that will enhance high-level analysis and reporting; and
› upgrading certain elements of the risk management software so as to capture the risk methodology enhancements.
EMBEDDING RISK-INTELLIGENCE AND RESILIENCEFor risk management to be effective, and for the successful implementation of associated processes, the proper context of risks must be established. Important considerations when determining context are outlined in the figure on the right.
Given the pressures and rapid change of the external environment in which the Group operates, appropriate contextual analysis is crucial for the provision of proactive and informed risk information that supports timeous decision-making and leads to the effective execution of the Group’s strategy. Scanning the external environment involves a multi-dimensional assessment of key elements that shape and are shaped by the Group’s actions.
12
RISK MANAGEMENT
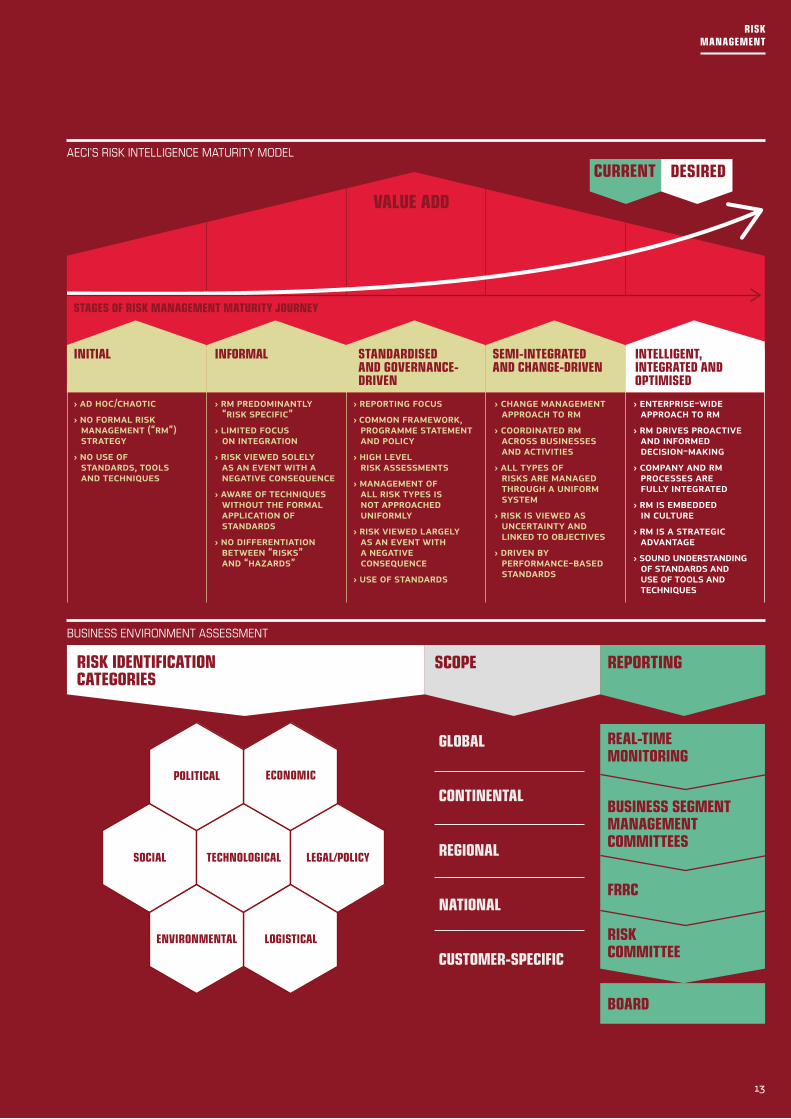
RISK IDENTIFICATION CATEGORIES
SCOPE REPORTING
ECONOMIC
SOCIAL TECHNOLOGICAL LEGAL/POLICY
LOGISTICAL
POLITICAL
ENVIRONMENTAL
GLOBAL
CONTINENTAL
REGIONAL
NATIONAL
CUSTOMER-SPECIFIC
REAL-TIME MONITORING
BUSINESS SEGMENTMANAGEMENTCOMMITTEES
FRRC
BOARD
RISK COMMITTEE
VALUE ADD
› AD HOC/CHAOTIC› NO FORMAL RISK MANAGEMENT (“RM”) STRATEGY› NO USE OF STANDARDS, TOOLS AND TECHNIQUES
› RM PREDOMINANTLY “RISK SPECIFIC”› LIMITED FOCUS ON INTEGRATION› RISK VIEWED SOLELY AS AN EVENT WITH A NEGATIVE CONSEQUENCE› AWARE OF TECHNIQUES WITHOUT THE FORMAL APPLICATION OF STANDARDS› NO DIFFERENTIATION BETWEEN “RISKS” AND “HAZARDS”
› REPORTING FOCUS› COMMON FRAMEWORK, PROGRAMME STATEMENT AND POLICY› HIGH LEVEL RISK ASSESSMENTS› MANAGEMENT OF ALL RISK TYPES IS NOT APPROACHED UNIFORMLY› RISK VIEWED LARGELY AS AN EVENT WITH A NEGATIVE CONSEQUENCE› USE OF STANDARDS
› CHANGE MANAGEMENT APPROACH TO RM› COORDINATED RM ACROSS BUSINESSES AND ACTIVITIES› ALL TYPES OF RISKS ARE MANAGED THROUGH A UNIFORM SYSTEM› RISK IS VIEWED AS UNCERTAINTY AND LINKED TO OBJECTIVES› DRIVEN BY PERFORMANCE-BASED STANDARDS
› ENTERPRISE-WIDE APPROACH TO RM› RM DRIVES PROACTIVE AND INFORMED DECISION-MAKING› COMPANY AND RM PROCESSES ARE FULLY INTEGRATED› RM IS EMBEDDED IN CULTURE› RM IS A STRATEGIC ADVANTAGE› SOUND UNDERSTANDING OF STANDARDS AND USE OF TOOLS AND TECHNIQUES
INFORMAL STANDARDISED AND GOVERNANCE-DRIVEN
SEMI-INTEGRATED AND CHANGE-DRIVEN
INTELLIGENT, INTEGRATED AND OPTIMISED
INITIAL
CURRENT DESIRED
STAGES OF RISK MANAGEMENT MATURITY JOURNEY
AECI’SRISKINTELLIGENCEMATURITYMODEL
BUSINESSENVIRONMENTASSESSMENT
13
RISK MANAGEMENT
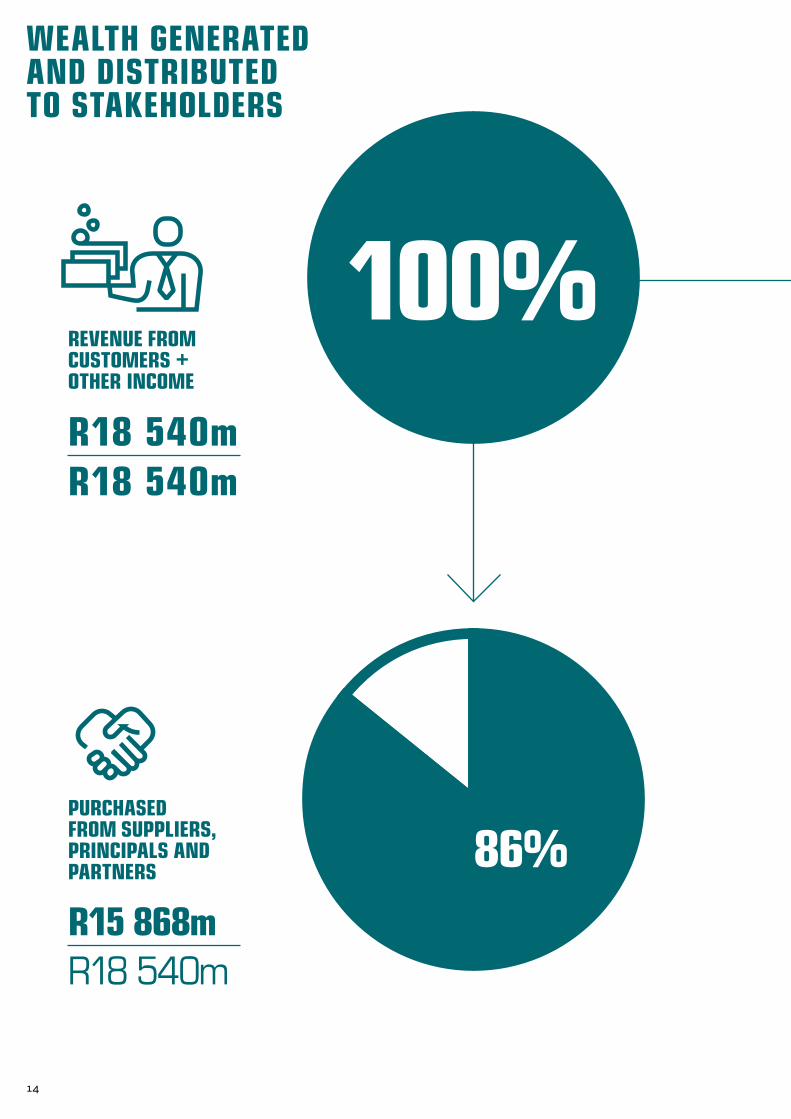
86%
WEALTH GENERATED AND DISTRIBUTED TO STAKEHOLDERS
REVENUE FROM CUSTOMERS + OTHER INCOME
PURCHASED FROM SUPPLIERS, PRINCIPALS AND PARTNERS
R15 868mR18 540m
100%R18 540mR18 540m
14
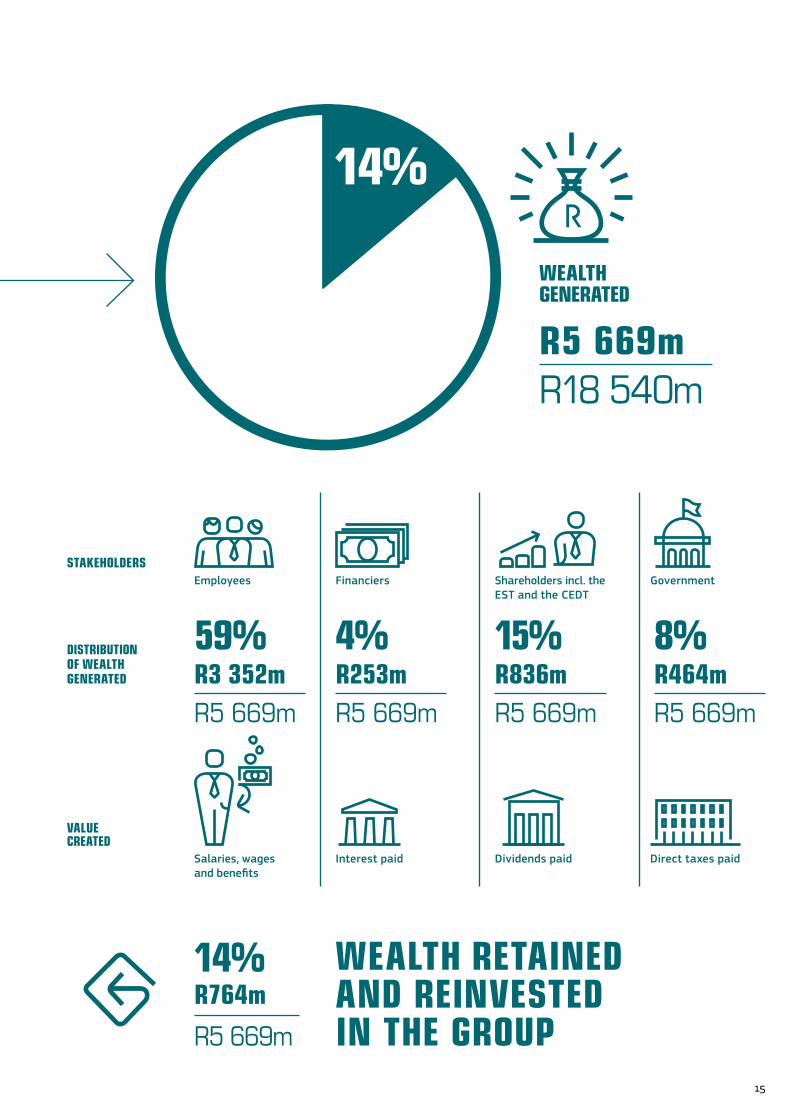
R764m
R5 669m
WEALTH RETAINED AND REINVESTED IN THE GROUP
Salaries, wages and benefits
Interest paid Dividends paid Direct taxes paid
VALUE CREATED
DISTRIBUTION OF WEALTH GENERATED R3 352m
R5 669m
59%R253mR5 669m
4%R464mR5 669m
8%R836mR5 669m
15%
STAKEHOLDERSEmployees GovernmentShareholders incl. the
EST and the CEDTFinanciers
WEALTHGENERATED
R5 669mR18 540m
14%
14%
15

SCHALK ENGELBRECHT RICHARD DUNNE (67) CA(SA)
Richard joined AECI’s Board in 2007. He is Chairman of the Audit and Remuneration Committees, a member of the Nominations and Risk Committees and chairs the Financial Review and Risk Committee (“FRRC”) of AECI’s specialty chemicals cluster. Richard is a member of the Boards and Audit Committees of Anglo American Platinum and the Standard Bank Group.
(69) BSc, MBL
Schalk took up his position as AECI’s Chairman in 2012. He is also Chairman of the Nominations Committee and a member of the Remuneration Committee. He was AECI’s Chief Executive from 2003 to 2008.
ZELLAH FUPHE (47) BSocialSc
Zellah joined the AECI Board in 2007 and chairs the Social and Ethics Committee. She is an Executive and a Board member at Dimension Data. She was previously an Executive at Plessey where she served as Managing Executive of Plessey Broadband Investments and Managing Director of Plessey South Africa for a number of years. Zellah is a member of the Engen Board. Previously she served on the Boards of Afric Oil (Chair), Worldwide Coal Carolina (Chair), the Oceana Group, Worldwide African Investment Holdings and the Unisa School of Business Leadership.
GRAHAM DEMPSTER (60) BCom, CA(SA)
Graham was appointed to AECI’s Board on 31 January 2016 and joined the Audit Committee on 22 February. He has 35 years’ experience in the banking industry, both in South Africa and internationally. He was an Executive Director of the Nedbank Group/Nedbank Limited (“Nedbank”) at the time of his retirement in 2015 and is the past Chief Operating Officer of Nedbank. He served as a Member of Nedbank’s Board Group Credit sub-Committee, as Chairman of the Asset and Liability Committee and the Nedbank Brand Committee. He serves as a Non-executive Director on the Boards of Imperial Holdings and Telkom.
16
NON-EXECUTIVE DIRECTORS

ALLEN MORGAN (68) BSc, BEng (Elect), Pr Eng
Allen joined the AECI Board in 2010. He is Chairman of the Risk Committee, a member of the Audit and Social and Ethics Committees as well as Chairman of the AEL FRRC. Allen spent his working life at Eskom and served as that company’s Chief Executive from 1994 until his retirement in 2000. Other directorships include BioTherm Energy, Imalivest Assets and Kumba Iron Ore.
LIZIWE MDA (50) MSc (Chem Eng), MBA
Liziwe joined AECI’s Board in 2011 and is a member of the Risk Committee. She is head of strategy at a large company in the oil and gas sector in Africa. Prior to taking up this position in 2013, Liziwe was Refinery Operations Manager at Shell and BP Southern Africa Petroleum Refineries (“SAPREF”) in Durban. She has extensive experience in manufacturing, projects, risk management, business improvement and strategy gained during her career at SAPREF, Sasol Technology and Unilever SA.
LITHA NYHONYHA (57) CA(SA)
Appointed to the AECI Board in 2006, Litha is a member of the Audit, Nominations and Remuneration Committees as well as a member of AEL’s FRRC. Litha is Executive Chairman and a founding member of Regiments Capital, a Black-controlled and managed financial services group. He is also a Director of several listed and unlisted companies including Kumba Iron Ore.
KHOTSO MOKHELE (60) BSc (Agriculture), MSc (Food Science), PhD (Microbiology)
Khotso was appointed to the AECI Board on 1 March 2016. He is Special Advisor to the Minister of Science and Technology, Chancellor of the University of the Free State, Lead Independent Non-executive Director of Afrox and a Non-executive Director on the Boards of Hans Merensky Holdings, Tiger Brands and Zimbabwe Platinum Holdings.
RAMS RAMASHIA (58) BIuris, LLB, LLM
Rams joined the AECI Board in 2010 and serves on the Social and Ethics, Risk, Nominations and Remuneration Committees. In 2015 he was appointed to the Board of Anglo American South Africa where he serves as a member of its Risk and Audit Committee and chairs the Social and Ethics Committee. He is Non-executive Chairman of Rand Refinery and also chairs that company’s Nomination and Remuneration Committee. Rams is past Chairman of BP Southern Africa, SAPREF and the South African Petroleum Industry Association. Between 2000 and 2004 he was Director-General of the National Department of Labour and government Chief Negotiator at the National Economic Development and Labour Council. Rams is a practising advocate of the High Court and a member of the Council of the Pretoria Society of Advocates.
GODFREY GOMWE (60) BAcc, MBL, CA(Z), CD(SA)
Godfrey joined the AECI Board in January 2015 and he is a member of the Audit Committee. Godfrey has extensive experience as an Executive in the metals and mining industries. At the time of his early retirement in 2014, he was Chief Executive of Anglo American Thermal Coal and was also responsible for Anglo American’s manganese interests in the joint venture with BHP Billiton. During his career Godfrey developed and led the execution of major business repositioning and transformation strategies. He was also a leader in driving safety culture and performance in the workplace.
17
NON-EXECUTIVE DIRECTORS
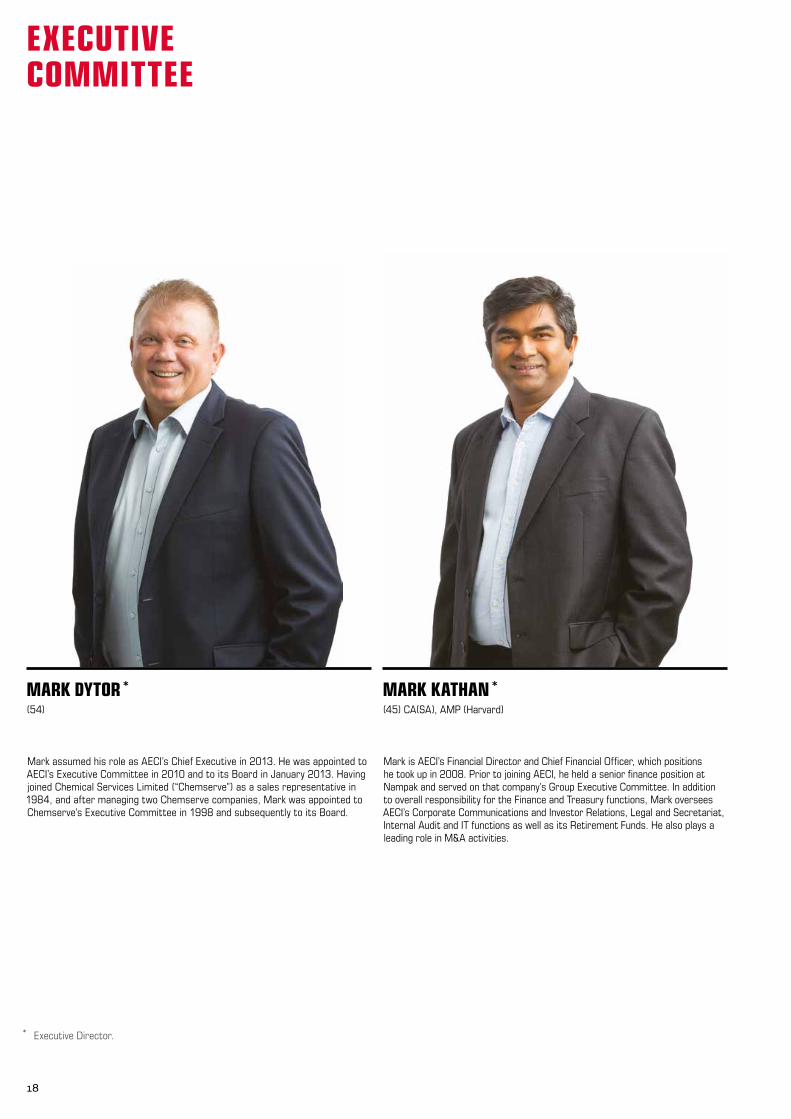
MARK DYTOR * MARK KATHAN * (54)
Mark assumed his role as AECI’s Chief Executive in 2013. He was appointed to AECI’s Executive Committee in 2010 and to its Board in January 2013. Having joined Chemical Services Limited (“Chemserve”) as a sales representative in 1984, and after managing two Chemserve companies, Mark was appointed to Chemserve’s Executive Committee in 1998 and subsequently to its Board.
* Executive Director.
(45) CA(SA), AMP (Harvard)
Mark is AECI’s Financial Director and Chief Financial Officer, which positions he took up in 2008. Prior to joining AECI, he held a senior finance position at Nampak and served on that company’s Group Executive Committee. In addition to overall responsibility for the Finance and Treasury functions, Mark oversees AECI’s Corporate Communications and Investor Relations, Legal and Secretariat, Internal Audit and IT functions as well as its Retirement Funds. He also plays a leading role in M&A activities.
18
EXECUTIVE COMMITTEE
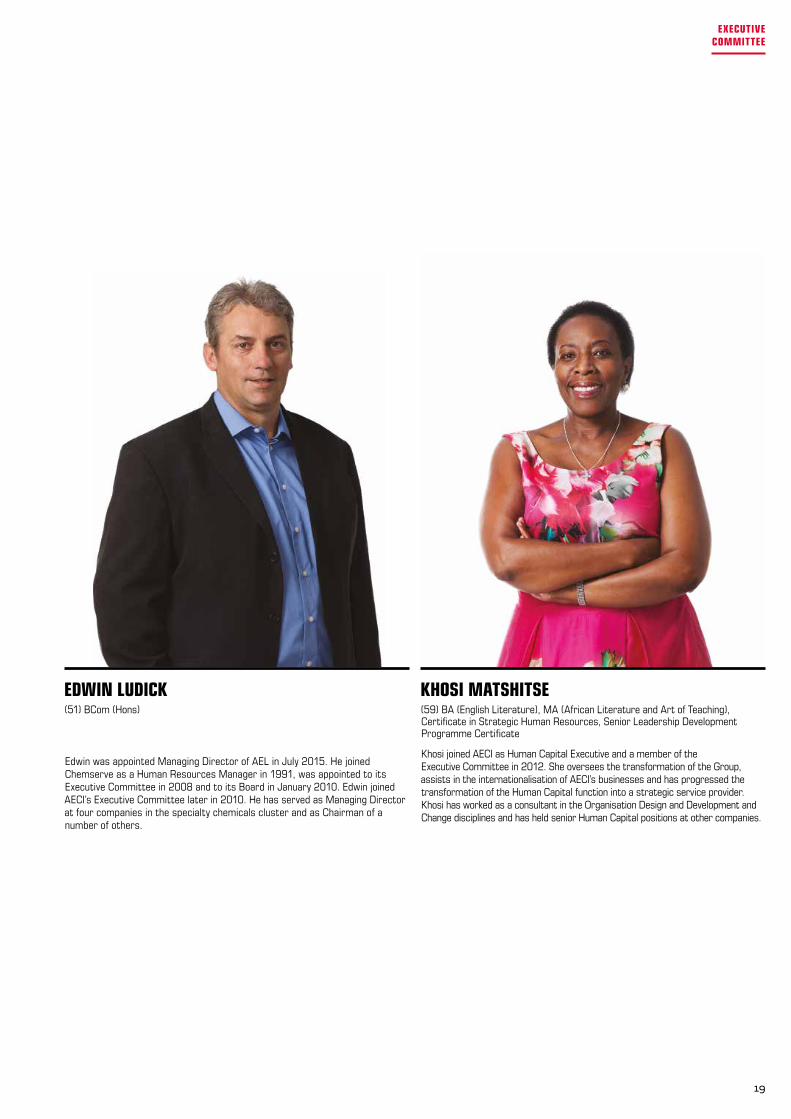
EDWIN LUDICK KHOSI MATSHITSE (51) BCom (Hons)
Edwin was appointed Managing Director of AEL in July 2015. He joined Chemserve as a Human Resources Manager in 1991, was appointed to its Executive Committee in 2008 and to its Board in January 2010. Edwin joined AECI’s Executive Committee later in 2010. He has served as Managing Director at four companies in the specialty chemicals cluster and as Chairman of a number of others.
(59) BA (English Literature), MA (African Literature and Art of Teaching), Certificate in Strategic Human Resources, Senior Leadership Development Programme Certificate
Khosi joined AECI as Human Capital Executive and a member of the Executive Committee in 2012. She oversees the transformation of the Group, assists in the internationalisation of AECI’s businesses and has progressed the transformation of the Human Capital function into a strategic service provider. Khosi has worked as a consultant in the Organisation Design and Development and Change disciplines and has held senior Human Capital positions at other companies.
19
EXECUTIVE COMMITTEE

GUGU MTHETHWA (56) BSc Eng (Chem), MBA
Gugu is Group M&A Manager. She joined AECI in 2011. Her work experience includes various roles in the chemical processing and pulp manufacturing industries, as well as investment banking.
FULVIA PUTERO (53) MA (Translation)
Fulvia is AECI’s Corporate Communications and Investor Relations Manager. A graduate of the University of the Witwatersrand, she joined the Group’s Publicity Department as a Junior Press Officer in 1986.
GARY CUNDILL (48) BSc Eng (Chem), BEng Hons (Water), GDE (Civil), MPhil (Environmental Management), MIChemE, CEng
Gary is Group Technical and Safety, Health and Environment Manager. He has worked in the chemicals, explosives and steel industries. Prior to joining the Group in 2001, he held positions in technical development and project and operations management.
20
SENIOR MANAGERS
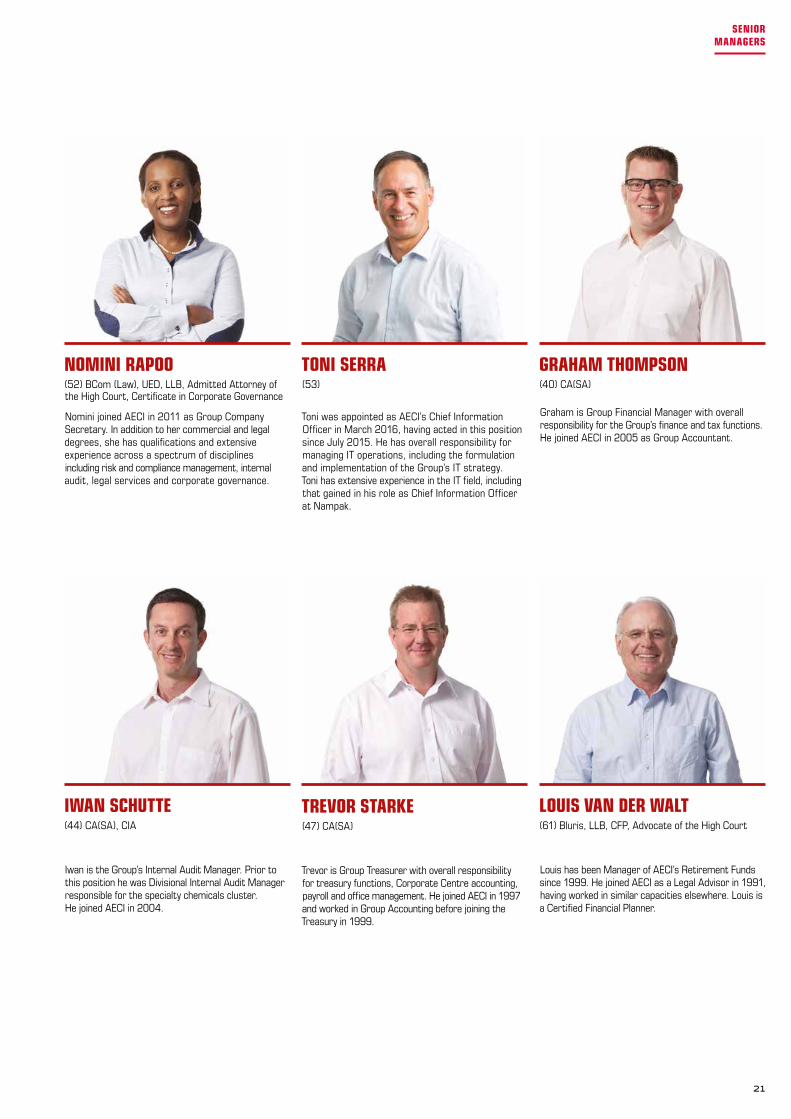
TREVOR STARKE (47) CA(SA)
Trevor is Group Treasurer with overall responsibility for treasury functions, Corporate Centre accounting, payroll and office management. He joined AECI in 1997 and worked in Group Accounting before joining the Treasury in 1999.
IWAN SCHUTTE (44) CA(SA), CIA
Iwan is the Group’s Internal Audit Manager. Prior to this position he was Divisional Internal Audit Manager responsible for the specialty chemicals cluster. He joined AECI in 2004.
GRAHAM THOMPSON (40) CA(SA)
Graham is Group Financial Manager with overall responsibility for the Group’s finance and tax functions. He joined AECI in 2005 as Group Accountant.
TONI SERRA (53)
Toni was appointed as AECI’s Chief Information Officer in March 2016, having acted in this position since July 2015. He has overall responsibility for managing IT operations, including the formulation and implementation of the Group’s IT strategy. Toni has extensive experience in the IT field, including that gained in his role as Chief Information Officer at Nampak.
LOUIS VAN DER WALT (61) Bluris, LLB, CFP, Advocate of the High Court
Louis has been Manager of AECI’s Retirement Funds since 1999. He joined AECI as a Legal Advisor in 1991, having worked in similar capacities elsewhere. Louis is a Certified Financial Planner.
NOMINI RAPOO (52) BCom (Law), UED, LLB, Admitted Attorney of the High Court, Certificate in Corporate Governance
Nomini joined AECI in 2011 as Group Company Secretary. In addition to her commercial and legal degrees, she has qualifications and extensive experience across a spectrum of disciplines including risk and compliance management, internal audit, legal services and corporate governance.
21
SENIOR MANAGERS


CHAIRMAN’S LETTER TO STAKEHOLDERS 24
CHIEF EXECUTIVE’S INNOVATION REPORT 28
CHIEF FINANCIAL OFFICER’S FINANCIAL CAPITAL REPORT 34
MANUFACTURED CAPITAL REPORT 42
THE FOLLOWING COMMENTARY FROM OUR LEADERSHIP SUMMARISES THE PROGRESS MADE DURING 2015 IN THE EXECUTION OF OUR STRATEGY, THE USE OF TECHNOLOGICAL SOLUTIONS ACROSS GROUP OPERATIONS AND THE FINANCIAL RESULTS OF THIS PROGRESS.
INNOVATIVEWE LOOK FOR AND ENCOURAGE NEW OPPORTUNITIES, IDEAS AND SOLUTIONS
WE EMBRACE, STAY ABREAST OF AND USE TECHNOLOGY
WE LEAD WITH GAME CHANGING DIFFERENTIATION FOR OUR CUSTOMERS’ SUCCESS
ACTIVELY CHALLENGING OURSELVES TO REINVENT WHO WE ARE, WHAT WE
DO AND HOW WE DO IT
DEAR STAKEHOLDERS
IT GIVES ME PLEASURE TO REPORT THAT AECI ACHIEVED ANOTHER GOOD PERFORMANCE IN 2015, NOTWITHSTANDING THE DIFFICULTIES THAT CHARACTERISED THE LOCAL AND GLOBAL ENVIRONMENTS. MANY OF THE COMPANY’S CUSTOMERS ARE IN THE MINING SECTOR WHERE CONDITIONS WERE PARTICULARLY CHALLENGING. NEVERTHELESS, THANKS TO BOLD AND INNOVATIVE STRATEGIES, PRODUCTS AND SERVICES THE GROUP WAS ABLE TO SUSTAIN ITS GROWTH TREND.
I share with you some noteworthy events and developments from the perspective of the Board of Directors.
The role of the Board is to exercise leadership, integrity and sound judgement in the business and to provide strategic
direction to the Company, with a keen understanding of key risks, and to continually monitor performance against agreed objectives. As such, the Board plays a pivotal role not only in overseeing the implementation of strategy, but also in defining a governance climate and framework in support of the delivery of sustainable growth in the interests of all stakeholders.
STRATEGIC DELIVERYThere was year-on-year growth in AECI’s revenue, profit from operations and headline earnings per share. Of the
R18,4 billion revenue generated, 34% originated outside South Africa. This is in line with the strategy to increase earnings denominated in hard currencies and the objective is to increase the ratio to about 50% in the next few years. The Group’s successful entry into Australia as a supplier of explosives, initiating systems and related expertise bodes well in this regard.
Strategic progress was also made in terms of growing the Group through acquisitions. All three businesses
acquired in the year were integrated successfully and enhanced the performance, as well as the prospects, of the Agrochemicals and the Food Additives and Ingredients pillars. We welcome the employees of Farmers Organisation, Biocult and Southern Canned Products (“SCP”) to the AECI Group.
AECI was established as a company in 1924. It was formed by a merger between the South African interests of Nobel Industries, of the United Kingdom, and the manufacturing arm of De Beers Consolidated, of Kimberley. The primary purpose was to provide blasting explosives and detonators to gold and diamond mines, with manufacturing sites at Modderfontein, Somerset West and Umbogintwini.
CASH OF R1,4bn RETURNED TO SHAREHOLDERS IN THE YEARDIVIDEND DISTRIBUTION: R836m
SHARE REPURCHASE: R563m
BOARD OF DIRECTORS STRENGTHENED
24
CHAIRMAN’S LETTER TO STAKEHOLDERS

SCHALK ENGELBRECHTCHAIRMAN
25
CHAIRMAN’S LETTER TO
STAKEHOLDERS
Further changes were effected in 2015 to enable improved standards of compliance with applicable laws and regulations. The Board agreed to redefine AECI’s governance framework in terms of the roles and responsibilities of the Company’s Board and those of the Boards of its subsidiaries. The objective is to ensure optimal alignment with the Group’s portfolio management operating model. This work will be completed in 2016.
RISK MANAGEMENTThe Board is accountable for risk management in AECI. It is assisted by the Risk Committee, which provides the Board
with assurance that an effective and measurable risk management process is in place. The AECI Executive Committee is responsible for the Group’s identification and management of risk. Several key risk management enhancements were introduced to the AECI Enterprise Risk Management Framework during 2014. In 2015 these enhancements were entrenched in all businesses, resulting in a more risk intelligent and resilient organisation.
An internal risk maturity assessment was undertaken at year-end, using the Company’s adopted Risk Intelligence Maturity Model. The assessment indicated that risk maturity had evolved during 2015, moving from “semi-integrated and change-driven” towards “intelligent, integrated and optimised”.
DIRECTORS’ DEVELOPMENT
As in the past, the Board was invited to participate in visits to Group businesses. Accordingly, Board members visited
newly-acquired SCP and Afoodable, a division of Lake Foods, which in May 2015 commissioned a new manufacturing plant. Board members were able to engage with the management teams of both businesses and obtain a more holistic understanding of their operations and value contribution to the Group’s Food Additives and Ingredients growth pillar.
A visit to Senmin, including the new R&D facility, was also undertaken during the year.
HUMAN CAPITALFurther progress was made towards the achievement of the Human Capital function’s objective to enable and facilitate the
development and growth of AECI’s people. Organisational effectiveness and development motivated several projects and programmes to enhance employees’ engagement and workplace experience.
With changes in technology, which reduced AECI’s manufacturing footprint over time, land holdings at
Modderfontein and Somerset West became surplus to operational requirements and available for alternative use. In 2013, agreement was reached with Shanghai Zendai Property Ltd for the sale of the bulk of surplus land in Modderfontein. In 2015, a bulk land sale at Somerset West was concluded with the City of Cape Town and the surplus assets not included in this transaction were also sold. About 216 hectares of surplus land remains at Modderfontein.
AECI’s property activities, which now comprise mainly the leasing of buildings and the provision of services at the multi-user Umbogintwini Industrial Complex, will continue to be managed by Acacia Real Estate.
SAFETYThe Group’s relaunched values and commitments embody the concepts and behaviours required of an
organisation that is EnGaGED and REspOnsIBLE in every aspect of its business. In terms of our REspOnsIBLE value, the work-related deaths of two Group employees during the year were tragic and marred what was otherwise a world-class safety performance. In January, Mr Zingisile Reginald Mkhosi died in a traffic accident while travelling on a public road to a customer’s site. In October, Mr Vincent Mahema sustained fatal injuries in a forklift accident. We extend our sympathies to their immediate and extended families, their friends and their colleagues.
The Board and management view all incidents of harm to employees in an extremely serious light and renewed efforts to improve behaviour and performance in matters of safety will need to be sustained and monitored very carefully in the coming year.
GOVERNANCEStakeholders including regulators, neighbours and special interest groups have significant influence on the sustainability
of our businesses. It is with their approval and cooperation that we retain our “licence to operate” by demonstrating open, honest and responsible corporate citizenship.
In this context, a disappointment was the search and seizure operation carried out at Modderfontein by environmental authorities towards year-end. In line with policy, AECI is cooperating with the authorities so as to resolve the matter.
The investigation process undertaken in respect of Akulu Marchon by the Competition Commission of South Africa (“the Commission”), as reported in 2014, was completed in the first quarter of 2015 and the Company awaits the Commission’s ruling in this regard.
26
CHAIRMAN’S LETTER TO STAKEHOLDERS
Building skills and behaviours which promote a culture of continual learning, leadership, inclusivity and transformation is imperative for the Group’s achievement of its strategic goals, including its Employment Equity targets. Talent effectiveness and leadership strength improved through the Group’s partnership with the Gordon Institute of Business Science, which provides accredited and customised programmes for the AECI Management Development Ladder designed for leaders from Junior to Senior management levels. The third intake participated in 2015 and the initiative’s continued success was pleasing. Over three years, 277 individuals have benefited, with 82% of these from designated groups.
In the year under review R2,3 million (20% more than in 2014) was invested in 124 employees through the Employee Study Assistance Programme. 90% of these employees were from designated groups and their chosen studies covered qualifications that included MBA, BSc and BCom Degrees as well as Diplomas and shorter courses in relevant disciplines. Although the focus remains on addressing scarce and critical skills, the Group will continue assisting employees wishing to improve their educational qualifications in their preferred fields, provided these are in line with their roles.
A more comprehensive discussion on these matters appears in the commentary on page 63.
B-BBEEThe Group maintained its Level 4 B-BBEE Contributor status. A summary of key initiatives, per element of the B-BBEE Amended Codes of Good Practice, to achieve substantive transformation is presented on page 58.
CASH RETURNED TO SHAREHOLDERSShareholders received the majority of the net proceeds from the bulk property sale at Modderfontein in the form of a special dividend of 375 cents per ordinary share, amounting to R430 million. Shareholders also received ordinary cash dividends in the amount of R401 million. A further R563 million was invested in a general ordinary share repurchase programme. Total cash returned to shareholders in the year, therefore, amounted to R1,4 billion. Beneficiaries of the AECI Employees Share Trust received a R2 million dividend.
CHANGES TO THE BOARDNon-executive Directors are appointed on the basis of their skills and expertise appropriate to the strategic direction
of the Company. Diversity, race and gender are also taken into account when appointments are made and the Board, through its Nominations Committee, ensures that it has the right balance of skills, expertise and experience. A succession plan for Board members has also been developed by the Nominations Committee.
In October 2015, Tak Hiemstra resigned as a Non-executive Director of the Company. We thank him for his services. Graham Dempster was appointed in the same capacity with effect from 31 January 2016. Khotso Mokhele was also appointed as a Non-executive Director with effect from 1 March 2016. These appointments were made after a rigorous search for individuals with the appropriate skills, talent and diversity in a limited pool of available resources. I welcome them both to the Board and look forward to working with them.
ACKNOWLEDGEMENTSI wish to record my thanks to all our stakeholders including my fellow Board members, AECI’s management, its employees and customers. Without all of your support and contributions our 2015 performance would not have been possible.
Schalk Engelbrecht Chairman
Woodmead, Sandton 11 April 2016
27
CHAIRMAN’S LETTER TO
STAKEHOLDERS
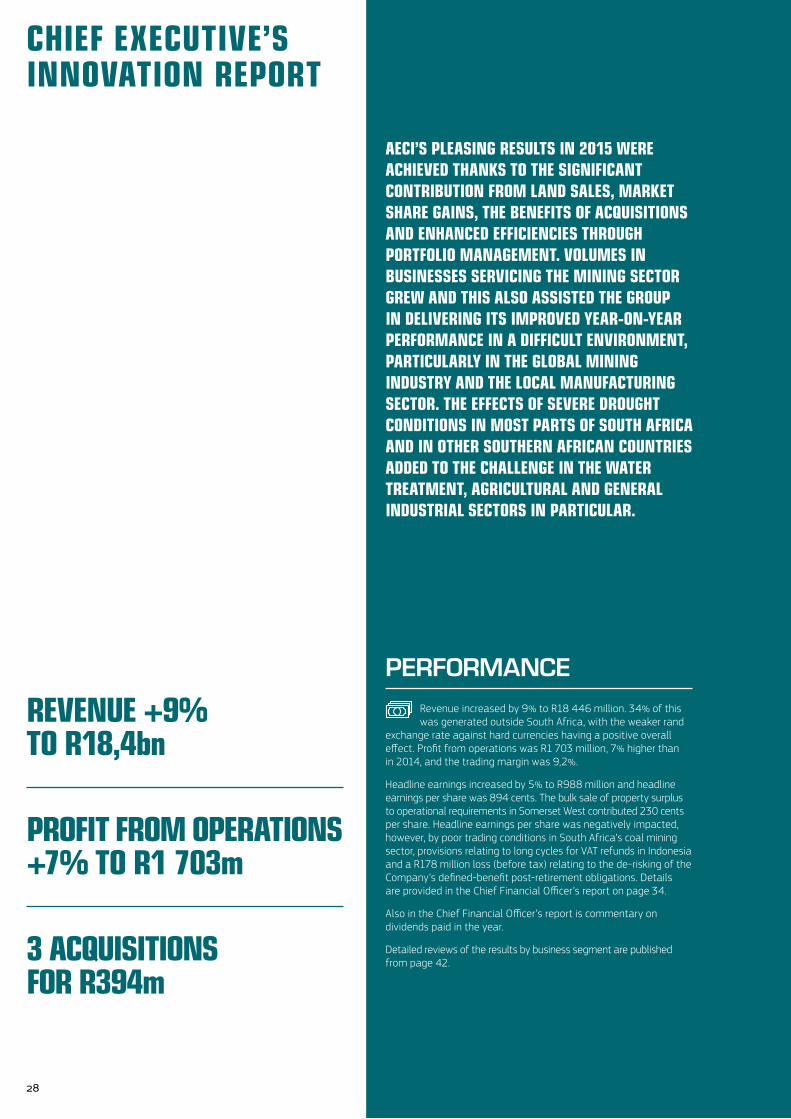
AECI’S PLEASING RESULTS IN 2015 WERE ACHIEVED THANKS TO THE SIGNIFICANT CONTRIBUTION FROM LAND SALES, MARKET SHARE GAINS, THE BENEFITS OF ACQUISITIONS AND ENHANCED EFFICIENCIES THROUGH PORTFOLIO MANAGEMENT. VOLUMES IN BUSINESSES SERVICING THE MINING SECTOR GREW AND THIS ALSO ASSISTED THE GROUP IN DELIVERING ITS IMPROVED YEAR-ON-YEAR PERFORMANCE IN A DIFFICULT ENVIRONMENT, PARTICULARLY IN THE GLOBAL MINING INDUSTRY AND THE LOCAL MANUFACTURING SECTOR. THE EFFECTS OF SEVERE DROUGHT CONDITIONS IN MOST PARTS OF SOUTH AFRICA AND IN OTHER SOUTHERN AFRICAN COUNTRIES ADDED TO THE CHALLENGE IN THE WATER TREATMENT, AGRICULTURAL AND GENERAL INDUSTRIAL SECTORS IN PARTICULAR.
PERFORMANCERevenue increased by 9% to R18 446 million. 34% of this was generated outside South Africa, with the weaker rand
exchange rate against hard currencies having a positive overall effect. Profit from operations was R1 703 million, 7% higher than in 2014, and the trading margin was 9,2%.
Headline earnings increased by 5% to R988 million and headline earnings per share was 894 cents. The bulk sale of property surplus to operational requirements in Somerset West contributed 230 cents per share. Headline earnings per share was negatively impacted, however, by poor trading conditions in South Africa’s coal mining sector, provisions relating to long cycles for VAT refunds in Indonesia and a R178 million loss (before tax) relating to the de-risking of the Company’s defined-benefit post-retirement obligations. Details are provided in the Chief Financial Officer’s report on page 34.
Also in the Chief Financial Officer’s report is commentary on dividends paid in the year.
Detailed reviews of the results by business segment are published from page 42.
REVENUE +9% TO R18,4bn
PROFIT FROM OPERATIONS +7% TO R1 703m
3 ACQUISITIONS FOR R394m
28
CHIEF EXECUTIVE’SINNOVATION REPORT
MARK DYTORCHIEF EXECUTIVE
29
CHIEF EXECUTIVE’S INNOVATION REPORT
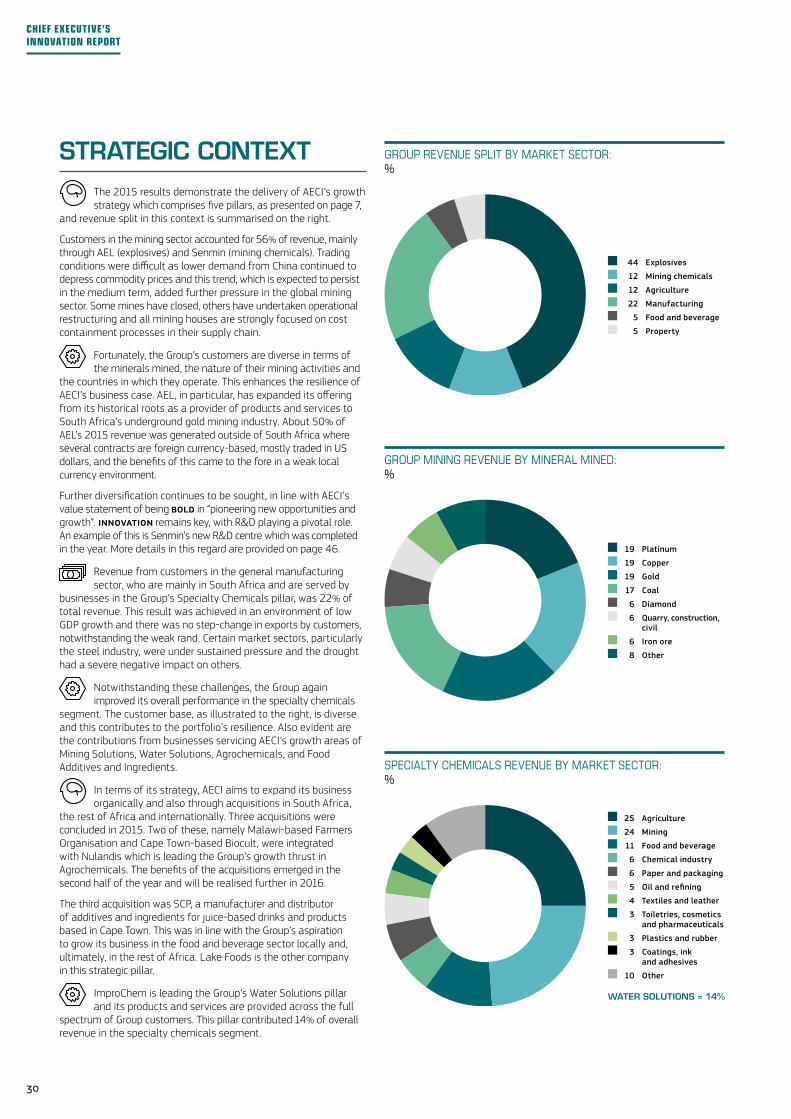
STRATEGIC CONTEXTThe 2015 results demonstrate the delivery of AECI’s growth strategy which comprises five pillars, as presented on page 7,
and revenue split in this context is summarised on the right.
Customers in the mining sector accounted for 56% of revenue, mainly through AEL (explosives) and Senmin (mining chemicals). Trading conditions were difficult as lower demand from China continued to depress commodity prices and this trend, which is expected to persist in the medium term, added further pressure in the global mining sector. Some mines have closed, others have undertaken operational restructuring and all mining houses are strongly focused on cost containment processes in their supply chain.
Fortunately, the Group’s customers are diverse in terms of the minerals mined, the nature of their mining activities and
the countries in which they operate. This enhances the resilience of AECI’s business case. AEL, in particular, has expanded its offering from its historical roots as a provider of products and services to South Africa’s underground gold mining industry. About 50% of AEL’s 2015 revenue was generated outside of South Africa where several contracts are foreign currency-based, mostly traded in US dollars, and the benefits of this came to the fore in a weak local currency environment.
Further diversification continues to be sought, in line with AECI’s value statement of being BOLD in “pioneering new opportunities and growth”. InnOvatIOn remains key, with R&D playing a pivotal role. An example of this is Senmin’s new R&D centre which was completed in the year. More details in this regard are provided on page 46.
Revenue from customers in the general manufacturing sector, who are mainly in South Africa and are served by
businesses in the Group’s Specialty Chemicals pillar, was 22% of total revenue. This result was achieved in an environment of low GDP growth and there was no step-change in exports by customers, notwithstanding the weak rand. Certain market sectors, particularly the steel industry, were under sustained pressure and the drought had a severe negative impact on others.
Notwithstanding these challenges, the Group again improved its overall performance in the specialty chemicals
segment. The customer base, as illustrated to the right, is diverse and this contributes to the portfolio’s resilience. Also evident are the contributions from businesses servicing AECI’s growth areas of Mining Solutions, Water Solutions, Agrochemicals, and Food Additives and Ingredients.
In terms of its strategy, AECI aims to expand its business organically and also through acquisitions in South Africa,
the rest of Africa and internationally. Three acquisitions were concluded in 2015. Two of these, namely Malawi-based Farmers Organisation and Cape Town-based Biocult, were integrated with Nulandis which is leading the Group’s growth thrust in Agrochemicals. The benefits of the acquisitions emerged in the second half of the year and will be realised further in 2016.
The third acquisition was SCP, a manufacturer and distributor of additives and ingredients for juice-based drinks and products based in Cape Town. This was in line with the Group’s aspiration to grow its business in the food and beverage sector locally and, ultimately, in the rest of Africa. Lake Foods is the other company in this strategic pillar.
ImproChem is leading the Group’s Water Solutions pillar and its products and services are provided across the full
spectrum of Group customers. This pillar contributed 14% of overall revenue in the specialty chemicals segment.
GROUPREVENUESPLITBYMARKETSECTOR:%
44 Explosives
12 Mining chemicals
12 Agriculture
22 Manufacturing
5 Food and beverage
5 Property
SPECIALTYCHEMICALSREVENUEBYMARKETSECTOR:%
25 Agriculture
24 Mining
11 Food and beverage
6 Chemical industry
6 Paper and packaging
5 Oil and refining
4 Textiles and leather
3 Toiletries, cosmetics and pharmaceuticals
3 Plastics and rubber
3 Coatings, ink and adhesives
10 Other
WATER SOLUTIONS = 14%
GROUPMININGREVENUEBYMINERALMINED:%
19 Platinum
19 Copper
19 Gold
17 Coal
6 Diamond
6 Quarry, construction, civil
6 Iron ore
8 Other
30
CHIEF EXECUTIVE’S INNOVATION REPORT
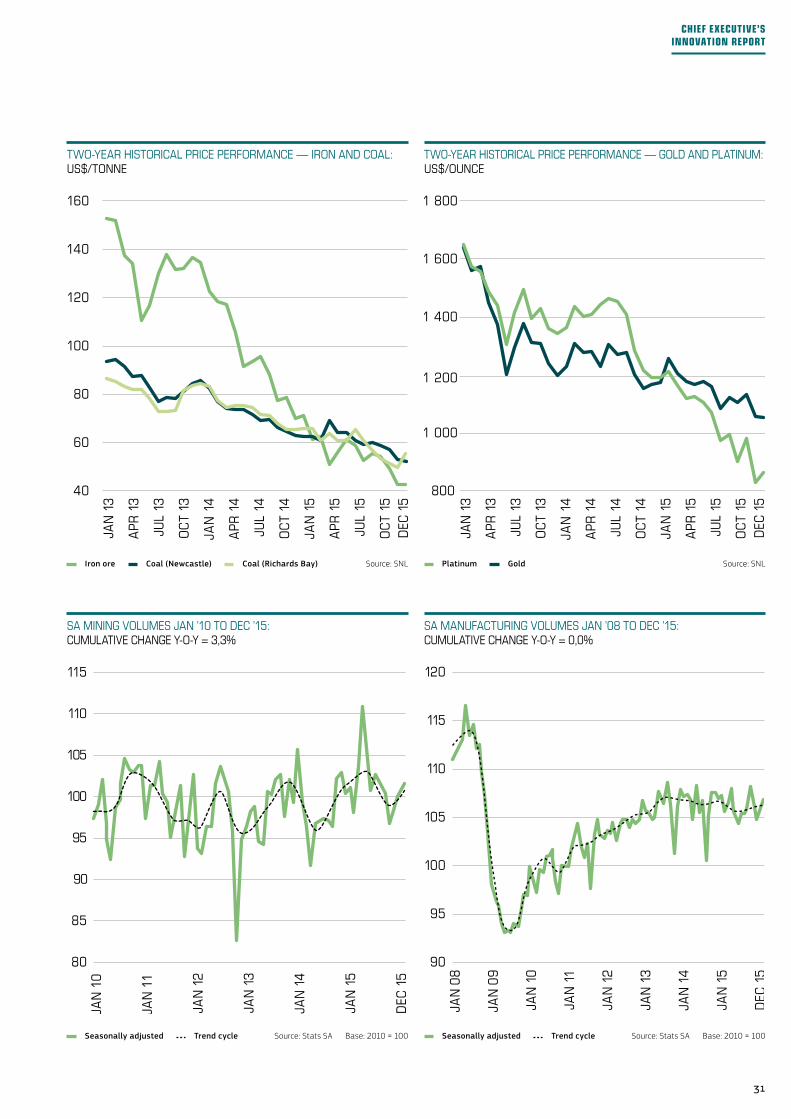
TWO-YEARHISTORICALPRICEPERFORMANCE—IRONANDCOAL:US$/TONNE
40
160
140
120
100
80
60
DEC
15
JUL
15
OC
T 15
APR
15
JAN
15
OC
T 14
JUL
14
APR
14
APR
13
JAN
13
JAN
14
OC
T 13
JUL
13
Iron ore Coal (Newcastle) Coal (Richards Bay) Source: SNL
SAMANUFACTURINGVOLUMESJAN’08TODEC’15:CUMULATIVECHANGEY-O-Y=0,0%
90
100
110
120
115
105
95
JAN
15
DEC
15
JAN
14
JAN
13
JAN
09
JAN
08
JAN
12
JAN
11
JAN
10
Seasonally adjusted Trend cycle Source: Stats SA Base: 2010 = 100
TWO-YEARHISTORICALPRICEPERFORMANCE—GOLDANDPLATINUM:US$/OUNCE
800
1 000
1 200
1 400
1 600
1 800
DEC
15
JUL
15
OC
T 15
APR
15
JAN
15
OC
T 14
JUL
14
APR
14
APR
13
JAN
13
JAN
14
OC
T 13
JUL
13
Platinum Gold Source: SNL
SAMININGVOLUMESJAN’10TODEC’15:CUMULATIVECHANGEY-O-Y=3,3%
80
90
100
110
105
95
85
JAN
15
JAN
11
JAN
10
JAN
14
JAN
13
JAN
12
DEC
15
115
Seasonally adjusted Trend cycle Source: Stats SA Base: 2010 = 100
31
CHIEF EXECUTIVE’S INNOVATION REPORT
AECI believes that its diversified products and services portfolio, its geographic footprint and ongoing innovation
to meet changing requirements will sustain its performance. The Group will continue to reshape and refocus its business model for the current operating environment, pursue additional acquisitions in support of its strategic growth pillars, and expand and leverage its international presence further so as to increase earnings generated in hard currencies. Opportunities for exports and import replacements will be rigorously pursued.
The careful management of working capital remains a focus, as commented on by the Chief Financial Officer, as does optimisation of the cost base.
InnOvatIOn is key if the Company is to remain at the forefront of adding value to its customers and R&D that enhances products and services, while preparing more effective alternatives for the future, will continue.
Collaboration between Group businesses is another focus area. The best current example of this is the mine-to-metal model
that brings together the expertise of AEL (blasting and explosives), Senmin (mining chemicals) and ImproChem (water treatment). As AECI Mining Solutions, this model offers mining customers a basket of products and expertise that can assist in addressing key issues facing the industry, name environmental accountability, water utilisation, power management and safety management. The combined offering of AEL and Senmin is available in Africa, Australia, Brazil, Chile and Indonesia while ImproChem is General Electric’s (“GE”) Chemical and Monitoring Solutions Partner in sub-Saharan Africa. The mine-to-metal wheel and associated value propositions are presented on the facing page.
Similar initiatives will be developed in the Group’s other strategic pillars. Other cost-saving Group collaboration projects are well advanced, particularly in the areas of transport and logistics.
ACKNOWLEDGEMENTSMy thanks go to the Board, the Group’s management teams and all of our employees for their unwavering commitment, energy, passion and perseverance. Without your efforts it would not have been possible to deliver improved results notwithstanding serious challenges. I would also like to thank the Group’s business partners, customers, suppliers and other stakeholders for their ongoing support.
Tak Hiemstra resigned from the Board in October and I acknowledge his contribution to the affairs of the Board and the Company. Graham Dempster and Khotso Mokhele joined the Board as Non-executive Directors on 31 January and 1 March, respectively. I look forward to working with them.
Mark Dytor Chief Executive
Woodmead 11 April 2016
ImproChem’s footprint was boosted by the acquisition of Clariant Southern Africa’s water treatment business in Africa, in 2014, and ImproChem is now a leader in its field on the continent. Further information on some of its BOLD and InnOvatIvE products and services are discussed on page 45.
Portfolio management remains key to maintaining the most competitive cost base possible, and maximising efficiencies.
In line with this, the restructuring of Akulu Marchon was completed in 2015. The white oils activities were integrated with Industrial Oleochemical Products and the personal care portfolio was divisionalised into ChemSystems. Resinkem, formerly a standalone entity, also moved to ChemSystems.
VALUESAll that AECI is and aspires to become is underpinned by its values, which are the essence of its character, culture and
behaviour. These BIGGER values were revisited and relaunched in 2015. The “R” in BIGGER commits the Group and all its employees to being REspOnsIBLE and embodies the “zero harm” principle. This principle must be put into practice internally, first and foremost. In this context, and as already commented on by the Chairman on page 26, the two fatalities that occurred in the year were tragic and overshadowed the Group’s otherwise best-ever safety performance. Harm to people at or during work is unacceptable to the Board and to management. Inadequate operational discipline was a factor in one of the two fatalities. More stringent auditing and reporting regimes are being developed to assist in re-emphasising the importance of adherence to established standards and practices.
Also disappointing in terms of the REspOnsIBLE and GOInG GREEn values was the search and seizure operation executed at AEL Modderfontein, on 14 December 2015, by the Department of Environmental Affairs (“DEA”), jointly with the City of Johannesburg. Management is cooperating with the DEA and has submitted a response to its allegations, relating to AEL’s compliance with certain conditions of this company’s emissions licence. Feedback from the DEA’s process is awaited.
In terms of being EnGaGED, further progress was made in finalising and implementing the Groups new Performance
Management system and investment in the Group’s leaders of the future continued. More information on these initiatives, and others in the Human Capital field, can be found elsewhere in this integrated report. The overall objective is to ensure that AECI remains well positioned to push its performance “above and beyond,” with people of the right calibre and skills pursuing the Group’s values of being BOLD and InnOvatIvE.
Wage negotiations were concluded successfully in the year and without any industrial action notwithstanding
the uncertain environment owing to subdued economic conditions. It was pleasing that the parties involved continued to display professionalism and maturity in engagements, to the benefit of all concerned.
OUTLOOK AND OBJECTIVESIndications are that conditions in the global and local economic environments will remain difficult, with no significant improvement expected in the short to medium term. In Southern Africa, the effects of drought conditions are an additional concern. Locally, the weak and volatile rand exchange rate presents challenges but also opportunities.
32
CHIEF EXECUTIVE’S INNOVATION REPORT
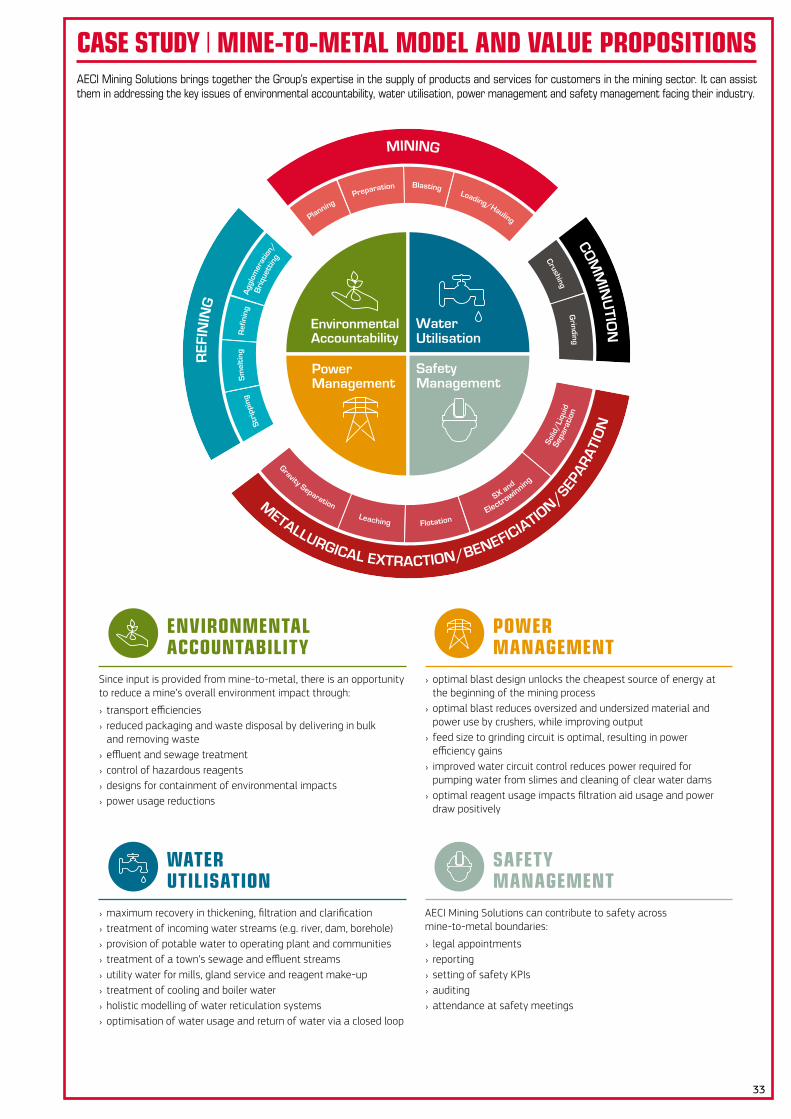
CASE STUDY | MINE-TO-METAL MODEL AND VALUE PROPOSITIONS
ENVIRONMENTAL ACCOUNTABILITY
Since input is provided from mine-to-metal, there is an opportunity to reduce a mine’s overall environment impact through:
› transport efficiencies › reduced packaging and waste disposal by delivering in bulk and removing waste
› effluent and sewage treatment › control of hazardous reagents › designs for containment of environmental impacts › power usage reductions
WATER UTILISATION
› maximum recovery in thickening, filtration and clarification › treatment of incoming water streams (e.g. river, dam, borehole) › provision of potable water to operating plant and communities › treatment of a town’s sewage and effluent streams › utility water for mills, gland service and reagent make-up › treatment of cooling and boiler water › holistic modelling of water reticulation systems › optimisation of water usage and return of water via a closed loop
POWER MANAGEMENT
› optimal blast design unlocks the cheapest source of energy at the beginning of the mining process
› optimal blast reduces oversized and undersized material and power use by crushers, while improving output
› feed size to grinding circuit is optimal, resulting in power efficiency gains
› improved water circuit control reduces power required for pumping water from slimes and cleaning of clear water dams
› optimal reagent usage impacts filtration aid usage and power draw positively
SAFETY MANAGEMENT
AECI Mining Solutions can contribute to safety across mine-to-metal boundaries:
› legal appointments › reporting › setting of safety KPIs › auditing › attendance at safety meetings
METALLURGICAL EXTRACTION/BENEFICIATIO
N/SEPAR
ATI
ON
SX and
Electrowinning
Flotation
Bri
quet
ting
Agg
lom
erat
ion/
Ref
inin
g
COMM
INU
TION
REF
ININ
G
MINING
PlanningPreparation Blasting
Loading/Hauling
CrushingG
rinding
Leaching
Solid
/Liq
uid
Sepa
rati
on
Stri
ppin
gS
mel
ting
Gravity Separation
Environmental Accountability
Power Management
Safety Management
Water Utilisation
AECIMiningSolutionsbringstogethertheGroup’sexpertiseinthesupplyofproductsandservicesforcustomersintheminingsector.Itcanassisttheminaddressingthekeyissuesofenvironmentalaccountability,waterutilisation,powermanagementandsafetymanagementfacingtheirindustry.
33
SHARE REPURCHASE OF R563m
SPECIAL DIVIDEND OF R430m PAID
HEPS +6% TO 894c
DIVIDENDS DECLARED OF 385c PER ORDINARY SHARE +13,2%
GEARING CONTROLLED TO 13%
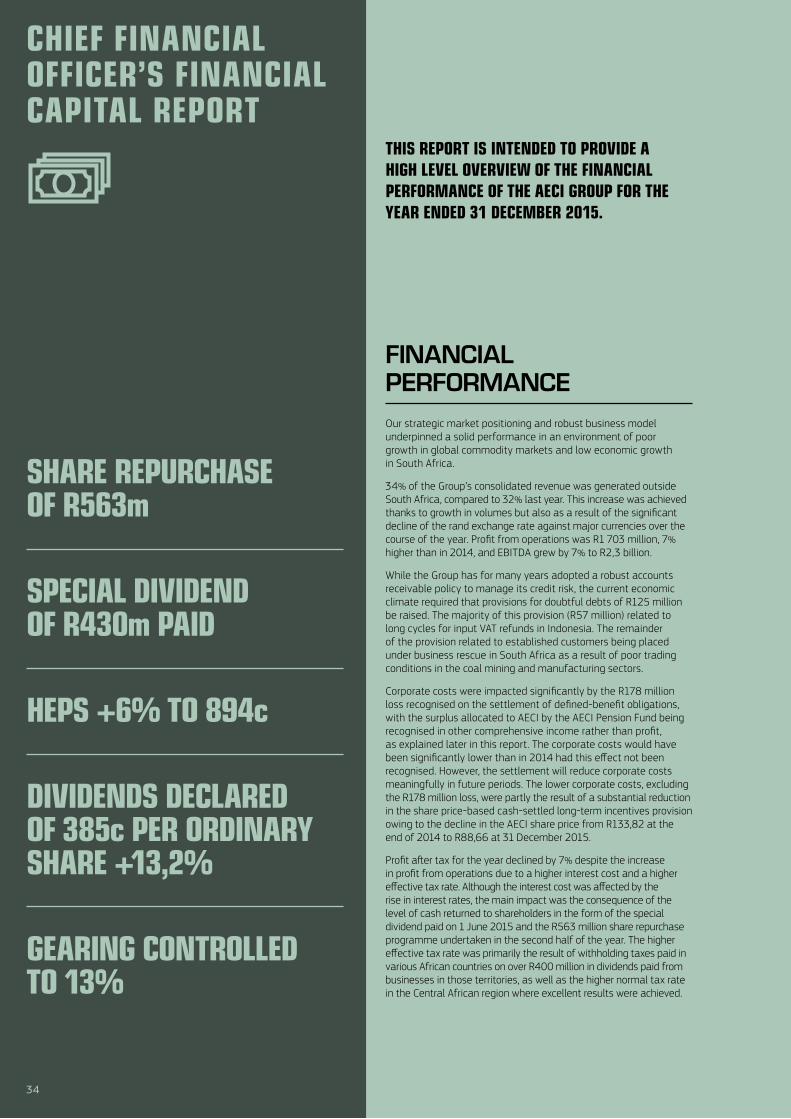
THIS REPORT IS INTENDED TO PROVIDE A HIGH LEVEL OVERVIEW OF THE FINANCIAL PERFORMANCE OF THE AECI GROUP FOR THE YEAR ENDED 31 DECEMBER 2015.
FINANCIAL PERFORMANCEOur strategic market positioning and robust business model underpinned a solid performance in an environment of poor growth in global commodity markets and low economic growth in South Africa.
34% of the Group’s consolidated revenue was generated outside South Africa, compared to 32% last year. This increase was achieved thanks to growth in volumes but also as a result of the significant decline of the rand exchange rate against major currencies over the course of the year. Profit from operations was R1 703 million, 7% higher than in 2014, and EBITDA grew by 7% to R2,3 billion.
While the Group has for many years adopted a robust accounts receivable policy to manage its credit risk, the current economic climate required that provisions for doubtful debts of R125 million be raised. The majority of this provision (R57 million) related to long cycles for input VAT refunds in Indonesia. The remainder of the provision related to established customers being placed under business rescue in South Africa as a result of poor trading conditions in the coal mining and manufacturing sectors.
Corporate costs were impacted significantly by the R178 million loss recognised on the settlement of defined-benefit obligations, with the surplus allocated to AECI by the AECI Pension Fund being recognised in other comprehensive income rather than profit, as explained later in this report. The corporate costs would have been significantly lower than in 2014 had this effect not been recognised. However, the settlement will reduce corporate costs meaningfully in future periods. The lower corporate costs, excluding the R178 million loss, were partly the result of a substantial reduction in the share price-based cash-settled long-term incentives provision owing to the decline in the AECI share price from R133,82 at the end of 2014 to R88,66 at 31 December 2015.
Profit after tax for the year declined by 7% despite the increase in profit from operations due to a higher interest cost and a higher effective tax rate. Although the interest cost was affected by the rise in interest rates, the main impact was the consequence of the level of cash returned to shareholders in the form of the special dividend paid on 1 June 2015 and the R563 million share repurchase programme undertaken in the second half of the year. The higher effective tax rate was primarily the result of withholding taxes paid in various African countries on over R400 million in dividends paid from businesses in those territories, as well as the higher normal tax rate in the Central African region where excellent results were achieved.
34
CHIEF FINANCIAL OFFICER’S FINANCIAL CAPITAL REPORT

MARK KATHANCHIEF FINANCIAL OFFICER
35
CHIEF FINANCIAL OFFICER’S FINANCIAL
CAPITAL REPORT
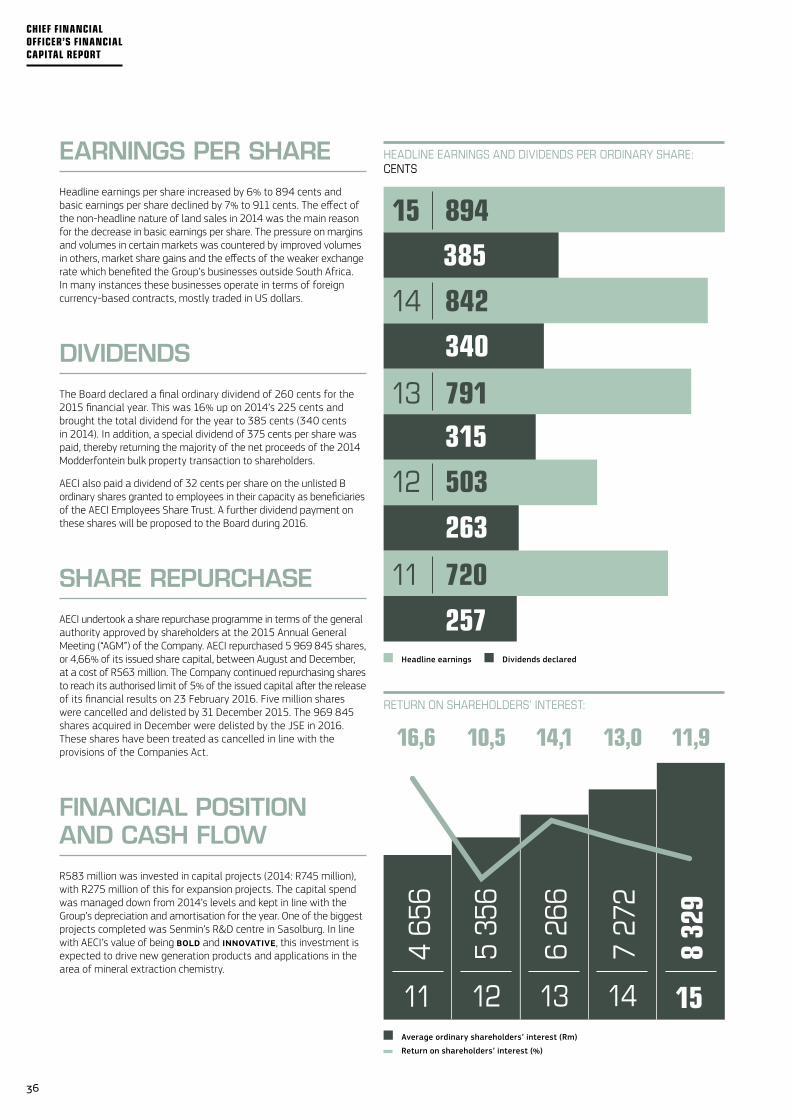
EARNINGS PER SHARE Headline earnings per share increased by 6% to 894 cents and basic earnings per share declined by 7% to 911 cents. The effect of the non-headline nature of land sales in 2014 was the main reason for the decrease in basic earnings per share. The pressure on margins and volumes in certain markets was countered by improved volumes in others, market share gains and the effects of the weaker exchange rate which benefited the Group’s businesses outside South Africa. In many instances these businesses operate in terms of foreign currency-based contracts, mostly traded in US dollars.
DIVIDENDSThe Board declared a final ordinary dividend of 260 cents for the 2015 financial year. This was 16% up on 2014’s 225 cents and brought the total dividend for the year to 385 cents (340 cents in 2014). In addition, a special dividend of 375 cents per share was paid, thereby returning the majority of the net proceeds of the 2014 Modderfontein bulk property transaction to shareholders.
AECI also paid a dividend of 32 cents per share on the unlisted B ordinary shares granted to employees in their capacity as beneficiaries of the AECI Employees Share Trust. A further dividend payment on these shares will be proposed to the Board during 2016.
SHARE REPURCHASEAECI undertook a share repurchase programme in terms of the general authority approved by shareholders at the 2015 Annual General Meeting (“AGM”) of the Company. AECI repurchased 5 969 845 shares, or 4,66% of its issued share capital, between August and December, at a cost of R563 million. The Company continued repurchasing shares to reach its authorised limit of 5% of the issued capital after the release of its financial results on 23 February 2016. Five million shares were cancelled and delisted by 31 December 2015. The 969 845 shares acquired in December were delisted by the JSE in 2016. These shares have been treated as cancelled in line with the provisions of the Companies Act.
FINANCIAL POSITION AND CASH FLOWR583 million was invested in capital projects (2014: R745 million), with R275 million of this for expansion projects. The capital spend was managed down from 2014’s levels and kept in line with the Group’s depreciation and amortisation for the year. One of the biggest projects completed was Senmin’s R&D centre in Sasolburg. In line with AECI’s value of being BOLD and InnOvatIvE, this investment is expected to drive new generation products and applications in the area of mineral extraction chemistry.
15 894
385
14 842
340
13 791315
12 503
263
11 720
257
11,913,014,110,516,6
15
8 32
9
14
7 27
2
13
6 26
6
1211
4 65
6
5 35
6
HEADLINEEARNINGSANDDIVIDENDSPERORDINARYSHARE:CENTS
RETURNONSHAREHOLDERS’INTEREST:
Headline earnings Dividends declared
Average ordinary shareholders’ interest (Rm)
Return on shareholders’ interest (%)
36
CHIEF FINANCIAL OFFICER’S FINANCIAL CAPITAL REPORT
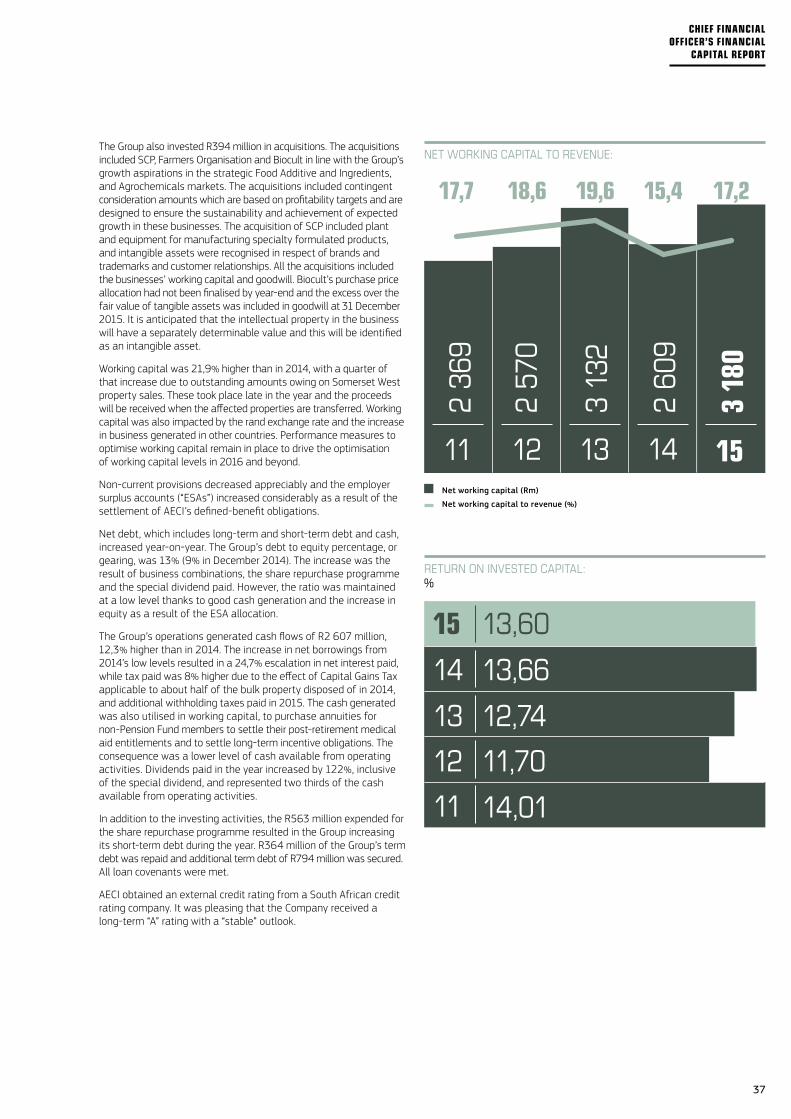
The Group also invested R394 million in acquisitions. The acquisitions included SCP, Farmers Organisation and Biocult in line with the Group’s growth aspirations in the strategic Food Additive and Ingredients, and Agrochemicals markets. The acquisitions included contingent consideration amounts which are based on profitability targets and are designed to ensure the sustainability and achievement of expected growth in these businesses. The acquisition of SCP included plant and equipment for manufacturing specialty formulated products, and intangible assets were recognised in respect of brands and trademarks and customer relationships. All the acquisitions included the businesses’ working capital and goodwill. Biocult’s purchase price allocation had not been finalised by year-end and the excess over the fair value of tangible assets was included in goodwill at 31 December 2015. It is anticipated that the intellectual property in the business will have a separately determinable value and this will be identified as an intangible asset.
Working capital was 21,9% higher than in 2014, with a quarter of that increase due to outstanding amounts owing on Somerset West property sales. These took place late in the year and the proceeds will be received when the affected properties are transferred. Working capital was also impacted by the rand exchange rate and the increase in business generated in other countries. Performance measures to optimise working capital remain in place to drive the optimisation of working capital levels in 2016 and beyond.
Non-current provisions decreased appreciably and the employer surplus accounts (“ESAs”) increased considerably as a result of the settlement of AECI’s defined-benefit obligations.
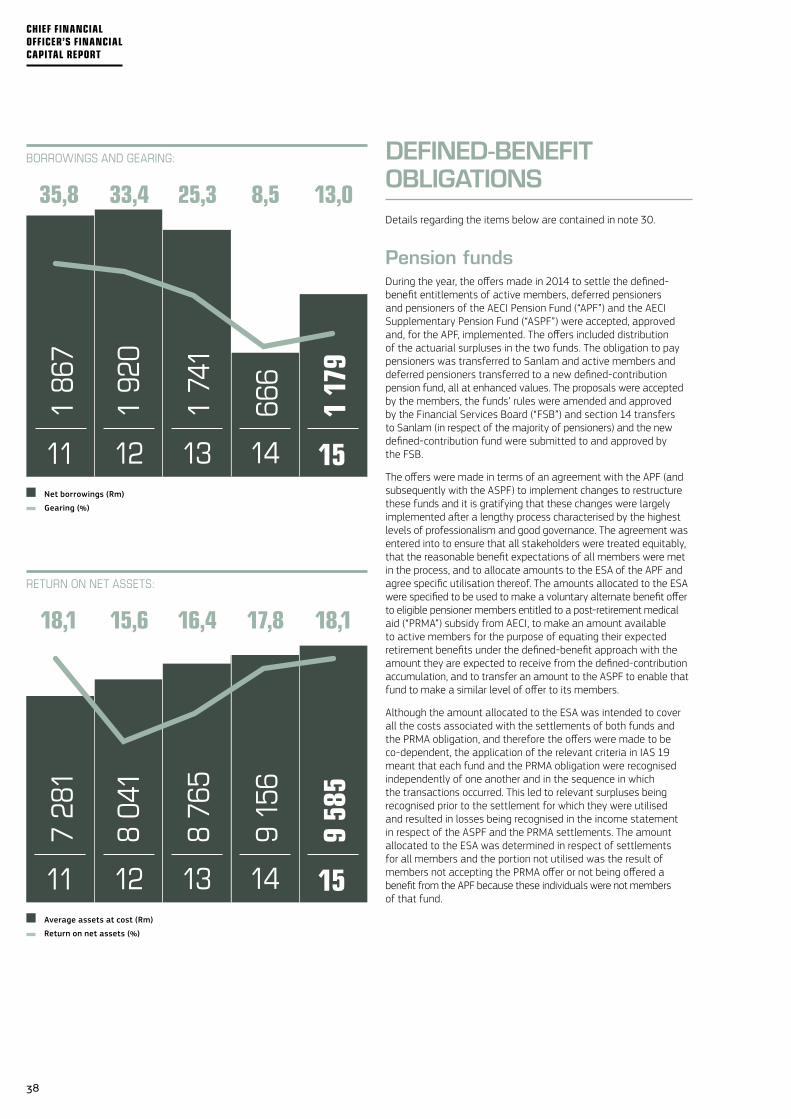
Net debt, which includes long-term and short-term debt and cash, increased year-on-year. The Group’s debt to equity percentage, or gearing, was 13% (9% in December 2014). The increase was the result of business combinations, the share repurchase programme and the special dividend paid. However, the ratio was maintained at a low level thanks to good cash generation and the increase in equity as a result of the ESA allocation.
The Group’s operations generated cash flows of R2 607 million, 12,3% higher than in 2014. The increase in net borrowings from 2014’s low levels resulted in a 24,7% escalation in net interest paid, while tax paid was 8% higher due to the effect of Capital Gains Tax applicable to about half of the bulk property disposed of in 2014, and additional withholding taxes paid in 2015. The cash generated was also utilised in working capital, to purchase annuities for non-Pension Fund members to settle their post-retirement medical aid entitlements and to settle long-term incentive obligations. The consequence was a lower level of cash available from operating activities. Dividends paid in the year increased by 122%, inclusive of the special dividend, and represented two thirds of the cash available from operating activities.
In addition to the investing activities, the R563 million expended for the share repurchase programme resulted in the Group increasing its short-term debt during the year. R364 million of the Group’s term debt was repaid and additional term debt of R794 million was secured. All loan covenants were met.
AECI obtained an external credit rating from a South African credit rating company. It was pleasing that the Company received a long-term “A” rating with a “stable” outlook.
15
14 13,66
13,60
13 12,74
12 11,70
11 14,01
17,215,419,618,617,7
15
3 18
0
14
2 60
9
13
3 13
2
12
2 57
0
112
369
NETWORKINGCAPITALTOREVENUE:
RETURNONINVESTEDCAPITAL:%
Net working capital (Rm)
Net working capital to revenue (%)
37
CHIEF FINANCIAL OFFICER’S FINANCIAL
CAPITAL REPORT
DEFINED-BENEFIT OBLIGATIONSDetails regarding the items below are contained in note 30.
Pension fundsDuring the year, the offers made in 2014 to settle the defined-benefit entitlements of active members, deferred pensioners and pensioners of the AECI Pension Fund (“APF”) and the AECI Supplementary Pension Fund (“ASPF”) were accepted, approved and, for the APF, implemented. The offers included distribution of the actuarial surpluses in the two funds. The obligation to pay pensioners was transferred to Sanlam and active members and deferred pensioners transferred to a new defined-contribution pension fund, all at enhanced values. The proposals were accepted by the members, the funds’ rules were amended and approved by the Financial Services Board (“FSB”) and section 14 transfers to Sanlam (in respect of the majority of pensioners) and the new defined-contribution fund were submitted to and approved by the FSB.
The offers were made in terms of an agreement with the APF (and subsequently with the ASPF) to implement changes to restructure these funds and it is gratifying that these changes were largely implemented after a lengthy process characterised by the highest levels of professionalism and good governance. The agreement was entered into to ensure that all stakeholders were treated equitably, that the reasonable benefit expectations of all members were met in the process, and to allocate amounts to the ESA of the APF and agree specific utilisation thereof. The amounts allocated to the ESA were specified to be used to make a voluntary alternate benefit offer to eligible pensioner members entitled to a post-retirement medical aid (“PRMA”) subsidy from AECI, to make an amount available to active members for the purpose of equating their expected retirement benefits under the defined-benefit approach with the amount they are expected to receive from the defined-contribution accumulation, and to transfer an amount to the ASPF to enable that fund to make a similar level of offer to its members.
Although the amount allocated to the ESA was intended to cover all the costs associated with the settlements of both funds and the PRMA obligation, and therefore the offers were made to be co-dependent, the application of the relevant criteria in IAS 19 meant that each fund and the PRMA obligation were recognised independently of one another and in the sequence in which the transactions occurred. This led to relevant surpluses being recognised prior to the settlement for which they were utilised and resulted in losses being recognised in the income statement in respect of the ASPF and the PRMA settlements. The amount allocated to the ESA was determined in respect of settlements for all members and the portion not utilised was the result of members not accepting the PRMA offer or not being offered a benefit from the APF because these individuals were not members of that fund.
13,08,525,333,435,8
15
1 17
9
14
666
13
1 74
1
12
1 92
0
11
1 86
7
18,117,816,415,618,1
15
9 58
5
14
9 15
6
13
8 76
5
12
8 04
1
11
7 28
1
BORROWINGSANDGEARING:
RETURNONNETASSETS:
Net borrowings (Rm)
Gearing (%)
Average assets at cost (Rm)
Return on net assets (%)
38
CHIEF FINANCIAL OFFICER’S FINANCIAL CAPITAL REPORT
Owing to the timing of the approvals, the formal transfer of assets from the ASPF to the new AECI Defined Contribution Pension Fund only took place in March 2016. The transfer to Sanlam took place in December 2015. The settlement was recognised in full in 2015 as a result of the approval of the transfers having been granted in the year. All members were transferred in terms of these approvals and the ASPF has no remaining members.
Progress has been made in engagements with the Group’s remaining two defined-benefit funds with comparable proposals for active members, deferred pensioners and pensioners. It is expected that these processes will be completed in 2016.
PRMAIn September 2014, AECI made an offer to retired employees entitled to a post-retirement medical aid subsidy to replace this subsidy with an annuity, subject to the regulatory approval of the defined-benefit pension transactions due to the intention that the ESA in the APF be utilised to effect the offer. The annuities, purchased from Momentum, were at an amount equivalent to the current subsidy increased by 25% and guaranteed for life. Offers were made to over 3 000 pensioners with 65% of them accepting the alternative benefit offer. Those who did not accept the offer retain their current entitlement, with AECI paying the monthly subsidy to the medical aid scheme and retaining the liability.
The acceptance of the alternative benefit offer is treated as a settlement of AECI’s defined-benefit obligation. The excess of the cost of the settlement over the reduction in the liability resulted in a loss on settlement of R75 million being recognised in the income statement. The cost of the settlement included R653 million of assets transferred from the APF’s ESA to Momentum and a cash payment, also to Momentum, of R222 million relating to non-Fund participants. The settlement of the obligations will reduce the Group’s net defined-benefit cost significantly and will have a positive impact on the Company’s profit in the future.
AECI also made a voluntary alternative benefit offer to active employees entitled to a post-retirement medical aid subsidy, in December 2015. The offer comprises a lump sum contribution to the member’s pension/provident fund, funded from the ESA in the relevant fund. The offer required acceptance on or before 31 January 2016 and was made conditional on successful implementation prior to 1 March 2016 as a result of changes to tax legislation regarding retirement funding contributions taking effect on that date. There was uncertainty on the impact these changes would have on the offer. However, the offer could only be implemented after the approval of a section 15E transfer from the ESA of the APF to the two funds. Although approval was granted prior to 1 March 2016, notification of this was only received later in the month and the transfers could only be effected at that time. AECI is assessing the impact of the timing of the transfer, and the implications of the changes to the relevant tax laws, to determine whether the offer can still be implemented. See note 36.
The APF had an actuarial surplus as the fair value of its assets exceeded the present value of its defined-benefit obligations by a significant amount. The surplus was recognised as an asset by AECI only to the extent of amounts allocated to the ESA. As part of the restructuring of the APF it was agreed to distribute the actuarial surplus, in terms of section 15C of the Pension Funds Act, No. 43 of 2014 (“the Act”), and the surplus was allocated to members and the ESA on an equitable basis.
At the beginning of 2015 that surplus was in excess of R7,7 billion and it increased during the year. The surplus distributed to members on settlement (not all of it was distributed because some pensioner and deferred pensioner members remain) was about R5,9 billion while the ESA allocation was R1,6 billion. The determination was based on certain calculated liabilities and reserves at the conversion date, which were increased by strengthening the assumptions relating to future pension increases that could be granted. The surplus allocation was made using those strengthened solvency basis liabilities and included the full notional pensioner accumulation amount, full value for members’ additional voluntary contributions, transfers from other funds and prior surplus distributions. Assets were set aside in a reserve for data issues and other contingencies. This amount was deducted from the assets available to determine the residual surplus which was then allocated to members and AECI in proportion to the contribution rates used to determine cash contributions made to the APF (7,5% and 9,0%, respectively).
The effect of this allocation of residual surplus was that members received an enhancement over and above the strengthened solvency basis liabilities, amounting to a 31% increase in this value. The assets set aside for pensioner members enabled Sanlam to offer these members a 37% increase in their monthly pension, which has guaranteed inflation-linked annual increases. Pensioner members were offered an actuarial-equivalent alternative of a cash bonus and a lower initial increase (35%).
At year-end, there were 68 pensioners and 65 deferred pensioners who had not yet been transferred and further applications to transfer 19 pensioners and 42 deferred pensioners were submitted in March 2016. Given that the settlement of approximately 3 500 pensioners and 1 300 active members was approved and implemented, it is not expected that the outstanding transfers will be declined.
The process for the ASPF was similar in all respects except that the surplus in that fund was not sufficient to offer the same enhancement to members. AECI agreed to fund the matching allocations made by the APF as the members of the ASPF were all members of the APF. AECI would achieve this by transferring the additional amount necessary to match the enhancement percentage from its ESA in the APF. In preparation for this, R70 million was transferred in 2014 and any additional amount required would be transferred as and when needed. The ESA balance would then be utilised to enhance members’ benefits in the ASPF, as permitted by the Act. As a result of AECI using its recognised asset to settle the benefit obligations of this fund, a loss on settlement was recognised in the income statement. This loss amounted to R103 million, being the fair value of the ESA at 4 December 2015.
39
CHIEF FINANCIAL OFFICER’S FINANCIAL
CAPITAL REPORT
A transaction was entered into in June, for R94 million, with a third party intermediary to enable the Company to settle its future obligation for this particular vesting, in terms of the LTIP rules. On 22 November the shares were made available by this intermediary to participating employees, in settlement of their entitlements.
AECI deducted and paid over appropriate amounts of tax (PAYE) in respect of these transactions. The share-based payment expense in respect of the performance shares is recognised from the grant date to the vesting date in accordance with IFRS 2 — Share-based Payments, and the vesting will not result in any further expense being recognised, with the cost of the shares purchased on the market being recognised against the IFRS 2 reserve created over the vesting period. Further details on the performance shares are described in the Remuneration report commencing on page 88 and in note 30.
FINANCIAL RISK MANAGEMENTDuring the year the Group established a Tax Risk Management Committee, tasked with overseeing the management of potential tax risks pertaining to all the geographies in which the Group operates. The Committee’s main objective is to provide financial personnel with the correct skills to enable them to adhere to best practice in their environments. Also key is developing sustainable relationships with tax authorities in all countries of operation.
The Group has been expanding its activities outside South Africa’s borders over a number of years. Another value-adding initiative in support of this has been the formation of a Foreign Investment Committee to assist the Group in planning successful entries into new countries, as well as guiding optimal governance practices in foreign operations that are already established. The focus areas for this Committee are funding, branding, corporate structures, tax and regulatory compliance as well as accounting systems infrastructure.
In 2015, AEL initiated a project to implement a financial shared service centre across all countries in which it operates. This initiative will improve transaction efficiency, cash management and the overall internal control environment. It is anticipated that the project will be completed in the second half of 2016.
PROPERTY TRANSACTIONSAnother bulk property sale was completed, this time at Somerset West. Land and certain other assets were sold to the City of Cape Town for a cash consideration of R400 million. All the necessary approvals were received in June 2015, with the cash being received by the Group on registration of the transfer in November. The remaining portions of Precinct 1 in Somerset West were sold in the latter part of the year and were also recognised in the 2015 results. The registration of the transfers and the receipt of the cash consideration for these properties will occur in 2016.
BUSINESS COMBINATIONS AND INVESTMENTSBusiness combinations in 2015 included SCP, Farmers Organisation, and Biocult. In addition, AECI acquired the remaining 50% shareholding in Resinkem which was moved to ChemSystems to enhance this business’ manufacturing capability and product offering. The Group also disposed if its petroleum jelly business and the related property, plant and equipment following the strategic reassessment of the Akulu Marchon business.
AECI identified impairment indicators in respect of its investment in BBRI, in Indonesia, due to the lower than expected sales of ammonium nitrate solution manufactured by this plant. Volumes were negatively affected as a consequence of the low thermal coal price which saw several smaller mines closing as demand in the region contracted. The impairment testing was performed in June 2015 and an impairment of US$4,2 million was recognised as a result. AECI has plans to address the volume decline and has begun implementing these. Although there was an improvement in volumes towards the end of 2015, growth was not yet sufficient to justify a reversal of the impairment recognised.
PERFORMANCE SHARESIn 2015, the first performance shares allocated in terms of the 2012 Long-term Incentive Plan (“LTIP”) vested. The number of shares that vested was determined based on AECI’s comparative total shareholder return (“TSR”) in relation to a peer group of companies, measured from 1 June 2012 to 1 June 2015. AECI achieved fifth position in the comparator Group, resulting in the allocated shares being multiplied by a factor of 2,6. The performance shares vested on 22 November 2015 for all eligible Executives and Senior Managers in the Group.
40
CHIEF FINANCIAL OFFICER’S FINANCIAL CAPITAL REPORT
CONCLUSIONWe are pleased with what we achieved in such a challenging environment. The Group’s financial position was strengthened further, it was de-risked considerably and the Company was able to return R1,4 billion to shareholders while continuing to pursue growth.
The coming year is expected to be equally difficult. Nonetheless, we are positive about our prospects. Our ability to innovate, the excellence of our people, our culture and our strategy will enable us to continue to deliver good performances in future.
ACKNOWLEDGEMENTSI would like to express my thanks to the Audit Committee, the Group’s Reporting, Tax, Governance, Legal, Internal Audit, IT, Treasury, Investor Relations and Retirement Funds teams in all the businesses and countries in which we operate. Their diligence and professional oversight of the Group’s finances, internal control and related matters is appreciated by me, my Executive Committee colleagues and the Board.
Mark Kathan Chief Financial Officer
Woodmead, Sandton 11 April 2016
41
CHIEF FINANCIAL OFFICER’S FINANCIAL
CAPITAL REPORT
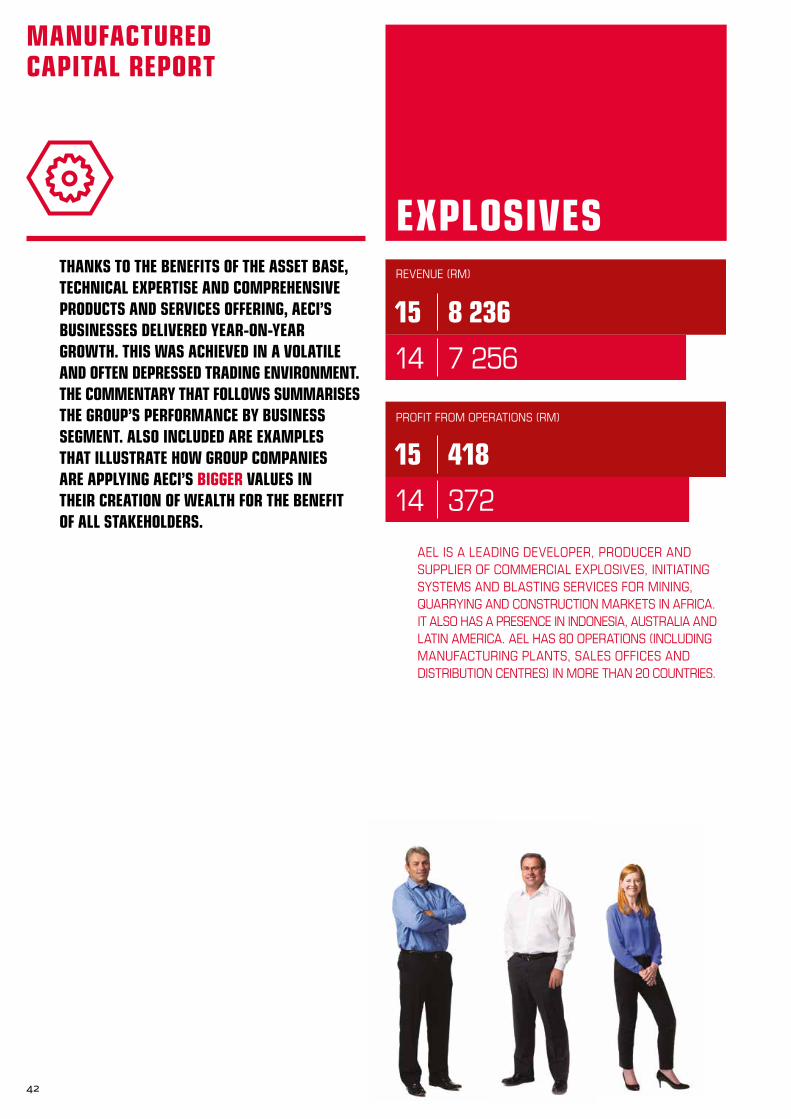
THANKS TO THE BENEFITS OF THE ASSET BASE, TECHNICAL EXPERTISE AND COMPREHENSIVE PRODUCTS AND SERVICES OFFERING, AECI’S BUSINESSES DELIVERED YEAR-ON-YEAR GROWTH. THIS WAS ACHIEVED IN A VOLATILE AND OFTEN DEPRESSED TRADING ENVIRONMENT. THE COMMENTARY THAT FOLLOWS SUMMARISES THE GROUP’S PERFORMANCE BY BUSINESS SEGMENT. ALSO INCLUDED ARE EXAMPLES THAT ILLUSTRATE HOW GROUP COMPANIES ARE APPLYING AECI’S BIGGER VALUES IN THEIR CREATION OF WEALTH FOR THE BENEFIT OF ALL STAKEHOLDERS.
15 418
14 372
15 8 236
14 7 256
AEL IS A LEADING DEVELOPER, PRODUCER AND SUPPLIER OF COMMERCIAL EXPLOSIVES, INITIATING SYSTEMS AND BLASTING SERVICES FOR MINING, QUARRYING AND CONSTRUCTION MARKETS IN AFRICA. IT ALSO HAS A PRESENCE IN INDONESIA, AUSTRALIA AND LATIN AMERICA. AEL HAS 80 OPERATIONS (INCLUDING MANUFACTURING PLANTS, SALES OFFICES AND DISTRIBUTION CENTRES) IN MORE THAN 20 COUNTRIES.
EXPLOSIVES
PROFITFROMOPERATIONS(RM)
REVENUE(RM)
42
MANUFACTURED CAPITAL REPORT
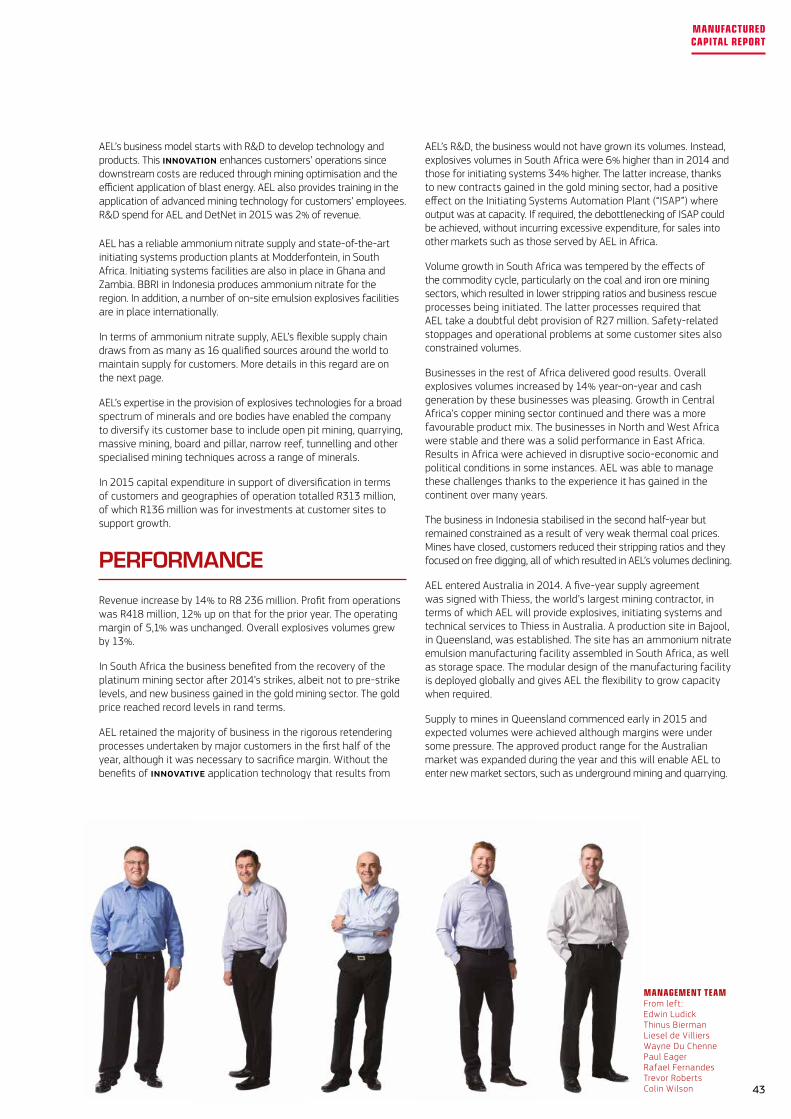
AEL’s business model starts with R&D to develop technology and products. This InnOvatIOn enhances customers’ operations since downstream costs are reduced through mining optimisation and the efficient application of blast energy. AEL also provides training in the application of advanced mining technology for customers’ employees. R&D spend for AEL and DetNet in 2015 was 2% of revenue.
AEL has a reliable ammonium nitrate supply and state-of-the-art initiating systems production plants at Modderfontein, in South Africa. Initiating systems facilities are also in place in Ghana and Zambia. BBRI in Indonesia produces ammonium nitrate for the region. In addition, a number of on-site emulsion explosives facilities are in place internationally.
In terms of ammonium nitrate supply, AEL’s flexible supply chain draws from as many as 16 qualified sources around the world to maintain supply for customers. More details in this regard are on the next page.
AEL’s expertise in the provision of explosives technologies for a broad spectrum of minerals and ore bodies have enabled the company to diversify its customer base to include open pit mining, quarrying, massive mining, board and pillar, narrow reef, tunnelling and other specialised mining techniques across a range of minerals.
In 2015 capital expenditure in support of diversification in terms of customers and geographies of operation totalled R313 million, of which R136 million was for investments at customer sites to support growth.
PERFORMANCE
Revenue increase by 14% to R8 236 million. Profit from operations was R418 million, 12% up on that for the prior year. The operating margin of 5,1% was unchanged. Overall explosives volumes grew by 13%.
In South Africa the business benefited from the recovery of the platinum mining sector after 2014’s strikes, albeit not to pre-strike levels, and new business gained in the gold mining sector. The gold price reached record levels in rand terms.
AEL retained the majority of business in the rigorous retendering processes undertaken by major customers in the first half of the year, although it was necessary to sacrifice margin. Without the benefits of InnOvatIvE application technology that results from
MANAGEMENT TEAM From left: Edwin Ludick Thinus Bierman Liesel de Villiers Wayne Du Chenne Paul Eager Rafael Fernandes Trevor Roberts Colin Wilson
AEL’s R&D, the business would not have grown its volumes. Instead, explosives volumes in South Africa were 6% higher than in 2014 and those for initiating systems 34% higher. The latter increase, thanks to new contracts gained in the gold mining sector, had a positive effect on the Initiating Systems Automation Plant (“ISAP”) where output was at capacity. If required, the debottlenecking of ISAP could be achieved, without incurring excessive expenditure, for sales into other markets such as those served by AEL in Africa.
Volume growth in South Africa was tempered by the effects of the commodity cycle, particularly on the coal and iron ore mining sectors, which resulted in lower stripping ratios and business rescue processes being initiated. The latter processes required that AEL take a doubtful debt provision of R27 million. Safety-related stoppages and operational problems at some customer sites also constrained volumes.
Businesses in the rest of Africa delivered good results. Overall explosives volumes increased by 14% year-on-year and cash generation by these businesses was pleasing. Growth in Central Africa’s copper mining sector continued and there was a more favourable product mix. The businesses in North and West Africa were stable and there was a solid performance in East Africa. Results in Africa were achieved in disruptive socio-economic and political conditions in some instances. AEL was able to manage these challenges thanks to the experience it has gained in the continent over many years.
The business in Indonesia stabilised in the second half-year but remained constrained as a result of very weak thermal coal prices. Mines have closed, customers reduced their stripping ratios and they focused on free digging, all of which resulted in AEL’s volumes declining.
AEL entered Australia in 2014. A five-year supply agreement was signed with Thiess, the world’s largest mining contractor, in terms of which AEL will provide explosives, initiating systems and technical services to Thiess in Australia. A production site in Bajool, in Queensland, was established. The site has an ammonium nitrate emulsion manufacturing facility assembled in South Africa, as well as storage space. The modular design of the manufacturing facility is deployed globally and gives AEL the flexibility to grow capacity when required.
Supply to mines in Queensland commenced early in 2015 and expected volumes were achieved although margins were under some pressure. The approved product range for the Australian market was expanded during the year and this will enable AEL to enter new market sectors, such as underground mining and quarrying.
43
MANUFACTURED CAPITAL REPORT
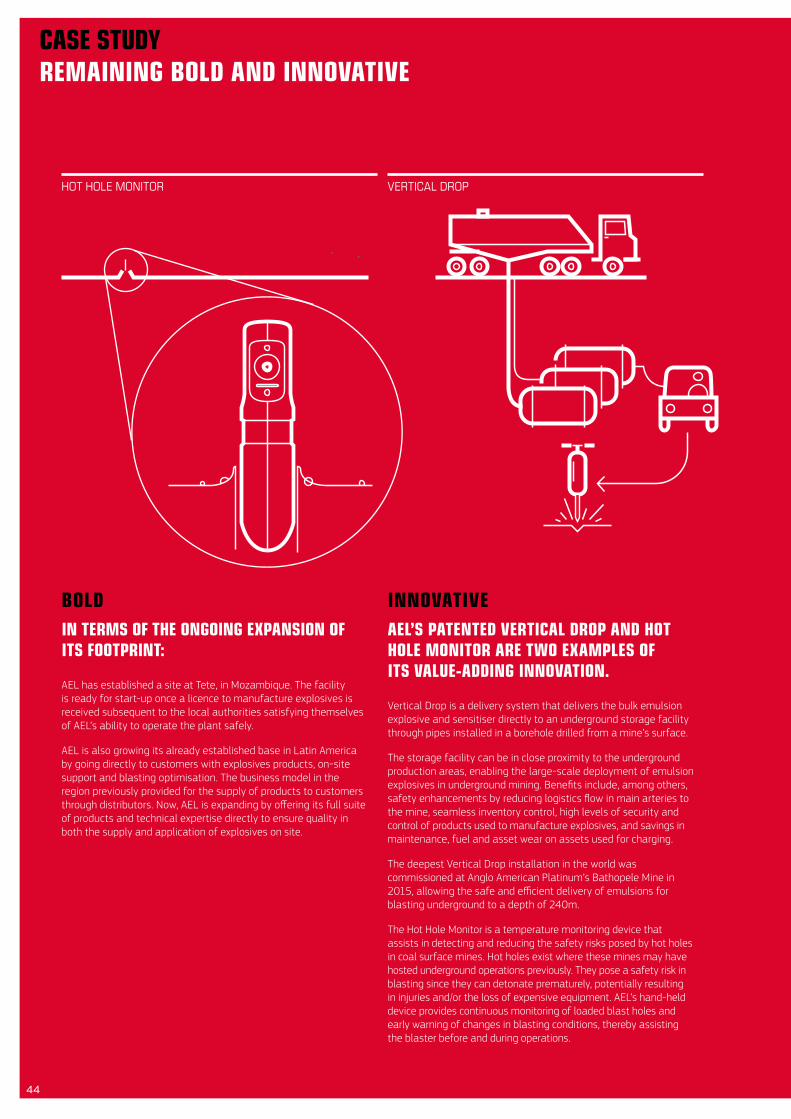
CASE STUDY REMAINING BOLD AND INNOVATIVE
BOLDIN TERMS OF THE ONGOING EXPANSION OF ITS FOOTPRINT:
AEL has established a site at Tete, in Mozambique. The facility is ready for start-up once a licence to manufacture explosives is received subsequent to the local authorities satisfying themselves of AEL’s ability to operate the plant safely.
AEL is also growing its already established base in Latin America by going directly to customers with explosives products, on-site support and blasting optimisation. The business model in the region previously provided for the supply of products to customers through distributors. Now, AEL is expanding by offering its full suite of products and technical expertise directly to ensure quality in both the supply and application of explosives on site.
INNOVATIVEAEL’S PATENTED VERTICAL DROP AND HOT HOLE MONITOR ARE TWO EXAMPLES OF ITS VALUE-ADDING INNOVATION.
Vertical Drop is a delivery system that delivers the bulk emulsion explosive and sensitiser directly to an underground storage facility through pipes installed in a borehole drilled from a mine’s surface.
The storage facility can be in close proximity to the underground production areas, enabling the large-scale deployment of emulsion explosives in underground mining. Benefits include, among others, safety enhancements by reducing logistics flow in main arteries to the mine, seamless inventory control, high levels of security and control of products used to manufacture explosives, and savings in maintenance, fuel and asset wear on assets used for charging.
The deepest Vertical Drop installation in the world was commissioned at Anglo American Platinum’s Bathopele Mine in 2015, allowing the safe and efficient delivery of emulsions for blasting underground to a depth of 240m.
The Hot Hole Monitor is a temperature monitoring device that assists in detecting and reducing the safety risks posed by hot holes in coal surface mines. Hot holes exist where these mines may have hosted underground operations previously. They pose a safety risk in blasting since they can detonate prematurely, potentially resulting in injuries and/or the loss of expensive equipment. AEL’s hand-held device provides continuous monitoring of loaded blast holes and early warning of changes in blasting conditions, thereby assisting the blaster before and during operations.
HOTHOLEMONITOR VERTICALDROP
44
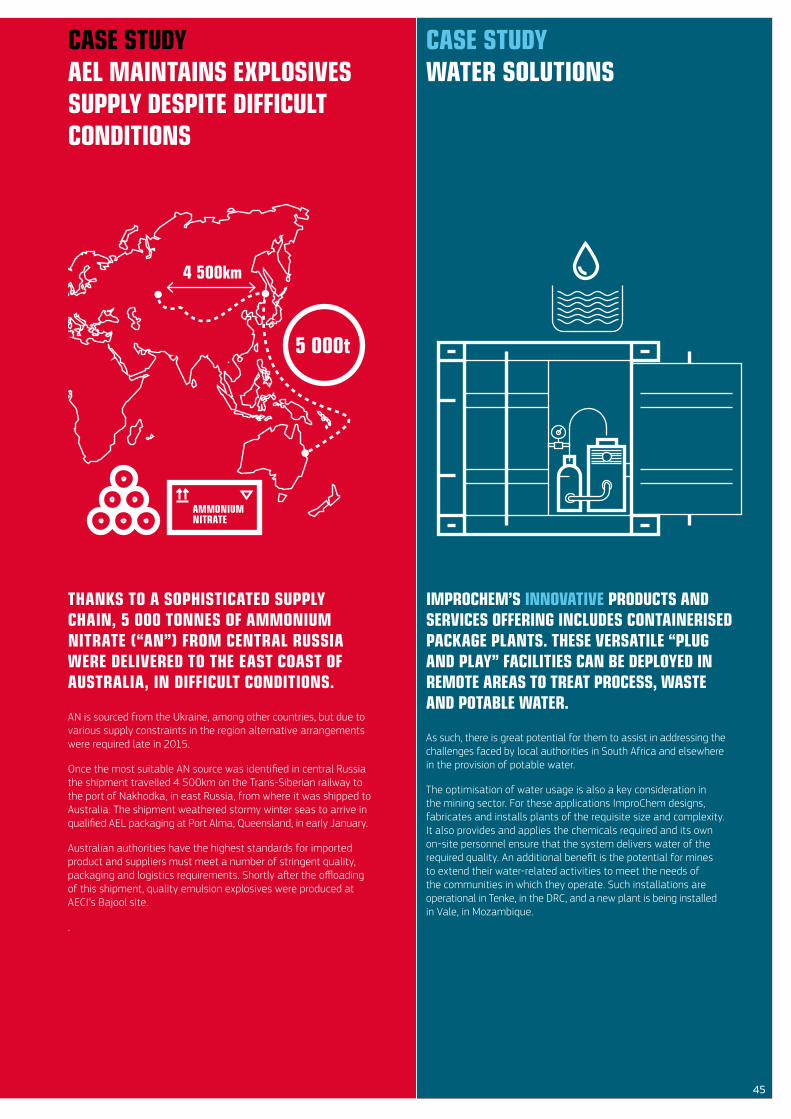
CASE STUDY WATER SOLUTIONS
IMPROCHEM’S INNOVATIVE PRODUCTS AND SERVICES OFFERING INCLUDES CONTAINERISED PACKAGE PLANTS. THESE VERSATILE “PLUG AND PLAY” FACILITIES CAN BE DEPLOYED IN REMOTE AREAS TO TREAT PROCESS, WASTE AND POTABLE WATER.
As such, there is great potential for them to assist in addressing the challenges faced by local authorities in South Africa and elsewhere in the provision of potable water.
The optimisation of water usage is also a key consideration in the mining sector. For these applications ImproChem designs, fabricates and installs plants of the requisite size and complexity. It also provides and applies the chemicals required and its own on-site personnel ensure that the system delivers water of the required quality. An additional benefit is the potential for mines to extend their water-related activities to meet the needs of the communities in which they operate. Such installations are operational in Tenke, in the DRC, and a new plant is being installed in Vale, in Mozambique.
THANKS TO A SOPHISTICATED SUPPLY CHAIN, 5 000 TONNES OF AMMONIUM NITRATE (“AN”) FROM CENTRAL RUSSIA WERE DELIVERED TO THE EAST COAST OF AUSTRALIA, IN DIFFICULT CONDITIONS.
AN is sourced from the Ukraine, among other countries, but due to various supply constraints in the region alternative arrangements were required late in 2015.
Once the most suitable AN source was identified in central Russia the shipment travelled 4 500km on the Trans-Siberian railway to the port of Nakhodka, in east Russia, from where it was shipped to Australia. The shipment weathered stormy winter seas to arrive in qualified AEL packaging at Port Alma, Queensland, in early January.
Australian authorities have the highest standards for imported product and suppliers must meet a number of stringent quality, packaging and logistics requirements. Shortly after the offloading of this shipment, quality emulsion explosives were produced at AECI’s Bajool site.
.
CASE STUDY AEL MAINTAINS EXPLOSIVES SUPPLY DESPITE DIFFICULT CONDITIONS
45
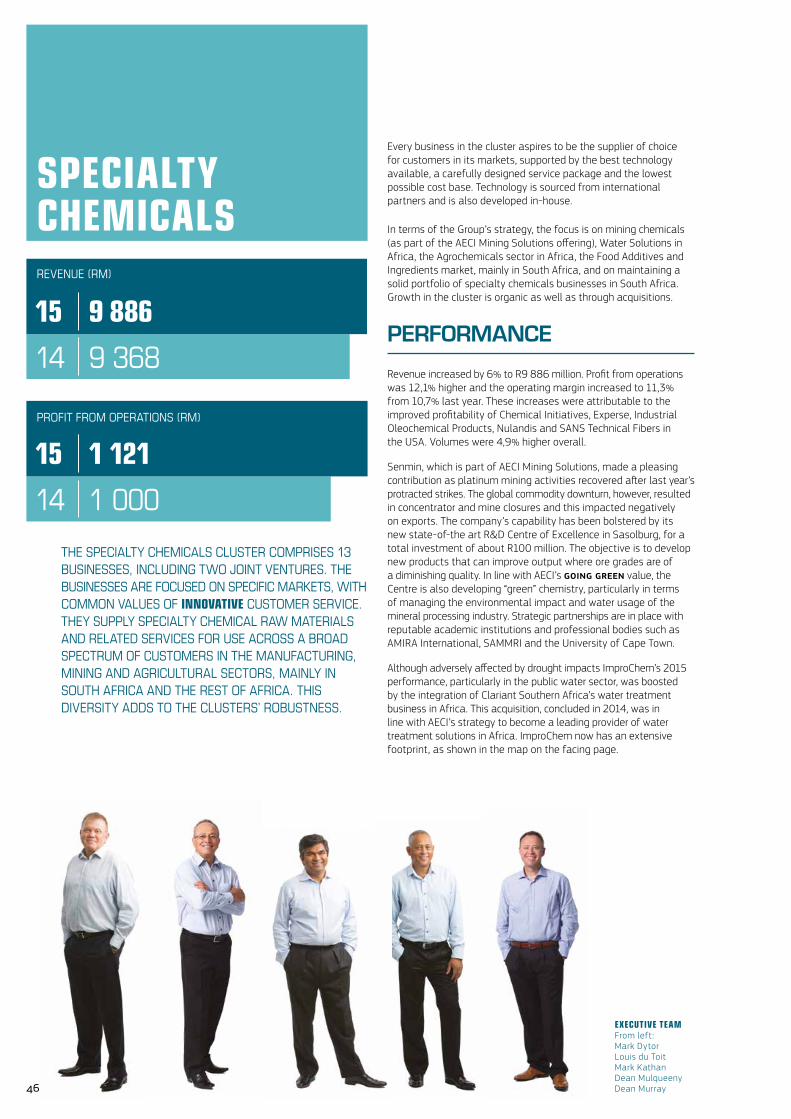
15 1 121
14 1 000
15 9 886
14 9 368
EXECUTIVE TEAM From left: Mark Dytor Louis du Toit Mark Kathan Dean Mulqueeny Dean Murray
Every business in the cluster aspires to be the supplier of choice for customers in its markets, supported by the best technology available, a carefully designed service package and the lowest possible cost base. Technology is sourced from international partners and is also developed in-house.
In terms of the Group’s strategy, the focus is on mining chemicals (as part of the AECI Mining Solutions offering), Water Solutions in Africa, the Agrochemicals sector in Africa, the Food Additives and Ingredients market, mainly in South Africa, and on maintaining a solid portfolio of specialty chemicals businesses in South Africa. Growth in the cluster is organic as well as through acquisitions.
PERFORMANCE
Revenue increased by 6% to R9 886 million. Profit from operations was 12,1% higher and the operating margin increased to 11,3% from 10,7% last year. These increases were attributable to the improved profitability of Chemical Initiatives, Experse, Industrial Oleochemical Products, Nulandis and SANS Technical Fibers in the USA. Volumes were 4,9% higher overall.
Senmin, which is part of AECI Mining Solutions, made a pleasing contribution as platinum mining activities recovered after last year’s protracted strikes. The global commodity downturn, however, resulted in concentrator and mine closures and this impacted negatively on exports. The company’s capability has been bolstered by its new state-of-the art R&D Centre of Excellence in Sasolburg, for a total investment of about R100 million. The objective is to develop new products that can improve output where ore grades are of a diminishing quality. In line with AECI’s GOInG GREEn value, the Centre is also developing “green” chemistry, particularly in terms of managing the environmental impact and water usage of the mineral processing industry. Strategic partnerships are in place with reputable academic institutions and professional bodies such as AMIRA International, SAMMRI and the University of Cape Town.
Although adversely affected by drought impacts ImproChem’s 2015 performance, particularly in the public water sector, was boosted by the integration of Clariant Southern Africa’s water treatment business in Africa. This acquisition, concluded in 2014, was in line with AECI’s strategy to become a leading provider of water treatment solutions in Africa. ImproChem now has an extensive footprint, as shown in the map on the facing page.
THE SPECIALTY CHEMICALS CLUSTER COMPRISES 13 BUSINESSES, INCLUDING TWO JOINT VENTURES. THE BUSINESSES ARE FOCUSED ON SPECIFIC MARKETS, WITH COMMON VALUES OF INNOVATIVE CUSTOMER SERVICE. THEY SUPPLY SPECIALTY CHEMICAL RAW MATERIALS AND RELATED SERVICES FOR USE ACROSS A BROAD SPECTRUM OF CUSTOMERS IN THE MANUFACTURING, MINING AND AGRICULTURAL SECTORS, MAINLY IN SOUTH AFRICA AND THE REST OF AFRICA. THIS DIVERSITY ADDS TO THE CLUSTERS’ ROBUSTNESS.
SPECIALTY CHEMICALS
PROFITFROMOPERATIONS(RM)
REVENUE(RM)
46
As GE’s technology partner in Africa ImproChem provides integrated solutions to customers in countries where water is often a scarce resource.
In Agrochemicals, Nulandis is leading the Group’s expansion and it delivered year-on-year growth notwithstanding the effects of the drought in the last quarter. Nulandis has a presence throughout South Africa and aspires to extend its business in the rest of Africa, where there is a need to optimise crop yields. The company’s footprint was enhanced through the acquisition of Farmers Organisation, in Malawi. Farmers Organisation had been Nulandis’ customer for 20 years. It is a distributor of agrochemicals, seeds and spraying equipment on behalf of multinational producers. It operates in the commercial estates market and revenue from the smallholder market segment is increasing. This provides Nulandis with a springboard into that market not only in Malawi but also in other countries in Southern and East Africa. In addition, the acquisition has presented Nulandis with further opportunities to expand sales of its in-house products through Farmers Organisation.
Also acquired and integrated with Nulandis was Biocult, a South African R&D-based company with strong intellectual property assets. Biocult develops and produces a range of soil-enhancing biological products. This is aligned with the Group’s GOInG GREEn value since it supports Nulandis’ more environmentally friendly, holistic plant health strategy.
In the Food Additives and Ingredients growth pillar, performance was enhanced by the results of Cape Town-based SCP acquired with effect from August 2015. SCP, which manufactures and distributes additives and ingredients for juice-based drinks and products, has enhanced the Group’s offering for the beverage industry, in particular. Its five-month contribution was ahead of expectations.
The other company in this pillar is Lake Foods. One of its three divisions is Afoodable, acquired in 2012, and this business’ state-of-the art facility in Cape Town became fully operational in May 2015. Afoodable’s range of branded products comprises 290 product lines of marinades and sauces, as well as base products, salad dressings and milkshake syrups. The business provides tailor-made solutions for local and export customers.
The new plant has increased Afoodable’s output capacity to 1 000 tonnes per month, enabling the business to partner with customers while offering a diverse range of improved products and services. As a major supplier to the catering and food manufacturing markets, Afoodable also manufactures and co-packs for large South African companies and retailers.
AECI will pursue further acquisitions to grow its Food Additives and Ingredients business, initially in South Africa and then in the rest of the continent. Although the effects of the current drought conditions are expected to lead to higher food prices, it is nonetheless forecast that growth rates in food consumption and soft drink volume sales will continue to outstrip GDP in the next few years.
IMPROCHEM’SFOOTPRINT FOODADDITIVESANDINGREDIENTSREVENUETARGETS(RM)EL
15 813 SCP 5 MONTHS
AFOODABLE
14 428
13 427
12 288
11 154
10 151
47
MANUFACTURED CAPITAL REPORT
15 527
14 490
15 922
14 871
ACACIA REAL ESTATE (“ACACIA”) MANAGES AECI’S PROPERTY ASSETS, NOW MAINLY LEASING SERVICES AS WELL AS THE PROVISION OF UTILITIES AND OTHER SERVICES. THE LATTER ACTIVITIES ARE LARGELY AT THE MULTI-USER UMBOGINTWINI INDUSTRIAL COMPLEX (“UIC”), SOUTH OF DURBAN. HERE ACACIA PROVIDES ITS MANUFACTURING CUSTOMERS WITH INTER ALIA THE CENTRALISED GENERATION AND DISTRIBUTION OF STEAM, SECURITY SERVICES, POTABLE WATER, ELECTRICITY, EFFLUENT HANDLING AND A COMPREHENSIVE RAIL NETWORK.
PROPERTY
PROFITFROMOPERATIONS(RM)
REVENUE(RM)
PERFORMANCE
The AECI Group and the City of Cape Town (“the City”) entered into an agreement in June in terms of which the City acquired 709 hectares of land, and certain buildings, of the total 734 hectares of land owned by the Group in Somerset West, for a cash consideration of R400 million. Excluded from the transaction with the City was Precinct 1, which is 25 hectares in extent. All remaining land in that Precinct had also been sold by year-end. The value realised at Somerset West is summarised on the facing page. Also in the year, the remaining transfers of land at Modderfontein to Shanghai Zendai Property Ltd (“Shanghai Zendai”) were concluded.
Revenue for the year was R922 million. Of this, R400 million related to the bulk sale at Somerset West, R154 million to further land sales at Somerset West and R368 million to the ongoing leasing and services businesses. Profit from operations was R527 million, including R394 million from Somerset West land sales and R48 million related to deferred profits in respect of the final transfers of land to Shanghai Zendai.
About 216 hectares of land surplus to operational requirements remain at Modderfontein, as indicated in the map on the facing page.
STRATEGY
Given that most of the Group’s surplus land and buildings have been sold, Acacia’s focus going forward will be on its leasing and services activities. Regarding the latter, AECI commissioned the preparation of a development master plan for the UIC to guide the optimal development at this site of available land parcels for industrial use. The intention is not to dispose of those land parcels but rather to make developments available on a long-term leasehold basis. Industrial development opportunities are in demand in the area and land rentals are attractive. Development of the site would also boost the services business.
The leasing portfolio showed pleasing resilience. At the UIC, in particular, vacancy rates remained at historical lows throughout the year, with very little space available. Demand for office space at Modderfontein was moderate.
EXECUTIVE TEAM From left: Neil Hayes Reg Bhikum Peshy Zwane48
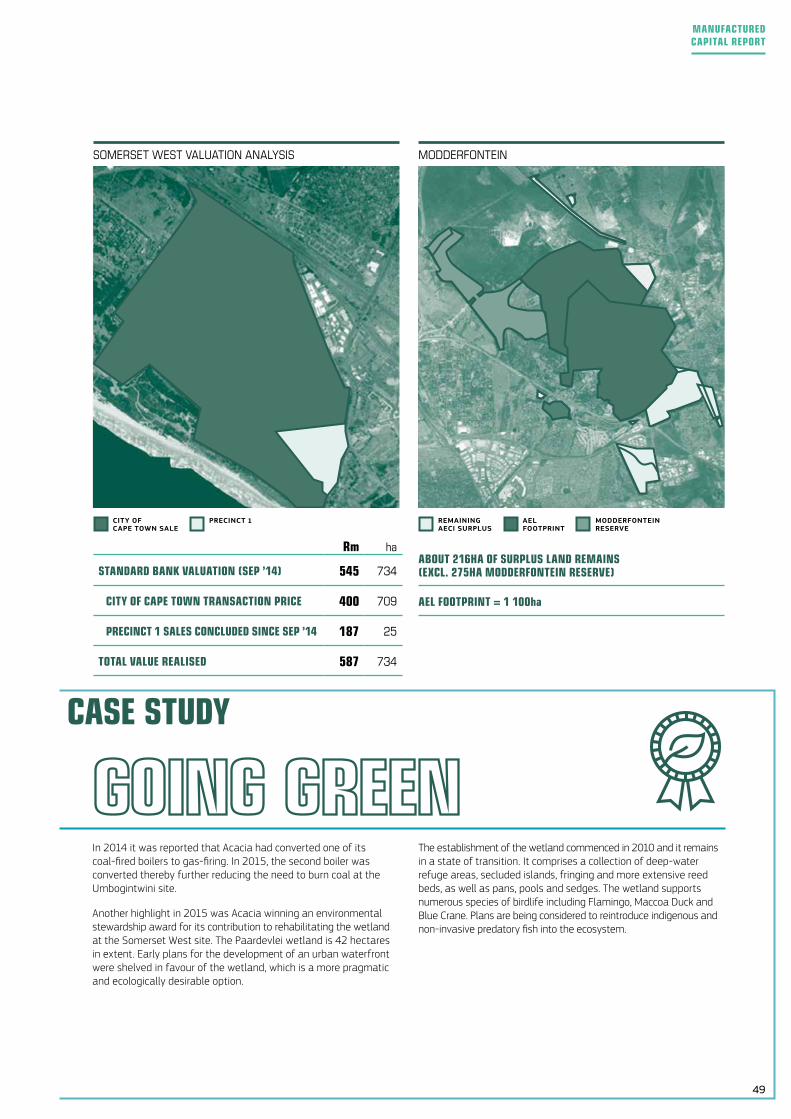
MODDERFONTEIN
In 2014 it was reported that Acacia had converted one of its coal-fired boilers to gas-firing. In 2015, the second boiler was converted thereby further reducing the need to burn coal at the Umbogintwini site.
Another highlight in 2015 was Acacia winning an environmental stewardship award for its contribution to rehabilitating the wetland at the Somerset West site. The Paardevlei wetland is 42 hectares in extent. Early plans for the development of an urban waterfront were shelved in favour of the wetland, which is a more pragmatic and ecologically desirable option.
CASE STUDY
ABOUT 216HA OF SURPLUS LAND REMAINS (EXCL. 275HA MODDERFONTEIN RESERVE)
AEL FOOTPRINT = 1 100ha
REmaInInG aEcI suRpLus
aEL fOOtpRInt
mODDERfOntEIn REsERvE
Rm ha
STANDARD BANK VALUATION (SEP ’14) 545 734
CITY OF CAPE TOWN TRANSACTION PRICE 400 709
PRECINCT 1 SALES CONCLUDED SINCE SEP ’14 187 25
TOTAL VALUE REALISED 587 734
The establishment of the wetland commenced in 2010 and it remains in a state of transition. It comprises a collection of deep-water refuge areas, secluded islands, fringing and more extensive reed beds, as well as pans, pools and sedges. The wetland supports numerous species of birdlife including Flamingo, Maccoa Duck and Blue Crane. Plans are being considered to reintroduce indigenous and non-invasive predatory fish into the ecosystem.
SOMERSETWESTVALUATIONANALYSIS
pREcInct 1cIty Of capE tOwn saLE
49
MANUFACTURED CAPITAL REPORT

STAKEHOLDER ENGAGEMENT 52
SOCIAL AND ETHICS COMMITTEE’S REPORT 56
HUMAN CAPITAL 58
INTELLECTUAL CAPITAL 63
SOCIAL AND RELATIONSHIP CAPITAL 65
A CULTURE OF ACCOUNTABILITY, HONESTY AND INCLUSIVITY IS ONLY ACHIEVABLE IF A COMMITTED APPROACH TO RESPECTFUL, OPEN ENGAGEMENT IS ADOPTED. AS A GROUP, WE EMBRACE DIVERSITY, FAIRNESS AND EQUALITY IN EVERYTHING WE DO. SUCH A CULTURE NOT ONLY DEFINES OUR RISK MANAGEMENT FRAMEWORK, BUT ALSO THE USE OF OUR RESOURCES. THIS, IN TURN, IMPACTS WHAT DECISIONS ARE MADE AND WHAT ACTIONS ARE TAKEN.
ENGAGEDWE TAKE OWNERSHIP OF OUR DECISIONS AND ACTIONS AND UNDERSTAND THEIR IMPACT ON OTHERS
WE ARE HONEST, OPEN AND RESPECTFUL IN ALL DEALINGS WITH OTHERS
WE EMBRACE DIVERSITY, FAIRNESS AND EQUALITY
BEING COMMITTED TO A CULTURE OF
ACCOUNTABILITY, HONESTY AND
INCLUSIVITY
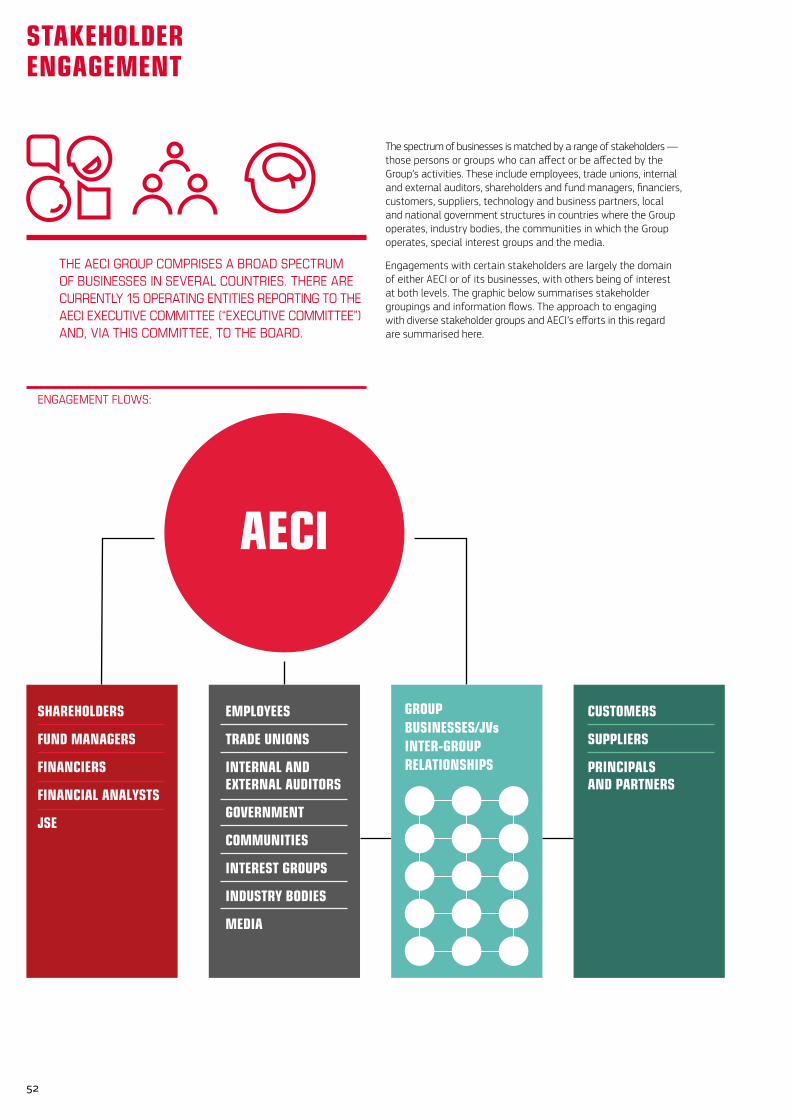
The spectrum of businesses is matched by a range of stakeholders — those persons or groups who can affect or be affected by the Group’s activities. These include employees, trade unions, internal and external auditors, shareholders and fund managers, financiers, customers, suppliers, technology and business partners, local and national government structures in countries where the Group operates, industry bodies, the communities in which the Group operates, special interest groups and the media.
Engagements with certain stakeholders are largely the domain of either AECI or of its businesses, with others being of interest at both levels. The graphic below summarises stakeholder groupings and information flows. The approach to engaging with diverse stakeholder groups and AECI’s efforts in this regard are summarised here.
THE AECI GROUP COMPRISES A BROAD SPECTRUM OF BUSINESSES IN SEVERAL COUNTRIES. THERE ARE CURRENTLY 15 OPERATING ENTITIES REPORTING TO THE AECI EXECUTIVE COMMITTEE (“EXECUTIVE COMMITTEE”) AND, VIA THIS COMMITTEE, TO THE BOARD.
CUSTOMERS
SUPPLIERS
PRINCIPALSAND PARTNERS
SHAREHOLDERS
FUND MANAGERS
FINANCIERS
FINANCIAL ANALYSTS
JSE
EMPLOYEES
TRADE UNIONS
INTERNAL AND EXTERNAL AUDITORS
GOVERNMENT
COMMUNITIES
INTEREST GROUPS
INDUSTRY BODIES
MEDIA
GROUP BUSINESSES/JVsINTER-GROUP RELATIONSHIPS
AECI
ENGAGEMENTFLOWS:
52
STAKEHOLDER ENGAGEMENT
AECI and the JSEAs an entity listed in South Africa, AECI is required to comply with the legal framework of the JSE Listings Requirements, the Companies Act and King III. Compliance is managed largely through the Company’s Legal and Secretariat and Corporate Communications functions. Interaction with the JSE is via Rand Merchant Bank (a division of FirstRand Bank Limited) as AECI’s corporate sponsor in South Africa, when such sponsor input is required. Further liaison with the JSE, such as work related to assessments for inclusion in specific Indices, is undertaken directly.
STAKEHOLDERS WITH WHOM ENGAGEMENT IS VIA AECI AS WELL AS ITS BUSINESSES
The Group and its employeesThe same information that is shared with investors and other financially-based stakeholders is made available to employees Group-wide. This takes place via newsletters and e-mails from the Chief Executive, presentations by him to Group management and similar interactions between Group management teams and the businesses for which they are responsible.
Across all businesses, Human Capital Departments and Specialists are primarily responsible for the Group’s policies, procedures and practices in employment, benefits and related human resource matters, and for the communication of these via established structures.
The Group and trade unionsThe AECI Group subscribes to the freedom of association principle and recognises the right of all employees to join a trade union of their choice. Representative trade unions, therefore, are recognised as one of the Group’s stakeholders. A list of unions with whom formal recognition agreements are in place is available on AECI’s website. These unions participate in various consultative and negotiation structures such as Management/Shop Stewards Consultative Forums, Employment Equity and Skills Development Steering Committees, Wellness Committees and Safety, Health and Environment Committees that deal with issues that affect employees’ interests.
Group businesses in South Africa are members of the National Bargaining Council for the Chemical Industry (“NBCCI”). Substantive collective agreements for the bargaining unit are negotiated on an annual basis with representative trade unions under the auspices of the NBCCI — Industrial Chemical Sector. Senior Industrial Relations Managers from the Group participate in this forum as employer representatives.
INTERACTION BETWEEN AECI AND ITS BUSINESSESTwo-way interaction between AECI and its businesses occurs on an ongoing basis, both formally and informally. Formal structures include operating business Board meetings, business reviews, Financial Review and Risk Committees (“FRRC”) and Executive Committee meetings. AECI’s Executive Directors are in attendance at most of these meetings (except where businesses are not based in South Africa) and Non-executive Directors chair the FRRCs.
Other forums, such as cluster-specific or Group-wide conferences and management meetings, also provide opportunities for information sharing and relationship building.
The Group’s strength is enhanced by sharing best practice and experience in all areas of activity. Focus has been placed on developing a culture of collaboration across businesses. The streamlining and harnessing of efficiencies, backed by a common drive for excellence, leads to better results for the businesses individually and for the Group as a collective.
STAKEHOLDERS WITH WHOM ENGAGEMENT IS MOSTLY VIA AECI
Shareholders and fund managers, financiers, financial analystsAECI communicates with these stakeholders by way of a number of processes, including announcements released on the JSE’s Stock Exchange News Service (“SENS”), the dissemination of financial results and reports electronically and in print, results presentations, business-specific site visits and meetings.
The Company’s Chief Executive, Chief Financial Officer and members of the Executive Committee conduct timely presentations on the Group’s performance and strategy to institutional investors, financiers, financial analysts and the media in South Africa. The Executive Directors undertake roadshows in Europe and the USA, aimed mostly at potential investors. There are also regular one-on-one meetings with this group of stakeholders.
Presentations, corporate actions and financial results, as well as any other information deemed relevant, are published on the Company’s website. Stakeholders are advised of such newly-published items via SENS. Other information on the Company, such as inter alia its management and history, is also available on the website www.aeci.co.za.
To ensure that shareholders without access to electronic communication are not prejudiced, AECI currently publishes and reports on details of its corporate actions and financial performance in at least one daily national English newspaper as required by the JSE.
53
STAKEHOLDER ENGAGEMENT
The Group and neighbouring communitiesFor several years, AECI has had structures in place for engaging with its neighbouring communities. In the mid-1990s, the Umbogintwini Industrial Complex (“UIC”) was the first site or business in the Group (and South Africa) to sign a formal charter with its neighbours. The charter sets out principles, responsibilities and procedures to serve as a framework for interaction between the parties.
Communities living within the footprint of influence of manufacturing and storage sites are most often concerned about the potential effects of site incidents and the management of these. Emergency preparedness and emergency response information, therefore, is shared with neighbouring communities using channels such as the distribution of pamphlets, local media articles and advertisements, and invitations to participate in site-based emergency exercises. The latter participation is via representatives mandated by communities to represent them in these matters.
Structures in place at AECI’s largest operating sites include:
› at Modderfontein, AEL oversees the functioning of a Community Awareness and Emergency Response (“CAER”) Committee; and
› at the UIC, the CAER Committee was replaced by issue-specific stakeholder and community liaison forums that deal with inter alia water quality (including discharges to sea), air emissions and development plans. Although stakeholder engagements are generally managed by the Umbogintwini Industrial Association, the AECI Group provides assistance with logistical arrangements and, more importantly, through the site’s Community Liaison Officer.
Other interactions include local corporate social investment projects in the areas of education, health, charitable contributions, and skills and enterprise development. Most often, contributions are not only in cash but also in the form of expertise and guidance. This is also true for a number of businesses beyond South Africa’s borders.
Communities in which the Group operates or has an interest in South Africa are the intended principal beneficiaries of the AECI Community Education and Development Trust, established in 2012 as part of AECI’s Broad-based Black Economic Empowerment transactions.
The Group and special interest groupsThese stakeholders are often, but not always, aligned with communities in which the Group operates and issues of concern to them are similarly aligned.
Although their engagement requirements often overlap with those of communities, their needs are recognised separately.
Wherever possible, such stakeholders are encouraged to participate in the Group’s affairs via existing structures (liaison forums and the like). Where this is not possible separate arrangements are made to meet the needs of such stakeholders who, as a rule, are concerned mainly with matters broadly classified as being environmentally-and health-based. Arrangements include meetings, site/business visits and participation in/support of interest group initiatives.
Examples of interest groups in South Africa include the Modderfontein Conservation Society and the Wildlife and Environment Society of South Africa.
The Group and internal and external auditorsThis engagement is driven by good governance requirements, through compliance with relevant legislation and standards. This includes the limited assurance of selected non-financial indicators which AECI believes are material in view of the nature of its businesses and the environment in which they operate.
The Directors are required in terms of the Companies Act and the JSE Listings Requirements to prepare annual financial statements which fairly present the state of affairs of the Company and the Group as at the end of the financial year and of the profit or loss for that period in conformity with IFRS. The external auditors are responsible for auditing the financial statements of the Company and its subsidiaries and for expressing their opinion on these statements to shareholders. In addition, the external auditors are responsible for confirming whether the financial statements meet the requirements of the Companies Act and IFRS. In 2015, the external auditors were also engaged to carry out an Agreed Upon Procedures Review in respect of the interim financial results to 30 June.
The Directors must ensure that Group companies maintain adequate accounting records, and that an effective risk management process and internal controls are in place to safeguard the assets of the Group and to prevent and detect fraud and other irregularities. To enable the Directors to meet these responsibilities, management sets standards and implements systems of risk management and internal control aimed at reducing the risk of error or loss in a cost-effective manner. The Group’s Internal Audit function appraises Group companies’ internal controls and submits its assessment of these to the Board on an annual basis.
The management of each operating business also submits an annual self-assessment of internal control (Internal Control Matrix) to the Audit Committee affirming that the systems of internal control, in entities for which they have responsibility, are adequate for their operations and are functioning effectively. Internal Audit assesses the controls opposite this matrix and reports thereon to the Audit Committee.
The Group and government/authoritiesEngagement with government regulatory structures is undertaken by AECI and its businesses directly as well as indirectly via industry forums, as deemed most effective and appropriate in any given circumstance. Direct engagement is usually site- or business-specific.
A key industry forum for regulatory engagement in South Africa is the Chemical and Allied Industries’ Association (“CAIA”). CAIA engages with government and various international agencies on a range of matters, predominantly in the areas of safety, health and the environment. Some of the interactions with the authorities are carried out under the auspices of Business Unity South Africa of which CAIA is a member. CAIA’s engagements include the Department of Labour’s working group on occupational health and safety, climate change matters, and the National Waste Act, No. 59 of 2008. AECI’s Chief Executive is a member of CAIA’s Board.
54
STAKEHOLDER ENGAGEMENT
STAKEHOLDERS WITH WHOM ENGAGEMENT IS MOSTLY VIA GROUP BUSINESSES
Group businesses and customers/suppliersCustomer service and engagement is at the heart of the daily business of AECI’s operating entities. It is fundamental to the value add business model and, as such, it embraces the spectrum of business-related issues that could affect performance and also addresses external considerations such as labour relations and socio-political stability.
Each Group business has a robust system in place to ensure that any changes in customers’ needs are met quickly and efficiently. Equally, relationships with suppliers are monitored continually and are modified as required. Terms of engagement with customers and suppliers are clearly defined and, where appropriate, Group-wide policies and procedures guide the businesses to ensure that customer- or supplier-related risks are properly understood and managed in line with AECI’s risk appetite.
Group businesses and technology and business partnersLong-term technology and other agreements, as well as strategically advantageous partnerships, are one of the bases for the AECI Group’s growth. Individual businesses engage with their principals and partners as a matter of course. Major changes, developments or opportunities are escalated to the Executive Committee and then to the Board, depending on the significance of the real or proposed change, development or opportunity.
This ensures that issues such as competitor and customer trends, economic conditions and industry trends, and the appropriateness of technologies, products and services are addressed.
The Group and the mediaAll issues pertaining to the Group and its stakeholders are of potential interest to the media in its role as a conduit for public information.
AECI’s Corporate Communications function maintains regular contact with the media by disseminating relevant information. Group businesses also interact with the media regarding matters specific to their sites or businesses. Other than in instances where media comment/coverage relates to marketing or product news, businesses are required to keep the AECI Head Office informed of likely media coverage. This is particularly true in instances where potentially controversial or negative comment is expected, or when it is possible that coverage will impact on/refer to the Group as a whole.
Where businesses do not have the necessary resources to deal with media requests or enquiries on their own, AECI’s Corporate Communications function provides guidance or responds on that business’ behalf after having confirmed the content of the response with management.
For communication in any situation which can be defined as a crisis or potential crisis (operational, industrial action, legal issues etc.), the preparedness of each business for such an eventuality is confirmed by annual Letters of Assurance submitted by Managing Directors to the Chief Executive.
Depending on the type and scale of an emergency, AECI Head Office resources are made available to assist the affected site or business. The hierarchy for escalating notifications of incidents, and subsequent progress reports, is clearly defined and has been communicated to all businesses.
The Group and industry bodiesIn addition to its involvement in CAIA, AECI and its businesses are involved in a number of initiatives and associations pertinent to all or some of their business activities. In this way, issues relevant to the sustainability of the Company or that of one or more of its businesses are addressed. Details are to be found in the Sustainability section of AECI’s website.
55
STAKEHOLDER ENGAGEMENT
COMMITTEE OBJECTIVESThe Board of Directors has conferred upon the members of the Committee the following powers:
Statutory duties › To consider, recommend and monitor AECI’s activities with regard to the following and report accordingly to the Board:
» good corporate citizenship, specifically in relation to (i) the promotion of equality, (ii) the prevention of unfair discrimination and the reduction of corruption, and (iii) AECI’s record of sponsorship, donations and charitable giving;
» labour and employment matters: specifically in relation to AECI’s standing on (i) the International Labour Organisation’s protocol on decent work and working conditions, and (ii) employee relations and contributions to the educational development of employees;
» safety, health and the environment: specifically in relation to the impacts of the AECI Group’s activities and those of its products and services;
» social and economic development of defined communities: specifically in relation to (i) the 10 principles set out in the United Nations Global Compact, (ii) the Organisation for Economic Co-operation and Development’s recommendations regarding corruption, (iii) the Employment Equity Act, No. 55 of 1998, (the “Employment Equity Act”) in South Africa, and (iv) the Broad-Based Black Economic Empowerment Act, No. 53 of 2003, in South Africa; and
» consumer relations: specifically in relation to advertising, public relations and compliance with consumer protection laws.
› To monitor and advance the implementation of policies and plans approved by the Board on matters as contemplated above.
Non-statutory dutiesThe Committee is further mandated as follows:
› to monitor to the best of its ability that AECI and its operating businesses adhere to the approved Code of Ethics and Business Conduct policy and guidelines;
› to provide guidance and advice on sustainability trends and issues relevant to the AECI Group as well as review and approve the Group’s sustainability policy from time to time. The Committee will be informed of the sustainability risks as recorded in the AECI Group risk register and provide related input to the Risk Committee, as appropriate. Further, the Committee will review Safety, Health and Environmental Incident reports;
› to monitor to the best of its ability that AECI and its operating businesses have properly identified stakeholders, and understand their issues, and ensure that all stakeholders are treated in an equitable and fair manner. Details of identified stakeholders and the AECI Group’s approach to engagement with them appear on pages 52 to 55.
DEAR STAKEHOLDERS
THIS REPORT IS PROVIDED BY THE SOCIAL AND ETHICS COMMITTEE (“THE COMMITTEE”) APPOINTED IN RESPECT OF THE 2015 FINANCIAL YEAR OF AECI LTD. THIS REPORT INCORPORATES THE REQUIREMENTS OF SECTION 43 OF THE REGULATIONS OF THE COMPANIES ACT.
MEMBERSHIPThe four meetings held in the year were attended by all members. Full details of the meeting dates and attendance are available via the link www.aeci.co.za/pdf/2015_board_meetings.pdf.
The current members are:
› Z Fuphe (Chairman)
› GJ Cundill
› MA Dytor
› MVK Matshitse
› AJ Morgan
› R Ramashia
Abridged biographies of the members are published on pages 16 to 20. Ms Fuphe has served on the Committee since 2008, Adv Ramashia since 2010, Mr Cundill and Ms Matshitse since 2012, Mr Dytor since 2013, and Mr Morgan since 2014.
56
SOCIAL AND ETHICS COMMITTEE’S REPORT TO STAKEHOLDERS
KEY ACTIVITIES IN THE YEAR UNDER REVIEW
The Committee › received and reviewed reports on AECI’s management of safety, health and environmental issues. This included detailed reports and presentations on the two fatalities, a plant explosion, and a search and seizure operation that occurred during the course of the year;
› received and reviewed reports on AECI’s progress on Employment Equity (“EE”) in its South African operations. This included the evaluation and approval of the targets which management would submit to the South African Department of Labour;
› received and reviewed reports relating to Broad-based Black Economic Empowerment, and the effect of changes to the Codes of Best Practice in this regard on its South African operations;
› received and reviewed reports on ethics management across the Group, including the workings of the Tip-offs Anonymous whistle-blowing line;
› received and reviewed reports on AECI’s talent management processes, including retention strategies, succession plans and reports on termination trends;
› received and reviewed reports on the AECI Employees Share Trust, including the review and approval of a proposal to pay a dividend to beneficiaries of this Trust; and
› received and reviewed reports on the AECI Community Education and Development Trust, and commented on this Trust’s proposed marketing plan.
Zellah Fuphe Chairman
Woodmead, Sandton 11 April 2016
57
SOCIAL AND ETHICS COMMITTEE’S REPORT
TO STAKEHOLDERS
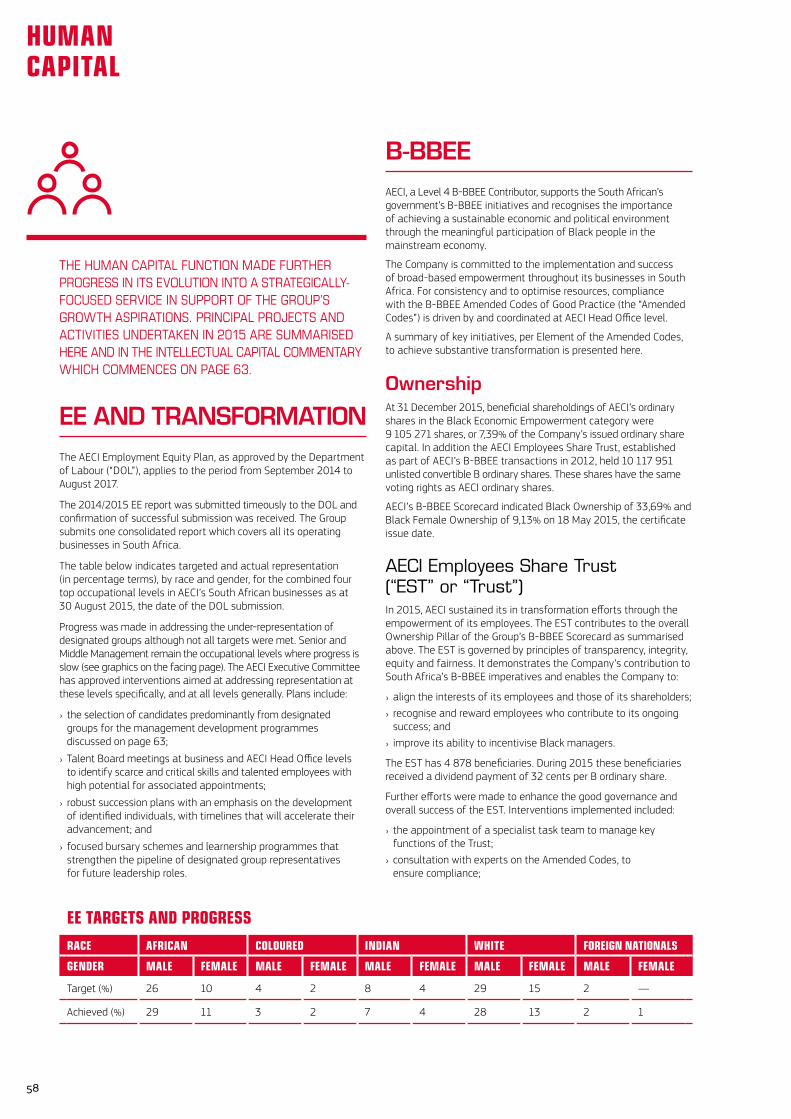
B-BBEEAECI, a Level 4 B-BBEE Contributor, supports the South African’s government’s B-BBEE initiatives and recognises the importance of achieving a sustainable economic and political environment through the meaningful participation of Black people in the mainstream economy.
The Company is committed to the implementation and success of broad-based empowerment throughout its businesses in South Africa. For consistency and to optimise resources, compliance with the B-BBEE Amended Codes of Good Practice (the “Amended Codes”) is driven by and coordinated at AECI Head Office level.
A summary of key initiatives, per Element of the Amended Codes, to achieve substantive transformation is presented here.
OwnershipAt 31 December 2015, beneficial shareholdings of AECI’s ordinary shares in the Black Economic Empowerment category were 9 105 271 shares, or 7,39% of the Company’s issued ordinary share capital. In addition the AECI Employees Share Trust, established as part of AECI’s B-BBEE transactions in 2012, held 10 117 951 unlisted convertible B ordinary shares. These shares have the same voting rights as AECI ordinary shares.
AECI’s B-BBEE Scorecard indicated Black Ownership of 33,69% and Black Female Ownership of 9,13% on 18 May 2015, the certificate issue date.
AECI Employees Share Trust (“EST” or “Trust”)In 2015, AECI sustained its in transformation efforts through the empowerment of its employees. The EST contributes to the overall Ownership Pillar of the Group’s B-BBEE Scorecard as summarised above. The EST is governed by principles of transparency, integrity, equity and fairness. It demonstrates the Company’s contribution to South Africa’s B-BBEE imperatives and enables the Company to:
› align the interests of its employees and those of its shareholders;
› recognise and reward employees who contribute to its ongoing success; and
› improve its ability to incentivise Black managers.
The EST has 4 878 beneficiaries. During 2015 these beneficiaries received a dividend payment of 32 cents per B ordinary share.
Further efforts were made to enhance the good governance and overall success of the EST. Interventions implemented included:
› the appointment of a specialist task team to manage key functions of the Trust;
› consultation with experts on the Amended Codes, to ensure compliance;
THE HUMAN CAPITAL FUNCTION MADE FURTHER PROGRESS IN ITS EVOLUTION INTO A STRATEGICALLY-FOCUSED SERVICE IN SUPPORT OF THE GROUP’S GROWTH ASPIRATIONS. PRINCIPAL PROJECTS AND ACTIVITIES UNDERTAKEN IN 2015 ARE SUMMARISED HERE AND IN THE INTELLECTUAL CAPITAL COMMENTARY WHICH COMMENCES ON PAGE 63.
EE AND TRANSFORMATIONThe AECI Employment Equity Plan, as approved by the Department of Labour (“DOL”), applies to the period from September 2014 to August 2017.
The 2014/2015 EE report was submitted timeously to the DOL and confirmation of successful submission was received. The Group submits one consolidated report which covers all its operating businesses in South Africa.
The table below indicates targeted and actual representation (in percentage terms), by race and gender, for the combined four top occupational levels in AECI’s South African businesses as at 30 August 2015, the date of the DOL submission.
Progress was made in addressing the under-representation of designated groups although not all targets were met. Senior and Middle Management remain the occupational levels where progress is slow (see graphics on the facing page). The AECI Executive Committee has approved interventions aimed at addressing representation at these levels specifically, and at all levels generally. Plans include:
› the selection of candidates predominantly from designated groups for the management development programmes discussed on page 63;
› Talent Board meetings at business and AECI Head Office levels to identify scarce and critical skills and talented employees with high potential for associated appointments;
› robust succession plans with an emphasis on the development of identified individuals, with timelines that will accelerate their advancement; and
› focused bursary schemes and learnership programmes that strengthen the pipeline of designated group representatives for future leadership roles.
EE TARGETS AND PROGRESSRACE AFRICAN COLOURED INDIAN WHITE FOREIGN NATIONALS
GENDER MALE FEMALE MALE FEMALE MALE FEMALE MALE FEMALE MALE FEMALE
Target (%) 26 10 4 2 8 4 29 15 2 —
Achieved (%) 29 11 3 2 7 4 28 13 2 1
58
HUMAN CAPITAL
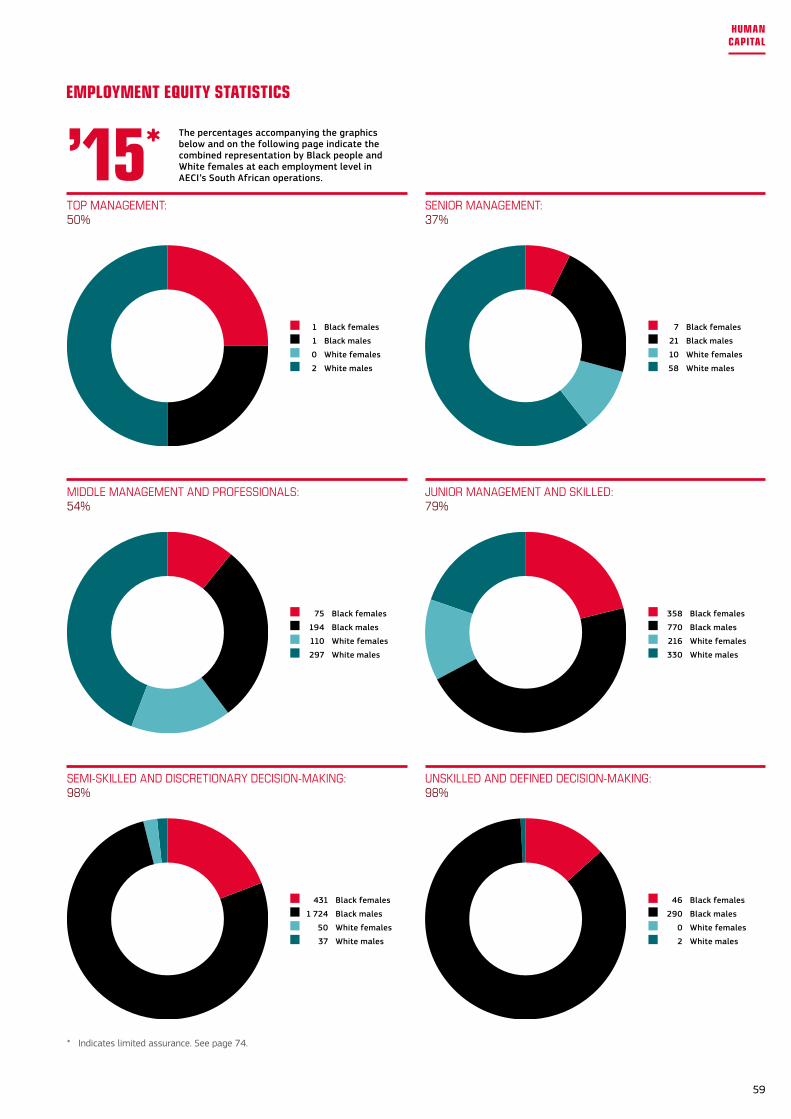
’15*TOPMANAGEMENT:50%
1 Black females
1 Black males
0 White females
2 White males
SENIORMANAGEMENT:37%
7 Black females
21 Black males
10 White females
58 White males
JUNIORMANAGEMENTANDSKILLED:79%
358 Black females
770 Black males
216 White females
330 White males
MIDDLEMANAGEMENTANDPROFESSIONALS:54%
75 Black females
194 Black males
110 White females
297 White males
UNSKILLEDANDDEFINEDDECISION-MAKING:98%
46 Black females
290 Black males
0 White females
2 White males
SEMI-SKILLEDANDDISCRETIONARYDECISION-MAKING:98%
431 Black females
1 724 Black males
50 White females
37 White males
* Indicates limited assurance. See page 74.
The percentages accompanying the graphics below and on the following page indicate the combined representation by Black people and White females at each employment level in AECI’s South African operations.
59
EMPLOYMENT EQUITY STATISTICS
HUMAN CAPITAL
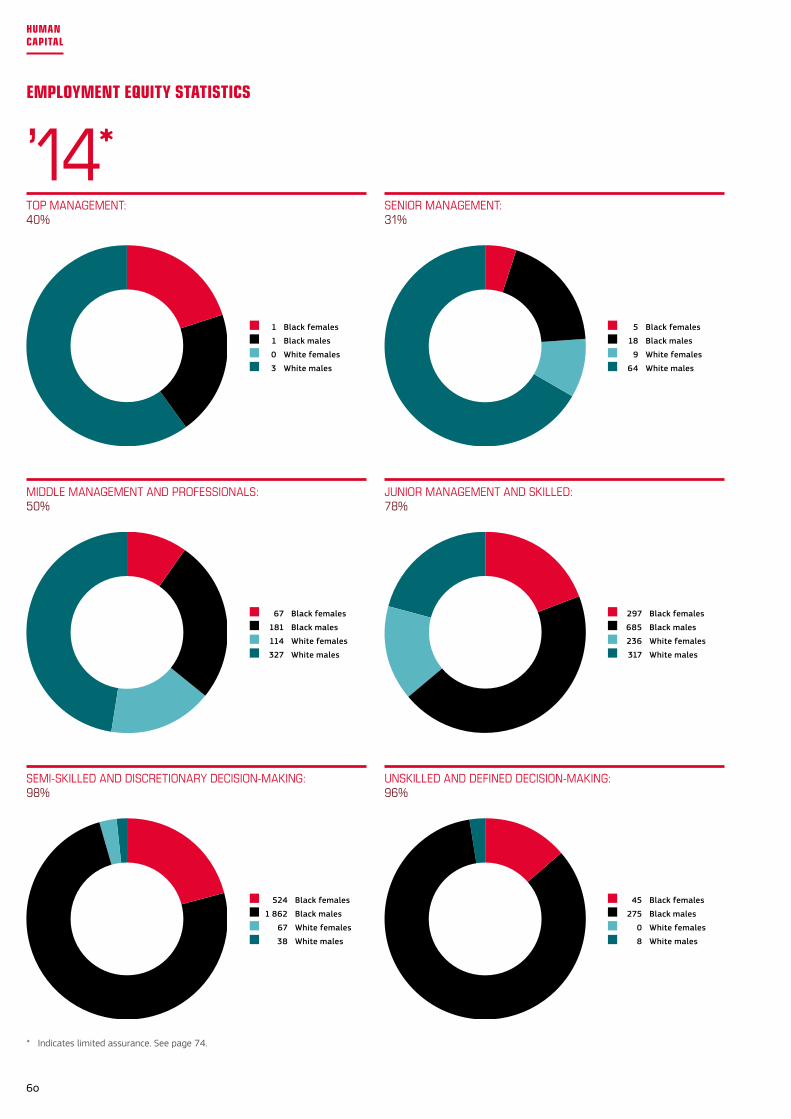
’14*TOPMANAGEMENT:40%
1 Black females
1 Black males
0 White females
3 White males
SENIORMANAGEMENT:31%
5 Black females
18 Black males
9 White females
64 White males
JUNIORMANAGEMENTANDSKILLED:78%
297 Black females
685 Black males
236 White females
317 White males
MIDDLEMANAGEMENTANDPROFESSIONALS:50%
67 Black females
181 Black males
114 White females
327 White males
UNSKILLEDANDDEFINEDDECISION-MAKING:96%
45 Black females
275 Black males
0 White females
8 White males
SEMI-SKILLEDANDDISCRETIONARYDECISION-MAKING:98%
524 Black females
1 862 Black males
67 White females
38 White males
* Indicates limited assurance. See page 74.
60
HUMAN CAPITAL
EMPLOYMENT EQUITY STATISTICS
EMPLOYEE RELATIONSIt is AECI’s policy not to tolerate any form of unfair discrimination, harassment, child labour or intimidation in the workplace. Group policies and standards guiding behaviour in these matters are in place and training is provided to management and shop stewards to facilitate understanding and good relationships. The violation of policies and standards is a violation of AECI’s EnGaGED and REspOnsIBLE values, and results in appropriate disciplinary action.
Employee relations policies are reviewed and updated regularly to ensure continued alignment with business and legislative requirements. Formal contracts with all employees conform to local legal requirements and the core conventions of the International Labour Organization.
Labour legislationThe South African Labour Relations Act, No. 66 of 1995, as amended, was promulgated in January 2015. Significant changes relate to areas such as the protection of vulnerable workers, limiting temporary employment to a period not exceeding three months, and non-discrimination in respect of issues of equal pay for work of equal value. For AECI, this resulted in the revision of employment policies in general and the Recruitment policy in particular, as well changes to the management of temporary employees and labour brokers.
AECI Group companies also operate in several other countries. There were no significant changes in labour legislation in any of these countries in 2015.
In Botswana, amendments to severance pay legislation are under review prior to finalisation and promulgation. Changes contemplated in Burkina Faso were placed on hold owing to political instability there.
AECI Group employees participate in the implementation of changes that affect them through their representative trade unions. Those who are not unionised are consulted via briefing sessions.
Trade union and employee participationAECI recognises the right of employees to collective bargaining and freedom of association. It maintains constructive relationships with all representative unions and councils that enjoy consultative or negotiating powers on issues of mutual interest. About 45% of employees in South Africa are members of trade unions. Trade union representatives participate in formal joint management/worker committees and they also serve on the Boards of Trustees of certain Group retirement funds.
A major concern for South African trade unions is the decreasing rate of employment and ongoing job losses through retrenchments. Industrial action across the country, particularly in the mining sector, has high- lighted the critical importance of a partnership approach to employee relations as jobs are lost in the Group’s customer operations.
› the development of a risk register and Board of Trustees charter; and
› finalisation of a marketing and communications plan to enhance awareness of the Trust among employees.
Beneficiaries were well represented at the General Meeting to mandate the Chairman to vote on the EST’s behalf at AECI’s AGM held on 1 June 2015.
Management control and skills developmentWork remains to be done to improve demographic diversity at all occupational levels, using the Economically Active Population statistics as a framework. Annual targets are set and initiatives in support of achieving them are summarised in the Talent Management and Learning and Development sections of this integrated report, on pages 63 and 64.
Enterprise development (“ED”) and supplier development (“SD”)Early in 2016, AECI launched a Group-wide strategic initiative to better align ED and SD programmes with the Amended Codes. The main thrusts include:
› ED: support will be provided so as to assist or accelerate the development, sustainability and ultimate financial independence of beneficiaries. To secure a return on investment, AECI intends using ED programmes as part of an integrated approach to developing a pipeline of Exempt Micro Enterprise and Qualifying Small Enterprise entrepreneurs for inclusion in corporate supply chains.
› In SD the key objectives are:
» increasing supplier diversity by adding new Black-owned suppliers to the Group’s supply chain;
» addressing the challenge of working with these suppliers by assisting them in enhancing their underlying operations; and/or
» improving suppliers’ capability in a way that benefits their sustainability and robustness.
Well-designed ED and SD programmes should not only gain compliance points for Scorecard purposes but should also address operational and supply chain challenges. Ultimately, they should assist in achieving targets in the Procurement Element of the Scorecard while contributing to the development and growth of small businesses.
Socio-economic development (“SED”)As a socially responsible corporate citizen, the Group invests in effective community-focused organisations and initiatives that develop and uplift vulnerable communities neighbouring its operations. SED programmes are driven by principles of strategic social investment, community empowerment, meaningful partnerships and good governance so as to promote sustainable development by “teaching people to fish rather than giving them a fish”. See page 65 for more information.
61
HUMAN CAPITAL
Substantive collective agreementsWage negotiations were concluded successfully and without any industrial action notwithstanding the uncertain environment due to subdued economic conditions. It was pleasing that the parties involved continue to display professionalism and maturity in engagements, to the benefit of all parties concerned.
Substantive collective agreements for bargaining unit employees in South Africa are negotiated annually under the auspices of the National Bargaining Council for the Chemical Industry. Settlements reached by employers and representative trade unions were effective from 1 July 2015 to 30 June 2016.
Wages and substantive conditions of employment in businesses outside South Africa are negotiated with trade unions on an annual basis where trade unions are involved. In Burkina Faso the government is also involved in the negotiation of wages. In countries where unions are not involved, management determines increases based on labour market competitiveness, inflation and remuneration survey data.
OutlookLess than robust economic conditions in South Africa call for a more strategic approach to partnerships between labour and the private and the public sectors. Issues such as poor socio-economic conditions, inter-union rivalry, job losses, the high youth unemployment rate and less expensive foreign labour pose challenges which could impact on labour market stability.
Outside South Africa the main concerns are in Burkina Faso, where socio-political unrest increased in 2015. Subsequent to elections in that country, it is hoped that stability will return.
In line with the principles and spirit of recognition agreements, consultative forums are used to communicate the state of the business environment and related business performance, and to engage on related matters of common concern.
As in South Africa, relationships with employees in other countries are based on fairness, openness and dialogue in the legal framework of each country of operation.
Recognition agreements in South Africa are in place with all the main chemical industry trade unions. Representative trade unions outside South Africa are recognised in a number of countries and represent about 59% of the Group’s international workforce. A list of trade unions is available in the Sustainability section of AECI’s website.
Business restructuringAEL, Akulu Marchon and ImproChem undertook restructuring initiatives in the year. All three consolidated functional and administrative services at their operating sites so as to enhance the cost competitiveness and efficiency of their cost bases. Certain business units were divisionalised.
Detailed, regular consultation with affected employee representative bodies preceded restructuring which, regrettably, resulted in 155 jobs being made redundant. Retrenchments were limited to 103 of the 155 employees affected owing to redeployment and natural attrition.
Where retrenchments are unavoidable, affected employees are treated fairly and with dignity.
To mitigate the effects of retrenchments a number of measures were put in place, in line with policy and practice. AECI has a comprehensive social plan with benefits and services aimed at alleviating the hardship of job losses:
› a competitive severance package;
› counselling to address emotional issues;
› financial and retirement workshops and counselling;
› assistance with writing curricula vitae;
› training in interview and job search skills;
› small business development training; and
› re-skilling and re-training programmes.
62
HUMAN CAPITAL
› the AECI Group Induction Programme, presented twice each year over two days, makes a significant contribution in enabling the Group’s strategic goal of better cohesion and collaboration across its businesses. The Programme assists in defining a unified view of the Group and its values. It also gives new employees an opportunity to build relationships beyond those with their immediate colleagues;
› the design of a system to standardise and harmonise job grading in the Group was completed and implementation for non-Bargaining Unit employees will commence in 2016. The initial focus will be on the Group’s employees in South Africa.
Also in 2016, the design of an HR Information System will be initiated. This System will enhance the efficiency and effectiveness of all employee-related matters.
LEARNING AND DEVELOPMENTAECI’s Learning and Development strategies are aligned with the Employment Equity Act, No. 55 of 1998, and the Skills Development Act, No. 97 of 1998, among others.
Building skills and behaviours which promote a culture of continual learning, leadership, inclusivity and transformation is imperative for the Group’s achievement of its strategic goals, including its EE targets.
In 2015, the objective of enabling employees to grow and advance their careers in the Group remained a priority. Opportunities were pursued for employees to participate in training programmes and learning interventions appropriate to their levels of work, and also to attend interventions at higher levels as appropriate.
Training programmes are designed to guarantee the timely availability of the Group’s human capital requirements and learning interventions aim to deliver well-rounded, competent employees who make valuable contributions through their personal growth and increased productivity. Ultimately, their contributions benefit not only themselves but also other stakeholders such as the communities in which they live and AECI’s shareholders.
Employees are encouraged to assume responsibility for their own development in partnership with their Managers. They are guided in assessing their level of competence before applying to participate in opportunities such as the AECI Management Development Ladder and the Employee Study Assistance Programme. The Learning Management System acquired in 2015 is a self-help application and registration service for training courses and e-learning modules, in line with AECI’s value of being EnGaGED. This benefits the employees directly affected and the Group as a whole.
In the year under review R2,3 million (20% more than in 2014) was invested in 124 employees through the Employee Study Assistance Programme. 90% of these employees were from designated groups and their chosen studies covered qualifications that included MBA, BSc and BCom Degrees as well as Diplomas and shorter courses in relevant disciplines. Although the focus remains on addressing scarce and critical skills, the Group will continue assisting employees wishing to improve their educational qualifications in their preferred fields, provided these are in line with their roles.
TALENT MANAGEMENTProgress was made in enabling and facilitating the development and growth of AECI’s people. The focus on organisational effectiveness and development motivated several projects and programmes to enhance employees’ engagement and workplace experience.
The Talent Management Department assisted the Group in driving employee engagement through benchmarked and researched interventions summarised as follows:
› recruitment of suitably qualified and experienced employees in support of AECI’s transformation objectives, in the most cost-effective manner possible. This included direct headhunting, refinement of the AECI Career website and negotiating preferential rates with placement agencies. For the 39 Senior management and Professional positions that became available, shortlisted candidates’ profiles indicated progress in terms of attracting individuals of the desired calibre. This was particularly evident among designated group applicants;
› improved talent effectiveness and leadership ability through the Group’s partnership with the Gordon Institute of Business Science (“GIBS”), which provides accredited and customised programmes for the AECI Management Development Ladder. This is designed for leaders from Junior to Senior management levels. The third intake participated in 2015 and the initiative’s sustained success was pleasing. Over three years, 277 individuals have benefited, with 82% of these from designated groups.
The GIBS programmes offer participants the most up-to-date knowledge and expose them to stretch assignments, both syndicated and individual. These assignments have highlighted specific potential strategic growth opportunities for the AECI Group as a whole and a number of collaborative interventions between two or more AECI businesses have emerged.
As was the case in prior years, Executives and Senior Managers were enrolled in the GIBS Global Executive Development Programme. Four participated in 2015, with two of them placed in the Top 3 of the class. The 2014 participants’ action learning projects were implemented successfully, resulting in measurable advantages for AECI;
› the Performance Improvement intervention was initiated in the year, with Group-wide management upskilling and cascading of the process. The intention is to ensure that Performance Management processes and procedures are standardised, that strategic objectives and goals are aligned and that they are cascaded effectively to Group employees at all levels, speaking to the pay-off line “One Team — Great Performance”. Implementation commenced in early 2016, with individual goals and objectives for management and employees at professional and managerial levels being set as a first step;
› the Talent Management Department assisted in the review of AECI’s values. All businesses participated in developing the BIGGER values and corresponding behaviours, applicable Group-wide. Thereafter, an awareness campaign was rolled out to all employees;
63
INTELLECTUAL CAPITAL
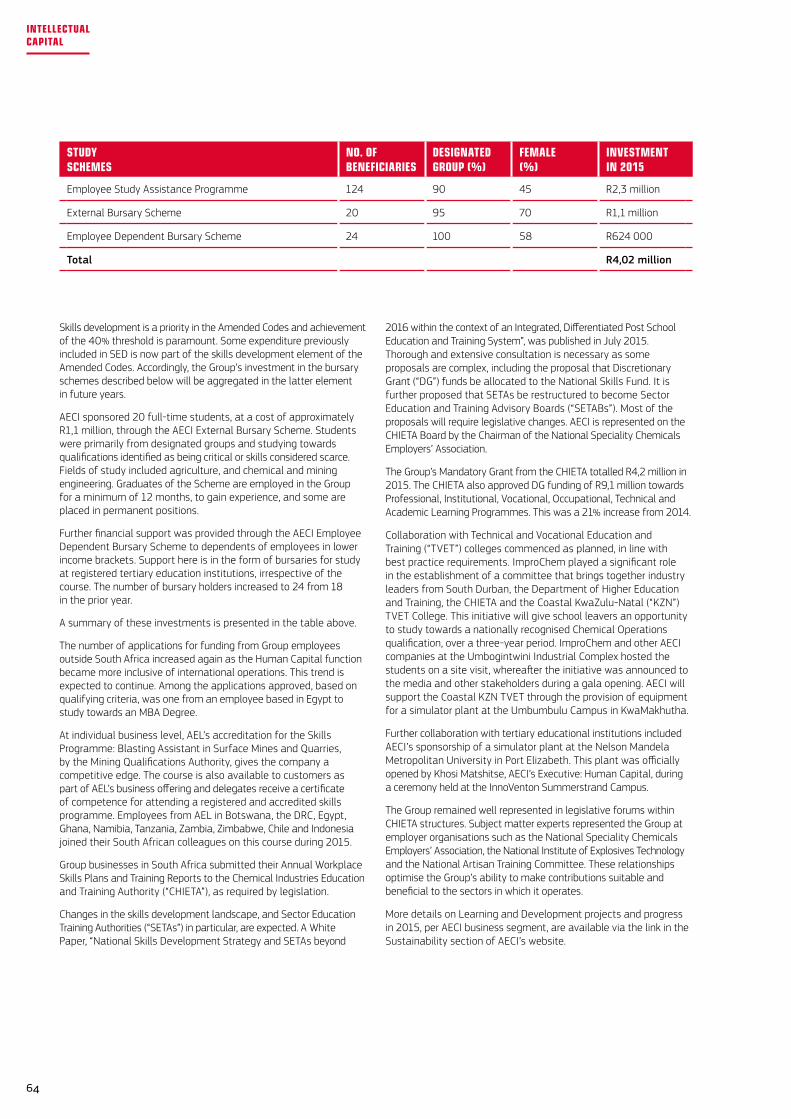
2016 within the context of an Integrated, Differentiated Post School Education and Training System”, was published in July 2015. Thorough and extensive consultation is necessary as some proposals are complex, including the proposal that Discretionary Grant (“DG”) funds be allocated to the National Skills Fund. It is further proposed that SETAs be restructured to become Sector Education and Training Advisory Boards (“SETABs”). Most of the proposals will require legislative changes. AECI is represented on the CHIETA Board by the Chairman of the National Speciality Chemicals Employers’ Association.
The Group’s Mandatory Grant from the CHIETA totalled R4,2 million in 2015. The CHIETA also approved DG funding of R9,1 million towards Professional, Institutional, Vocational, Occupational, Technical and Academic Learning Programmes. This was a 21% increase from 2014.
Collaboration with Technical and Vocational Education and Training (“TVET”) colleges commenced as planned, in line with best practice requirements. ImproChem played a significant role in the establishment of a committee that brings together industry leaders from South Durban, the Department of Higher Education and Training, the CHIETA and the Coastal KwaZulu-Natal (“KZN”) TVET College. This initiative will give school leavers an opportunity to study towards a nationally recognised Chemical Operations qualification, over a three-year period. ImproChem and other AECI companies at the Umbogintwini Industrial Complex hosted the students on a site visit, whereafter the initiative was announced to the media and other stakeholders during a gala opening. AECI will support the Coastal KZN TVET through the provision of equipment for a simulator plant at the Umbumbulu Campus in KwaMakhutha.
Further collaboration with tertiary educational institutions included AECI’s sponsorship of a simulator plant at the Nelson Mandela Metropolitan University in Port Elizabeth. This plant was officially opened by Khosi Matshitse, AECI’s Executive: Human Capital, during a ceremony held at the InnoVenton Summerstrand Campus.
The Group remained well represented in legislative forums within CHIETA structures. Subject matter experts represented the Group at employer organisations such as the National Speciality Chemicals Employers’ Association, the National Institute of Explosives Technology and the National Artisan Training Committee. These relationships optimise the Group’s ability to make contributions suitable and beneficial to the sectors in which it operates.
More details on Learning and Development projects and progress in 2015, per AECI business segment, are available via the link in the Sustainability section of AECI’s website.
Skills development is a priority in the Amended Codes and achievement of the 40% threshold is paramount. Some expenditure previously included in SED is now part of the skills development element of the Amended Codes. Accordingly, the Group’s investment in the bursary schemes described below will be aggregated in the latter element in future years.
AECI sponsored 20 full-time students, at a cost of approximately R1,1 million, through the AECI External Bursary Scheme. Students were primarily from designated groups and studying towards qualifications identified as being critical or skills considered scarce. Fields of study included agriculture, and chemical and mining engineering. Graduates of the Scheme are employed in the Group for a minimum of 12 months, to gain experience, and some are placed in permanent positions.
Further financial support was provided through the AECI Employee Dependent Bursary Scheme to dependents of employees in lower income brackets. Support here is in the form of bursaries for study at registered tertiary education institutions, irrespective of the course. The number of bursary holders increased to 24 from 18 in the prior year.
A summary of these investments is presented in the table above.
The number of applications for funding from Group employees outside South Africa increased again as the Human Capital function became more inclusive of international operations. This trend is expected to continue. Among the applications approved, based on qualifying criteria, was one from an employee based in Egypt to study towards an MBA Degree.
At individual business level, AEL’s accreditation for the Skills Programme: Blasting Assistant in Surface Mines and Quarries, by the Mining Qualifications Authority, gives the company a competitive edge. The course is also available to customers as part of AEL’s business offering and delegates receive a certificate of competence for attending a registered and accredited skills programme. Employees from AEL in Botswana, the DRC, Egypt, Ghana, Namibia, Tanzania, Zambia, Zimbabwe, Chile and Indonesia joined their South African colleagues on this course during 2015.
Group businesses in South Africa submitted their Annual Workplace Skills Plans and Training Reports to the Chemical Industries Education and Training Authority (“CHIETA”), as required by legislation.
Changes in the skills development landscape, and Sector Education Training Authorities (“SETAs”) in particular, are expected. A White Paper, “National Skills Development Strategy and SETAs beyond
STUDY SCHEMES
NO. OFBENEFICIARIES
DESIGNATEDGROUP (%)
FEMALE (%)
INVESTMENTIN 2015
Employee Study Assistance Programme 124 90 45 R2,3 million
External Bursary Scheme 20 95 70 R1,1 million
Employee Dependent Bursary Scheme 24 100 58 R624 000
Total R4,02 million
64
INTELLECTUAL CAPITAL
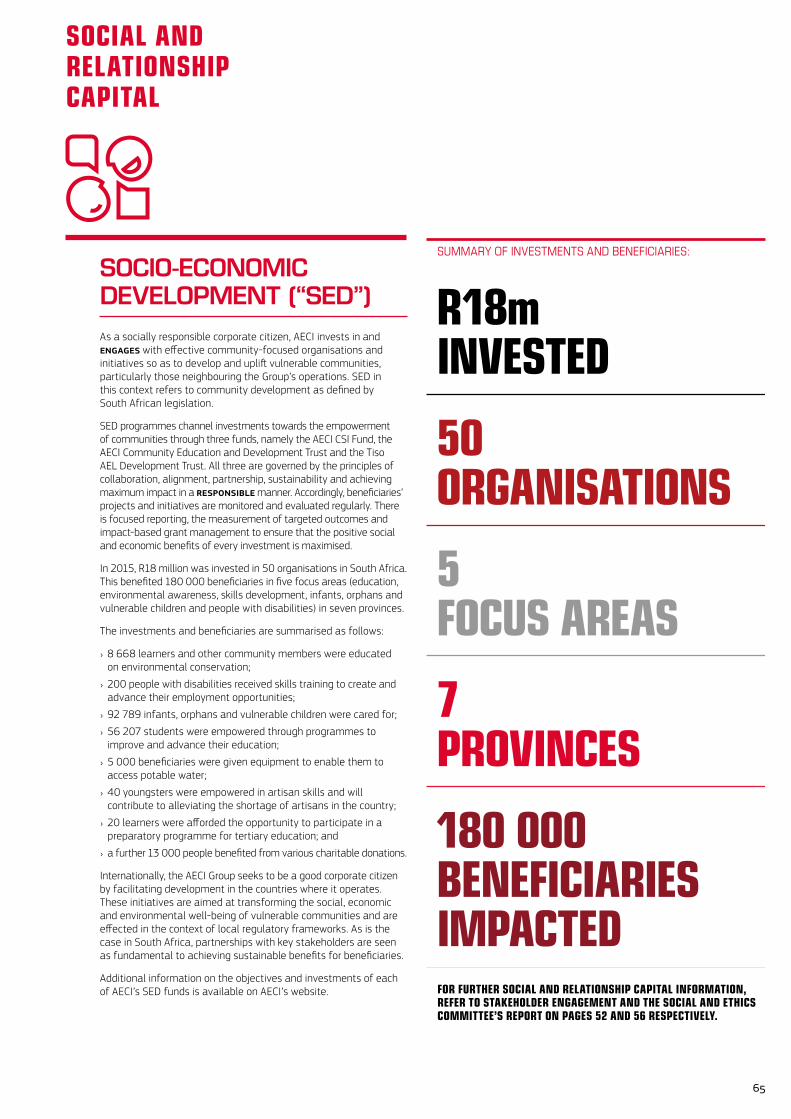
SOCIO-ECONOMIC DEVELOPMENT (“SED”)As a socially responsible corporate citizen, AECI invests in and EnGaGEs with effective community-focused organisations and initiatives so as to develop and uplift vulnerable communities, particularly those neighbouring the Group’s operations. SED in this context refers to community development as defined by South African legislation.
SED programmes channel investments towards the empowerment of communities through three funds, namely the AECI CSI Fund, the AECI Community Education and Development Trust and the Tiso AEL Development Trust. All three are governed by the principles of collaboration, alignment, partnership, sustainability and achieving maximum impact in a REspOnsIBLE manner. Accordingly, beneficiaries’ projects and initiatives are monitored and evaluated regularly. There is focused reporting, the measurement of targeted outcomes and impact-based grant management to ensure that the positive social and economic benefits of every investment is maximised.
In 2015, R18 million was invested in 50 organisations in South Africa. This benefited 180 000 beneficiaries in five focus areas (education, environmental awareness, skills development, infants, orphans and vulnerable children and people with disabilities) in seven provinces.
The investments and beneficiaries are summarised as follows:
› 8 668 learners and other community members were educated on environmental conservation;
› 200 people with disabilities received skills training to create and advance their employment opportunities;
› 92 789 infants, orphans and vulnerable children were cared for;
› 56 207 students were empowered through programmes to improve and advance their education;
› 5 000 beneficiaries were given equipment to enable them to access potable water;
› 40 youngsters were empowered in artisan skills and will contribute to alleviating the shortage of artisans in the country;
› 20 learners were afforded the opportunity to participate in a preparatory programme for tertiary education; and
› a further 13 000 people benefited from various charitable donations.
Internationally, the AECI Group seeks to be a good corporate citizen by facilitating development in the countries where it operates. These initiatives are aimed at transforming the social, economic and environmental well-being of vulnerable communities and are effected in the context of local regulatory frameworks. As is the case in South Africa, partnerships with key stakeholders are seen as fundamental to achieving sustainable benefits for beneficiaries.
Additional information on the objectives and investments of each of AECI’s SED funds is available on AECI’s website.
SUMMARYOFINVESTMENTSANDBENEFICIARIES:
R18m INVESTED
50 ORGANISATIONS
5FOCUS AREAS
7PROVINCES
180 000BENEFICIARIES IMPACTEDFOR FURTHER SOCIAL AND RELATIONSHIP CAPITAL INFORMATION, REFER TO STAKEHOLDER ENGAGEMENT AND THE SOCIAL AND ETHICS COMMITTEE’S REPORT ON PAGES 52 AND 56 RESPECTIVELY.
65
SOCIAL AND RELATIONSHIP CAPITAL


NATURAL CAPITAL 68
INDEPENDENT ASSURANCE REPORT 0N SELECTED SUSTAINABILITY INFORMATION 74
THE USE OF OUR NATURAL CAPITAL IN A MANNER THAT PROMOTES A SUSTAINABLE FUTURE STEERS THE SOLUTIONS PROVIDED TO STAKEHOLDERS. THE NARRATIVE IN THIS SECTION DELINEATES OUR ENDEAVOURS TO MAXIMISE RESOURCES WHILE BEING COGNIZANT OF THE IMPACTS THAT OUR PROCESSES HAVE ON PEOPLE AND THE ENVIRONMENT.
GOING GREENWE PROVIDE SUSTAINABLE ALTERNATIVES FOR OUR CUSTOMERS
WE WORK SMARTER TO CONSERVE RESOURCES AND ENERGY
WE TAKE INTO ACCOUNT HOW OUR WORK AND PROCESSES IMPACT ON PEOPLE AND THE ENVIRONMENT
DRIVING SOLUTIONS FOR A SUSTAINABLE
FUTURE
AEL has utilised its in-house World Class system which comprises seven elements, including health and safety, for a number of years. This system will be retained going forward but it will be supplemented by the implementation of OHSAS 18001, beginning at the company’s Modderfontein operations.
A table providing details of SHE-related accreditations and, for AEL, levels of achievement against the World Class system standards may be found at www.aeci.co.za/pdf/certifications_2015.pdf.
ENVIRONMENTAL PERFORMANCE
ComplianceCertain manufacturing operations at AEL’s Modderfontein site are unable at this time to meet all the minimum emission standards that came into effect on 1 April 2015, in terms of the National Environmental Management: Air Quality Act, No. 39 of 2004, as amended. Accordingly, AEL submitted an application to the regulatory authorities for the postponement of the compliance timeframes so as to allow the company sufficient time to make the necessary commitments of capital required to achieve full compliance.
On 14 December 2015 the Department of Environmental Affairs (“DEA”), accompanied by representatives from the City of Johannesburg, conducted a search and seizure operation at AEL Modderfontein. Subsequent to this AEL was advised by the authorities that consideration of its postponement application will take place after the issues raised as a result of the search and seizure operation have been resolved satisfactorily. Management is cooperating with the DEA and has submitted a response to its allegations, relating to AEL’s compliance with certain conditions of its current emissions licence. Feedback from the DEA’s process is awaited.
The legal environment in which AECI operates is increasingly complex as a result of additional SHE-related legislation in South Africa and the diversity of legislation in countries in the Group’s geographic footprint. AECI’s risk management and compliance approach in this regard will be reviewed in the coming year to ensure that management processes remain appropriate in a changing environment and to prevent the recurrence of environmental compliance shortcomings identified during 2015.
IncidentsThe prevention of incidents detrimental to the environment is an important aspect of AECI’s approach to managing its impact in a REspOnsIBLE manner. Such incidents do occur, though, and are classified and reported internally in line with AECI’s reporting standards and guidelines, available in the Sustainability section of its website. Reporting to external stakeholders in line with the Group’s value of being EnGaGED also takes place, as appropriate, through structures such as Community Awareness and Emergency Response Committees, Stakeholder Forums and Licence Advisory Forums.
It is pleasing to report that no * major or serious environmental incidents occurred in 2015 (one * serious incident in 2014). Of those moderate and minor environmental incidents that did occur during the year, the two most significant were:
THE AECI GROUP, AS A MATTER OF POLICY, IS COMMITTED TO A CLEAN, SAFE AND HEALTHY ENVIRONMENT FOR ITS EMPLOYEES, CONTRACTORS, CUSTOMERS AND SURROUNDING COMMUNITIES.
To fulfil this policy commitment, a set of Safety, Health and Environmental (“SHE”) standards has been agreed to and approved by the Chief Executive. These standards, as stated below, are designed for implementation within AECI’s federal structure. The Chief Executive holds the Managing Director of each AECI business accountable for ensuring that implementation is effected in the business he or she manages. Each Group business must:
› adopt a safety, health and environmental policy that meets the needs of the business;
› hold line management accountable for the implementation of the safety, health and environmental policy;
› develop and maintain appropriate procedures to support the safety, health and environmental policy;
› manage safety, health and environmental risks in a manner that meets all the legal requirements of the countries in which it operates and accepted international criteria;
› be prepared for and deal with any emergency;
› ensure that employees and contractors are trained effectively;
› maintain a record of safety, health and environmental information and meet statutory record-keeping requirements; and
› audit performance against its policy, standards and procedures and report this regularly to the AECI Executive Committee.
On an annual basis each Managing Director submits a Letter of Assurance to the Chief Executive, describing the main SHE-related risks faced by the business and what is being done to manage these, and confirming that the business is in compliance with AECI’s SHE standards. Where such confirmation cannot be given, the level of non-compliance is described and details of the plans in place to achieve compliance are provided.
It is also a requirement for AECI’s businesses and/or operating sites to align their SHE Management Systems with an external standard against which third-party audits may be undertaken. The most commonly adopted such standards are:
› OHSAS 18001 (an internationally applied British health and safety management standard, soon to be replaced by ISO 45001);
› ISO 14001 (an international environmental management standard);
› NOSA 5 star (a South African SHE Management System); and
› Responsible Care. This is the global chemical industry’s voluntary initiative for the continual improvement of performance in safety, health and environmental practices.
* Indicates limited assurance. See page 74.
68
NATURAL CAPITAL
Council for Sustainable Development. Details on the operating and organisational boundaries used to calculate AECI’s carbon footprint are available on its website.
The 15% decrease in total CO2e emissions was due predominantly to a significant reduction in Scope 1 emissions at AEL. Process-related CO2e emissions decreased by 26% year-on-year owing to lower nitrous oxide emissions from the No. 9 Nitric Acid Plant, at Modderfontein. This plant had significantly reduced on-line time.
AECI’s Scope 2 emissions were predominantly from electricity consumption. The Group consumed 207 888 MWh * of electricity (2014: 217 959 MWh *). This 4,6% decrease was the result of lower production at most operations. AECI’s total energy usage was 2 274 443 GJ * (2014: 2 446 673 GJ *).
LAND REMEDIATIONThe guiding principles underlying AECI’s land remediation activities are the protection of human health and the environment and the use of good science, proven concepts and the best available appropriate technologies. Human health and environmental risk assessments are undertaken and these influence subsequent activities. Stakeholder communication in the remediation process is vital and AECI cooperates with regulatory authorities and shares information with interested and affected parties on a regular basis.
Remediation activities in 2015 were mainly at Umbogintwini, as detailed on page 71. A legacy manufacturing site in Johannesburg was also remediated. Since the waste arising from these projects was not the result of ongoing operations it was excluded from the data reported.
A highlight in terms of GOInG GREEn was that the 2015 Mondi Prize for Wetland Stewardship was awarded to AECI’s Paardevlei Properties for its role in successfully rehabilitating a contaminated area at the Group’s former Somerset West site. See page 49.
Details on financial provisions for environmental liabilities are included in note 16 to the annual financial statements.
› six tonnes of nitric acid were spilt at AEL’s Modderfontein manufacturing facility. The spillage was contained on the site and clean-up was effected successfully;
› a third-party contractor’s vehicle tipped over near Mufulira, in Zambia, when the driver attempted to avoid a pothole. The emulsion that spilled from the vehicle was cleaned up successfully and there was no material environmental damage.
Resource efficiencyWater usage by the Group’s operations increased by 2,9% to 3 432 734 m3 *. The majority of this increase took place at ImproChem’s operations as a result of the acquisition of Clariant’s manufacturing facilities.
Hazardous waste generation and disposal increased markedly by 84% to 7 892 tonnes* (2014: 4 296 tonnes *). The main component of this increase was as a result of AEL needing to dispose of large quantities of low concentration sulphuric acid. This waste stream was previously used as a feedstock by a customer whose business closed during the year. The acquisition of Clariant also contributed to increased hazardous waste generation, as did higher production levels at Chemical Initiatives.
Recycled waste arisings were 7,7% lower at 14 815 tonnes (2014: 16 049 tonnes *) thanks largely to the success of a waste reduction project at Industrial Oleochemicals Products’ manufacturing facility in Jacobs, Durban. This is an example of progress being made in line with AECI’s Green Gauge initiative. See the Sustainability section on the AECI website for details on Green Gauge.
Carbon footprintThe term “carbon footprint” is defined as the total greenhouse gas emissions caused directly and indirectly by an individual, organisation, event or product, and is expressed as tonnes of carbon dioxide equivalent (“CO2e”). AECI’s carbon footprint was calculated using the United Nation’s Intergovernmental Panel on Climate Change Guidelines for National Greenhouse Gas Inventories and the Greenhouse Gas Protocol’s Corporate and Accounting and Reporting Standards, as developed by the World Business
CARBON FOOTPRINT TONNES OF CO2e: SCOPE 1 2011 2012 2013 2014 2015 % CHANGE
Explosives 201 499 188 610 226 946 308 080 229 272 (26)
Specialty chemicals 60 335 30 593 26 861 22 724 22 897 1
Property 68 075 62 685 76 015 45 422 44 203 (3)
Total 329 909 * 281 888 * 329 822 * 376 226 * 296 372 * (21)
TONNES OF CO2e: SCOPE 2 2011 2012 2013 2014 2015 % CHANGE
Explosives 76 622 76 277 78 170 74 031 75 714 2
Specialty chemicals 162 632 141 225 124 009 150 721 136 860 (9)
Property 8 315 6 863 7 378 5 713 4 786 (16)
Total 247 569 * 224 365 * 209 557 * 230 465 * 217 360 * (6)
Total (Scopes 1 and 2) 577 478 * 506 253 * 539 379 * 606 691 * 513 732 * (15)
* Indicates limited assurance. See page 74.
69
NATURAL CAPITAL
WATERUSAGEBYBUSINESSSEGMENT:%
54 Explosives
40 Specialty chemicals
6 Property
HAZARDOUSWASTEGENERATIONBYBUSINESSSEGMENT:%
44 Explosives
55 Specialty chemicals
1 Property
RECYCLEDWASTEBYBUSINESSSEGMENT:%
45 Explosives
42 Specialty chemicals
13 Property
WATERUSAGE:m3
15 3 432 734*
14 3 336 099*
13 4 175 710*
12 5 582 606*
11 4 748 170*
HAZARDOUSWASTEGENERATION:TONNESPERYEAR
15 7 892*
14 4 286*
13 5 034*
12 4 753*
11 5 920*
RECYCLEDWASTE:TONNESPERYEAR
15 14 815
14 16 049*
13 13 326*
12 13 597*
11 13 956** Indicates limited assurance. See page 74.
70
NATURAL CAPITAL
CHCs before enhanced in-situ bioremediation (“EISB”) was adopted as the technology of choice. This technology has been implemented through the creation of “biobarrier zones” in the sub-surface, down gradient (in groundwater terms) of the source areas.
The growth of microbes in the biobarrier zones is enhanced through the injection of “food” (in the form of vegetable oil) into the sub-surface. The migrating groundwater passes through these biologically active zones where the dissolved CHC constituents are remediated through microbial activity — the microbes “breathe” the chemicals, thereby facilitating degradation.
The EISB programme commenced in 2007 and has been rolled out progressively in two areas at Umbogintwini. Progress has been such that this biotechnological solution has replaced other more conventional, medium-term remediation initiatives such as the pumping and treatment of groundwater. The large-scale oil injection currently underway is the final step towards the creation of two full-scale, functional biobarriers.
A number of previously contaminated areas at Umbogintwini have already been remediated successfully. Some of these remain under management control and have been incorporated into suitable land use initiatives that include green belt zones and conservation areas, while others have become suitable for industrial re-use.
Although the management of residual impacts due to a long history of chemical manufacturing activities at this historical AECI site is challenging, international and local peer reviews have confirmed that AECI is applying the correct mix of available remediation technologies to progressively reduce its environmental footprint over time.
Umbogintwini remediation updateChemical manufacturing activities at this site commenced more than 100 years ago. Global awareness of the environmental impacts associated with chemical waste storage and management only developed much later and, by then, soil and groundwater had been impacted significantly. The progressive reduction of these impacts, coupled with the protection of off-site environments, has been the main driver of AECI’s InnOvatIvE and award-winning remediation programme over more than 20 years.
Remedial activities are governed by the Umbogintwini’s Remediation Strategy (“the Strategy”) and Action Plan which is overseen by the Department of Environmental Affairs and the Department of Water and Sanitation, in terms of the National Environmental Management: Waste Act, No. 58 of 2008, as amended. The prioritisation of remedial activities is risk-based. The Strategy is updated annually to reflect (among others) successfully implemented remedial interventions, the findings of scientific investigations, research into technological advances, legislative requirements, the requirements of authorities and those of interested and affected parties.
Chlorinated hydro-carbons (“CHCs”) are one of the chemical groups that remain persistent in groundwater. CHCs are recognised worldwide as being extremely recalcitrant with respect to remediation. The successful removal of these chemicals from groundwater requires the implementation of InnOvatIvE science and international best practice over a timeframe that could span decades.
Numerous scientific studies, including international reviews, were performed to evaluate the most appropriate remedial approach for
TREATED GROUNDWATER
OIL INJECTION POINTS
GROUNDWATER MOVEMENT
SOURCEAREA
71
NATURAL CAPITAL
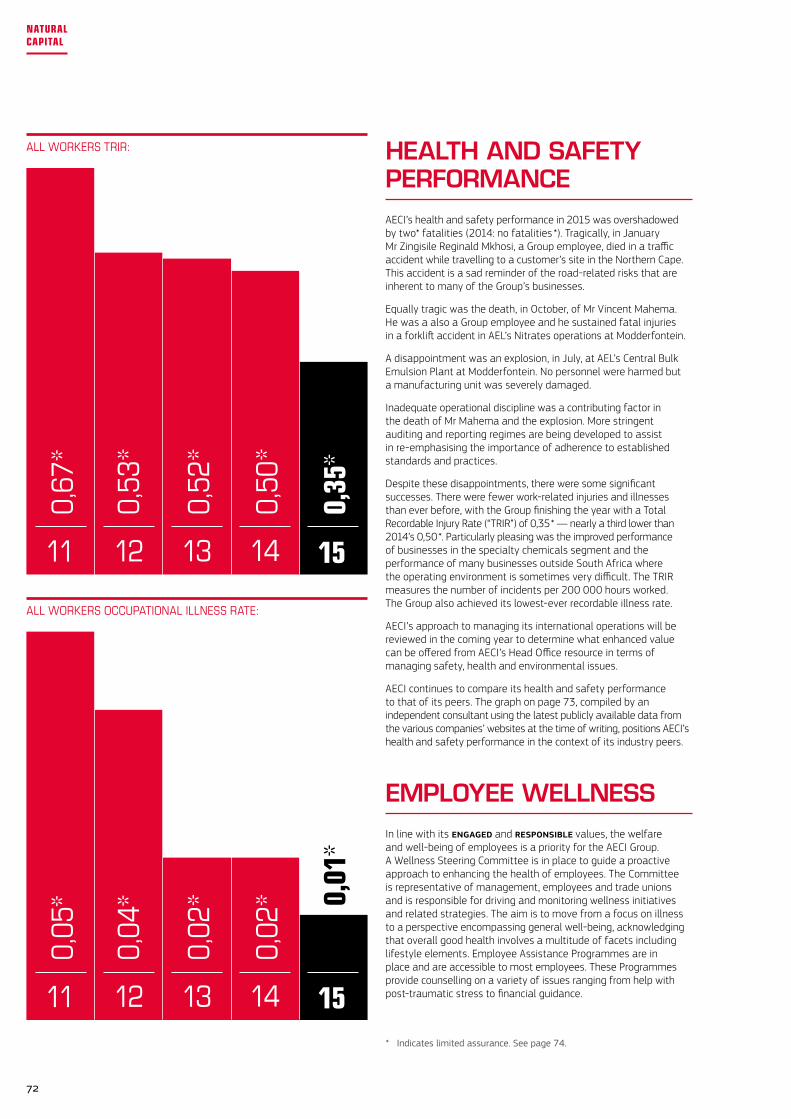
ALLWORKERSTRIR:
ALLWORKERSOCCUPATIONALILLNESSRATE:
HEALTH AND SAFETY PERFORMANCEAECI’s health and safety performance in 2015 was overshadowed by two* fatalities (2014: no fatalities *). Tragically, in January Mr Zingisile Reginald Mkhosi, a Group employee, died in a traffic accident while travelling to a customer’s site in the Northern Cape. This accident is a sad reminder of the road-related risks that are inherent to many of the Group’s businesses.
Equally tragic was the death, in October, of Mr Vincent Mahema. He was a also a Group employee and he sustained fatal injuries in a forklift accident in AEL’s Nitrates operations at Modderfontein.
A disappointment was an explosion, in July, at AEL’s Central Bulk Emulsion Plant at Modderfontein. No personnel were harmed but a manufacturing unit was severely damaged.
Inadequate operational discipline was a contributing factor in the death of Mr Mahema and the explosion. More stringent auditing and reporting regimes are being developed to assist in re-emphasising the importance of adherence to established standards and practices.
Despite these disappointments, there were some significant successes. There were fewer work-related injuries and illnesses than ever before, with the Group finishing the year with a Total Recordable Injury Rate (“TRIR”) of 0,35 * — nearly a third lower than 2014’s 0,50 *. Particularly pleasing was the improved performance of businesses in the specialty chemicals segment and the performance of many businesses outside South Africa where the operating environment is sometimes very difficult. The TRIR measures the number of incidents per 200 000 hours worked. The Group also achieved its lowest-ever recordable illness rate.
AECI’s approach to managing its international operations will be reviewed in the coming year to determine what enhanced value can be offered from AECI’s Head Office resource in terms of managing safety, health and environmental issues.
AECI continues to compare its health and safety performance to that of its peers. The graph on page 73, compiled by an independent consultant using the latest publicly available data from the various companies’ websites at the time of writing, positions AECI’s health and safety performance in the context of its industry peers.
EMPLOYEE WELLNESSIn line with its EnGaGED and REspOnsIBLE values, the welfare and well-being of employees is a priority for the AECI Group. A Wellness Steering Committee is in place to guide a proactive approach to enhancing the health of employees. The Committee is representative of management, employees and trade unions and is responsible for driving and monitoring wellness initiatives and related strategies. The aim is to move from a focus on illness to a perspective encompassing general well-being, acknowledging that overall good health involves a multitude of facets including lifestyle elements. Employee Assistance Programmes are in place and are accessible to most employees. These Programmes provide counselling on a variety of issues ranging from help with post-traumatic stress to financial guidance.
15
0,35
*
14
0,50
*
13
0,52
*
12
0,53
*
11
0,67
*
15
0,01
*
14
0,02
*
13
0,02
*
12
0,04
*
11
0,05
*
* Indicates limited assurance. See page 74.
72
NATURAL CAPITAL
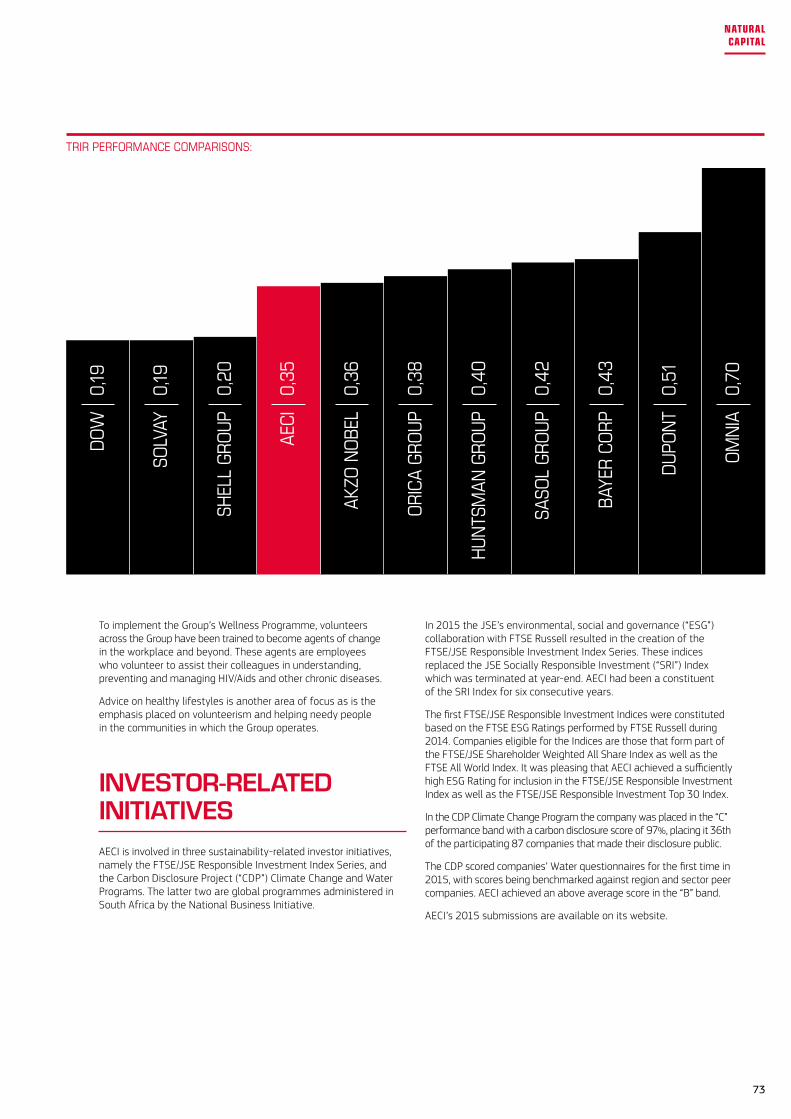
In 2015 the JSE’s environmental, social and governance (“ESG”) collaboration with FTSE Russell resulted in the creation of the FTSE/JSE Responsible Investment Index Series. These indices replaced the JSE Socially Responsible Investment (“SRI”) Index which was terminated at year-end. AECI had been a constituent of the SRI Index for six consecutive years.
The first FTSE/JSE Responsible Investment Indices were constituted based on the FTSE ESG Ratings performed by FTSE Russell during 2014. Companies eligible for the Indices are those that form part of the FTSE/JSE Shareholder Weighted All Share Index as well as the FTSE All World Index. It was pleasing that AECI achieved a sufficiently high ESG Rating for inclusion in the FTSE/JSE Responsible Investment Index as well as the FTSE/JSE Responsible Investment Top 30 Index.
In the CDP Climate Change Program the company was placed in the “C” performance band with a carbon disclosure score of 97%, placing it 36th of the participating 87 companies that made their disclosure public.
The CDP scored companies’ Water questionnaires for the first time in 2015, with scores being benchmarked against region and sector peer companies. AECI achieved an above average score in the “B” band.
AECI’s 2015 submissions are available on its website.
To implement the Group’s Wellness Programme, volunteers across the Group have been trained to become agents of change in the workplace and beyond. These agents are employees who volunteer to assist their colleagues in understanding, preventing and managing HIV/Aids and other chronic diseases.
Advice on healthy lifestyles is another area of focus as is the emphasis placed on volunteerism and helping needy people in the communities in which the Group operates.
INVESTOR-RELATED INITIATIVESAECI is involved in three sustainability-related investor initiatives, namely the FTSE/JSE Responsible Investment Index Series, and the Carbon Disclosure Project (“CDP”) Climate Change and Water Programs. The latter two are global programmes administered in South Africa by the National Business Initiative.
0,19
DO
W
SOLV
AY0,
19
SHEL
L GR
OUP
0,20
AECI
0,35
AKZO
NO
BEL
0,36
ORI
CA G
ROUP
0,38
HUN
TSM
AN G
ROUP
0,40
SASO
L GR
OUP
0,42
BAYE
R C
ORP
0,43
DUP
ON
T0,
51
OM
NIA
0,70
TRIRPERFORMANCECOMPARISONS:
73
NATURAL CAPITAL
DIRECTORS’ RESPONSIBILITIESThe Directors are responsible for the selection, preparation and presentation of the selected KPIs in accordance with the accompanying AECI reporting criteria. This responsibility includes the identification of stakeholders and stakeholder requirements, material issues, for commitments with respect to sustainability performance and for the design, implementation and maintenance of internal control relevant to the preparation of the report that is free from material misstatement, whether due to fraud or error.
OUR INDEPENDENCE AND QUALITY CONTROLWe have complied with the independence and all other ethical requirements of the Code of Ethics for Professional Accountants issued by the International Ethics Standards Board for Accountants, which is founded on fundamental principles of integrity, objectivity, professional competence and due care, confidentiality and professional behaviour.
KPMG Services (Pty) Ltd applies the International Standard on Quality Control 1 and accordingly maintains a comprehensive system of quality control, including documented policies and procedures regarding compliance with ethical requirements, professional standards and applicable legal and regulatory requirements.
OUR RESPONSIBILITYOur responsibility is to express limited assurance conclusions on the selected KPIs based on the procedures we have performed and the evidence we have obtained. We conducted our limited assurance engagement in accordance with the International Standard on Assurance Engagements (“ISAE”) 3000 (revised), Assurance Engagements other than Audits or Reviews of Historical Financial Information, issued by the International Auditing and Assurance Standards Board. That Standard requires that we plan and perform our engagement to obtain limited assurance about whether the selected KPIs are free from material misstatement.
A limited assurance engagement undertaken in accordance with ISAE 3000 (revised) involves assessing the suitability in the circumstances of AECI’s use of its reporting criteria guidelines as the basis of preparation for the selected KPIs, assessing the risks of material misstatement of the selected KPIs whether due to fraud or error, responding to the assessed risks as necessary in the circumstances, and evaluating the overall presentation of the selected KPIs. A limited assurance engagement is substantially less in scope than a reasonable assurance engagement in relation to both risk assessment procedures, including an understanding of internal control, and the procedures performed in response to the assessed risks.
TO THE DIRECTORS OF AECI LIMITEDWe have undertaken a limited assurance engagement on selected key performance indicators (“KPIs”), as described below, and presented in the Human Capital report and the Natural Capital report included in the 2015 integrated report to stakeholders of AECI Ltd (“AECI”) for the year ended 31 December 2015 (“the report”). This engagement was conducted by a multidisciplinary team of health, safety, environmental and assurance specialists with extensive experience in sustainability reporting.
SUBJECT MATTERWe are required to provide limited assurance on the following KPIs, marked with a * on the relevant pages in the report. The selected KPIs described below have been prepared in accordance with AECI’s reporting criteria that accompany the performance information as presented in the relevant pages of the report (“the accompanying AECI reporting criteria”).
› Employment Equity indicators (expressed as the total number of people for each category) — Black males, Black females, White males and White females per category of Top Management, Senior Management, Middle Management and Professionals, Junior Management and Skilled, Semi-skilled and Discretionary Decision-making, and Unskilled and Defined Decision-making (page 59).
› Environmental indicators — total water usage (page 69), hazardous waste generation (page 69), total electricity usage (page 69), total energy usage (page 69), carbon footprint — Scope 1, Scope 2 and total of Scopes 1 and 2 (page 69), and number of environmental incidents (total major and serious) (page 68).
› Health and safety indicators — Total Recordable Incident Rate (employees and contractors combined) (page 72), occupational illness rate (employees and contractors combined) (page 72), and fatalities (employees and contractors combined) (page 72).
74
INDEPENDENT ASSURANCE REPORT ON SELECTED SUSTAINABILITY INFORMATION
OTHER MATTERSThe maintenance and integrity of AECI’s website is the responsibility of the Company’s management. Our procedures did not involve consideration of these matters and, accordingly, we accept no responsibility for any changes to either the information in the report or our independent limited assurance report that may have occurred since the initial presentation on AECI’s website.
RESTRICTION OF LIABILITYOur work has been undertaken to enable us to express a limited assurance conclusion on the selected KPIs to the Directors of AECI, in accordance with the terms of our engagement, and for no other purpose. We do not accept or assume liability to any party other than AECI for our work, for this report, or for the conclusions we have reached.
KPMG Services (Pty) Ltd
Per PD Naidoo Director
Johannesburg 11 April 2016
85 Empire Road, Parktown Johannesburg, 2193
The procedures we performed were based on our professional judgement and included enquiries, observation of processes followed, inspection of documents, analytical procedures, evaluating the appropriateness of quantification methods and reporting policies, and agreeing or reconciling with underlying records.
Given the circumstances of the engagement, in performing the procedures listed above we:
› interviewed members of the AECI Executive Committee and Senior Managers to obtain an understanding of the internal control environment, risk assessment process and information systems relevant to the sustainability reporting process;
› inspected documentation to corroborate the statements of members of the AECI Executive Committee and Senior Managers in our interviews;
› tested the processes and systems to generate, collate, aggregate, monitor and report the selected KPIs;
› inspected supporting documentation and performed analytical procedures on a sample basis to evaluate the data generation and reporting processes against the reporting criteria;
› assessed the reasonableness and appropriateness of significant estimates and judgements made by the Directors in preparing the KPIs;
› undertook site visits to AEL (Modderfontein, Coal and Nitrates in South Africa, and Zambia); Acacia Operations Services (Umbogintwini), Chemical Initiatives (Umbogintwini), ImproChem (Umbogintwini), Senmin (Sasolburg) and Specialty Minerals SA (Durban). In addition, desktop reviews were performed for AEL’s sites in Egypt and Indonesia and for Industrial Oleochemical Products in Jacobs, Durban; and
› evaluated whether the selected KPIs presented in the report are consistent with our overall knowledge and experience of sustainability management and performance at AECI.
The procedures performed in a limited assurance engagement vary in nature from, and are less in extent than for, a reasonable assurance engagement. As a result the level of assurance obtained in a limited assurance engagement is substantially lower than the assurance that would have been obtained had we performed a reasonable assurance engagement. Accordingly, we do not express a reasonable assurance opinion about whether AECI’s selected KPIs have been prepared, in all material respects, in accordance with the accompanying AECI reporting criteria.
LIMITED ASSURANCE CONCLUSIONSBased on the procedures we have performed and the evidence we have obtained, nothing has come to our attention that causes us to believe that the selected KPIs as set out in the subject matter paragraph for the year ended 31 December 2015 have not been prepared, in all material respects, in accordance with the accompanying AECI reporting criteria.
75
INDEPENDENT ASSURANCE REPORT ON SELECTED
SUSTAINABILITY INFORMATION

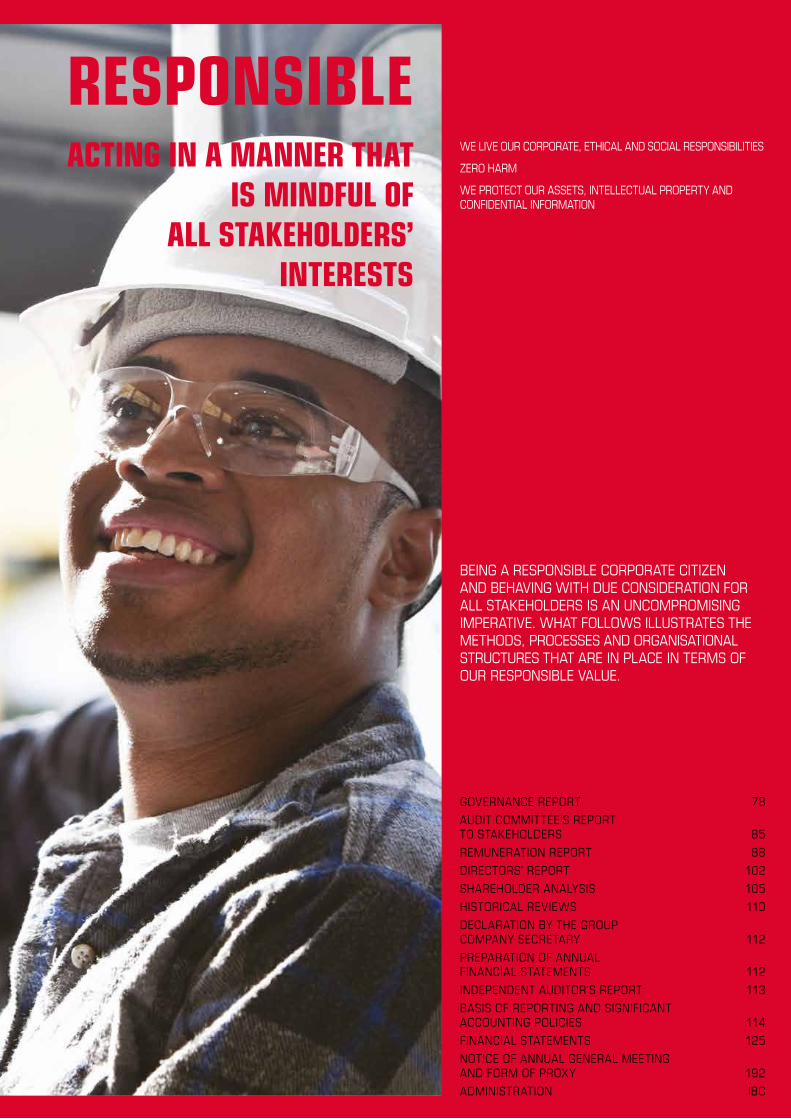
GOVERNANCE REPORT 78
AUDIT COMMITTEE’S REPORT TO STAKEHOLDERS 85
REMUNERATION REPORT 88
DIRECTORS’ REPORT 102
SHAREHOLDER ANALYSIS 105
HISTORICAL REVIEWS 110
DECLARATION BY THE GROUP COMPANY SECRETARY 112
PREPARATION OF ANNUAL FINANCIAL STATEMENTS 112
INDEPENDENT AUDITOR’S REPORT 113
BASIS OF REPORTING AND SIGNIFICANT ACCOUNTING POLICIES 114
FINANCIAL STATEMENTS 125
NOTICE OF ANNUAL GENERAL MEETING AND FORM OF PROXY 192
ADMINISTRATION IBC
BEING A RESPONSIBLE CORPORATE CITIZEN AND BEHAVING WITH DUE CONSIDERATION FOR ALL STAKEHOLDERS IS AN UNCOMPROMISING IMPERATIVE. WHAT FOLLOWS ILLUSTRATES THE METHODS, PROCESSES AND ORGANISATIONAL STRUCTURES THAT ARE IN PLACE IN TERMS OF OUR RESPONSIBLE VALUE.
RESPONSIBLEWE LIVE OUR CORPORATE, ETHICAL AND SOCIAL RESPONSIBILITIES
ZERO HARM
WE PROTECT OUR ASSETS, INTELLECTUAL PROPERTY AND CONFIDENTIAL INFORMATION
ACTING IN A MANNER THAT IS MINDFUL OF
ALL STAKEHOLDERS’ INTERESTS
In October 2015 Tak Hiemstra resigned as a Non-executive Director of the Board. Graham Dempster was appointed in the same capacity with effect from 31 January 2016. Khotso Mokhele was also appointed as a Non-executive Director, with effect from 1 March 2016. These appointments were made after a rigorous search for individuals with the appropriate skills, talent and diversity.
Rotation, tenure and successionNon-executive Directors may generally serve for up to nine years, subject to retirement and re-election by rotation as set out in the Company’s MOI. Extensions of this period may be granted, provided the Nominations Committee remains satisfied that the Director’s independence has not been compromised. In terms of the MOI Executive Directors are also subject to retirement and re-election by rotation. One-third of the Executive and Non-executive Directors must retire by rotation at each AGM.
In 2014 the Board conducted an independence review of its longest-serving Non-executive Directors. Although the Board was satisfied with the outcome, which confirmed that these Directors remain Independent in thought and conduct, it was agreed that this process should be used as an opportunity to develop a succession plan for Board members going forward. Accordingly, such a plan was deliberated in 2015.
Terms of employment of DirectorsExecutive Directors are employees of the Company and have standard terms and conditions of employment. They do not receive any special remuneration or other benefits for their additional duties as Directors. The Board, through its Nominations Committee, has engaged with the two Executive Directors to review their employment contracts and to change their notice periods from one month to six months. The Board views this as a risk mitigation measure to avoid any potential leadership vacuum at management level.
The Board, on the recommendation of the Remuneration Committee, determines the remuneration of Executive Directors, Executive Committee members and other Senior Managers as underpinned by the remuneration philosophy of the Company. None of the Non-executive Directors are Company employees. Non-executive Directors’ remuneration is arrived at after an annual benchmarking exercise performed by the Executive Directors and the approval by shareholders of the proposed fees, on the Board’s recommendation.
Directors’ management of conflict of interestsAECI has a Conflict of Interests policy (embedded in the Group’s Code of Ethics and Business Conduct) which provides guidance and procedures for Directors on managing and dealing with potential conflict of interests situations. The same policy applies to all Group employees. The Group Company Secretary is charged with maintaining a comprehensive register of Directors’ declarations of interests and this is submitted for updating by the Directors before each Board meeting. In 2015 all Directors duly completed and updated this register.
THE AECI BOARD PLAYS A PIVOTAL ROLE IN DEFINING THE GROUP’S GOVERNANCE CLIMATE AND FRAMEWORK, GEARED TOWARDS DELIVERING SUSTAINABLE GROWTH IN THE INTERESTS OF ALL STAKEHOLDERS. IN THE YEAR UNDER REVIEW THE COMPANY CONTINUED TO REFINE AND ARTICULATE ITS GROWTH STRATEGY AS WELL AS THE EXPECTED STANDARDS OF BUSINESS INTEGRITY AND ETHICS THROUGH THE REVIEW AND RELAUNCH OF THE GROUP’S BIGGER VALUES.
Further improvements were effected, as required, to enable enhanced standards of compliance with King III, the Companies Act, the JSE Listings Requirements and other applicable laws and regulations. The Board agreed to redefine AECI’s governance framework in terms of the roles and responsibilities of the Company’s Board and those of the Boards of its subsidiaries. The objective is to ensure optimal alignment with the Group’s portfolio management operating model. This work will be completed in 2016.
A summary of adherence to King III appears from page 83.
THE BOARD OF DIRECTORS
Structure and composition of the BoardAECI has a unitary Board structure led by an Independent Non-executive Chairman, nine other Independent Non-executive Directors and two Executive Directors. The Board Charter as well as the terms of reference of the Nominations Committee detail the procedures for appointments to the Board. Such appointments are formal and transparent and a matter for the Board as a whole. Non-executive Directors are appointed on the basis of their skills and expertise appropriate to the strategic direction of the Company. Diversity, race and gender are also taken into account when appointments are made and the Board, through its Nominations Committee, ensures that it has the right balance of skills, expertise and experience.
Summarised biographical details of the Directors are provided on pages 16 to 18. The Board operates in terms of a Board charter which was revised in 2014. A copy of this and of the terms of reference of all Board Committees can be found via the website link www.aeci.co.za/gov_policy.php. The role of the Board is to exercise leadership, integrity and sound judgement in the business and to provide strategic direction to the Company, with a keen understanding of key risks, and to continually monitor performance against set objectives.
78
GOVERNANCE REPORT
Board meetingsThe Board met five times in the year, including a session to discuss the development of Company strategy. Meeting dates for the Board and its Committees, and details of attendance, are available via the link www.aeci.co.za/pdf/2015_board_meetings.pdf. As is customary, the Chief Executive and the Chief Financial Officer kept the Board up-to-date on specific and urgent matters that could not be deferred until the next formal Board meeting.
It has become Board practice for the Non-executive Directors to meet before the start of Board meetings, without the Executive Directors being present, so as to raise matters of interest or concern. The Chairman of the Board is charged with the responsibility of conveying any related discussions to the Executive Directors, as warranted.
The Chairman of the Board, assisted by the Chief Executive and the Group Company Secretary, is responsible for setting the agenda for each Board meeting. The full Board has the opportunity to provide input. Board meetings are scheduled well in advance and the Group Company Secretary ensures that all Directors are provided with the information required timeously to enable them to prepare for meetings and formulate their views on matters.
Board CommitteesThe Board has established a number of Committees to assist it in fulfilling its duties and objectives. In addition, ad hoc Committees are established from time to time if circumstances so warrant to assist the Board with specific material issues or projects.
The restructuring of AECI’s defined-benefit pension funds to a defined-contribution fund is a case in point. The Board formed a sub-Committee of two Independent Non-executive Directors to consider and guide this process, which commenced in 2013.
The role and responsibility of each Committee is set out in its formalised and Board-approved terms of reference. Reviews of the terms for the Audit, Nominations and Remuneration Committees were finalised and approved by the Board in 2014. The review of the terms of reference for the Risk and Social and Ethics Committees was deferred to 2016.
Board Committees usually meet before each Board meeting and the Chairmen table at the Board meeting a report of their Committees’ proceedings. The minutes of each Committee meeting are also included in the full Board information pack.
All Committees are satisfied that in 2015 they carried out their responsibilities in compliance with their mandate and terms of reference.
Audit CommitteeThe Audit Committee in 2015 was comprised of four Independent Non-executive Directors. Tak Hiemstra also served on the Committee until his resignation from the Board in October. Graham Dempster was appointed as an additional member in February 2016. The Committee’s statutory duties are set out in the Companies Act.
Both the internal and external auditors have unrestricted access to the Chairman of the Committee and it is standard operating procedure for them to meet privately with the Committee.
The Chairman of the Board, the Chief Executive, the Chief Financial Officer and the external and internal auditors attend meetings of the Committee by invitation.
No conflict of interests or recusals from Board discussions and deliberations were noted in relation to any proposed transaction other than for matters pertaining to the de-risking of the Company’s post-retirement obligations. The Chairman and the two Executive Directors, as related parties, continued to recuse themselves from any decision-making in this regard and this project was driven by an ad hoc Committee of non-conflicted Non-executive Directors, with leadership and support from the full Board. This was recorded in the Board minutes, which are available for inspection by the Company’s external auditors.
Induction and ongoing development of DirectorsThe Company’s Directors have expertise and experience in diverse industries including banking, chemicals, mining, technical, accounting and strategic matters. Upon appointment, all new Directors undergo a Group-specific induction programme which includes a number of one-on-one meetings with Senior Managers and the Managing Directors of subsidiaries. The Company intends continuing with the practice of inducting the newly-appointed Board members in 2016. As always, this will be done with the specific intent of developing these Directors’ full appreciation and understanding of the complex nature of the Group’s businesses.
As in the past, the Board was invited to participate in visits to Group businesses. See the Chairman’s letter to stakeholders on page 26 in this regard.
With regard to formal training the Group Company Secretary is charged with sourcing and organising relevant training for Board members, based largely on the specific needs of each Director.
Board and Committee performance evaluationThe Board agreed to focus on implementing the corrective actions outlined in the 2014 Board evaluation process as well as the outcome of the Directors’ independence evaluation. It is anticipated that implementation of these corrective actions will result in a stronger, more cohesive and effective Board well able to meet the ever-growing challenges posed by the macro environment. The Board focused on improvements suggested by the evaluation in the areas of Board and management succession planning as well as the pace of transformation in the Group. The Board was satisfied with progress made in the year.
Board relationships with staff and external advisorsTo the extent that they may require such access to make informed decisions, Board members have unrestricted access to the Company’s records, information, documents and property. They also have unrestricted access to Senior Managers, the internal auditors and the external auditors to consult on any aspect of the Company’s operations. Furthermore Board members may collectively or individually, at the expense of the Company, consult external professional advisors on any matter of concern to themselves or the Company after having advised the Chief Executive or Chairman.
79
GOVERNANCE REPORT
In 2015 the Committee continued to focus on ensuring that AECI has robust management processes for issues pertaining to workplace transformation, Employment Equity, safety, health, the environment, and ethics-related matters. The Committee met four times in the year. Members of the Committee are:
› Z Fuphe (Chairman)
› GJ Cundill ∞
› MA Dytor
› MVK Matshitse *
› AJ Morgan
› R Ramashia
Ms Fuphe has been a member of the Committee since 2008 (and Chairman since 2013), Mr Morgan and Adv Ramashia have been members since 2010, Mr Cundill and Ms Matshitse since 2012 and Mr Dytor since 2013.
∞ Group Technical and Safety, Health and Environment Manager.* Human Capital Executive and member of the Executive Committee.
Remuneration CommitteeThe Remuneration Committee is comprised of four Independent Non-executive Directors and its mandate is inter alia to ensure that the Company’s remuneration policy and practices are aligned with Group strategy and that remuneration is dependent on the achievement of performance indicators. The Committee also ensures that human capital polices are in line with best practice and are adhered to.
The Chief Executive and the Chief Financial Officer attend by invitation, when necessary, to discuss the remuneration of Executive Committee members and Senior Managers and to contribute to other discussions as warranted. No attendee participates in any discussion relating to his/her own remuneration. The Committee met six times in 2015.
A key issue that the Committee continued to engage in was the conversion of the Group’s pension funds from defined-benefit to a defined-contribution scheme, and all related decision-making was led by the specially convened sub-Committee led by the Chairman of the Remuneration Committee. The Committee also focused on approving Executive Committee members’ KPIs, the assessment of Executive Committee members’ and Senior Managers’ performance against their KPIs, and a review of short-term incentives for individuals at these levels. Members of the Committee are:
› RMW Dunne (Chairman)
› S Engelbrecht
› LM Nyhonyha
› R Ramashia
Mr Dunne has been a member of the Committee since 2007 (and Chairman since 2009), Mr Engelbrecht since 2009, Mr Nyhonyha since 2012 and Adv Ramashia was appointed on 1 June 2015.
Nominations CommitteeThe Nominations Committee is comprised of four Independent Non-executive Directors and is chaired by the Chairman of the Board. The Committee’s mandate includes reviewing the composition of the Board as well as the performance of the Board, its Committees and individual Directors, the appointment and reappointment of Executive Directors, and succession planning, particularly for the Chairman and the Chief Executive. The Committee met four times in 2015.
A summary of the Audit Committee’s work in 2015 is published in its Report to stakeholders on page 85. Members of the Committee are:
› RMW Dunne (Chairman)
› GW Dempster
› G Gomwe
› AJ Morgan
› LM Nyhonyha
Mr Dunne has been a member of the Committee since 2007 (and Chairman since 2014), Mr Nyhonyha since 2006, Mr Morgan since 2010, Mr Gomwe was appointed on 1 June 2015 and Mr Dempster was appointed on 22 February 2016.
Risk CommitteeThe Risk Committee is comprised of four Independent Non-executive Directors and four Executive Committee members, including the two Executive Directors. The Committee met three times in the year.
The Risk Committee’s mandate includes reviewing and assessing risk and compliance management processes. The management of safety, health and environmental matters is part of this.
In 2015 the Committee continued to review the Group’s risk registers and oversaw the embedding of Business Continuity Management to enable a coordinated crisis management plan. Initiatives to implement better IT governance processes were a key focus in the year. The Committee also conducted a peer review of its compliance and risk management processes and practices. Members of the Committee are:
› AJ Morgan (Chairman)
› RMW Dunne
› MA Dytor † *
› KM Kathan † *
› EE Ludick *
› MVK Matshitse *
› LL Mda
› R Ramashia
Mr Morgan has served as a member and Chairman of the Committee since 2010, Messrs Dytor, Kathan and Ludick and Adv Ramashia have been members since 2010, Ms Mda since 2011 and Ms Matshitse since 2012.
† Executive Director.* Member of the Executive Committee.
Social and Ethics CommitteeThe Social and Ethics Committee is comprised of three Independent Non-executive Directors, the Chief Executive, the Human Capital Executive and the Group Technical and Safety, Health and Environment Manager. The Chief Financial Officer attends by invitation.
80
GOVERNANCE REPORT
The Group Company Secretary is not a Director of the Company or any of its subsidiaries and, accordingly, maintains an arm’s length relationship with the Board and its Directors.
Fulfilment of Board responsibilities
Accountability and internal controlThe Directors are required in terms of the Companies Act and the JSE Listings Requirements to prepare annual financial statements which fairly present the state of affairs of the and the Group as at the end of the financial year and of the profit or loss for that period in conformity with IFRS. The external auditors are responsible for auditing the financial statements of the Company and its subsidiaries and for expressing their opinion on these statements to shareholders. In addition, the external auditors are responsible for confirming whether the financial statements meet the requirements of the Companies Act and IFRS. In 2015, the external auditors also carried out certain pre-agreed procedures pertaining to the Group’s half-year results to 30 June.
Following discussions with the external auditors the Directors consider that, in preparing the financial statements, the Company has consistently used appropriate accounting policies supported by reasonable and prudent judgement and estimates. All applicable international financial reporting standards have been followed.
The Directors have formally reviewed the budgets and forecasts of the businesses and have concluded that the Group will continue in business for the foreseeable future. They also conducted liquidity tests as required by the Companies Act. Accordingly, the going-concern basis of accounting remains appropriate.
COMPLIANCE
African and international operationsThe AECI Group operates in more than 20 countries, in Africa and elsewhere. The increasing complexity of the regulatory environment in individual countries is the principal challenge to achieving full compliance in all operations in all these countries.
For the reporting period the focus was on finalising the project initiated in 2014 to scope regulatory compliance requirements in the Group’s countries of operations. Although progress was made, in 2016 attention will shift to reviewing and agreeing the approach to ensure compliance with diverse compliance frameworks.
The Committee identified new Independent Non-executive Directors for appointment. Accordingly Graham Dempster and Khotso Mokhele were appointed, both after the year-end. Members of the Committee are:
› S Engelbrecht (Chairman)
› RMW Dunne
› LM Nyhonyha
› R Ramashia
Mr Engelbrecht has been a member of the Committee since 2009 (and Chairman since 2012), Mr Dunne since 2007, Mr Nyhonyha since 2012 and Adv Ramashia was appointed on 1 June 2015.
Executive CommitteeThe Board has delegated the day-to-day running of the Company to the Chief Executive who works with an Executive Committee to assist him in this task. The Executive Committee is the highest executive decision-making structure in the Group and central to its role is the formulation and implementation of the Group’s strategy and policy direction, and ensuring that all business activities are aligned in this respect.
Group businesses operate in a decentralised framework, defined internally as “freedom supported by a framework”. The framework is established for the Group by the parent company and addresses policies, standards and processes in the areas of legal compliance and governance, financial control and risk management, strategic direction and remit, and safety, health and the environment. Within this framework, businesses pursue their individual InnOvatIvE product and service offerings. Most Group businesses have their own Boards and management structures and decision-making is in line with the provisions of the Group’s Delegation of Authority which was reviewed and approved in 2014.
Group Company SecretaryThe Group Company Secretary oversees the portfolio of secretariat, legal services, risk and compliance management, and attends all Board and Committee meetings as secretary.
The Board as a whole and individual Directors have access to the Group Company Secretary who provides guidance on how they should discharge their duties and responsibilities in the best interests of the Company. In 2015 the Group Company Secretary oversaw the ongoing education and training of the Company’s Directors through the inclusion of topical papers, articles and opinions in their information packs and continued to assist the Board and its Committees in preparing annual plans, agendas, minutes, and terms of reference as warranted.
In line with the JSE Listings Requirements the Board, through its Nominations Committee, undertook the annual performance appraisal of the Group Company Secretary. The assessment reviewed the performance of the incumbent, taking into account the quality of support received and guidance provided to the Board and management during the year. All parties were satisfied with the quality of support received as well as the competency and experience demonstrated by the incumbent. An abridged biography of the Group Company Secretary is published on page 21.
81
GOVERNANCE REPORT
DEALING IN SECURITIESIn accordance with the JSE Listings Requirements, AECI has adopted a trading in securities policy in terms of which there is a “closed period” that endures from the end of the financial reporting period until the publication of financial results for that period. Additional closed periods may be declared from time to time if circumstances so warrant.
During closed periods Directors, Prescribed Officers and other designated employees are prohibited from dealing in the Company’s securities, either directly or indirectly. Identified employees are advised to this effect. The Group Company Secretary advises the Directors of all the closed periods.
Dealings in securities by Directors and Prescribed Officers of the Company require prior approval by the Chairman or the Chief Executive, depending on the person dealing. Share dealings by Directors, Prescribed Officers of the Company as well as those by Directors of major subsidiaries are notified to the JSE for publication via the Johannesburg Stock Exchange News Service (“SENS”).
The Group has in place an Information Disclosure and Communications policy designed to record AECI’s procedures with regard to communicating with the media, the investment community, securities professionals and other stakeholders to avoid the selective disclosure of material information and govern the disclosure of price-sensitive information to the public in a broad, comprehensive and lawful manner. This policy has been brought to the attention of all employees and must be adhered to by them.
Directors’ and Prescribed Officers’ liability insuranceThe Company has in place Directors’ and Prescribed Officers’ liability insurance which provides some cover against legal action by third parties.
Investor relations and shareholder communicationThe Company’s Chief Executive, Chief Financial Officer and members of the Executive Committee conduct timely presentations on the Group’s performance and strategy to financiers, institutional investors, financial analysts and the media in South Africa.
Presentations, corporate actions and reports on performance, as well as any other information deemed relevant, are published on the Company’s website. Shareholders and other stakeholders are advised of such newly-published items via SENS. Other information on the Company, such as inter alia its management team and history, is also available on the website.
The Company publishes and reports on details of its corporate actions and performance, including its half- and full-year financial results, in print and electronic media as specified by the JSE Listings Requirements from time to time. AECI’s Corporate Communications function maintains regular contact with the media by disseminating relevant information.
All Non-executive Directors are invited to attend the Company’s financial and business-specific presentations.
ETHICAL BUSINESS CONDUCT
TransparencyGlobalisation continues to draw governments, business, civil society and individual citizens into tighter interconnectedness and interdependence. As a result a company’s actions and its interaction with its stakeholders, both internal and external, are potentially more significant than ever before. AECI is no exception and the need to balance diverse stakeholders’ needs shapes the way the Group conducts its business. In an environment of increasingly empowered communities and individuals, social activism and a trust deficit, transparency and accountability are non-negotiable.
Cultivating an ethical cultureAn ethical culture is key to driving long-term business value and stakeholders’ support of businesses. To embed such a culture more strongly, training on AECI’s Code of Ethics and Business Conduct (“the Code”) continued across the Group. A copy of the Code is available at www.aeci.co.za/gov_policy.php.
Efforts to entrench the principles of the Code further included the clarification of the Group’s values and behaviours, in alignment with the principles set out in the Code.
Ethical risks identified and whistle-blowingOwing to the difficult prevailing economic climate, the Board is mindful that ethics-related risks like conflict of interests, bribery and corruption should remain focus areas. The Group’s ethical risk mitigation processes include a whistle-blowing service, management reports and the like. Education and communication relevant to these risks are a cornerstone of preventative processes.
REGULATORY INTERACTIONThe investigation process undertaken by the Competition Commission of South Africa (“the Commission”), reported in 2014, was completed in the first quarter of 2015 the Company awaits the Commission’s ruling in this regard.
On 14 December 2015 the Department of Environmental Affairs, jointly with representatives from the City of Johannesburg, conducted a search and seizure operation at AEL Modderfontein. The Company is cooperating with the Department and has submitted a response to its allegations, relating to AEL’s compliance with certain conditions of it air emissions licence. Feedback from the Department’s process is awaited.
82
GOVERNANCE REPORT
SUMMARY OF ADHERENCE TO KING IIIPRINCIPLE APPLIED COMMENT
The Board should act as the focal point for and custodian of corporate governance. ✓
In line with the Companies Act, AECI’s corporate governance framework and processes are led by the Board supported by six Committees. Board and Committee details are included in this report, commencing on page 78.
The Board should appreciate that strategy, risk performance and sustainability are inseparable. ✓
AECI has used its risk management framework as a guide to determine the materiality of issues for inclusion in this report. Each of these issues has the potential to affect the Company’s current business activities and future growth. See pages 10 to 13.
Directors act in the best interests of the Company. ✓ AECI has a Conflict of Interests policy which guides Directors in these matters. All of AECI’s Non-executive Directors are Independent. No Non-executive Director is an employee of the Company. The two Executive Directors have employment contracts with a notice period of six months.
The Chairman of the Board is an Independent Non-executive Director. ✓
The Board should provide effective leadership based on an ethical foundation. ✓ In matters of ethical business conduct and good corporate citizenship,
the Board has delegated responsibilities to the Social and Ethics Committee. This Committee reports to the full Board at every meeting and to shareholders at the AGM.The Board should ensure that the Company is
and is seen to be a responsible corporate citizen. ✓
The Board should ensure that the Company’s ethics are managed effectively. ✓ See page 82 — Ethical business conduct.
The Board should ensure that the Company has an effective and independent Audit Committee. ✓ See page 79 — Audit Committee, and page 85 — Audit Committee’s
report to stakeholders.
The Board should be responsible for the governance of risk. ✓ See page 80 — Risk Committee.
The Board should be responsible for IT governance. ✓ See page 80 — Risk Committee.
The Board should ensure that the Company complies with applicable laws and considers adherence to non-binding rules, codes and standards.
✓See page 81 — Compliance.
The Board should ensure that there is an effective, risk-based Internal Audit. ✓ See the Audit Committee’s report to stakeholders on page 85 —
Execution of functions in respect of internal control and Internal Audit.
The Board should appreciate that stakeholders’ perceptions affect the Company’s reputation. ✓ See page 52 — Stakeholder engagement.
The Board should ensure the integrity of the Company’s integrated report. ✓ See page 3 — Approval of the integrated report .
The Board should report on the effectiveness of the Company’s system of internal control. ✓ See the Audit Committee’s report to stakeholders on page 85 —
Execution of functions in respect of internal control and Internal Audit.
The Board and its Directors should act in the best interests of the Company.
✓
AECI has a Conflict of Interests policy which guides Directors in these matters. See page 78. All of AECI’s Non-executive Directors are Independent. None of the Non-executive Directors are Company employees. The two Executive Directors have employment contracts with a notice period of six months.
83
GOVERNANCE REPORT
SUMMARY OF ADHERENCE TO KING III CONTINUEDPRINCIPLE APPLIED COMMENT
The Board should consider business rescue proceedings or other turnaround mechanisms as soon as the Company is financially distressed, as defined in the Act.
N/A
See Directors’ report on page 102 — Going-concern statement.
The Board should elect a Chairman of the Board who is an Independent Non-executive Director. The Chief Executive of the Company should not also fulfill the role of Chairman of the Board.
✓All 10 Non-executive Directors, including the Chairman, are Independent. See page 78 — Structure and Composition of the Board. The Chief Executive is an Executive Director whose role is separate from that of the Chairman.
The Board should appoint the Chief Executive and establish a framework for the delegation of authority.
✓In terms of the Board charter, the appointment of the Chief Executive is the responsibility of the Board. For delegation of authority see commentary on the Executive Committee on page 81.
The Board should comprise a balance of power, with a majority of Non-executive Directors. The majority of Non-executive Directors should be Independent.
✓See page 78 — Structure and composition of the Board.
Directors should be appointed through a formal process. ✓ See page 78 — Structure and composition of the Board,
and page 80 — Nominations Committee.
The induction and on-going training and development of Directors should be conducted through formal processes.
✓See page 79 — Induction and on-going development of Directors.
The Board should be assisted by a competent, suitably qualified and experienced Group Company Secretary.
✓See page 81 — Group Company Secretary.
The evaluation of the Board, its Committees and individual Directors should be performed every year.
✓See page 79 — Board and Committee performance evaluation.
The Board should delegate certain functions to well-structured Committees but without abdicating its own responsibilities.
✓See page 79 — Board Committees.
A governance framework should be agreed between the Group and its subsidiary Boards. ✓ See page 78 — Introductory paragraphs.
Companies should remunerate Directors and Executives fairly and responsibly. ✓ See page 88 — Remuneration report.
Companies should disclose the remuneration of each individual Director and certain Senior Executives.
✓See note 31.
A full King III gap analysis can be viewed via the website link: www.aeci.co.za/gov_king.php.
84
GOVERNANCE REPORT
PURPOSEThe purpose of the Committee is to:
› assist the Board in overseeing the quality and integrity of the Company’s integrated reporting process, including the financial statements and sustainability reporting, and announcements in respect of the financial results, thereby enhancing the credibility of financial reporting and providing a channel for communication between the Board, internal and external auditors and management;
› ensure that an effective control environment in the AECI Group is maintained by supporting the Board in the discharge of its duties relating to the safeguarding of assets, the operation of adequate systems and controls, risk management and the integrity of financial statements and reporting;
› provide the Financial Director, external auditors and the Head of Internal Audit with unrestricted access to the Committee and its Chairman, as is required, in relation to any matter falling within the remit of the Committee;
› meet with the external auditors, Senior Managers and Executive Directors as the Committee may elect;
› meet at least once a year with the Head of Internal Audit and members of his team without the external auditors, other Executive Board members or the Company’s Financial Director being present;
› review and recommend to the Company’s Board, for approval, the Company’s interim financial results for the half-year to 30 June;
› review and recommend to the Company’s Board, for approval, the Company’s audited financial statements for the financial year to 31 December;
› oversee the activities of, and ensure coordination between, the activities of the internal and external auditors;
› perform duties that are assigned to it by the Companies Act and as governed by other legislative requirements, including the statutory Audit Committee functions required for subsidiary companies;
› receive and deal with any complaints concerning accounting practices, the Internal Audit function or the content and audit of financial statements or related matters;
› conduct annual reviews of the Committee’s work and terms of reference and make recommendations to the Board to ensure that the Committee operates at maximum effectiveness; and
› assess the performance and effectiveness of the Committee and its members on a regular basis.
DEAR STAKEHOLDERS
THIS REPORT IS PROVIDED BY THE AUDIT COMMITTEE (“THE COMMITTEE”) APPOINTED IN RESPECT OF THE 2015 FINANCIAL YEAR OF AECI LTD. THIS REPORT INCORPORATES THE REQUIREMENTS OF THE COMPANIES ACT, KING III PRINCIPLES AND OTHER REGULATORY REQUIREMENTS. THE COMMITTEE’S OPERATION IS GUIDED BY A DETAILED CHARTER THAT IS INFORMED BY THE COMPANIES ACT AND KING III AND WAS APPROVED BY THE BOARD.
MEMBERSHIPThe Committee was nominated by the Board in respect of the 2015 financial year and its members were confirmed by shareholders at the AGM held on 1 June 2015. Shareholders will be requested to confirm the appointment of the members of the Committee for the 2016 financial year at the AGM scheduled for 30 May 2016.
The four meetings held in the year were attended by all members. Full details of the meeting dates and attendance are available on AECI’s website www.aeci.co.za/pdf/2015_board_meetings.pdf. The Committee comprises solely Independent Non-executive Directors.
The current members are:
› RMW Dunne (Chairman)
› GW Dempster
› G Gomwe
› AJ Morgan
› LM Nyhonyha
Abridged biographies of these Directors are published on pages 16 and 17 of this integrated report.
Mr RL Hiemstra resigned from the Board and the Committee on 6 October 2015. Mr Dunne has served on the Committee since 2007, Mr Morgan since 2010 and Mr Nyhonyha since 2006. Messrs G Gomwe and DW Dempster were appointed to the Committee on 1 June 2015 and 22 February 2016, respectively.
85
AUDIT COMMITTEE’S REPORT TO STAKEHOLDERS
» reviewed compliance with the financial conditions of loan covenants and determined that the capital of the Company was adequate;
» examined and reviewed the interim and annual financial statements, as well as all financial information disclosed to stakeholders, prior to submission to and approval by the Board;
» ensured that the financial statements fairly present the financial position of the Company and of the Group as at the end of the financial year and the results of operations and cash flows for the financial year, and considered the basis on which the Company and its subsidiaries, joint arrangements and associates were determined to be going-concerns;
» considered accounting treatments, significant unusual transactions and accounting judgements;
» considered the appropriateness of the accounting policies adopted and changes thereto;
» reviewed the external auditor’s audit report;
» reviewed the representation letter relating to the Group financial statements which was signed by management;
» considered any problems identified and reviewed any significant legal and tax matters that could have a material impact on the financial statements; and
» met separately with management, the external auditor and Internal Audit.
› In respect of internal control and Internal Audit, including Forensic Audit, the Committee among other matters:
» reviewed and approved the Internal Audit charter and annual audit plan and evaluated the independence, effectiveness and performance of the Internal Audit function and compliance with its charter;
» considered the reports of the internal auditor and external auditor on the Group’s systems of internal control including financial controls, business risk management and the maintenance of effective internal control systems;
» received assurance that proper and adequate accounting records were maintained and that the systems safeguarded the assets against unauthorised use or disposal thereof;
» reviewed significant issues raised by the internal and forensic audit processes and the adequacy of corrective action in response to significant internal and forensic audit findings; and
» based on the above, the Committee formed the opinion that there were no material breakdowns in internal control, including financial controls, business risk management and the maintenance of effective material control systems.
EXECUTION OF FUNCTIONSThe Committee executed its duties and responsibilities during the 2015 financial year in accordance with its terms of reference as they relate to the Group’s accounting, internal auditing, internal control, and integrated reporting practices.
During the year under review:
› In respect of the external auditor and the external audit, the Committee among other matters:
» nominated KPMG Inc. and Ms ML Watson as the external auditor and designated auditor, respectively, to shareholders for appointment as auditor for the financial year ended 31 December 2015, and ensured that the appointment complied with all applicable legal and regulatory requirements for the appointment of an auditor. The Committee confirms that the auditor and the designated auditor are accredited by the JSE;
» approved the external audit engagement letter, the audit plan and the budgeted audit fees payable to the external auditor;
» reviewed the audit, evaluated the effectiveness of the auditor and its independence and evaluated the external auditor’s internal quality control procedures;
» obtained an annual written statement from the auditor that its independence was not impaired;
» obtained assurance that no member of the external audit team was hired by the Company or its subsidiaries during the year;
» obtained assurances from the external auditor that adequate accounting records were being maintained by the Company and its subsidiaries;
» implemented a policy setting out the categories of non-audit services that the external auditor may and may not provide, split between permitted, permissible and prohibited services;
» approved all non-audit services with KPMG Inc.;
» considered whether any Reportable Irregularities were identified and reported by the external auditor in terms of the Auditing Profession Act, No. 26 of 2005, and determined that there were none; and
» nominated the external auditor and the designated independent auditor for each subsidiary company.
› In respect of the financial statements, the Committee among other matters:
» confirmed the going-concern as the basis of preparation of the interim and annual financial statements;
86
AUDIT COMMITTEE’S REPORT TO STAKEHOLDERS
INDEPENDENCE OF THE EXTERNAL AUDITORThe Committee is satisfied that KPMG Inc. is independent of the Company and the Group after taking the following factors into account:
› representations made by KPMG Inc. to the Committee;
› the auditor does not, except as external auditor or in rendering permitted non-audit services, receive any remuneration or other benefits from the Company;
› the auditor’s independence was not impaired by any consultancy, advisory or other work undertaken by the auditor;
› the auditor’s independence was not prejudiced as a result of any previous appointment as auditor; and
› the criteria specified for independence by the Independent Regulatory Board for Auditors and international regulatory bodies.
INTEGRATED REPORTFollowing the review by the Committee of the annual financial statements of AECI Ltd for the year ended 31 December 2015, the Committee is of the view that in all material respects they comply with the relevant provisions of the Companies Act and IFRS and fairly present the Group and Company financial position at that date and the results of operations and cash flows for the year then ended. The Committee has also satisfied itself of the integrity of the remainder of the integrated report.
Having achieved its objectives, the Committee has recommended the integrated report for the year ended 31 December 2015 for approval to the AECI Board. The Board has subsequently approved the report, which will be open for discussion at the forthcoming AGM.
On behalf of the Audit Committee
Richard Dunne Chairman
Woodmead, Sandton 11 April 2016
› In respect of risk management and IT, the Committee, insofar as relevant to its functions:
» reviewed the Group’s policies on risk assessment and risk management, including fraud risks and IT risks as they pertain to financial reporting and the going-concern assessment, and found them to be sound;
» considered and reviewed the findings and recommendations of the Risk Committee;
» considered the reports of Internal Audit and the external auditor insofar as these were relevant to risk management and IT, and could have an impact on financial controls, and ensured that the related management action plans were adequate; and
» reviewed and considered the feedback from the business segments’ Financial Review and Risk Committee meetings, insofar as these related to risk management and IT.
› In respect of sustainability issues the Committee has:
» overseen the process of sustainability reporting and considered the findings and recommendations of the Risk and the Social and Ethics Committees.
› In respect of legal and regulatory requirements to the extent that these may have an impact on the financial statements, the Committee:
» reviewed with management legal matters that could have a material impact on the Group;
» reviewed with the Company’s internal counsel the adequacy and effectiveness of the Group’s procedures, including its Risk Management Framework, to ensure compliance with legal and regulatory responsibilities;
» monitored complaints received via the Group’s whistle-blowing service, including complaints or concerns regarding accounting matters, Internal Audit, internal accounting controls, contents of the financial statements, potential violations of the law and questionable accounting or auditing matters;
» considered the results of an independent Group ethics risk assessment and reviewed the management action plans in response to these results; and
» considered reports provided by management, Internal Audit and the external auditor regarding compliance with legal and regulatory requirements.
› In respect of the coordination of assurance activities, the Committee reviewed the plans and work outputs of the external and internal auditors and concluded that these were adequate to address all significant financial risks facing the business.
› Considered the appropriateness of the experience and expertise of the Chief Financial Officer and Financial Director and his Finance team and concluded that these were appropriate.
87
AUDIT COMMITTEE’S REPORT TO STAKEHOLDERS

1. Disclosure of AECI’s remuneration philosophy, strategy and policy, including:
› governance and the Committee;
› key remuneration decisions taken in 2015;
› remuneration overview;
› reward strategy — pay mix;
› guaranteed remuneration;
› short-term incentives (“STIs”);
› long-term (share-based) incentives (“LTIs”);
› Executive Committee members’ service contracts; and
› Non-executive Directors’ fees.
2. Implementation of the remuneration policy for Executive Directors and Prescribed Officers in the period under review
Shareholders will be requested to vote on the policy, as expressed in Part 1 of this report, at the AGM scheduled to be held on 30 May 2016.
Richard Dunne Chairman
Woodmead, Sandton 11 April 2016
DEAR STAKEHOLDERSOn behalf of the Remuneration Committee (“the Committee”) and the AECI Board, I am pleased to present this report which sets out information applicable to AECI’s remuneration philosophy, policy, strategy, Executive remuneration — both fixed and variable, Non-executive Directors’ fees, and work undertaken by the Committee in 2015. The information provided in this report has been approved by the Board on the recommendation of the Committee.
AECI’s remuneration philosophy is to establish fair and equitable reward levels that will attract and retain high calibre Executive Committee members, Senior Managers and key talent, and will motivate them to develop and implement the Group’s business strategy. The primary intention of the reward strategy is to enhance shareholder value through focus on, and support of, AECI’s overall strategic goals as outlined in the Chief Executive’s report on page 28.
There has been no change to the overall remuneration philosophy and policy for 2016. General market conditions in the global mining industry and the local manufacturing sector were taken into consideration when reviewing Executive remuneration and performance in terms of the incentive scheme for the year under review. Further, the financial impact of the platinum mining sector strikes in 2014 was factored into the allocation of the long-term incentive award value during 2015. Short-term incentive payments made in 2014 where linked to the financial achievement for that year. The Group’s financial results in that year were negatively impacted as several AECI businesses are directly exposed to conditions in the mining sector.
Stakeholder feedback on the Remuneration report presented at the AGM held on 1 June 2015 was sought and the key issues highlighted were:
› further disclosure was requested on the achievement of non-financial elements in the incentive schemes;
› performance hurdles in the AECI Long-term Incentive Plan (“LTIP”) should be clarified;
› the overall effectiveness of the LTIP as a retention device should be disclosed;
› the payment of ad hoc fees to Non-Executive Directors was not deemed appropriate.
Each of these concerns was reviewed in terms of alignment with the remuneration philosophy and in the broader context of AECI’s growth strategy. As result of that review more information on non-financial elements of the short-term incentive scheme, the performance hurdles of the LTIP and the achievement of these has been included in this report.
The Committee approved an additional retention scheme for senior employees and withdrew the payment of ad hoc fees to Non-executive Directors in 2016.
In alignment with the Remuneration Guidelines of King III, and in compliance with the Companies Act, this report is presented in two parts:
REWARD STRATEGY
RECOGNITIONAND REWARD
COMPETITIVE GUARANTEED PACKAGE (INCLUDING BENEFITS)
SHORT- AND LONG-TERM INCENTIVES
PERFORMANCE MANAGEMENT
EMPLOYEE GROWTH AND DEVELOPMENT
88
REMUNERATION REPORT
› approval of allocation principles, under the LTIP, of earnings-growth units and awards of performance shares, in line with policy;
› review and approval of a once-off adjustment in relation to the impact on the STI performance of 2014’s platinum mining sector strikes;
› approval of the targets and weighting of performance measures for the STI plan;
› approval of salary increases for Executive Committee members and Senior Managers;
› approval of STI payment pools for the Group and its individual businesses;
› review and approval of the Company’s 2015 Remuneration report;
› review of Non-executive Directors’ fees and the formulation of a recommendation to shareholders for the approval of increases;
› review of the implication of the bulk Somerset West property sale on the Group’s STI and LTI awards;
› review and approval of a proposed amended LTI scheme for Paterson level D Upper employees; and
› review and approval of a proposed retention scheme for Executive Committee members and Senior Managers.
Components of remunerationAECI is committed to maintaining pay levels on a total cost to employer basis that reflect an employee’s worth to the Group, a Performance Management system that serves to differentiate individual and/or team performance, and incentives that recognise and reward, where appropriate, both operational performance and strategic performance in a volatile business environment. Growth and development opportunities for employees are identified informally on a day-to-day basis and more formally through Talent Board processes.
The guaranteed package comprises base pay, allowances, and retirement and medical aid benefits. It is managed in relation to the market median, taking into account individuals’ performance against defined objectives. Benefits such as travel allowances and contributions to retirement and medical funds are maintained at market-competitive levels.
STIs are designed to motivate and reward the achievement of short-term objectives for Executive Committee members and Senior Managers, while LTIs are designed to incentivise and reward them through the achievement of long-term shareholder value.
The tables on pages 90 and 91 summarise the composition of total remuneration packages in 2016. The variable elements of pay will be reviewed for some employment levels during the year.
The variable elements of pay will also be reviewed in the coming year with the intention of achieving alignment with strategic objectives, embedding standardisation across all Group businesses and positioning employees to achieve key performance objectives, and offering suitable, sustainable reward.
Expert external consultants will be engaged to benchmark existing schemes and incentive programmes against market trends and best practice.
PART 1
Remuneration philosophy, strategy and policyAECI’s Executive remuneration policy is driven by individuals’ performance and comparisons to market benchmarks, including compensation, benefits, variable pay and retention elements of reward. The policy seeks to reward Executive Committee members and Senior Managers who contribute to the achievement of targets for growth and shareholder returns. Accordingly, financial performance measures and Executives’ Key Performance Indicators (“KPI”) scorecards determine the levels of reward for Executives and Senior Managers.
AECI has taken a balanced approach to remuneration, ensuring that employees are incentivised to achieve both the short- and long-term strategic objectives of the Company. Short-term performance is measured against trading profit and headline earnings per share (“HEPS”) and the achievement of key financial and non-financial indicators. Long-term incentives are linked to HEPS and total shareholder return (“TSR”) against a comparator group.
Remuneration Committee and its role
CompositionThe Committee is comprised of four Non-executive Directors all of whom, including the Chairman, are Independent. Meetings of the Committee are usually held four times a year and additional meetings are held when deemed necessary. The Group Company Secretary attends all meetings as secretary. The Chief Executive and Chief Financial Officer are invited to attend to discuss the remuneration of Executive Committee members and Senior Managers and to contribute to other discussions as warranted. No attendee may participate in or be present at any discussion or decision regarding his/her own remuneration. Current members of the Committee are:
› RMW Dunne (Chairman)
› S Engelbrecht
› LM Nyhonyha
› R Ramashia
Mr Dunne has been a member of the Committee since 2007 (and Chairman since 2009), Mr Engelbrecht since 2009, Mr Nyhonyha since 2012 and Adv Ramashia was appointed on 1 June 2015.
The responsibilities of the Committee are in accordance with its Board-approved terms of reference which comply with King III. A copy of these can be found via the link www.aeci.co.za/gov_policy.php. The Board is satisfied that the Committee’s composition is appropriate with regard to the necessary balance of knowledge, skill and experience of its members. The Committee met six times in the year. Details of meeting dates and attendance are available at www.aeci.co.za/pdf/2015_board_meetings.pdf.
Key remuneration decisions taken in the 2015 financial yearThe Committee considered the following matters and took key decisions as appropriate:
89
REMUNERATION REPORT
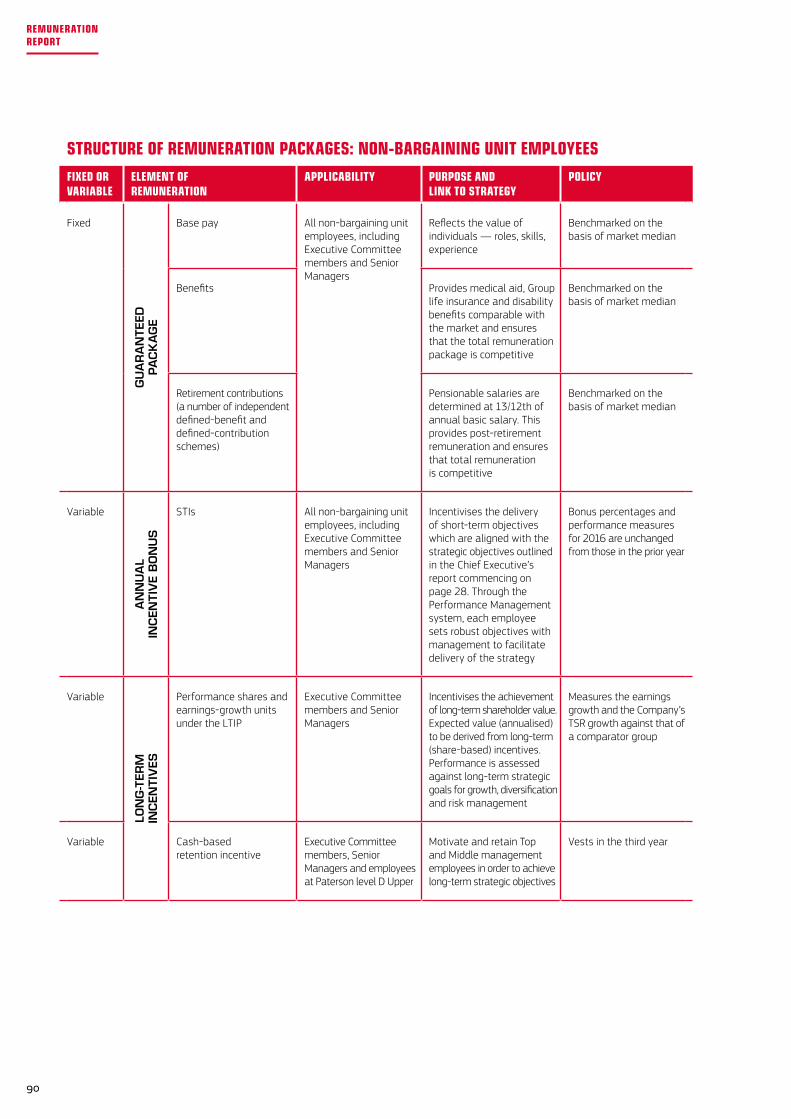
STRUCTURE OF REMUNERATION PACKAGES: NON-BARGAINING UNIT EMPLOYEESFIXED OR VARIABLE
ELEMENT OF REMUNERATION
APPLICABILITY PURPOSE AND LINK TO STRATEGY
POLICY
Fixed
GU
AR
AN
TEED
PA
CK
AG
E
Base pay All non-bargaining unit employees, including Executive Committee members and Senior Managers
Reflects the value of individuals — roles, skills, experience
Benchmarked on the basis of market median
Benefits Provides medical aid, Group life insurance and disability benefits comparable with the market and ensures that the total remuneration package is competitive
Benchmarked on the basis of market median
Retirement contributions (a number of independent defined-benefit and defined-contribution schemes)
Pensionable salaries are determined at 13/12th of annual basic salary. This provides post-retirement remuneration and ensures that total remuneration is competitive
Benchmarked on the basis of market median
Variable
AN
NU
AL
INC
ENTI
VE
BO
NU
S
STIs All non-bargaining unit employees, including Executive Committee members and Senior Managers
Incentivises the delivery of short-term objectives which are aligned with the strategic objectives outlined in the Chief Executive’s report commencing on page 28. Through the Performance Management system, each employee sets robust objectives with management to facilitate delivery of the strategy
Bonus percentages and performance measures for 2016 are unchanged from those in the prior year
Variable
LON
G-T
ERM
IN
CEN
TIV
ES
Performance shares and earnings-growth units under the LTIP
Executive Committee members and Senior Managers
Incentivises the achievement of long-term shareholder value. Expected value (annualised) to be derived from long-term (share-based) incentives. Performance is assessed against long-term strategic goals for growth, diversification and risk management
Measures the earnings growth and the Company’s TSR growth against that of a comparator group
Variable Cash-based retention incentive
Executive Committee members, Senior Managers and employees at Paterson level D Upper
Motivate and retain Top and Middle management employees in order to achieve long-term strategic objectives
Vests in the third year
90
REMUNERATION REPORT
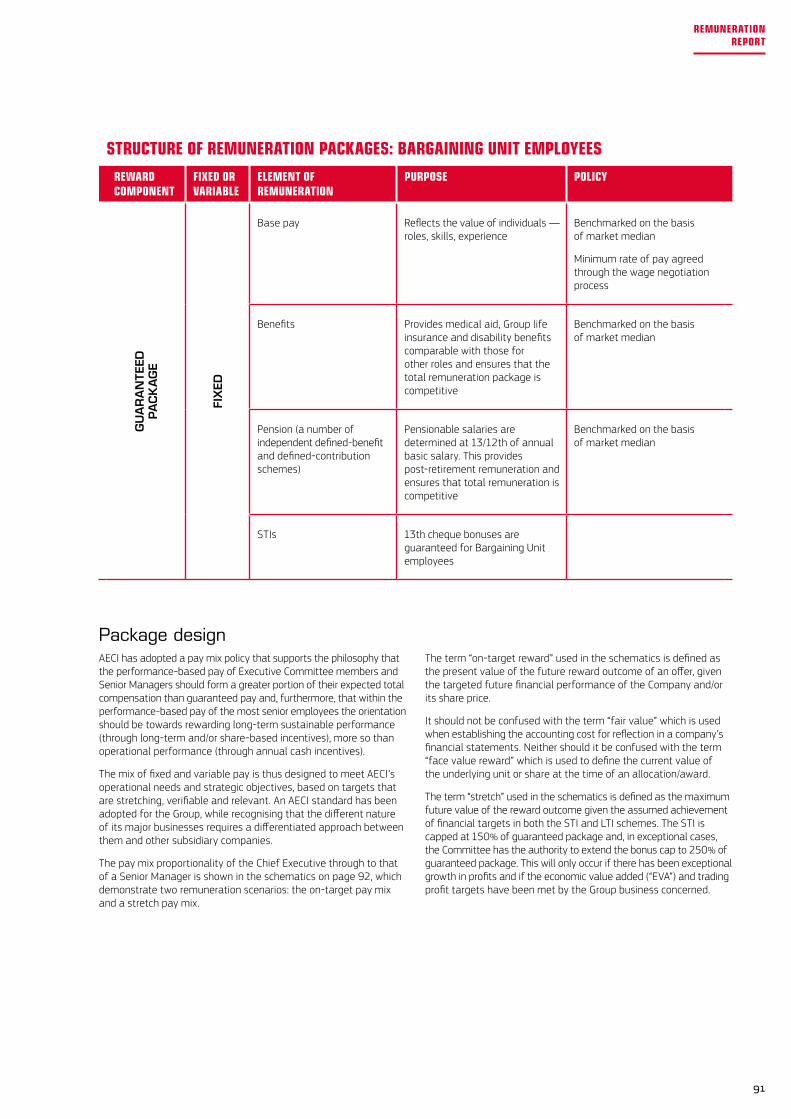
The term “on-target reward” used in the schematics is defined as the present value of the future reward outcome of an offer, given the targeted future financial performance of the Company and/or its share price.
It should not be confused with the term “fair value” which is used when establishing the accounting cost for reflection in a company’s financial statements. Neither should it be confused with the term “face value reward” which is used to define the current value of the underlying unit or share at the time of an allocation/award.
The term “stretch” used in the schematics is defined as the maximum future value of the reward outcome given the assumed achievement of financial targets in both the STI and LTI schemes. The STI is capped at 150% of guaranteed package and, in exceptional cases, the Committee has the authority to extend the bonus cap to 250% of guaranteed package. This will only occur if there has been exceptional growth in profits and if the economic value added (“EVA”) and trading profit targets have been met by the Group business concerned.
Package designAECI has adopted a pay mix policy that supports the philosophy that the performance-based pay of Executive Committee members and Senior Managers should form a greater portion of their expected total compensation than guaranteed pay and, furthermore, that within the performance-based pay of the most senior employees the orientation should be towards rewarding long-term sustainable performance (through long-term and/or share-based incentives), more so than operational performance (through annual cash incentives).
The mix of fixed and variable pay is thus designed to meet AECI’s operational needs and strategic objectives, based on targets that are stretching, verifiable and relevant. An AECI standard has been adopted for the Group, while recognising that the different nature of its major businesses requires a differentiated approach between them and other subsidiary companies.
The pay mix proportionality of the Chief Executive through to that of a Senior Manager is shown in the schematics on page 92, which demonstrate two remuneration scenarios: the on-target pay mix and a stretch pay mix.
STRUCTURE OF REMUNERATION PACKAGES: BARGAINING UNIT EMPLOYEESREWARD COMPONENT
FIXED OR VARIABLE
ELEMENT OF REMUNERATION
PURPOSE POLICY
GU
AR
AN
TEED
PA
CK
AG
E
FIX
EDBase pay Reflects the value of individuals —
roles, skills, experienceBenchmarked on the basis of market median
Minimum rate of pay agreed through the wage negotiation process
Benefits Provides medical aid, Group life insurance and disability benefits comparable with those for other roles and ensures that the total remuneration package is competitive
Benchmarked on the basis of market median
Pension (a number of independent defined-benefit and defined-contribution schemes)
Pensionable salaries are determined at 13/12th of annual basic salary. This provides post-retirement remuneration and ensures that total remuneration is competitive
Benchmarked on the basis of market median
STIs 13th cheque bonuses are guaranteed for Bargaining Unit employees
91
REMUNERATION REPORT
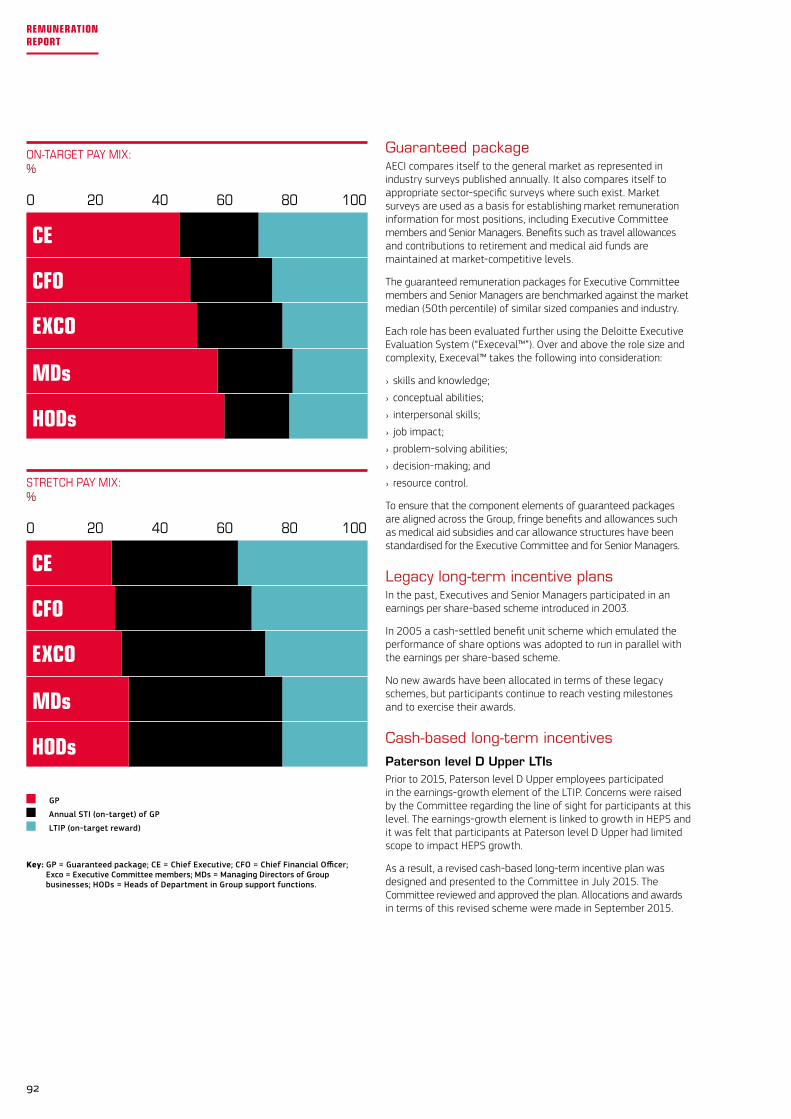
Guaranteed packageAECI compares itself to the general market as represented in industry surveys published annually. It also compares itself to appropriate sector-specific surveys where such exist. Market surveys are used as a basis for establishing market remuneration information for most positions, including Executive Committee members and Senior Managers. Benefits such as travel allowances and contributions to retirement and medical aid funds are maintained at market-competitive levels.
The guaranteed remuneration packages for Executive Committee members and Senior Managers are benchmarked against the market median (50th percentile) of similar sized companies and industry.
Each role has been evaluated further using the Deloitte Executive Evaluation System (“Execeval™”). Over and above the role size and complexity, Execeval™ takes the following into consideration:
› skills and knowledge;
› conceptual abilities;
› interpersonal skills;
› job impact;
› problem-solving abilities;
› decision-making; and
› resource control.
To ensure that the component elements of guaranteed packages are aligned across the Group, fringe benefits and allowances such as medical aid subsidies and car allowance structures have been standardised for the Executive Committee and for Senior Managers.
Legacy long-term incentive plansIn the past, Executives and Senior Managers participated in an earnings per share-based scheme introduced in 2003.
In 2005 a cash-settled benefit unit scheme which emulated the performance of share options was adopted to run in parallel with the earnings per share-based scheme.
No new awards have been allocated in terms of these legacy schemes, but participants continue to reach vesting milestones and to exercise their awards.
Cash-based long-term incentives
Paterson level D Upper LTIsPrior to 2015, Paterson level D Upper employees participated in the earnings-growth element of the LTIP. Concerns were raised by the Committee regarding the line of sight for participants at this level. The earnings-growth element is linked to growth in HEPS and it was felt that participants at Paterson level D Upper had limited scope to impact HEPS growth.
As a result, a revised cash-based long-term incentive plan was designed and presented to the Committee in July 2015. The Committee reviewed and approved the plan. Allocations and awards in terms of this revised scheme were made in September 2015.
HODs
MDs
EXCO
CFO
CE
80 1006040200
HODs
MDs
EXCO
CFO
CE
80 1006040200
ON-TARGETPAYMIX:%
STRETCHPAYMIX:%
GP
Annual STI (on-target) of GP
LTIP (on-target reward)
Key: GP = Guaranteed package; CE = Chief Executive; CFO = Chief Financial Officer; Exco = Executive Committee members; MDs = Managing Directors of Group businesses; HODs = Heads of Department in Group support functions.
92
REMUNERATION REPORT
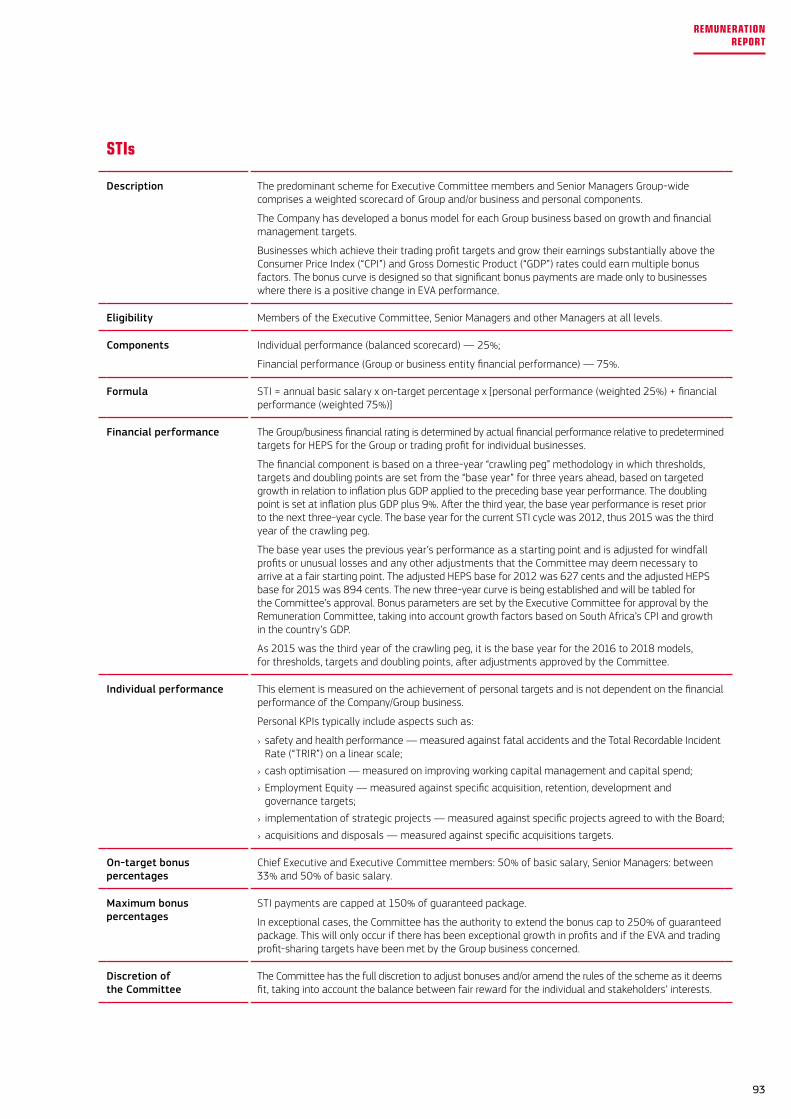
Description The predominant scheme for Executive Committee members and Senior Managers Group-wide comprises a weighted scorecard of Group and/or business and personal components.
The Company has developed a bonus model for each Group business based on growth and financial management targets.
Businesses which achieve their trading profit targets and grow their earnings substantially above the Consumer Price Index (“CPI”) and Gross Domestic Product (“GDP”) rates could earn multiple bonus factors. The bonus curve is designed so that significant bonus payments are made only to businesses where there is a positive change in EVA performance.
Eligibility Members of the Executive Committee, Senior Managers and other Managers at all levels.
Components Individual performance (balanced scorecard) — 25%;
Financial performance (Group or business entity financial performance) — 75%.
Formula STI = annual basic salary x on-target percentage x [personal performance (weighted 25%) + financial performance (weighted 75%)]
Financial performance The Group/business financial rating is determined by actual financial performance relative to predetermined targets for HEPS for the Group or trading profit for individual businesses.
The financial component is based on a three-year “crawling peg” methodology in which thresholds, targets and doubling points are set from the “base year” for three years ahead, based on targeted growth in relation to inflation plus GDP applied to the preceding base year performance. The doubling point is set at inflation plus GDP plus 9%. After the third year, the base year performance is reset prior to the next three-year cycle. The base year for the current STI cycle was 2012, thus 2015 was the third year of the crawling peg.
The base year uses the previous year’s performance as a starting point and is adjusted for windfall profits or unusual losses and any other adjustments that the Committee may deem necessary to arrive at a fair starting point. The adjusted HEPS base for 2012 was 627 cents and the adjusted HEPS base for 2015 was 894 cents. The new three-year curve is being established and will be tabled for the Committee’s approval. Bonus parameters are set by the Executive Committee for approval by the Remuneration Committee, taking into account growth factors based on South Africa’s CPI and growth in the country’s GDP.
As 2015 was the third year of the crawling peg, it is the base year for the 2016 to 2018 models, for thresholds, targets and doubling points, after adjustments approved by the Committee.
Individual performance This element is measured on the achievement of personal targets and is not dependent on the financial performance of the Company/Group business.
Personal KPIs typically include aspects such as:
› safety and health performance — measured against fatal accidents and the Total Recordable Incident Rate (“TRIR”) on a linear scale;
› cash optimisation — measured on improving working capital management and capital spend;
› Employment Equity — measured against specific acquisition, retention, development and governance targets;
› implementation of strategic projects — measured against specific projects agreed to with the Board;
› acquisitions and disposals — measured against specific acquisitions targets.
On-target bonus percentages
Chief Executive and Executive Committee members: 50% of basic salary, Senior Managers: between 33% and 50% of basic salary.
Maximum bonus percentages
STI payments are capped at 150% of guaranteed package.
In exceptional cases, the Committee has the authority to extend the bonus cap to 250% of guaranteed package. This will only occur if there has been exceptional growth in profits and if the EVA and trading profit-sharing targets have been met by the Group business concerned.
Discretion of the Committee
The Committee has the full discretion to adjust bonuses and/or amend the rules of the scheme as it deems fit, taking into account the balance between fair reward for the individual and stakeholders’ interests.
STIs
93
REMUNERATION REPORT
Eligibility Executives and selected Senior Managers of the Company and its businesses.
Purpose The purpose of the LTIP is to attract, retain, motivate and reward Executive Committee members and Managers who are able to influence the performance of AECI and its subsidiaries on a basis which aligns their interests with those of the Company’s stakeholders.
The combined, weighted implementation of the two LTI elements (earnings-growth units and performance shares) will allow AECI to remain competitive in long-term incentives, reward long-term sustainable Company performance, act as a retention tool and ensure that Executive Committee members share a significant level of personal risk with the Company’s shareholders.
The performance share element aligns the interests of shareholders and AECI’s senior employees closely by rewarding superior shareholder returns and financial performance in the future. Because annual awards are made, with each award requiring the resetting of the performance criteria, it is only with continued and sustained outperformance by the Company that significant reward accrues to participants.
Operation and instruments Annual LTIs comprise a weighted combination of:
› allocations of earnings-growth units; and
› awards of performance shares.
Quantum of awards Allocations and awards will be governed by AECI’s reward strategy (pay mix) in which inter alia the “target reward” of long-term incentivisation is set for defined categories of Executives and Senior Managers.
Earnings-growth units The earnings-growth unit element is similar in architecture to AECI’s previous earnings per share-based incentive scheme but is documented more thoroughly to address the provisions of the scheme under conditions of termination, adjustment, change of control and the like, on which the previous scheme documentation was silent.
Annual allocations of earnings-growth units will be made to Executives and Managers. They will be eligible for vesting in equal thirds on no earlier than the third, fourth and fifth anniversaries but need not be exercised until the seventh anniversary, at which time they must be exercised or they will lapse.
On settlement, the value accruing to participants will be their share of the full appreciation in AECI’s HEPS, adjusted as deemed appropriate by the Committee.
Earnings-growth units will continue to offer a form of earnings growth/appreciation-linked long-term incentive, as in the past, but now at a reduced level in terms of targeted reward, the balance being from the performance share element described on the facing page.
Performance conditions for the earnings-growth units
The earnings-growth units are linked directly to the growth in AECI’s HEPS. However, an additional performance underpin may, at the discretion of the Board, be stipulated which will take the form of a minimum Company financial performance that must be achieved before vesting, notwithstanding the passage of time, and which must be met by at least the seventh anniversary, or all units will lapse.
LTIs — LTIP
94
REMUNERATION REPORT
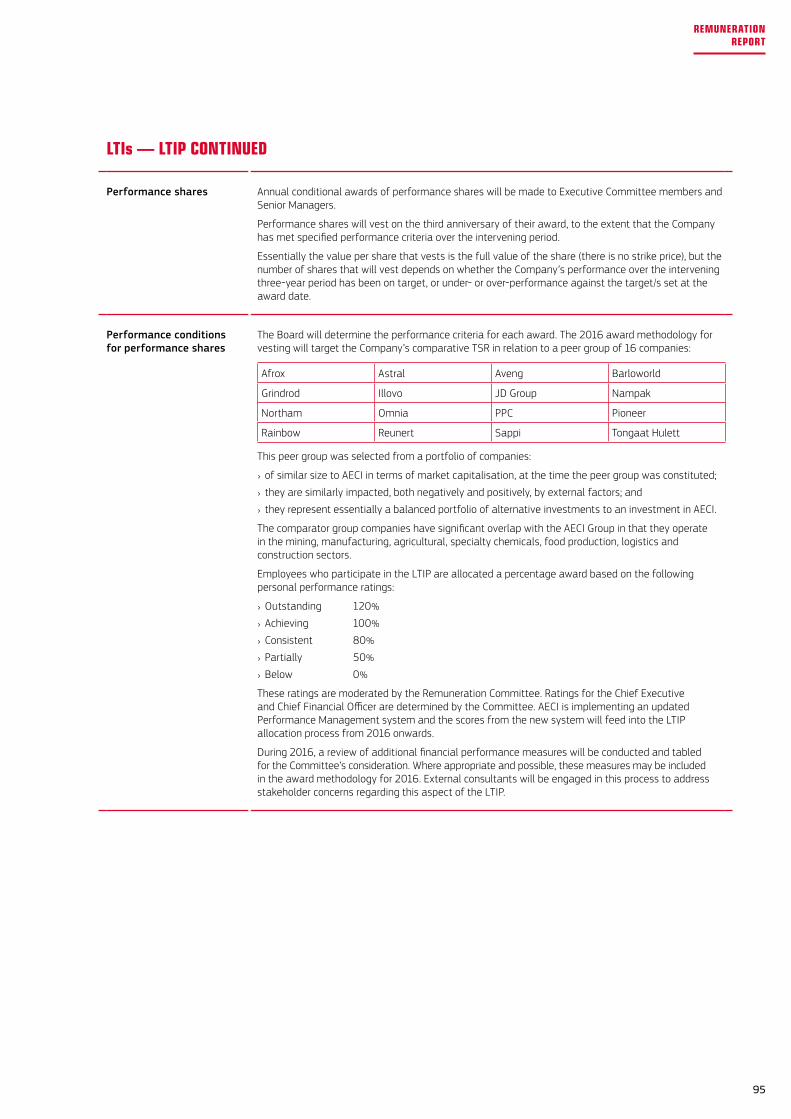
Performance shares Annual conditional awards of performance shares will be made to Executive Committee members and Senior Managers.
Performance shares will vest on the third anniversary of their award, to the extent that the Company has met specified performance criteria over the intervening period.
Essentially the value per share that vests is the full value of the share (there is no strike price), but the number of shares that will vest depends on whether the Company’s performance over the intervening three-year period has been on target, or under- or over-performance against the target/s set at the award date.
Performance conditions for performance shares
The Board will determine the performance criteria for each award. The 2016 award methodology for vesting will target the Company’s comparative TSR in relation to a peer group of 16 companies:
Afrox Astral Aveng Barloworld
Grindrod Illovo JD Group Nampak
Northam Omnia PPC Pioneer
Rainbow Reunert Sappi Tongaat Hulett
This peer group was selected from a portfolio of companies:
› of similar size to AECI in terms of market capitalisation, at the time the peer group was constituted;
› they are similarly impacted, both negatively and positively, by external factors; and
› they represent essentially a balanced portfolio of alternative investments to an investment in AECI.
The comparator group companies have significant overlap with the AECI Group in that they operate in the mining, manufacturing, agricultural, specialty chemicals, food production, logistics and construction sectors.
Employees who participate in the LTIP are allocated a percentage award based on the following personal performance ratings:
› Outstanding 120%
› Achieving 100%
› Consistent 80%
› Partially 50%
› Below 0%
These ratings are moderated by the Remuneration Committee. Ratings for the Chief Executive and Chief Financial Officer are determined by the Committee. AECI is implementing an updated Performance Management system and the scores from the new system will feed into the LTIP allocation process from 2016 onwards.
During 2016, a review of additional financial performance measures will be conducted and tabled for the Committee’s consideration. Where appropriate and possible, these measures may be included in the award methodology for 2016. External consultants will be engaged in this process to address stakeholder concerns regarding this aspect of the LTIP.
LTIs — LTIP CONTINUED
95
REMUNERATION REPORT
Non-executive Directors’ compensation
Terms of appointmentNon-executive Directors do not have service contracts. Non-executive Directors do not participate in any of the Company’s LTI schemes and no shares are granted to them. Non-executive Directors receive a fixed fee per annum for their contribution, which is comprised of a base retainer fee and, where applicable, a committee membership fee. Meeting attendance fees are paid at a fixed value.
In addition, the Company pays for all travel and accommodation expenses incurred by Directors to attend Board and committee meetings and visits to Company businesses.
Non-executive Directors’ fees are arrived at after an annual benchmarking exercise performed by the Executive Directors and the approval by shareholders at the AGM of the proposed fees, on the Committee’s recommendation. In arriving at the proposed fee, cognizance is taken of market norms and practices as well as the additional responsibilities placed on Board members by new legislation and corporate governance principles.
Details of the emoluments paid to Non-executive Directors in 2015 are disclosed in note 31.
Non-binding advisory voteIn terms of King III and best practice principles, the remuneration policy as outlined in Part 1 of this report will be put to a non-binding vote at the AGM of shareholders of the Company scheduled to take place on 30 May 2016.
PART 2
Implementation of policy in 20151. Guaranteed package adjustmentsThe Committee reviewed guaranteed packages for Executive Committee members and Senior Managers, as recommended by the Chief Executive, taking into consideration market data as provided by the Deloitte Top Executive Remuneration Survey 2015, market data from PwC Research Services, the results of Execeval™, individuals’ experience and current levels of performance.
The Committee approved that the target range of the guaranteed package should be between 70% and 130% of the market median. Progressive annual adjustments will be made for incumbents below this target range over a period of time, taking into consideration their performance levels.
Senior Management and Executive retention schemeIntroduced in 2015, the Senior Management and Executive retention scheme was designed to address stakeholder concerns that the LTIP did not secure sufficient employee retention. The scheme is a cash-settled scheme which mimics a phantom share scheme, where phantom shares are allocated to members. The allocations vest after three years.
In designing and reviewing the LTIP, the Committee took cognizance of large institutional shareholders’ approach to retention schemes, King III and market best practice in retention initiatives. Two leading external consultancy firms were approached for their comments. It was determined that the retention plan should be underpinned by a performance hurdle set at a minimum level of acceptable performance.
A component of the scheme would be the extension of notice periods for key Executives and Senior Managers. The awards would vest after a three-year period and it was envisioned that awards would be allocated annually.
The proposed scheme was presented to the Committee in July 2015 and approved at the same meeting.
Executive Directors’ and Executive Committee members’ service contractsNeither of the Executive Directors have extended employment contracts or special termination benefits. Since December 2015, both Executive Directors have restraints of trade in place for 12 months. Service contracts of Executive Directors and members of the Executive Committee are in accordance with AECI’s standard terms and conditions of employment and their notice period was amended in December 2015 from one month to six months. The majority of current Paterson level E employees’ notice periods were amended from one month to three months.
From 1 January 2016, all new appointments at Paterson level E have notice periods of three months and Paterson level F employees have notice periods of six months.
In principle, AECI does not offer sign-on bonuses, but in instances were a sign-on bonus is included the contract will stipulate that the employee must remain employed by the Group for a minimum period of three years. The sign-on bonus is paid in installments over the three-year period and all payments are subject to claw-back conditions.
Generally, it is not AECI’s policy to offer balloon payments on termination of service. An employee, even at Executive level, who resigns from the Group forfeits all LTI awards and will not receive a STI payment. Where an employee’s service is terminated through the sale of a business or no fault retrenchment, the terms of that termination are negotiated and may include the continued vesting of previous LTIP awards.
96
REMUNERATION REPORT
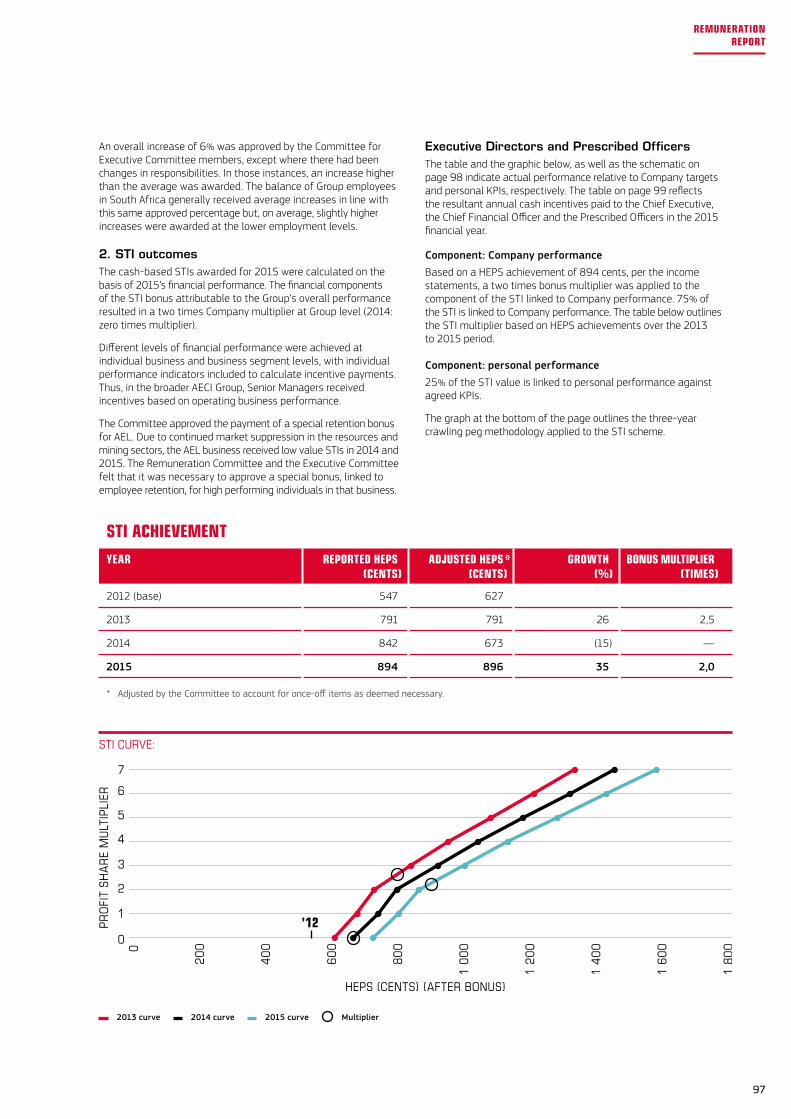
Executive Directors and Prescribed OfficersThe table and the graphic below, as well as the schematic on page 98 indicate actual performance relative to Company targets and personal KPIs, respectively. The table on page 99 reflects the resultant annual cash incentives paid to the Chief Executive, the Chief Financial Officer and the Prescribed Officers in the 2015 financial year.
Component: Company performanceBased on a HEPS achievement of 894 cents, per the income statements, a two times bonus multiplier was applied to the component of the STI linked to Company performance. 75% of the STI is linked to Company performance. The table below outlines the STI multiplier based on HEPS achievements over the 2013 to 2015 period.
Component: personal performance25% of the STI value is linked to personal performance against agreed KPIs.
The graph at the bottom of the page outlines the three-year crawling peg methodology applied to the STI scheme.
An overall increase of 6% was approved by the Committee for Executive Committee members, except where there had been changes in responsibilities. In those instances, an increase higher than the average was awarded. The balance of Group employees in South Africa generally received average increases in line with this same approved percentage but, on average, slightly higher increases were awarded at the lower employment levels.
2. STI outcomesThe cash-based STIs awarded for 2015 were calculated on the basis of 2015’s financial performance. The financial components of the STI bonus attributable to the Group’s overall performance resulted in a two times Company multiplier at Group level (2014: zero times multiplier).
Different levels of financial performance were achieved at individual business and business segment levels, with individual performance indicators included to calculate incentive payments. Thus, in the broader AECI Group, Senior Managers received incentives based on operating business performance.
The Committee approved the payment of a special retention bonus for AEL. Due to continued market suppression in the resources and mining sectors, the AEL business received low value STIs in 2014 and 2015. The Remuneration Committee and the Executive Committee felt that it was necessary to approve a special bonus, linked to employee retention, for high performing individuals in that business.
STI ACHIEVEMENTYEAR REPORTED HEPS
(CENTS)ADJUSTED HEPS *
(CENTS)GROWTH
(%)BONUS MULTIPLIER
(TIMES)
2012 (base) 547 627
2013 791 791 26 2,5
2014 842 673 (15) —
2015 894 896 35 2,0
* Adjusted by the Committee to account for once-off items as deemed necessary.
STICURVE:
2013 curve 2014 curve 2015 curve Multiplier
0
2
4
6
5
3
1
0
PR
OFI
T SH
AR
E M
ULT
IPLI
ER
HEPS (CENTS) (AFTER BONUS)
1 8
00
1 6
00
1 4
00
1 2
00
1 0
00
80
0
60
0
40
0
20
0
7
’12
97
REMUNERATION REPORT
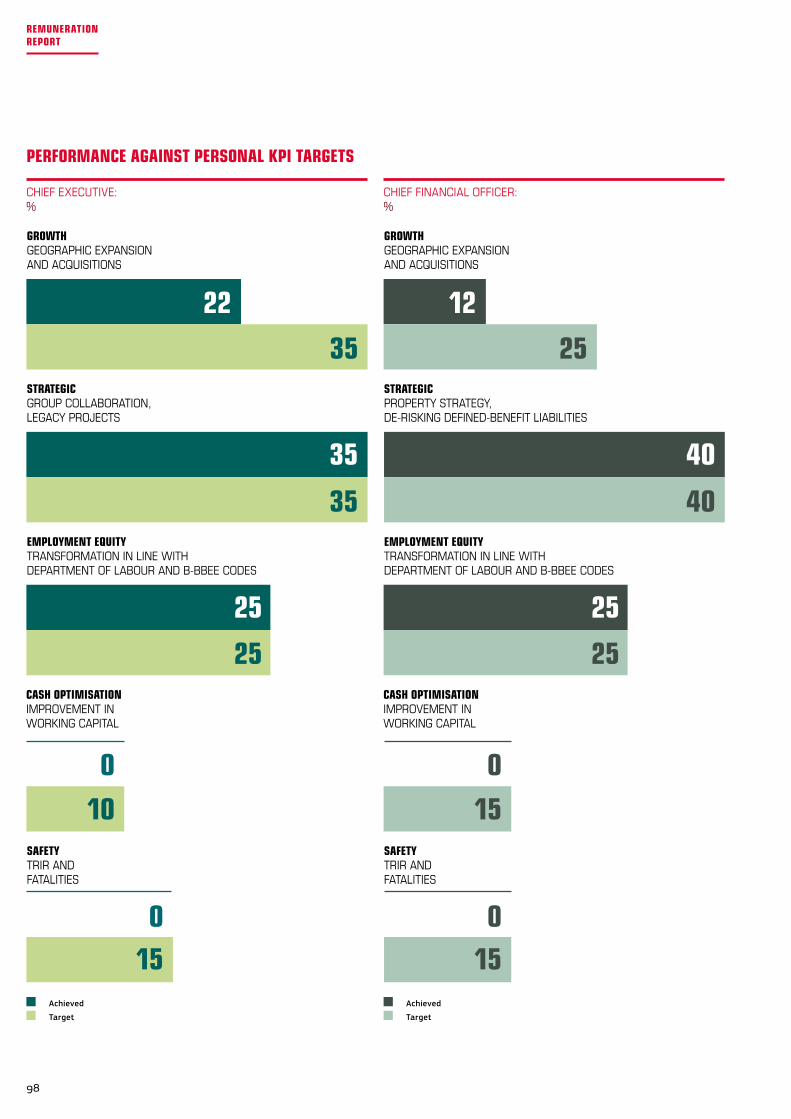
EMPLOYMENT EQUITYTRANSFORMATION IN LINE WITHDEPARTMENT OF LABOUR AND B-BBEE CODES
25
25
GROWTHGEOGRAPHIC EXPANSION AND ACQUISITIONS
22
35
CASH OPTIMISATIONIMPROVEMENT INWORKING CAPITAL
100
STRATEGICGROUP COLLABORATION, LEGACY PROJECTS
35
35
150
SAFETYTRIR AND FATALITIES
CHIEFEXECUTIVE:%
Achieved
Target
CASH OPTIMISATIONIMPROVEMENT INWORKING CAPITAL
150
STRATEGICPROPERTY STRATEGY,DE-RISKING DEFINED-BENEFIT LIABILITIES
40
40
150
SAFETYTRIR AND FATALITIES
GROWTHGEOGRAPHIC EXPANSION AND ACQUISITIONS
12
25
EMPLOYMENT EQUITYTRANSFORMATION IN LINE WITHDEPARTMENT OF LABOUR AND B-BBEE CODES
25
25
CHIEFFINANCIALOFFICER:%
Achieved
Target
PERFORMANCE AGAINST PERSONAL KPI TARGETS
98
REMUNERATION REPORT
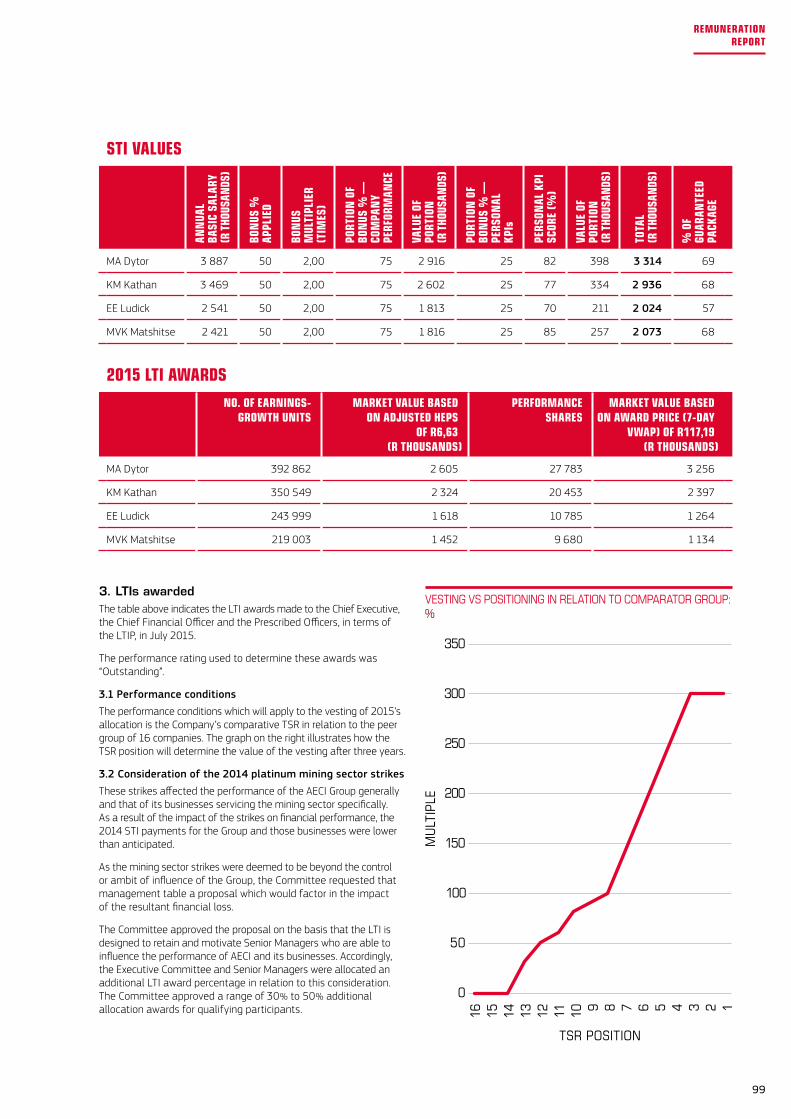
3. LTIs awardedThe table above indicates the LTI awards made to the Chief Executive, the Chief Financial Officer and the Prescribed Officers, in terms of the LTIP, in July 2015.
The performance rating used to determine these awards was “Outstanding”.
3.1 Performance conditionsThe performance conditions which will apply to the vesting of 2015’s allocation is the Company’s comparative TSR in relation to the peer group of 16 companies. The graph on the right illustrates how the TSR position will determine the value of the vesting after three years.
3.2 Consideration of the 2014 platinum mining sector strikesThese strikes affected the performance of the AECI Group generally and that of its businesses servicing the mining sector specifically. As a result of the impact of the strikes on financial performance, the 2014 STI payments for the Group and those businesses were lower than anticipated.
As the mining sector strikes were deemed to be beyond the control or ambit of influence of the Group, the Committee requested that management table a proposal which would factor in the impact of the resultant financial loss.
The Committee approved the proposal on the basis that the LTI is designed to retain and motivate Senior Managers who are able to influence the performance of AECI and its businesses. Accordingly, the Executive Committee and Senior Managers were allocated an additional LTI award percentage in relation to this consideration. The Committee approved a range of 30% to 50% additional allocation awards for qualifying participants.
VESTINGVSPOSITIONINGINRELATIONTOCOMPARATORGROUP:%
STI VALUES
ANN
UAL
BASI
C SA
LARY
(R T
HOUS
ANDS
)
BON
US %
AP
PLIE
D
BON
US
MUL
TIPL
IER
(TIM
ES)
PORT
ION
OF
BON
US %
—
COM
PAN
Y PE
RFOR
MAN
CE
VALU
E OF
PO
RTIO
N(R
THO
USAN
DS)
PORT
ION
OF
BON
US %
—
PERS
ONAL
KP
Is
PERS
ONAL
KPI
SC
ORE
(%)
VALU
E OF
PO
RTIO
N
(R T
HOUS
ANDS
)
TOTA
L(R
THO
USAN
DS)
% O
F GU
ARAN
TEED
PA
CKAG
E
MA Dytor 3 887 50 2,00 75 2 916 25 82 398 3 314 69
KM Kathan 3 469 50 2,00 75 2 602 25 77 334 2 936 68
EE Ludick 2 541 50 2,00 75 1 813 25 70 211 2 024 57
MVK Matshitse 2 421 50 2,00 75 1 816 25 85 257 2 073 68
2015 LTI AWARDSNO. OF EARNINGS-
GROWTH UNITSMARKET VALUE BASED
ON ADJUSTED HEPSOF R6,63
(R THOUSANDS)
PERFORMANCESHARES
MARKET VALUE BASEDON AWARD PRICE (7-DAY
VWAP) OF R117,19(R THOUSANDS)
MA Dytor 392 862 2 605 27 783 3 256
KM Kathan 350 549 2 324 20 453 2 397
EE Ludick 243 999 1 618 10 785 1 264
MVK Matshitse 219 003 1 452 9 680 1 134
0
100
200
300
250
150
50
MU
LTIP
LE
TSR POSITION
12345678910111213141516
350
99
REMUNERATION REPORT
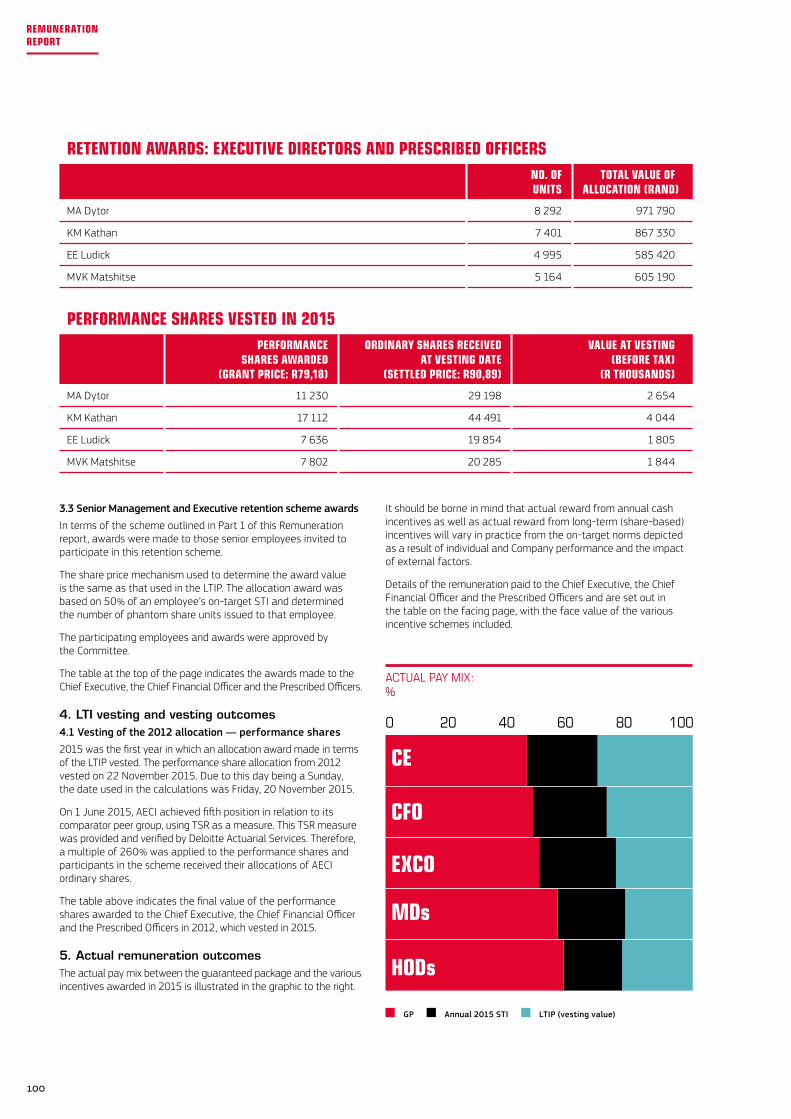
It should be borne in mind that actual reward from annual cash incentives as well as actual reward from long-term (share-based) incentives will vary in practice from the on-target norms depicted as a result of individual and Company performance and the impact of external factors.
Details of the remuneration paid to the Chief Executive, the Chief Financial Officer and the Prescribed Officers and are set out in the table on the facing page, with the face value of the various incentive schemes included.
3.3 Senior Management and Executive retention scheme awardsIn terms of the scheme outlined in Part 1 of this Remuneration report, awards were made to those senior employees invited to participate in this retention scheme.
The share price mechanism used to determine the award value is the same as that used in the LTIP. The allocation award was based on 50% of an employee’s on-target STI and determined the number of phantom share units issued to that employee.
The participating employees and awards were approved by the Committee.
The table at the top of the page indicates the awards made to the Chief Executive, the Chief Financial Officer and the Prescribed Officers.
4. LTI vesting and vesting outcomes4.1 Vesting of the 2012 allocation — performance shares2015 was the first year in which an allocation award made in terms of the LTIP vested. The performance share allocation from 2012 vested on 22 November 2015. Due to this day being a Sunday, the date used in the calculations was Friday, 20 November 2015.
On 1 June 2015, AECI achieved fifth position in relation to its comparator peer group, using TSR as a measure. This TSR measure was provided and verified by Deloitte Actuarial Services. Therefore, a multiple of 260% was applied to the performance shares and participants in the scheme received their allocations of AECI ordinary shares.
The table above indicates the final value of the performance shares awarded to the Chief Executive, the Chief Financial Officer and the Prescribed Officers in 2012, which vested in 2015.
5. Actual remuneration outcomesThe actual pay mix between the guaranteed package and the various incentives awarded in 2015 is illustrated in the graphic to the right.
RETENTION AWARDS: EXECUTIVE DIRECTORS AND PRESCRIBED OFFICERSNO. OFUNITS
TOTAL VALUE OFALLOCATION (RAND)
MA Dytor 8 292 971 790
KM Kathan 7 401 867 330
EE Ludick 4 995 585 420
MVK Matshitse 5 164 605 190
PERFORMANCE SHARES VESTED IN 2015PERFORMANCE
SHARES AWARDED(GRANT PRICE: R79,18)
ORDINARY SHARES RECEIVEDAT VESTING DATE
(SETTLED PRICE: R90,89)
VALUE AT VESTING(BEFORE TAX)
(R THOUSANDS)
MA Dytor 11 230 29 198 2 654
KM Kathan 17 112 44 491 4 044
EE Ludick 7 636 19 854 1 805
MVK Matshitse 7 802 20 285 1 844
ACTUALPAYMIX:%
GP Annual 2015 STI LTIP (vesting value)
HODs
MDs
EXCO
CFO
CE
80 1006040200
100
REMUNERATION REPORT
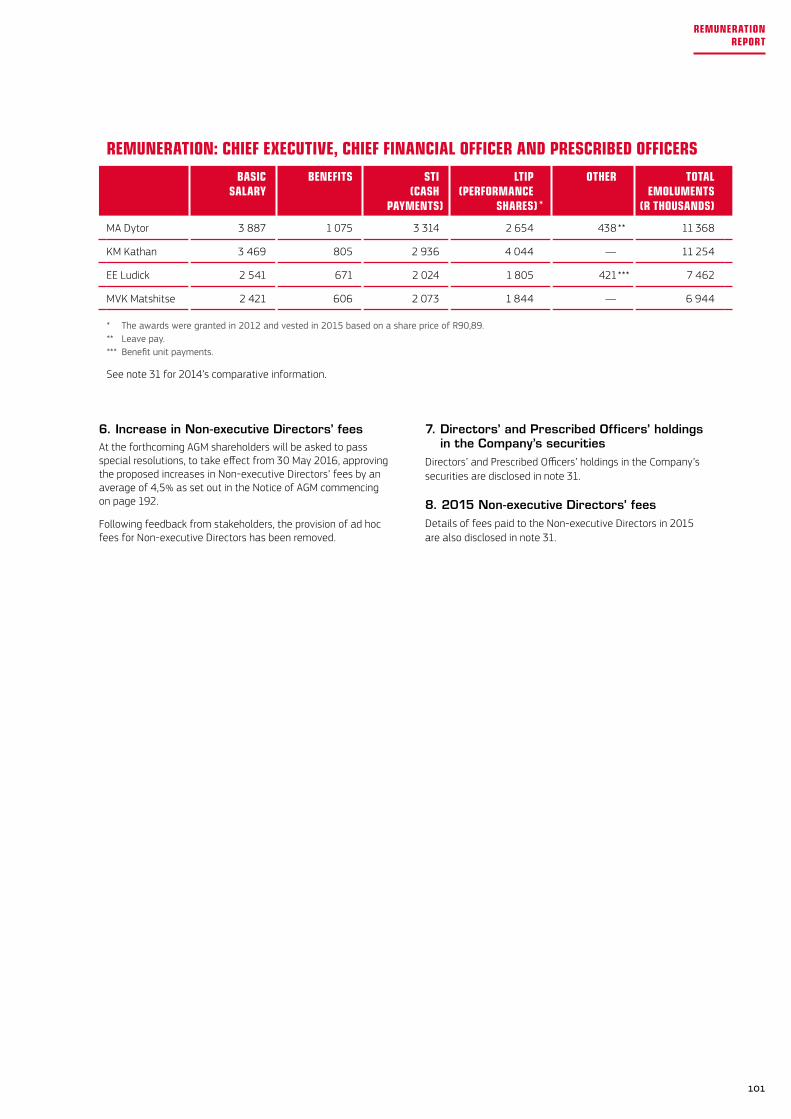
REMUNERATION: CHIEF EXECUTIVE, CHIEF FINANCIAL OFFICER AND PRESCRIBED OFFICERSBASIC
SALARYBENEFITS STI
(CASHPAYMENTS)
LTIP(PERFORMANCE
SHARES) *
OTHER TOTALEMOLUMENTS
(R THOUSANDS)
MA Dytor 3 887 1 075 3 314 2 654 438 ** 11 368
KM Kathan 3 469 805 2 936 4 044 — 11 254
EE Ludick 2 541 671 2 024 1 805 421 *** 7 462
MVK Matshitse 2 421 606 2 073 1 844 — 6 944
* The awards were granted in 2012 and vested in 2015 based on a share price of R90,89.** Leave pay.*** Benefit unit payments.
See note 31 for 2014’s comparative information.
7. Directors’ and Prescribed Officers’ holdings in the Company’s securities
Directors’ and Prescribed Officers’ holdings in the Company’s securities are disclosed in note 31.
8. 2015 Non-executive Directors’ feesDetails of fees paid to the Non-executive Directors in 2015 are also disclosed in note 31.
6. Increase in Non-executive Directors’ feesAt the forthcoming AGM shareholders will be asked to pass special resolutions, to take effect from 30 May 2016, approving the proposed increases in Non-executive Directors’ fees by an average of 4,5% as set out in the Notice of AGM commencing on page 192.
Following feedback from stakeholders, the provision of ad hoc fees for Non-executive Directors has been removed.
101
REMUNERATION REPORT
In Food Additives and Ingredients, the strategy is for the pillar to reach critical mass in South Africa and to expand into Africa thereafter. To this end AECI acquired SCP, a manufacturer and distributor of additives and ingredients for juice-based drinks and products, in Cape Town.
A solid portfolio of Specialty Chemicals businesses remains core for AECI. These businesses serve a diverse range of customers, mainly in the local manufacturing sector. The active management and enhancement of this portfolio ensures that synergies are maximised to boost overall efficiencies and that costs remain well controlled.
All remaining land surplus to operational requirements in Somerset West was sold in 2015. The Group still has about 216 hectares of surplus land at Modderfontein. AECI’s remaining property activities, mainly the leasing of buildings and the provision of services at the multi-user Umbogintwini Industrial Complex in KwaZulu-Natal, are managed by Acacia Real Estate, the Group’s property division.
DIRECTORS’ AND GROUP COMPANY SECRETARY’S INTERESTS IN SHARESAt 31 December 2015, the Directors and their associates (as defined in terms of the JSE Listings Requirements) had direct and indirect beneficial interests in the share capital of the Company as set out on the facing page. The direct beneficial interests of Messrs Dytor, Engelbrecht and Kathan were unchanged between the end of the financial year and as at the date of this report. The indirect beneficial interests of Mr Engelbrecht related to the interests of his spouse and were also unchanged year-on-year and as at the date of this report.
No Non-executive Director has been granted options or shares. The Executive Directors and the Prescribed Officers have been issued long-term incentive benefits as disclosed in note 30.
GOING-CONCERNThe financial statements have been prepared using appropriate accounting policies, supported by reasonable and prudent judgements and estimates. The Directors are of the opinion that the Company and its subsidiaries, joint arrangements and associates have adequate resources to continue as a going-concern in the foreseeable future.
BORROWING POWERSIn terms of its MOI the Company has unlimited borrowing powers.
The Directors have pleasure in submitting their report together with the consolidated and separate financial statements for the year ended 31 December 2015.
AECI was registered as a company in South Africa in 1924 and has been listed on the JSE since 1966. At the end of 2015 its market capitalisation was R10,8 billion.
NATURE OF BUSINESS
Profile and strategyAECI is a South African-based explosives and specialty chemicals company focused on providing products and services to a broad spectrum of customers in the mining, manufacturing and agricultural sectors. It has regional and international businesses in Africa, South East Asia, the USA and Australia. Other markets of interest are in Latin America.
The Group currently comprises 15 businesses and, at 31 December 2015, it had 6 246 employees.
The focus is on domestic growth as well as ongoing expansion outside South Africa in the Group’s chosen strategic areas of Mining Solutions, Water Solutions, Agrochemicals, and Food Additives and Ingredients. The proactive management of a portfolio of Specialty Chemicals businesses is the Group’s fifth growth pillar.
Mining Solutions is led by AEL Mining Services (“AEL”) and Senmin, Water Solutions by ImproChem and Agrochemicals by Nulandis. Lake Foods and Southern Canned Products (“SCP”) constitute the Food Additives and Ingredients pillar.
Mining Solutions is AECI’s international business. Both AEL and Senmin have their own unrestricted intellectual property, enabling them to service customers worldwide. Between them the two companies have close to 100 operations (including manufacturing plants, sales offices and distribution centres) in more than 20 countries, including an extensive footprint in Africa. AEL also has an established presence in Indonesia and Australia.
In 2015, AEL maintained its investment in R&D. Product innovation and enhancements are under the management of AEL’s specialist team at Modderfontein. Also in 2015, Senmin took occupation of its new state-of-the-art R&D facility in Sasolburg.
Business expansion in Africa is a thrust for Water Solutions and Agrochemicals.
ImproChem’s African footprint was enhanced in 2014 with the acquisition of the African water treatment business of Clariant Southern Africa. ImproChem is now a leading industrial, effluent and municipal water treatment chemical company in Africa.
Nulandis, which is leading the Group’s agrochemicals business growth in Africa, extended its footprint through the acquisition of Farmers Organisation, in Malawi. Farmers Organisation is a distributor of agrochemicals, seeds and spraying equipment to commercial farmers and the growing smallholder market. Also acquired and integrated with Nulandis was Biocult, a South African R&D-based company that develops and produces a range of soil-enhancing biological products.
102
DIRECTORS’ REPORT
Shareholders may direct any enquiries in this regard to the Company’s Transfer Secretaries on telephone number: +27 (0) 861 100 950 in South Africa, or +44 (0) 870 889 3176 in the United Kingdom.
DIVIDENDS TO ORDINARY AND PREFERENCE SHAREHOLDERSAn interim cash dividend of 125 cents was declared on 27 July 2015 and paid on 7 September 2015.
A final ordinary cash dividend of 260 cents was declared on 22 February 2016 and is payable on 11 April 2016.
A special dividend for the prior year of 375 cents was declared on 23 February 2015 and paid on 1 June 2015.
See note 14.
DEFINED-BENEFIT OBLIGATIONSIn 2015 the Company made good progress in de-risking its defined-benefit obligations and finalisation of the necessary processes was largely complete. See page 38 and notes 30 and 36.
CHANGES TO THE BOARDMr RL Hiemstra resigned as a Non-executive Director on 6 October 2015. Mr GW Dempster and Dr KDK Mokhele were appointed as Non-executive Directors with effect from 31 January 2016 and 1 March 2016, respectively.
INDEPENDENT AUDITORSThe independent auditors, KPMG Inc., will be recommended for reappointment at the forthcoming AGM to undertake the audit of the Company for the financial year ending 31 December 2016. All non-audit services provided by KPMG Inc. are tabled at and approved by the Audit Committee.
SHARE CAPITAL AND SHARE PREMIUMThe issued ordinary share capital of the Company, is 122 271 295 shares of R1 each (2014: 128 241 140) and 10 117 951 unlisted redeemable convertible B ordinary shares of no par value (2014: 10 117 951 shares). Also in issue are 3 000 000 listed 5,5% cumulative preference shares of R2 each (2013: 3 000 000 shares).
SHARE REPURCHASEDuring the year AECI undertook a general repurchase in terms of the general authority to repurchase shares approved by shareholders at the AGM of the Company held on 1 June 2015. 5 969 845 ordinary shares were repurchased, at an average price of R94,25 per share, for a total investment of R563 million. Of these, 5 000 000 had been cancelled by 31 December and the balance of 969 845 was cancelled in 2016.
Details of the share premium are provided in note 14.
STRATEThe dematerialisation of the Company’s issued shares commenced in July 2001. Shares still in paper form are no longer good for delivery and will need to be dematerialised before participation in any transaction.
DIRECTORS’ AND GROUP COMPANY SECRETARY’S INTERESTS IN SHARESNUMBER OF SHARES
2015Direct
2015Indirect
2014Direct
2014Indirect
EXECUTIVE DIRECTORSMA Dytor 26 803 — 10 015 —
KM Kathan 33 382 — 7 800 —
60 185 — 17 815 —
NON-EXECUTIVE DIRECTORS Engelbrecht 6 629 600 6 629 600
6 629 600 6 629 600
66 814 600 24 444 600
103
DIRECTORS’ REPORT
On 14 December 2015 the Department of Environmental Affairs, jointly with the City of Johannesburg executed a search and seizure operation at AEL Modderfontein. Management is cooperating with the Department and has submitted a response to its allegations, relating to AEL’s compliance with certain conditions of its air emissions licence. Feedback from the Department’s process is awaited.
DIRECTORS’ RESPONSIBILITY STATEMENTThe Directors whose names appear on pages 16 to 18 in this integrated report collectively and individually accept full responsibility for the accuracy of the information given and certify that, to the best of their knowledge and belief, there are no facts that have been omitted which would make any statement false or misleading, and that all reasonable enquiries to ascertain such facts have been made, and that this statement contains all information required by law and the JSE Listings Requirements.
The Directors acknowledge that their responsibility includes:
› designing, implementing and maintaining internal controls relevant to the preparation and fair presentation of these financial statements that are free from material misstatement, whether due to fraud or error;
› selecting and applying appropriate accounting policies; and
› making accounting estimates that are reasonable in the circumstances.
The Directors’ responsibility also includes ensuring that adequate accounting records and an effective system of risk management are maintained.
INTERESTS OF DIRECTORS AND OFFICERSDuring 2015, no contracts were entered into in which Directors had an interest and which significantly affected the business of the Group. The Directors and Prescribed Officers had no interests in any third party or company responsible for managing any of the business activities of the Group.
REMUNERATION AND EMPLOYEE INCENTIVE PARTICIPATION SCHEMESFull details regarding the remuneration and participation in the Group’s long-term incentive schemes by the Company’s Executive Directors and Prescribed Officers are disclosed in note 31 to the financial statements.
DIRECTORATE AND SECRETARYDetails of the Directorate and Secretary of the Company are published on pages 16 to 21.
In terms of the Company’s MOI Mr KM Kathan, Ms Z Fuphe, Mr G Gomwe and Adv R Ramashia retire by rotation at the forthcoming AGM and, being eligible, offer themselves for re-election.
Also in terms of the Company’s MOI, the appointments of Mr GW Dempster and Dr KDK Mokhele will be confirmed at the AGM.
MAJOR SHAREHOLDERSDetails of the interests of shareholders who are directly or indirectly beneficially interested in 3% or more of the Company’s share capital are included in the shareholder analysis commencing on page 105.
SPECIAL RESOLUTIONSThe Company passed the following special resolutions at the AGM held on 1 June 2015:
1. to approve the annual fees payable by the Company to its Non-executive Directors;
2. to grant the Directors a general authority to repurchase the Company’s issued shares; and
3. to grant the Directors the authority to cause the Company to provide financial assistance to any company or other legal entity which is related or inter-related to the Company.
No special resolutions referred to in paragraph 8.63(i) of the JSE Listings Requirements were passed by its subsidiary companies.
MATERIAL CHANGESThere have been no material changes in the financial or trading position of the Company and its subsidiaries since 31 December 2015.
REGULATORY INTERACTIONAs reported in 2014, the investigation process undertaken by the Competition Commission of South Africa (“the Commission”) was completed in the first quarter of 2015 and the Company awaits the Commission’s ruling in this regard.
104
DIRECTORS’ REPORT
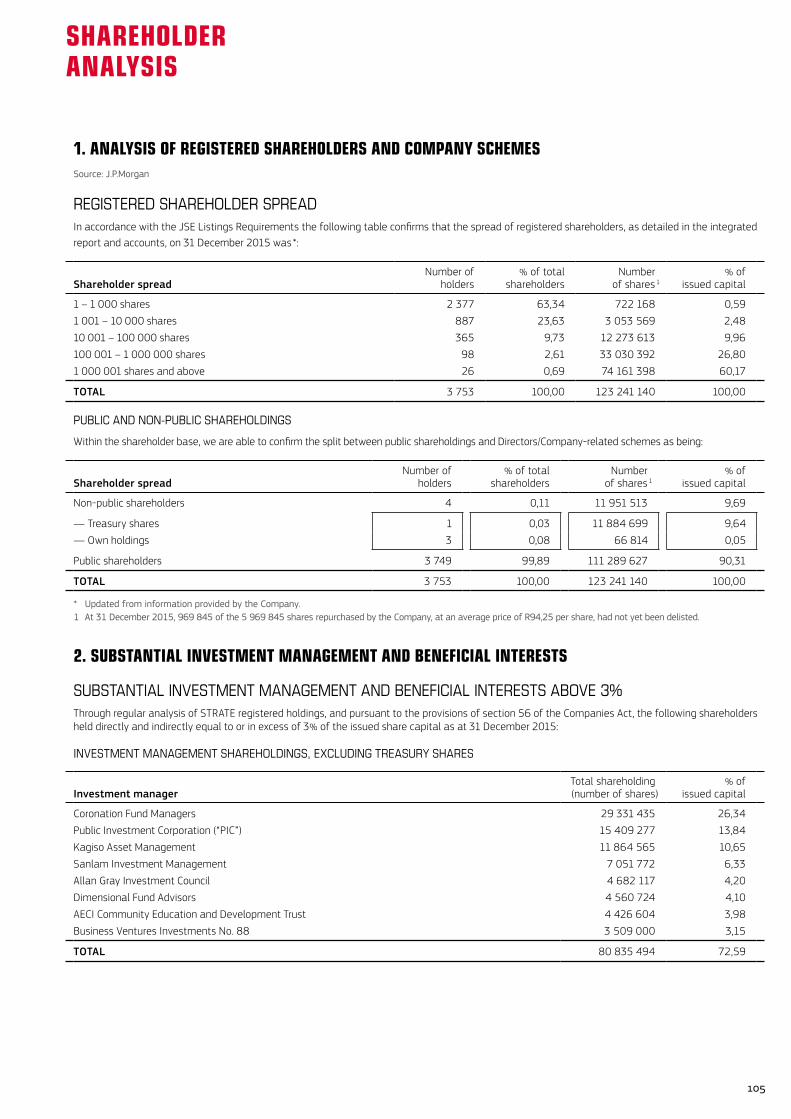
1. ANALYSIS OF REGISTERED SHAREHOLDERS AND COMPANY SCHEMESSource: J.P.Morgan
REGISTERED SHAREHOLDER SPREADIn accordance with the JSE Listings Requirements the following table confirms that the spread of registered shareholders, as detailed in the integrated report and accounts, on 31 December 2015 was *:
Shareholder spreadNumber of
holders% of total
shareholdersNumber
of shares 1% of
issued capital
1 – 1 000 shares 2 377 63,34 722 168 0,59
1 001 – 10 000 shares 887 23,63 3 053 569 2,48
10 001 – 100 000 shares 365 9,73 12 273 613 9,96
100 001 – 1 000 000 shares 98 2,61 33 030 392 26,80
1 000 001 shares and above 26 0,69 74 161 398 60,17
TOTAL 3 753 100,00 123 241 140 100,00
PUBLIC AND NON-PUBLIC SHAREHOLDINGS
Within the shareholder base, we are able to confirm the split between public shareholdings and Directors/Company-related schemes as being:
Shareholder spreadNumber of
holders% of total
shareholdersNumber
of shares 1% of
issued capital
Non-public shareholders 4 0,11 11 951 513 9,69
— Treasury shares 1 0,03 11 884 699 9,64
— Own holdings 3 0,08 66 814 0,05
Public shareholders 3 749 99,89 111 289 627 90,31
TOTAL 3 753 100,00 123 241 140 100,00
* Updated from information provided by the Company.1 At 31 December 2015, 969 845 of the 5 969 845 shares repurchased by the Company, at an average price of R94,25 per share, had not yet been delisted.
2. SUBSTANTIAL INVESTMENT MANAGEMENT AND BENEFICIAL INTERESTS
SUBSTANTIAL INVESTMENT MANAGEMENT AND BENEFICIAL INTERESTS ABOVE 3%Through regular analysis of STRATE registered holdings, and pursuant to the provisions of section 56 of the Companies Act, the following shareholders held directly and indirectly equal to or in excess of 3% of the issued share capital as at 31 December 2015:
INVESTMENT MANAGEMENT SHAREHOLDINGS, EXCLUDING TREASURY SHARES
Investment managerTotal shareholding(number of shares)
% ofissued capital
Coronation Fund Managers 29 331 435 26,34
Public Investment Corporation (“PIC”) 15 409 277 13,84
Kagiso Asset Management 11 864 565 10,65
Sanlam Investment Management 7 051 772 6,33
Allan Gray Investment Council 4 682 117 4,20
Dimensional Fund Advisors 4 560 724 4,10
AECI Community Education and Development Trust 4 426 604 3,98
Business Ventures Investments No. 88 3 509 000 3,15
TOTAL 80 835 494 72,59
105
SHAREHOLDER ANALYSIS
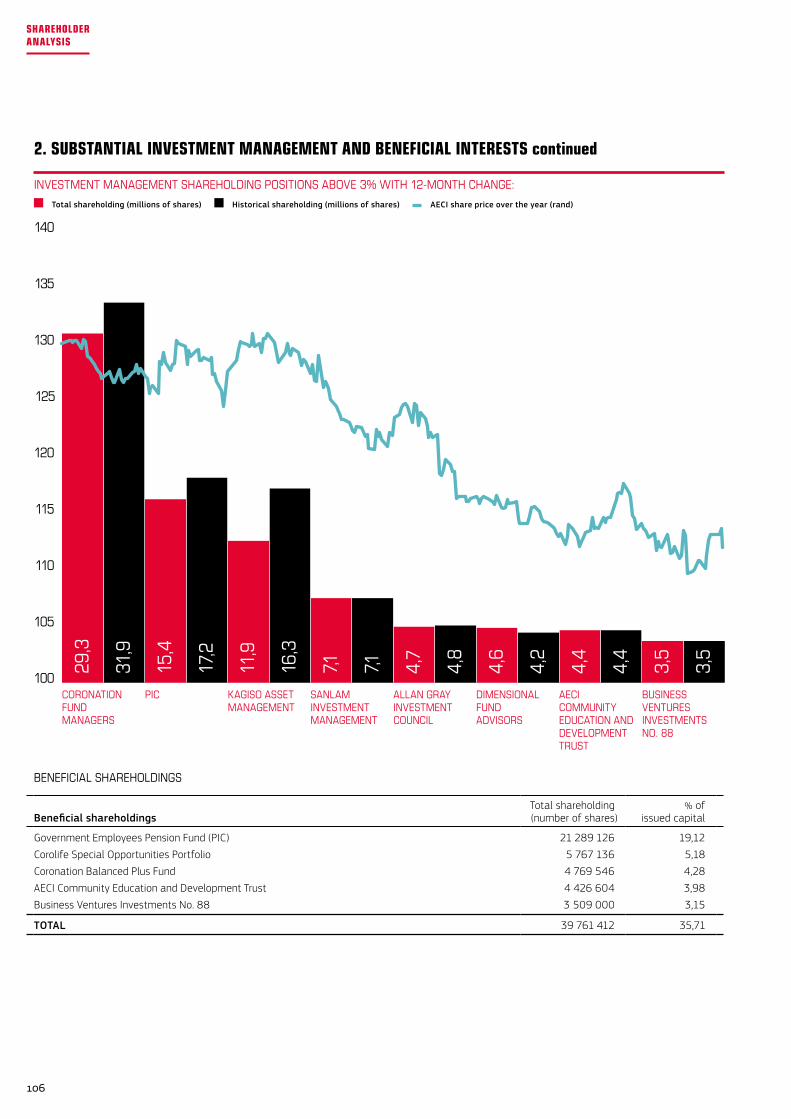
2. SUBSTANTIAL INVESTMENT MANAGEMENT AND BENEFICIAL INTERESTS continued
BENEFICIAL SHAREHOLDINGS
Beneficial shareholdingsTotal shareholding(number of shares)
% ofissued capital
Government Employees Pension Fund (PIC) 21 289 126 19,12
Corolife Special Opportunities Portfolio 5 767 136 5,18
Coronation Balanced Plus Fund 4 769 546 4,28
AECI Community Education and Development Trust 4 426 604 3,98
Business Ventures Investments No. 88 3 509 000 3,15
TOTAL 39 761 412 35,71
INVESTMENTMANAGEMENTSHAREHOLDINGPOSITIONSABOVE3%WITH12-MONTHCHANGE:
140
135
130
125
115
120
100
105
110
AECI COMMUNITY EDUCATION AND DEVELOPMENT TRUST
DIMENSIONALFUND ADVISORS
BUSINESSVENTURESINVESTMENTSNO. 88
CORONATIONFUNDMANAGERS
PIC KAGISO ASSETMANAGEMENT
SANLAMINVESTMENTMANAGEMENT
ALLAN GRAYINVESTMENTCOUNCIL
29,3
31,9
15,4
17,2
11,9
16,3
7,1 7,1 4,7
4,8
4,6
4,2
4,4
4,4
3,5
3,5
Total shareholding (millions of shares) Historical shareholding (millions of shares) AECI share price over the year (rand)
106
SHAREHOLDER ANALYSIS
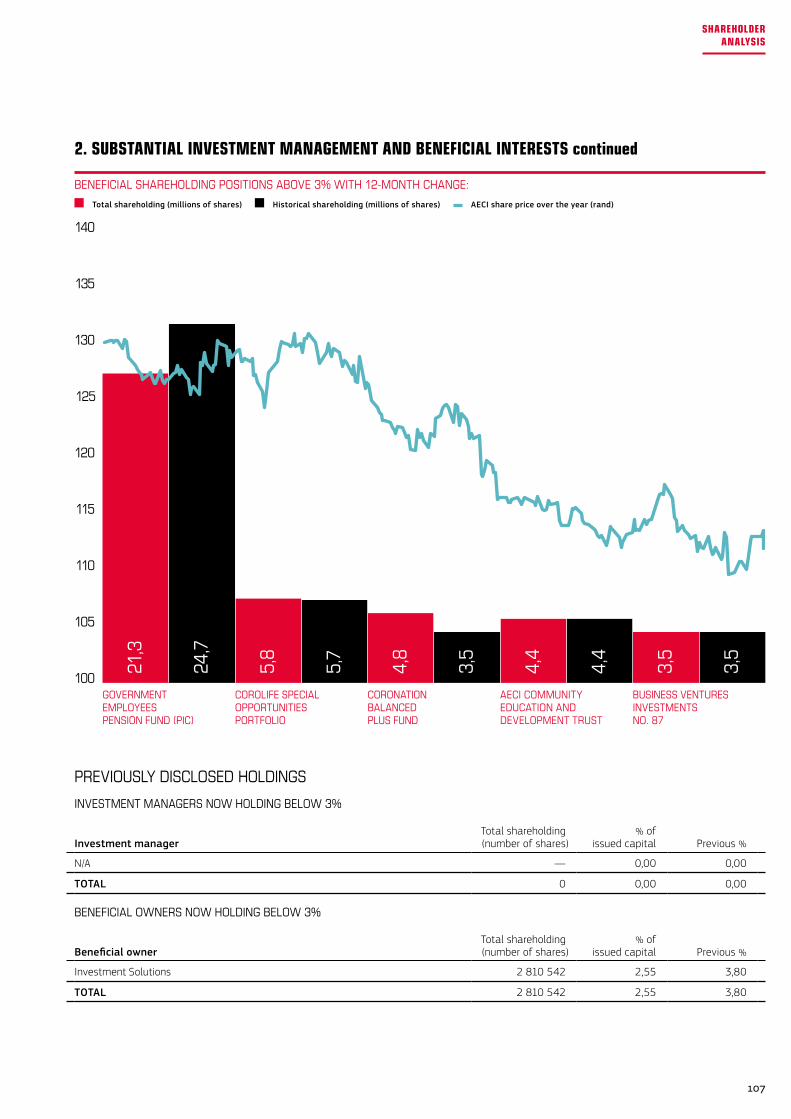
2. SUBSTANTIAL INVESTMENT MANAGEMENT AND BENEFICIAL INTERESTS continued
PREVIOUSLY DISCLOSED HOLDINGS
INVESTMENT MANAGERS NOW HOLDING BELOW 3%
Investment managerTotal shareholding(number of shares)
% ofissued capital Previous %
N/A — 0,00 0,00
TOTAL 0 0,00 0,00
BENEFICIAL OWNERS NOW HOLDING BELOW 3%
Beneficial ownerTotal shareholding(number of shares)
% ofissued capital Previous %
Investment Solutions 2 810 542 2,55 3,80
TOTAL 2 810 542 2,55 3,80
BENEFICIALSHAREHOLDINGPOSITIONSABOVE3%WITH12-MONTHCHANGE:
140
135
130
125
115
120
100
105
110
GOVERNMENT EMPLOYEES PENSION FUND (PIC)
21,3
24,7
COROLIFE SPECIAL OPPORTUNITIES PORTFOLIO
5,8
5,7
CORONATION BALANCED PLUS FUND
4,8
3,5
AECI COMMUNITY EDUCATION AND DEVELOPMENT TRUST
4,4
4,4
BUSINESS VENTURES INVESTMENTS NO. 87
3,5
3,5
Total shareholding (millions of shares) Historical shareholding (millions of shares) AECI share price over the year (rand)
107
SHAREHOLDER ANALYSIS
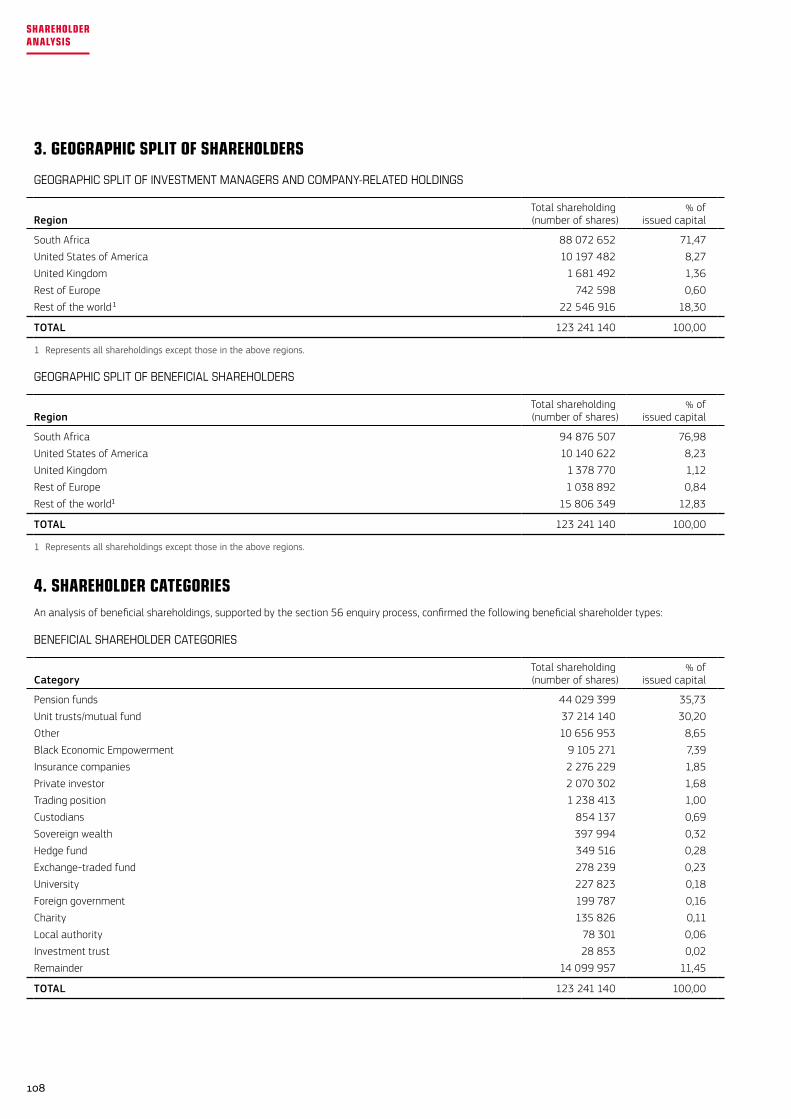
3. GEOGRAPHIC SPLIT OF SHAREHOLDERS
GEOGRAPHIC SPLIT OF INVESTMENT MANAGERS AND COMPANY-RELATED HOLDINGS
RegionTotal shareholding(number of shares)
% ofissued capital
South Africa 88 072 652 71,47
United States of America 10 197 482 8,27
United Kingdom 1 681 492 1,36
Rest of Europe 742 598 0,60
Rest of the world ¹ 22 546 916 18,30
TOTAL 123 241 140 100,00
1 Represents all shareholdings except those in the above regions.
GEOGRAPHIC SPLIT OF BENEFICIAL SHAREHOLDERS
RegionTotal shareholding(number of shares)
% ofissued capital
South Africa 94 876 507 76,98
United States of America 10 140 622 8,23
United Kingdom 1 378 770 1,12
Rest of Europe 1 038 892 0,84
Rest of the world¹ 15 806 349 12,83
TOTAL 123 241 140 100,00
1 Represents all shareholdings except those in the above regions.
4. SHAREHOLDER CATEGORIESAn analysis of beneficial shareholdings, supported by the section 56 enquiry process, confirmed the following beneficial shareholder types:
BENEFICIAL SHAREHOLDER CATEGORIES
CategoryTotal shareholding(number of shares)
% ofissued capital
Pension funds 44 029 399 35,73
Unit trusts/mutual fund 37 214 140 30,20
Other 10 656 953 8,65
Black Economic Empowerment 9 105 271 7,39
Insurance companies 2 276 229 1,85
Private investor 2 070 302 1,68
Trading position 1 238 413 1,00
Custodians 854 137 0,69
Sovereign wealth 397 994 0,32
Hedge fund 349 516 0,28
Exchange-traded fund 278 239 0,23
University 227 823 0,18
Foreign government 199 787 0,16
Charity 135 826 0,11
Local authority 78 301 0,06
Investment trust 28 853 0,02
Remainder 14 099 957 11,45
TOTAL 123 241 140 100,00
108
SHAREHOLDER ANALYSIS
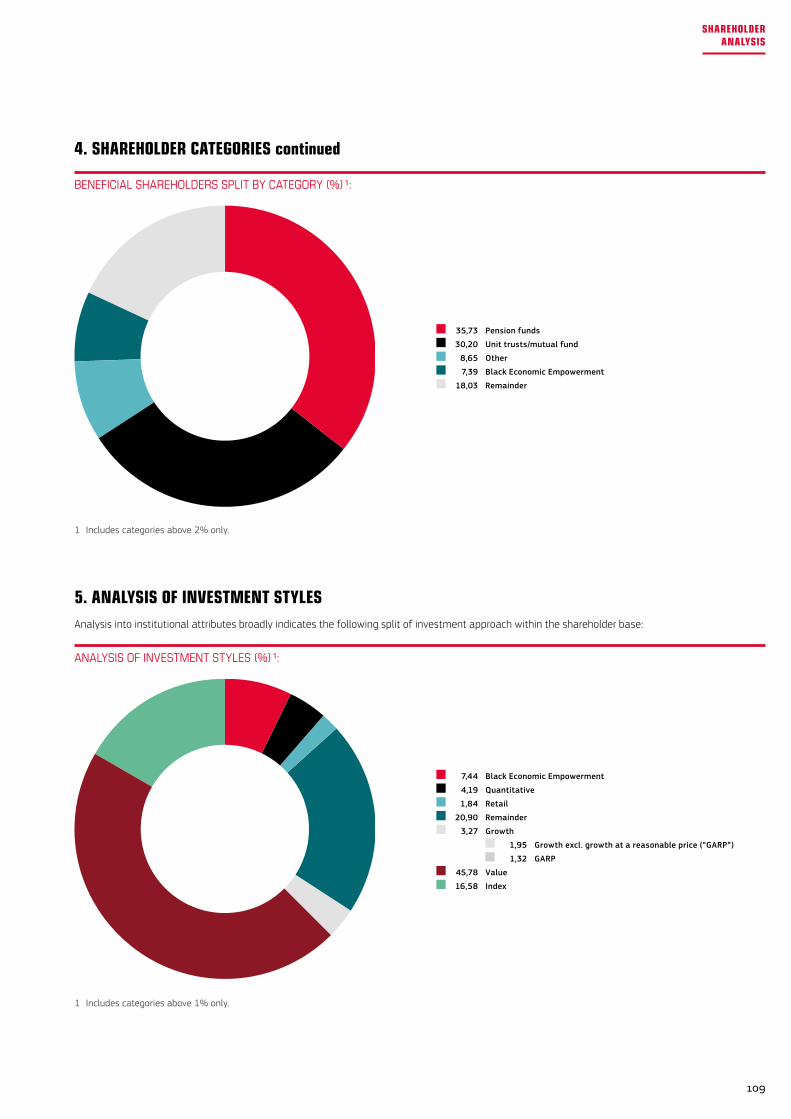
4. SHAREHOLDER CATEGORIES continued
5. ANALYSIS OF INVESTMENT STYLESAnalysis into institutional attributes broadly indicates the following split of investment approach within the shareholder base:
BENEFICIALSHAREHOLDERSSPLITBYCATEGORY(%)¹:
ANALYSISOFINVESTMENTSTYLES(%)¹:
35,73 Pension funds
30,20 Unit trusts/mutual fund
8,65 Other
7,39 Black Economic Empowerment
18,03 Remainder
7,44 Black Economic Empowerment
4,19 Quantitative
1,84 Retail
20,90 Remainder
3,27 Growth
1,95 Growth excl. growth at a reasonable price (“GARP”)
1,32 GARP
45,78 Value
16,58 Index
1 Includes categories above 2% only.
1 Includes categories above 1% only.
109
SHAREHOLDER ANALYSIS
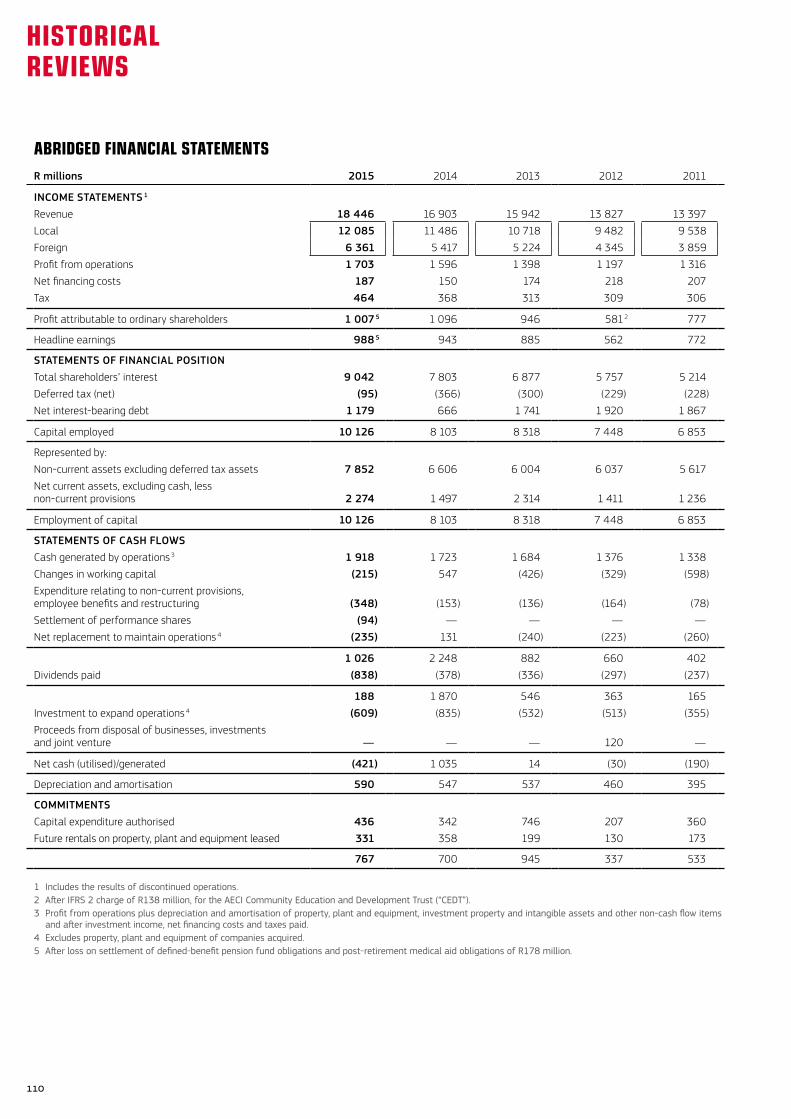
ABRIDGED FINANCIAL STATEMENTSR millions 2015 2014 2013 2012 2011
INCOME STATEMENTS 1
Revenue 18 446 16 903 15 942 13 827 13 397
Local 12 085 11 486 10 718 9 482 9 538
Foreign 6 361 5 417 5 224 4 345 3 859
Profit from operations 1 703 1 596 1 398 1 197 1 316
Net financing costs 187 150 174 218 207
Tax 464 368 313 309 306
Profit attributable to ordinary shareholders 1 007 5 1 096 946 581 2 777
Headline earnings 988 5 943 885 562 772
STATEMENTS OF FINANCIAL POSITIONTotal shareholders’ interest 9 042 7 803 6 877 5 757 5 214
Deferred tax (net) (95) (366) (300) (229) (228)
Net interest-bearing debt 1 179 666 1 741 1 920 1 867
Capital employed 10 126 8 103 8 318 7 448 6 853
Represented by:
Non-current assets excluding deferred tax assets 7 852 6 606 6 004 6 037 5 617
Net current assets, excluding cash, less non-current provisions 2 274 1 497 2 314 1 411 1 236
Employment of capital 10 126 8 103 8 318 7 448 6 853
STATEMENTS OF CASH FLOWSCash generated by operations 3 1 918 1 723 1 684 1 376 1 338
Changes in working capital (215) 547 (426) (329) (598)
Expenditure relating to non-current provisions, employee benefits and restructuring (348) (153) (136) (164) (78)
Settlement of performance shares (94) — — — —
Net replacement to maintain operations 4 (235) 131 (240) (223) (260)
1 026 2 248 882 660 402
Dividends paid (838) (378) (336) (297) (237)
188 1 870 546 363 165
Investment to expand operations 4 (609) (835) (532) (513) (355)
Proceeds from disposal of businesses, investments and joint venture — — — 120 —
Net cash (utilised)/generated (421) 1 035 14 (30) (190)
Depreciation and amortisation 590 547 537 460 395
COMMITMENTSCapital expenditure authorised 436 342 746 207 360
Future rentals on property, plant and equipment leased 331 358 199 130 173
767 700 945 337 533
1 Includes the results of discontinued operations.2 After IFRS 2 charge of R138 million, for the AECI Community Education and Development Trust (“CEDT”).3 Profit from operations plus depreciation and amortisation of property, plant and equipment, investment property and intangible assets and other non-cash flow items
and after investment income, net financing costs and taxes paid.4 Excludes property, plant and equipment of companies acquired.5 After loss on settlement of defined-benefit pension fund obligations and post-retirement medical aid obligations of R178 million.
110
HISTORICAL REVIEWS
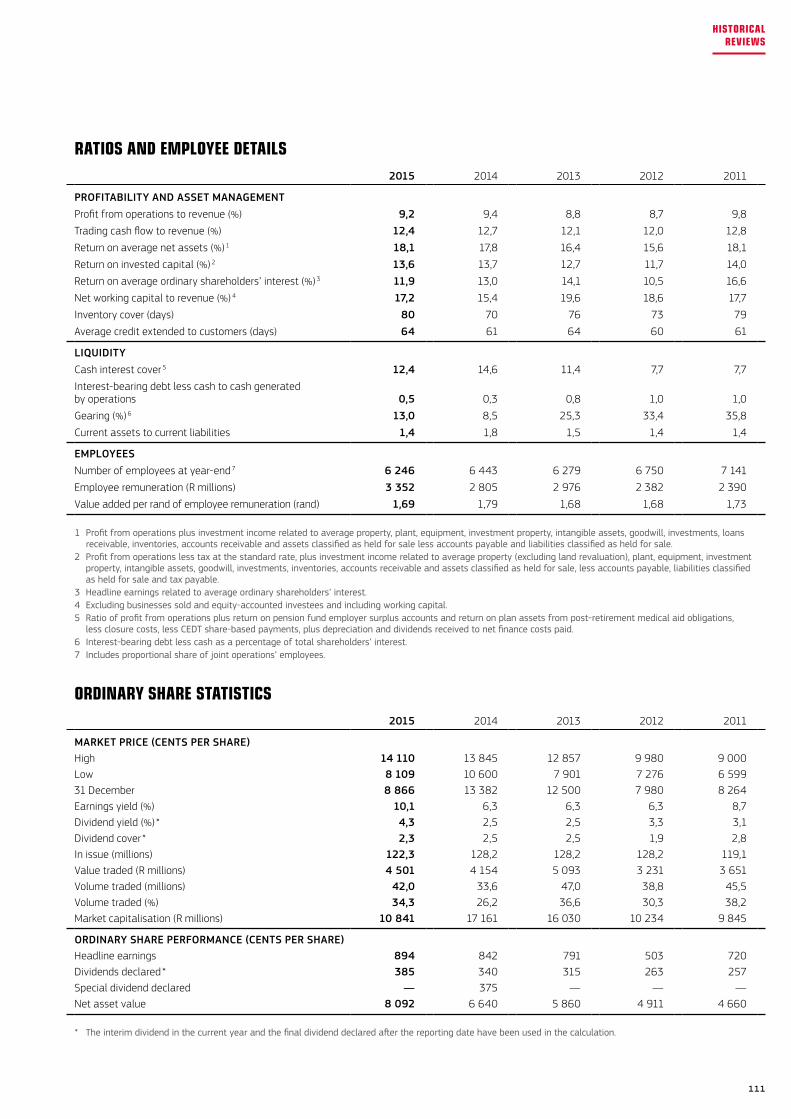
RATIOS AND EMPLOYEE DETAILS2015 2014 2013 2012 2011
PROFITABILITY AND ASSET MANAGEMENTProfit from operations to revenue (%) 9,2 9,4 8,8 8,7 9,8
Trading cash flow to revenue (%) 12,4 12,7 12,1 12,0 12,8
Return on average net assets (%) 1 18,1 17,8 16,4 15,6 18,1
Return on invested capital (%) 2 13,6 13,7 12,7 11,7 14,0
Return on average ordinary shareholders’ interest (%) 3 11,9 13,0 14,1 10,5 16,6
Net working capital to revenue (%) 4 17,2 15,4 19,6 18,6 17,7
Inventory cover (days) 80 70 76 73 79
Average credit extended to customers (days) 64 61 64 60 61
LIQUIDITYCash interest cover 5 12,4 14,6 11,4 7,7 7,7
Interest-bearing debt less cash to cash generated by operations 0,5 0,3 0,8 1,0 1,0
Gearing (%) 6 13,0 8,5 25,3 33,4 35,8
Current assets to current liabilities 1,4 1,8 1,5 1,4 1,4
EMPLOYEES Number of employees at year-end 7 6 246 6 443 6 279 6 750 7 141
Employee remuneration (R millions) 3 352 2 805 2 976 2 382 2 390
Value added per rand of employee remuneration (rand) 1,69 1,79 1,68 1,68 1,73
1 Profit from operations plus investment income related to average property, plant, equipment, investment property, intangible assets, goodwill, investments, loans receivable, inventories, accounts receivable and assets classified as held for sale less accounts payable and liabilities classified as held for sale.
2 Profit from operations less tax at the standard rate, plus investment income related to average property (excluding land revaluation), plant, equipment, investment property, intangible assets, goodwill, investments, inventories, accounts receivable and assets classified as held for sale, less accounts payable, liabilities classified as held for sale and tax payable.
3 Headline earnings related to average ordinary shareholders’ interest.4 Excluding businesses sold and equity-accounted investees and including working capital.5 Ratio of profit from operations plus return on pension fund employer surplus accounts and return on plan assets from post-retirement medical aid obligations,
less closure costs, less CEDT share-based payments, plus depreciation and dividends received to net finance costs paid.6 Interest-bearing debt less cash as a percentage of total shareholders’ interest.7 Includes proportional share of joint operations’ employees.
ORDINARY SHARE STATISTICS2015 2014 2013 2012 2011
MARKET PRICE (CENTS PER SHARE)High 14 110 13 845 12 857 9 980 9 000Low 8 109 10 600 7 901 7 276 6 59931 December 8 866 13 382 12 500 7 980 8 264Earnings yield (%) 10,1 6,3 6,3 6,3 8,7Dividend yield (%) * 4,3 2,5 2,5 3,3 3,1Dividend cover * 2,3 2,5 2,5 1,9 2,8In issue (millions) 122,3 128,2 128,2 128,2 119,1Value traded (R millions) 4 501 4 154 5 093 3 231 3 651Volume traded (millions) 42,0 33,6 47,0 38,8 45,5Volume traded (%) 34,3 26,2 36,6 30,3 38,2 Market capitalisation (R millions) 10 841 17 161 16 030 10 234 9 845
ORDINARY SHARE PERFORMANCE (CENTS PER SHARE)Headline earnings 894 842 791 503 720Dividends declared * 385 340 315 263 257Special dividend declared — 375 — — —Net asset value 8 092 6 640 5 860 4 911 4 660
* The interim dividend in the current year and the final dividend declared after the reporting date have been used in the calculation.
111
HISTORICAL REVIEWS
I hereby confirm that AECI Ltd has lodged with the Registrar of Companies all such returns in respect of the year under review as are required of a public company in terms of the Companies Act, and that all such returns are, to the best of my knowledge and belief, true, correct and up-to-date.
Nomini Rapoo Group Company Secretary
Woodmead, Sandton 11 April 2016
The Group annual financial statements and Company annual financial statements were published on 11 April 2016 and are for the year ended 31 December 2015. These comprise the Audit Committee’s report to stakeholders, the Directors’ report, the Declaration by the Group Company Secretary, the Independent Auditor’s report, the Basis of Reporting and Significant Accounting Policies, and the financial statements.
The financial statements have been audited as required by the Companies Act and their preparation was supervised by the Chief Financial Officer, Mr KM Kathan CA(SA), AMP (Harvard).
112
DECLARATION BY THE GROUP COMPANY SECRETARY
PREPARATION OF ANNUAL FINANCIAL STATEMENTS
OpinionIn our opinion these financial statements present fairly, in all material respects, the consolidated and separate financial position of AECI Ltd at 31 December 2015, and its consolidated and separate financial performance and consolidated and separate cash flows for the year then ended in accordance with International Financial Reporting Standards and the requirements of the Companies Act of South Africa.
Other reports required by the Companies ActAs part of our audit of the financial statements for the year ended 31 December 2015, we have read the Directors’ report, the Audit Committee’s report to stakeholders and the declaration by the Group Company Secretary for the purpose of identifying whether there are material inconsistencies between those reports and the audited financial statements. Those reports are the responsibility of the respective preparers. Based on reading those reports we have not identified material inconsistencies between those reports and the audited financial statements. However, we have not audited those reports and, accordingly, do not express an opinion on those reports.
Report on other legal and regulatory requirementsIn terms of the Independent Regulatory Board for Auditors’ rule published in the Government Gazette No. 39475 dated 4 December 2015, we report that KPMG Inc. has been the auditor of AECI Ltd for 91 years.
KPMG Inc. Registered Auditor
Per ML Watson Chartered Accountant (SA) Registered Auditor, Director
85 Empire Road, Parktown Johannesburg, 2193 11 April 2016
TO THE SHAREHOLDERS OF AECI LIMITED
Report on the financial statementsWe have audited the Group financial statements and financial statements of AECI Ltd, which comprise the statements of financial position at 31 December 2015, and the income statements, statements of comprehensive income, changes in equity and cash flows for the year then ended, and the notes to the financial statements which include a summary of significant accounting policies and other explanatory notes, as set out on pages 114 to 191.
Directors’ responsibility for the financial statementsThe Company’s Directors are responsible for the preparation and fair presentation of these financial statements in accordance with International Financial Reporting Standards and the requirements of the Companies Act of South Africa, and for such internal controls as the Directors determine necessary to enable the preparation of financial statements that are free from material misstatement, whether due to fraud or error.
Auditor’s responsibilityOur responsibility is to express an opinion on these financial statements based on our audit. We conducted our audit in accordance with International Standards on Auditing. Those standards require that we comply with ethical requirements and plan and perform the audit to obtain reasonable assurance about whether the financial statements are free from material misstatement.
An audit involves performing procedures to obtain audit evidence about the amounts and disclosures in the financial statements. The procedures selected depend on the auditor’s judgement, including the assessment of the risks of material misstatement of the financial statements, whether due to fraud or error. In making those risk assessments, the auditor considers internal controls relevant to the entity’s preparation and fair presentation of the financial statements in order to design audit procedures that are appropriate in the circumstances, but not for the purpose of expressing an opinion on the effectiveness of the entity’s internal control. An audit also includes evaluating the appropriateness of accounting policies used and the reasonableness of accounting estimates made by management, as well as evaluating the overall presentation of the financial statements.
We believe that the audit evidence we have obtained is sufficient and appropriate to provide a basis for our audit opinion.
113
INDEPENDENT AUDITOR’S REPORT
› Amendments to IFRS 10 and IAS 28 Sale or Contribution of Assets between an Investor and its Associate or Joint Venture — the amendments require the full gain to be recognised when assets transferred between an investor and its associate or joint venture meet the definition of a “business” under IFRS 3 Business Combinations. Where the assets transferred do not meet the definition of a business, a partial gain to the extent of unrelated investors’ interests in the associate or joint venture is recognised. The definition of a business is key to determining the extent of the gain to be recognised.
The amendments apply prospectively for annual periods beginning on or after 1 January 2016 and will be applied when a sale or contribution of assets occurs.
› Amendments to IFRS 11 Accounting for Acquisitions of Interests in Joint Operations — the amendments require business combination accounting to be applied to acquisitions of interests in a joint operation that constitutes a business.
Business combination accounting also applies to the acquisition of additional interests in a joint operation while the joint operator retains joint control. The additional interest acquired will be measured at fair value. The previously held interest in the joint operation will not be remeasured. As a consequence of these amendments, the Group will amend its accounting policy with effect from 1 January 2016 for acquisitions of interests in a joint operation.
The amendments apply prospectively for annual periods beginning on or after 1 January 2016.
› IFRS 15 Revenue from Contracts with Customers — relating to the principles that an entity will apply to determine the measurement of revenue and timing of when it is recognised. The underlying principle is that an entity will recognise revenue to depict the transfer of goods or services to customers at an amount that the entity expects to be entitled to in exchange for those goods or services at a point in time or over time.
The effective date for adoption of this standard is for periods commencing on or after 1 January 2018. AECI is reviewing the effects of the standard and will consider adoption when appropriate.
› Amendments to IAS 1 Disclosure Initiative — the amendments provide additional guidance on the application of materiality and aggregation when preparing financial statements.
The amendments apply to annual periods beginning on or after 1 January 2016.
› Amendments to IAS 16 and IAS 38 Clarification of Acceptable Methods of Depreciation and Amortisation — the amendments to IAS 16 Property, Plant and Equipment state explicitly that revenue-based methods of depreciation cannot be used for property, plant and equipment.
The amendments to IAS 38 Intangible Assets introduce a rebuttable presumption that the use of revenue-based amortisation methods for intangible assets is inappropriate. The presumption can be overcome only when revenue and the consumption of the economic benefits of the intangible asset are “highly correlated”, or when the intangible asset is expressed as a measure of revenue.
REPORTING ENTITYAECI Ltd (“the Company”) is a public company domiciled in South Africa. The address of the Company’s registered office is the First Floor, AECI Place, 24 The Woodlands, Woodlands Drive, Woodmead, Sandton. The consolidated financial statements of the Company for the year ended 31 December 2015 comprise the Company and its subsidiaries (together referred to as “the Group” and individually as “Group entities” or “business entities”) and the Group’s interest in associates and joint arrangements. The Group is involved primarily in the manufacture and distribution of commercial explosives, mainly to the mining sector, specialty chemicals for the mining, manufacturing and agricultural sectors, as well as the management of those property assets which the Group still owns.
Basis of preparation
Statement of complianceThe Group financial statements and the Company financial statements have been prepared in compliance with IFRS, and interpretations of those standards as adopted by the IASB, the SAICA Financial Reporting Guides issued by the Accounting Practices Committee, Financial Pronouncements as issued by the Financial Reporting Standards Council, the JSE Listings Requirements and in accordance with the requirements of the Companies Act.
The following accounting standards, interpretations and amendments to published accounting standards, which are relevant to the Group but not yet effective, have not been adopted in the current year and will be applied in the reporting period in which they become effective:
› IFRS 9 Financial Instruments — this standard replaces earlier versions of IFRS 9 and completes the IASB’s project to replace IAS 39 Financial Instruments: Recognition and Measurement.
This standard may have an impact on the Group, which will include changes in the measurement bases of the Group’s financial assets to amortised cost, fair value through other comprehensive income or fair value through profit and loss. Even though these measurement categories are similar to IAS 39, the criteria for classification into these categories are significantly different. In addition, the IFRS 9 impairment model has been changed from an “incurred loss” model of IAS 39 to an “expected credit loss” model.
The standard is effective for annual periods beginning on or after 1 January 2018 with retrospective application. AECI is assessing the potential impact on the Group of the application of IFRS 9.
114
BASIS OF REPORTING AND SIGNIFICANT ACCOUNTING POLICIES
Environmental remediationEstimating the future costs of environmental remediation obligations is complex and requires management to make estimates and judgements because most of the obligations will be fulfilled in the future and laws are often not clear regarding what is required. The resulting provisions are influenced further by changing technologies and social, political, environmental, safety, business and statutory considerations. As explained in note 16 to the financial statements, the Group has to apply judgement in determining the environmental remediation provision. The provision may need to be adjusted when detailed characterisation of the land is performed or when the end use is determined.
Asset lives and residual valuesProperty, plant and equipment, investment property and intangible assets are depreciated or amortised over their estimated useful lives taking into account residual values, where appropriate. The actual lives of the assets and residual values are assessed annually and may vary depending on a number of factors. In reassessing asset lives, factors such as technological innovation, product lifecycles and maintenance programmes are taken into account. Residual value assessments consider issues such as current market conditions, the remaining useful life of an asset and disposal values.
Post-retirement benefit obligationsPost-retirement defined benefits are provided for certain existing and former employees. Actuarial valuations are based on assumptions which include employee turnover, mortality rates, the discount rate, the expected long-term rate of return of retirement plan assets, healthcare inflation costs and rates of increase in compensation costs. The net present value of current estimates for post-retirement medical aid benefits has been discounted to its present value at 10,0% per annum (2014: 8,3%) being the estimated investment return assuming the liability is fully funded. Medical cost inflation of CPI +1% per annum has been assumed (2014: CPI +1%). See note 30 to the financial statements.
ImpairmentsAn asset is impaired when its carrying amount exceeds its recoverable amount. Goodwill and intangible assets with indefinite useful lives are tested for impairment annually while other assets are tested if there is an indication that they may be impaired. The assessment of recoverable amounts involves the application of judgement relating to the calculation of value-in-use, which is based on cash flow projections, variations in the amount and timing of these cash flows and the discount rate used to determine the present value of those future cash flows.
These are assessed for each cash-generating unit to which goodwill is attributed or for the cash-generating unit or asset where indicators of impairment have been assessed. See note 4 for significant assumptions on value-in-use for goodwill.
The amendments apply prospectively for annual periods beginning on or after 1 January 2016. These amendments are not expected to have a significant impact on the Group.
Basis of measurementThe Group financial statements and the Company financial statements have been prepared on the going-concern basis using the historical cost convention, except for available-for-sale financial assets, derivative instruments, contingent consideration, pension fund employer surplus accounts and liabilities which are measured at fair value. Equity-settled share-based payments are measured at fair value at the grant date.
Functional and presentation currencyThe Group financial statements and the Company financial statements have been prepared in South African rand, which is the Company’s functional currency. All the financial information has been rounded to the nearest million of rand, except where otherwise stated.
Judgements made by management and sources of estimation uncertaintyThe preparation of the financial statements in conformity with IFRS requires management to make judgements, estimates and assumptions that affect the application of policies and reported amounts of assets and liabilities, income and expenses. The estimates and associated assumptions are based on historical experience and various other factors that are believed to be reasonable under the circumstances. Actual results may differ from these estimates. Estimates and underlying assumptions are reviewed on an ongoing basis. Revisions to accounting estimates are recognised in the period in which estimates are revised and in any future periods affected.
The accounting policies which have been identified as including assumptions and estimation uncertainties that may have an impact on the future results are as follows:
Deferred tax assetsDeferred tax assets are recognised to the extent that it is probable that taxable income will be available in future against which they can be utilised. Future taxable profits are estimated based on business plans which include estimates and assumptions regarding economic growth, interest and inflation rates and competitive forces.
115
BASIS OF REPORTING AND SIGNIFICANT ACCOUNTING POLICIES
Joint arrangementsJoint arrangements are those entities in respect of which there is a contractual agreement whereby the Group and one or more other parties undertake an economic activity, which is subject to joint control.
A joint venture is an arrangement whereby the parties that have joint control of the arrangement have rights to the net assets of the arrangement.
A joint operation is an arrangement whereby the parties that have joint control of the arrangement have rights to the assets, and obligations for the liabilities, relating to the arrangement.
The Group’s participation in joint ventures is accounted for using the equity method. Joint ventures are recognised at cost initially, which includes transaction costs. Subsequent to initial recognition, the Group financial statements include the Group’s share of profits or loss and other comprehensive income of the equity-accounted investees, until the date on which joint control ceases. An impairment loss is measured by comparing the recoverable amount of the investment with its carrying amount. An impairment loss is recognised in the income statement and is reversed if there has been a favourable change in the estimates used to determine the recoverable amount.
The Group’s participation in joint operations is accounted for by recognising the Group’s share of assets, liabilities, revenue and expenses on a line-by-line basis.
Where a Group entity transacts with a joint arrangement of the Group, unrealised profits are eliminated to the extent of the Group’s interest in the joint arrangement.
AssociatesAn associate is an entity in which the Group holds an equity interest, over which the Group has significant influence and is neither a subsidiary nor an interest in a joint arrangement. Significant influence is the power to participate in the financial and operating policy decisions of the associate but is not control or joint control over those policies.
An associate is recognised at cost initially. Post-acquisition results of associate companies are accounted for in the Group financial statements using the equity method of accounting from the date that significant influence commences until the date that significant influence ceases. An impairment loss is measured by comparing the recoverable amount of the investment with its carrying amount. An impairment loss is recognised in the income statement and is reversed if there has been a favourable change in the estimates used to determine the recoverable amount. Where a Group entity transacts with an associate of the Group, unrealised profits are eliminated to the extent of the Group’s interest in the associate.
When the Group’s share of losses exceeds its interest in an equity-accounted investee, the carrying amount of that interest is reduced to nil and the recognition of further losses is discontinued, except to the extent that the Group has an obligation to or has made payments on behalf of the investee.
SIGNIFICANT ACCOUNTING POLICIESThe significant accounting policies of the Group, as set out herein, have been applied consistently throughout the Group and are consistent with those followed in the previous year in all material respects. Unless specifically stated otherwise, the Company also applies all Group accounting policies.
Basis of consolidation
SubsidiariesSubsidiaries are those entities controlled by the Company. An investor controls an investee when it is exposed, or has rights, to variable returns from its involvement with the investee and has the ability to affect those returns through its power over the investee.
The Group financial statements incorporate the financial statements of the Company and its subsidiaries. The results of subsidiaries, including those acquired or disposed of during the year, are included from the dates control commenced and up to the dates control ceased. Inter-Group transactions and balances between Group entities as well as any unrealised income and expenditure arising from such transactions are eliminated on consolidation. Non-controlling interests in the net assets of subsidiaries are identified separately from the Group’s equity therein.
The non-controlling interest, which represents the present ownership interests and would entitle shareholders to a proportionate share of the entity in the event of liquidation, is measured at the non-controlling interest’s proportional share of the acquiree’s identifiable net assets. Subsequent profits or losses, and each component of comprehensive income, are attributed to non-controlling interest even if it results in the non-controlling interest having a deficit balance. All other components of non-controlling interest are measured at their acquisition date fair values.
Changes in the Group’s interest in a subsidiary that do not result in a loss of control are accounted for as transactions with owners in their capacity as owners. Adjustments to non-controlling interests are based on a proportionate amount of the net assets of the subsidiary. No adjustments are made to goodwill and no gain or loss is recognised in profit or loss.
On loss of control, the Group derecognises the assets and liabilities of the subsidiary, any non-controlling interests and other components of equity related to the subsidiary. Any surplus or deficit arising on the loss of control is recognised in profit or loss. If the Group retains any interest in the former subsidiary, then such interest is measured at fair value at the date that control is lost.
Subsequently, that retained interest is accounted for as an equity-accounted investee or as an available-for-sale asset, depending on the level of influence retained.
116
BASIS OF REPORTING AND SIGNIFICANT ACCOUNTING POLICIES
Deferred taxA deferred tax asset is the amount of income tax recoverable in future periods in respect of deductible temporary differences, the carry forward of unused tax losses and unused tax credits. A deferred tax liability is the amount of income tax payable in future periods in respect of taxable temporary differences.
Temporary differences are differences between the carrying amounts of assets and liabilities for financial reporting purposes and their tax base. The tax base of an asset is the amount that is deductible for tax purposes if the economic benefits from the asset are taxable, or is the carrying amount of the asset if the economic benefits are not taxable. The tax base of a liability is the carrying amount of the liability less the amount deductible in respect of that liability in future periods.
Deferred tax is recognised in respect of temporary differences between the carrying values of assets and liabilities for accounting purposes and their corresponding values for tax purposes. Deferred tax is also recognised on tax losses. No deferred tax is recognised on temporary differences relating to the initial recognition of goodwill, the initial recognition (other than in a business combination) of an asset or a liability to the extent that neither accounting nor tax profit is affected on acquisition, and differences relating to investments in subsidiaries, joint arrangements and associates to the extent that the Group is able to control the timing of the reversal of the temporary differences and it is probable that they will not reverse in the foreseeable future.
A deferred tax asset is recognised only to the extent that it is probable that future taxable profits will be available against which the associated unused tax losses and deductible temporary differences can be utilised. Deferred tax assets are reduced to the extent that it is no longer probable that the related tax benefit will be realised. Deferred tax assets are reviewed at each reporting date.
Deferred tax assets and liabilities are offset if there is a legally enforceable right to offset current tax liabilities and assets and they relate to income taxes levied by the same tax authority on the same taxable entity.
Deferred tax assets and liabilities are measured at the tax rates that are expected to apply to the period when the asset is realised or the liability is settled, based on tax rates/laws that have been enacted or substantively enacted by the end of the reporting period.
Investments in subsidiaries, joint arrangements and associatesInvestments in subsidiaries, joint arrangements and associates in the Company financial statements are recognised at cost less impairment losses and include the equity contributions of share-based payments to employees of subsidiaries as well as loans owing from non-operating subsidiaries.
Business combinations and goodwillBusiness combinations are accounted for using the acquisition method as at the acquisition date, which is the date on which control is transferred to the Group. Goodwill is not amortised. The goodwill of joint ventures and associates is included in the carrying amount of the relevant equity-accounted investee. Goodwill is reviewed for impairment at least annually.
Cash-generating units represent the business operations from which the goodwill was originally generated. On disposal of a subsidiary, joint venture or associate, the attributable amount of goodwill is included in the determination of the profit or loss on disposal.
The Group measures goodwill at the acquisition date as:
› the fair value of the consideration transferred; plus
› the recognised amount of any non-controlling interests in the acquiree; plus
› if the business combination is achieved in stages, the fair value of the existing equity interest in the acquiree; less
› the net recognised amount (generally fair value) of the identifiable assets acquired and liabilities assumed.
If, on a business combination, the fair value of the Group’s interest in the identifiable assets and liabilities exceeds the cost of acquisition, this excess, a bargain purchase gain, is recognised in the income statement immediately.
The consideration transferred does not include amounts related to the settlement of pre-existing relationships. Such amounts are generally recognised in the income statement.
Costs related to the acquisition, other than those associated with the issue of debt or equity securities, that the Group incurs in connection with a business combination are expensed as incurred.
Any contingent consideration is measured at fair value at the date of acquisition. If an obligation to pay contingent consideration that meets the definition of a financial instrument is classified as equity, then it is not remeasured and settlement is accounted for in equity. Otherwise, other contingent consideration is remeasured at fair value at each reporting date and subsequent changes in the fair value of the contingent consideration are recognised in profit or loss.
117
BASIS OF REPORTING AND SIGNIFICANT ACCOUNTING POLICIES
Investment properties comprising properties surplus to the Group’s operational requirements, and leased to third parties, are measured at cost less accumulated depreciation and impairment losses. Land is not depreciated and buildings are depreciated on a straight-line basis over their useful life of 20 years. Depreciation methods, useful lives and residual values are reviewed at each reporting date. Any gain or loss on disposal (calculated as the difference between the net proceeds from disposal and the carrying amount) is recognised in the income statement.
Transfers to and from investment property are made when there is evidence of a change of use. Transfers are measured at the carrying amount immediately prior to transfer and no changes to the carrying amount are made unless the change in use results in an indication of impairment.
Intangible assetsIntangible assets are measured at cost less accumulated amortisation and impairment losses. Intangible assets are recognised if it is probable that future economic benefits will flow from the intangible assets and their costs can be measured reliably. Subsequent expenditure is capitalised only when it increases the future economic benefits embodied in the specific asset to which it relates. All other expenditure is recognised in the income statement as incurred.
Intangible assets with finite useful lives are amortised on a straight-line basis over their estimated useful lives. The amortisation methods and estimated remaining useful lives are reviewed at least annually.
Intangible assets with indefinite useful lives are not amortised but are tested at each reporting date for impairment. The assessment that the estimated useful lives of these assets are indefinite is reviewed at least annually.
The estimated useful lives are as follows:
› Customer and marketing relationships 5 to 20 years
› Patents and trademarks 15 to 20 years
› Technical and licensing agreements 17 years
› Other 3 to 10 years
Intangible assets are derecognised on disposal, or when no future economic benefits are expected from use. Gains or losses arising from derecognition of an intangible asset, measured as the difference between the net disposal proceeds and the carrying amount of the asset, are recognised in the income statement when the asset is derecognised.
Intangible assets acquired in a business combinationIntangible assets acquired in a business combination, and recognised separately from goodwill, are recognised initially at their fair value at the acquisition date. Subsequently, these intangible assets are measured at cost less accumulated amortisation and accumulated impairment losses, on the same basis as intangible assets that are acquired separately.
Property, plant and equipmentProperty, plant and equipment is measured at cost less accumulated depreciation and accumulated impairment losses. Cost includes expenditure directly attributable to the acquisition of an asset. The cost of self-constructed assets includes the cost of materials and direct labour and any other costs directly attributable to bringing the asset into a working condition for its intended use, as well as gains and losses on qualifying cash flow hedges and borrowing costs attributable to that asset. Depreciation is provided on property, plant and equipment, other than land, on the straight-line basis at rates which will write off the assets over their estimated useful lives. Assets under construction are not depreciated until they are available for use. Depreciation methods, useful lives and residual values are reviewed at each reporting date.
The estimated useful lives are as follows:
› Property » land unlimited
» buildings 5 to 56 years
› Plant and equipment » plant and equipment 3 to 30 years
» furniture and fittings 3 to 15 years
» computer equipment 3 to 10 years
» motor vehicles 3 to 12 years
When significant parts of an item of property, plant and equipment have different useful lives, they are accounted for as separate items of property, plant and equipment.
Gains and losses on disposals of property, plant and equipment are determined by comparing the proceeds from disposal with the carrying amounts of the items sold and are recognised in the income statement.
Specific plant spares are measured at cost and are depreciated over the estimated useful lives of the plants to which they relate.
The cost of replacing part of an item of property, plant and equipment is recognised in the carrying amount of the item if it is probable that the future economic benefits embodied in the part will flow to the Group and its cost can be measured reliably. The carrying amount of the replaced part is derecognised. The cost of maintaining property, plant and equipment is recognised in the income statement.
Investment propertiesCertain of the Group’s land, which was originally acquired as an item of property, plant and equipment and which was subsequently determined to be surplus to the Group’s operational requirements, was included at deemed cost on transition to IFRS. The deemed cost was at values determined by sworn appraisers in a period prior to the implementation of IFRS.
The basis of the valuation was the open market value at the time and the surplus over original cost was recognised in other comprehensive income as a separate reserve. When such land is eventually sold to third parties, the proportion of the reserve relating to that land is transferred to distributable reserves.
118
BASIS OF REPORTING AND SIGNIFICANT ACCOUNTING POLICIES
All impairment losses are recognised in the income statement. Any cumulative loss in respect of an available-for-sale financial asset previously recognised in other comprehensive income is transferred to the income statement.
An impairment loss is reversed if the reversal can be related objectively to an event occurring after the impairment loss was recognised. For financial assets measured at amortised cost and available-for-sale financial assets that are debt securities, the reversal is recognised in the income statement. For available-for-sale financial assets that are equity securities the reversal is recognised directly in other comprehensive income.
Non-financial assetsThe carrying amounts of the Group’s non-financial assets, other than inventories and deferred tax assets, are reviewed at each reporting date to determine whether there is any indication of impairment. If there is any indication that an asset may be impaired, its recoverable amount is estimated to determine the extent of the impairment loss. The recoverable amount is the higher of its fair value, less costs to sell, and its value-in-use.
Value-in-use is estimated taking into account future cash flows, forecast market conditions and the expected lives of the assets. An impairment loss is recognised whenever the carrying amount of an asset or a cash-generating unit exceeds its recoverable amount. Impairment losses are recognised in the income statement. Subsequent to the recognition of an impairment loss, the depreciation charge for the asset is adjusted to allocate its remaining carrying value, less any residual value, over its remaining useful life.
Impairment losses recognised in respect of a cash-generating unit are allocated first to reduce the carrying amount of any goodwill allocated to the cash-generating unit and then to reduce the carrying amount of the other assets of the cash-generating unit.
An impairment loss is reversed only to the extent that the carrying amount of the asset or cash-generating unit does not exceed the net carrying amount that would have been determined if no impairment loss had been recognised. A reversal of an impairment loss is recognised in the income statement.
Goodwill is allocated to cash-generating units that are expected to benefit from the synergies of the business combination. Goodwill and the cash-generating units to which it has been allocated are tested for impairment on an annual basis even if there is no indication of impairment. Impairment losses on goodwill are not reversed.
InventoriesInventories of raw and packing materials, products and intermediates and merchandise are measured at cost using the first-in first-out method or the weighted average cost method, depending on the nature of the inventories or their use to businesses in the Group.
The cost of products and intermediates comprises raw and packing materials, manufacturing costs, depreciation and an appropriate allocation of production overheads. Costs may include transfers from other comprehensive income of any gain or loss on qualifying cash flow hedges of foreign currency purchases.
Property developments include the cost of properties transferred from investment property and development costs.
Research and developmentResearch costs are expensed in the income statement in the year in which they are incurred. Development costs are reviewed on an ongoing basis and are capitalised if they can be measured reliably, the product or process is technically and commercially feasible, it is probable that the asset will generate future economic benefits and the Group intends, and has sufficient resources, to complete development and to use or sell the asset. Development costs are expensed in the income statement if they do not qualify for capitalisation. If a project is abandoned during the development stage, the total accumulated expenditure is written off in the income statement.
After initial recognition, development costs are carried at cost less accumulated amortisation and impairment losses.
Non-current assets classified as held for saleManagement classifies a non-current asset (or disposal group) as held for sale if its carrying amount will be recovered principally through a sale transaction rather than through continuing use. Property, plant and equipment and intangible assets are not depreciated or amortised once they have been classified as held for sale.
A non-current asset (or disposal group) classified as held for sale is measured at the lower of its carrying amount and fair value less costs to sell. When the carrying value of the assets and liabilities and the results of operations become immaterial to the Group, they are no longer shown separately as discontinued operations and are included in continuing operations.
Any impairment loss on a disposal group is allocated first to goodwill and then to the remaining assets and liabilities on a pro rated basis except that no loss is allocated to inventories, financial assets, deferred tax assets and employee benefits, which continue to be measured in accordance with the Group’s accounting policies. Impairment losses on initial classification as held for sale and subsequent gains or losses on remeasurement are recognised in the income statement. Gains are not recognised in excess of any cumulative impairment losses.
Impairment
Financial assetsA financial asset not carried at fair value through profit or loss is assessed at each reporting date to determine whether there is any objective evidence that it is impaired. A financial asset is considered to be impaired if objective evidence indicates that one or more loss events occurred after initial recognition of the asset that had a negative effect on the estimated future cash flows of that asset.
An impairment loss in respect of a financial asset measured at amortised cost is calculated as the difference between its carrying amount and the present value of the estimated future cash flows discounted at the original effective interest rate. An impairment loss in respect of an available-for-sale financial asset is calculated by reference to its fair value.
Individually significant financial assets are tested for impairment on an individual basis. The remaining financial assets are assessed collectively in groups that share similar credit risk characteristics.
119
BASIS OF REPORTING AND SIGNIFICANT ACCOUNTING POLICIES
Treasury sharesTreasury shares are Company shares held by a subsidiary and by the AECI Employees Share Trust (“EST”) and are excluded from the shares recognised as Group equity.
Earnings per share
Basic earnings per shareBasic earnings per share is calculated by dividing the net profit attributable to equity holders of the Group by the weighted average number of ordinary shares in issue during the year.
Diluted earnings per shareDiluted earnings per share is calculated by dividing the net profit attributable to equity holders of the Group by the weighted average number of ordinary shares in issue, adjusted for the dilutive effect of the contingently returnable ordinary shares issued to the AECI Community Education and Development Trust (“CEDT”), the potential shares issued to the EST and the performance shares issued as part of the Group’s Long-term Incentive Plan.
RevenueRevenue is measured at the fair value of the consideration received or receivable, being invoiced sales of goods and services to customers, net of returns, trade discounts, rebates and Value Added Tax, rental income from investment properties, and sales of land that is surplus to the Group’s operational requirements.
Revenue in respect of goods and the related services sold is recognised when the significant risks and rewards of ownership have been transferred to the purchaser, when delivery has been made and title has passed, when the amount of the revenue and the related costs can be measured reliably, and when recovery of the sale consideration is probable.
Revenue in respect of rentals received from leasing activities is recognised on a straight-line basis over the period of the lease, where fixed escalation clauses apply, and when there is a reasonable expectation that recovery of the lease rental is probable. Where no fixed escalation clauses are applicable to a lease, rental income is recognised in the period in which it is due by the lessee.
Revenue in respect of property transactions is recognised when it is highly probable that the significant risks and rewards of ownership have transferred to the buyer (when there is a binding, unconditional sale agreement). Agreements are unconditional only when the purchase price is covered, in full, by either cash deposited with the conveyancing attorney or by means of an irrevocable guarantee from an acceptable bank in favour of the Group, and when servicing arrangements and costs are substantively finalised.
In all cases inventories are valued at the lower of cost and net realisable value. Net realisable value is the estimated selling price in the ordinary course of business, less the estimated costs of completion and selling expenses, taking into account obsolescence.
ProvisionsA provision is recognised when the Group has a present legal or constructive obligation, as a result of past events, for which it is probable that an outflow of economic benefits will occur and where a reliable estimate can be made of the amount of the obligation. The amount recognised as a provision is the best estimate of the consideration required to settle the obligation at the reporting date, taking into account the risks and uncertainties associated with the obligation. Non-current provisions are determined by discounting the expected future cash flows to their present value at a pre-tax rate that reflects current market assessment of the time value of money. The unwinding of the discount is recognised as a finance cost.
When some or all of the economic benefits required to settle a provision are expected to be recovered from a third party, the receivable is recognised as an asset if it is virtually certain that reimbursement will be received and the amount of the receivable can be measured reliably.
Environmental remediationA provision for environmental remediation is recognised in accordance with the Group’s environmental policy and applicable legal requirements. The adequacy of the provision is reviewed annually at the reporting date against changed circumstances, legislation and technology.
Share capitalShare capital comprises ordinary shares and convertible redeemable B ordinary shares and is classified as equity. Issued ordinary shares are measured at the fair value of the proceeds received less any directly attributable issue costs. An amount equal to the par value of the shares issued is presented as share capital. The amount by which the fair value exceeds par value is presented as share premium. The fair value is presented in full as share capital for no par value shares.
Shares repurchased by the Company are cancelled immediately and delisted as soon as is practicable. The amount paid is recognised by reducing share capital by the par value of shares repurchased, with any excess reducing the carrying amount of share premium to the extent available, and thereafter reducing retained earnings.
Preference sharesPreference shares are measured at historical cost, are cumulative and are classified as equity. Dividends paid are disclosed in the statement of changes in equity.
120
BASIS OF REPORTING AND SIGNIFICANT ACCOUNTING POLICIES
OffsetIf a legally enforceable right currently exists to set off recognised amounts of financial assets and financial liabilities, which are in determinable monetary amounts, and the Group intends either to settle on a net basis or realise the asset and settle the liability simultaneously, the relevant financial assets and financial liabilities are offset.
Non-derivative financial instrumentsNon-derivative financial instruments comprise investments in equity securities, loans to and from subsidiaries, accounts receivable, cash, loans and borrowings, loans from joint arrangements, contingent consideration and accounts payable.
The Group recognises loans and receivables on the date on which they are originated. All other financial instruments are recognised on the date on which the Group becomes a party to the contractual provisions of the instrument.
The Group derecognises a financial asset when the contractual rights to the cash flows from the asset expire, or it transfers the rights to receive the contractual cash flows on the financial asset in a transaction in which substantively all the risks and rewards of ownership of the financial asset are transferred. Any interest in transferred financial assets that is created or retained by the Group is recognised as a separate asset or liability.
The Group derecognises a financial liability when its contractual obligations are discharged, cancelled or expire.
InvestmentsUnlisted investments classified as available-for-sale financial assets are measured at fair value. Changes in fair value are reflected in other comprehensive income unless there is objective evidence that the asset is impaired, in which case the impairment loss is recognised in the income statement. Fair value, for this purpose, is a value arrived at by using appropriate valuation techniques. When an instrument is derecognised, the cumulative gain or loss in other comprehensive income is transferred to the income statement.
Money market investments are classified as financial assets at fair value through profit or loss. All changes in fair value are recognised in the income statement. Fair value is an observable market value.
Accounts receivableAccounts receivable are measured at amortised cost using the effective interest method, less any impairment losses.
CashCash is measured at amortised cost.
Loans to subsidiaries, joint arrangements and associatesLoans by the Company to subsidiaries, joint arrangements and associates are measured at amortised cost using the effective interest method, less any impairment losses.
Foreign currencies
Foreign currency translationsTransactions in foreign currencies are translated into the functional currencies of each entity in the Group at the rates of exchange ruling on the dates of the transactions. Monetary assets and liabilities denominated in foreign currencies are translated at the rates of exchange ruling at the reporting date. Non-monetary assets and liabilities denominated in foreign currencies that are measured at fair value are translated into the functional currency of the entity concerned at the rates of exchange ruling at the dates of the transactions.
Gains or losses arising on exchange differences are recognised in the income statement. Costs associated with forward cover contracts linked to borrowings are included in financing costs.
Foreign operationsThe financial statements of foreign operations in the Group are translated into South African rand as follows:
› assets, including goodwill, and liabilities at the rates of exchange ruling at the reporting date;
› income, expenditure and cash flow items at the weighted average rate of exchange during the accounting period;
› equity at historical rates;
› differences arising on translation are recognised in other comprehensive income and are presented in the foreign currency translation reserve in reserves;
› when a foreign operation is disposed of in full, the relevant amount in the foreign currency translation reserve is recognised in the income statement;
› when the Group disposes of only part of its interest in a subsidiary that includes a foreign operation, while retaining control, the relevant portion of the cumulative foreign currency translation reserve is recognised in non-controlling interest;
› differences arising from a monetary item receivable from or payable to a foreign operation, the settlement of which is neither planned nor likely in the foreseeable future, are considered part of a net investment in a foreign operation and are recognised in other comprehensive income in the foreign currency translation reserve; and
› when the monetary item is settled, the repayment is accounted for as a part disposal of the net investment with a proportionate share of the cumulative differences recognised in the income statement.
Financial instrumentsFinancial instruments are recognised at fair value initially. Directly attributable transaction costs are included in the amount recognised only when changes in fair value are not subsequently recognised in the income statement. Subsequent to initial recognition, these instruments are measured as set out as follows in respect of derivative and non-derivative financial instruments.
121
BASIS OF REPORTING AND SIGNIFICANT ACCOUNTING POLICIES
Government grantsGovernment grants represent assistance by government in the form of transfers of resources in return for compliance with conditions related to operating activities. Government assistance is action by government designed to provide an economic benefit specific to an entity or range of entities qualifying under certain criteria. The definition of government here includes agencies and similar bodies whether local, national or international.
When the conditions attached to government grants have been complied with and they will be received, they are recognised in profit or loss on a systematic basis over the periods necessary to match them with the related costs. When they are for expenses or losses already incurred, they are recognised in profit or loss immediately. The unrecognised portion at the statement of financial position date is presented as deferred income.
No value is recognised where government provides general industry assistance.
Where the government grants target specific assets, they are deducted from the cost of the asset, hence reducing its cost.
Borrowing costsBorrowing costs (net of investment income earned on the temporary investment of specific borrowings pending their expenditure on qualifying assets) directly attributable to the acquisition, construction or production of assets that necessarily take a substantial period of time to get ready for their intended use, are added to the cost of those assets until such time as the assets are substantively ready for their intended use. All other borrowing costs are recognised in the income statement in the period in which they are incurred.
Leases
Finance leasesLeases that transfer substantively all the risks and rewards of ownership are classified as finance leases. Assets acquired in terms of finance leases are capitalised at the lower of fair value and the present value of the minimum lease payments at the inception of the lease and depreciated over the estimated useful life of the asset or the lease term, if shorter. Lease payments are allocated using the effective interest method to determine the lease finance cost, which is recognised in the income statement over the lease period, and the capital repayment, which reduces the finance lease liability to the lessor.
Amounts receivable under finance leases, where the Group is the lessor, are recognised in the statement of financial position as a loan receivable at the amount of the net investment in the lease. Finance income is based on a pattern reflecting a constant periodic rate of return on the net investment in the finance lease. Profit or loss on manufactured assets under finance leases is recognised in the income statement when the finance lease is recognised.
Operating leasesAll other leases are classified as operating leases. Payments made under operating leases are charged against income on a straight-line basis over the period of the lease.
Financial liabilitiesFinancial liabilities, including borrowings and accounts payable, are measured at amortised cost using the effective interest method.
Derivative financial instrumentsThe Group uses derivative financial instruments including currency and interest rate swaps, forward rate agreements and forward exchange contracts to manage its exposure to foreign exchange, interest rate and commodity price risks arising from operational, financing and investment activities. The Group does not hold or issue derivative financial instruments for trading purposes.
Derivative instrumentsDerivative instruments are recognised and measured at fair value with changes in fair value being included in the income statement, other than derivatives designated as cash flow hedges.
Hedge accountingIf a fair value hedge meets the conditions for hedge accounting, any gain or loss on the hedged item attributable to the hedged risk is included in the carrying amount of the hedged item and recognised in the income statement.
If a cash flow hedge meets the conditions for hedge accounting, the portion of the gain or loss on the hedging instrument that is determined to be an effective hedge is recognised in other comprehensive income and the ineffective portion is recognised in the income statement.
If an effective hedge of a forecast transaction subsequently results in the recognition of a financial asset or a financial liability, the associated gains or losses recognised in other comprehensive income are transferred to the income statement in the same period in which the asset or liability affects the income statement.
If the hedge of a forecast transaction subsequently results in the recognition of a non-financial asset or liability, the associated gains or losses recognised in other comprehensive income are included in the initial measurement of the cost of the asset or liability.
Hedge accounting is discontinued on a prospective basis when the hedge no longer meets the hedge accounting criteria (including when the hedge becomes ineffective), when the hedge instrument is sold, terminated or exercised, when, for cash flow hedges, the forecast transaction is no longer expected to occur, or when the hedge designation is revoked. Any cumulative gain or loss on the hedging instrument for a forecast transaction is retained in other comprehensive income until the transaction occurs, unless the transaction is no longer expected to occur in which case it is transferred to the income statement.
Investment incomeInterest income is recognised in the income statement as it accrues and it is measured using the effective interest method. Dividend income from investments is recognised when the shareholders’ right to receive payment has been established.
122
BASIS OF REPORTING AND SIGNIFICANT ACCOUNTING POLICIES
The defined-benefit cost recognised in the income statement includes the current service cost and the net interest on the net defined-benefit liability (asset). Net interest expense (income) is the interest on the net defined-benefit liability (asset) at the beginning of the period, calculated using the discount rate used in the prior year’s actuarial valuation. The interest takes into account changes in the net defined-benefit liability (asset) during the year as a result of contributions and benefit payments.
The defined-benefit cost relating to actuarial gains and losses, which include the return on plan assets (excluding the interest income recognised in the income statement) and the effect of the asset ceiling (excluding the interest cost) and any changes in actuarial assumptions or experience adjustments, are remeasurements and are recognised immediately in other comprehensive income.
Defined-benefit post-retirement medical aid obligationsThe Group provides defined-benefit post-retirement healthcare benefits to certain of its retirees and eligible employees. The Group’s net obligation is calculated by estimating the amount of future benefit that employees have earned in return for their service in the current and prior periods; that benefit is discounted to determine its present value. The fair value of any plan assets is deducted. The discount rate is the yield at the reporting date on suitable corporate bonds that have maturity dates approximating the terms of the Group’s obligations and are denominated in rand as the benefits are expected to be paid in rand.
Actuarial valuations are conducted annually by a qualified actuary and the calculation is performed using the projected unit credit method.
The defined-benefit cost recognised in the income statement includes the current service cost and the net interest on the net defined-benefit liability (asset). Net interest expense (income) is the interest on the net defined-benefit liability (asset) at the beginning of the period calculated using the discount rate used in the prior year’s actuarial valuation. The interest takes into account changes in the net defined-benefit liability (asset) during the year as a result of contributions and benefit payments.
The defined-benefit cost relating to actuarial gains and losses, which include the return on plan assets (excluding the interest income recognised in profit and loss) and any changes in actuarial assumptions or experience adjustments, are remeasurements and are recognised immediately in other comprehensive income.
Gains or losses on the settlement of a defined-benefit plan are recognised in the income statement when the settlement occurs. The gain or loss on settlement is determined as follows:
› the net defined-benefit liability/(asset) is remeasured at the date of the settlement as if no settlement has occurred;
› the gain or loss on settlement is then determined as the difference between the carrying amount (present value of the defined-benefit obligation) being settled and the settlement price, including any plan assets transferred and any payments made directly by the Group in connection with the settlement.
For the purpose of determining the value of plan assets transferred, AECI uses only the value of the recognised plan assets (as limited by the asset ceiling). Unrecognised surpluses, which include those not allocated to an employer surplus account (“ESA”) or which were not otherwise available for use by AECI, are not taken into account.
Employee benefits
Short-term employee benefitsThe cost of all short-term employee benefits is recognised in the income statement during the period in which the employee renders the related service.
Accruals for employee entitlements to salaries, performance bonuses and annual leave represent the amount of the Group’s present obligation as a result of employees’ services provided up to the reporting date.
Accruals are calculated at undiscounted amounts based on current salary rates.
Retirement benefitsThe Group provides defined-contribution and defined-benefit funds for its employees, the assets of which are held in separate funds. These funds are financed by payments from employees and the Group, taking account of the recommendations of independent actuaries.
Defined-contribution plansA defined-contribution plan is a post-retirement benefit plan under which an entity pays fixed contributions into a separate entity and will have no legal or constructive obligation to pay further amounts.
Obligations for contributions to defined-contribution pension plans are recognised in the income statement as the related service is provided.
Defined-benefit plansA defined-benefit plan is a post-retirement benefit plan other than a defined-contribution plan.
The Group’s net obligation in respect of defined-benefit plans is calculated separately for each plan by estimating the amount of future benefit that employees have earned in return for their services in the current and prior periods; that benefit is discounted to determine its present value. Any unrecognised past service costs and the fair value of any plan assets are deducted. The discount rate is the yield at the reporting date on suitable corporate bonds that have maturity dates approximating the terms of the Group’s obligations and are denominated in rand as the benefits are expected to be paid in rand.
Actuarial valuations are conducted annually and interim adjustments to those valuations are made at the reporting date. The calculation is performed by qualified actuaries using the projected unit credit method.
When the calculation results in a benefit to the Group, the recognised asset is limited to amounts credited to the employer surplus accounts in accordance with the Pension Funds Act, No. 24 of 1956, as amended, where this does not exceed the total of any unrecognised past service costs and the present value of economic benefits available in the form of any future refunds from the plan or reductions in future contributions to the plan. To calculate the present value of economic benefits, consideration is given to any minimum funding requirements that apply to any plan in the Group. An economic benefit is available to the Group if it is realisable during the life of the plan, or on settlement of the plan liabilities.
123
BASIS OF REPORTING AND SIGNIFICANT ACCOUNTING POLICIES
Income taxIncome tax comprises current and deferred tax. Income tax expense is recognised in the income statement except to the extent that it relates to a business combination or items recognised directly in equity or other comprehensive income.
Current tax is the expected tax payable on the taxable income for the year, using tax rates enacted or substantively enacted at the reporting date, and any adjustment to tax payable in respect of prior years.
DividendsDividends are recognised as a liability when declared and are included in the statement of changes in equity. Scrip dividends are recognised, when declared, in share capital and retained earnings in the statement of changes in equity and are measured at the par value of the shares issued.
Dividends tax is levied on non-exempt shareholders. As this tax is levied on the shareholders and not the Company, it is not included in the tax expense recognised in profit or loss or in other comprehensive income.
Segment reportingAn operating segment is a component of the Group that engages in business activities from which it may earn revenues and incur expenses, including revenues and expenses that relate to transactions with any of the Group’s other components. The operating results of all segments are reviewed monthly by the AECI Executive Committee to make decisions about resources to be allocated to them and to assess their performances.
Inter-segment transactions are made on an arm’s length basis.
The Group reports on its segments based on the nature of the products or services offered, as follows:
› Explosives, comprising mainly the manufacture of commercial explosives and initiating systems for use by the mining industry;
› Specialty chemicals, comprising businesses that manufacture and market specialty chemicals to a broad range of industries; and
› Property, comprising a leasing portfolio and the provision of services at Umbogintwini.
The basis of segment reporting is representative of the internal structure used for management reporting.
Termination benefitsTermination benefits are recognised at the earlier of when the Group can no longer withdraw from the offer of those benefits or when the Group recognises costs of restructuring. If the benefits are payable more than 12 months after the reporting date, they are discounted to their present value.
Share-based paymentsThe Group has equity-settled and cash-settled share-based compensation plans.
Cash-settled share-based scheme (benefit units)This scheme allows senior Group employees to participate in the performance of AECI’s ordinary share price, in return for services rendered, through the payment of cash incentives which are based on the market price of AECI ordinary shares. These share appreciation rights are recognised as a liability at fair value at each reporting date, in the statement of financial position, until the date of settlement. The fair value of these rights is determined at each reporting date and the unrecognised cost is amortised in the income statement as an employee cost over the period that employees provide services to the Group.
No new allocations in terms of this scheme have been made since 2011.
Equity-settled share-based schemesThe EST equity-settled share-based scheme awards certain employees AECI B ordinary shares which will be converted to ordinary shares after a 10-year lock-in period based on a predetermined award formula.
Senior employees are awarded performance shares. Performance shares are awards that entitle certain employees to receive ordinary shares after a three-year lock-in period based on the performance of the Company’s ordinary share price relative to a peer group of listed companies.
Such equity-settled share-based payments are measured at fair value at the date of the grant.
The fair value determined at the grant of the equity-settled share-based payments is charged as an employee cost, with a corresponding increase in equity, on a straight-line basis over the period that the employee becomes unconditionally entitled to the shares, based on management’s estimation of the shares that will vest and adjusted for effects of non-market based vesting conditions.
124
BASIS OF REPORTING AND SIGNIFICANT ACCOUNTING POLICIES
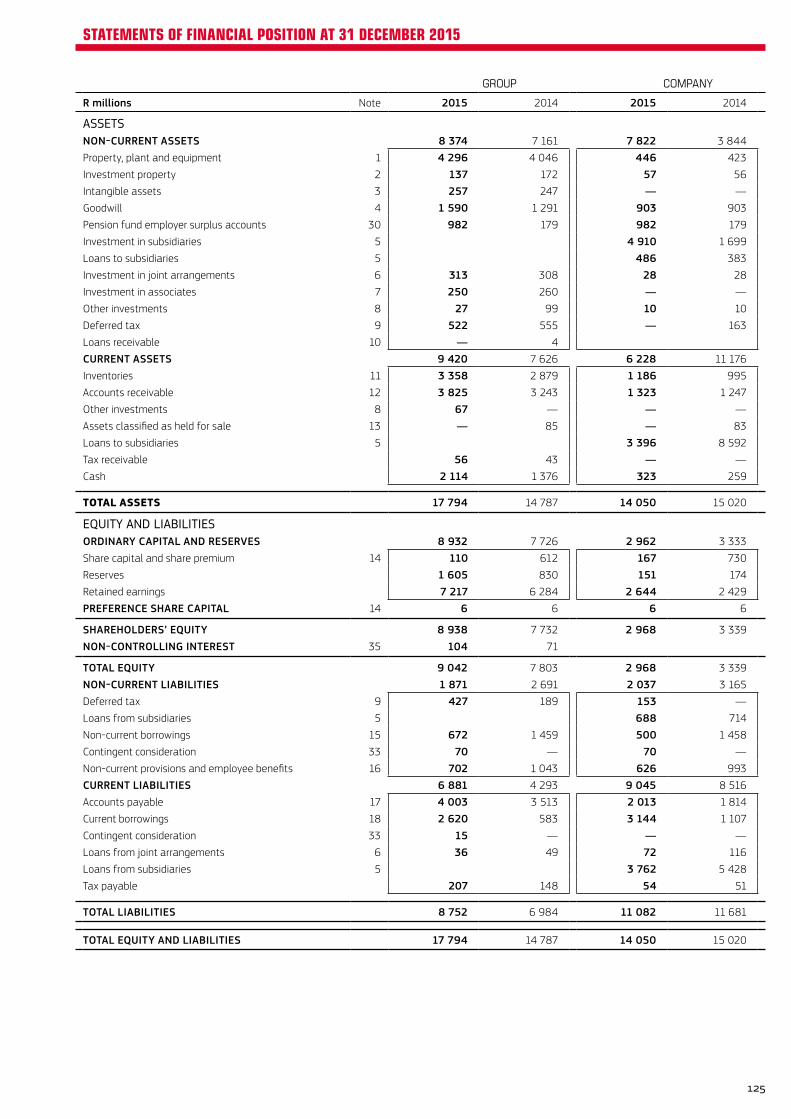
GROUP COMPANY
R millions Note 2015 2014 2015 2014
ASSETSNON-CURRENT ASSETS 8 374 7 161 7 822 3 844
Property, plant and equipment 1 4 296 4 046 446 423
Investment property 2 137 172 57 56
Intangible assets 3 257 247 — —
Goodwill 4 1 590 1 291 903 903
Pension fund employer surplus accounts 30 982 179 982 179
Investment in subsidiaries 5 4 910 1 699
Loans to subsidiaries 5 486 383
Investment in joint arrangements 6 313 308 28 28
Investment in associates 7 250 260 — —
Other investments 8 27 99 10 10
Deferred tax 9 522 555 — 163
Loans receivable 10 — 4
CURRENT ASSETS 9 420 7 626 6 228 11 176
Inventories 11 3 358 2 879 1 186 995
Accounts receivable 12 3 825 3 243 1 323 1 247
Other investments 8 67 — — —
Assets classified as held for sale 13 — 85 — 83
Loans to subsidiaries 5 3 396 8 592
Tax receivable 56 43 — —
Cash 2 114 1 376 323 259
TOTAL ASSETS 17 794 14 787 14 050 15 020
EQUITY AND LIABILITIESORDINARY CAPITAL AND RESERVES 8 932 7 726 2 962 3 333
Share capital and share premium 14 110 612 167 730
Reserves 1 605 830 151 174
Retained earnings 7 217 6 284 2 644 2 429
PREFERENCE SHARE CAPITAL 14 6 6 6 6
SHAREHOLDERS’ EQUITY 8 938 7 732 2 968 3 339
NON-CONTROLLING INTEREST 35 104 71
TOTAL EQUITY 9 042 7 803 2 968 3 339
NON-CURRENT LIABILITIES 1 871 2 691 2 037 3 165
Deferred tax 9 427 189 153 —
Loans from subsidiaries 5 688 714
Non-current borrowings 15 672 1 459 500 1 458
Contingent consideration 33 70 — 70 —
Non-current provisions and employee benefits 16 702 1 043 626 993
CURRENT LIABILITIES 6 881 4 293 9 045 8 516
Accounts payable 17 4 003 3 513 2 013 1 814
Current borrowings 18 2 620 583 3 144 1 107
Contingent consideration 33 15 — — —
Loans from joint arrangements 6 36 49 72 116
Loans from subsidiaries 5 3 762 5 428
Tax payable 207 148 54 51
TOTAL LIABILITIES 8 752 6 984 11 082 11 681
TOTAL EQUITY AND LIABILITIES 17 794 14 787 14 050 15 020
125
STATEMENTS OF FINANCIAL POSITION AT 31 DECEMBER 2015
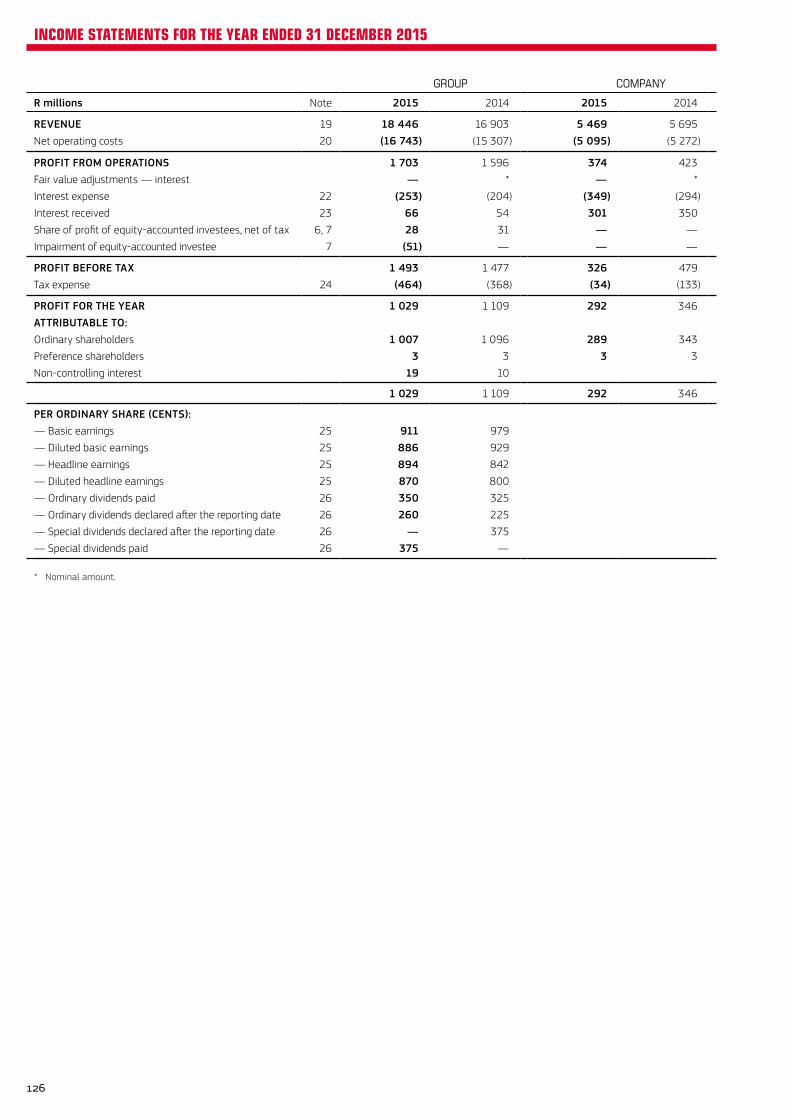
GROUP COMPANY
R millions Note 2015 2014 2015 2014
REVENUE 19 18 446 16 903 5 469 5 695
Net operating costs 20 (16 743) (15 307) (5 095) (5 272)
PROFIT FROM OPERATIONS 1 703 1 596 374 423
Fair value adjustments — interest — * — *
Interest expense 22 (253) (204) (349) (294)
Interest received 23 66 54 301 350
Share of profit of equity-accounted investees, net of tax 6, 7 28 31 — —
Impairment of equity-accounted investee 7 (51) — — —
PROFIT BEFORE TAX 1 493 1 477 326 479
Tax expense 24 (464) (368) (34) (133)
PROFIT FOR THE YEAR 1 029 1 109 292 346
ATTRIBUTABLE TO:Ordinary shareholders 1 007 1 096 289 343
Preference shareholders 3 3 3 3
Non-controlling interest 19 10
1 029 1 109 292 346
PER ORDINARY SHARE (CENTS):— Basic earnings 25 911 979
— Diluted basic earnings 25 886 929
— Headline earnings 25 894 842
— Diluted headline earnings 25 870 800
— Ordinary dividends paid 26 350 325
— Ordinary dividends declared after the reporting date 26 260 225
— Special dividends declared after the reporting date 26 — 375
— Special dividends paid 26 375 —
* Nominal amount.
126
INCOME STATEMENTS FOR THE YEAR ENDED 31 DECEMBER 2015
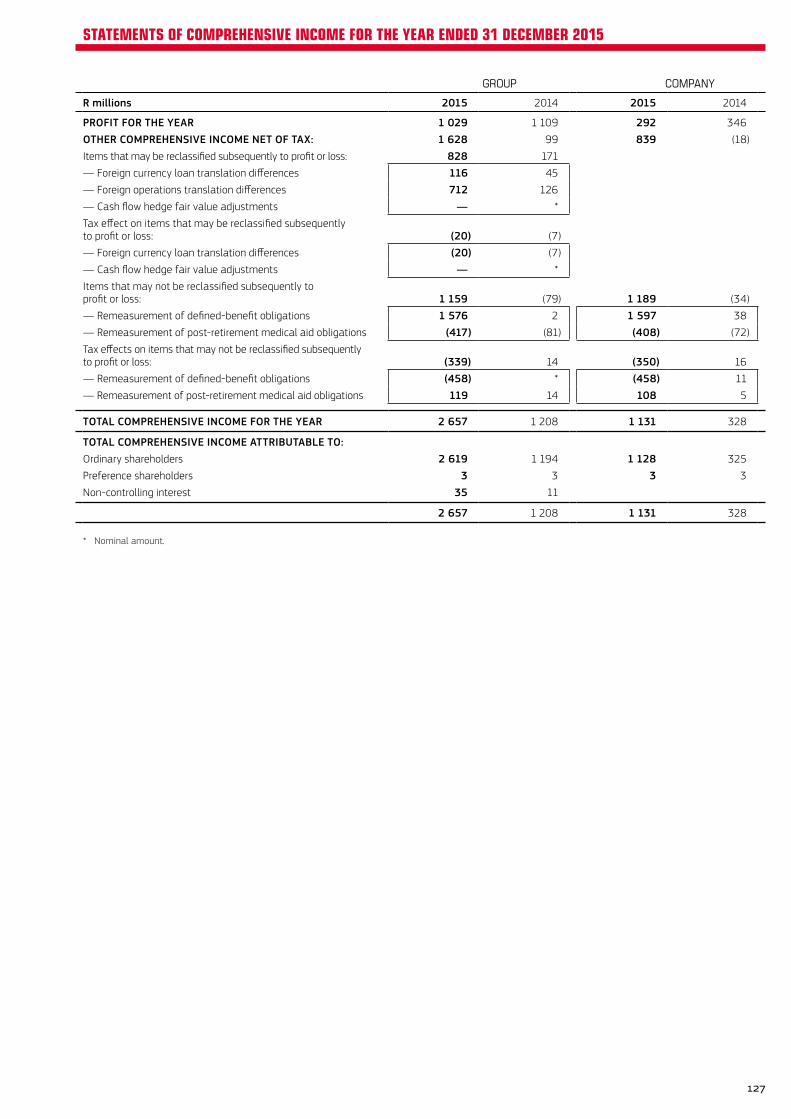
GROUP COMPANY
R millions 2015 2014 2015 2014
PROFIT FOR THE YEAR 1 029 1 109 292 346
OTHER COMPREHENSIVE INCOME NET OF TAX: 1 628 99 839 (18)
Items that may be reclassified subsequently to profit or loss: 828 171
— Foreign currency loan translation differences 116 45
— Foreign operations translation differences 712 126
— Cash flow hedge fair value adjustments — *
Tax effect on items that may be reclassified subsequently to profit or loss: (20) (7)
— Foreign currency loan translation differences (20) (7)
— Cash flow hedge fair value adjustments — *
Items that may not be reclassified subsequently to profit or loss: 1 159 (79) 1 189 (34)
— Remeasurement of defined-benefit obligations 1 576 2 1 597 38
— Remeasurement of post-retirement medical aid obligations (417) (81) (408) (72)
Tax effects on items that may not be reclassified subsequently to profit or loss: (339) 14 (350) 16
— Remeasurement of defined-benefit obligations (458) * (458) 11
— Remeasurement of post-retirement medical aid obligations 119 14 108 5
TOTAL COMPREHENSIVE INCOME FOR THE YEAR 2 657 1 208 1 131 328
TOTAL COMPREHENSIVE INCOME ATTRIBUTABLE TO:Ordinary shareholders 2 619 1 194 1 128 325
Preference shareholders 3 3 3 3
Non-controlling interest 35 11
2 657 1 208 1 131 328
* Nominal amount.
127
STATEMENTS OF COMPREHENSIVE INCOME FOR THE YEAR ENDED 31 DECEMBER 2015
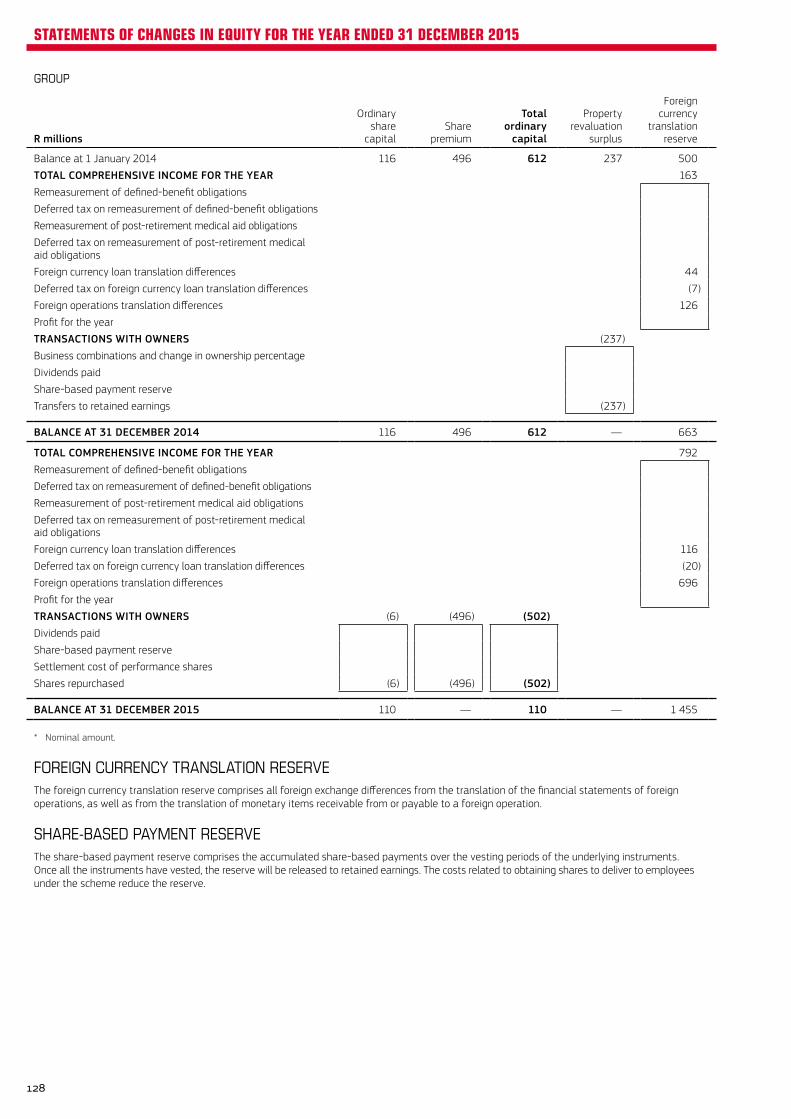
GROUP
R millions
Ordinaryshare
capitalShare
premium
Totalordinary
capital
Propertyrevaluation
surplus
Foreigncurrency
translationreserve
Share-basedpayment
reserveOther
reserves
Totalother
reservesRetainedearnings Total
Non-controlling
interest
Preferenceshare
capitalTotal
equity
Balance at 1 January 2014 116 496 612 237 500 76 — 813 5 394 6 819 52 6 6 877TOTAL COMPREHENSIVE INCOME FOR THE YEAR 163 163 1 031 1 194 11 3 1 208Remeasurement of defined-benefit obligations 2 2 2Deferred tax on remeasurement of defined-benefit obligations * * *Remeasurement of post-retirement medical aid obligations (81) (81) (81)Deferred tax on remeasurement of post-retirement medical aid obligations 14 14 14Foreign currency loan translation differences 44 44 44 1 45Deferred tax on foreign currency loan translation differences (7) (7) (7) (7)Foreign operations translation differences 126 126 126 126Profit for the year 1 096 1 096 10 3 1 109TRANSACTIONS WITH OWNERS (237) 91 — (146) (141) (287) 8 (3) (282)Business combinations and change in ownership percentage (3) (3) (3) 8 5Dividends paid (375) (375) (3) (378)Share-based payment reserve 91 91 91 91Transfers to retained earnings (237) 3 (234) 234 — —
BALANCE AT 31 DECEMBER 2014 116 496 612 — 663 167 — 830 6 284 7 726 71 6 7 803
TOTAL COMPREHENSIVE INCOME FOR THE YEAR 792 792 1 827 2 619 35 3 2 657Remeasurement of defined-benefit obligations 1 576 1 576 1 576Deferred tax on remeasurement of defined-benefit obligations (458) (458) (458)Remeasurement of post-retirement medical aid obligations (417) (417) (417)Deferred tax on remeasurement of post-retirement medical aid obligations 119 119 119Foreign currency loan translation differences 116 116 116 116Deferred tax on foreign currency loan translation differences (20) (20) (20) (20)Foreign operations translation differences 696 696 696 16 712Profit for the year 1 007 1 007 19 3 1 029TRANSACTIONS WITH OWNERS (6) (496) (502) (17) (17) (894) (1 413) (2) (3) (1 418)Dividends paid (833) (833) (2) (3) (838)Share-based payment reserve 77 77 77 77Settlement cost of performance shares (94) (94) (94) (94)Shares repurchased (6) (496) (502) (61) (563) (563)
BALANCE AT 31 DECEMBER 2015 110 — 110 — 1 455 150 — 1 605 7 217 8 932 104 6 9 042
* Nominal amount.
FOREIGN CURRENCY TRANSLATION RESERVEThe foreign currency translation reserve comprises all foreign exchange differences from the translation of the financial statements of foreign operations, as well as from the translation of monetary items receivable from or payable to a foreign operation.
SHARE-BASED PAYMENT RESERVEThe share-based payment reserve comprises the accumulated share-based payments over the vesting periods of the underlying instruments. Once all the instruments have vested, the reserve will be released to retained earnings. The costs related to obtaining shares to deliver to employees under the scheme reduce the reserve.
128
STATEMENTS OF CHANGES IN EQUITY FOR THE YEAR ENDED 31 DECEMBER 2015
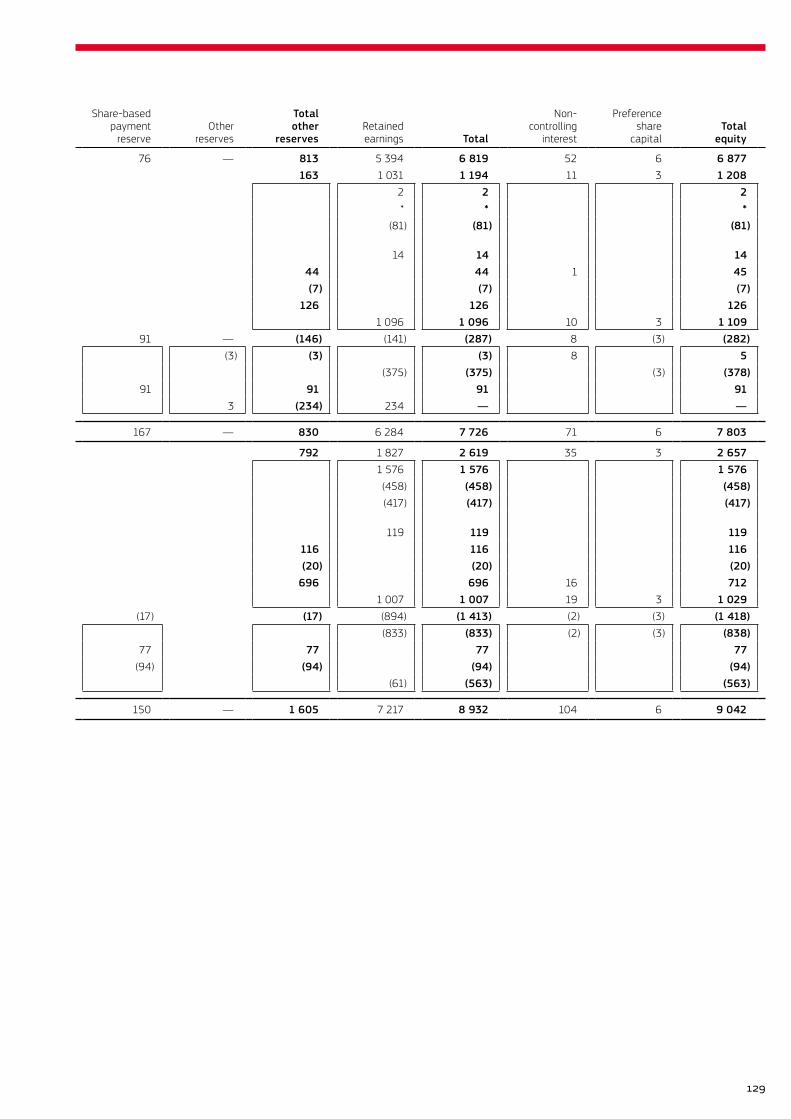
GROUP
R millions
Ordinaryshare
capitalShare
premium
Totalordinary
capital
Propertyrevaluation
surplus
Foreigncurrency
translationreserve
Share-basedpayment
reserveOther
reserves
Totalother
reservesRetainedearnings Total
Non-controlling
interest
Preferenceshare
capitalTotal
equity
Balance at 1 January 2014 116 496 612 237 500 76 — 813 5 394 6 819 52 6 6 877TOTAL COMPREHENSIVE INCOME FOR THE YEAR 163 163 1 031 1 194 11 3 1 208Remeasurement of defined-benefit obligations 2 2 2Deferred tax on remeasurement of defined-benefit obligations * * *Remeasurement of post-retirement medical aid obligations (81) (81) (81)Deferred tax on remeasurement of post-retirement medical aid obligations 14 14 14Foreign currency loan translation differences 44 44 44 1 45Deferred tax on foreign currency loan translation differences (7) (7) (7) (7)Foreign operations translation differences 126 126 126 126Profit for the year 1 096 1 096 10 3 1 109TRANSACTIONS WITH OWNERS (237) 91 — (146) (141) (287) 8 (3) (282)Business combinations and change in ownership percentage (3) (3) (3) 8 5Dividends paid (375) (375) (3) (378)Share-based payment reserve 91 91 91 91Transfers to retained earnings (237) 3 (234) 234 — —
BALANCE AT 31 DECEMBER 2014 116 496 612 — 663 167 — 830 6 284 7 726 71 6 7 803
TOTAL COMPREHENSIVE INCOME FOR THE YEAR 792 792 1 827 2 619 35 3 2 657Remeasurement of defined-benefit obligations 1 576 1 576 1 576Deferred tax on remeasurement of defined-benefit obligations (458) (458) (458)Remeasurement of post-retirement medical aid obligations (417) (417) (417)Deferred tax on remeasurement of post-retirement medical aid obligations 119 119 119Foreign currency loan translation differences 116 116 116 116Deferred tax on foreign currency loan translation differences (20) (20) (20) (20)Foreign operations translation differences 696 696 696 16 712Profit for the year 1 007 1 007 19 3 1 029TRANSACTIONS WITH OWNERS (6) (496) (502) (17) (17) (894) (1 413) (2) (3) (1 418)Dividends paid (833) (833) (2) (3) (838)Share-based payment reserve 77 77 77 77Settlement cost of performance shares (94) (94) (94) (94)Shares repurchased (6) (496) (502) (61) (563) (563)
BALANCE AT 31 DECEMBER 2015 110 — 110 — 1 455 150 — 1 605 7 217 8 932 104 6 9 042
* Nominal amount.
FOREIGN CURRENCY TRANSLATION RESERVEThe foreign currency translation reserve comprises all foreign exchange differences from the translation of the financial statements of foreign operations, as well as from the translation of monetary items receivable from or payable to a foreign operation.
SHARE-BASED PAYMENT RESERVEThe share-based payment reserve comprises the accumulated share-based payments over the vesting periods of the underlying instruments. Once all the instruments have vested, the reserve will be released to retained earnings. The costs related to obtaining shares to deliver to employees under the scheme reduce the reserve.
129

COMPANY
R millions
Ordinaryshare
capitalShare
premium
Totalordinary
capital
Propertyrevaluation
surplus
Share-basedpayment
reserveOther
reserves
Totalother
reservesRetainedearnings Total
Preferenceshare
capitalTotal
equity
Balance at 1 January 2014 128 602 730 241 77 6 324 2 276 3 330 6 3 336
TOTAL COMPREHENSIVE INCOME FOR THE YEAR 325 325 3 328
Remeasurement of defined-benefit obligations 38 38 38
Deferred tax on remeasurement of defined-benefit obligations 11 11 11
Remeasurement of post-retirement medical aid obligations (72) (72) (72)
Deferred tax on remeasurement of post-retirement medical aid obligations 5 5 5
Profit for the year 343 343 3 346
TRANSACTIONS WITH OWNERS (241) 91 (150) (172) (322) (3) (325)
Dividends paid (413) (413) (3) (416)
Share-based payment reserve 91 91 91 91
Transfers to retained earnings (241) (241) 241 — —
BALANCE AT 31 DECEMBER 2014 128 602 730 — 168 6 174 2 429 3 333 6 3 339
TOTAL COMPREHENSIVE INCOME FOR THE YEAR 1 128 1 128 3 1 131
Remeasurement of defined-benefit obligations 1 597 1 597 1 597
Deferred tax on remeasurement of defined-benefit obligations (458) (458) (458)
Remeasurement of post-retirement medical aid obligations (408) (408) (408)
Deferred tax on remeasurement of post-retirement medical aid obligations 108 108 108
Profit for the year 289 289 3 292
TRANSACTIONS WITH OWNERS (6) (557) (563) (17) (6) (23) (913) (1 499) (3) (1 502)
Dividends paid (919) (919) (3) (922)
Share-based payment reserve 77 77 77 77
Settlement cost for performance shares (94) (94) (94) (94)
Shares repurchased (6) (557) (563) (563) (563)
Transfers to retained earnings (6) (6) 6 — —
BALANCE AT 31 DECEMBER 2015 122 45 167 — 151 — 151 2 644 2 962 6 2 968
130
STATEMENTS OF CHANGES IN EQUITY FOR THE YEAR ENDED 31 DECEMBER 2015 continued
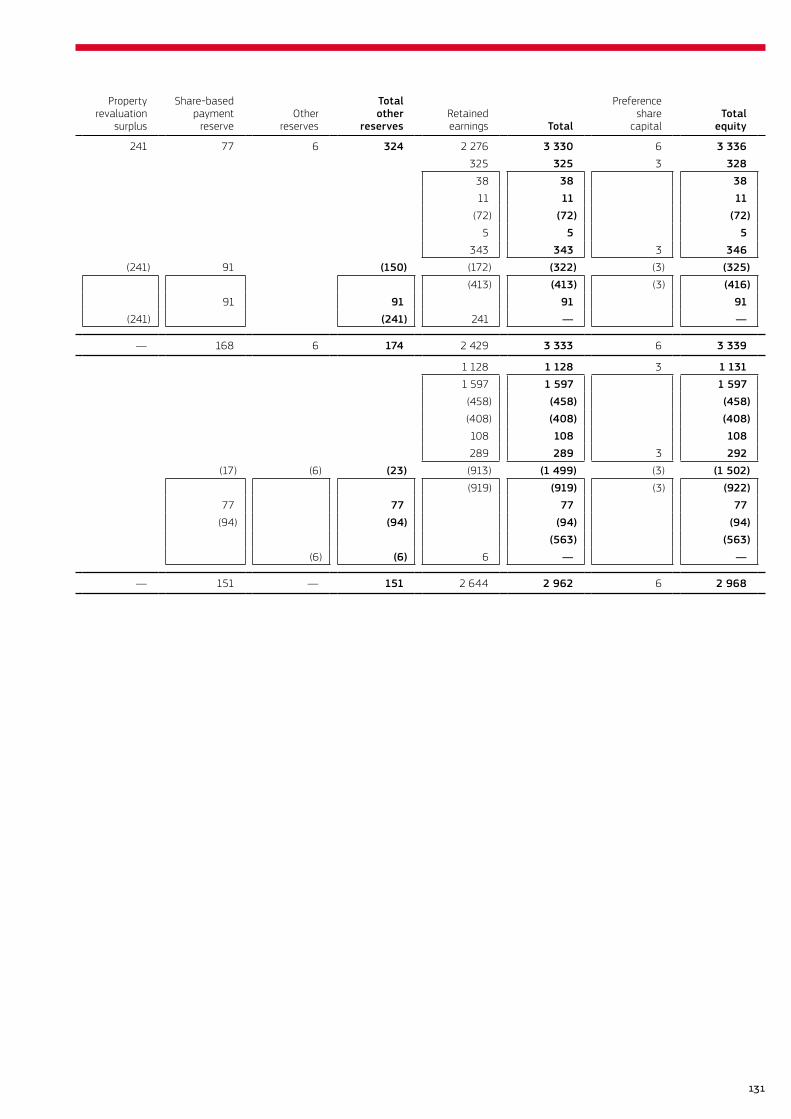
COMPANY
R millions
Ordinaryshare
capitalShare
premium
Totalordinary
capital
Propertyrevaluation
surplus
Share-basedpayment
reserveOther
reserves
Totalother
reservesRetainedearnings Total
Preferenceshare
capitalTotal
equity
Balance at 1 January 2014 128 602 730 241 77 6 324 2 276 3 330 6 3 336
TOTAL COMPREHENSIVE INCOME FOR THE YEAR 325 325 3 328
Remeasurement of defined-benefit obligations 38 38 38
Deferred tax on remeasurement of defined-benefit obligations 11 11 11
Remeasurement of post-retirement medical aid obligations (72) (72) (72)
Deferred tax on remeasurement of post-retirement medical aid obligations 5 5 5
Profit for the year 343 343 3 346
TRANSACTIONS WITH OWNERS (241) 91 (150) (172) (322) (3) (325)
Dividends paid (413) (413) (3) (416)
Share-based payment reserve 91 91 91 91
Transfers to retained earnings (241) (241) 241 — —
BALANCE AT 31 DECEMBER 2014 128 602 730 — 168 6 174 2 429 3 333 6 3 339
TOTAL COMPREHENSIVE INCOME FOR THE YEAR 1 128 1 128 3 1 131
Remeasurement of defined-benefit obligations 1 597 1 597 1 597
Deferred tax on remeasurement of defined-benefit obligations (458) (458) (458)
Remeasurement of post-retirement medical aid obligations (408) (408) (408)
Deferred tax on remeasurement of post-retirement medical aid obligations 108 108 108
Profit for the year 289 289 3 292
TRANSACTIONS WITH OWNERS (6) (557) (563) (17) (6) (23) (913) (1 499) (3) (1 502)
Dividends paid (919) (919) (3) (922)
Share-based payment reserve 77 77 77 77
Settlement cost for performance shares (94) (94) (94) (94)
Shares repurchased (6) (557) (563) (563) (563)
Transfers to retained earnings (6) (6) 6 — —
BALANCE AT 31 DECEMBER 2015 122 45 167 — 151 — 151 2 644 2 962 6 2 968
131
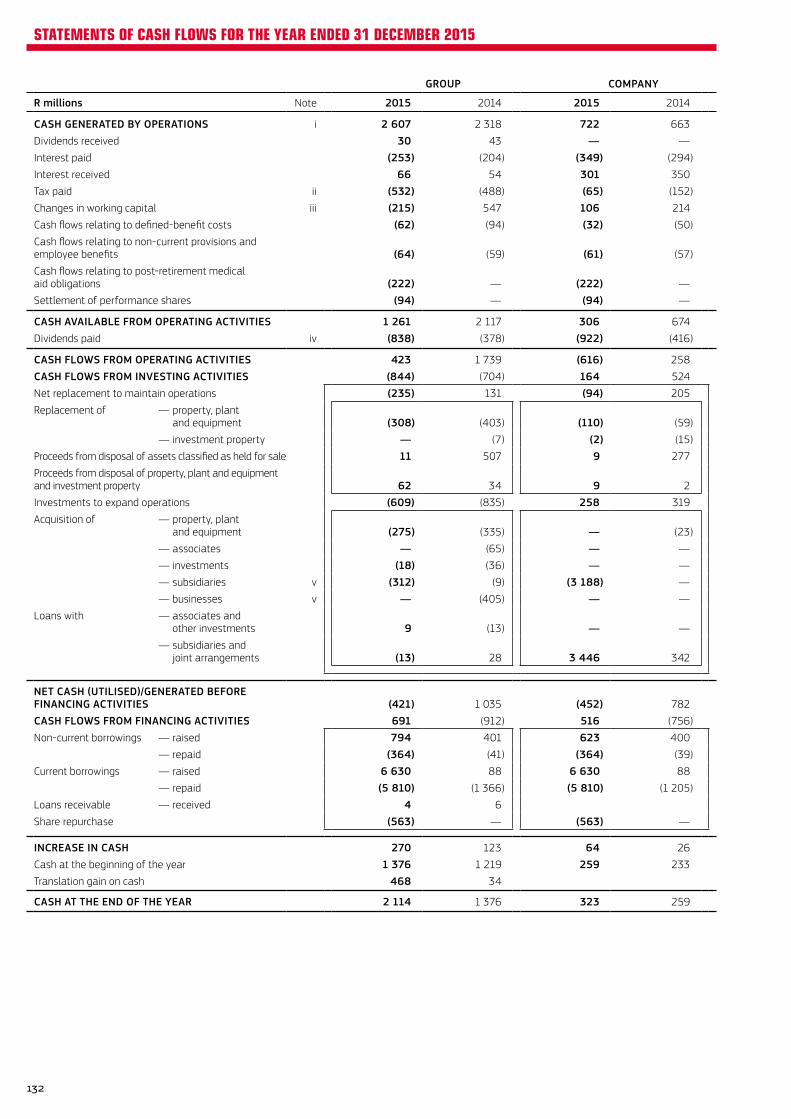
GROUP COMPANY
R millions Note 2015 2014 2015 2014
CASH GENERATED BY OPERATIONS i 2 607 2 318 722 663
Dividends received 30 43 — —
Interest paid (253) (204) (349) (294)
Interest received 66 54 301 350
Tax paid ii (532) (488) (65) (152)
Changes in working capital iii (215) 547 106 214
Cash flows relating to defined-benefit costs (62) (94) (32) (50)
Cash flows relating to non-current provisions and employee benefits (64) (59) (61) (57)
Cash flows relating to post-retirement medical aid obligations (222) — (222) —
Settlement of performance shares (94) — (94) —
CASH AVAILABLE FROM OPERATING ACTIVITIES 1 261 2 117 306 674
Dividends paid iv (838) (378) (922) (416)
CASH FLOWS FROM OPERATING ACTIVITIES 423 1 739 (616) 258
CASH FLOWS FROM INVESTING ACTIVITIES (844) (704) 164 524
Net replacement to maintain operations (235) 131 (94) 205
Replacement of — property, plant and equipment (308) (403) (110) (59)
— investment property — (7) (2) (15)
Proceeds from disposal of assets classified as held for sale 11 507 9 277
Proceeds from disposal of property, plant and equipment and investment property 62 34 9 2
Investments to expand operations (609) (835) 258 319
Acquisition of — property, plant and equipment (275) (335) — (23)
— associates — (65) — —
— investments (18) (36) — —
— subsidiaries v (312) (9) (3 188) —
— businesses v — (405) — —
Loans with — associates and other investments 9 (13) — —
— subsidiaries and joint arrangements (13) 28 3 446 342
NET CASH (UTILISED)/GENERATED BEFORE FINANCING ACTIVITIES (421) 1 035 (452) 782
CASH FLOWS FROM FINANCING ACTIVITIES 691 (912) 516 (756)
Non-current borrowings — raised 794 401 623 400
— repaid (364) (41) (364) (39)
Current borrowings — raised 6 630 88 6 630 88
— repaid (5 810) (1 366) (5 810) (1 205)
Loans receivable — received 4 6
Share repurchase (563) — (563) —
INCREASE IN CASH 270 123 64 26
Cash at the beginning of the year 1 376 1 219 259 233
Translation gain on cash 468 34
CASH AT THE END OF THE YEAR 2 114 1 376 323 259
132
STATEMENTS OF CASH FLOWS FOR THE YEAR ENDED 31 DECEMBER 2015
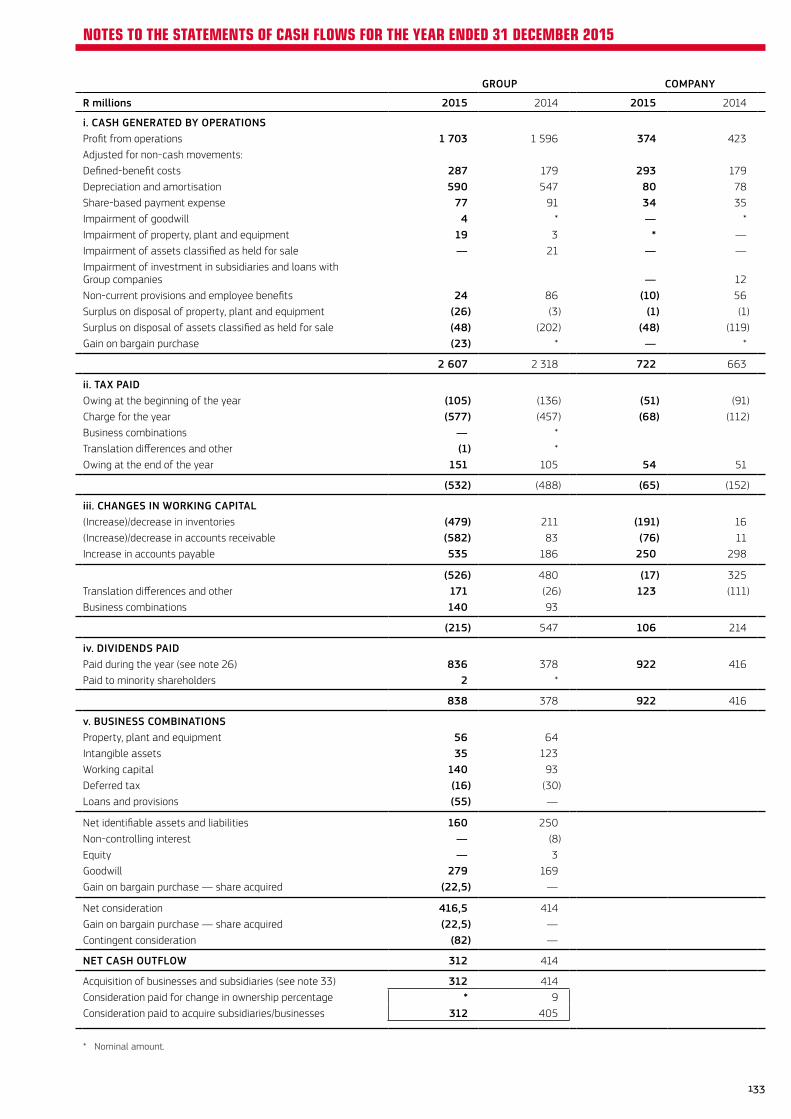
GROUP COMPANY
R millions 2015 2014 2015 2014
i. CASH GENERATED BY OPERATIONSProfit from operations 1 703 1 596 374 423Adjusted for non-cash movements:Defined-benefit costs 287 179 293 179Depreciation and amortisation 590 547 80 78Share-based payment expense 77 91 34 35Impairment of goodwill 4 * — *Impairment of property, plant and equipment 19 3 * —Impairment of assets classified as held for sale — 21 — —Impairment of investment in subsidiaries and loans with Group companies — 12Non-current provisions and employee benefits 24 86 (10) 56Surplus on disposal of property, plant and equipment (26) (3) (1) (1)Surplus on disposal of assets classified as held for sale (48) (202) (48) (119)Gain on bargain purchase (23) * — *
2 607 2 318 722 663
ii. TAX PAIDOwing at the beginning of the year (105) (136) (51) (91)Charge for the year (577) (457) (68) (112)Business combinations — *Translation differences and other (1) *Owing at the end of the year 151 105 54 51
(532) (488) (65) (152)
iii. CHANGES IN WORKING CAPITAL(Increase)/decrease in inventories (479) 211 (191) 16(Increase)/decrease in accounts receivable (582) 83 (76) 11Increase in accounts payable 535 186 250 298
(526) 480 (17) 325Translation differences and other 171 (26) 123 (111)Business combinations 140 93
(215) 547 106 214
iv. DIVIDENDS PAIDPaid during the year (see note 26) 836 378 922 416Paid to minority shareholders 2 *
838 378 922 416
v. BUSINESS COMBINATIONSProperty, plant and equipment 56 64Intangible assets 35 123Working capital 140 93Deferred tax (16) (30)Loans and provisions (55) —
Net identifiable assets and liabilities 160 250Non-controlling interest — (8)Equity — 3Goodwill 279 169Gain on bargain purchase — share acquired (22,5) —
Net consideration 416,5 414Gain on bargain purchase — share acquired (22,5) —Contingent consideration (82) —
NET CASH OUTFLOW 312 414
Acquisition of businesses and subsidiaries (see note 33) 312 414Consideration paid for change in ownership percentage * 9Consideration paid to acquire subsidiaries/businesses 312 405
* Nominal amount.
133
NOTES TO THE STATEMENTS OF CASH FLOWS FOR THE YEAR ENDED 31 DECEMBER 2015
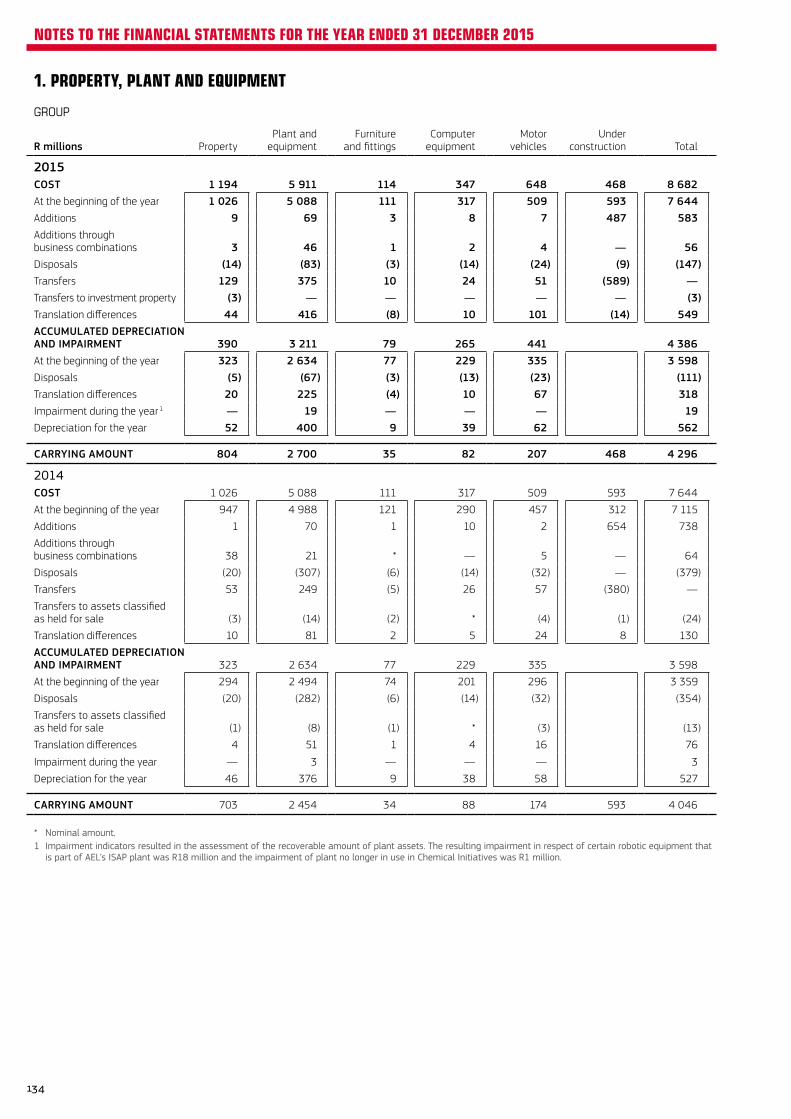
1. PROPERTY, PLANT AND EQUIPMENT
GROUP
R millions PropertyPlant and
equipmentFurniture
and fittingsComputer
equipmentMotor
vehiclesUnder
construction Total
2015COST 1 194 5 911 114 347 648 468 8 682At the beginning of the year 1 026 5 088 111 317 509 593 7 644Additions 9 69 3 8 7 487 583Additions through business combinations 3 46 1 2 4 — 56Disposals (14) (83) (3) (14) (24) (9) (147)Transfers 129 375 10 24 51 (589) —Transfers to investment property (3) — — — — — (3)Translation differences 44 416 (8) 10 101 (14) 549ACCUMULATED DEPRECIATION AND IMPAIRMENT 390 3 211 79 265 441 4 386At the beginning of the year 323 2 634 77 229 335 3 598Disposals (5) (67) (3) (13) (23) (111)Translation differences 20 225 (4) 10 67 318Impairment during the year 1 — 19 — — — 19Depreciation for the year 52 400 9 39 62 562
CARRYING AMOUNT 804 2 700 35 82 207 468 4 296
2014COST 1 026 5 088 111 317 509 593 7 644
At the beginning of the year 947 4 988 121 290 457 312 7 115
Additions 1 70 1 10 2 654 738
Additions through business combinations 38 21 * — 5 — 64
Disposals (20) (307) (6) (14) (32) — (379)
Transfers 53 249 (5) 26 57 (380) —
Transfers to assets classified as held for sale (3) (14) (2) * (4) (1) (24)
Translation differences 10 81 2 5 24 8 130
ACCUMULATED DEPRECIATION AND IMPAIRMENT 323 2 634 77 229 335 3 598
At the beginning of the year 294 2 494 74 201 296 3 359
Disposals (20) (282) (6) (14) (32) (354)
Transfers to assets classified as held for sale (1) (8) (1) * (3) (13)
Translation differences 4 51 1 4 16 76
Impairment during the year — 3 — — — 3
Depreciation for the year 46 376 9 38 58 527
CARRYING AMOUNT 703 2 454 34 88 174 593 4 046
* Nominal amount.1 Impairment indicators resulted in the assessment of the recoverable amount of plant assets. The resulting impairment in respect of certain robotic equipment that
is part of AEL’s ISAP plant was R18 million and the impairment of plant no longer in use in Chemical Initiatives was R1 million.
134
NOTES TO THE FINANCIAL STATEMENTS FOR THE YEAR ENDED 31 DECEMBER 2015
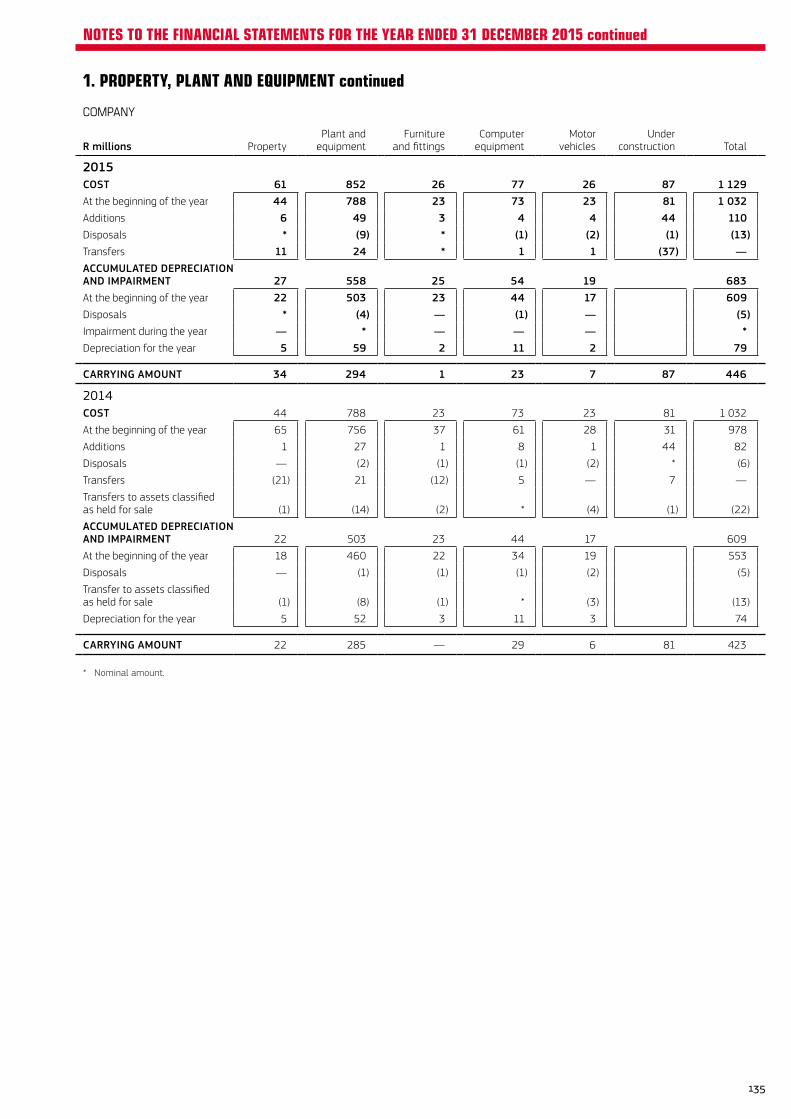
1. PROPERTY, PLANT AND EQUIPMENT continued
COMPANY
R millions PropertyPlant and
equipmentFurniture
and fittingsComputer
equipmentMotor
vehiclesUnder
construction Total
2015COST 61 852 26 77 26 87 1 129At the beginning of the year 44 788 23 73 23 81 1 032Additions 6 49 3 4 4 44 110Disposals * (9) * (1) (2) (1) (13)Transfers 11 24 * 1 1 (37) —ACCUMULATED DEPRECIATION AND IMPAIRMENT 27 558 25 54 19 683At the beginning of the year 22 503 23 44 17 609Disposals * (4) — (1) — (5)Impairment during the year — * — — — *Depreciation for the year 5 59 2 11 2 79
CARRYING AMOUNT 34 294 1 23 7 87 446
2014COST 44 788 23 73 23 81 1 032
At the beginning of the year 65 756 37 61 28 31 978
Additions 1 27 1 8 1 44 82
Disposals — (2) (1) (1) (2) * (6)
Transfers (21) 21 (12) 5 — 7 —
Transfers to assets classified as held for sale (1) (14) (2) * (4) (1) (22)
ACCUMULATED DEPRECIATION AND IMPAIRMENT 22 503 23 44 17 609
At the beginning of the year 18 460 22 34 19 553
Disposals — (1) (1) (1) (2) (5)
Transfer to assets classified as held for sale (1) (8) (1) * (3) (13)
Depreciation for the year 5 52 3 11 3 74
CARRYING AMOUNT 22 285 — 29 6 81 423
* Nominal amount.
135
NOTES TO THE FINANCIAL STATEMENTS FOR THE YEAR ENDED 31 DECEMBER 2015 continued
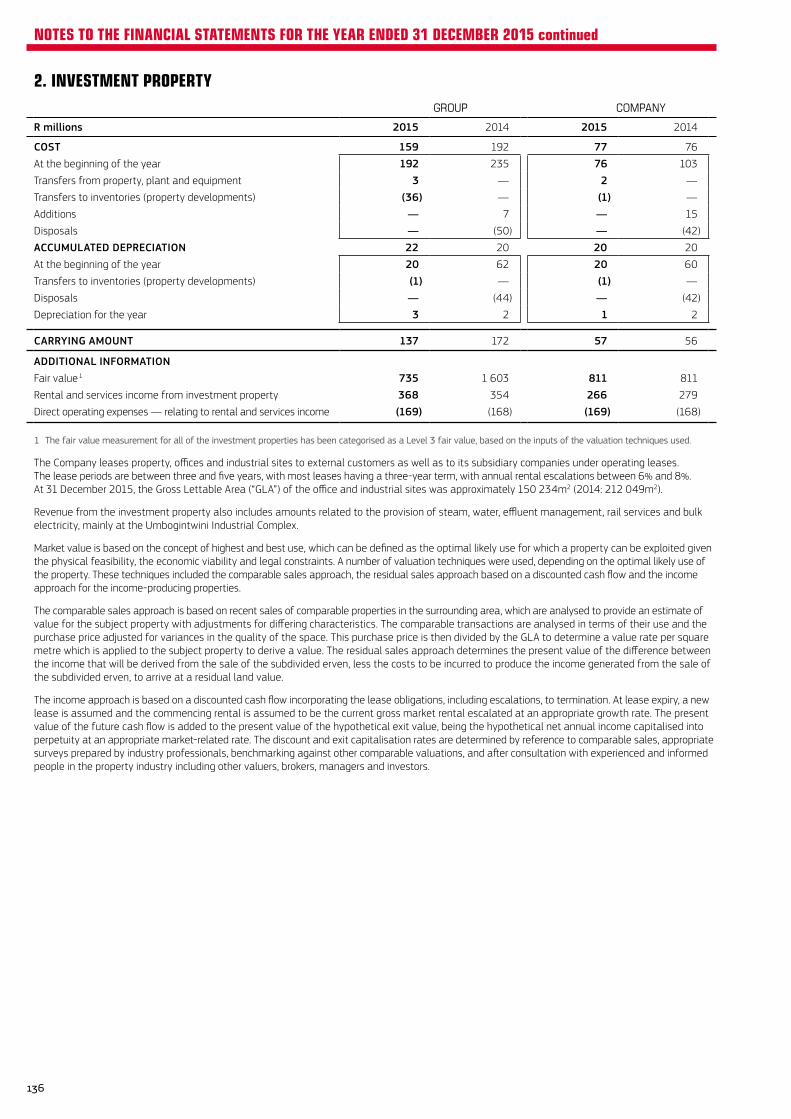
2. INVESTMENT PROPERTYGROUP COMPANY
R millions 2015 2014 2015 2014
COST 159 192 77 76
At the beginning of the year 192 235 76 103
Transfers from property, plant and equipment 3 — 2 —
Transfers to inventories (property developments) (36) — (1) —
Additions — 7 — 15
Disposals — (50) — (42)
ACCUMULATED DEPRECIATION 22 20 20 20
At the beginning of the year 20 62 20 60
Transfers to inventories (property developments) (1) — (1) —
Disposals — (44) — (42)
Depreciation for the year 3 2 1 2
CARRYING AMOUNT 137 172 57 56
ADDITIONAL INFORMATIONFair value 1 735 1 603 811 811
Rental and services income from investment property 368 354 266 279
Direct operating expenses — relating to rental and services income (169) (168) (169) (168)
1 The fair value measurement for all of the investment properties has been categorised as a Level 3 fair value, based on the inputs of the valuation techniques used.
The Company leases property, offices and industrial sites to external customers as well as to its subsidiary companies under operating leases. The lease periods are between three and five years, with most leases having a three-year term, with annual rental escalations between 6% and 8%. At 31 December 2015, the Gross Lettable Area (“GLA”) of the office and industrial sites was approximately 150 234m2 (2014: 212 049m2).
Revenue from the investment property also includes amounts related to the provision of steam, water, effluent management, rail services and bulk electricity, mainly at the Umbogintwini Industrial Complex.
Market value is based on the concept of highest and best use, which can be defined as the optimal likely use for which a property can be exploited given the physical feasibility, the economic viability and legal constraints. A number of valuation techniques were used, depending on the optimal likely use of the property. These techniques included the comparable sales approach, the residual sales approach based on a discounted cash flow and the income approach for the income-producing properties.
The comparable sales approach is based on recent sales of comparable properties in the surrounding area, which are analysed to provide an estimate of value for the subject property with adjustments for differing characteristics. The comparable transactions are analysed in terms of their use and the purchase price adjusted for variances in the quality of the space. This purchase price is then divided by the GLA to determine a value rate per square metre which is applied to the subject property to derive a value. The residual sales approach determines the present value of the difference between the income that will be derived from the sale of the subdivided erven, less the costs to be incurred to produce the income generated from the sale of the subdivided erven, to arrive at a residual land value.
The income approach is based on a discounted cash flow incorporating the lease obligations, including escalations, to termination. At lease expiry, a new lease is assumed and the commencing rental is assumed to be the current gross market rental escalated at an appropriate growth rate. The present value of the future cash flow is added to the present value of the hypothetical exit value, being the hypothetical net annual income capitalised into perpetuity at an appropriate market-related rate. The discount and exit capitalisation rates are determined by reference to comparable sales, appropriate surveys prepared by industry professionals, benchmarking against other comparable valuations, and after consultation with experienced and informed people in the property industry including other valuers, brokers, managers and investors.
136
NOTES TO THE FINANCIAL STATEMENTS FOR THE YEAR ENDED 31 DECEMBER 2015 continued
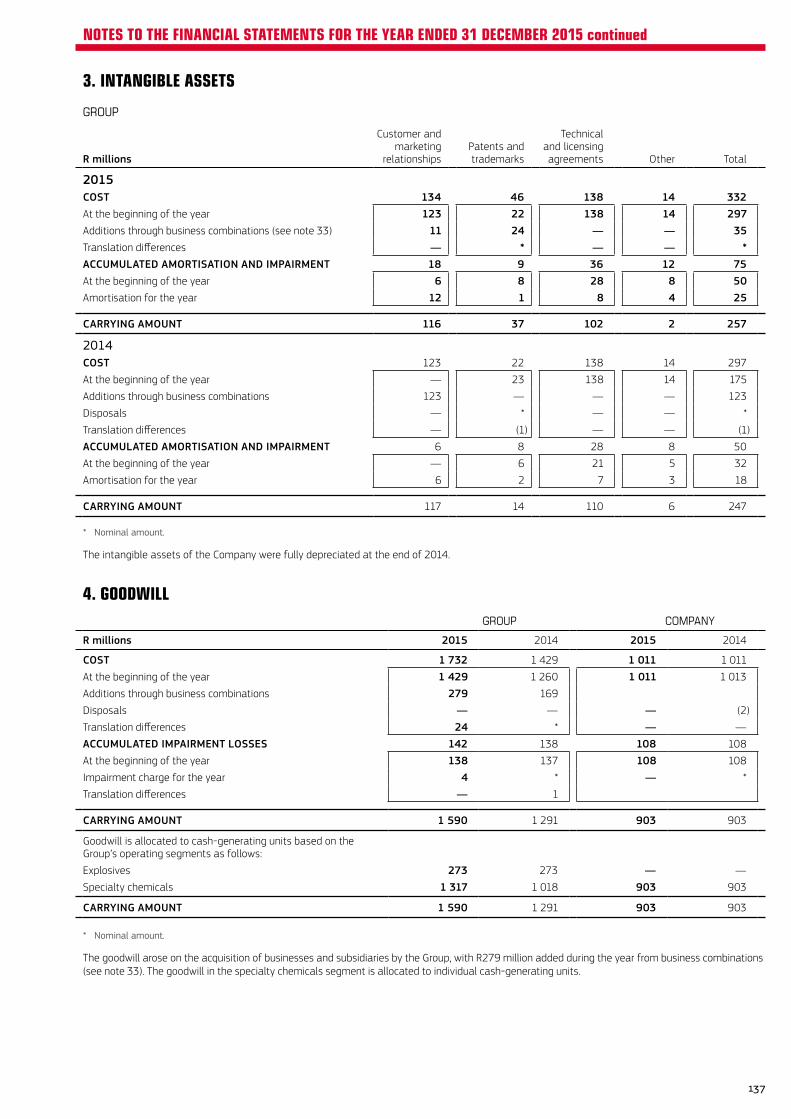
3. INTANGIBLE ASSETS
GROUP
R millions
Customer andmarketing
relationshipsPatents andtrademarks
Technicaland licensingagreements Other Total
2015COST 134 46 138 14 332At the beginning of the year 123 22 138 14 297Additions through business combinations (see note 33) 11 24 — — 35Translation differences — * — — *ACCUMULATED AMORTISATION AND IMPAIRMENT 18 9 36 12 75At the beginning of the year 6 8 28 8 50Amortisation for the year 12 1 8 4 25
CARRYING AMOUNT 116 37 102 2 257
2014COST 123 22 138 14 297
At the beginning of the year — 23 138 14 175
Additions through business combinations 123 — — — 123
Disposals — * — — *
Translation differences — (1) — — (1)
ACCUMULATED AMORTISATION AND IMPAIRMENT 6 8 28 8 50
At the beginning of the year — 6 21 5 32
Amortisation for the year 6 2 7 3 18
CARRYING AMOUNT 117 14 110 6 247
* Nominal amount.
The intangible assets of the Company were fully depreciated at the end of 2014.
4. GOODWILLGROUP COMPANY
R millions 2015 2014 2015 2014
COST 1 732 1 429 1 011 1 011
At the beginning of the year 1 429 1 260 1 011 1 013
Additions through business combinations 279 169
Disposals — — — (2)
Translation differences 24 * — —
ACCUMULATED IMPAIRMENT LOSSES 142 138 108 108
At the beginning of the year 138 137 108 108
Impairment charge for the year 4 * — *
Translation differences — 1
CARRYING AMOUNT 1 590 1 291 903 903
Goodwill is allocated to cash-generating units based on the Group’s operating segments as follows:
Explosives 273 273 — —
Specialty chemicals 1 317 1 018 903 903
CARRYING AMOUNT 1 590 1 291 903 903
* Nominal amount.
The goodwill arose on the acquisition of businesses and subsidiaries by the Group, with R279 million added during the year from business combinations (see note 33). The goodwill in the specialty chemicals segment is allocated to individual cash-generating units.
137
NOTES TO THE FINANCIAL STATEMENTS FOR THE YEAR ENDED 31 DECEMBER 2015 continued
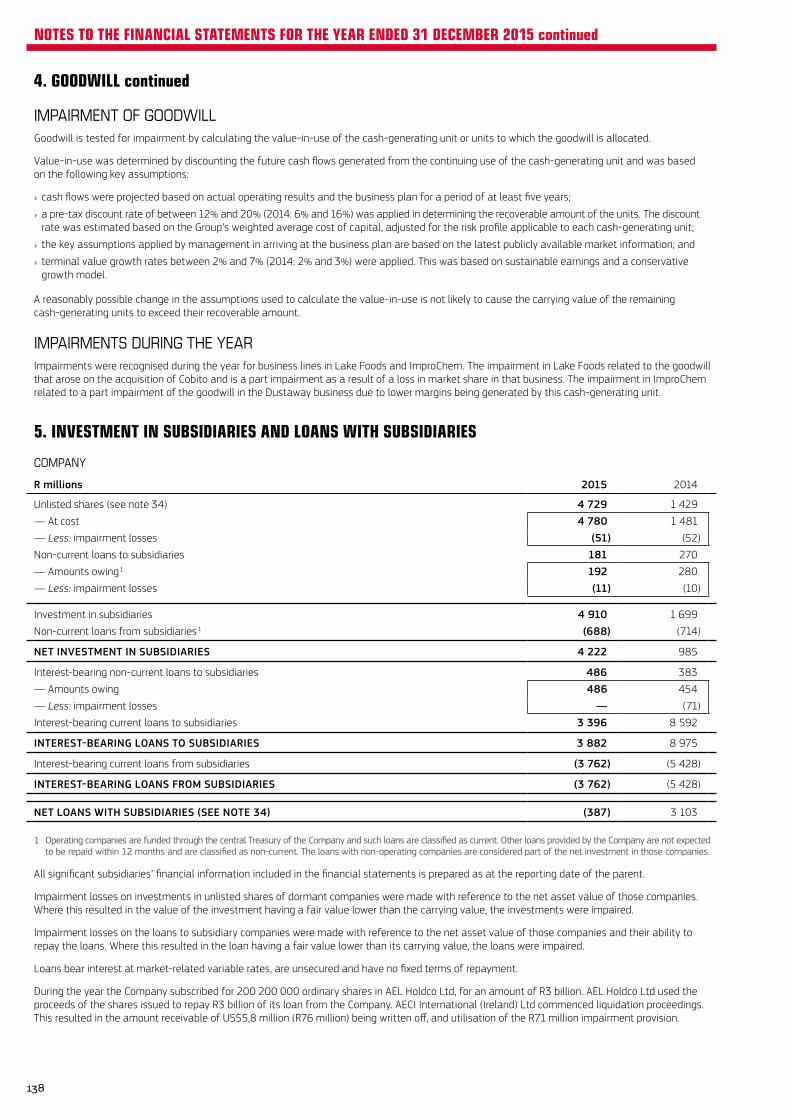
4. GOODWILL continued
IMPAIRMENT OF GOODWILLGoodwill is tested for impairment by calculating the value-in-use of the cash-generating unit or units to which the goodwill is allocated.
Value-in-use was determined by discounting the future cash flows generated from the continuing use of the cash-generating unit and was based on the following key assumptions:
› cash flows were projected based on actual operating results and the business plan for a period of at least five years;
› a pre-tax discount rate of between 12% and 20% (2014: 6% and 16%) was applied in determining the recoverable amount of the units. The discount rate was estimated based on the Group’s weighted average cost of capital, adjusted for the risk profile applicable to each cash-generating unit;
› the key assumptions applied by management in arriving at the business plan are based on the latest publicly available market information; and
› terminal value growth rates between 2% and 7% (2014: 2% and 3%) were applied. This was based on sustainable earnings and a conservative growth model.
A reasonably possible change in the assumptions used to calculate the value-in-use is not likely to cause the carrying value of the remaining cash-generating units to exceed their recoverable amount.
IMPAIRMENTS DURING THE YEARImpairments were recognised during the year for business lines in Lake Foods and ImproChem. The impairment in Lake Foods related to the goodwill that arose on the acquisition of Cobito and is a part impairment as a result of a loss in market share in that business. The impairment in ImproChem related to a part impairment of the goodwill in the Dustaway business due to lower margins being generated by this cash-generating unit.
5. INVESTMENT IN SUBSIDIARIES AND LOANS WITH SUBSIDIARIES
COMPANY
R millions 2015 2014
Unlisted shares (see note 34) 4 729 1 429
— At cost 4 780 1 481
— Less: impairment losses (51) (52)
Non-current loans to subsidiaries 181 270
— Amounts owing 1 192 280
— Less: impairment losses (11) (10)
Investment in subsidiaries 4 910 1 699
Non-current loans from subsidiaries 1 (688) (714)
NET INVESTMENT IN SUBSIDIARIES 4 222 985
Interest-bearing non-current loans to subsidiaries 486 383
— Amounts owing 486 454
— Less: impairment losses — (71)
Interest-bearing current loans to subsidiaries 3 396 8 592
INTEREST-BEARING LOANS TO SUBSIDIARIES 3 882 8 975
Interest-bearing current loans from subsidiaries (3 762) (5 428)
INTEREST-BEARING LOANS FROM SUBSIDIARIES (3 762) (5 428)
NET LOANS WITH SUBSIDIARIES (SEE NOTE 34) (387) 3 103
1 Operating companies are funded through the central Treasury of the Company and such loans are classified as current. Other loans provided by the Company are not expected to be repaid within 12 months and are classified as non-current. The loans with non-operating companies are considered part of the net investment in those companies.
All significant subsidiaries’ financial information included in the financial statements is prepared as at the reporting date of the parent.
Impairment losses on investments in unlisted shares of dormant companies were made with reference to the net asset value of those companies. Where this resulted in the value of the investment having a fair value lower than the carrying value, the investments were impaired.
Impairment losses on the loans to subsidiary companies were made with reference to the net asset value of those companies and their ability to repay the loans. Where this resulted in the loan having a fair value lower than its carrying value, the loans were impaired.
Loans bear interest at market-related variable rates, are unsecured and have no fixed terms of repayment.
During the year the Company subscribed for 200 200 000 ordinary shares in AEL Holdco Ltd, for an amount of R3 billion. AEL Holdco Ltd used the proceeds of the shares issued to repay R3 billion of its loan from the Company. AECI International (Ireland) Ltd commenced liquidation proceedings. This resulted in the amount receivable of US$5,8 million (R76 million) being written off, and utilisation of the R71 million impairment provision.
138
NOTES TO THE FINANCIAL STATEMENTS FOR THE YEAR ENDED 31 DECEMBER 2015 continued
6. INVESTMENT IN JOINT ARRANGEMENTS AND LOANS WITH JOINT ARRANGEMENTSGROUP COMPANY
R millions 2015 2014 2015 2014
Interest-bearing current loans from joint arrangements (36) (49) (72) (116)
LOANS FROM JOINT ARRANGEMENTS (36) (49) (72) (116)
INTERESTS IN JOINT VENTURESThe Group’s share of profit in the equity-accounted investees for the year was R54 million (2014: R50 million).
In 2015 the Group received dividends of R30 million from its equity-accounted investees (2014: R43 million).
Resinkem manufactures and markets urea formaldehyde resins, formaldehyde solutions, urea, phenol and furan resins for the timber, pulp and paper, animal feeds and foundry industries in South Africa. During the year, the Group acquired the other 50% shareholding that it did not already own in this company (see note 33). The result was that the equity-accounted investment was disposed of and a subsidiary was acquired.
Crest Chemicals is a joint venture with the Brenntag AG Group. Crest Chemicals represents several international manufacturers of specialty and commodity chemical products and distributes these to a large number of industries in Southern Africa. Its six divisions service the following key markets: food and beverages, paints and coatings, pharmaceuticals and personal care, mining and water treatment, surfactants and general industry.
Specialty Minerals South Africa is a joint venture with Specialty Minerals Inc., a wholly-owned subsidiary of Minerals Technologies Inc., which is a global leader in precipitated calcium carbonate technology. Accordingly, Specialty Minerals South Africa has access to the most up-to-date technology and technical services. The company’s products are used as a value-adding filler material in the manufacture of copy grade paper in South Africa.
The Group has a residual interest in the net assets of Crest Chemicals and Specialty Minerals South Africa and, therefore, they are classified as joint ventures.
None of the Group’s equity-accounted investees are publicly listed entities and, consequently, they do not have published price quotations.
Summarised financial information for the equity-accounted investees was as follows:
STATEMENTS OF FINANCIAL POSITION
R millions Crest Chemicals Resinkem
SpecialtyMinerals
South Africa Total
2015OWNERSHIP (%) 50 50
Current assets 742 121 863Non-current assets 275 9 284
TOTAL ASSETS 1 017 130 1 147
Current liabilities 410 34 444Non-current liabilities 52 — 52
TOTAL LIABILITIES 462 34 496
Non-controlling interest 25 — 25
NET ASSETS 530 96 626
Group share of net assets 265 48 313
CARRYING AMOUNT 265 48 313
2014OWNERSHIP (%) 50 50 50
Current assets 679 53 62 794
Non-current assets 287 18 7 312
TOTAL ASSETS 966 71 69 1 106
Current liabilities 369 26 8 403
Non-current liabilities 50 9 2 61
TOTAL LIABILITIES 419 35 10 464
Non-controlling interest 28 — — 28
NET ASSETS 519 36 59 614
Group share of net assets 260 18 30 308
CARRYING AMOUNT 260 18 30 308
139
NOTES TO THE FINANCIAL STATEMENTS FOR THE YEAR ENDED 31 DECEMBER 2015 continued
6. INVESTMENT IN JOINT ARRANGEMENTS AND LOANS WITH JOINT ARRANGEMENTS continued
INCOME STATEMENTS
R millions Crest Chemicals Resinkem
SpecialtyMinerals
South Africa Total
2015OWNERSHIP (%) 50 50 50
Revenue 1 673 36 140 1 849Net operating costs excluding depreciation and amortisation (1 564) (36) (84) (1 684)Depreciation and amortisation (9) * (5) (14)Interest expense (2) * — (2)Interest received 6 * 2 8Tax expense (29) * (17) (46)Non-controlling interest (3) — — (3)
PROFIT 72 * 36 108
Group share of profit 36 * 18 54
2014OWNERSHIP (%) 50 50 50
Revenue 1 779 174 138 2 091
Net operating costs excluding depreciation and amortisation (1 674) (169) (94) (1 937)
Depreciation and amortisation (10) (2) (5) (17)
Interest expense (1) — — (1)
Interest received 4 1 1 6
Tax expense (27) (1) (14) (42)
Non-controlling interest (2) — — (2)
PROFIT 69 3 26 98
Group share of profit 35 2 13 50
* Nominal amount.
INTERESTS IN JOINT OPERATIONS
COMPANY
R millions 2015 2014
Unlisted shares at amortised cost 28 28
DetNet is a joint operation with Dyno Nobel, a subsidiary of Incitec Pivot Ltd. DetNet is represented globally by both AEL and Dyno Nobel, thus providing global access and support for all its products. The Group has rights to the assets and obligations for the liabilities of DetNet and thus it is classified as a joint operation.
EFFECTIVE PERCENTAGE HELD BY AECI LTD
Ownership (%) 2015 2014
DetNet International 1 50 50
DetNet South Africa 50 50
1 Incorporated in Ireland. Liquidation proceedings by this entity commenced during the year.
140
NOTES TO THE FINANCIAL STATEMENTS FOR THE YEAR ENDED 31 DECEMBER 2015 continued
7. INVESTMENT IN ASSOCIATES
GROUP
Effective holding (%) 2015 2014
agVantage 17,5 17,5
PT Black Bear Resources Indonesia (“BBRI”) 42,6 42,6
agVantage is an Australian company and the Group’s investment was a strategic investment to grow the market for its agrochemical products through Nulandis. The business did not perform as expected and trading ceased during the year. The Group has significant influence in agVantage as an entity. Although the actual holding is 35%, the investment is held by a joint venture company in which the Group has a 50% interest.
BBRI is an Indonesian company and has built an ammonium nitrate plant which supplies ammonium nitrate solution to the region, thereby improving AEL’s supply chain. This is a strategic investment for the explosives segment and will enable local supply to replace imports into this market.
In June, the Group’s investment in BBRI was impaired by US$4,2 million (R51 million). The value-in-use was reassessed at 31 December by discounting the expected future cash flows to be generated from the investment over the useful life of the underlying plant, using a discount rate of 11,0%. The recoverable amount was US$15 million (R233 million translated at that date), compared to the carrying value of US$19,2 million (R284 million translated at that date), resulting in the recognition of the impairment.
The impairment assessment was performed using a discounted cash flow model, in accordance with the Group’s policy on impairment of non-financial assets. The following key assumptions were applied:
› Material margin percentages were determined by management, using judgement and best estimates derived from information available at the time.
› Sales volumes were determined after considering sustainable production capacity and demand observed in the markets in which BBRI operates.
› The discount rate of 11,0% applied in the model was calculated using the Group’s weighted average cost of capital, the US risk-free rate and the Indonesian country risk premium.
› The discount period was based on the useful economic life of the underlying plant, determined in terms of the Group’s policy on property, plant and equipment.
The Group’s share of losses in these equity-accounted investees for the year was R26 million (2014: R19 million).
141
NOTES TO THE FINANCIAL STATEMENTS FOR THE YEAR ENDED 31 DECEMBER 2015 continued
7. INVESTMENT IN ASSOCIATES continued
STATEMENTS OF FINANCIAL POSITION
R millions BBRI agVantage Total
2015Current assets 103 53 156Non-current assets 506 2 508
TOTAL ASSETS 609 55 664
Current liabilities 290 1 291Non-current liabilities 3 — 3
TOTAL LIABILITIES 293 1 294
NET ASSETS 316 54 370
2014Current assets 110 50 160
Non-current assets 358 2 360
TOTAL ASSETS 468 52 520
Current liabilities 115 1 116
Non-current liabilities 109 — 109
TOTAL LIABILITIES 224 1 225
NET ASSETS 244 51 295
INCOME STATEMENTS
R millions BBRI agVantage Total
2015Revenue 161 — 161Net operating costs excluding depreciation and amortisation (153) — (153)Depreciation and amortisation (43) — (43)Interest expense (19) — (19)Interest received * — *Tax expense (8) — (8)
LOSS (62) — (62)
GROUP SHARE OF LOSSES (26) — (26)
2014Revenue 84 * 84
Net operating costs excluding depreciation and amortisation (102) * (102)
Depreciation and amortisation (31) — (31)
Interest expense (14) — (14)
Interest received * * *
Tax expense 12 — 12
LOSS (51) — (51)
GROUP SHARE OF LOSSES (19) * (19)
* Nominal amount.
142
NOTES TO THE FINANCIAL STATEMENTS FOR THE YEAR ENDED 31 DECEMBER 2015 continued
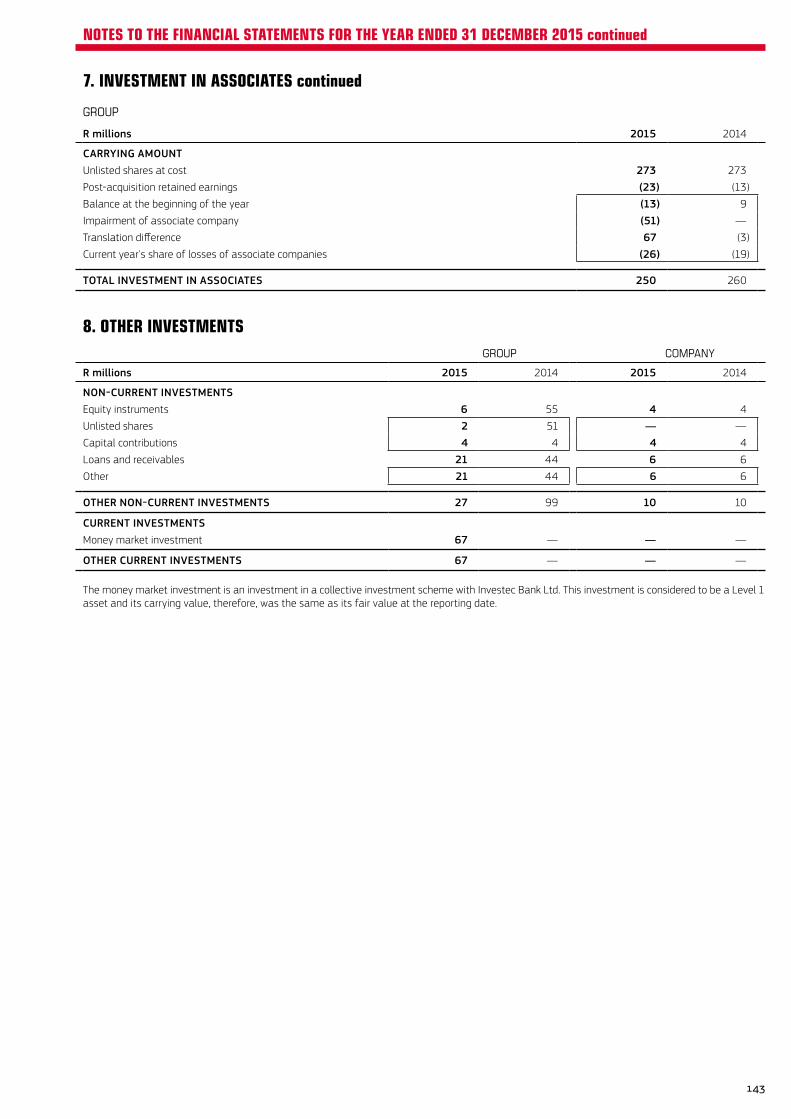
7. INVESTMENT IN ASSOCIATES continued
GROUP
R millions 2015 2014
CARRYING AMOUNTUnlisted shares at cost 273 273
Post-acquisition retained earnings (23) (13)
Balance at the beginning of the year (13) 9
Impairment of associate company (51) —
Translation difference 67 (3)
Current year's share of losses of associate companies (26) (19)
TOTAL INVESTMENT IN ASSOCIATES 250 260
8. OTHER INVESTMENTSGROUP COMPANY
R millions 2015 2014 2015 2014
NON-CURRENT INVESTMENTSEquity instruments 6 55 4 4
Unlisted shares 2 51 — —
Capital contributions 4 4 4 4
Loans and receivables 21 44 6 6
Other 21 44 6 6
OTHER NON-CURRENT INVESTMENTS 27 99 10 10
CURRENT INVESTMENTSMoney market investment 67 — — —
OTHER CURRENT INVESTMENTS 67 — — —
The money market investment is an investment in a collective investment scheme with Investec Bank Ltd. This investment is considered to be a Level 1 asset and its carrying value, therefore, was the same as its fair value at the reporting date.
143
NOTES TO THE FINANCIAL STATEMENTS FOR THE YEAR ENDED 31 DECEMBER 2015 continued
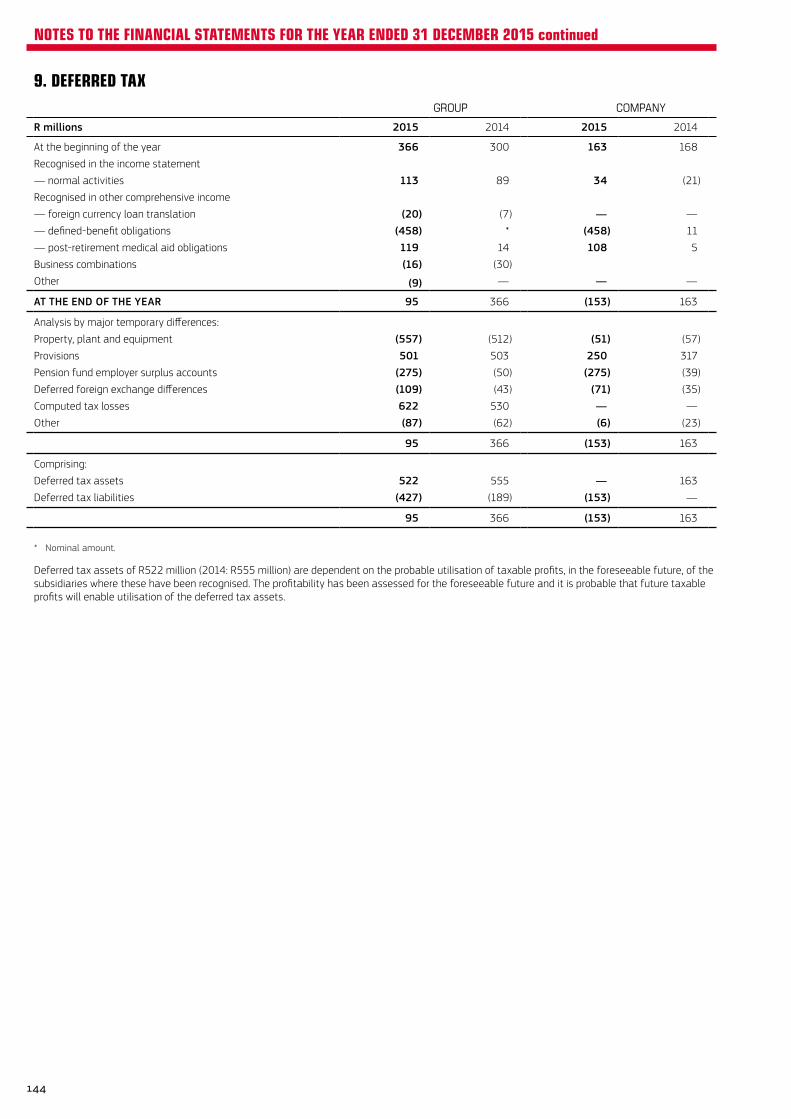
9. DEFERRED TAXGROUP COMPANY
R millions 2015 2014 2015 2014
At the beginning of the year 366 300 163 168
Recognised in the income statement
— normal activities 113 89 34 (21)
Recognised in other comprehensive income
— foreign currency loan translation (20) (7) — —
— defined-benefit obligations (458) * (458) 11
— post-retirement medical aid obligations 119 14 108 5
Business combinations (16) (30)
Other (9) — — —
AT THE END OF THE YEAR 95 366 (153) 163
Analysis by major temporary differences:
Property, plant and equipment (557) (512) (51) (57)
Provisions 501 503 250 317
Pension fund employer surplus accounts (275) (50) (275) (39)
Deferred foreign exchange differences (109) (43) (71) (35)
Computed tax losses 622 530 — —
Other (87) (62) (6) (23)
95 366 (153) 163
Comprising:
Deferred tax assets 522 555 — 163
Deferred tax liabilities (427) (189) (153) —
95 366 (153) 163
* Nominal amount.
Deferred tax assets of R522 million (2014: R555 million) are dependent on the probable utilisation of taxable profits, in the foreseeable future, of the subsidiaries where these have been recognised. The profitability has been assessed for the foreseeable future and it is probable that future taxable profits will enable utilisation of the deferred tax assets.
144
NOTES TO THE FINANCIAL STATEMENTS FOR THE YEAR ENDED 31 DECEMBER 2015 continued
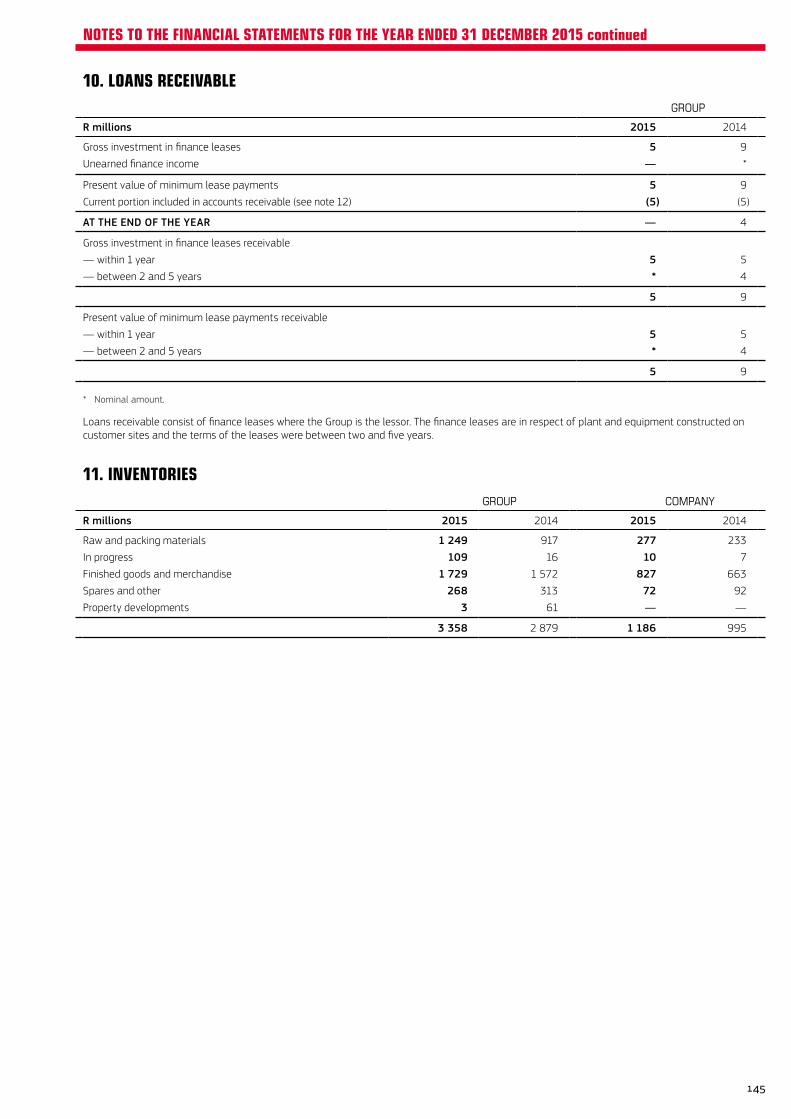
10. LOANS RECEIVABLEGROUP
R millions 2015 2014
Gross investment in finance leases 5 9
Unearned finance income — *
Present value of minimum lease payments 5 9
Current portion included in accounts receivable (see note 12) (5) (5)
AT THE END OF THE YEAR — 4
Gross investment in finance leases receivable
— within 1 year 5 5
— between 2 and 5 years * 4
5 9
Present value of minimum lease payments receivable
— within 1 year 5 5
— between 2 and 5 years * 4
5 9
* Nominal amount.
Loans receivable consist of finance leases where the Group is the lessor. The finance leases are in respect of plant and equipment constructed on customer sites and the terms of the leases were between two and five years.
11. INVENTORIESGROUP COMPANY
R millions 2015 2014 2015 2014
Raw and packing materials 1 249 917 277 233
In progress 109 16 10 7
Finished goods and merchandise 1 729 1 572 827 663
Spares and other 268 313 72 92
Property developments 3 61 — —
3 358 2 879 1 186 995
145
NOTES TO THE FINANCIAL STATEMENTS FOR THE YEAR ENDED 31 DECEMBER 2015 continued
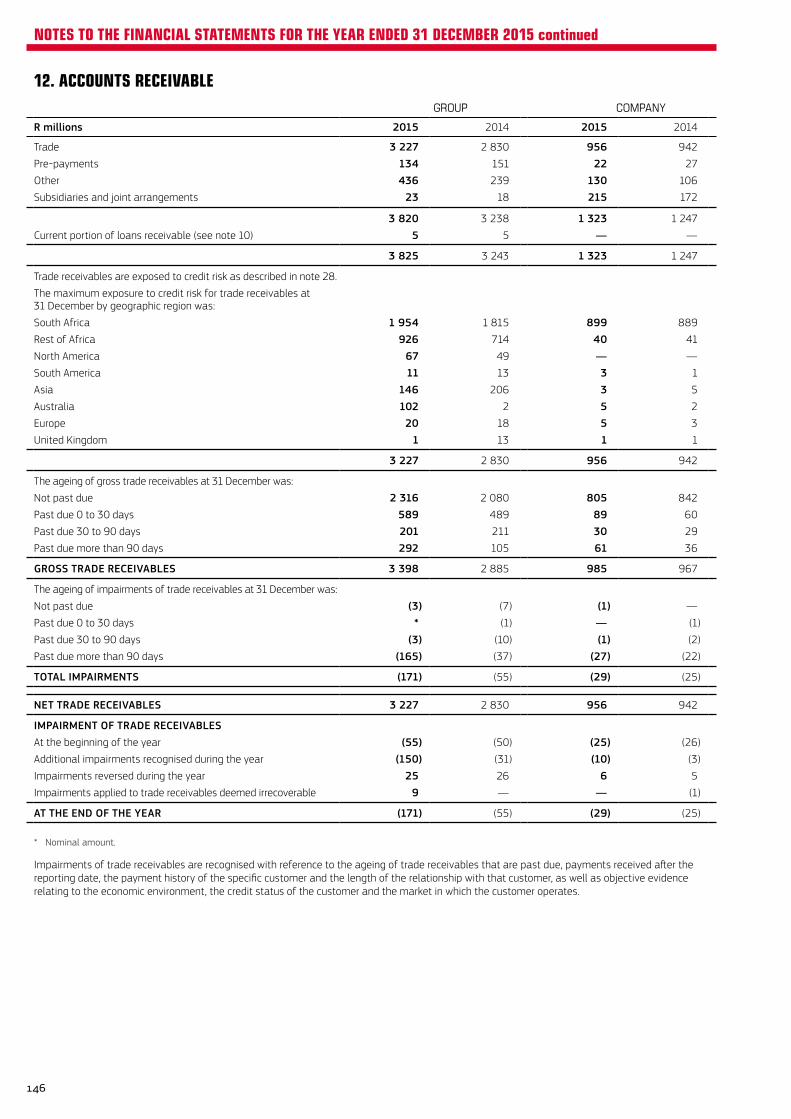
12. ACCOUNTS RECEIVABLEGROUP COMPANY
R millions 2015 2014 2015 2014
Trade 3 227 2 830 956 942
Pre-payments 134 151 22 27
Other 436 239 130 106
Subsidiaries and joint arrangements 23 18 215 172
3 820 3 238 1 323 1 247
Current portion of loans receivable (see note 10) 5 5 — —
3 825 3 243 1 323 1 247
Trade receivables are exposed to credit risk as described in note 28.
The maximum exposure to credit risk for trade receivables at 31 December by geographic region was:
South Africa 1 954 1 815 899 889
Rest of Africa 926 714 40 41
North America 67 49 — —
South America 11 13 3 1
Asia 146 206 3 5
Australia 102 2 5 2
Europe 20 18 5 3
United Kingdom 1 13 1 1
3 227 2 830 956 942
The ageing of gross trade receivables at 31 December was:
Not past due 2 316 2 080 805 842
Past due 0 to 30 days 589 489 89 60
Past due 30 to 90 days 201 211 30 29
Past due more than 90 days 292 105 61 36
GROSS TRADE RECEIVABLES 3 398 2 885 985 967
The ageing of impairments of trade receivables at 31 December was:
Not past due (3) (7) (1) —
Past due 0 to 30 days * (1) — (1)
Past due 30 to 90 days (3) (10) (1) (2)
Past due more than 90 days (165) (37) (27) (22)
TOTAL IMPAIRMENTS (171) (55) (29) (25)
NET TRADE RECEIVABLES 3 227 2 830 956 942
IMPAIRMENT OF TRADE RECEIVABLESAt the beginning of the year (55) (50) (25) (26)
Additional impairments recognised during the year (150) (31) (10) (3)
Impairments reversed during the year 25 26 6 5
Impairments applied to trade receivables deemed irrecoverable 9 — — (1)
AT THE END OF THE YEAR (171) (55) (29) (25)
* Nominal amount.
Impairments of trade receivables are recognised with reference to the ageing of trade receivables that are past due, payments received after the reporting date, the payment history of the specific customer and the length of the relationship with that customer, as well as objective evidence relating to the economic environment, the credit status of the customer and the market in which the customer operates.
146
NOTES TO THE FINANCIAL STATEMENTS FOR THE YEAR ENDED 31 DECEMBER 2015 continued

13. ASSETS CLASSIFIED AS HELD FOR SALEThe Group transferred the remaining two properties to Shanghai Zendai Property Ltd during the year in terms of the sale agreement entered into in 2013. Proceeds of R122 million, previously recognised as income received in advance, and the carrying amount of R74 million, previously classified as held for sale, were recognised in the income statement. The profit of R48 million was included in the property segment but excluded from HEPS as it was capital in nature.
In 2014 Akulu Marchon’s petroleum jelly business discontinued production, distribution and warehousing operations at its Mobeni site in KwaZulu-Natal. Akulu Marchon is part of the specialty chemicals segment. The business entered into an agreement to sell this site and its related production assets. All conditions precedent were fulfilled during the year and the assets which had a carrying amount of R11 million (2014: R11 million) were disposed of, resulting in a nominal loss.
147
NOTES TO THE FINANCIAL STATEMENTS FOR THE YEAR ENDED 31 DECEMBER 2015 continued
14. SHARE CAPITAL AND SHARE PREMIUMNUMBER OF SHARES GROUP COMPANY
2015 20142015
R millions2014
R millions2015
R millions2014
R millions
ORDINARY SHARESAuthorised
Ordinary shares of R1 each 180 000 000 180 000 000 180 180 180 180
B ordinary shares of no par value 10 117 951 10 117 951
LISTED ORDINARY SHARES AT THE BEGINNING AND END OF THE YEARAt the beginning of the yearGroup 116 356 441 116 356 441 116 116
Company 128 241 140 128 241 140 128 128
Repurchased during the year 1
Group (5 969 845) (6)Company (5 969 845) (6) —
AT THE END OF THE YEARGroup 110 386 596 116 356 441 110 116
Company 122 271 295 128 241 140 122 128
UNLISTED REDEEMABLE CONVERTIBLE B ORDINARY SHARES AT THE BEGINNING AND END OF THE YEARCompany 10 117 951 10 117 951
Share premium less share issue expenses — 496 45 602
At the beginning of the year 496 496 602 602
Shares repurchased (496) — (557) —
Total ordinary shares at the beginning and end of the year
Group 110 386 596 116 356 441 110 612
Company 132 389 246 138 359 091 167 730
No par value treasury shares held by consolidated trust 10 117 951 10 117 951
Par value treasury shares held by a subsidiary company 11 884 699 11 884 699
Total treasury shares at the beginning and end of the year 22 002 650 22 002 650
LISTED PREFERENCE SHARESAuthorised and issued
5,5% cumulative shares of R2 each 3 000 000 3 000 000 6 6 6 6
1 At 31 December 2015, 969 845 of the 5 969 845 shares that were repurchased by the Company, at an average price of R94,25 per share, had not yet been delisted.
In terms of the Company’s MOI all payments of dividends on the preference shares and all payments to be made in respect of the preference shares in the event of liquidation shall be made in pound sterling and calculated as though the shares were one pound sterling. The capital repayment to preference shareholders in the event of liquidation is limited to 3 150 000 pound sterling (1,05 pound sterling per share).
The Company has two beneficial shareholders holding 5,0% or more of the Company’s listed ordinary shares, excluding treasury shares, being the Government Employees Pension Fund (PIC) and the Corolife Special Opportunities Portfolio. Their holdings, at 31 December 2015, were 21 289 126 and 5 767 136 shares respectively, equivalent to 19,12% and 5,18% of the Company’s listed ordinary shares.
CAPITAL MANAGEMENTThe Board’s policy is to maintain a strong capital base so as to maintain investor and market confidence and to sustain future development of the business. The Board monitors the spread of shareholders, the level of dividends to ordinary shareholders and return on capital. Return on capital is defined as profit from operations plus investment income related to average property, plant and equipment, investment property, intangible assets, goodwill, investments, inventories, accounts receivable and assets classified as held for sale, less accounts payable. There are no externally imposed capital requirements.
SHARE REPURCHASEDuring the year AECI undertook a general share repurchase in terms of the general authority to repurchase shares approved by shareholders at the AGM of the Company held on 1 June 2015. 5 969 845 shares, or 4,66% of AECI’s issued share capital, were repurchased at a cost of R563 million.
148
NOTES TO THE FINANCIAL STATEMENTS FOR THE YEAR ENDED 31 DECEMBER 2015 continued
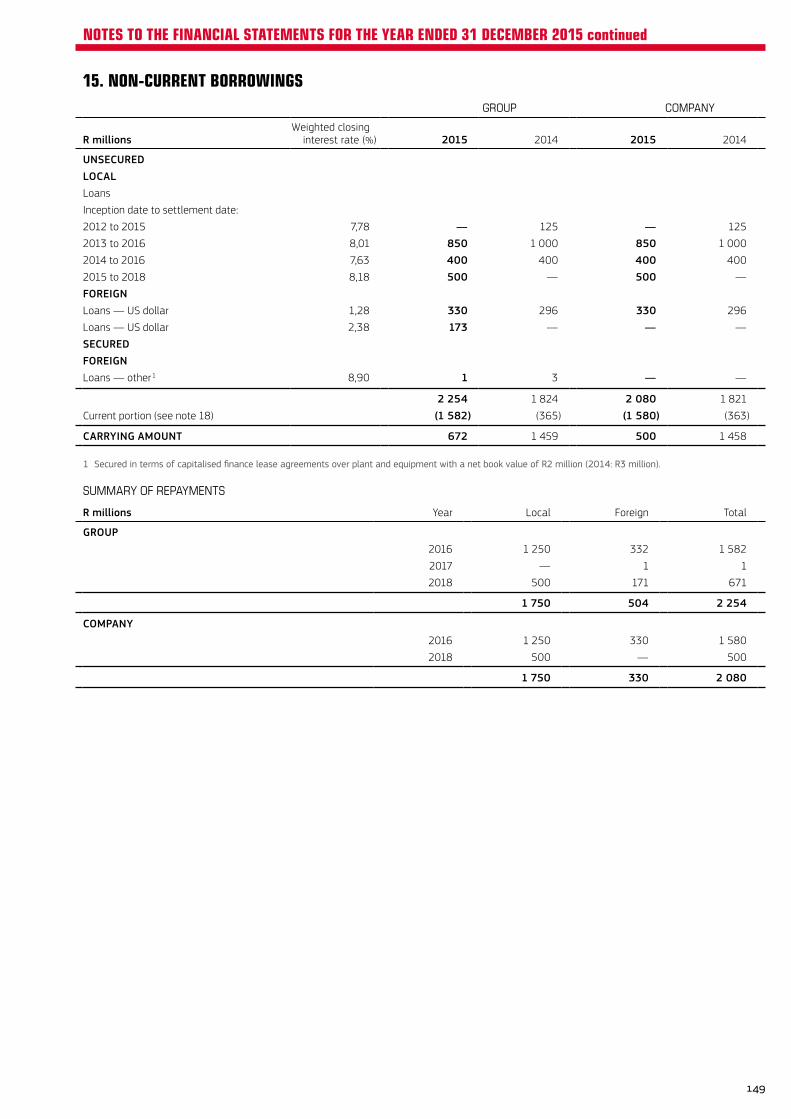
15. NON-CURRENT BORROWINGSGROUP COMPANY
R millionsWeighted closing
interest rate (%) 2015 2014 2015 2014
UNSECUREDLOCALLoans
Inception date to settlement date:
2012 to 2015 7,78 — 125 — 125
2013 to 2016 8,01 850 1 000 850 1 000
2014 to 2016 7,63 400 400 400 400
2015 to 2018 8,18 500 — 500 —
FOREIGNLoans — US dollar 1,28 330 296 330 296
Loans — US dollar 2,38 173 — — —
SECUREDFOREIGNLoans — other 1 8,90 1 3 — —
2 254 1 824 2 080 1 821
Current portion (see note 18) (1 582) (365) (1 580) (363)
CARRYING AMOUNT 672 1 459 500 1 458
1 Secured in terms of capitalised finance lease agreements over plant and equipment with a net book value of R2 million (2014: R3 million).
SUMMARY OF REPAYMENTS
R millions Year Local Foreign Total
GROUP2016 1 250 332 1 582
2017 — 1 1
2018 500 171 671
1 750 504 2 254
COMPANY2016 1 250 330 1 580
2018 500 — 500
1 750 330 2 080
149
NOTES TO THE FINANCIAL STATEMENTS FOR THE YEAR ENDED 31 DECEMBER 2015 continued
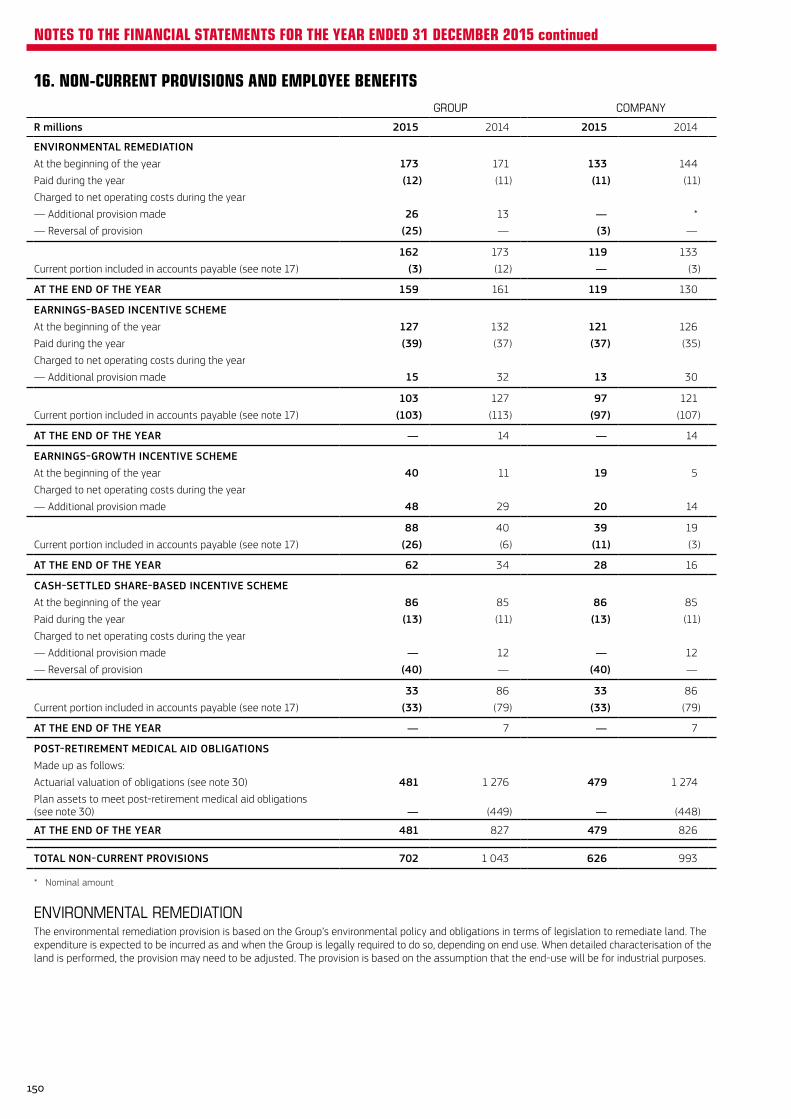
16. NON-CURRENT PROVISIONS AND EMPLOYEE BENEFITSGROUP COMPANY
R millions 2015 2014 2015 2014
ENVIRONMENTAL REMEDIATIONAt the beginning of the year 173 171 133 144
Paid during the year (12) (11) (11) (11)
Charged to net operating costs during the year
— Additional provision made 26 13 — *
— Reversal of provision (25) — (3) —
162 173 119 133
Current portion included in accounts payable (see note 17) (3) (12) — (3)
AT THE END OF THE YEAR 159 161 119 130
EARNINGS-BASED INCENTIVE SCHEMEAt the beginning of the year 127 132 121 126
Paid during the year (39) (37) (37) (35)
Charged to net operating costs during the year
— Additional provision made 15 32 13 30
103 127 97 121
Current portion included in accounts payable (see note 17) (103) (113) (97) (107)
AT THE END OF THE YEAR — 14 — 14
EARNINGS-GROWTH INCENTIVE SCHEMEAt the beginning of the year 40 11 19 5
Charged to net operating costs during the year
— Additional provision made 48 29 20 14
88 40 39 19
Current portion included in accounts payable (see note 17) (26) (6) (11) (3)
AT THE END OF THE YEAR 62 34 28 16
CASH-SETTLED SHARE-BASED INCENTIVE SCHEMEAt the beginning of the year 86 85 86 85
Paid during the year (13) (11) (13) (11)
Charged to net operating costs during the year
— Additional provision made — 12 — 12
— Reversal of provision (40) — (40) —
33 86 33 86
Current portion included in accounts payable (see note 17) (33) (79) (33) (79)
AT THE END OF THE YEAR — 7 — 7
POST-RETIREMENT MEDICAL AID OBLIGATIONSMade up as follows:
Actuarial valuation of obligations (see note 30) 481 1 276 479 1 274
Plan assets to meet post-retirement medical aid obligations (see note 30) — (449) — (448)
AT THE END OF THE YEAR 481 827 479 826
TOTAL NON-CURRENT PROVISIONS 702 1 043 626 993
* Nominal amount
ENVIRONMENTAL REMEDIATIONThe environmental remediation provision is based on the Group’s environmental policy and obligations in terms of legislation to remediate land. The expenditure is expected to be incurred as and when the Group is legally required to do so, depending on end use. When detailed characterisation of the land is performed, the provision may need to be adjusted. The provision is based on the assumption that the end-use will be for industrial purposes.
150
NOTES TO THE FINANCIAL STATEMENTS FOR THE YEAR ENDED 31 DECEMBER 2015 continued
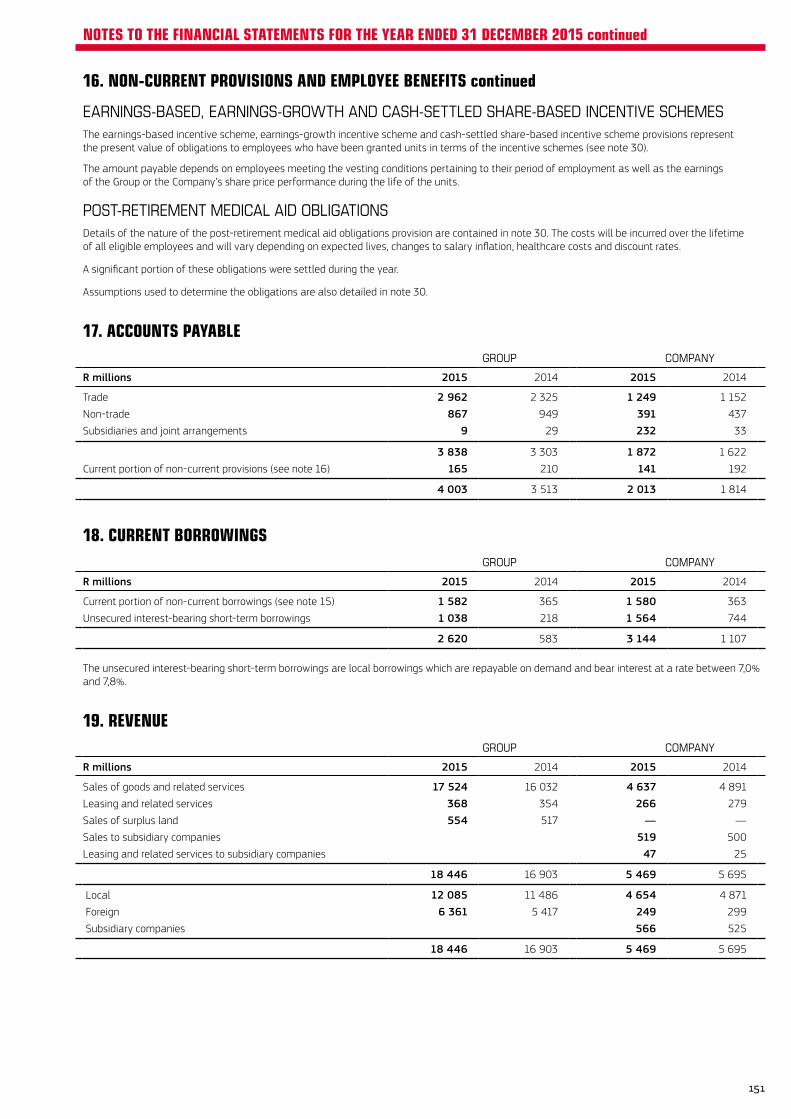
16. NON-CURRENT PROVISIONS AND EMPLOYEE BENEFITS continued
EARNINGS-BASED, EARNINGS-GROWTH AND CASH-SETTLED SHARE-BASED INCENTIVE SCHEMESThe earnings-based incentive scheme, earnings-growth incentive scheme and cash-settled share-based incentive scheme provisions represent the present value of obligations to employees who have been granted units in terms of the incentive schemes (see note 30).
The amount payable depends on employees meeting the vesting conditions pertaining to their period of employment as well as the earnings of the Group or the Company’s share price performance during the life of the units.
POST-RETIREMENT MEDICAL AID OBLIGATIONSDetails of the nature of the post-retirement medical aid obligations provision are contained in note 30. The costs will be incurred over the lifetime of all eligible employees and will vary depending on expected lives, changes to salary inflation, healthcare costs and discount rates.
A significant portion of these obligations were settled during the year.
Assumptions used to determine the obligations are also detailed in note 30.
17. ACCOUNTS PAYABLEGROUP COMPANY
R millions 2015 2014 2015 2014
Trade 2 962 2 325 1 249 1 152
Non-trade 867 949 391 437
Subsidiaries and joint arrangements 9 29 232 33
3 838 3 303 1 872 1 622
Current portion of non-current provisions (see note 16) 165 210 141 192
4 003 3 513 2 013 1 814
18. CURRENT BORROWINGSGROUP COMPANY
R millions 2015 2014 2015 2014
Current portion of non-current borrowings (see note 15) 1 582 365 1 580 363
Unsecured interest-bearing short-term borrowings 1 038 218 1 564 744
2 620 583 3 144 1 107
The unsecured interest-bearing short-term borrowings are local borrowings which are repayable on demand and bear interest at a rate between 7,0% and 7,8%.
19. REVENUEGROUP COMPANY
R millions 2015 2014 2015 2014
Sales of goods and related services 17 524 16 032 4 637 4 891
Leasing and related services 368 354 266 279
Sales of surplus land 554 517 — —
Sales to subsidiary companies 519 500
Leasing and related services to subsidiary companies 47 25
18 446 16 903 5 469 5 695
Local 12 085 11 486 4 654 4 871
Foreign 6 361 5 417 249 299
Subsidiary companies 566 525
18 446 16 903 5 469 5 695
151
NOTES TO THE FINANCIAL STATEMENTS FOR THE YEAR ENDED 31 DECEMBER 2015 continued
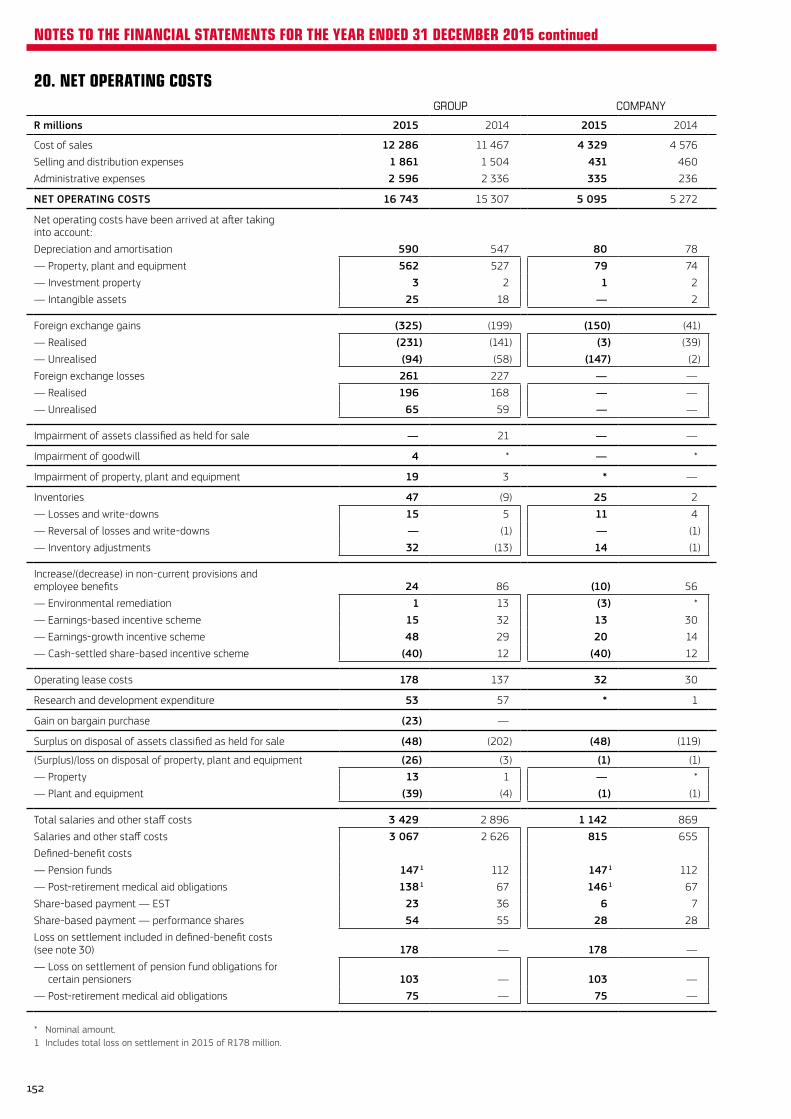
20. NET OPERATING COSTSGROUP COMPANY
R millions 2015 2014 2015 2014
Cost of sales 12 286 11 467 4 329 4 576
Selling and distribution expenses 1 861 1 504 431 460
Administrative expenses 2 596 2 336 335 236
NET OPERATING COSTS 16 743 15 307 5 095 5 272
Net operating costs have been arrived at after taking into account:
Depreciation and amortisation 590 547 80 78
— Property, plant and equipment 562 527 79 74
— Investment property 3 2 1 2
— Intangible assets 25 18 — 2
Foreign exchange gains (325) (199) (150) (41)
— Realised (231) (141) (3) (39)
— Unrealised (94) (58) (147) (2)
Foreign exchange losses 261 227 — —
— Realised 196 168 — —
— Unrealised 65 59 — —
Impairment of assets classified as held for sale — 21 — —
Impairment of goodwill 4 * — *
Impairment of property, plant and equipment 19 3 * —
Inventories 47 (9) 25 2
— Losses and write-downs 15 5 11 4
— Reversal of losses and write-downs — (1) — (1)
— Inventory adjustments 32 (13) 14 (1)
Increase/(decrease) in non-current provisions and employee benefits 24 86 (10) 56
— Environmental remediation 1 13 (3) *
— Earnings-based incentive scheme 15 32 13 30
— Earnings-growth incentive scheme 48 29 20 14
— Cash-settled share-based incentive scheme (40) 12 (40) 12
Operating lease costs 178 137 32 30
Research and development expenditure 53 57 * 1
Gain on bargain purchase (23) —
Surplus on disposal of assets classified as held for sale (48) (202) (48) (119)
(Surplus)/loss on disposal of property, plant and equipment (26) (3) (1) (1)
— Property 13 1 — *
— Plant and equipment (39) (4) (1) (1)
Total salaries and other staff costs 3 429 2 896 1 142 869
Salaries and other staff costs 3 067 2 626 815 655
Defined-benefit costs
— Pension funds 147 1 112 147 1 112
— Post-retirement medical aid obligations 138 1 67 146 1 67
Share-based payment — EST 23 36 6 7
Share-based payment — performance shares 54 55 28 28
Loss on settlement included in defined-benefit costs (see note 30) 178 — 178 —
— Loss on settlement of pension fund obligations for certain pensioners 103 — 103 —
— Post-retirement medical aid obligations 75 — 75 —
* Nominal amount.1 Includes total loss on settlement in 2015 of R178 million.
152
NOTES TO THE FINANCIAL STATEMENTS FOR THE YEAR ENDED 31 DECEMBER 2015 continued
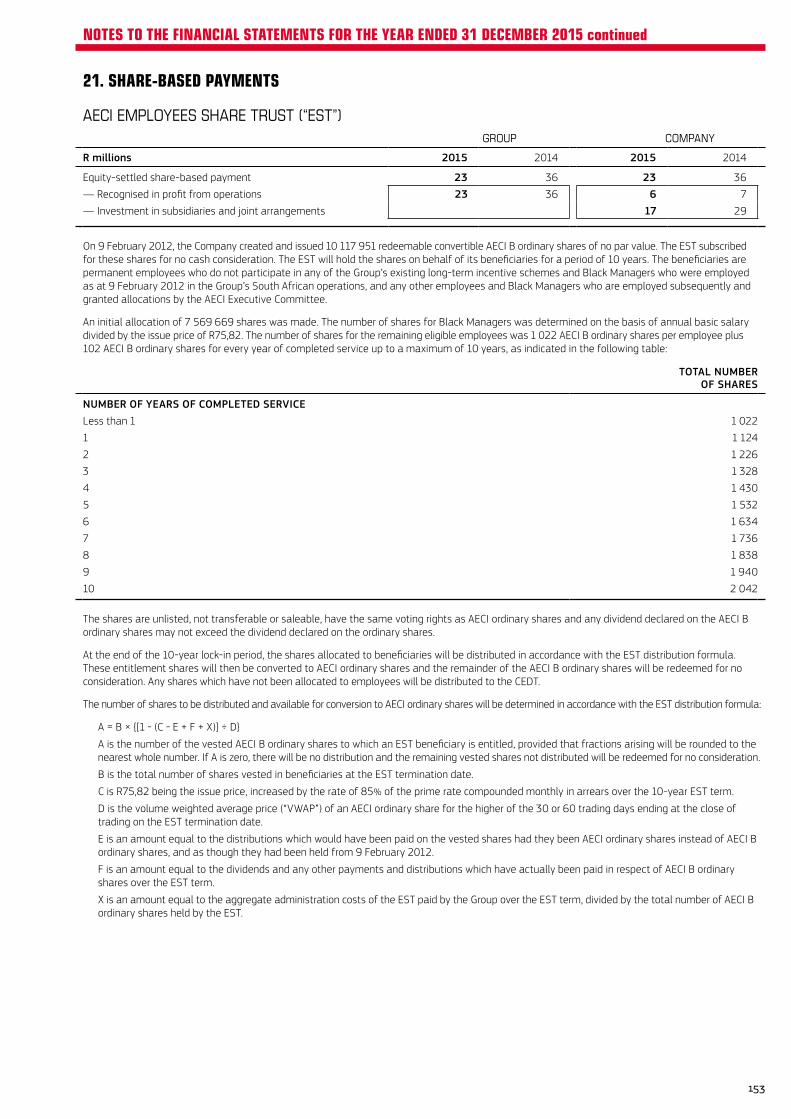
21. SHARE-BASED PAYMENTS
AECI EMPLOYEES SHARE TRUST (“EST”)GROUP COMPANY
R millions 2015 2014 2015 2014
Equity-settled share-based payment 23 36 23 36
— Recognised in profit from operations 23 36 6 7
— Investment in subsidiaries and joint arrangements 17 29
On 9 February 2012, the Company created and issued 10 117 951 redeemable convertible AECI B ordinary shares of no par value. The EST subscribed for these shares for no cash consideration. The EST will hold the shares on behalf of its beneficiaries for a period of 10 years. The beneficiaries are permanent employees who do not participate in any of the Group’s existing long-term incentive schemes and Black Managers who were employed as at 9 February 2012 in the Group’s South African operations, and any other employees and Black Managers who are employed subsequently and granted allocations by the AECI Executive Committee.
An initial allocation of 7 569 669 shares was made. The number of shares for Black Managers was determined on the basis of annual basic salary divided by the issue price of R75,82. The number of shares for the remaining eligible employees was 1 022 AECI B ordinary shares per employee plus 102 AECI B ordinary shares for every year of completed service up to a maximum of 10 years, as indicated in the following table:
TOTAL NUMBER OF SHARES
NUMBER OF YEARS OF COMPLETED SERVICELess than 1 1 022
1 1 124
2 1 226
3 1 328
4 1 430
5 1 532
6 1 634
7 1 736
8 1 838
9 1 940
10 2 042
The shares are unlisted, not transferable or saleable, have the same voting rights as AECI ordinary shares and any dividend declared on the AECI B ordinary shares may not exceed the dividend declared on the ordinary shares.
At the end of the 10-year lock-in period, the shares allocated to beneficiaries will be distributed in accordance with the EST distribution formula. These entitlement shares will then be converted to AECI ordinary shares and the remainder of the AECI B ordinary shares will be redeemed for no consideration. Any shares which have not been allocated to employees will be distributed to the CEDT.
The number of shares to be distributed and available for conversion to AECI ordinary shares will be determined in accordance with the EST distribution formula:
A = B × {[1 - (C - E + F + X)] ÷ D}
A is the number of the vested AECI B ordinary shares to which an EST beneficiary is entitled, provided that fractions arising will be rounded to the nearest whole number. If A is zero, there will be no distribution and the remaining vested shares not distributed will be redeemed for no consideration.
B is the total number of shares vested in beneficiaries at the EST termination date.
C is R75,82 being the issue price, increased by the rate of 85% of the prime rate compounded monthly in arrears over the 10-year EST term.
D is the volume weighted average price (“VWAP”) of an AECI ordinary share for the higher of the 30 or 60 trading days ending at the close of trading on the EST termination date.
E is an amount equal to the distributions which would have been paid on the vested shares had they been AECI ordinary shares instead of AECI B ordinary shares, and as though they had been held from 9 February 2012.
F is an amount equal to the dividends and any other payments and distributions which have actually been paid in respect of AECI B ordinary shares over the EST term.
X is an amount equal to the aggregate administration costs of the EST paid by the Group over the EST term, divided by the total number of AECI B ordinary shares held by the EST.
153
NOTES TO THE FINANCIAL STATEMENTS FOR THE YEAR ENDED 31 DECEMBER 2015 continued
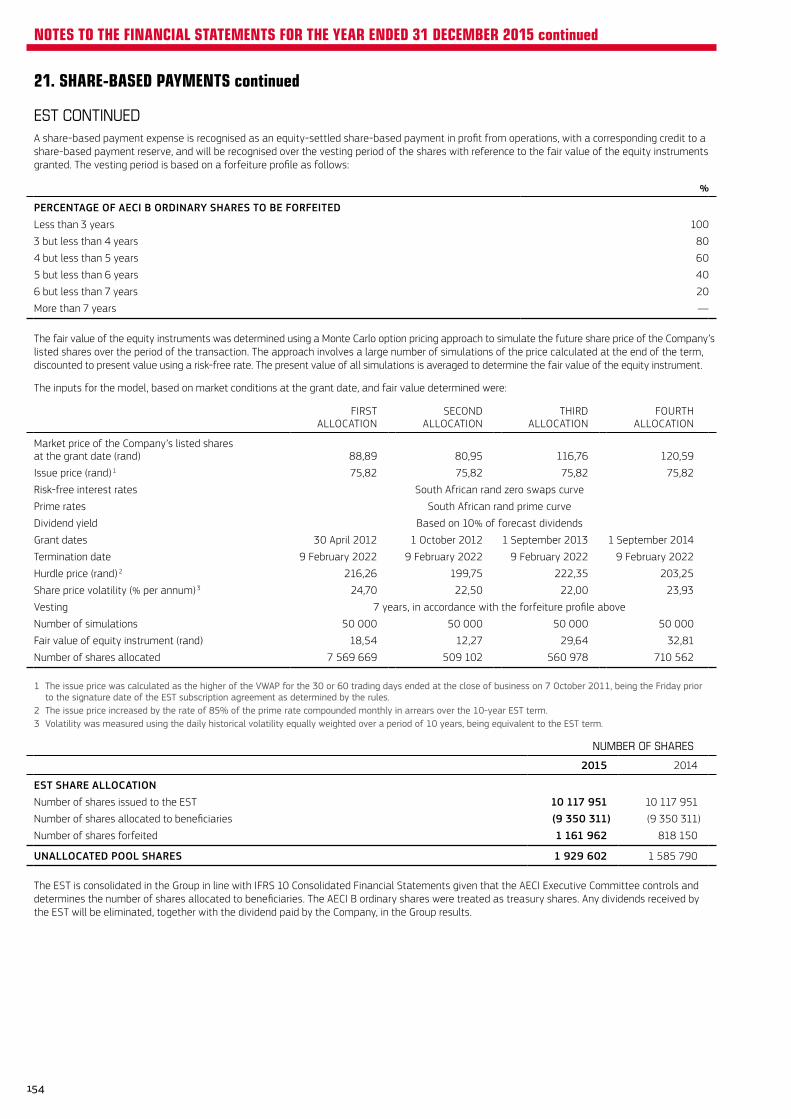
21. SHARE-BASED PAYMENTS continued
EST CONTINUEDA share-based payment expense is recognised as an equity-settled share-based payment in profit from operations, with a corresponding credit to a share-based payment reserve, and will be recognised over the vesting period of the shares with reference to the fair value of the equity instruments granted. The vesting period is based on a forfeiture profile as follows:
%
PERCENTAGE OF AECI B ORDINARY SHARES TO BE FORFEITEDLess than 3 years 100
3 but less than 4 years 80
4 but less than 5 years 60
5 but less than 6 years 40
6 but less than 7 years 20
More than 7 years —
The fair value of the equity instruments was determined using a Monte Carlo option pricing approach to simulate the future share price of the Company’s listed shares over the period of the transaction. The approach involves a large number of simulations of the price calculated at the end of the term, discounted to present value using a risk-free rate. The present value of all simulations is averaged to determine the fair value of the equity instrument.
The inputs for the model, based on market conditions at the grant date, and fair value determined were:
FIRSTALLOCATION
SECONDALLOCATION
THIRDALLOCATION
FOURTHALLOCATION
Market price of the Company’s listed shares at the grant date (rand) 88,89 80,95 116,76 120,59
Issue price (rand) 1 75,82 75,82 75,82 75,82
Risk-free interest rates South African rand zero swaps curve
Prime rates South African rand prime curve
Dividend yield Based on 10% of forecast dividends
Grant dates 30 April 2012 1 October 2012 1 September 2013 1 September 2014
Termination date 9 February 2022 9 February 2022 9 February 2022 9 February 2022
Hurdle price (rand) 2 216,26 199,75 222,35 203,25
Share price volatility (% per annum) 3 24,70 22,50 22,00 23,93
Vesting 7 years, in accordance with the forfeiture profile above
Number of simulations 50 000 50 000 50 000 50 000
Fair value of equity instrument (rand) 18,54 12,27 29,64 32,81
Number of shares allocated 7 569 669 509 102 560 978 710 562
1 The issue price was calculated as the higher of the VWAP for the 30 or 60 trading days ended at the close of business on 7 October 2011, being the Friday prior to the signature date of the EST subscription agreement as determined by the rules.
2 The issue price increased by the rate of 85% of the prime rate compounded monthly in arrears over the 10-year EST term.3 Volatility was measured using the daily historical volatility equally weighted over a period of 10 years, being equivalent to the EST term.
NUMBER OF SHARES
2015 2014
EST SHARE ALLOCATION Number of shares issued to the EST 10 117 951 10 117 951
Number of shares allocated to beneficiaries (9 350 311) (9 350 311)
Number of shares forfeited 1 161 962 818 150
UNALLOCATED POOL SHARES 1 929 602 1 585 790
The EST is consolidated in the Group in line with IFRS 10 Consolidated Financial Statements given that the AECI Executive Committee controls and determines the number of shares allocated to beneficiaries. The AECI B ordinary shares were treated as treasury shares. Any dividends received by the EST will be eliminated, together with the dividend paid by the Company, in the Group results.
154
NOTES TO THE FINANCIAL STATEMENTS FOR THE YEAR ENDED 31 DECEMBER 2015 continued
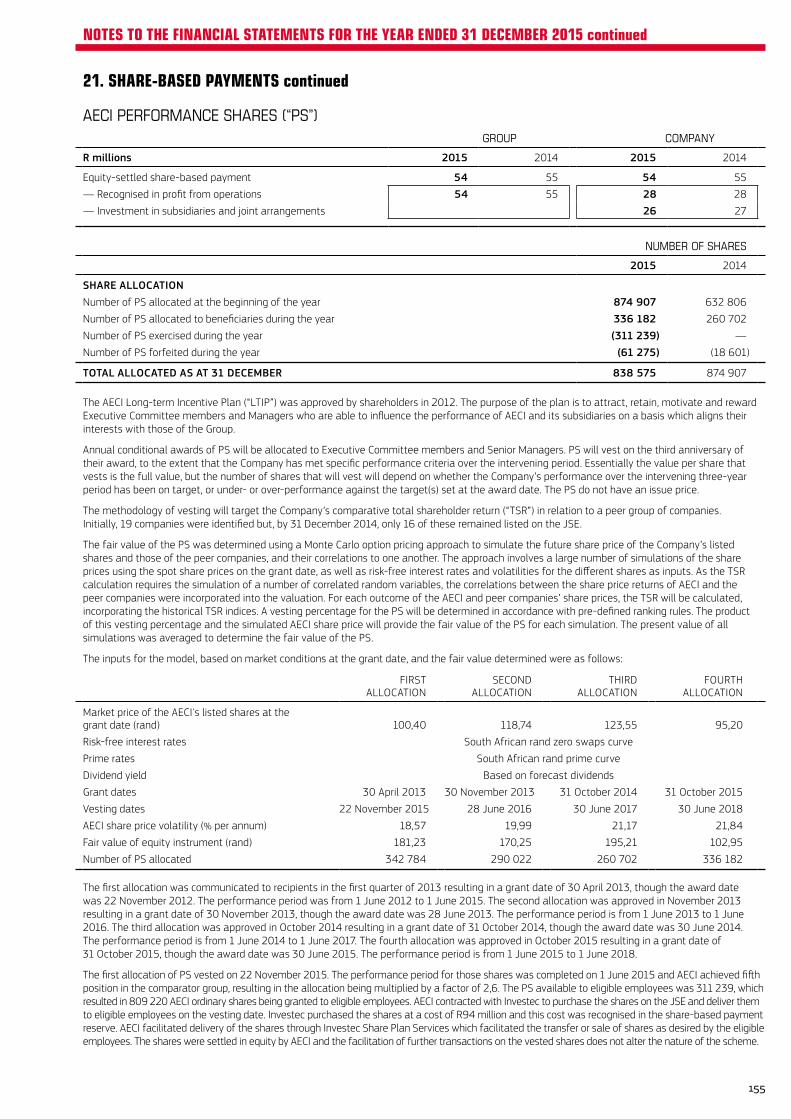
21. SHARE-BASED PAYMENTS continued
AECI PERFORMANCE SHARES (“PS”)GROUP COMPANY
R millions 2015 2014 2015 2014
Equity-settled share-based payment 54 55 54 55
— Recognised in profit from operations 54 55 28 28
— Investment in subsidiaries and joint arrangements 26 27
NUMBER OF SHARES
2015 2014
SHARE ALLOCATIONNumber of PS allocated at the beginning of the year 874 907 632 806
Number of PS allocated to beneficiaries during the year 336 182 260 702
Number of PS exercised during the year (311 239) —
Number of PS forfeited during the year (61 275) (18 601)
TOTAL ALLOCATED AS AT 31 DECEMBER 838 575 874 907
The AECI Long-term Incentive Plan (“LTIP”) was approved by shareholders in 2012. The purpose of the plan is to attract, retain, motivate and reward Executive Committee members and Managers who are able to influence the performance of AECI and its subsidiaries on a basis which aligns their interests with those of the Group.
Annual conditional awards of PS will be allocated to Executive Committee members and Senior Managers. PS will vest on the third anniversary of their award, to the extent that the Company has met specific performance criteria over the intervening period. Essentially the value per share that vests is the full value, but the number of shares that will vest will depend on whether the Company’s performance over the intervening three-year period has been on target, or under- or over-performance against the target(s) set at the award date. The PS do not have an issue price.
The methodology of vesting will target the Company’s comparative total shareholder return (“TSR”) in relation to a peer group of companies. Initially, 19 companies were identified but, by 31 December 2014, only 16 of these remained listed on the JSE.
The fair value of the PS was determined using a Monte Carlo option pricing approach to simulate the future share price of the Company’s listed shares and those of the peer companies, and their correlations to one another. The approach involves a large number of simulations of the share prices using the spot share prices on the grant date, as well as risk-free interest rates and volatilities for the different shares as inputs. As the TSR calculation requires the simulation of a number of correlated random variables, the correlations between the share price returns of AECI and the peer companies were incorporated into the valuation. For each outcome of the AECI and peer companies’ share prices, the TSR will be calculated, incorporating the historical TSR indices. A vesting percentage for the PS will be determined in accordance with pre-defined ranking rules. The product of this vesting percentage and the simulated AECI share price will provide the fair value of the PS for each simulation. The present value of all simulations was averaged to determine the fair value of the PS.
The inputs for the model, based on market conditions at the grant date, and the fair value determined were as follows:
FIRSTALLOCATION
SECONDALLOCATION
THIRDALLOCATION
FOURTHALLOCATION
Market price of the AECI's listed shares at the grant date (rand) 100,40 118,74 123,55 95,20
Risk-free interest rates South African rand zero swaps curve
Prime rates South African rand prime curve
Dividend yield Based on forecast dividends
Grant dates 30 April 2013 30 November 2013 31 October 2014 31 October 2015
Vesting dates 22 November 2015 28 June 2016 30 June 2017 30 June 2018
AECI share price volatility (% per annum) 18,57 19,99 21,17 21,84
Fair value of equity instrument (rand) 181,23 170,25 195,21 102,95
Number of PS allocated 342 784 290 022 260 702 336 182
The first allocation was communicated to recipients in the first quarter of 2013 resulting in a grant date of 30 April 2013, though the award date was 22 November 2012. The performance period was from 1 June 2012 to 1 June 2015. The second allocation was approved in November 2013 resulting in a grant date of 30 November 2013, though the award date was 28 June 2013. The performance period is from 1 June 2013 to 1 June 2016. The third allocation was approved in October 2014 resulting in a grant date of 31 October 2014, though the award date was 30 June 2014. The performance period is from 1 June 2014 to 1 June 2017. The fourth allocation was approved in October 2015 resulting in a grant date of 31 October 2015, though the award date was 30 June 2015. The performance period is from 1 June 2015 to 1 June 2018.
The first allocation of PS vested on 22 November 2015. The performance period for those shares was completed on 1 June 2015 and AECI achieved fifth position in the comparator group, resulting in the allocation being multiplied by a factor of 2,6. The PS available to eligible employees was 311 239, which resulted in 809 220 AECI ordinary shares being granted to eligible employees. AECI contracted with Investec to purchase the shares on the JSE and deliver them to eligible employees on the vesting date. Investec purchased the shares at a cost of R94 million and this cost was recognised in the share-based payment reserve. AECI facilitated delivery of the shares through Investec Share Plan Services which facilitated the transfer or sale of shares as desired by the eligible employees. The shares were settled in equity by AECI and the facilitation of further transactions on the vested shares does not alter the nature of the scheme.
155
NOTES TO THE FINANCIAL STATEMENTS FOR THE YEAR ENDED 31 DECEMBER 2015 continued
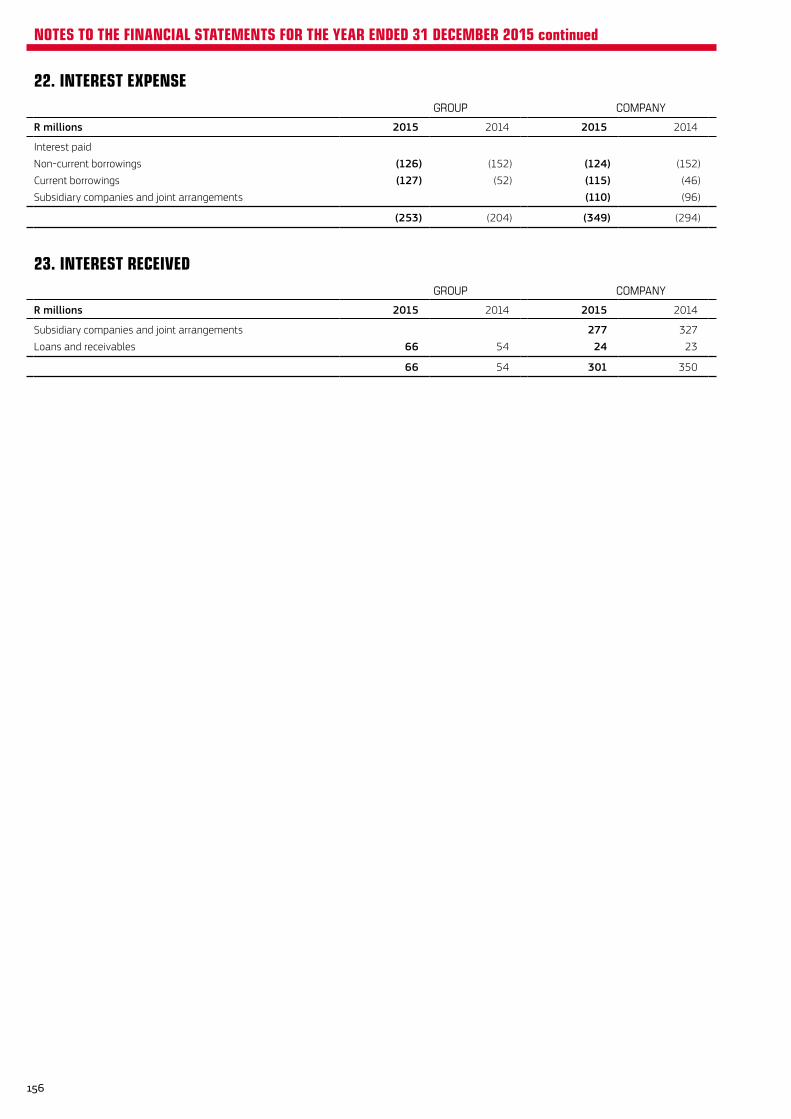
22. INTEREST EXPENSEGROUP COMPANY
R millions 2015 2014 2015 2014
Interest paid
Non-current borrowings (126) (152) (124) (152)
Current borrowings (127) (52) (115) (46)
Subsidiary companies and joint arrangements (110) (96)
(253) (204) (349) (294)
23. INTEREST RECEIVEDGROUP COMPANY
R millions 2015 2014 2015 2014
Subsidiary companies and joint arrangements 277 327
Loans and receivables 66 54 24 23
66 54 301 350
156
NOTES TO THE FINANCIAL STATEMENTS FOR THE YEAR ENDED 31 DECEMBER 2015 continued
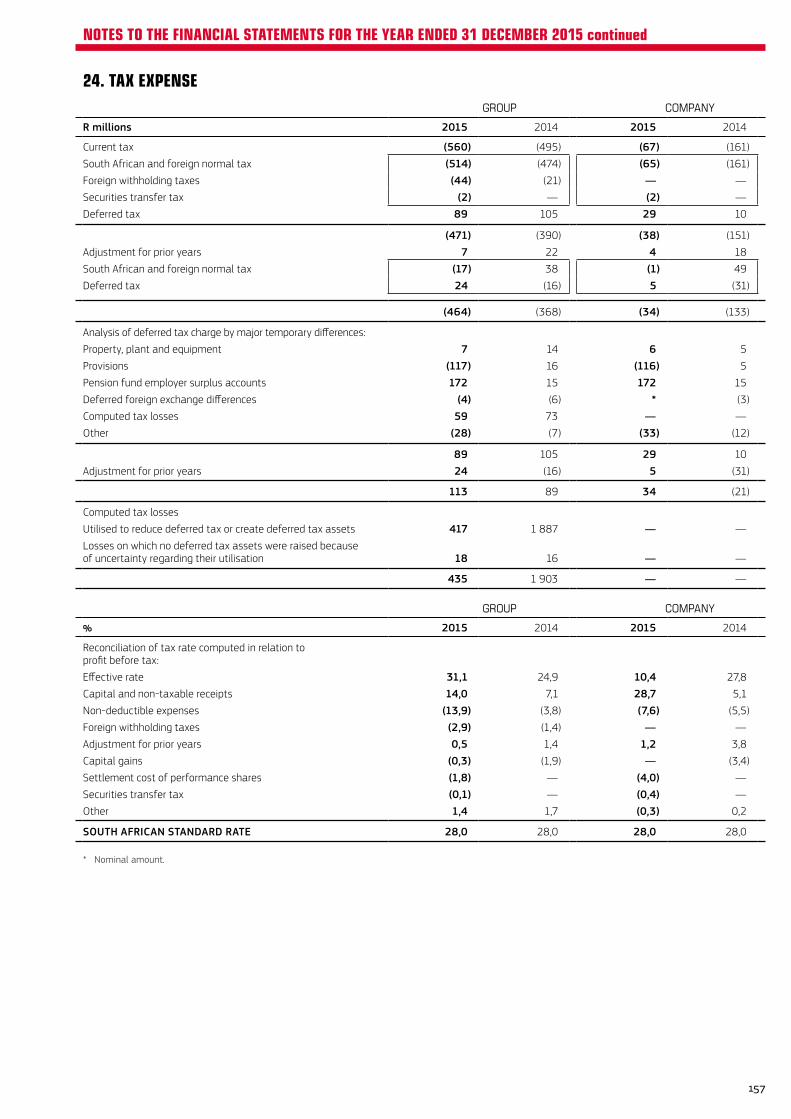
24. TAX EXPENSEGROUP COMPANY
R millions 2015 2014 2015 2014
Current tax (560) (495) (67) (161)
South African and foreign normal tax (514) (474) (65) (161)
Foreign withholding taxes (44) (21) — —
Securities transfer tax (2) — (2) —
Deferred tax 89 105 29 10
(471) (390) (38) (151)
Adjustment for prior years 7 22 4 18
South African and foreign normal tax (17) 38 (1) 49
Deferred tax 24 (16) 5 (31)
(464) (368) (34) (133)
Analysis of deferred tax charge by major temporary differences:
Property, plant and equipment 7 14 6 5
Provisions (117) 16 (116) 5
Pension fund employer surplus accounts 172 15 172 15
Deferred foreign exchange differences (4) (6) * (3)
Computed tax losses 59 73 — —
Other (28) (7) (33) (12)
89 105 29 10
Adjustment for prior years 24 (16) 5 (31)
113 89 34 (21)
Computed tax losses
Utilised to reduce deferred tax or create deferred tax assets 417 1 887 — —
Losses on which no deferred tax assets were raised because of uncertainty regarding their utilisation 18 16 — —
435 1 903 — —
GROUP COMPANY
% 2015 2014 2015 2014
Reconciliation of tax rate computed in relation to profit before tax:
Effective rate 31,1 24,9 10,4 27,8
Capital and non-taxable receipts 14,0 7,1 28,7 5,1
Non-deductible expenses (13,9) (3,8) (7,6) (5,5)
Foreign withholding taxes (2,9) (1,4) — —
Adjustment for prior years 0,5 1,4 1,2 3,8
Capital gains (0,3) (1,9) — (3,4)
Settlement cost of performance shares (1,8) — (4,0) —
Securities transfer tax (0,1) — (0,4) —
Other 1,4 1,7 (0,3) 0,2
SOUTH AFRICAN STANDARD RATE 28,0 28,0 28,0 28,0
* Nominal amount.
157
NOTES TO THE FINANCIAL STATEMENTS FOR THE YEAR ENDED 31 DECEMBER 2015 continued
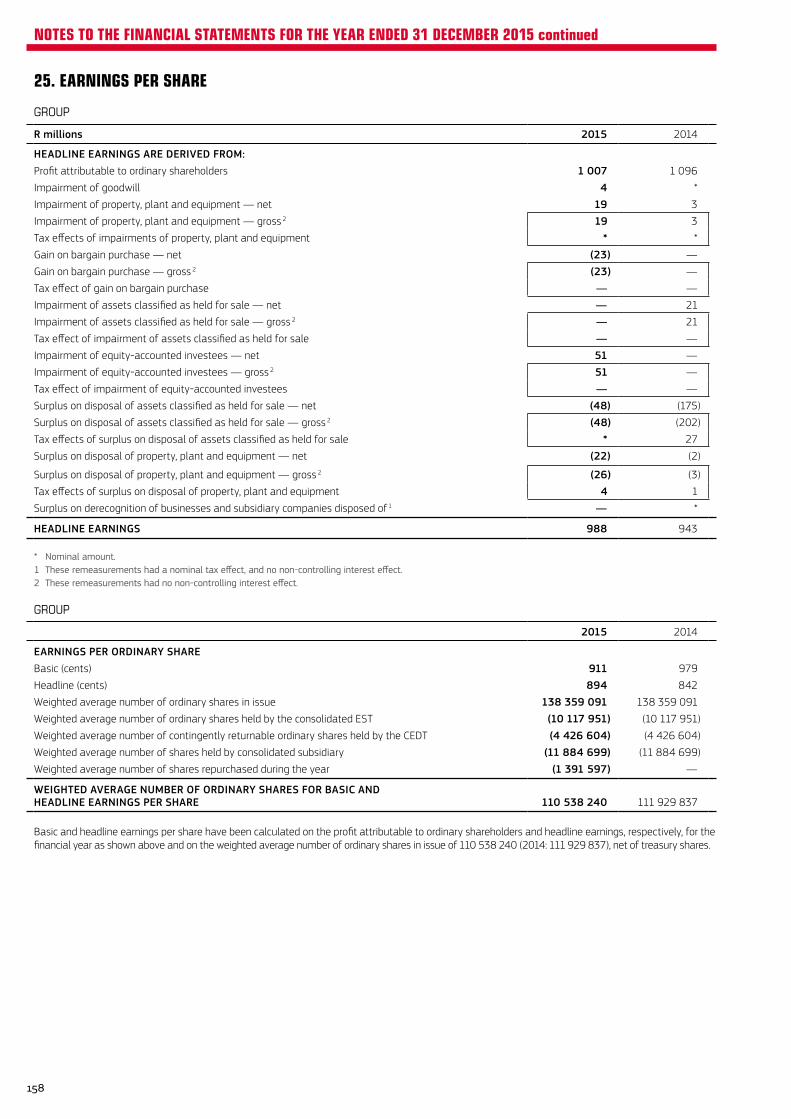
25. EARNINGS PER SHARE
GROUP
R millions 2015 2014
HEADLINE EARNINGS ARE DERIVED FROM:Profit attributable to ordinary shareholders 1 007 1 096
Impairment of goodwill 4 *
Impairment of property, plant and equipment — net 19 3
Impairment of property, plant and equipment — gross 2 19 3
Tax effects of impairments of property, plant and equipment * *
Gain on bargain purchase — net (23) —
Gain on bargain purchase — gross 2 (23) —
Tax effect of gain on bargain purchase — —
Impairment of assets classified as held for sale — net — 21
Impairment of assets classified as held for sale — gross 2 — 21
Tax effect of impairment of assets classified as held for sale — —
Impairment of equity-accounted investees — net 51 —
Impairment of equity-accounted investees — gross 2 51 —
Tax effect of impairment of equity-accounted investees — —
Surplus on disposal of assets classified as held for sale — net (48) (175)
Surplus on disposal of assets classified as held for sale — gross 2 (48) (202)
Tax effects of surplus on disposal of assets classified as held for sale * 27
Surplus on disposal of property, plant and equipment — net (22) (2)
Surplus on disposal of property, plant and equipment — gross 2 (26) (3)
Tax effects of surplus on disposal of property, plant and equipment 4 1
Surplus on derecognition of businesses and subsidiary companies disposed of 1 — *
HEADLINE EARNINGS 988 943
* Nominal amount.1 These remeasurements had a nominal tax effect, and no non-controlling interest effect.2 These remeasurements had no non-controlling interest effect.
GROUP
2015 2014
EARNINGS PER ORDINARY SHAREBasic (cents) 911 979
Headline (cents) 894 842
Weighted average number of ordinary shares in issue 138 359 091 138 359 091
Weighted average number of ordinary shares held by the consolidated EST (10 117 951) (10 117 951)
Weighted average number of contingently returnable ordinary shares held by the CEDT (4 426 604) (4 426 604)
Weighted average number of shares held by consolidated subsidiary (11 884 699) (11 884 699)
Weighted average number of shares repurchased during the year (1 391 597) —
WEIGHTED AVERAGE NUMBER OF ORDINARY SHARES FOR BASIC AND HEADLINE EARNINGS PER SHARE 110 538 240 111 929 837
Basic and headline earnings per share have been calculated on the profit attributable to ordinary shareholders and headline earnings, respectively, for the financial year as shown above and on the weighted average number of ordinary shares in issue of 110 538 240 (2014: 111 929 837), net of treasury shares.
158
NOTES TO THE FINANCIAL STATEMENTS FOR THE YEAR ENDED 31 DECEMBER 2015 continued
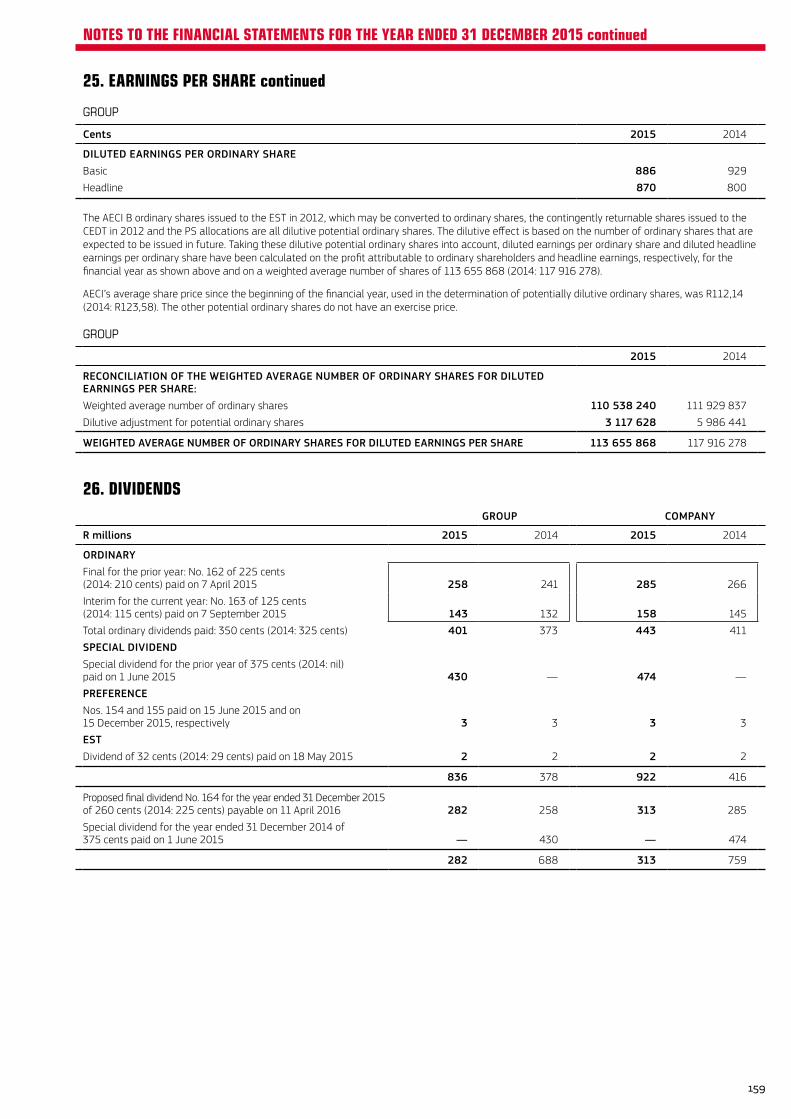
25. EARNINGS PER SHARE continued
GROUP
Cents 2015 2014
DILUTED EARNINGS PER ORDINARY SHAREBasic 886 929
Headline 870 800
The AECI B ordinary shares issued to the EST in 2012, which may be converted to ordinary shares, the contingently returnable shares issued to the CEDT in 2012 and the PS allocations are all dilutive potential ordinary shares. The dilutive effect is based on the number of ordinary shares that are expected to be issued in future. Taking these dilutive potential ordinary shares into account, diluted earnings per ordinary share and diluted headline earnings per ordinary share have been calculated on the profit attributable to ordinary shareholders and headline earnings, respectively, for the financial year as shown above and on a weighted average number of shares of 113 655 868 (2014: 117 916 278).
AECI’s average share price since the beginning of the financial year, used in the determination of potentially dilutive ordinary shares, was R112,14 (2014: R123,58). The other potential ordinary shares do not have an exercise price.
GROUP
2015 2014
RECONCILIATION OF THE WEIGHTED AVERAGE NUMBER OF ORDINARY SHARES FOR DILUTED EARNINGS PER SHARE:Weighted average number of ordinary shares 110 538 240 111 929 837
Dilutive adjustment for potential ordinary shares 3 117 628 5 986 441
WEIGHTED AVERAGE NUMBER OF ORDINARY SHARES FOR DILUTED EARNINGS PER SHARE 113 655 868 117 916 278
26. DIVIDENDSGROUP COMPANY
R millions 2015 2014 2015 2014
ORDINARYFinal for the prior year: No. 162 of 225 cents (2014: 210 cents) paid on 7 April 2015 258 241 285 266
Interim for the current year: No. 163 of 125 cents (2014: 115 cents) paid on 7 September 2015 143 132 158 145
Total ordinary dividends paid: 350 cents (2014: 325 cents) 401 373 443 411
SPECIAL DIVIDENDSpecial dividend for the prior year of 375 cents (2014: nil) paid on 1 June 2015 430 — 474 —
PREFERENCENos. 154 and 155 paid on 15 June 2015 and on 15 December 2015, respectively 3 3 3 3
ESTDividend of 32 cents (2014: 29 cents) paid on 18 May 2015 2 2 2 2
836 378 922 416
Proposed final dividend No. 164 for the year ended 31 December 2015 of 260 cents (2014: 225 cents) payable on 11 April 2016 282 258 313 285
Special dividend for the year ended 31 December 2014 of 375 cents paid on 1 June 2015 — 430 — 474
282 688 313 759
159
NOTES TO THE FINANCIAL STATEMENTS FOR THE YEAR ENDED 31 DECEMBER 2015 continued
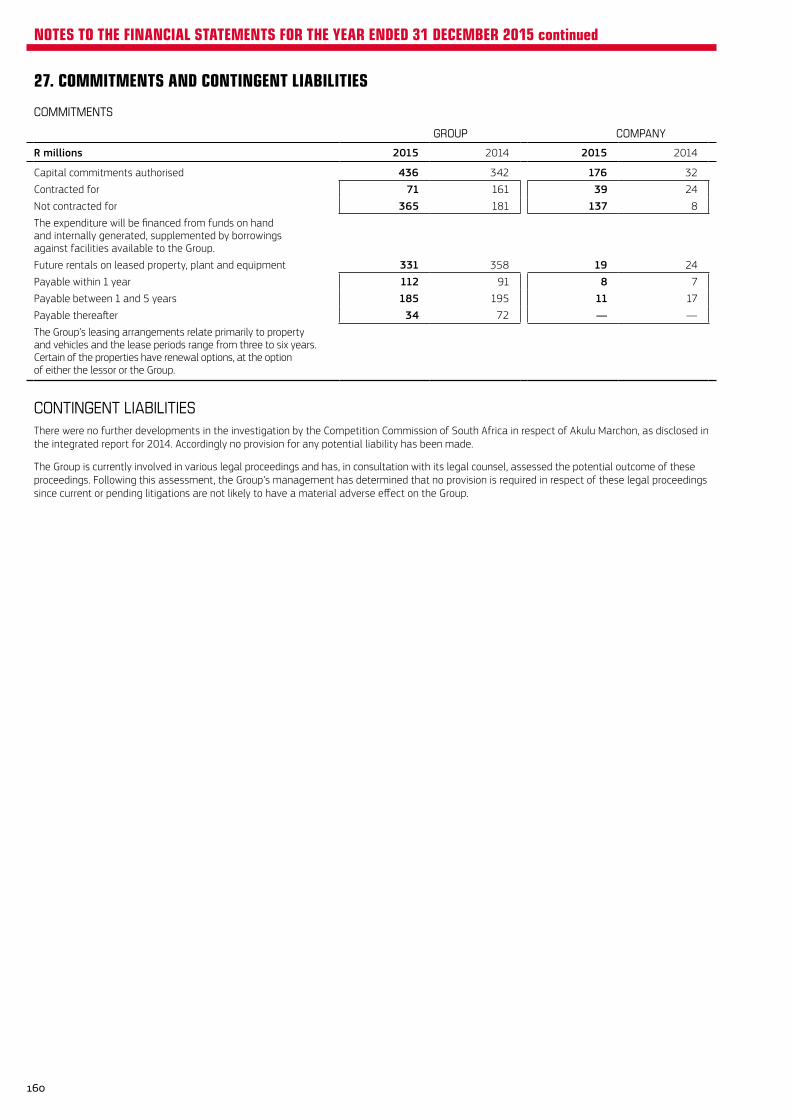
27. COMMITMENTS AND CONTINGENT LIABILITIES
COMMITMENTS
GROUP COMPANY
R millions 2015 2014 2015 2014
Capital commitments authorised 436 342 176 32
Contracted for 71 161 39 24
Not contracted for 365 181 137 8
The expenditure will be financed from funds on hand and internally generated, supplemented by borrowings against facilities available to the Group.
Future rentals on leased property, plant and equipment 331 358 19 24
Payable within 1 year 112 91 8 7
Payable between 1 and 5 years 185 195 11 17
Payable thereafter 34 72 — —
The Group’s leasing arrangements relate primarily to property and vehicles and the lease periods range from three to six years. Certain of the properties have renewal options, at the option of either the lessor or the Group.
CONTINGENT LIABILITIESThere were no further developments in the investigation by the Competition Commission of South Africa in respect of Akulu Marchon, as disclosed in the integrated report for 2014. Accordingly no provision for any potential liability has been made.
The Group is currently involved in various legal proceedings and has, in consultation with its legal counsel, assessed the potential outcome of these proceedings. Following this assessment, the Group’s management has determined that no provision is required in respect of these legal proceedings since current or pending litigations are not likely to have a material adverse effect on the Group.
160
NOTES TO THE FINANCIAL STATEMENTS FOR THE YEAR ENDED 31 DECEMBER 2015 continued
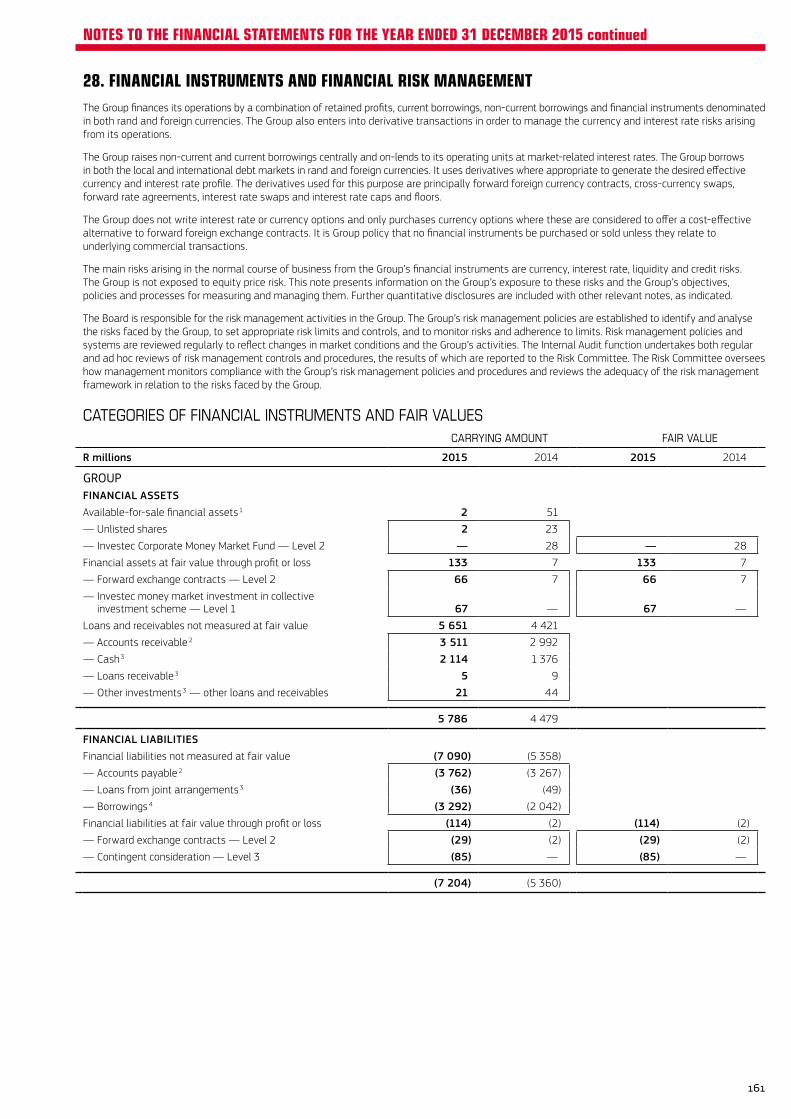
28. FINANCIAL INSTRUMENTS AND FINANCIAL RISK MANAGEMENTThe Group finances its operations by a combination of retained profits, current borrowings, non-current borrowings and financial instruments denominated in both rand and foreign currencies. The Group also enters into derivative transactions in order to manage the currency and interest rate risks arising from its operations.
The Group raises non-current and current borrowings centrally and on-lends to its operating units at market-related interest rates. The Group borrows in both the local and international debt markets in rand and foreign currencies. It uses derivatives where appropriate to generate the desired effective currency and interest rate profile. The derivatives used for this purpose are principally forward foreign currency contracts, cross-currency swaps, forward rate agreements, interest rate swaps and interest rate caps and floors.
The Group does not write interest rate or currency options and only purchases currency options where these are considered to offer a cost-effective alternative to forward foreign exchange contracts. It is Group policy that no financial instruments be purchased or sold unless they relate to underlying commercial transactions.
The main risks arising in the normal course of business from the Group’s financial instruments are currency, interest rate, liquidity and credit risks. The Group is not exposed to equity price risk. This note presents information on the Group’s exposure to these risks and the Group’s objectives, policies and processes for measuring and managing them. Further quantitative disclosures are included with other relevant notes, as indicated.
The Board is responsible for the risk management activities in the Group. The Group’s risk management policies are established to identify and analyse the risks faced by the Group, to set appropriate risk limits and controls, and to monitor risks and adherence to limits. Risk management policies and systems are reviewed regularly to reflect changes in market conditions and the Group’s activities. The Internal Audit function undertakes both regular and ad hoc reviews of risk management controls and procedures, the results of which are reported to the Risk Committee. The Risk Committee oversees how management monitors compliance with the Group’s risk management policies and procedures and reviews the adequacy of the risk management framework in relation to the risks faced by the Group.
CATEGORIES OF FINANCIAL INSTRUMENTS AND FAIR VALUESCARRYING AMOUNT FAIR VALUE
R millions 2015 2014 2015 2014
GROUPFINANCIAL ASSETSAvailable-for-sale financial assets 1 2 51
— Unlisted shares 2 23
— Investec Corporate Money Market Fund — Level 2 — 28 — 28
Financial assets at fair value through profit or loss 133 7 133 7
— Forward exchange contracts — Level 2 66 7 66 7
— Investec money market investment in collective investment scheme — Level 1 67 — 67 —
Loans and receivables not measured at fair value 5 651 4 421
— Accounts receivable 2 3 511 2 992
— Cash 3 2 114 1 376
— Loans receivable 3 5 9
— Other investments 3 — other loans and receivables 21 44
5 786 4 479
FINANCIAL LIABILITIESFinancial liabilities not measured at fair value (7 090) (5 358)
— Accounts payable 2 (3 762) (3 267)
— Loans from joint arrangements 3 (36) (49)
— Borrowings 4 (3 292) (2 042)
Financial liabilities at fair value through profit or loss (114) (2) (114) (2)
— Forward exchange contracts — Level 2 (29) (2) (29) (2)
— Contingent consideration — Level 3 (85) — (85) —
(7 204) (5 360)
161
NOTES TO THE FINANCIAL STATEMENTS FOR THE YEAR ENDED 31 DECEMBER 2015 continued
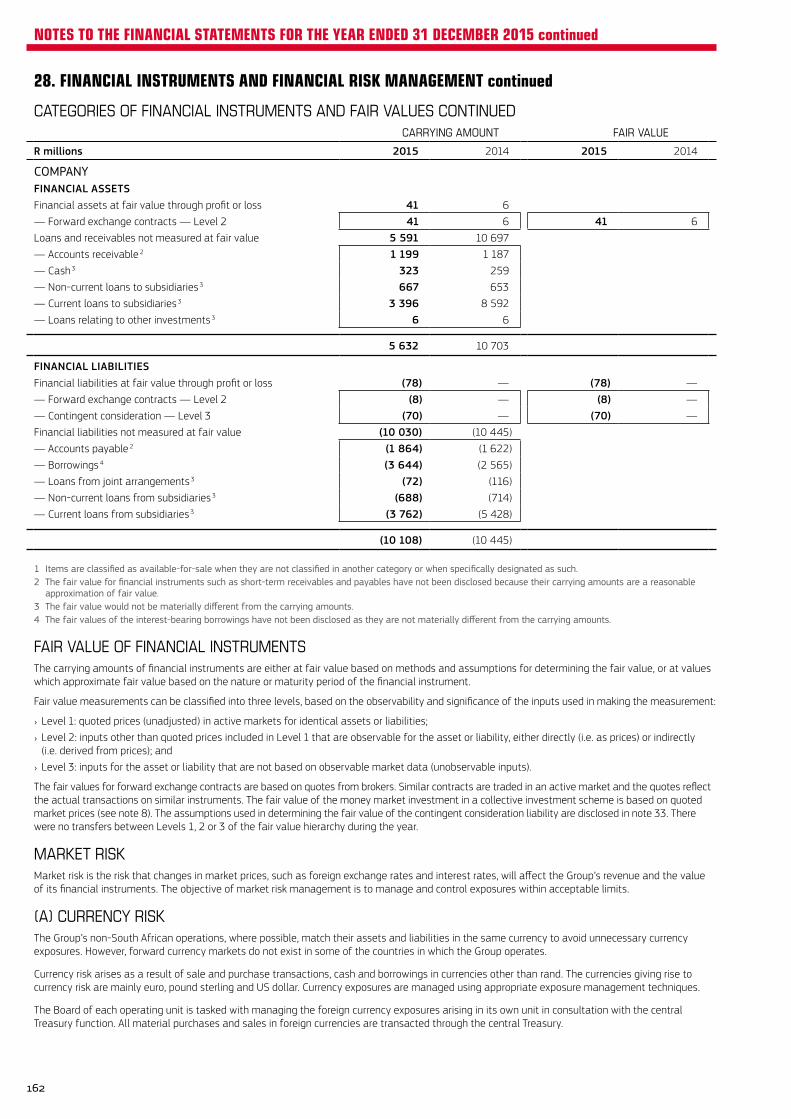
28. FINANCIAL INSTRUMENTS AND FINANCIAL RISK MANAGEMENT continued
CATEGORIES OF FINANCIAL INSTRUMENTS AND FAIR VALUES CONTINUEDCARRYING AMOUNT FAIR VALUE
R millions 2015 2014 2015 2014
COMPANYFINANCIAL ASSETSFinancial assets at fair value through profit or loss 41 6
— Forward exchange contracts — Level 2 41 6 41 6
Loans and receivables not measured at fair value 5 591 10 697
— Accounts receivable 2 1 199 1 187
— Cash 3 323 259
— Non-current loans to subsidiaries 3 667 653
— Current loans to subsidiaries 3 3 396 8 592
— Loans relating to other investments 3 6 6
5 632 10 703
FINANCIAL LIABILITIESFinancial liabilities at fair value through profit or loss (78) — (78) —
— Forward exchange contracts — Level 2 (8) — (8) —
— Contingent consideration — Level 3 (70) — (70) —
Financial liabilities not measured at fair value (10 030) (10 445)
— Accounts payable 2 (1 864) (1 622)
— Borrowings 4 (3 644) (2 565)
— Loans from joint arrangements 3 (72) (116)
— Non-current loans from subsidiaries 3 (688) (714)
— Current loans from subsidiaries 3 (3 762) (5 428)
(10 108) (10 445)
1 Items are classified as available-for-sale when they are not classified in another category or when specifically designated as such.2 The fair value for financial instruments such as short-term receivables and payables have not been disclosed because their carrying amounts are a reasonable
approximation of fair value.3 The fair value would not be materially different from the carrying amounts.4 The fair values of the interest-bearing borrowings have not been disclosed as they are not materially different from the carrying amounts.
FAIR VALUE OF FINANCIAL INSTRUMENTSThe carrying amounts of financial instruments are either at fair value based on methods and assumptions for determining the fair value, or at values which approximate fair value based on the nature or maturity period of the financial instrument.
Fair value measurements can be classified into three levels, based on the observability and significance of the inputs used in making the measurement:
› Level 1: quoted prices (unadjusted) in active markets for identical assets or liabilities; › Level 2: inputs other than quoted prices included in Level 1 that are observable for the asset or liability, either directly (i.e. as prices) or indirectly (i.e. derived from prices); and
› Level 3: inputs for the asset or liability that are not based on observable market data (unobservable inputs).
The fair values for forward exchange contracts are based on quotes from brokers. Similar contracts are traded in an active market and the quotes reflect the actual transactions on similar instruments. The fair value of the money market investment in a collective investment scheme is based on quoted market prices (see note 8). The assumptions used in determining the fair value of the contingent consideration liability are disclosed in note 33. There were no transfers between Levels 1, 2 or 3 of the fair value hierarchy during the year.
MARKET RISKMarket risk is the risk that changes in market prices, such as foreign exchange rates and interest rates, will affect the Group’s revenue and the value of its financial instruments. The objective of market risk management is to manage and control exposures within acceptable limits.
(A) CURRENCY RISKThe Group’s non-South African operations, where possible, match their assets and liabilities in the same currency to avoid unnecessary currency exposures. However, forward currency markets do not exist in some of the countries in which the Group operates.
Currency risk arises as a result of sale and purchase transactions, cash and borrowings in currencies other than rand. The currencies giving rise to currency risk are mainly euro, pound sterling and US dollar. Currency exposures are managed using appropriate exposure management techniques.
The Board of each operating unit is tasked with managing the foreign currency exposures arising in its own unit in consultation with the central Treasury function. All material purchases and sales in foreign currencies are transacted through the central Treasury.
162
NOTES TO THE FINANCIAL STATEMENTS FOR THE YEAR ENDED 31 DECEMBER 2015 continued
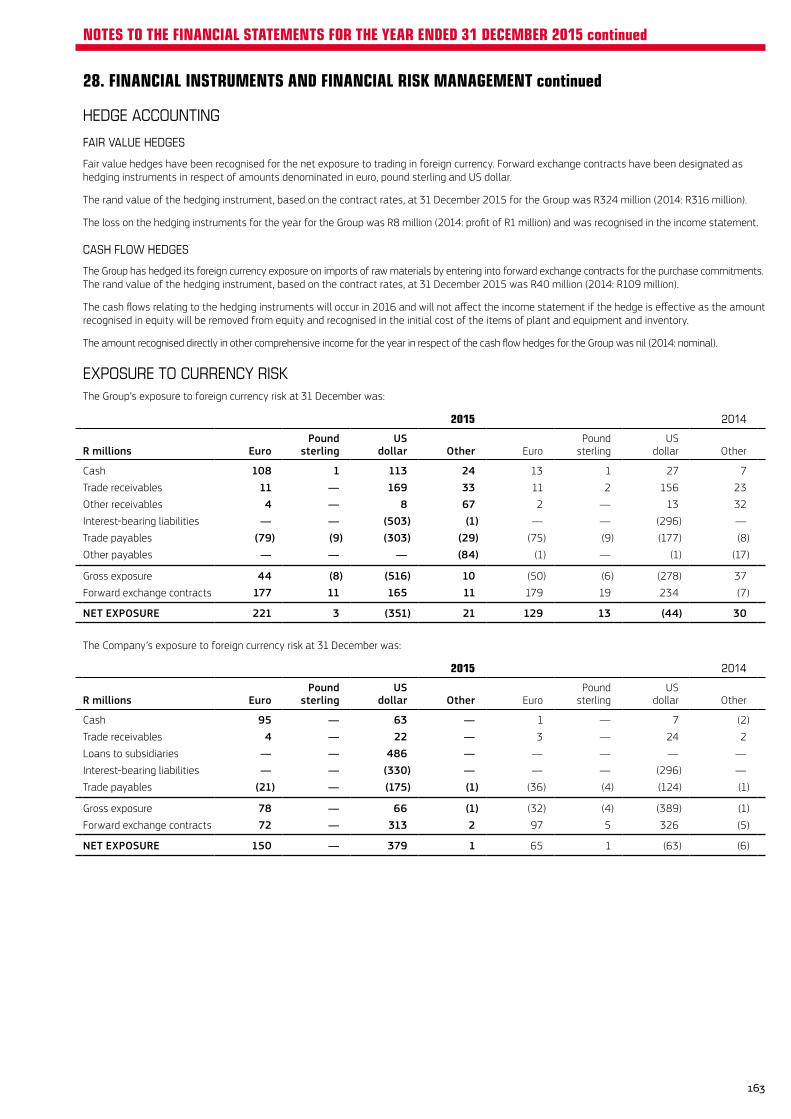
28. FINANCIAL INSTRUMENTS AND FINANCIAL RISK MANAGEMENT continued
HEDGE ACCOUNTING
FAIR VALUE HEDGES
Fair value hedges have been recognised for the net exposure to trading in foreign currency. Forward exchange contracts have been designated as hedging instruments in respect of amounts denominated in euro, pound sterling and US dollar.
The rand value of the hedging instrument, based on the contract rates, at 31 December 2015 for the Group was R324 million (2014: R316 million).
The loss on the hedging instruments for the year for the Group was R8 million (2014: profit of R1 million) and was recognised in the income statement.
CASH FLOW HEDGES
The Group has hedged its foreign currency exposure on imports of raw materials by entering into forward exchange contracts for the purchase commitments. The rand value of the hedging instrument, based on the contract rates, at 31 December 2015 was R40 million (2014: R109 million).
The cash flows relating to the hedging instruments will occur in 2016 and will not affect the income statement if the hedge is effective as the amount recognised in equity will be removed from equity and recognised in the initial cost of the items of plant and equipment and inventory.
The amount recognised directly in other comprehensive income for the year in respect of the cash flow hedges for the Group was nil (2014: nominal).
EXPOSURE TO CURRENCY RISKThe Group’s exposure to foreign currency risk at 31 December was:
2015 2014
R millions EuroPound
sterlingUS
dollar Other EuroPound
sterlingUS
dollar Other
Cash 108 1 113 24 13 1 27 7
Trade receivables 11 — 169 33 11 2 156 23
Other receivables 4 — 8 67 2 — 13 32
Interest-bearing liabilities — — (503) (1) — — (296) —
Trade payables (79) (9) (303) (29) (75) (9) (177) (8)
Other payables — — — (84) (1) — (1) (17)
Gross exposure 44 (8) (516) 10 (50) (6) (278) 37
Forward exchange contracts 177 11 165 11 179 19 234 (7)
NET EXPOSURE 221 3 (351) 21 129 13 (44) 30
The Company’s exposure to foreign currency risk at 31 December was:
2015 2014
R millions EuroPound
sterlingUS
dollar Other EuroPound
sterlingUS
dollar Other
Cash 95 — 63 — 1 — 7 (2)
Trade receivables 4 — 22 — 3 — 24 2
Loans to subsidiaries — — 486 — — — — —
Interest-bearing liabilities — — (330) — — — (296) —
Trade payables (21) — (175) (1) (36) (4) (124) (1)
Gross exposure 78 — 66 (1) (32) (4) (389) (1)
Forward exchange contracts 72 — 313 2 97 5 326 (5)
NET EXPOSURE 150 — 379 1 65 1 (63) (6)
163
NOTES TO THE FINANCIAL STATEMENTS FOR THE YEAR ENDED 31 DECEMBER 2015 continued
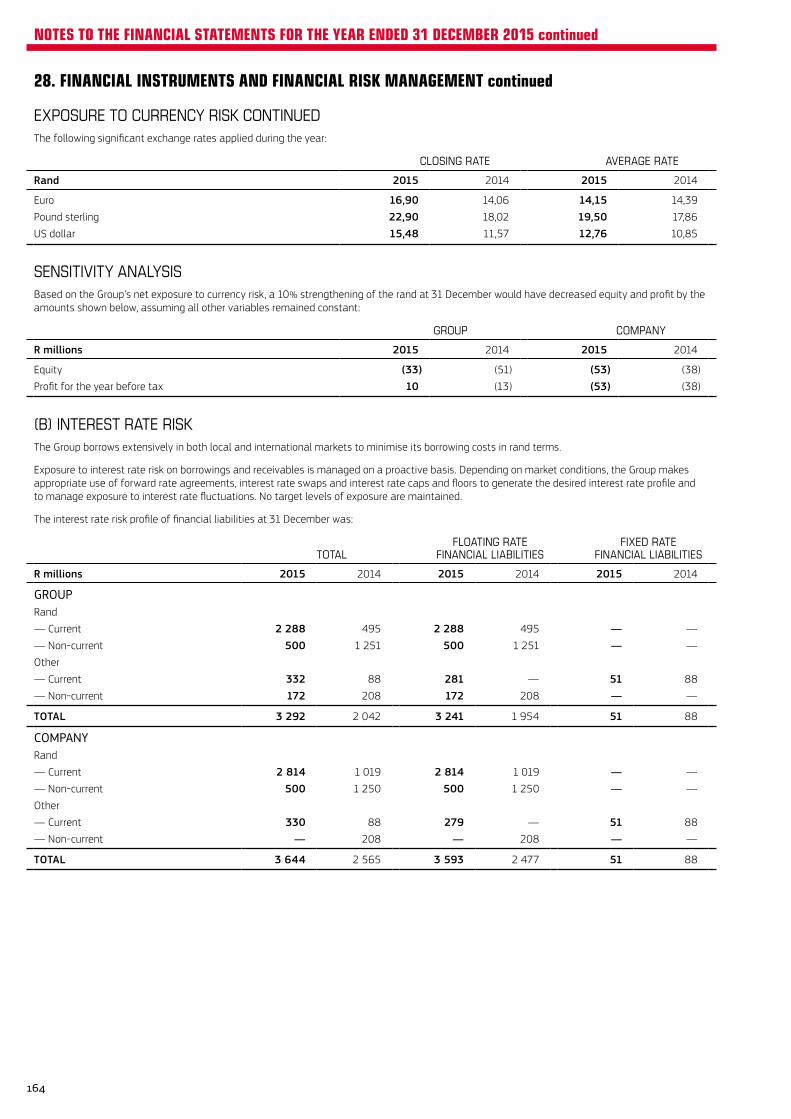
28. FINANCIAL INSTRUMENTS AND FINANCIAL RISK MANAGEMENT continued
EXPOSURE TO CURRENCY RISK CONTINUEDThe following significant exchange rates applied during the year:
CLOSING RATE AVERAGE RATE
Rand 2015 2014 2015 2014
Euro 16,90 14,06 14,15 14,39
Pound sterling 22,90 18,02 19,50 17,86
US dollar 15,48 11,57 12,76 10,85
SENSITIVITY ANALYSISBased on the Group’s net exposure to currency risk, a 10% strengthening of the rand at 31 December would have decreased equity and profit by the amounts shown below, assuming all other variables remained constant:
GROUP COMPANY
R millions 2015 2014 2015 2014
Equity (33) (51) (53) (38)
Profit for the year before tax 10 (13) (53) (38)
(B) INTEREST RATE RISKThe Group borrows extensively in both local and international markets to minimise its borrowing costs in rand terms.
Exposure to interest rate risk on borrowings and receivables is managed on a proactive basis. Depending on market conditions, the Group makes appropriate use of forward rate agreements, interest rate swaps and interest rate caps and floors to generate the desired interest rate profile and to manage exposure to interest rate fluctuations. No target levels of exposure are maintained.
The interest rate risk profile of financial liabilities at 31 December was:
TOTALFLOATING RATE
FINANCIAL LIABILITIESFIXED RATE
FINANCIAL LIABILITIES
R millions 2015 2014 2015 2014 2015 2014
GROUPRand
— Current 2 288 495 2 288 495 — —
— Non-current 500 1 251 500 1 251 — —
Other
— Current 332 88 281 — 51 88
— Non-current 172 208 172 208 — —
TOTAL 3 292 2 042 3 241 1 954 51 88
COMPANYRand
— Current 2 814 1 019 2 814 1 019 — —
— Non-current 500 1 250 500 1 250 — —
Other
— Current 330 88 279 — 51 88
— Non-current — 208 — 208 — —
TOTAL 3 644 2 565 3 593 2 477 51 88
164
NOTES TO THE FINANCIAL STATEMENTS FOR THE YEAR ENDED 31 DECEMBER 2015 continued
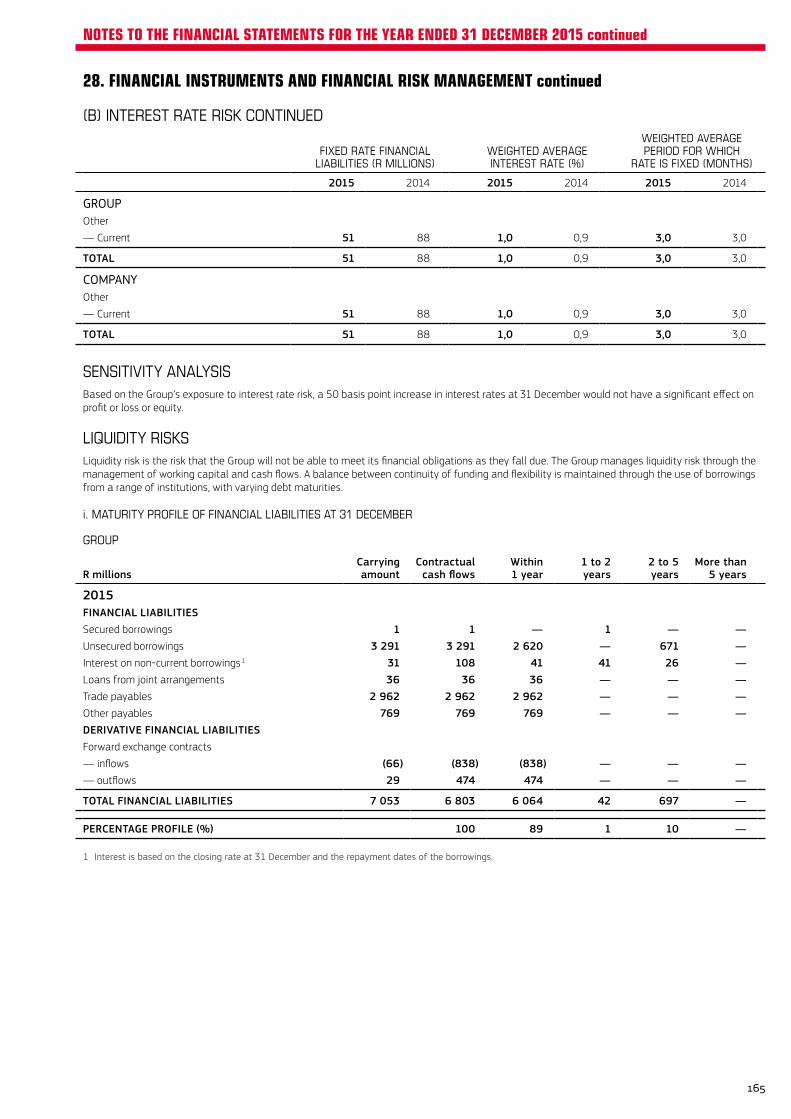
28. FINANCIAL INSTRUMENTS AND FINANCIAL RISK MANAGEMENT continued
(B) INTEREST RATE RISK CONTINUED
FIXED RATE FINANCIALLIABILITIES (R MILLIONS)
WEIGHTED AVERAGEINTEREST RATE (%)
WEIGHTED AVERAGEPERIOD FOR WHICH
RATE IS FIXED (MONTHS)
2015 2014 2015 2014 2015 2014
GROUPOther
— Current 51 88 1,0 0,9 3,0 3,0
TOTAL 51 88 1,0 0,9 3,0 3,0
COMPANYOther
— Current 51 88 1,0 0,9 3,0 3,0
TOTAL 51 88 1,0 0,9 3,0 3,0
SENSITIVITY ANALYSISBased on the Group’s exposure to interest rate risk, a 50 basis point increase in interest rates at 31 December would not have a significant effect on profit or loss or equity.
LIQUIDITY RISKSLiquidity risk is the risk that the Group will not be able to meet its financial obligations as they fall due. The Group manages liquidity risk through the management of working capital and cash flows. A balance between continuity of funding and flexibility is maintained through the use of borrowings from a range of institutions, with varying debt maturities.
i. MATURITY PROFILE OF FINANCIAL LIABILITIES AT 31 DECEMBER
GROUP
R millionsCarryingamount
Contractualcash flows
Within1 year
1 to 2years
2 to 5years
More than5 years
2015FINANCIAL LIABILITIESSecured borrowings 1 1 — 1 — —Unsecured borrowings 3 291 3 291 2 620 — 671 —Interest on non-current borrowings 1 31 108 41 41 26 —Loans from joint arrangements 36 36 36 — — —Trade payables 2 962 2 962 2 962 — — —Other payables 769 769 769 — — —DERIVATIVE FINANCIAL LIABILITIESForward exchange contracts
— inflows (66) (838) (838) — — —— outflows 29 474 474 — — —
TOTAL FINANCIAL LIABILITIES 7 053 6 803 6 064 42 697 —
PERCENTAGE PROFILE (%) 100 89 1 10 —
1 Interest is based on the closing rate at 31 December and the repayment dates of the borrowings.
165
NOTES TO THE FINANCIAL STATEMENTS FOR THE YEAR ENDED 31 DECEMBER 2015 continued

28. FINANCIAL INSTRUMENTS AND FINANCIAL RISK MANAGEMENT continued
LIQUIDITY RISKS CONTINUED
i. MATURITY PROFILE OF FINANCIAL LIABILITIES AT 31 DECEMBER continued
GROUP
R millionsCarryingamount
Contractualcash flows
Within1 year
1 to 2years
2 to 5years
More than5 years
2014FINANCIAL LIABILITIESSecured non-current borrowings 3 3 2 1 — —
Unsecured non-current borrowings 1 821 1 821 363 1 458 — —
Unsecured current borrowings 218 218 218 — — —
Interest on non-current borrowings 1 25 172 138 34 — —
Loans from joint arrangements 49 49 49 — — —
Trade payables 2 325 2 325 2 325 — — —
Other payables 917 917 917 — — —
DERIVATIVE FINANCIAL LIABILITIESForward exchange contracts
— inflows (7) (374) (374) — — —
— outflows 2 799 799 — — —
TOTAL FINANCIAL LIABILITIES 5 353 5 930 4 437 1 493 — —
PERCENTAGE PROFILE (%) 100 75 25 — —
COMPANY
R millionsCarryingamount
Contractualcash flows
Within1 year
1 to 2years
2 to 5years
More than5 years
2015FINANCIAL LIABILITIESUnsecured borrowings 3 644 3 644 3 144 — 500 —Interest on non-current borrowings 1 31 108 41 41 26 —Loans from joint arrangements 72 72 72 — — —Non-current loans from subsidiaries 688 688 — — 688 —Current loans from subsidiaries 3 762 3 762 3 762 — — —Trade payables 1 249 1 249 1 249 — — —Other payables 584 584 584 — — —DERIVATIVE FINANCIAL LIABILITIESForward exchange contracts
— inflows (41) (469) (469) — — —— outflows 8 82 82 — — —
TOTAL FINANCIAL LIABILITIES 9 997 9 720 8 465 41 1 214 —
PERCENTAGE PROFILE (%) 100 87 — 13 —
1 Interest is based on the closing rate at 31 December and the repayment dates of the borrowings.
166
NOTES TO THE FINANCIAL STATEMENTS FOR THE YEAR ENDED 31 DECEMBER 2015 continued
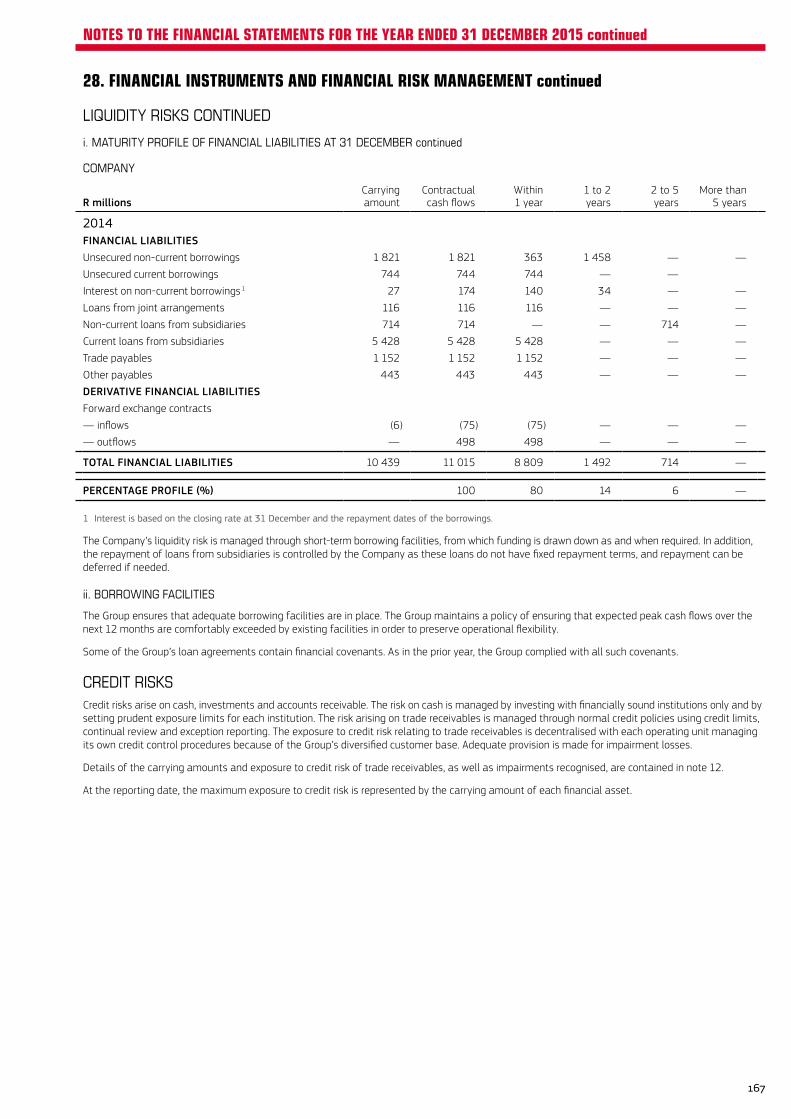
28. FINANCIAL INSTRUMENTS AND FINANCIAL RISK MANAGEMENT continued
LIQUIDITY RISKS CONTINUED
i. MATURITY PROFILE OF FINANCIAL LIABILITIES AT 31 DECEMBER continued
COMPANY
R millionsCarryingamount
Contractualcash flows
Within1 year
1 to 2years
2 to 5years
More than5 years
2014FINANCIAL LIABILITIESUnsecured non-current borrowings 1 821 1 821 363 1 458 — —
Unsecured current borrowings 744 744 744 — —
Interest on non-current borrowings 1 27 174 140 34 — —
Loans from joint arrangements 116 116 116 — — —
Non-current loans from subsidiaries 714 714 — — 714 —
Current loans from subsidiaries 5 428 5 428 5 428 — — —
Trade payables 1 152 1 152 1 152 — — —
Other payables 443 443 443 — — —
DERIVATIVE FINANCIAL LIABILITIESForward exchange contracts
— inflows (6) (75) (75) — — —
— outflows — 498 498 — — —
TOTAL FINANCIAL LIABILITIES 10 439 11 015 8 809 1 492 714 —
PERCENTAGE PROFILE (%) 100 80 14 6 —
1 Interest is based on the closing rate at 31 December and the repayment dates of the borrowings.
The Company’s liquidity risk is managed through short-term borrowing facilities, from which funding is drawn down as and when required. In addition, the repayment of loans from subsidiaries is controlled by the Company as these loans do not have fixed repayment terms, and repayment can be deferred if needed.
ii. BORROWING FACILITIES
The Group ensures that adequate borrowing facilities are in place. The Group maintains a policy of ensuring that expected peak cash flows over the next 12 months are comfortably exceeded by existing facilities in order to preserve operational flexibility.
Some of the Group’s loan agreements contain financial covenants. As in the prior year, the Group complied with all such covenants.
CREDIT RISKSCredit risks arise on cash, investments and accounts receivable. The risk on cash is managed by investing with financially sound institutions only and by setting prudent exposure limits for each institution. The risk arising on trade receivables is managed through normal credit policies using credit limits, continual review and exception reporting. The exposure to credit risk relating to trade receivables is decentralised with each operating unit managing its own credit control procedures because of the Group’s diversified customer base. Adequate provision is made for impairment losses.
Details of the carrying amounts and exposure to credit risk of trade receivables, as well as impairments recognised, are contained in note 12.
At the reporting date, the maximum exposure to credit risk is represented by the carrying amount of each financial asset.
167
NOTES TO THE FINANCIAL STATEMENTS FOR THE YEAR ENDED 31 DECEMBER 2015 continued
29. RELATED PARTY INFORMATIONThe subsidiaries of the Group are identified in note 34, joint arrangements in note 6 and associate companies in note 7.
All transactions and balances with these related parties have been eliminated in accordance with, and to the extent required by, IFRS 10 Consolidated Financial Statements, IFRS 11 Joint Arrangements and IAS 28 Investments in Associates and Joint Ventures.
No dividends were received from associate companies (2014: nil).
Transactions with Directors are disclosed in note 31.
Transactions with related parties are made on terms equivalent to those that prevail in arm’s length transactions.
COMPANY
R millions 2015 2014
TRANSACTIONS THAT TOOK PLACE WITH RELATED PARTIES OF THE COMPANY WERE:Leasing income and sales by the Company to
— Subsidiaries 566 525
Sales to the Company by
— Subsidiaries 82 117
Interest received by the Company from
— Subsidiaries 275 326
— Joint arrangements 2 1
Interest paid by the Company to
— Subsidiaries 105 88
— Joint arrangements 5 8
Rental of premises to the Company by
— Subsidiaries 32 28
Secretarial and administration fees paid to the Company by
— Subsidiaries 86 81
— Joint arrangements 5 —
Company contributions to retirement funds
— AECI Pension Fund — 19
— AECI Supplementary Pension Fund — 2
— AECI Employees Provident Fund 5 11
OUTSTANDING BALANCES WITH RELATED PARTIES OF THE COMPANY AT 31 DECEMBER WERE (SEE NOTES 5 AND 6):Loan amounts owing to the Company by
— Subsidiaries 4 063 9 245
Loan amounts owing by the Company to
— Subsidiaries 4 450 6 142
— Joint arrangements 72 116
Although contributions were made for the full year to the AECI Defined Contribution Pension Fund for former members of the AECI Pension Fund (“APF”) and no contributions were actually made to the APF, the recognition of the settlement of the APF’s obligations required recognition of notional contributions to that fund up to the date of settlement. As a result, the employee benefits note (see note 30) includes R36 million as employer contributions to the APF. These contributions were treated as having been returned to the employer as part of the settlement. The settlement transactions with the APF and the ASPF are disclosed in full in note 30.
The Company guaranteed a loan payable by AECI (Mauritius) Ltd to the value of the balance outstanding to its bankers. At 31 December 2015, the outstanding loan value was US$11 million (R170 million).
Accounts receivable from and payable to related parties are disclosed in notes 12 and 17.
GROUP
R millions 2015 2014
KEY MANAGEMENT PERSONNEL COMPENSATION:— short-term employee benefits 40 33
— post-retirement benefits 2 3
— other long-term benefits 4 3
46 39
Key management personnel are the Directors, Prescribed Officers and Managing Directors or equivalent of operating businesses.
The key management personnel compensation above relates to the Managing Director or equivalent and excludes Directors’ and Prescribed Officers’ remuneration which is set out in note 31.
168
NOTES TO THE FINANCIAL STATEMENTS FOR THE YEAR ENDED 31 DECEMBER 2015 continued
30. EMPLOYEE BENEFITS
RETIREMENT BENEFITSThe Group provides retirement benefits for its permanent employees by means of independent defined-contribution and defined-benefit pension schemes and defined-contribution provident funds. There are four separate defined-benefit pension funds, one defined-contribution pension fund and two defined-contribution provident funds.
During the year, the offers made in 2014 to settle the defined-benefit entitlements of active members, deferred pensioners and pensioners (collectively referred to as “members”) of the APF and the AECI Supplementary Pension Fund (“ASPF”) were accepted and approved. For the APF, implementation of the transaction occurred in the year and for the ASPF the transaction will be completed in 2016. The Group is engaged in a similar process with its other defined-benefit pension funds, namely the AECI Employees Pension Fund (“AEPF”) which has 1 774 members but only eight active employees, and the Dulux Employees Pension Fund (“DEPF”) which has 83 pensioner members.
The Company, together with the APF and the ASPF, made proposals to all members of the APF and ASPF to settle their defined-benefit entitlements. The proposals included distribution of the actuarial surpluses in those funds. The obligation to pay pensioners would be transferred to Sanlam and active members and deferred pensioners would transfer to a new defined-contribution pension fund, all at enhanced values. The proposals were accepted by the members, the funds’ rules were amended accordingly and were approved by the Financial Services Board (“FSB”). Section 14 transfers to Sanlam (in respect of the majority of the pensioners) and to the new defined-contribution fund were submitted to and approved by the FSB. The approval by the FSB was the date on which settlement was made for the purposes of IAS 19 Employee Benefits, in line with legislation relating to the implementation of a section 14 transfer. The settlement date for the APF was 14 August 2015 and for the ASPF it was 4 December 2015.
In March 2014 the Company had concluded an agreement with the APF (and subsequently with the ASPF) to implement changes to restructure these funds. The agreement set out the conditions of an offer to all members of the funds for an alternative benefit in place of the defined-benefit entitlement determined in terms of the rules of the funds. The agreement was entered into to ensure all stakeholders were treated equitably, to ensure that the benefit expectations of all members were met and to allocate amounts to the employer surplus account (“ESA”) of the APF and agree specific utilisation thereof. The amounts allocated to the ESA were specified to be used to make a voluntary alternate benefit offer to eligible members entitled to post-retirement medical aid subsidies from the Group, to make an amount available to active members for the purpose of equating their expected retirement benefits under the defined-benefit approach with the amount they are expected to receive from the defined-contribution accumulation, and to transfer an amount to the ASPF to enable that fund to make a similar level of offer to its members.
The APF had an actuarial surplus as the fair value of its assets significantly exceeded the present value of its defined-benefit obligations. The surplus was recognised as an asset by the Company only to the extent of amounts allocated to the ESA. As part of the restructuring of the APF it was agreed to distribute the actuarial surplus, in terms of section 15C of the Pension Funds Act, No. 24 of 1956, as amended (“the Pension Funds Act”), and the surplus was allocated to members and the ESA on an equitable basis.
The assets of the APF were allocated to stakeholder groups in proportion to certain calculated liabilities and reserves at the conversion date, being 1 May 2014. The defined obligations were determined in a manner consistent with prior years, but using the valuation basis applicable at the conversion date. The amounts were then increased by strengthening the assumptions relating to future pension increases that could be granted. The solvency reserves were recalculated on this strengthened basis and the allocation of the surplus was made based on these strengthened solvency based liabilities. The surplus allocation included the full notional pensioner accumulation amount allocated to members. In addition, members received full value for their additional voluntary contributions, transfers from other funds and prior surplus distributions. Prior to the determination of the surplus, assets were set aside in a reserve for data issues and other contingencies. These set aside assets were deducted from the assets available to determine the residual surplus which was then allocated to members and the Company in proportion to the contribution rates used to determine cash contributions made to the APF (7,5% and 9,0%, respectively). Members were allocated 45,45% of the residual surplus and 54,55% was allocated to the ESA. The effect of this allocation of the residual surplus was that members received an enhancement over and above the strengthened solvency basis liabilities, amounting to a 31% increase in this value.
The assets were notionally separated on this basis and investment returns added to the assets from the conversion date to the actual date of settlement. The assets relating to active members and deferred pensioners were then transferred to the AECI Defined Contribution Pension Fund (“ADCPF”) after receiving section 14 approval from the FSB, while the assets relating to pensioner members were transferred to Sanlam. The latter assumed the longevity and investment risk in respect of the pensioner members. The assets set aside for pensioner members enabled Sanlam to offer them a 37% increase in their monthly pension, with guaranteed inflation-linked annual increases. Pensioner members were also offered an actuarial-equivalent alternative of a cash bonus and a lower initial increase (35%).
The Company agreed to utilise some of the ESA to offer active members an additional enhancement of a retirement benefit equalisation target (“RBET”). The RBET is an amount equivalent to the difference between the estimated retirement benefit under the APF and the estimated retirement benefit under the ADCPF, should the APF benefit exceed the ADCPF benefit. The RBET was transferred to the ADCPF and vests in active members uniformly over their remaining service period until the age of 62 years. If an employee leaves the ADCPF before the age of 62 years, other than as a result of death or disability, the unvested RBET is released to the ESA in the ADCPF.
At year-end, there were 68 pensioners and 65 deferred pensioners who had not yet transferred to Sanlam or to the ADCPF (or an alternative fund in the case of deferred pensioners who elected to do so). Of these remaining members, further applications to transfer 19 pensioners and 42 deferred pensioners were submitted in March 2016. Given that the settlement of approximately 3 500 pensioners and 1 300 active members and deferred pensioners was approved and implemented, it is not expected that the outstanding transfers will be declined. The liabilities and assets for these remaining members have not yet been accounted for as a settlement but the asset values determined on the basis above have been set aside, with an asset limitation being applied to reduce the Company’s recognised asset to the amount in the ESA.
169
NOTES TO THE FINANCIAL STATEMENTS FOR THE YEAR ENDED 31 DECEMBER 2015 continued
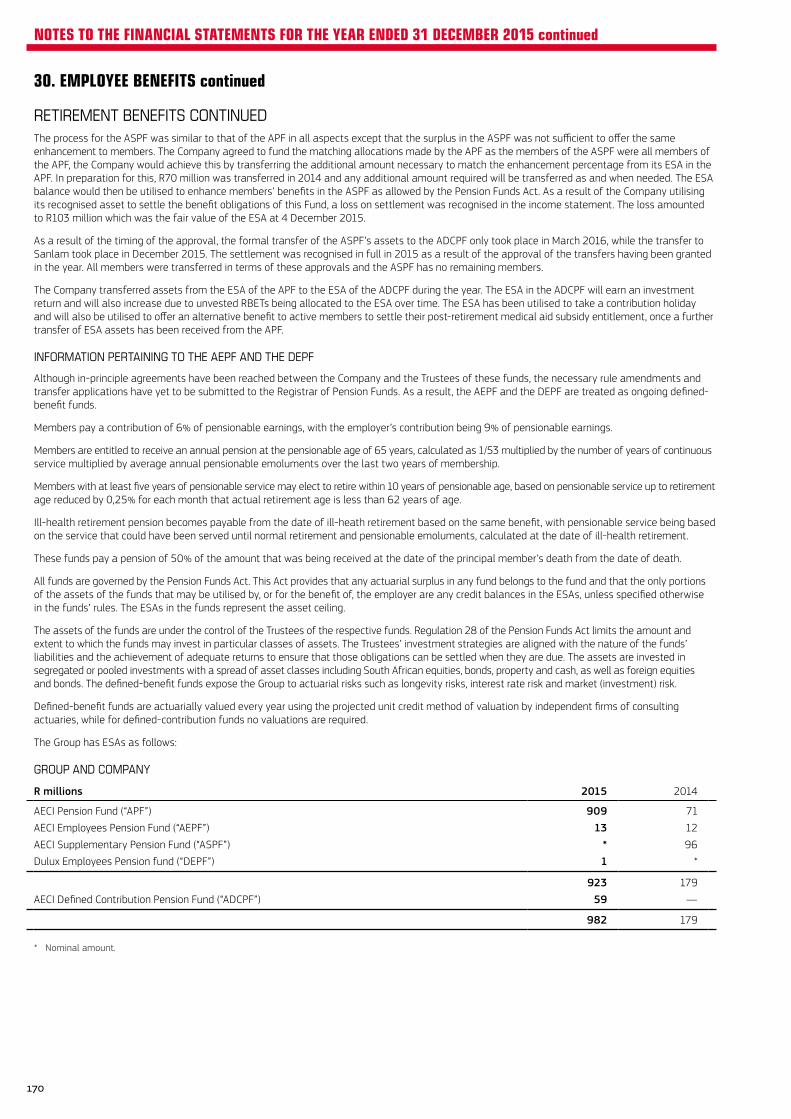
30. EMPLOYEE BENEFITS continued
RETIREMENT BENEFITS CONTINUEDThe process for the ASPF was similar to that of the APF in all aspects except that the surplus in the ASPF was not sufficient to offer the same enhancement to members. The Company agreed to fund the matching allocations made by the APF as the members of the ASPF were all members of the APF, the Company would achieve this by transferring the additional amount necessary to match the enhancement percentage from its ESA in the APF. In preparation for this, R70 million was transferred in 2014 and any additional amount required will be transferred as and when needed. The ESA balance would then be utilised to enhance members’ benefits in the ASPF as allowed by the Pension Funds Act. As a result of the Company utilising its recognised asset to settle the benefit obligations of this Fund, a loss on settlement was recognised in the income statement. The loss amounted to R103 million which was the fair value of the ESA at 4 December 2015.
As a result of the timing of the approval, the formal transfer of the ASPF’s assets to the ADCPF only took place in March 2016, while the transfer to Sanlam took place in December 2015. The settlement was recognised in full in 2015 as a result of the approval of the transfers having been granted in the year. All members were transferred in terms of these approvals and the ASPF has no remaining members.
The Company transferred assets from the ESA of the APF to the ESA of the ADCPF during the year. The ESA in the ADCPF will earn an investment return and will also increase due to unvested RBETs being allocated to the ESA over time. The ESA has been utilised to take a contribution holiday and will also be utilised to offer an alternative benefit to active members to settle their post-retirement medical aid subsidy entitlement, once a further transfer of ESA assets has been received from the APF.
INFORMATION PERTAINING TO THE AEPF AND THE DEPF
Although in-principle agreements have been reached between the Company and the Trustees of these funds, the necessary rule amendments and transfer applications have yet to be submitted to the Registrar of Pension Funds. As a result, the AEPF and the DEPF are treated as ongoing defined-benefit funds.
Members pay a contribution of 6% of pensionable earnings, with the employer’s contribution being 9% of pensionable earnings.
Members are entitled to receive an annual pension at the pensionable age of 65 years, calculated as 1/53 multiplied by the number of years of continuous service multiplied by average annual pensionable emoluments over the last two years of membership.
Members with at least five years of pensionable service may elect to retire within 10 years of pensionable age, based on pensionable service up to retirement age reduced by 0,25% for each month that actual retirement age is less than 62 years of age.
Ill-health retirement pension becomes payable from the date of ill-heath retirement based on the same benefit, with pensionable service being based on the service that could have been served until normal retirement and pensionable emoluments, calculated at the date of ill-health retirement.
These funds pay a pension of 50% of the amount that was being received at the date of the principal member’s death from the date of death.
All funds are governed by the Pension Funds Act. This Act provides that any actuarial surplus in any fund belongs to the fund and that the only portions of the assets of the funds that may be utilised by, or for the benefit of, the employer are any credit balances in the ESAs, unless specified otherwise in the funds’ rules. The ESAs in the funds represent the asset ceiling.
The assets of the funds are under the control of the Trustees of the respective funds. Regulation 28 of the Pension Funds Act limits the amount and extent to which the funds may invest in particular classes of assets. The Trustees’ investment strategies are aligned with the nature of the funds’ liabilities and the achievement of adequate returns to ensure that those obligations can be settled when they are due. The assets are invested in segregated or pooled investments with a spread of asset classes including South African equities, bonds, property and cash, as well as foreign equities and bonds. The defined-benefit funds expose the Group to actuarial risks such as longevity risks, interest rate risk and market (investment) risk.
Defined-benefit funds are actuarially valued every year using the projected unit credit method of valuation by independent firms of consulting actuaries, while for defined-contribution funds no valuations are required.
The Group has ESAs as follows:
GROUP AND COMPANY
R millions 2015 2014
AECI Pension Fund (“APF”) 909 71
AECI Employees Pension Fund (“AEPF”) 13 12
AECI Supplementary Pension Fund (“ASPF”) * 96
Dulux Employees Pension fund (“DEPF”) 1 *
923 179
AECI Defined Contribution Pension Fund (“ADCPF”) 59 —
982 179
* Nominal amount.
170
NOTES TO THE FINANCIAL STATEMENTS FOR THE YEAR ENDED 31 DECEMBER 2015 continued
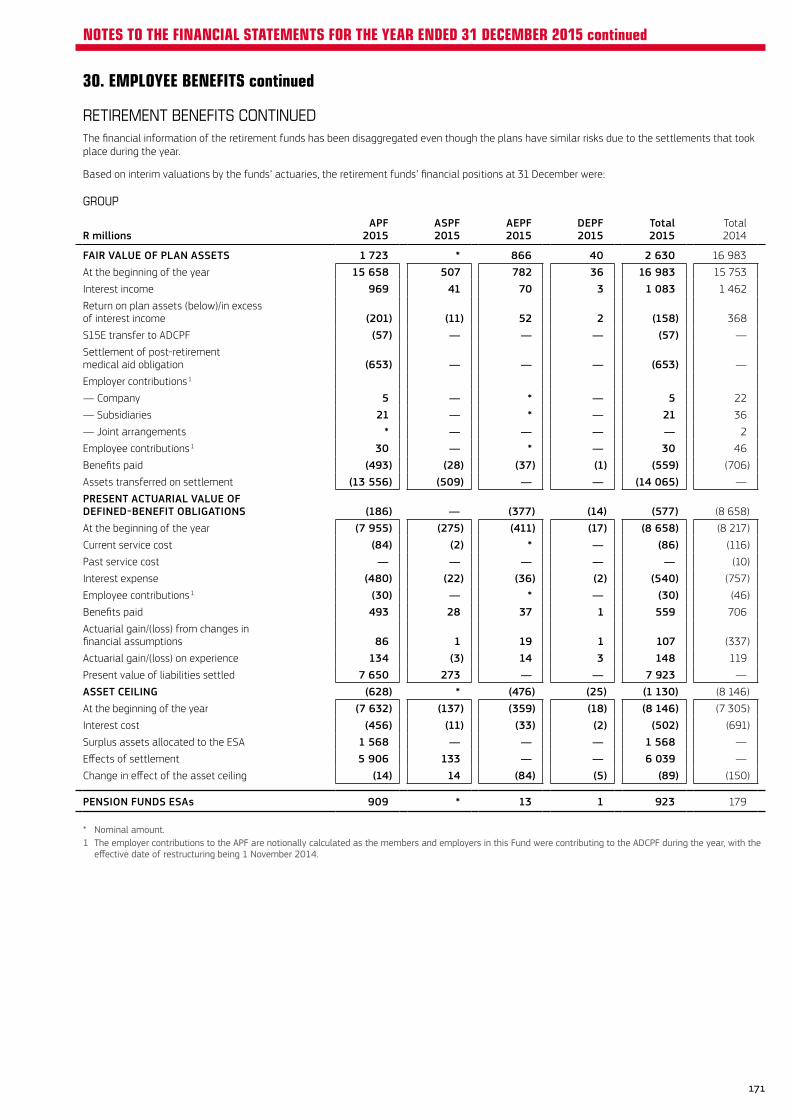
30. EMPLOYEE BENEFITS continued
RETIREMENT BENEFITS CONTINUEDThe financial information of the retirement funds has been disaggregated even though the plans have similar risks due to the settlements that took place during the year.
Based on interim valuations by the funds’ actuaries, the retirement funds’ financial positions at 31 December were:
GROUP
R millionsAPF
2015ASPF2015
AEPF2015
DEPF2015
Total2015
Total2014
FAIR VALUE OF PLAN ASSETS 1 723 * 866 40 2 630 16 983
At the beginning of the year 15 658 507 782 36 16 983 15 753
Interest income 969 41 70 3 1 083 1 462
Return on plan assets (below)/in excess of interest income (201) (11) 52 2 (158) 368
S15E transfer to ADCPF (57) — — — (57) —
Settlement of post-retirement medical aid obligation (653) — — — (653) —
Employer contributions 1
— Company 5 — * — 5 22
— Subsidiaries 21 — * — 21 36
— Joint arrangements * — — — — 2
Employee contributions 1 30 — * — 30 46
Benefits paid (493) (28) (37) (1) (559) (706)
Assets transferred on settlement (13 556) (509) — — (14 065) —
PRESENT ACTUARIAL VALUE OF DEFINED-BENEFIT OBLIGATIONS (186) — (377) (14) (577) (8 658)
At the beginning of the year (7 955) (275) (411) (17) (8 658) (8 217)
Current service cost (84) (2) * — (86) (116)
Past service cost — — — — — (10)
Interest expense (480) (22) (36) (2) (540) (757)
Employee contributions 1 (30) — * — (30) (46)
Benefits paid 493 28 37 1 559 706
Actuarial gain/(loss) from changes in financial assumptions 86 1 19 1 107 (337)
Actuarial gain/(loss) on experience 134 (3) 14 3 148 119
Present value of liabilities settled 7 650 273 — — 7 923 —
ASSET CEILING (628) * (476) (25) (1 130) (8 146)
At the beginning of the year (7 632) (137) (359) (18) (8 146) (7 305)
Interest cost (456) (11) (33) (2) (502) (691)
Surplus assets allocated to the ESA 1 568 — — — 1 568 —
Effects of settlement 5 906 133 — — 6 039 —
Change in effect of the asset ceiling (14) 14 (84) (5) (89) (150)
PENSION FUNDS ESAs 909 * 13 1 923 179
* Nominal amount.1 The employer contributions to the APF are notionally calculated as the members and employers in this Fund were contributing to the ADCPF during the year, with the
effective date of restructuring being 1 November 2014.
171
NOTES TO THE FINANCIAL STATEMENTS FOR THE YEAR ENDED 31 DECEMBER 2015 continued
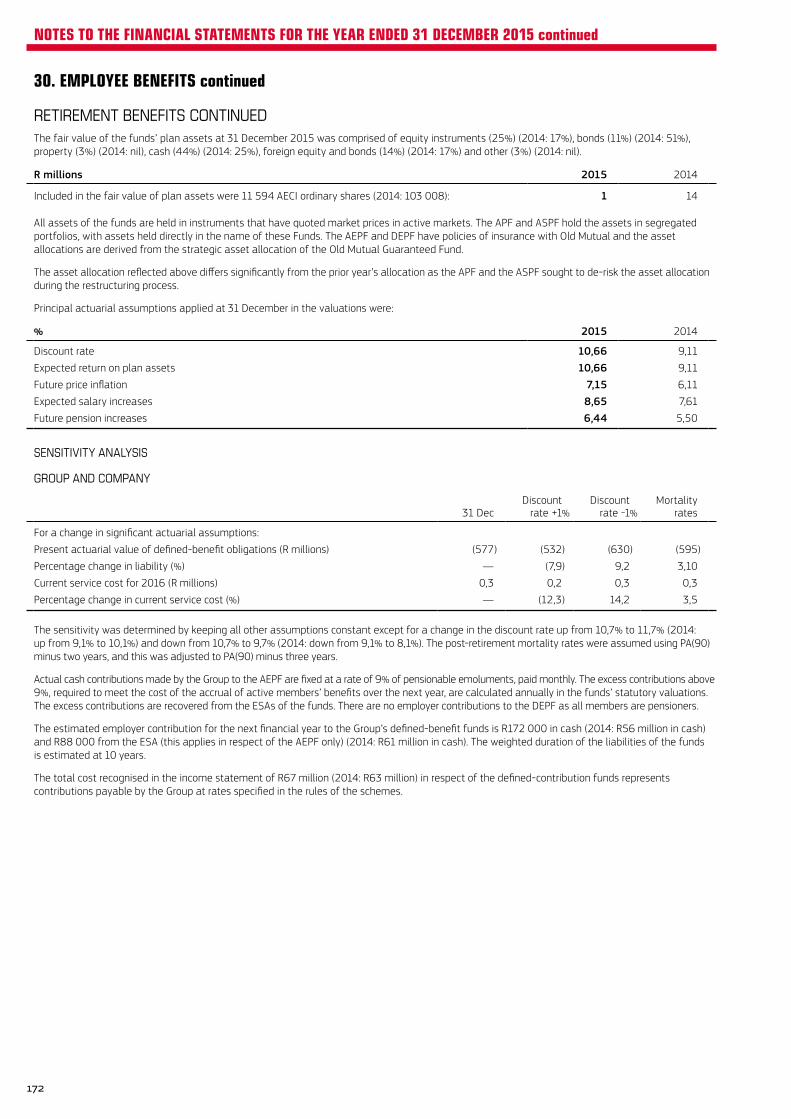
30. EMPLOYEE BENEFITS continued
RETIREMENT BENEFITS CONTINUEDThe fair value of the funds’ plan assets at 31 December 2015 was comprised of equity instruments (25%) (2014: 17%), bonds (11%) (2014: 51%), property (3%) (2014: nil), cash (44%) (2014: 25%), foreign equity and bonds (14%) (2014: 17%) and other (3%) (2014: nil).
R millions 2015 2014
Included in the fair value of plan assets were 11 594 AECI ordinary shares (2014: 103 008): 1 14
All assets of the funds are held in instruments that have quoted market prices in active markets. The APF and ASPF hold the assets in segregated portfolios, with assets held directly in the name of these Funds. The AEPF and DEPF have policies of insurance with Old Mutual and the asset allocations are derived from the strategic asset allocation of the Old Mutual Guaranteed Fund.
The asset allocation reflected above differs significantly from the prior year’s allocation as the APF and the ASPF sought to de-risk the asset allocation during the restructuring process.
Principal actuarial assumptions applied at 31 December in the valuations were:
% 2015 2014
Discount rate 10,66 9,11
Expected return on plan assets 10,66 9,11
Future price inflation 7,15 6,11
Expected salary increases 8,65 7,61
Future pension increases 6,44 5,50
SENSITIVITY ANALYSIS
GROUP AND COMPANY
31 DecDiscount
rate +1%Discount
rate -1%Mortality
rates
For a change in significant actuarial assumptions:
Present actuarial value of defined-benefit obligations (R millions) (577) (532) (630) (595)
Percentage change in liability (%) — (7,9) 9,2 3,10
Current service cost for 2016 (R millions) 0,3 0,2 0,3 0,3
Percentage change in current service cost (%) — (12,3) 14,2 3,5
The sensitivity was determined by keeping all other assumptions constant except for a change in the discount rate up from 10,7% to 11,7% (2014: up from 9,1% to 10,1%) and down from 10,7% to 9,7% (2014: down from 9,1% to 8,1%). The post-retirement mortality rates were assumed using PA(90) minus two years, and this was adjusted to PA(90) minus three years.
Actual cash contributions made by the Group to the AEPF are fixed at a rate of 9% of pensionable emoluments, paid monthly. The excess contributions above 9%, required to meet the cost of the accrual of active members’ benefits over the next year, are calculated annually in the funds’ statutory valuations. The excess contributions are recovered from the ESAs of the funds. There are no employer contributions to the DEPF as all members are pensioners.
The estimated employer contribution for the next financial year to the Group’s defined-benefit funds is R172 000 in cash (2014: R56 million in cash) and R88 000 from the ESA (this applies in respect of the AEPF only) (2014: R61 million in cash). The weighted duration of the liabilities of the funds is estimated at 10 years.
The total cost recognised in the income statement of R67 million (2014: R63 million) in respect of the defined-contribution funds represents contributions payable by the Group at rates specified in the rules of the schemes.
172
NOTES TO THE FINANCIAL STATEMENTS FOR THE YEAR ENDED 31 DECEMBER 2015 continued
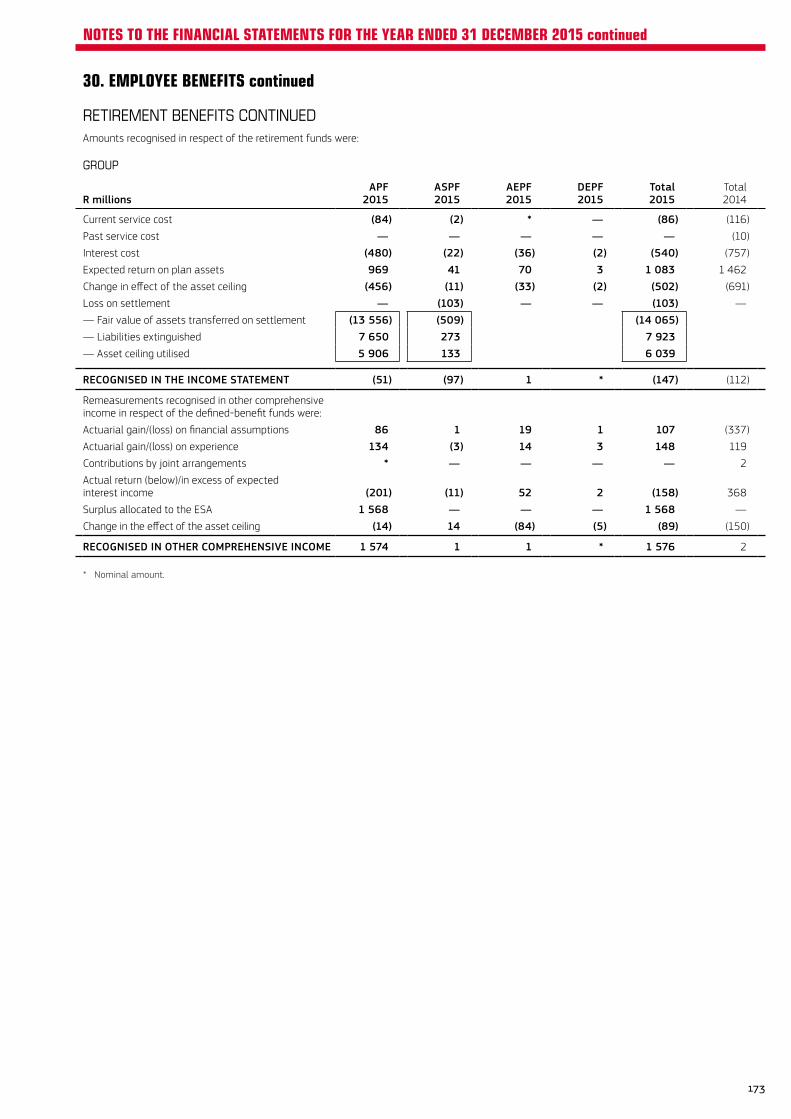
30. EMPLOYEE BENEFITS continued
RETIREMENT BENEFITS CONTINUEDAmounts recognised in respect of the retirement funds were:
GROUP
R millionsAPF
2015ASPF2015
AEPF2015
DEPF2015
Total2015
Total2014
Current service cost (84) (2) * — (86) (116)
Past service cost — — — — — (10)
Interest cost (480) (22) (36) (2) (540) (757)
Expected return on plan assets 969 41 70 3 1 083 1 462
Change in effect of the asset ceiling (456) (11) (33) (2) (502) (691)
Loss on settlement — (103) — — (103) —
— Fair value of assets transferred on settlement (13 556) (509) (14 065)— Liabilities extinguished 7 650 273 7 923— Asset ceiling utilised 5 906 133 6 039
RECOGNISED IN THE INCOME STATEMENT (51) (97) 1 * (147) (112)
Remeasurements recognised in other comprehensive income in respect of the defined-benefit funds were:
Actuarial gain/(loss) on financial assumptions 86 1 19 1 107 (337)
Actuarial gain/(loss) on experience 134 (3) 14 3 148 119
Contributions by joint arrangements * — — — — 2
Actual return (below)/in excess of expected interest income (201) (11) 52 2 (158) 368
Surplus allocated to the ESA 1 568 — — — 1 568 —
Change in the effect of the asset ceiling (14) 14 (84) (5) (89) (150)
RECOGNISED IN OTHER COMPREHENSIVE INCOME 1 574 1 1 * 1 576 2
* Nominal amount.
173
NOTES TO THE FINANCIAL STATEMENTS FOR THE YEAR ENDED 31 DECEMBER 2015 continued
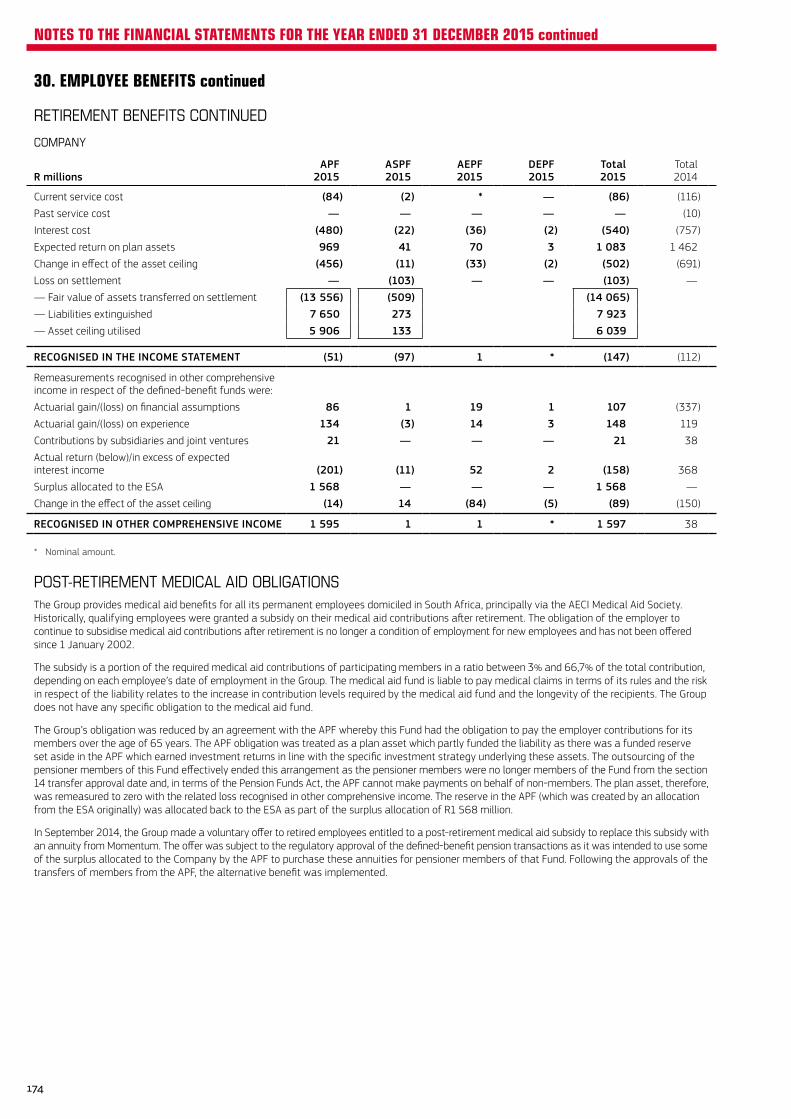
30. EMPLOYEE BENEFITS continued
RETIREMENT BENEFITS CONTINUED
COMPANY
R millionsAPF
2015ASPF2015
AEPF2015
DEPF2015
Total2015
Total2014
Current service cost (84) (2) * — (86) (116)
Past service cost — — — — — (10)
Interest cost (480) (22) (36) (2) (540) (757)
Expected return on plan assets 969 41 70 3 1 083 1 462
Change in effect of the asset ceiling (456) (11) (33) (2) (502) (691)
Loss on settlement — (103) — — (103) —
— Fair value of assets transferred on settlement (13 556) (509) (14 065)— Liabilities extinguished 7 650 273 7 923— Asset ceiling utilised 5 906 133 6 039
RECOGNISED IN THE INCOME STATEMENT (51) (97) 1 * (147) (112)
Remeasurements recognised in other comprehensive income in respect of the defined-benefit funds were:
Actuarial gain/(loss) on financial assumptions 86 1 19 1 107 (337)
Actuarial gain/(loss) on experience 134 (3) 14 3 148 119
Contributions by subsidiaries and joint ventures 21 — — — 21 38
Actual return (below)/in excess of expected interest income (201) (11) 52 2 (158) 368
Surplus allocated to the ESA 1 568 — — — 1 568 —
Change in the effect of the asset ceiling (14) 14 (84) (5) (89) (150)
RECOGNISED IN OTHER COMPREHENSIVE INCOME 1 595 1 1 * 1 597 38
* Nominal amount.
POST-RETIREMENT MEDICAL AID OBLIGATIONSThe Group provides medical aid benefits for all its permanent employees domiciled in South Africa, principally via the AECI Medical Aid Society. Historically, qualifying employees were granted a subsidy on their medical aid contributions after retirement. The obligation of the employer to continue to subsidise medical aid contributions after retirement is no longer a condition of employment for new employees and has not been offered since 1 January 2002.
The subsidy is a portion of the required medical aid contributions of participating members in a ratio between 3% and 66,7% of the total contribution, depending on each employee’s date of employment in the Group. The medical aid fund is liable to pay medical claims in terms of its rules and the risk in respect of the liability relates to the increase in contribution levels required by the medical aid fund and the longevity of the recipients. The Group does not have any specific obligation to the medical aid fund.
The Group’s obligation was reduced by an agreement with the APF whereby this Fund had the obligation to pay the employer contributions for its members over the age of 65 years. The APF obligation was treated as a plan asset which partly funded the liability as there was a funded reserve set aside in the APF which earned investment returns in line with the specific investment strategy underlying these assets. The outsourcing of the pensioner members of this Fund effectively ended this arrangement as the pensioner members were no longer members of the Fund from the section 14 transfer approval date and, in terms of the Pension Funds Act, the APF cannot make payments on behalf of non-members. The plan asset, therefore, was remeasured to zero with the related loss recognised in other comprehensive income. The reserve in the APF (which was created by an allocation from the ESA originally) was allocated back to the ESA as part of the surplus allocation of R1 568 million.
In September 2014, the Group made a voluntary offer to retired employees entitled to a post-retirement medical aid subsidy to replace this subsidy with an annuity from Momentum. The offer was subject to the regulatory approval of the defined-benefit pension transactions as it was intended to use some of the surplus allocated to the Company by the APF to purchase these annuities for pensioner members of that Fund. Following the approvals of the transfers of members from the APF, the alternative benefit was implemented.
174
NOTES TO THE FINANCIAL STATEMENTS FOR THE YEAR ENDED 31 DECEMBER 2015 continued
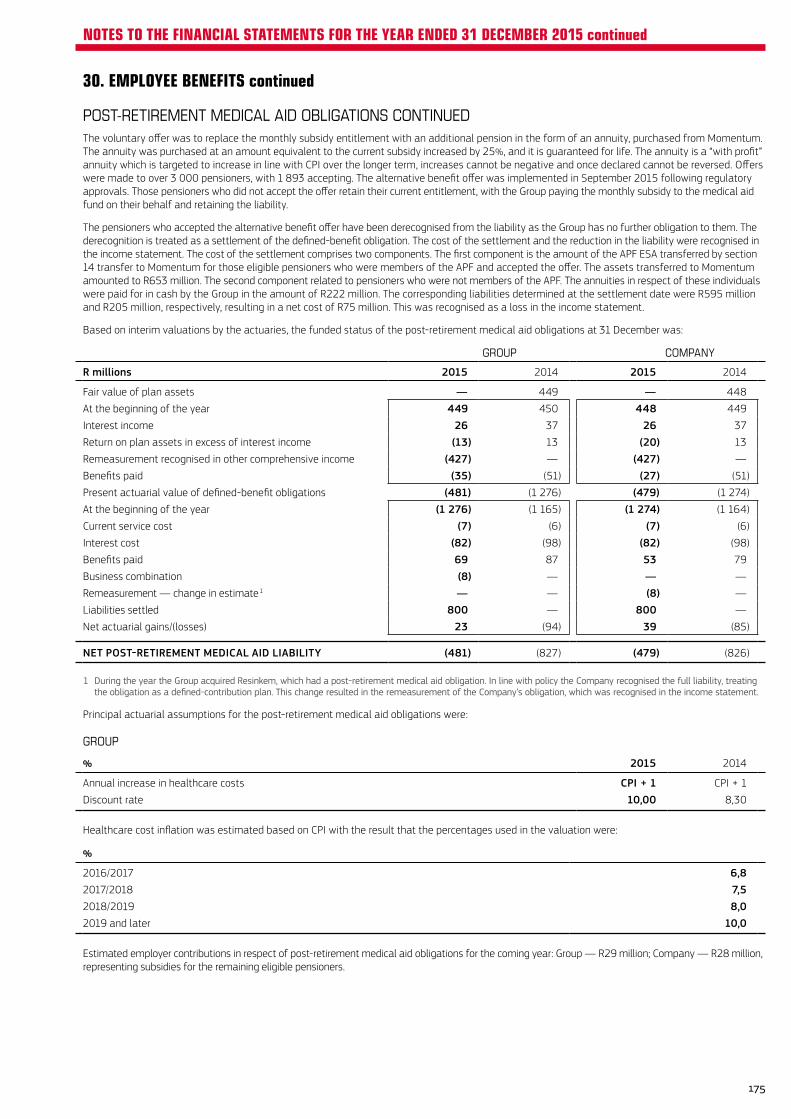
30. EMPLOYEE BENEFITS continued
POST-RETIREMENT MEDICAL AID OBLIGATIONS CONTINUEDThe voluntary offer was to replace the monthly subsidy entitlement with an additional pension in the form of an annuity, purchased from Momentum. The annuity was purchased at an amount equivalent to the current subsidy increased by 25%, and it is guaranteed for life. The annuity is a “with profit” annuity which is targeted to increase in line with CPI over the longer term, increases cannot be negative and once declared cannot be reversed. Offers were made to over 3 000 pensioners, with 1 893 accepting. The alternative benefit offer was implemented in September 2015 following regulatory approvals. Those pensioners who did not accept the offer retain their current entitlement, with the Group paying the monthly subsidy to the medical aid fund on their behalf and retaining the liability.
The pensioners who accepted the alternative benefit offer have been derecognised from the liability as the Group has no further obligation to them. The derecognition is treated as a settlement of the defined-benefit obligation. The cost of the settlement and the reduction in the liability were recognised in the income statement. The cost of the settlement comprises two components. The first component is the amount of the APF ESA transferred by section 14 transfer to Momentum for those eligible pensioners who were members of the APF and accepted the offer. The assets transferred to Momentum amounted to R653 million. The second component related to pensioners who were not members of the APF. The annuities in respect of these individuals were paid for in cash by the Group in the amount of R222 million. The corresponding liabilities determined at the settlement date were R595 million and R205 million, respectively, resulting in a net cost of R75 million. This was recognised as a loss in the income statement.
Based on interim valuations by the actuaries, the funded status of the post-retirement medical aid obligations at 31 December was:
GROUP COMPANY
R millions 2015 2014 2015 2014
Fair value of plan assets — 449 — 448
At the beginning of the year 449 450 448 449
Interest income 26 37 26 37
Return on plan assets in excess of interest income (13) 13 (20) 13
Remeasurement recognised in other comprehensive income (427) — (427) —
Benefits paid (35) (51) (27) (51)
Present actuarial value of defined-benefit obligations (481) (1 276) (479) (1 274)
At the beginning of the year (1 276) (1 165) (1 274) (1 164)
Current service cost (7) (6) (7) (6)
Interest cost (82) (98) (82) (98)
Benefits paid 69 87 53 79
Business combination (8) — — —
Remeasurement — change in estimate 1 — — (8) —
Liabilities settled 800 — 800 —
Net actuarial gains/(losses) 23 (94) 39 (85)
NET POST-RETIREMENT MEDICAL AID LIABILITY (481) (827) (479) (826)
1 During the year the Group acquired Resinkem, which had a post-retirement medical aid obligation. In line with policy the Company recognised the full liability, treating the obligation as a defined-contribution plan. This change resulted in the remeasurement of the Company’s obligation, which was recognised in the income statement.
Principal actuarial assumptions for the post-retirement medical aid obligations were:
GROUP
% 2015 2014
Annual increase in healthcare costs CPI + 1 CPI + 1
Discount rate 10,00 8,30
Healthcare cost inflation was estimated based on CPI with the result that the percentages used in the valuation were:
%
2016/2017 6,82017/2018 7,52018/2019 8,02019 and later 10,0
Estimated employer contributions in respect of post-retirement medical aid obligations for the coming year: Group — R29 million; Company — R28 million, representing subsidies for the remaining eligible pensioners.
175
NOTES TO THE FINANCIAL STATEMENTS FOR THE YEAR ENDED 31 DECEMBER 2015 continued
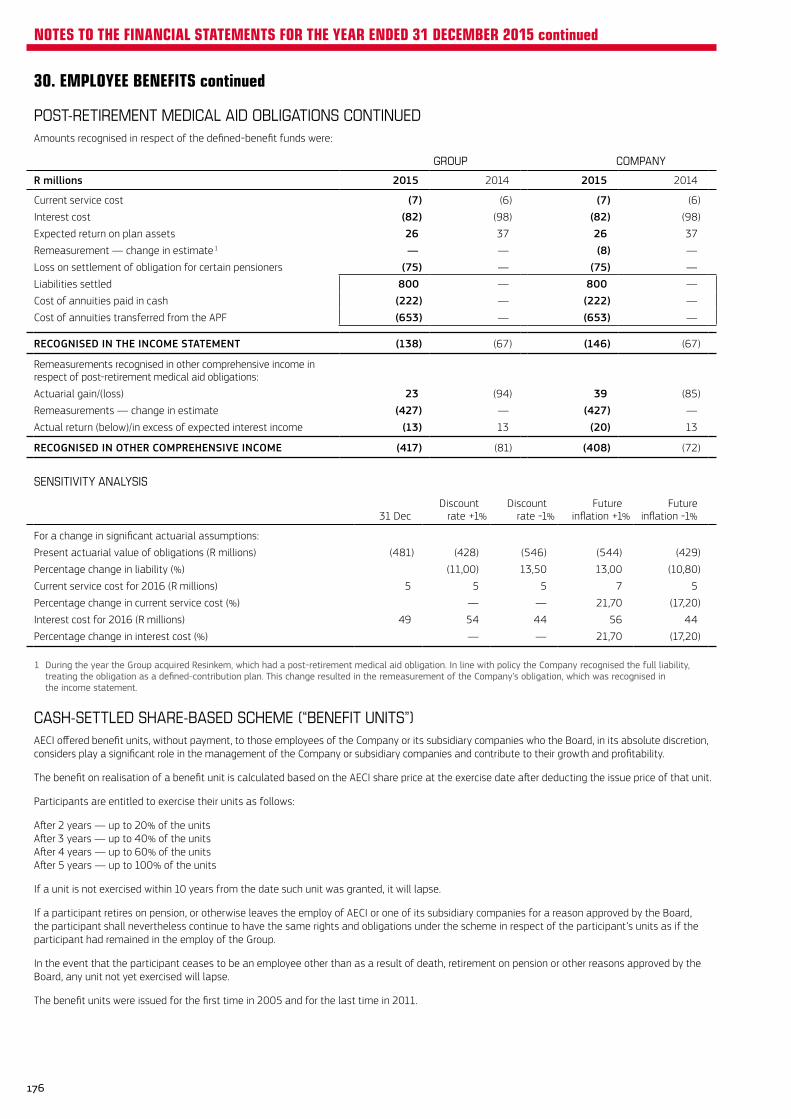
30. EMPLOYEE BENEFITS continued
POST-RETIREMENT MEDICAL AID OBLIGATIONS CONTINUEDAmounts recognised in respect of the defined-benefit funds were:
GROUP COMPANY
R millions 2015 2014 2015 2014
Current service cost (7) (6) (7) (6)
Interest cost (82) (98) (82) (98)
Expected return on plan assets 26 37 26 37
Remeasurement — change in estimate 1 — — (8) —
Loss on settlement of obligation for certain pensioners (75) — (75) —
Liabilities settled 800 — 800 —
Cost of annuities paid in cash (222) — (222) —
Cost of annuities transferred from the APF (653) — (653) —
RECOGNISED IN THE INCOME STATEMENT (138) (67) (146) (67)
Remeasurements recognised in other comprehensive income in respect of post-retirement medical aid obligations:
Actuarial gain/(loss) 23 (94) 39 (85)
Remeasurements — change in estimate (427) — (427) —
Actual return (below)/in excess of expected interest income (13) 13 (20) 13
RECOGNISED IN OTHER COMPREHENSIVE INCOME (417) (81) (408) (72)
SENSITIVITY ANALYSIS
31 DecDiscount
rate +1%Discount
rate -1%Future
inflation +1%Future
inflation -1%
For a change in significant actuarial assumptions:
Present actuarial value of obligations (R millions) (481) (428) (546) (544) (429)
Percentage change in liability (%) (11,00) 13,50 13,00 (10,80)
Current service cost for 2016 (R millions) 5 5 5 7 5
Percentage change in current service cost (%) — — 21,70 (17,20)
Interest cost for 2016 (R millions) 49 54 44 56 44
Percentage change in interest cost (%) — — 21,70 (17,20)
1 During the year the Group acquired Resinkem, which had a post-retirement medical aid obligation. In line with policy the Company recognised the full liability, treating the obligation as a defined-contribution plan. This change resulted in the remeasurement of the Company’s obligation, which was recognised in the income statement.
CASH-SETTLED SHARE-BASED SCHEME (“BENEFIT UNITS”)AECI offered benefit units, without payment, to those employees of the Company or its subsidiary companies who the Board, in its absolute discretion, considers play a significant role in the management of the Company or subsidiary companies and contribute to their growth and profitability.
The benefit on realisation of a benefit unit is calculated based on the AECI share price at the exercise date after deducting the issue price of that unit.
Participants are entitled to exercise their units as follows:
After 2 years — up to 20% of the units After 3 years — up to 40% of the units After 4 years — up to 60% of the units After 5 years — up to 100% of the units
If a unit is not exercised within 10 years from the date such unit was granted, it will lapse.
If a participant retires on pension, or otherwise leaves the employ of AECI or one of its subsidiary companies for a reason approved by the Board, the participant shall nevertheless continue to have the same rights and obligations under the scheme in respect of the participant’s units as if the participant had remained in the employ of the Group.
In the event that the participant ceases to be an employee other than as a result of death, retirement on pension or other reasons approved by the Board, any unit not yet exercised will lapse.
The benefit units were issued for the first time in 2005 and for the last time in 2011.
176
NOTES TO THE FINANCIAL STATEMENTS FOR THE YEAR ENDED 31 DECEMBER 2015 continued
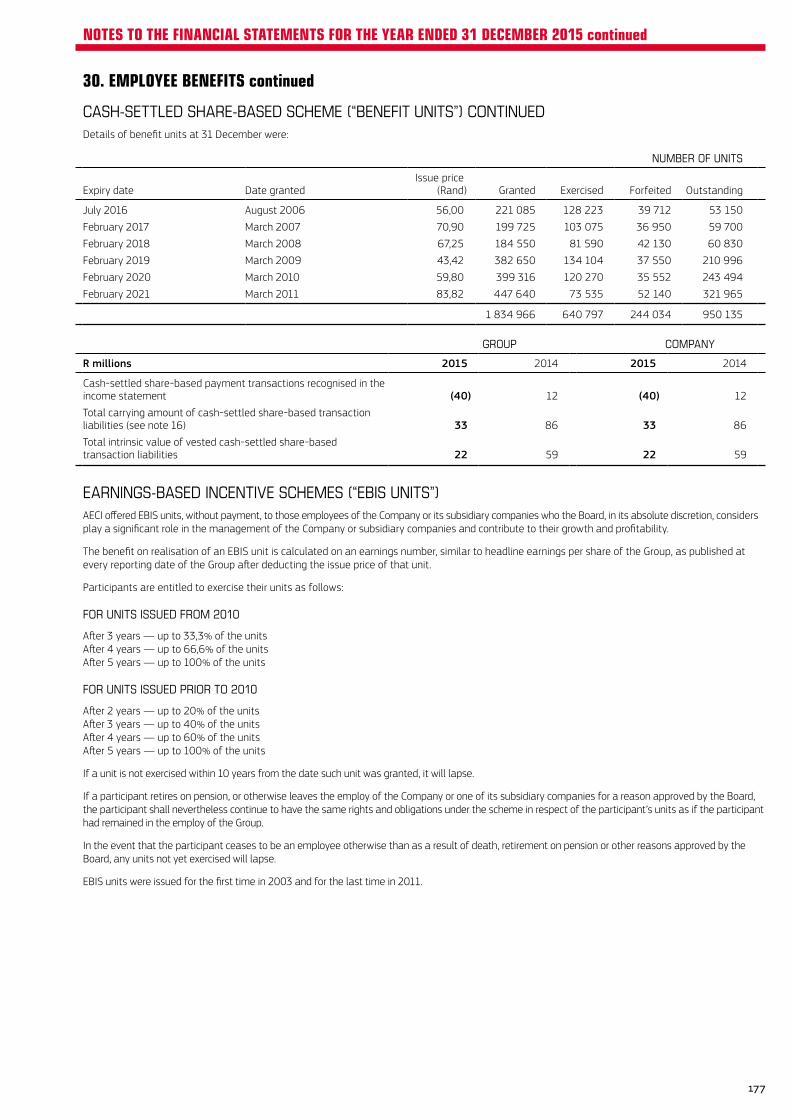
30. EMPLOYEE BENEFITS continued
CASH-SETTLED SHARE-BASED SCHEME (“BENEFIT UNITS”) CONTINUEDDetails of benefit units at 31 December were:
NUMBER OF UNITS
Expiry date Date grantedIssue price
(Rand) Granted Exercised Forfeited Outstanding
July 2016 August 2006 56,00 221 085 128 223 39 712 53 150
February 2017 March 2007 70,90 199 725 103 075 36 950 59 700
February 2018 March 2008 67,25 184 550 81 590 42 130 60 830
February 2019 March 2009 43,42 382 650 134 104 37 550 210 996
February 2020 March 2010 59,80 399 316 120 270 35 552 243 494
February 2021 March 2011 83,82 447 640 73 535 52 140 321 965
1 834 966 640 797 244 034 950 135
GROUP COMPANY
R millions 2015 2014 2015 2014
Cash-settled share-based payment transactions recognised in the income statement (40) 12 (40) 12
Total carrying amount of cash-settled share-based transaction liabilities (see note 16) 33 86 33 86
Total intrinsic value of vested cash-settled share-based transaction liabilities 22 59 22 59
EARNINGS-BASED INCENTIVE SCHEMES (“EBIS UNITS”)AECI offered EBIS units, without payment, to those employees of the Company or its subsidiary companies who the Board, in its absolute discretion, considers play a significant role in the management of the Company or subsidiary companies and contribute to their growth and profitability.
The benefit on realisation of an EBIS unit is calculated on an earnings number, similar to headline earnings per share of the Group, as published at every reporting date of the Group after deducting the issue price of that unit.
Participants are entitled to exercise their units as follows:
FOR UNITS ISSUED FROM 2010
After 3 years — up to 33,3% of the units After 4 years — up to 66,6% of the units After 5 years — up to 100% of the units
FOR UNITS ISSUED PRIOR TO 2010
After 2 years — up to 20% of the units After 3 years — up to 40% of the units After 4 years — up to 60% of the units After 5 years — up to 100% of the units
If a unit is not exercised within 10 years from the date such unit was granted, it will lapse.
If a participant retires on pension, or otherwise leaves the employ of the Company or one of its subsidiary companies for a reason approved by the Board, the participant shall nevertheless continue to have the same rights and obligations under the scheme in respect of the participant’s units as if the participant had remained in the employ of the Group.
In the event that the participant ceases to be an employee otherwise than as a result of death, retirement on pension or other reasons approved by the Board, any units not yet exercised will lapse.
EBIS units were issued for the first time in 2003 and for the last time in 2011.
177
NOTES TO THE FINANCIAL STATEMENTS FOR THE YEAR ENDED 31 DECEMBER 2015 continued
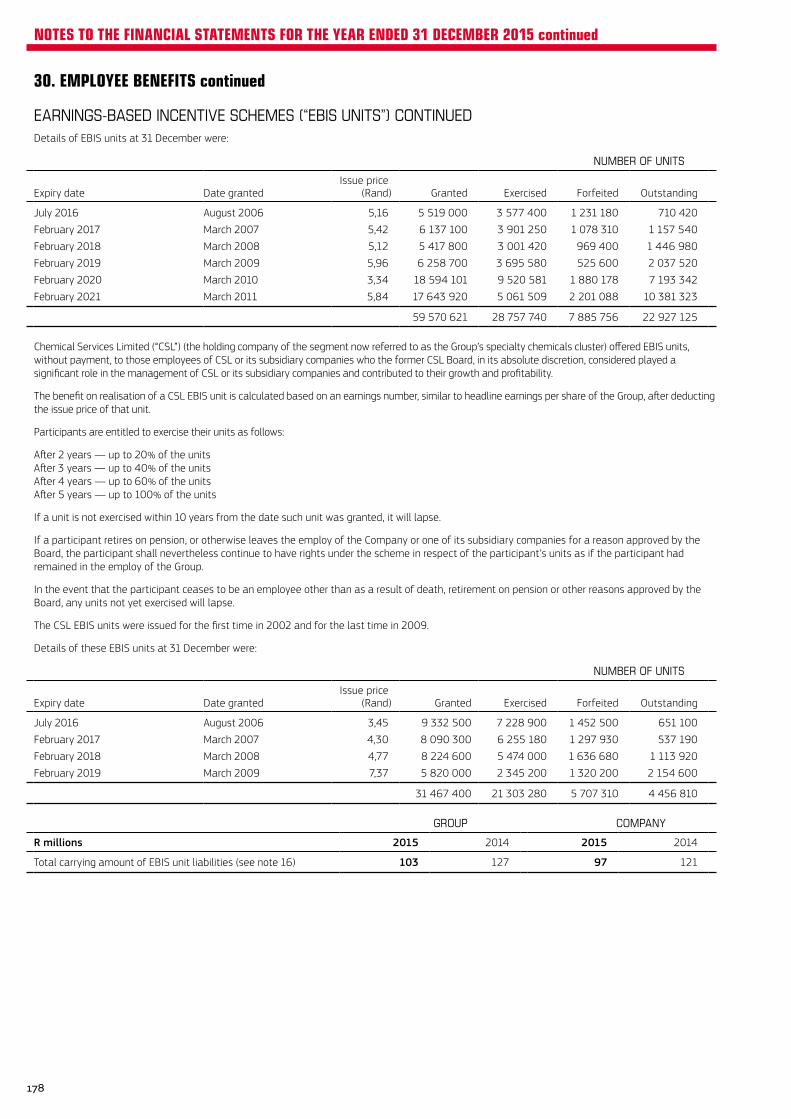
30. EMPLOYEE BENEFITS continued
EARNINGS-BASED INCENTIVE SCHEMES (“EBIS UNITS”) CONTINUEDDetails of EBIS units at 31 December were:
NUMBER OF UNITS
Expiry date Date grantedIssue price
(Rand) Granted Exercised Forfeited Outstanding
July 2016 August 2006 5,16 5 519 000 3 577 400 1 231 180 710 420
February 2017 March 2007 5,42 6 137 100 3 901 250 1 078 310 1 157 540
February 2018 March 2008 5,12 5 417 800 3 001 420 969 400 1 446 980
February 2019 March 2009 5,96 6 258 700 3 695 580 525 600 2 037 520
February 2020 March 2010 3,34 18 594 101 9 520 581 1 880 178 7 193 342
February 2021 March 2011 5,84 17 643 920 5 061 509 2 201 088 10 381 323
59 570 621 28 757 740 7 885 756 22 927 125
Chemical Services Limited (“CSL”) (the holding company of the segment now referred to as the Group’s specialty chemicals cluster) offered EBIS units, without payment, to those employees of CSL or its subsidiary companies who the former CSL Board, in its absolute discretion, considered played a significant role in the management of CSL or its subsidiary companies and contributed to their growth and profitability.
The benefit on realisation of a CSL EBIS unit is calculated based on an earnings number, similar to headline earnings per share of the Group, after deducting the issue price of that unit.
Participants are entitled to exercise their units as follows:
After 2 years — up to 20% of the units After 3 years — up to 40% of the units After 4 years — up to 60% of the units After 5 years — up to 100% of the units
If a unit is not exercised within 10 years from the date such unit was granted, it will lapse.
If a participant retires on pension, or otherwise leaves the employ of the Company or one of its subsidiary companies for a reason approved by the Board, the participant shall nevertheless continue to have rights under the scheme in respect of the participant’s units as if the participant had remained in the employ of the Group.
In the event that the participant ceases to be an employee other than as a result of death, retirement on pension or other reasons approved by the Board, any units not yet exercised will lapse.
The CSL EBIS units were issued for the first time in 2002 and for the last time in 2009.
Details of these EBIS units at 31 December were:
NUMBER OF UNITS
Expiry date Date grantedIssue price
(Rand) Granted Exercised Forfeited Outstanding
July 2016 August 2006 3,45 9 332 500 7 228 900 1 452 500 651 100
February 2017 March 2007 4,30 8 090 300 6 255 180 1 297 930 537 190
February 2018 March 2008 4,77 8 224 600 5 474 000 1 636 680 1 113 920
February 2019 March 2009 7,37 5 820 000 2 345 200 1 320 200 2 154 600
31 467 400 21 303 280 5 707 310 4 456 810
GROUP COMPANY
R millions 2015 2014 2015 2014
Total carrying amount of EBIS unit liabilities (see note 16) 103 127 97 121
178
NOTES TO THE FINANCIAL STATEMENTS FOR THE YEAR ENDED 31 DECEMBER 2015 continued
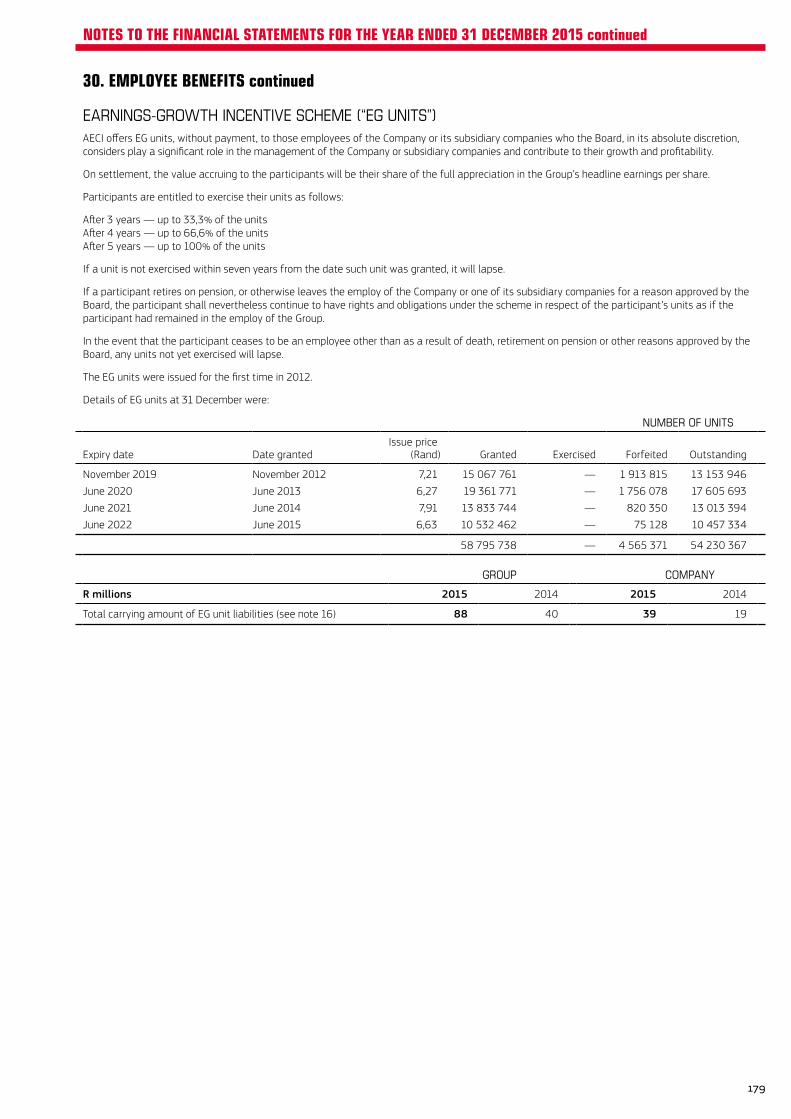
30. EMPLOYEE BENEFITS continued
EARNINGS-GROWTH INCENTIVE SCHEME (“EG UNITS”)AECI offers EG units, without payment, to those employees of the Company or its subsidiary companies who the Board, in its absolute discretion, considers play a significant role in the management of the Company or subsidiary companies and contribute to their growth and profitability.
On settlement, the value accruing to the participants will be their share of the full appreciation in the Group’s headline earnings per share.
Participants are entitled to exercise their units as follows:
After 3 years — up to 33,3% of the units After 4 years — up to 66,6% of the units After 5 years — up to 100% of the units
If a unit is not exercised within seven years from the date such unit was granted, it will lapse.
If a participant retires on pension, or otherwise leaves the employ of the Company or one of its subsidiary companies for a reason approved by the Board, the participant shall nevertheless continue to have rights and obligations under the scheme in respect of the participant’s units as if the participant had remained in the employ of the Group.
In the event that the participant ceases to be an employee other than as a result of death, retirement on pension or other reasons approved by the Board, any units not yet exercised will lapse.
The EG units were issued for the first time in 2012.
Details of EG units at 31 December were:
NUMBER OF UNITS
Expiry date Date grantedIssue price
(Rand) Granted Exercised Forfeited Outstanding
November 2019 November 2012 7,21 15 067 761 — 1 913 815 13 153 946
June 2020 June 2013 6,27 19 361 771 — 1 756 078 17 605 693
June 2021 June 2014 7,91 13 833 744 — 820 350 13 013 394
June 2022 June 2015 6,63 10 532 462 — 75 128 10 457 334
58 795 738 — 4 565 371 54 230 367
GROUP COMPANY
R millions 2015 2014 2015 2014
Total carrying amount of EG unit liabilities (see note 16) 88 40 39 19
179
NOTES TO THE FINANCIAL STATEMENTS FOR THE YEAR ENDED 31 DECEMBER 2015 continued
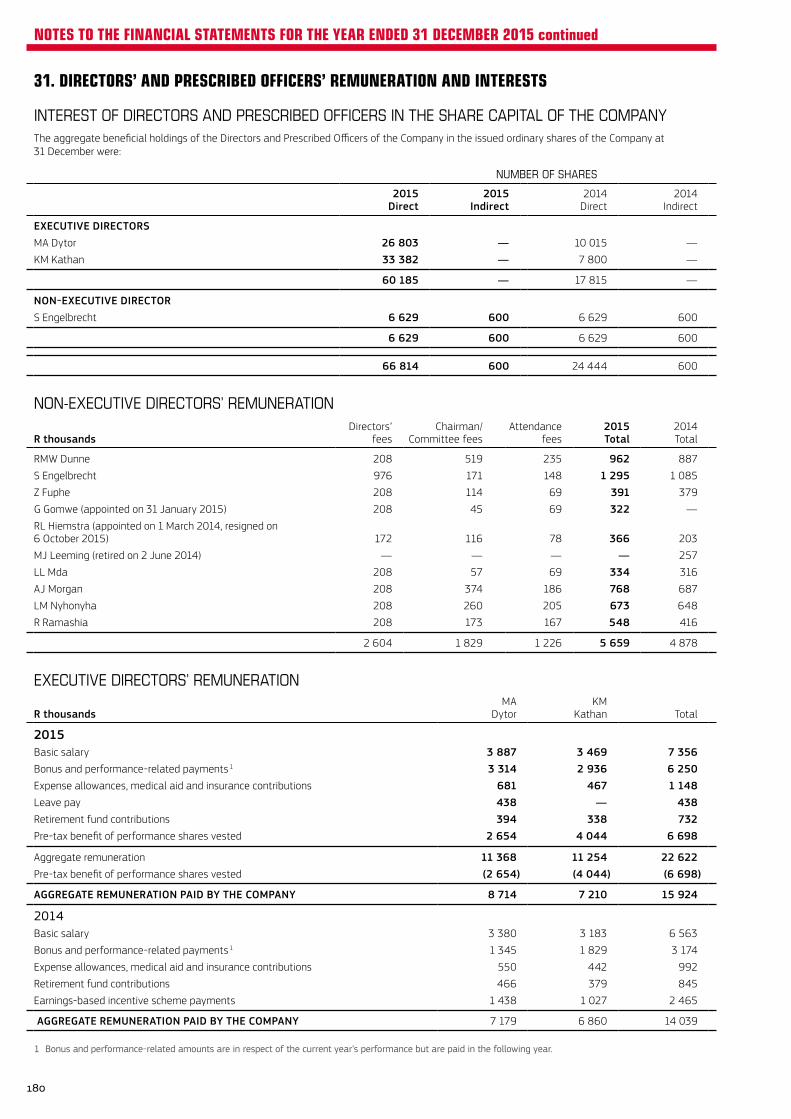
31. DIRECTORS’ AND PRESCRIBED OFFICERS’ REMUNERATION AND INTERESTS
INTEREST OF DIRECTORS AND PRESCRIBED OFFICERS IN THE SHARE CAPITAL OF THE COMPANYThe aggregate beneficial holdings of the Directors and Prescribed Officers of the Company in the issued ordinary shares of the Company at 31 December were:
NUMBER OF SHARES
2015Direct
2015Indirect
2014Direct
2014Indirect
EXECUTIVE DIRECTORSMA Dytor 26 803 — 10 015 —
KM Kathan 33 382 — 7 800 —
60 185 — 17 815 —
NON-EXECUTIVE DIRECTORS Engelbrecht 6 629 600 6 629 600
6 629 600 6 629 600
66 814 600 24 444 600
NON-EXECUTIVE DIRECTORS’ REMUNERATION
R thousandsDirectors’
feesChairman/
Committee feesAttendance
fees2015Total
2014Total
RMW Dunne 208 519 235 962 887
S Engelbrecht 976 171 148 1 295 1 085
Z Fuphe 208 114 69 391 379
G Gomwe (appointed on 31 January 2015) 208 45 69 322 —
RL Hiemstra (appointed on 1 March 2014, resigned on 6 October 2015) 172 116 78 366 203
MJ Leeming (retired on 2 June 2014) — — — — 257
LL Mda 208 57 69 334 316
AJ Morgan 208 374 186 768 687
LM Nyhonyha 208 260 205 673 648
R Ramashia 208 173 167 548 416
2 604 1 829 1 226 5 659 4 878
EXECUTIVE DIRECTORS’ REMUNERATION
R thousandsMA
Dytor KM
Kathan Total
2015Basic salary 3 887 3 469 7 356Bonus and performance-related payments 1 3 314 2 936 6 250Expense allowances, medical aid and insurance contributions 681 467 1 148Leave pay 438 — 438Retirement fund contributions 394 338 732Pre-tax benefit of performance shares vested 2 654 4 044 6 698
Aggregate remuneration 11 368 11 254 22 622Pre-tax benefit of performance shares vested (2 654) (4 044) (6 698)
AGGREGATE REMUNERATION PAID BY THE COMPANY 8 714 7 210 15 924
2014Basic salary 3 380 3 183 6 563
Bonus and performance-related payments 1 1 345 1 829 3 174
Expense allowances, medical aid and insurance contributions 550 442 992
Retirement fund contributions 466 379 845
Earnings-based incentive scheme payments 1 438 1 027 2 465
AGGREGATE REMUNERATION PAID BY THE COMPANY 7 179 6 860 14 039
1 Bonus and performance-related amounts are in respect of the current year’s performance but are paid in the following year.
180
NOTES TO THE FINANCIAL STATEMENTS FOR THE YEAR ENDED 31 DECEMBER 2015 continued

31. DIRECTORS’ AND PRESCRIBED OFFICERS’ REMUNERATION AND INTERESTS continued
PRESCRIBED OFFICERS’ REMUNERATION 1
R thousandsJAA
Diepenbroek 2EE
LudickMVK
MatshitseSM
Venter 3 Total
2015Basic salary — 2 541 2 421 1 061 6 023Bonus and performance-related payments 4 — 2 024 2 073 — 4 097Expense allowances, medical aid and insurance contributions — 424 370 164 958Retirement fund contributions — 247 236 114 597Benefit unit payments 5 — 421 — 601 1 022Earnings-based incentive scheme payments 6 — — — 697 697Pre-tax benefit of performance shares vested — 1 805 1 844 — 3 649
Aggregate remuneration — 7 462 6 944 2 637 17 043Pre-tax benefit of performance shares vested — (1 805) (1 844) — (3 649)Aggregate remuneration paid by subsidiaries — (3 270) — (1 339) (4 609)
AGGREGATE REMUNERATION PAID BY THE COMPANY — 2 387 5 100 1 298 8 785
2014Basic salary 561 2 129 2 262 2 605 7 557
Bonus and performance-related payments — 192 237 278 707
Expense allowances, medical aid and insurance contributions 100 436 347 451 1 334
Retirement fund contributions 220 260 661 309 1 450
Benefit unit payments 236 — — — 236
Earnings-based incentive scheme payments 2 229 1 324 — 1 254 4 807
Aggregate remuneration 3 346 4 341 3 507 4 897 16 091
Aggregate remuneration paid by subsidiaries (3 346) — — (4 897) (8 243)
AGGREGATE REMUNERATION PAID BY THE COMPANY — 4 341 3 507 — 7 848
AGGREGATE REMUNERATIONR thousands 2015 2014
Non-executive Directors 5 659 4 878
Executive Directors 22 622 14 039
Prescribed Officers 17 043 16 091
45 324 35 008
1 Members of the AECI Executive Committee exercise general control over the management of the business and activities of the Company. There are no other persons who exercise such control over the business or a significant portion thereof. Accordingly, the AECI Executive Committee members are the Company’s Prescribed Officers.
2 JAA Diepenbroek resigned with effect from 19 March 2014.3 SM Venter resigned with effect from 15 March 2015.4 Bonus and performance-related amounts are in respect of the current year’s performance but are paid in the following year.5 EE Ludick exercised 5 800 benefit units which generated a benefit of R421 834 before tax, and SM Venter exercised 9 866 benefit units which generated
a benefit of R600 589 before tax.6 SM Venter exercised 419 100 EBIS units which generated a benefit of R697 794 before tax.7 No compensation was paid to any Director, Prescribed Officer, past Directors or past Prescribed Officers for loss of office.8 There were no other pensions paid by the Company to any Directors, Prescribed Officers, past Directors or past Prescribed Officers of the Company.
181
NOTES TO THE FINANCIAL STATEMENTS FOR THE YEAR ENDED 31 DECEMBER 2015 continued
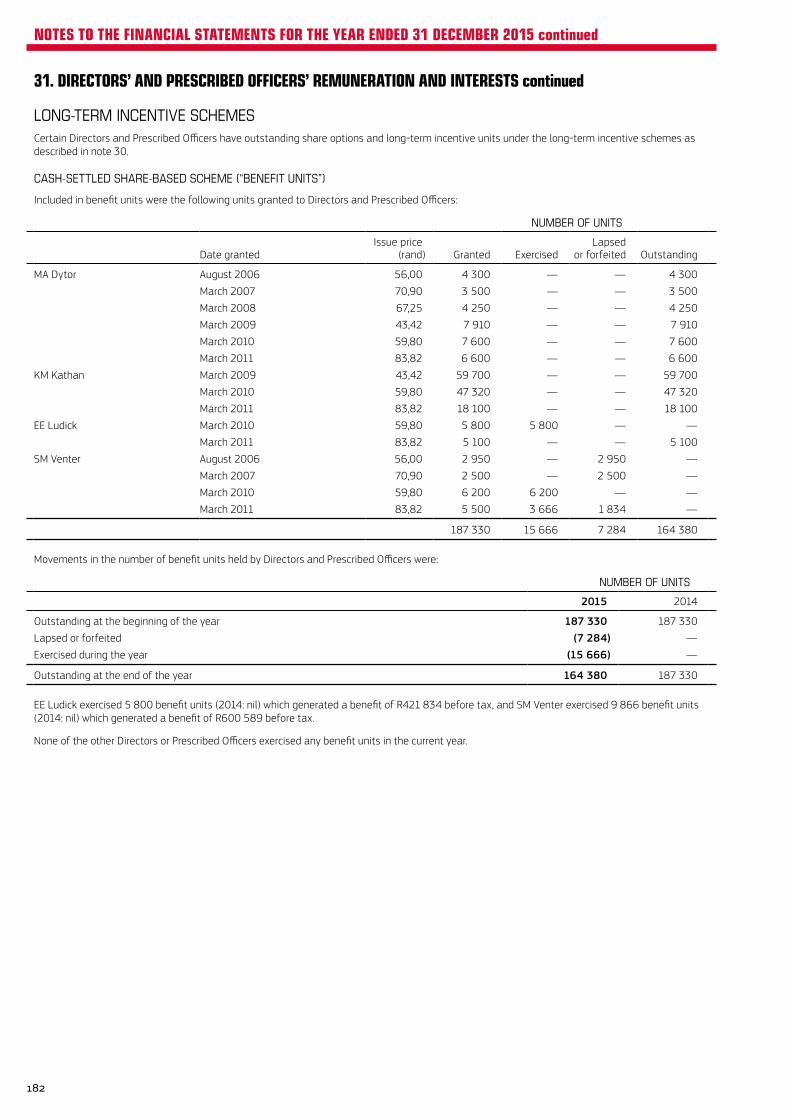
31. DIRECTORS’ AND PRESCRIBED OFFICERS’ REMUNERATION AND INTERESTS continued
LONG-TERM INCENTIVE SCHEMESCertain Directors and Prescribed Officers have outstanding share options and long-term incentive units under the long-term incentive schemes as described in note 30.
CASH-SETTLED SHARE-BASED SCHEME (“BENEFIT UNITS”)
Included in benefit units were the following units granted to Directors and Prescribed Officers:
NUMBER OF UNITS
Date grantedIssue price
(rand) Granted ExercisedLapsed
or forfeited Outstanding
MA Dytor August 2006 56,00 4 300 — — 4 300
March 2007 70,90 3 500 — — 3 500
March 2008 67,25 4 250 — — 4 250
March 2009 43,42 7 910 — — 7 910
March 2010 59,80 7 600 — — 7 600
March 2011 83,82 6 600 — — 6 600
KM Kathan March 2009 43,42 59 700 — — 59 700
March 2010 59,80 47 320 — — 47 320
March 2011 83,82 18 100 — — 18 100
EE Ludick March 2010 59,80 5 800 5 800 — —
March 2011 83,82 5 100 — — 5 100
SM Venter August 2006 56,00 2 950 — 2 950 —
March 2007 70,90 2 500 — 2 500 —
March 2010 59,80 6 200 6 200 — —
March 2011 83,82 5 500 3 666 1 834 —
187 330 15 666 7 284 164 380
Movements in the number of benefit units held by Directors and Prescribed Officers were:
NUMBER OF UNITS
2015 2014
Outstanding at the beginning of the year 187 330 187 330
Lapsed or forfeited (7 284) —
Exercised during the year (15 666) —
Outstanding at the end of the year 164 380 187 330
EE Ludick exercised 5 800 benefit units (2014: nil) which generated a benefit of R421 834 before tax, and SM Venter exercised 9 866 benefit units (2014: nil) which generated a benefit of R600 589 before tax.
None of the other Directors or Prescribed Officers exercised any benefit units in the current year.
182
NOTES TO THE FINANCIAL STATEMENTS FOR THE YEAR ENDED 31 DECEMBER 2015 continued
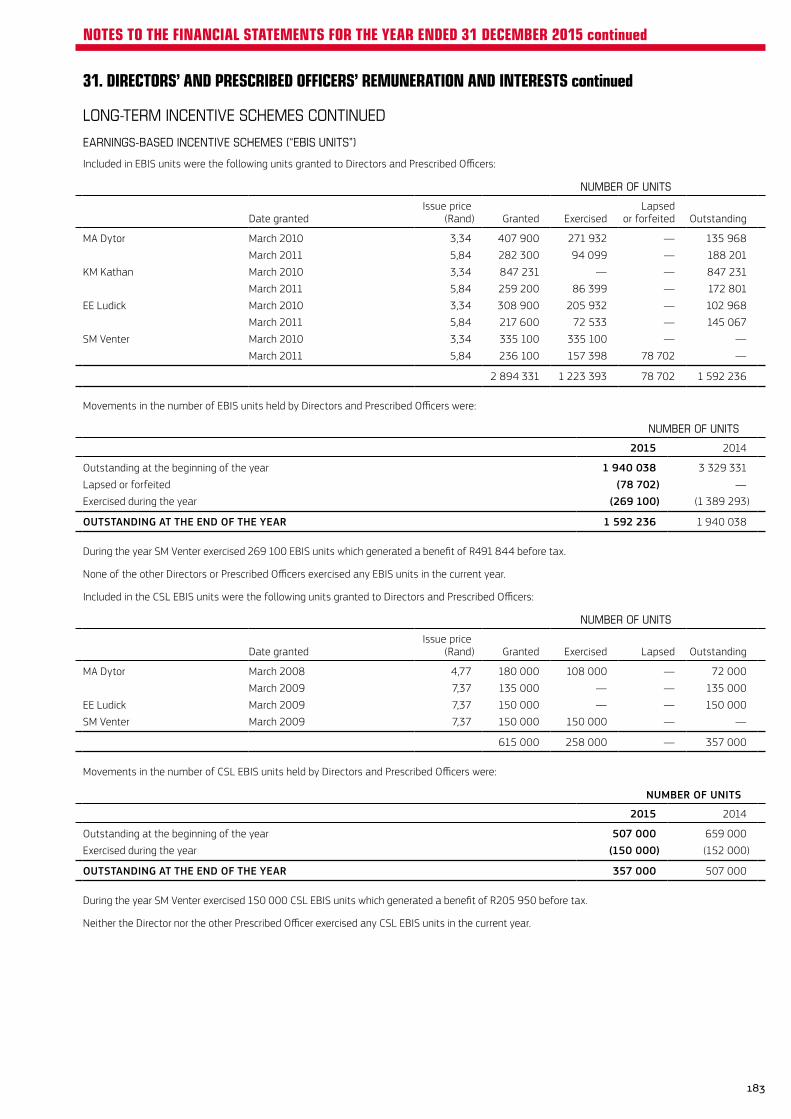
31. DIRECTORS’ AND PRESCRIBED OFFICERS’ REMUNERATION AND INTERESTS continued
LONG-TERM INCENTIVE SCHEMES CONTINUED
EARNINGS-BASED INCENTIVE SCHEMES (“EBIS UNITS”)
Included in EBIS units were the following units granted to Directors and Prescribed Officers:
NUMBER OF UNITS
Date grantedIssue price
(Rand) Granted ExercisedLapsed
or forfeited Outstanding
MA Dytor March 2010 3,34 407 900 271 932 — 135 968
March 2011 5,84 282 300 94 099 — 188 201
KM Kathan March 2010 3,34 847 231 — — 847 231
March 2011 5,84 259 200 86 399 — 172 801
EE Ludick March 2010 3,34 308 900 205 932 — 102 968
March 2011 5,84 217 600 72 533 — 145 067
SM Venter March 2010 3,34 335 100 335 100 — —
March 2011 5,84 236 100 157 398 78 702 —
2 894 331 1 223 393 78 702 1 592 236
Movements in the number of EBIS units held by Directors and Prescribed Officers were:
NUMBER OF UNITS
2015 2014
Outstanding at the beginning of the year 1 940 038 3 329 331
Lapsed or forfeited (78 702) —
Exercised during the year (269 100) (1 389 293)
OUTSTANDING AT THE END OF THE YEAR 1 592 236 1 940 038
During the year SM Venter exercised 269 100 EBIS units which generated a benefit of R491 844 before tax.
None of the other Directors or Prescribed Officers exercised any EBIS units in the current year.
Included in the CSL EBIS units were the following units granted to Directors and Prescribed Officers:
NUMBER OF UNITS
Date grantedIssue price
(Rand) Granted Exercised Lapsed Outstanding
MA Dytor March 2008 4,77 180 000 108 000 — 72 000
March 2009 7,37 135 000 — — 135 000
EE Ludick March 2009 7,37 150 000 — — 150 000
SM Venter March 2009 7,37 150 000 150 000 — —
615 000 258 000 — 357 000
Movements in the number of CSL EBIS units held by Directors and Prescribed Officers were:
NUMBER OF UNITS
2015 2014
Outstanding at the beginning of the year 507 000 659 000
Exercised during the year (150 000) (152 000)
OUTSTANDING AT THE END OF THE YEAR 357 000 507 000
During the year SM Venter exercised 150 000 CSL EBIS units which generated a benefit of R205 950 before tax.
Neither the Director nor the other Prescribed Officer exercised any CSL EBIS units in the current year.
183
NOTES TO THE FINANCIAL STATEMENTS FOR THE YEAR ENDED 31 DECEMBER 2015 continued
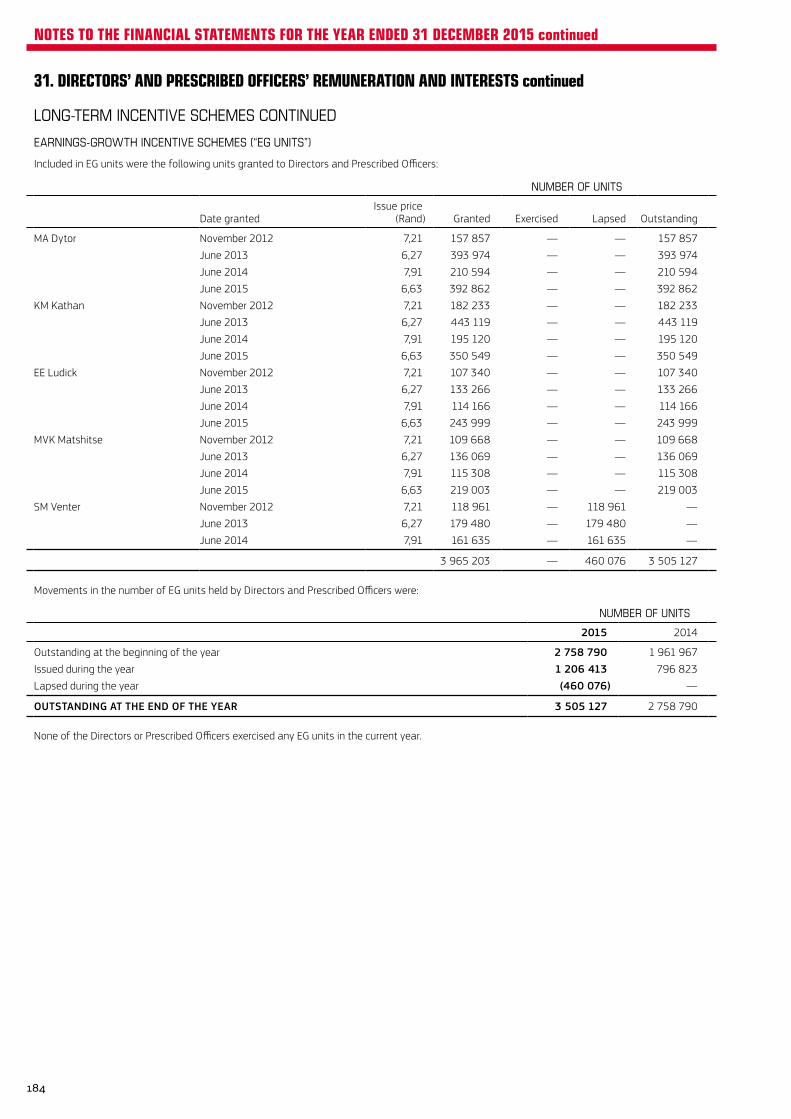
31. DIRECTORS’ AND PRESCRIBED OFFICERS’ REMUNERATION AND INTERESTS continued
LONG-TERM INCENTIVE SCHEMES CONTINUED
EARNINGS-GROWTH INCENTIVE SCHEMES (“EG UNITS”)
Included in EG units were the following units granted to Directors and Prescribed Officers:
NUMBER OF UNITS
Date grantedIssue price
(Rand) Granted Exercised Lapsed Outstanding
MA Dytor November 2012 7,21 157 857 — — 157 857
June 2013 6,27 393 974 — — 393 974
June 2014 7,91 210 594 — — 210 594
June 2015 6,63 392 862 — — 392 862
KM Kathan November 2012 7,21 182 233 — — 182 233
June 2013 6,27 443 119 — — 443 119
June 2014 7,91 195 120 — — 195 120
June 2015 6,63 350 549 — — 350 549
EE Ludick November 2012 7,21 107 340 — — 107 340
June 2013 6,27 133 266 — — 133 266
June 2014 7,91 114 166 — — 114 166
June 2015 6,63 243 999 — — 243 999
MVK Matshitse November 2012 7,21 109 668 — — 109 668
June 2013 6,27 136 069 — — 136 069
June 2014 7,91 115 308 — — 115 308
June 2015 6,63 219 003 — — 219 003
SM Venter November 2012 7,21 118 961 — 118 961 —
June 2013 6,27 179 480 — 179 480 —
June 2014 7,91 161 635 — 161 635 —
3 965 203 — 460 076 3 505 127
Movements in the number of EG units held by Directors and Prescribed Officers were:
NUMBER OF UNITS
2015 2014
Outstanding at the beginning of the year 2 758 790 1 961 967
Issued during the year 1 206 413 796 823
Lapsed during the year (460 076) —
OUTSTANDING AT THE END OF THE YEAR 3 505 127 2 758 790
None of the Directors or Prescribed Officers exercised any EG units in the current year.
184
NOTES TO THE FINANCIAL STATEMENTS FOR THE YEAR ENDED 31 DECEMBER 2015 continued
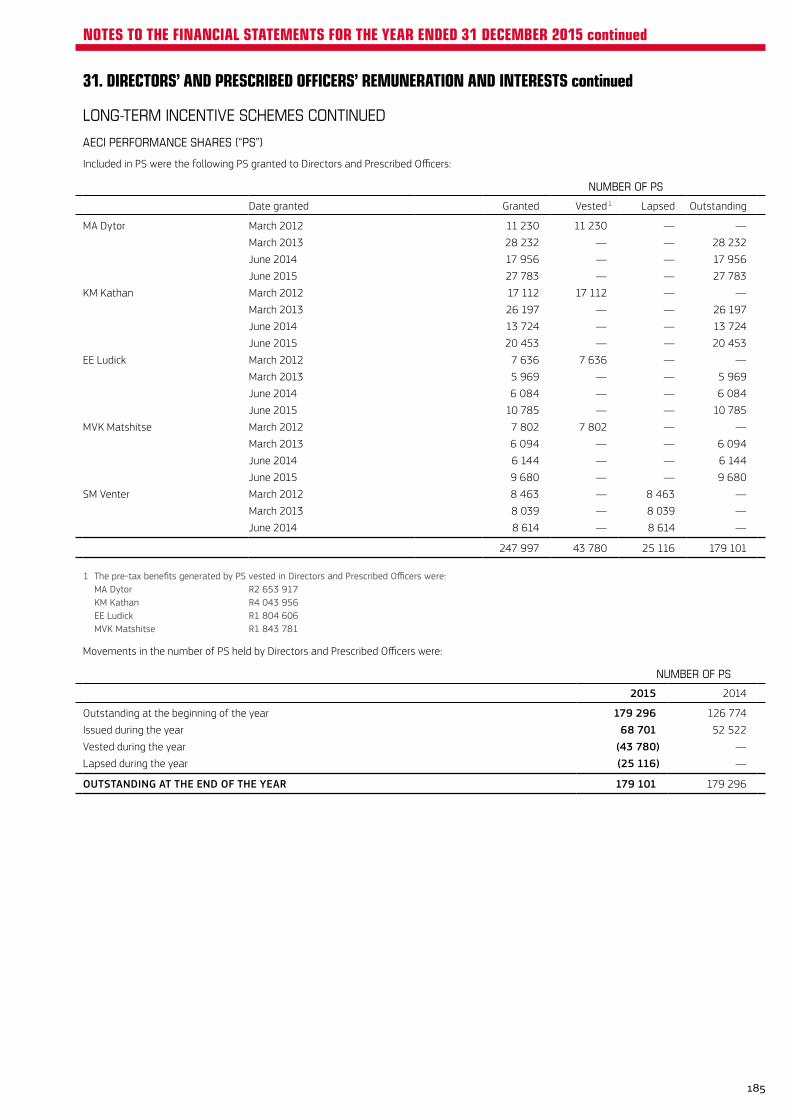
31. DIRECTORS’ AND PRESCRIBED OFFICERS’ REMUNERATION AND INTERESTS continued
LONG-TERM INCENTIVE SCHEMES CONTINUED
AECI PERFORMANCE SHARES (“PS”)
Included in PS were the following PS granted to Directors and Prescribed Officers:
NUMBER OF PS
Date granted Granted Vested 1 Lapsed Outstanding
MA Dytor March 2012 11 230 11 230 — —
March 2013 28 232 — — 28 232
June 2014 17 956 — — 17 956
June 2015 27 783 — — 27 783
KM Kathan March 2012 17 112 17 112 — —
March 2013 26 197 — — 26 197
June 2014 13 724 — — 13 724
June 2015 20 453 — — 20 453
EE Ludick March 2012 7 636 7 636 — —
March 2013 5 969 — — 5 969
June 2014 6 084 — — 6 084
June 2015 10 785 — — 10 785
MVK Matshitse March 2012 7 802 7 802 — —
March 2013 6 094 — — 6 094
June 2014 6 144 — — 6 144
June 2015 9 680 — — 9 680
SM Venter March 2012 8 463 — 8 463 —
March 2013 8 039 — 8 039 —
June 2014 8 614 — 8 614 —
247 997 43 780 25 116 179 101
1 The pre-tax benefits generated by PS vested in Directors and Prescribed Officers were: MA Dytor R2 653 917 KM Kathan R4 043 956 EE Ludick R1 804 606 MVK Matshitse R1 843 781
Movements in the number of PS held by Directors and Prescribed Officers were:
NUMBER OF PS
2015 2014
Outstanding at the beginning of the year 179 296 126 774
Issued during the year 68 701 52 522
Vested during the year (43 780) —
Lapsed during the year (25 116) —
OUTSTANDING AT THE END OF THE YEAR 179 101 179 296
185
NOTES TO THE FINANCIAL STATEMENTS FOR THE YEAR ENDED 31 DECEMBER 2015 continued
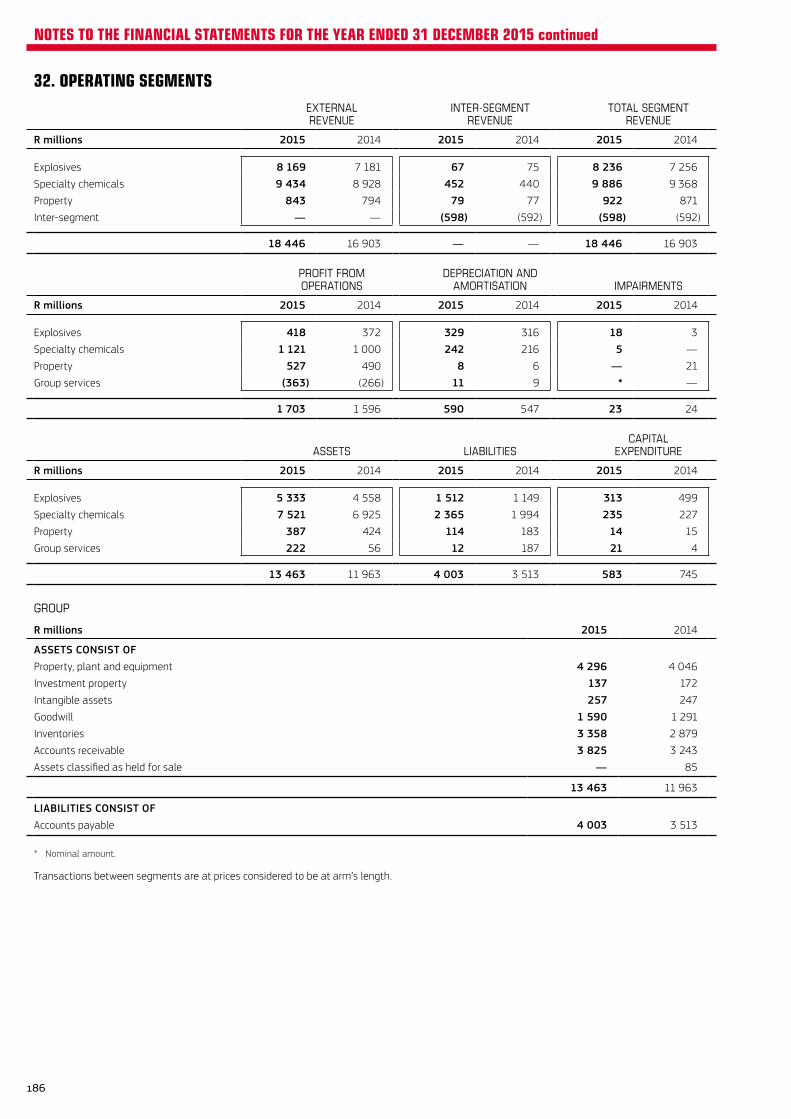
32. OPERATING SEGMENTSEXTERNALREVENUE
INTER-SEGMENTREVENUE
TOTAL SEGMENTREVENUE
R millions 2015 2014 2015 2014 2015 2014
Explosives 8 169 7 181 67 75 8 236 7 256
Specialty chemicals 9 434 8 928 452 440 9 886 9 368
Property 843 794 79 77 922 871
Inter-segment — — (598) (592) (598) (592)
18 446 16 903 — — 18 446 16 903
PROFIT FROMOPERATIONS
DEPRECIATION ANDAMORTISATION IMPAIRMENTS
R millions 2015 2014 2015 2014 2015 2014
Explosives 418 372 329 316 18 3
Specialty chemicals 1 121 1 000 242 216 5 —
Property 527 490 8 6 — 21
Group services (363) (266) 11 9 * —
1 703 1 596 590 547 23 24
ASSETS LIABILITIESCAPITAL
EXPENDITURE
R millions 2015 2014 2015 2014 2015 2014
Explosives 5 333 4 558 1 512 1 149 313 499
Specialty chemicals 7 521 6 925 2 365 1 994 235 227
Property 387 424 114 183 14 15
Group services 222 56 12 187 21 4
13 463 11 963 4 003 3 513 583 745
GROUP
R millions 2015 2014
ASSETS CONSIST OFProperty, plant and equipment 4 296 4 046
Investment property 137 172
Intangible assets 257 247
Goodwill 1 590 1 291
Inventories 3 358 2 879
Accounts receivable 3 825 3 243
Assets classified as held for sale — 85
13 463 11 963
LIABILITIES CONSIST OFAccounts payable 4 003 3 513
* Nominal amount.
Transactions between segments are at prices considered to be at arm’s length.
186
NOTES TO THE FINANCIAL STATEMENTS FOR THE YEAR ENDED 31 DECEMBER 2015 continued
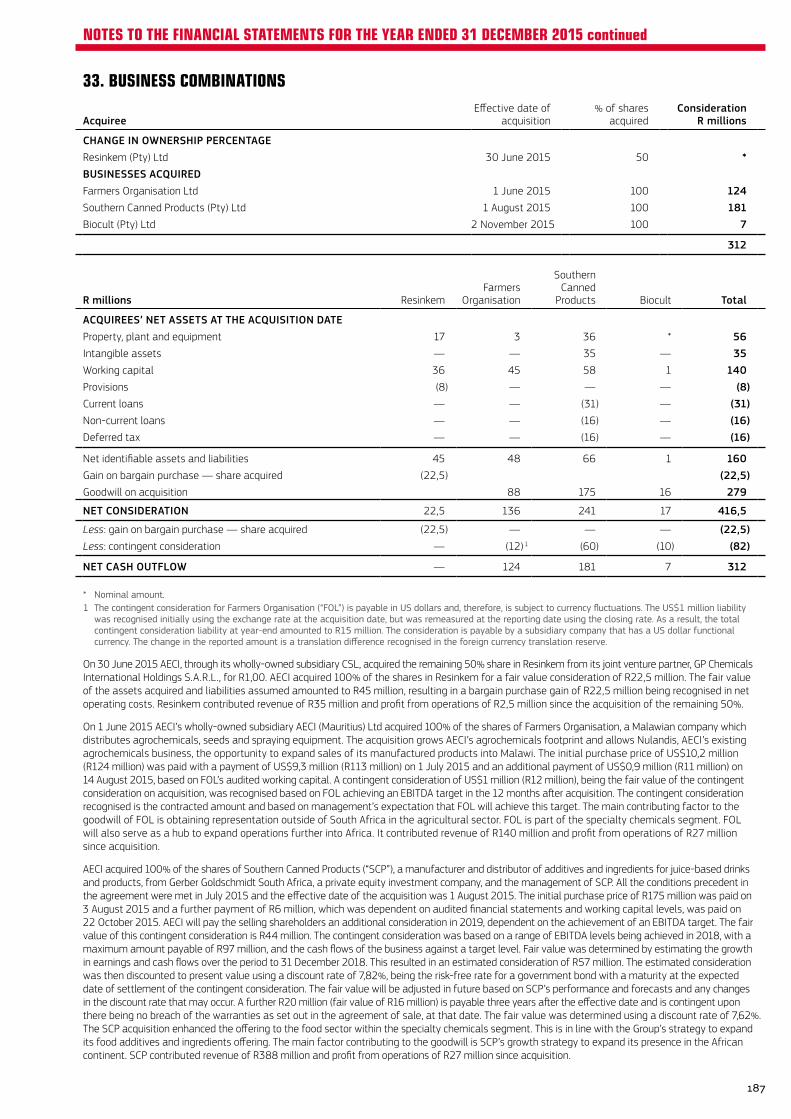
33. BUSINESS COMBINATIONS
AcquireeEffective date of
acquisition% of shares
acquiredConsideration
R millions
CHANGE IN OWNERSHIP PERCENTAGEResinkem (Pty) Ltd 30 June 2015 50 *BUSINESSES ACQUIREDFarmers Organisation Ltd 1 June 2015 100 124Southern Canned Products (Pty) Ltd 1 August 2015 100 181Biocult (Pty) Ltd 2 November 2015 100 7
312
R millions ResinkemFarmers
Organisation
SouthernCanned
Products Biocult Total
ACQUIREES’ NET ASSETS AT THE ACQUISITION DATEProperty, plant and equipment 17 3 36 * 56Intangible assets — — 35 — 35Working capital 36 45 58 1 140Provisions (8) — — — (8)Current loans — — (31) — (31)Non-current loans — — (16) — (16)Deferred tax — — (16) — (16)
Net identifiable assets and liabilities 45 48 66 1 160Gain on bargain purchase — share acquired (22,5) (22,5)Goodwill on acquisition 88 175 16 279
NET CONSIDERATION 22,5 136 241 17 416,5
Less: gain on bargain purchase — share acquired (22,5) — — — (22,5)Less: contingent consideration — (12) 1 (60) (10) (82)
NET CASH OUTFLOW — 124 181 7 312
* Nominal amount.1 The contingent consideration for Farmers Organisation (“FOL”) is payable in US dollars and, therefore, is subject to currency fluctuations. The US$1 million liability
was recognised initially using the exchange rate at the acquisition date, but was remeasured at the reporting date using the closing rate. As a result, the total contingent consideration liability at year-end amounted to R15 million. The consideration is payable by a subsidiary company that has a US dollar functional currency. The change in the reported amount is a translation difference recognised in the foreign currency translation reserve.
On 30 June 2015 AECI, through its wholly-owned subsidiary CSL, acquired the remaining 50% share in Resinkem from its joint venture partner, GP Chemicals International Holdings S.A.R.L., for R1,00. AECI acquired 100% of the shares in Resinkem for a fair value consideration of R22,5 million. The fair value of the assets acquired and liabilities assumed amounted to R45 million, resulting in a bargain purchase gain of R22,5 million being recognised in net operating costs. Resinkem contributed revenue of R35 million and profit from operations of R2,5 million since the acquisition of the remaining 50%.
On 1 June 2015 AECI’s wholly-owned subsidiary AECI (Mauritius) Ltd acquired 100% of the shares of Farmers Organisation, a Malawian company which distributes agrochemicals, seeds and spraying equipment. The acquisition grows AECI’s agrochemicals footprint and allows Nulandis, AECI’s existing agrochemicals business, the opportunity to expand sales of its manufactured products into Malawi. The initial purchase price of US$10,2 million (R124 million) was paid with a payment of US$9,3 million (R113 million) on 1 July 2015 and an additional payment of US$0,9 million (R11 million) on 14 August 2015, based on FOL’s audited working capital. A contingent consideration of US$1 million (R12 million), being the fair value of the contingent consideration on acquisition, was recognised based on FOL achieving an EBITDA target in the 12 months after acquisition. The contingent consideration recognised is the contracted amount and based on management’s expectation that FOL will achieve this target. The main contributing factor to the goodwill of FOL is obtaining representation outside of South Africa in the agricultural sector. FOL is part of the specialty chemicals segment. FOL will also serve as a hub to expand operations further into Africa. It contributed revenue of R140 million and profit from operations of R27 million since acquisition.
AECI acquired 100% of the shares of Southern Canned Products (“SCP”), a manufacturer and distributor of additives and ingredients for juice-based drinks and products, from Gerber Goldschmidt South Africa, a private equity investment company, and the management of SCP. All the conditions precedent in the agreement were met in July 2015 and the effective date of the acquisition was 1 August 2015. The initial purchase price of R175 million was paid on 3 August 2015 and a further payment of R6 million, which was dependent on audited financial statements and working capital levels, was paid on 22 October 2015. AECI will pay the selling shareholders an additional consideration in 2019, dependent on the achievement of an EBITDA target. The fair value of this contingent consideration is R44 million. The contingent consideration was based on a range of EBITDA levels being achieved in 2018, with a maximum amount payable of R97 million, and the cash flows of the business against a target level. Fair value was determined by estimating the growth in earnings and cash flows over the period to 31 December 2018. This resulted in an estimated consideration of R57 million. The estimated consideration was then discounted to present value using a discount rate of 7,82%, being the risk-free rate for a government bond with a maturity at the expected date of settlement of the contingent consideration. The fair value will be adjusted in future based on SCP’s performance and forecasts and any changes in the discount rate that may occur. A further R20 million (fair value of R16 million) is payable three years after the effective date and is contingent upon there being no breach of the warranties as set out in the agreement of sale, at that date. The fair value was determined using a discount rate of 7,62%. The SCP acquisition enhanced the offering to the food sector within the specialty chemicals segment. This is in line with the Group’s strategy to expand its food additives and ingredients offering. The main factor contributing to the goodwill is SCP’s growth strategy to expand its presence in the African continent. SCP contributed revenue of R388 million and profit from operations of R27 million since acquisition.
187
NOTES TO THE FINANCIAL STATEMENTS FOR THE YEAR ENDED 31 DECEMBER 2015 continued
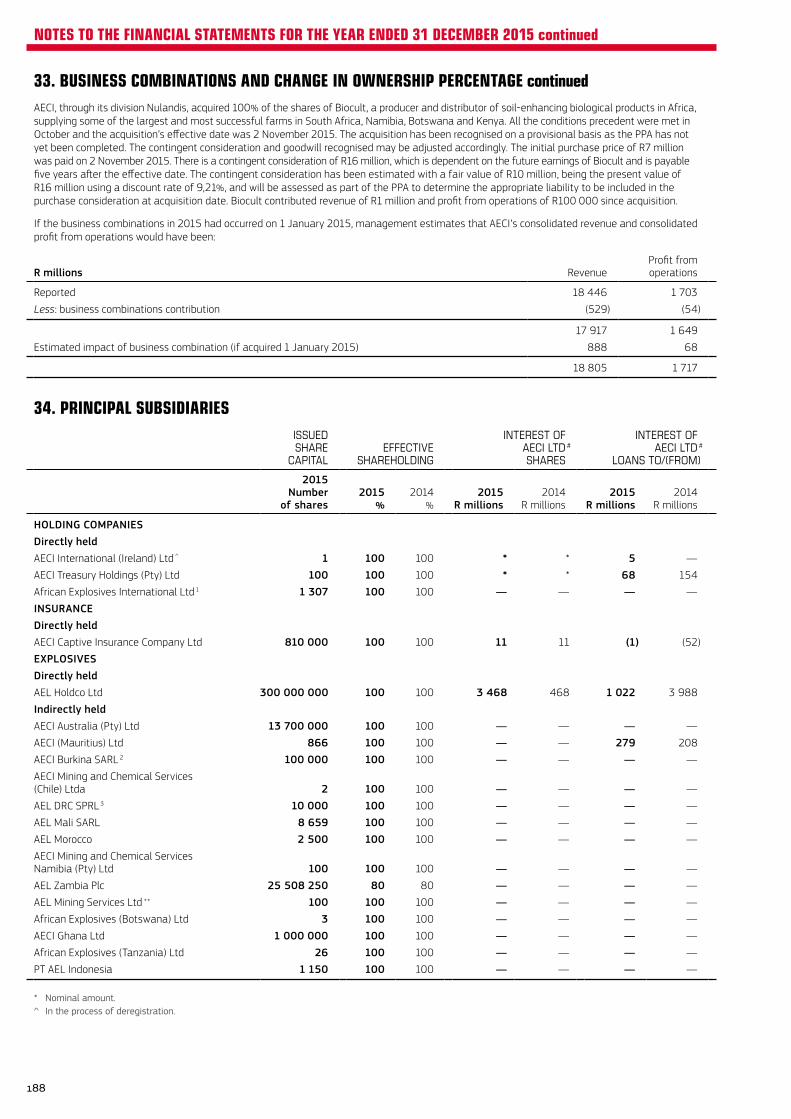
33. BUSINESS COMBINATIONS AND CHANGE IN OWNERSHIP PERCENTAGE continuedAECI, through its division Nulandis, acquired 100% of the shares of Biocult, a producer and distributor of soil-enhancing biological products in Africa, supplying some of the largest and most successful farms in South Africa, Namibia, Botswana and Kenya. All the conditions precedent were met in October and the acquisition’s effective date was 2 November 2015. The acquisition has been recognised on a provisional basis as the PPA has not yet been completed. The contingent consideration and goodwill recognised may be adjusted accordingly. The initial purchase price of R7 million was paid on 2 November 2015. There is a contingent consideration of R16 million, which is dependent on the future earnings of Biocult and is payable five years after the effective date. The contingent consideration has been estimated with a fair value of R10 million, being the present value of R16 million using a discount rate of 9,21%, and will be assessed as part of the PPA to determine the appropriate liability to be included in the purchase consideration at acquisition date. Biocult contributed revenue of R1 million and profit from operations of R100 000 since acquisition.
If the business combinations in 2015 had occurred on 1 January 2015, management estimates that AECI’s consolidated revenue and consolidated profit from operations would have been:
R millions RevenueProfit fromoperations
Reported 18 446 1 703
Less: business combinations contribution (529) (54)
17 917 1 649
Estimated impact of business combination (if acquired 1 January 2015) 888 68
18 805 1 717
34. PRINCIPAL SUBSIDIARIESISSUEDSHARE
CAPITALEFFECTIVE
SHAREHOLDING
INTEREST OFAECI LTD #SHARES
INTEREST OFAECI LTD #
LOANS TO/(FROM)
2015Number
of shares2015
%2014
%2015
R millions2014
R millions2015
R millions2014
R millions
HOLDING COMPANIESDirectly heldAECI International (Ireland) Ltd ̂ 1 100 100 * * 5 —
AECI Treasury Holdings (Pty) Ltd 100 100 100 * * 68 154
African Explosives International Ltd 1 1 307 100 100 — — — —
INSURANCEDirectly heldAECI Captive Insurance Company Ltd 810 000 100 100 11 11 (1) (52)
EXPLOSIVESDirectly heldAEL Holdco Ltd 300 000 000 100 100 3 468 468 1 022 3 988
Indirectly heldAECI Australia (Pty) Ltd 13 700 000 100 100 — — — —
AECI (Mauritius) Ltd 866 100 100 — — 279 208
AECI Burkina SARL 2 100 000 100 100 — — — —
AECI Mining and Chemical Services (Chile) Ltda 2 100 100 — — — —
AEL DRC SPRL 3 10 000 100 100 — — — —
AEL Mali SARL 8 659 100 100 — — — —
AEL Morocco 2 500 100 100 — — — —
AECI Mining and Chemical Services Namibia (Pty) Ltd 100 100 100 — — — —
AEL Zambia Plc 25 508 250 80 80 — — — —
AEL Mining Services Ltd ++ 100 100 100 — — — —
African Explosives (Botswana) Ltd 3 100 100 — — — —
AECI Ghana Ltd 1 000 000 100 100 — — — —
African Explosives (Tanzania) Ltd 26 100 100 — — — —
PT AEL Indonesia 1 150 100 100 — — — —
* Nominal amount.^ In the process of deregistration.
188
NOTES TO THE FINANCIAL STATEMENTS FOR THE YEAR ENDED 31 DECEMBER 2015 continued
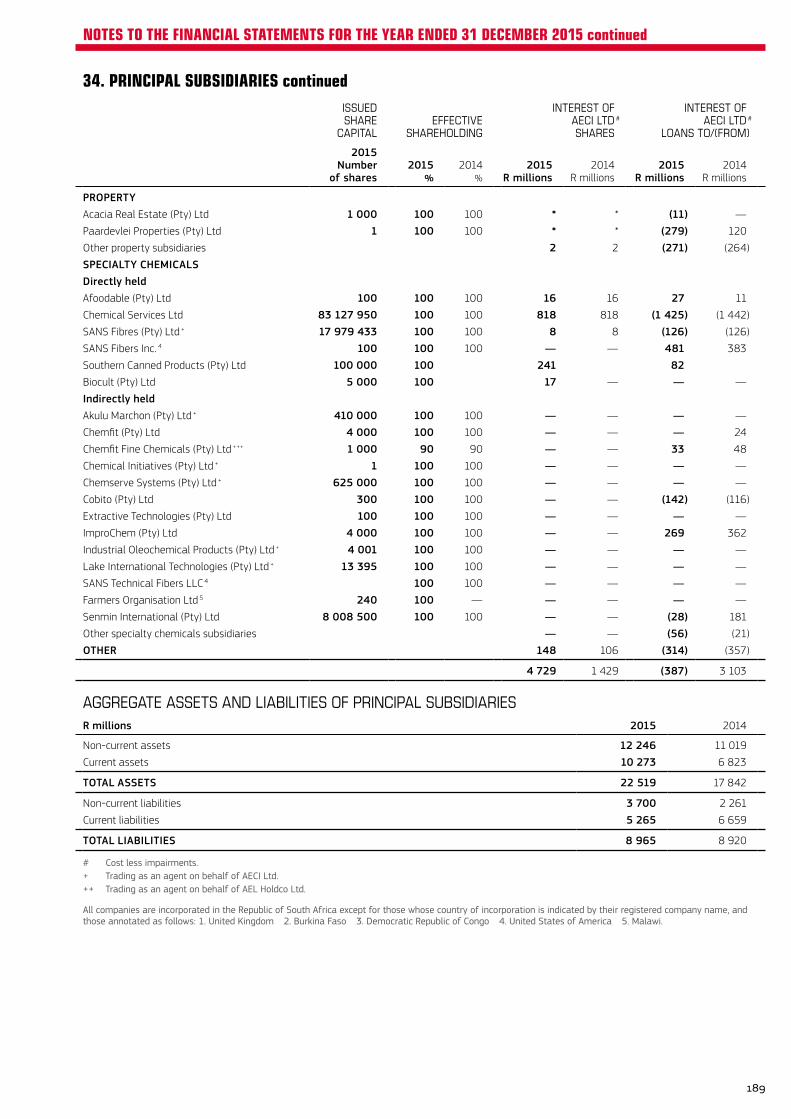
34. PRINCIPAL SUBSIDIARIES continuedISSUEDSHARE
CAPITALEFFECTIVE
SHAREHOLDING
INTEREST OFAECI LTD #SHARES
INTEREST OFAECI LTD #
LOANS TO/(FROM)
2015Number
of shares2015
%2014
%2015
R millions2014
R millions2015
R millions2014
R millions
PROPERTYAcacia Real Estate (Pty) Ltd 1 000 100 100 * * (11) —
Paardevlei Properties (Pty) Ltd 1 100 100 * * (279) 120
Other property subsidiaries 2 2 (271) (264)
SPECIALTY CHEMICALSDirectly heldAfoodable (Pty) Ltd 100 100 100 16 16 27 11
Chemical Services Ltd 83 127 950 100 100 818 818 (1 425) (1 442)
SANS Fibres (Pty) Ltd + 17 979 433 100 100 8 8 (126) (126)
SANS Fibers Inc. 4 100 100 100 — — 481 383
Southern Canned Products (Pty) Ltd 100 000 100 241 82Biocult (Pty) Ltd 5 000 100 17 — — —
Indirectly heldAkulu Marchon (Pty) Ltd + 410 000 100 100 — — — —
Chemfit (Pty) Ltd 4 000 100 100 — — — 24
Chemfit Fine Chemicals (Pty) Ltd +++ 1 000 90 90 — — 33 48
Chemical Initiatives (Pty) Ltd + 1 100 100 — — — —
Chemserve Systems (Pty) Ltd + 625 000 100 100 — — — —
Cobito (Pty) Ltd 300 100 100 — — (142) (116)
Extractive Technologies (Pty) Ltd 100 100 100 — — — —
ImproChem (Pty) Ltd 4 000 100 100 — — 269 362
Industrial Oleochemical Products (Pty) Ltd + 4 001 100 100 — — — —
Lake International Technologies (Pty) Ltd + 13 395 100 100 — — — —
SANS Technical Fibers LLC 4 100 100 — — — —
Farmers Organisation Ltd 5 240 100 — — — — —
Senmin International (Pty) Ltd 8 008 500 100 100 — — (28) 181
Other specialty chemicals subsidiaries — — (56) (21)
OTHER 148 106 (314) (357)
4 729 1 429 (387) 3 103
AGGREGATE ASSETS AND LIABILITIES OF PRINCIPAL SUBSIDIARIESR millions 2015 2014
Non-current assets 12 246 11 019
Current assets 10 273 6 823
TOTAL ASSETS 22 519 17 842
Non-current liabilities 3 700 2 261
Current liabilities 5 265 6 659
TOTAL LIABILITIES 8 965 8 920
# Cost less impairments.+ Trading as an agent on behalf of AECI Ltd.++ Trading as an agent on behalf of AEL Holdco Ltd.
All companies are incorporated in the Republic of South Africa except for those whose country of incorporation is indicated by their registered company name, and those annotated as follows: 1. United Kingdom 2. Burkina Faso 3. Democratic Republic of Congo 4. United States of America 5. Malawi.
189
NOTES TO THE FINANCIAL STATEMENTS FOR THE YEAR ENDED 31 DECEMBER 2015 continued
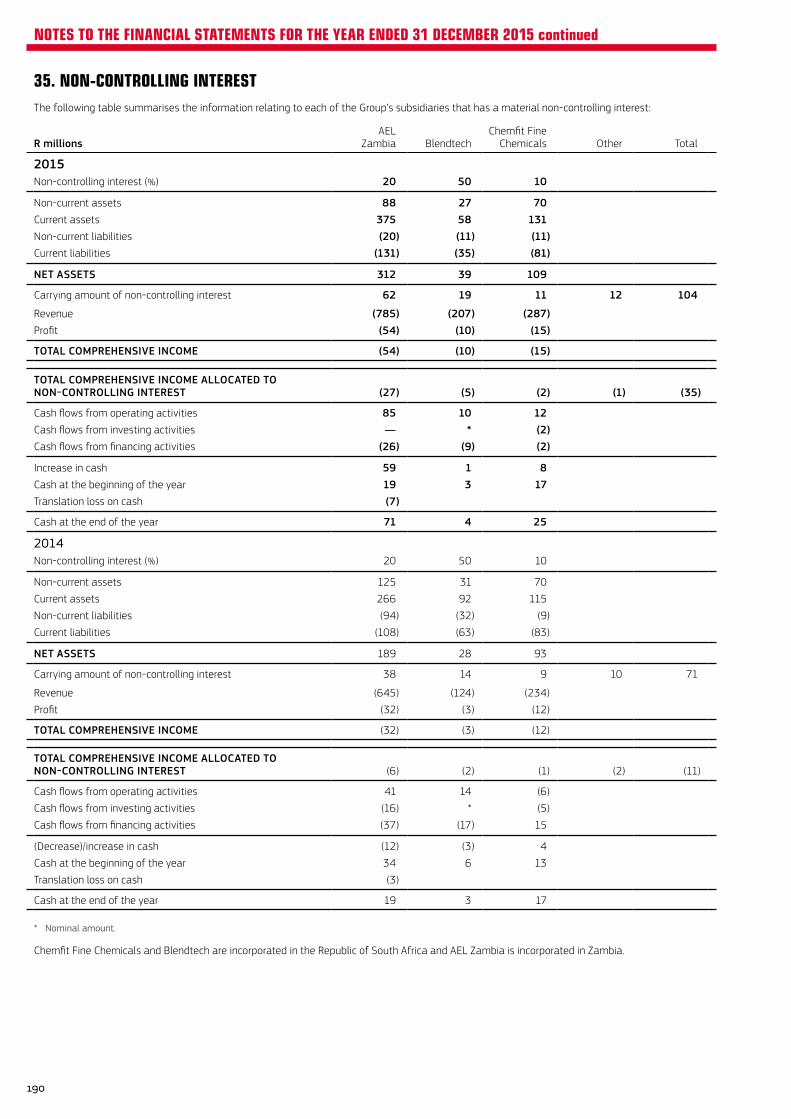
35. NON-CONTROLLING INTERESTThe following table summarises the information relating to each of the Group’s subsidiaries that has a material non-controlling interest:
R millionsAEL
Zambia Blendtech Chemfit Fine
Chemicals Other Total
2015Non-controlling interest (%) 20 50 10
Non-current assets 88 27 70Current assets 375 58 131Non-current liabilities (20) (11) (11)Current liabilities (131) (35) (81)
NET ASSETS 312 39 109
Carrying amount of non-controlling interest 62 19 11 12 104
Revenue (785) (207) (287)Profit (54) (10) (15)
TOTAL COMPREHENSIVE INCOME (54) (10) (15)
TOTAL COMPREHENSIVE INCOME ALLOCATED TO NON-CONTROLLING INTEREST (27) (5) (2) (1) (35)
Cash flows from operating activities 85 10 12Cash flows from investing activities — * (2)Cash flows from financing activities (26) (9) (2)
Increase in cash 59 1 8Cash at the beginning of the year 19 3 17Translation loss on cash (7)
Cash at the end of the year 71 4 25
2014Non-controlling interest (%) 20 50 10
Non-current assets 125 31 70
Current assets 266 92 115
Non-current liabilities (94) (32) (9)
Current liabilities (108) (63) (83)
NET ASSETS 189 28 93
Carrying amount of non-controlling interest 38 14 9 10 71
Revenue (645) (124) (234)
Profit (32) (3) (12)
TOTAL COMPREHENSIVE INCOME (32) (3) (12)
TOTAL COMPREHENSIVE INCOME ALLOCATED TO NON-CONTROLLING INTEREST (6) (2) (1) (2) (11)
Cash flows from operating activities 41 14 (6)
Cash flows from investing activities (16) * (5)
Cash flows from financing activities (37) (17) 15
(Decrease)/increase in cash (12) (3) 4
Cash at the beginning of the year 34 6 13
Translation loss on cash (3)
Cash at the end of the year 19 3 17
* Nominal amount.
Chemfit Fine Chemicals and Blendtech are incorporated in the Republic of South Africa and AEL Zambia is incorporated in Zambia.
190
NOTES TO THE FINANCIAL STATEMENTS FOR THE YEAR ENDED 31 DECEMBER 2015 continued
36. SETTLEMENT OF POST-RETIREMENT MEDICAL AID OBLIGATIONSIn December 2015 the Group made a voluntary alternative benefit offer to active employees entitled to a post-retirement medical aid subsidy. The offer comprises a lump sum contribution to the member’s pension/provident fund which will vest immediately. The lump sum was calculated as the present value of the amount required to purchase an annuity, at retirement, equal to the medical aid subsidy obligation increased by 2,5% for each year of employment with the Group in excess of 10 years (determined at 31 January 2016), up to a maximum of 25%. This has the effect that the targeted annuity will be up to 25% greater than the employer subsidy amount. The lump sums are to be funded from the ESA in each relevant retirement fund. The ESA will arise from a section 15E transfer from the ESA of the APF.
The offer was made only to eligible employees who are contributing members of the AECI Employees Provident Fund and the ADCPF, with acceptance required on or before 31 January 2016. The offer was made conditional upon successful implementation prior to 1 March 2016 on the basis that the offer would be null and void if implementation occurred after 1 March 2016. On that date, due to an unintended consequence of the changes to retirement funding included in the Taxation Laws Amendment Act No. 43 of 2014, which then took effect, the amount become a taxable benefit in the hands of employees.
Implementation could only commence after the section 15E transfer had been approved by the FSB and the related ESA transfers had been effected between the funds. Approval was granted on 26 February 2016, with an effective date of 1 January 2016, although this approval notification was only received in March 2016. The transfers between the funds took place in March 2016. The Group is assessing the impact of the timing of the transfer and the implications of the changes to the tax laws regarding retirement funding contributions to determine if the condition in the offer will now make it null and void.
These changes will be accounted for as a settlement of obligations only when all legal or constructive obligations have been eliminated. Until then, there are no changes to the Group’s post-retirement medical aid obligations in respect of eligible employees and the disclosure in note 30 remains unchanged.
191
NOTES TO THE FINANCIAL STATEMENTS FOR THE YEAR ENDED 31 DECEMBER 2015 continued
ORDINARY RESOLUTIONS NUMBERS 3.1 TO 3.3
Re-election of Non-executive DirectorsResolved that the following Non-executive Directors who are retiring in terms of the Company’s Memorandum of Incorporation (“MOI”) and who, being eligible, be re-elected:
3.1 Ms Z Fuphe
3.2 Mr G Gomwe
3.3 Adv R Ramashia
A brief curriculum vitae of each of the Directors standing for re-election is provided on pages 16 and 17 of the integrated report of which this Notice forms part.
Each of the ordinary resolutions 3.1 to 3.3 will be considered by way of a separate vote.
ORDINARY RESOLUTIONS NUMBERS 4.1 AND 4.2
Appointment of Directors4.1 Resolved that Mr GW Dempster, who was appointed on
31 January 2016, be appointed in terms of the MOI.
A brief curriculum vitae of Mr Dempster is provided on page 16 of the integrated report of which this Notice forms part.
4.2 Resolved that Dr KDK Mokhele, who was appointed on 1 March 2016, be appointed in terms of the MOI.
A brief curriculum vitae of Dr Mokhele is provided on page 17 of the integrated report of which this Notice forms part.
Both of the ordinary resolutions 4.1 and 4.2 will be considered by way of a separate vote.
ORDINARY RESOLUTION NUMBER 5
Re-election of Executive DirectorResolved that Mr KM Kathan, who is retiring in terms of the MOI and who, being eligible, be re-elected.
A brief curriculum vitae of Mr Kathan is provided on page 18 of the integrated report of which this Notice forms part.
AECI Limited (“AECI” or “the Company” or “the Group”)
Incorporated in the Republic of South Africa
(Registration Number 1924/002590/06)
JSE share code: AFE ISIN code: ZAE000000220
NOTICE OF MEETINGNotice is hereby given that the 92nd AGM of shareholders of the Company will be held on the Ground Floor, AECI Place, 24 The Woodlands, Woodlands Drive, Woodmead, Sandton on Monday, 30 May 2016, at 09h00.
PURPOSE OF MEETINGThe purpose of this meeting is to:
› present the Directors’ report and the audited annual financial statements of the Company and the Group for the year ended 31 December 2015;
› present the Audit Committee’s report;
› present the Social and Ethics Committee’s report;
› consider any matters raised by shareholders; and
› consider and if deemed fit to pass, with or without modification, the resolutions set out below.
ORDINARY RESOLUTION NUMBER 1
Adoption of annual financial statementsResolved that the audited annual financial statements of the Company and the Group for the year ended 31 December 2015 be received and adopted.
ORDINARY RESOLUTION NUMBER 2
Reappointment of independent auditorsResolved that, upon the recommendation of the current Audit Committee, KPMG Inc. be reappointed as the independent registered auditor of the Company to undertake the audit during the financial year ending 31 December 2016.
192
NOTICE OF ANNUAL GENERAL MEETING (“AGM” OR “THE MEETING”)
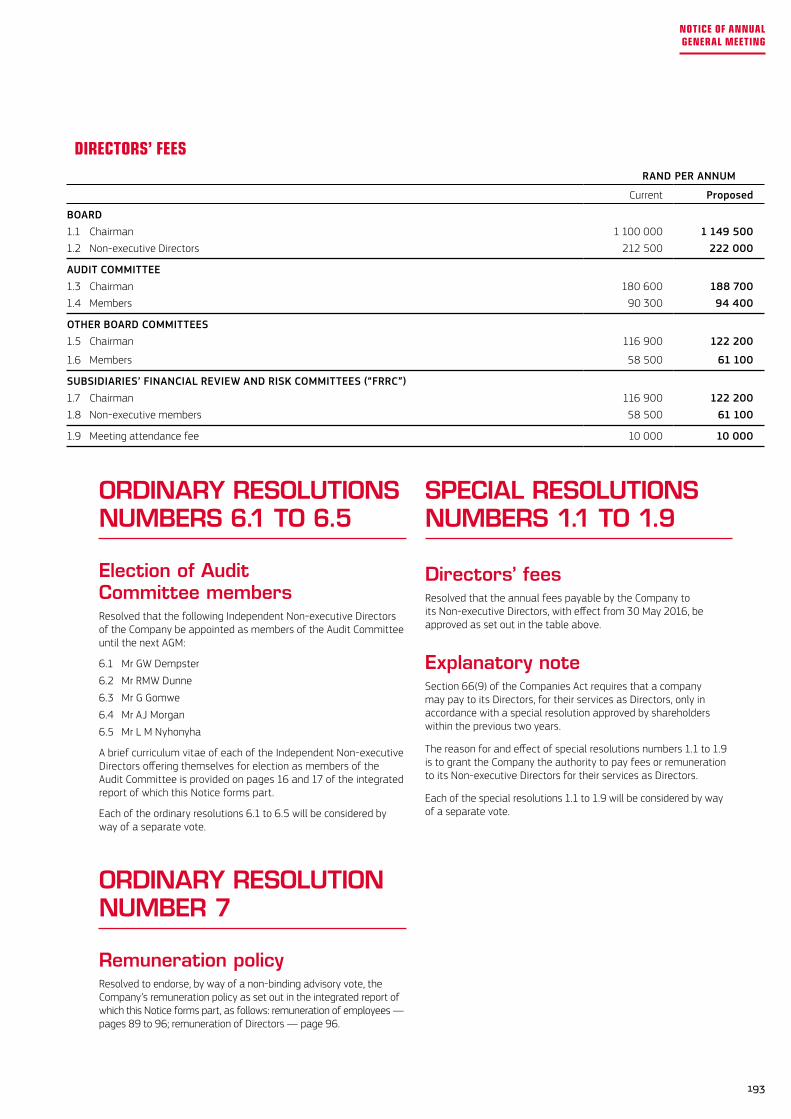
SPECIAL RESOLUTIONS NUMBERS 1.1 TO 1.9
Directors’ feesResolved that the annual fees payable by the Company to its Non-executive Directors, with effect from 30 May 2016, be approved as set out in the table above.
Explanatory noteSection 66(9) of the Companies Act requires that a company may pay to its Directors, for their services as Directors, only in accordance with a special resolution approved by shareholders within the previous two years.
The reason for and effect of special resolutions numbers 1.1 to 1.9 is to grant the Company the authority to pay fees or remuneration to its Non-executive Directors for their services as Directors.
Each of the special resolutions 1.1 to 1.9 will be considered by way of a separate vote.
ORDINARY RESOLUTIONS NUMBERS 6.1 TO 6.5
Election of Audit Committee membersResolved that the following Independent Non-executive Directors of the Company be appointed as members of the Audit Committee until the next AGM:
6.1 Mr GW Dempster
6.2 Mr RMW Dunne
6.3 Mr G Gomwe
6.4 Mr AJ Morgan
6.5 Mr L M Nyhonyha
A brief curriculum vitae of each of the Independent Non-executive Directors offering themselves for election as members of the Audit Committee is provided on pages 16 and 17 of the integrated report of which this Notice forms part.
Each of the ordinary resolutions 6.1 to 6.5 will be considered by way of a separate vote.
ORDINARY RESOLUTION NUMBER 7
Remuneration policyResolved to endorse, by way of a non-binding advisory vote, the Company’s remuneration policy as set out in the integrated report of which this Notice forms part, as follows: remuneration of employees — pages 89 to 96; remuneration of Directors — page 96.
DIRECTORS’ FEESRAND PER ANNUM
Current Proposed
BOARD1.1 Chairman 1 100 000 1 149 5001.2 Non-executive Directors 212 500 222 000
AUDIT COMMITTEE1.3 Chairman 180 600 188 7001.4 Members 90 300 94 400
OTHER BOARD COMMITTEES1.5 Chairman 116 900 122 200
1.6 Members 58 500 61 100
SUBSIDIARIES’ FINANCIAL REVIEW AND RISK COMMITTEES (“FRRC”)1.7 Chairman 116 900 122 2001.8 Non-executive members 58 500 61 100
1.9 Meeting attendance fee 10 000 10 000
193
NOTICE OF ANNUAL GENERAL MEETING
› the Company or its subsidiaries may not repurchase securities during a prohibited period as defined in the JSE Listings Requirements unless they have in place a repurchase programme where the dates and quantities of securities to be traded during the relevant period are fixed (not subject to any variation) and full details of the programme have been disclosed to the JSE, in writing, prior to the commencement of the prohibited period. The Company or its subsidiaries have instructed an independent third party, which makes its investment decisions in relation to the Company’s securities independently of, and uninfluenced by, the Company or its subsidiaries, prior to the commencement of the prohibited period to execute the repurchase programme submitted to the JSE.
Explanatory noteAt the present time, the Directors have no specific intention with regard to the utilisation of this authority, which will only be used if the circumstances are appropriate.
The Company’s Directors undertake that they will not effect any such repurchases while the general authority is valid, unless:
(i) the Group will be able, in the ordinary course of business, to pay its debts for a period of 12 months following the date of the general repurchase;
(ii) the assets of the Company and the Group will exceed the liabilities of the Company and the Group for a period of 12 months following the date of the general repurchase. For this purpose, the assets and liabilities are recognised and measured in accordance with the accounting policies used in the Company’s latest audited annual Group financial statements;
(iii) the Company and the Group will have adequate share capital and reserves for ordinary business purposes for a period of 12 months following the date of the general repurchase; and
(iv) the working capital of the Company and the Group will be adequate for ordinary business purposes for a period of 12 months following the date of the general repurchase.
The reason for and effect of special resolution number 2 is to grant the Company a general authority to facilitate the acquisition of the Company’s own shares, which general authority shall be valid until the earlier of the next AGM of the Company or the variation or revocation of such general authority by special resolution by any subsequent General Meeting of the Company, provided that this general authority shall not extend beyond 15 months from the date of adoption of this special resolution.
Such general authority will provide the Directors with flexibility to effect a repurchase of the Company’s shares, should it be in the interests of the Company to do so at any time while the general authority is in force.
SPECIAL RESOLUTION NUMBER 2
General authority to repurchase sharesResolved that the Company be and is hereby granted a general authority authorising the acquisition by the Company and/or its subsidiaries of shares issued by the Company, on such terms and conditions and in such amounts as the Directors of the Company may from time to time deem fit, and in terms of section 48(8) of the Companies Act, the Company’s MOI and the JSE Listings Requirements provided that:
› subject to section 48 of the Companies Act, the general authority to repurchase is limited to a maximum of 5% in the aggregate, in any one financial year, of the Company’s issued share capital at the beginning of the financial year, provided that the number of shares purchased and held by or for the benefit of a subsidiary or subsidiaries of the Company, taken together, shall not exceed 10% in the aggregate of the number of issued shares in the Company;
› this general authority shall only be valid until the Company’s next AGM, provided that it shall not extend beyond 15 months from the date of adoption of this special resolution;
› a resolution has been passed by the Board of Directors (“the AECI Board”) confirming that the AECI Board has authorised the general repurchase, that the Company passed the solvency and liquidity test and that since the test was done there have been no material changes to the financial position of the Company and its subsidiaries (collectively “the Group”);
› repurchases may not be made at a price greater than 10% above the weighted average of the market value of the ordinary shares for the five business days immediately preceding the date on which the transaction is effected. The JSE should be consulted for a ruling if the Company’s securities have not traded in such a five business day period;
› any such general repurchase is subject to exchange control regulations and approval at that point in time;
› the repurchase of securities will be effected through the order book operated by the JSE’s trading system and done without any prior understanding or arrangement between the Company and the counter-party (reported trades are prohibited);
› at any point in time, a company may only appoint one agent to effect any repurchases on the company’s behalf;
› an announcement giving such details as may be required in terms of the JSE Listings Requirements will be released when the Company or its subsidiaries have cumulatively repurchased 3% of the initial number of the relevant class of shares in issue as at the time this resolution is passed (“initial number”) and for each 3% in aggregate of the initial number of that class acquired thereafter;
194
NOTICE OF ANNUAL GENERAL MEETING
RECORD DATEThe AECI Board has, in terms of section 59(1)(a) of the Companies Act, set the record date, for the purpose of determining which shareholders of the Company are entitled to receive Notice of the AGM as being Friday, 15 April 2016 and has, in terms of section 59(1)(b) of the Companies Act, set the record date, for purposes of determining which shareholders of the Company are entitled to participate in and vote at the AGM, as being Friday, 20 May 2016. Accordingly, the last day to trade in order to be registered in the register of shareholders of the Company and therefore eligible to participate in and vote at the AGM is Friday, 13 May 2016.
APPROVALS REQUIRED FOR RESOLUTIONSOrdinary resolutions numbers 1 to 7 contained in this Notice of AGM require the approval by more than 50% of the votes exercised on the resolutions by shareholders present or represented by proxy at the AGM, subject to the provisions of the Companies Act, the MOI of the Company and the JSE Listings Requirements.
Special resolutions numbers 1 to 3 contained in this Notice of AGM require the approval by at least 75% of the votes exercised on the resolutions by shareholders present or represented by proxy at the AGM, subject to the provisions of the Companies Act, the MOI of the Company and the JSE Listings Requirements.
GENERAL INFORMATIONThe following additional information appears elsewhere in the integrated report of which this Notice forms part:
(i) major shareholders of the Company (refer to the shareholder analysis commencing on page 105);
(ii) share capital of the Company (refer to the Directors’ report on page 103).
NO MATERIAL CHANGES TO REPORTThere have been no material changes in the financial or trading position of the Company and its subsidiaries since the date of signature of the Independent Auditors’ report and the date of this Notice.
SPECIAL RESOLUTION NUMBER 3
Financial assistance to related or inter-related companyResolved that, in terms of and subject to the provisions of section 45 of the Companies Act, the Directors of the Company be and they are hereby authorised and empowered to cause the Company to provide any direct or indirect financial assistance to any company or other legal entity which is related or inter-related to the Company.
Explanatory noteOn a regular basis, and in the ordinary course of business, the Company provides loan financing, guarantees and other support to the related and inter-related companies or legal entities in the Group. Section 45(2) of the Companies Act empowers the Board of Directors (“the Board”) of a company to provide direct or indirect financial assistance to a related or inter-related company or corporation. However, section 45(3) of the Companies Act provides that the Board of a company may only authorise any financial assistance contemplated in section 45(2) thereof pursuant to a special resolution of the shareholders of the company adopted within the previous two years.
The AECI Board undertakes that:
(i) it will not adopt a resolution to authorise such financial assistance unless it is satisfied that:
› immediately after providing the financial assistance, the Company would satisfy the solvency and liquidity test as contemplated in the Companies Act; and
› the terms under which the financial assistance is proposed to be given are fair and reasonable to the Company; and
(ii) written notice of any such resolution by the AECI Board shall be given to all shareholders of the Company and any trade union representing its employees:
› within 10 business days after the AECI Board adopted the resolution if the total value of the financial assistance contemplated in that resolution, together with any previous such resolution during the financial year, exceeds one-tenth of 1% of the Company’s net worth at the time of the resolution; or
› within 30 business days after the end of the financial year, in any other case.
The reason for and effect of special resolution number 3 is to grant the Directors of the Company the authority to cause the Company to provide financial assistance to any company or other legal entity which is related or inter-related to the Company.
195
NOTICE OF ANNUAL GENERAL MEETING
Forms of proxy must be lodged at, posted, faxed or e-mailed to the Transfer Secretaries of the Company, Computershare Investor Services (Pty) Ltd, 70 Marshall Street, Johannesburg, 2001, PO Box 61051, Marshalltown, 2107, Fax 011 688 5238, [email protected], to be received by them not later than 09h00 on Thursday, 26 May 2016. Any forms of proxy not received by this time must be handed to the Chairman of the AGM immediately prior to the AGM.
Proxy forms must only be completed by shareholders who have not dematerialised their shares or who have dematerialised their shares with “own name” registration.
All resolutions shall be decided on a poll and every shareholder of the Company shall have one vote for every share held in the Company by such shareholder.
Shareholders who have dematerialised their shares, other than those shareholders who have dematerialised their shares with “own name” registration, must contact their Central Securities Depository Participant (“CSDP”) or stockbroker in the manner and time stipulated in their agreement:
› to furnish their CSDP or stockbroker with their voting instructions; and
› in the event that they wish to attend the Meeting, to obtain the necessary authority to do so with a letter of representation in terms of the custody agreement. Such letter of representation must be lodged with the Company’s Transfer Secretaries, Computershare Investor Services (Pty) Ltd, Ground Floor, 70 Marshall Street, Johannesburg, 2001, or posted to the Transfer Secretaries at PO Box 61051, Marshalltown, 2107, or e-mailed to [email protected] to reach them no later than 09h00 on Thursday, 26 May 2016.
All participants at the AGM will be required to provide identification reasonably satisfactory to the Chairman of the Meeting (which may take the form of a valid identity document, driver’s licence or passport, for example).
By order of the Board
Nomini Rapoo Group Company Secretary
Woodmead, Sandton 11 April 2016
DIRECTORS’ RESPONSIBILITY STATEMENTThe Directors whose names appear on pages 16 to 18 in the integrated report of which this Notice forms part collectively and individually accept full responsibility for the accuracy of the information contained in these resolutions and certify that, to the best of their knowledge and belief, there are no facts that have been omitted which would make any statement false or misleading, and that all reasonable enquiries to ascertain such facts have been made and these resolutions contain all information required by law and the JSE Listings Requirements.
VOTING AND PROXIESShareholders or their proxies may participate in the AGM by way of a teleconference call and, if they wish to do so:
› should make application by email to the Group Company Secretary ([email protected]) by no later than 16h00 on Wednesday, 25 May 2016 in order for the Group Company Secretary to provide the shareholder or such shareholder’s representative with details as to how to access the AGM for telephonic participation;
› the costs of enabling a shareholder to access the AGM for telephonic participation will be borne by the shareholder so accessing the AGM;
› shareholders are advised that accessing the AGM by way of telephonic participation will not entitle a shareholder to vote at the AGM;
› should a shareholder wish to vote at the AGM, such shareholder may do so by attending and voting at the AGM either in person or by proxy; and
› the Company reserves the right to elect not to provide for telephonic or any other form of electronic participation in the AGM in the event that it determines that it is not practical to do so.
Shareholders who have not dematerialised their shares or who have dematerialised their shares with “own name” registration are entitled to attend and vote at the AGM and are entitled to appoint a proxy or proxies (for which purpose a form of proxy is included) to attend, speak and vote in their stead. The person so appointed need not be a shareholder of the Company.
196
NOTICE OF ANNUAL GENERAL MEETING
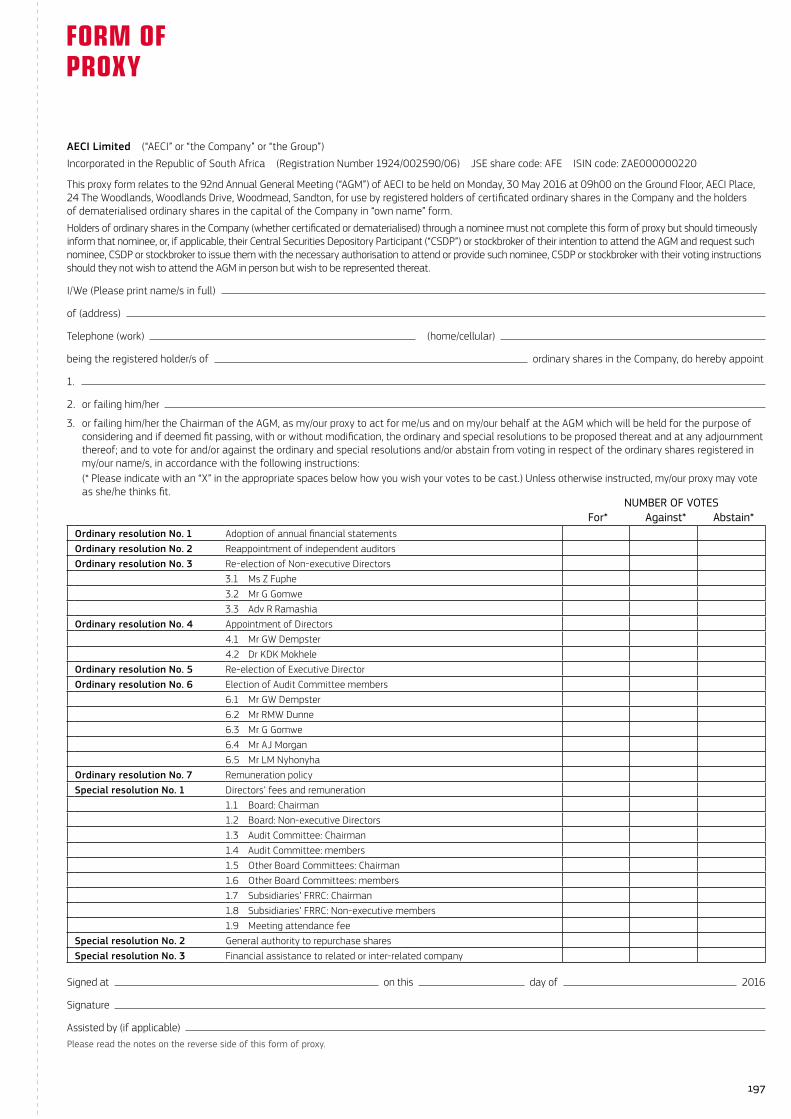
AECI Limited (“AECI” or “the Company” or “the Group”)
Incorporated in the Republic of South Africa (Registration Number 1924/002590/06) JSE share code: AFE ISIN code: ZAE000000220
This proxy form relates to the 92nd Annual General Meeting (“AGM”) of AECI to be held on Monday, 30 May 2016 at 09h00 on the Ground Floor, AECI Place, 24 The Woodlands, Woodlands Drive, Woodmead, Sandton, for use by registered holders of certificated ordinary shares in the Company and the holders of dematerialised ordinary shares in the capital of the Company in “own name” form.
Holders of ordinary shares in the Company (whether certificated or dematerialised) through a nominee must not complete this form of proxy but should timeously inform that nominee, or, if applicable, their Central Securities Depository Participant (“CSDP”) or stockbroker of their intention to attend the AGM and request such nominee, CSDP or stockbroker to issue them with the necessary authorisation to attend or provide such nominee, CSDP or stockbroker with their voting instructions should they not wish to attend the AGM in person but wish to be represented thereat.
I/We (Please print name/s in full)
of (address)
Telephone (work) (home/cellular)
being the registered holder/s of ordinary shares in the Company, do hereby appoint
1.
2. or failing him/her
3. or failing him/her the Chairman of the AGM, as my/our proxy to act for me/us and on my/our behalf at the AGM which will be held for the purpose of considering and if deemed fit passing, with or without modification, the ordinary and special resolutions to be proposed thereat and at any adjournment thereof; and to vote for and/or against the ordinary and special resolutions and/or abstain from voting in respect of the ordinary shares registered in my/our name/s, in accordance with the following instructions:
(* Please indicate with an “X” in the appropriate spaces below how you wish your votes to be cast.) Unless otherwise instructed, my/our proxy may vote as she/he thinks fit.
NUMBER OF VOTESFor* Against* Abstain*
Ordinary resolution No. 1 Adoption of annual financial statementsOrdinary resolution No. 2 Reappointment of independent auditorsOrdinary resolution No. 3 Re-election of Non-executive Directors
3.1 Ms Z Fuphe3.2 Mr G Gomwe3.3 Adv R Ramashia
Ordinary resolution No. 4 Appointment of Directors4.1 Mr GW Dempster4.2 Dr KDK Mokhele
Ordinary resolution No. 5 Re-election of Executive DirectorOrdinary resolution No. 6 Election of Audit Committee members
6.1 Mr GW Dempster6.2 Mr RMW Dunne6.3 Mr G Gomwe6.4 Mr AJ Morgan6.5 Mr LM Nyhonyha
Ordinary resolution No. 7 Remuneration policySpecial resolution No. 1 Directors’ fees and remuneration
1.1 Board: Chairman1.2 Board: Non-executive Directors1.3 Audit Committee: Chairman1.4 Audit Committee: members1.5 Other Board Committees: Chairman1.6 Other Board Committees: members1.7 Subsidiaries’ FRRC: Chairman1.8 Subsidiaries’ FRRC: Non-executive members1.9 Meeting attendance fee
Special resolution No. 2 General authority to repurchase sharesSpecial resolution No. 3 Financial assistance to related or inter-related company
Signed at on this day of 2016
Signature
Assisted by (if applicable) Please read the notes on the reverse side of this form of proxy.
197
FORM OF PROXY
9. Shareholders whose dematerialised shares are held in the name of a nominee and who wish to attend the AGM must contact their Central Securities Depository Participant (“CSDP”) or stockbroker who will furnish them with the necessary letter of authority to attend the AGM. Alternatively, they must instruct their CSDP or stockbroker as to how they wish to vote. This must be done in terms of the agreement between the shareholder and the CSDP or the stockbroker.
10. Shareholders who wish to attend and vote at the AGM must ensure that their letters of authority from their CSDP or stockbroker reach the Transfer Secretaries not later than 09h00 on Thursday, 26 May 2016.
11. The completion and lodging of this form of proxy shall not preclude the relevant shareholder from attending the AGM and speaking and voting in person thereat to the exclusion of any proxy appointed in terms hereof, should such shareholder wish to do so.
12. The completion of any blank spaces overleaf need not be initialled. Any alterations or corrections to this form of proxy must be initialled by the signatory/ies.
13. The Chairman of the AGM may accept any form of proxy which is completed other than in accordance with these instructions provided that she/he is satisfied as to the manner in which a shareholder wishes to vote.
14. A proxy may delegate the proxy’s authority to act on behalf of the shareholder to another person.
15. A proxy appointment is suspended at any time and to the extent that the shareholder chooses to act directly and in person in the exercise of any rights as a shareholder.
16. A proxy appointment must be in writing, dated and signed by the shareholder, and remains valid only until the end of the meeting at which it was intended to be used, unless the proxy appointment is revoked, in which case the proxy appointment will be cancelled with effect from such revocation.
17. The appointment of a proxy in terms of this form of proxy is revocable in terms of the provisions of section 58(4)(c) read with section 58(5) of the Companies Act and, accordingly, a shareholder may revoke the proxy appointment by cancelling it in writing, or making a later inconsistent appointment of a proxy, and delivering a copy of the revocation instrument to the proxy and to the Company.
18. The revocation of a proxy appointment constitutes a complete and final cancellation of the proxy’s authority to act on behalf of the shareholder as of the later of the date stated in the revocation instrument, if any, or the date on which the revocation instrument is delivered in terms of 17 above.
1. A shareholder entitled to attend and vote at the AGM may, at any time, appoint any individual, including an individual who is not a shareholder of the Company, as a proxy to, among other things, participate in, and speak and vote at the AGM on behalf of the shareholder. Satisfactory identification must be presented by any person wishing to attend the AGM, as set out in the Notice.
2. Every shareholder present in person or by proxy and entitled to vote at the AGM of the Company shall, on a poll, be entitled to one vote in respect of each ordinary share held by her/him.
3. A shareholder may insert the name of a proxy or the names of two alternative proxies of the shareholder’s choice in the space/s provided overleaf, with or without deleting “the Chairman of the AGM”, but any such deletion must be initialled by the shareholder. Should this space be left blank, the Chairman of the AGM will exercise the proxy. The person whose name appears first on the proxy form and who is present at the AGM will be entitled to act as proxy to the exclusion of those whose names follow.
4. A shareholder’s voting instructions to the proxy must be indicated by the insertion of the number of votes exercisable by that shareholder in the appropriate spaces provided overleaf. Failure to do so shall be deemed to authorise the proxy to vote or to abstain from voting at the AGM as she/he thinks fit in respect of all the shareholder’s exercisable votes. A shareholder or her/his proxy is not obliged to use all the votes exercisable by her/him or her/his proxy, but the total number of votes cast, or those in respect of which abstention is recorded, may not exceed the total number of votes exercisable by the shareholder or by her/his proxy.
5. A minor must be assisted by her/his parent or guardian unless the relevant documents establishing her/his legal capacity are produced or have been registered by the Transfer Secretaries.
6. Forms of proxy must be lodged at, posted, faxed or e-mailed to the Transfer Secretaries of the Company, Computershare Investor Services (Pty) Ltd, 70 Marshall Street, Johannesburg, 2001, PO Box 61051, Marshalltown, 2107, Fax 011 688 5238, [email protected], to be received by them not later than 09h00 on Thursday, 26 May 2016. Any forms of proxy not received by this time must be handed to the Chairman of the AGM immediately prior to the AGM.
7. Documentary evidence establishing the authority of a person signing this form of proxy in a representative capacity must be attached to this form of proxy unless previously recorded by the Transfer Secretaries or waived by the Chairman of the AGM.
8. This form of proxy is to be completed only by those shareholders who either still hold shares in a certificated form, or whose shares are recorded in their “own name” in electronic form in the sub-register.
198
NOTES TO THE FORM OF PROXY
ADMINISTRATION
GROUP COMPANY SECRETARY AND REGISTERED OFFICEEN RapooFirst FloorAECI Place24 The WoodlandsWoodlands DriveWoodmeadSandton(no postal deliveries to this address)
POSTAL ADDRESSPrivate Bag X21Gallo Manor2052Telephone: +27 (0)11 806 8700Telefax: +27 (0)11 806 8701E-mail: [email protected]
WEB ADDRESSwww.aeci.co.za
LONDON SECRETARYSt James’s Corporate Services LtdSuite 31, Second Floor107 CheapsideLondon EC2V 6DNEngland
TRANSFER SECRETARIESComputershare Investor Services (Pty) Ltd70 Marshall Street, JohannesburgPO Box 61051, Marshalltown, 2107South AfricaandComputershare Investor Services plcPO Box 82The PavilionsBridgwater RoadBristol BS99 7NHEngland
AUDITORKPMG Inc.
PRIMARY TRANSACTIONAL AND FUNDING BANKSAbsa Bank LtdFirst National Bank of Southern Africa LtdNedbank LtdThe Standard Bank of South Africa Ltd
SOUTH AFRICAN SPONSORRand Merchant Bank(A division of FirstRand Bank Limited)1 Merchant PlaceCorner Rivonia Road and Fredman DriveSandton2196
sigil design bureau

INTEGRATED REPORT AND ANNUAL FIN
ANCIAL STATEMEN
TS 2015AECI LTD
INTEGRATEDREPORT AND
ANNUALFINANCIAL
STATEMENTS2015WWW.AECI.CO.ZA