AEC 2012 - What Drives Foreign Direct Investments in … What Drives Foreign Direct Investments in...
25
1 What Drives Foreign Direct Investments in Africa? An Empirical Investigation with Panel Data Abdoul’ Ganiou Mijiyawa* African Center for Economic Transformation (ACET), Accra, Ghana E-mail: [email protected] Tel: +233 267 726 693/ Fax: +233 302 258 140 Abstract This paper analyses factors that drive Foreign Direct Investments (FDI) in Africa. To do so, for the first time in the literature, the paper uses five-year panel data with the system-GMM technique, over the period 1970-2009 including 53 African countries. The main results are as follows: (a) Larger countries attract more FDI. (b) However, regardless of their size, more open countries, politically stable countries and countries offering higher return to investment also attract FDI. (c) FDI inflows are persistent in Africa. This suggests that countries that manage to attract FDI today are likely to attract more FDI in the future. Key words: FDI, Africa Jel Classification: F21, O55 * The author is economist at ACET. The views expressed here are those of the author and not of his affiliated institution.
Transcript of AEC 2012 - What Drives Foreign Direct Investments in … What Drives Foreign Direct Investments in...

1
What Drives Foreign Direct Investments in Africa? An Empirical
Investigation with Panel Data
Abdoul’ Ganiou Mijiyawa*
African Center for Economic Transformation (ACET), Accra, Ghana
E-mail: [email protected]
Tel: +233 267 726 693/ Fax: +233 302 258 140
Abstract
This paper analyses factors that drive Foreign Direct Investments (FDI) in Africa. To do so,
for the first time in the literature, the paper uses five-year panel data with the system-GMM
technique, over the period 1970-2009 including 53 African countries. The main results are as
follows: (a) Larger countries attract more FDI. (b) However, regardless of their size, more
open countries, politically stable countries and countries offering higher return to investment
also attract FDI. (c) FDI inflows are persistent in Africa. This suggests that countries that
manage to attract FDI today are likely to attract more FDI in the future.
Key words: FDI, Africa
Jel Classification: F21, O55
* The author is economist at ACET. The views expressed here are those of the author and not
of his affiliated institution.

2
1. Introduction
In 1970 (the first year for which FDI data were available), the total amount of Foreign
Direct Investments (henceforth, FDI) inflows in Africa was US$1.26 billion, and it rose to
US$55.04 billion in 2010. Thus, between the two periods, FDI inflows have increased by
4,247%, and one can say that Africa has done well in attracting FDI. However, for a good
assessment of the situation, it is better to put Africa’s performance in relative perspective.
Here the picture is different. Indeed, in 1970, Africa’s share in the global FDI inflows was
9.5% and it dropped to 4.4% in 2010. Likewise, the share of Africa in developing countries’
FDI inflows was 32.8% in 1970, and it dropped to 9.6% in 2010.1
The aforementioned figures show that there is absolute progress but relative decline of
Africa as far as FDI attractiveness is concerned. Thus, the question is why African countries
fail to attract more FDI compared to the rest of the world. In other words, it is important to
find out factors that drive or deter FDI in Africa. This is where this paper seeks to make a
contribution.
The study of the drivers of FDI in Africa is important because FDI can play a
fundamental role in the process of the continent’s development. Indeed, FDI can stimulate
domestic investment, facilitate technology transfer, create employment, promote exports and
generate economic growth.2 The role of FDI as a source of capital is particularly important to
Africa, because FDI can fill the annual financings gap of US$64 billion, or 12% of GDP that
the continent needs to achieve the objective of halving poverty by 2015.3 Moreover, net
official development assistance to Africa had declined from US$17.8 billion in 1995 to
US$12.2 billion in 2000, a decrease of about 31% (World Bank, 2003). Net official
development assistance will probably continue to decline given the recent global economic
crisis, which reduces the capacity of developed countries to provide development assistance
to developing world, including Africa. Thus, Africa needs to find other resources for
financing its development, and FDI is one of those alternative financing sources.
Despite the importance of FDI for the development of Africa, few evidences exist on
the determinants of FDI inflows in Africa. For instance, a search in Econlit reveals that about
10 papers have been published in economic journals on the determinants of FDI inflows in
1 According to FDI data from the UNCTAD.
2 See Mody and Murshid (2002) for a discussion on the relationship between domestic investment and FDI, De
Mello (1997) for a survey on FDI and economic growth and Blomstorm and Koklo (1988) for a survey on FDI
and technology spillovers to host countries. 3 From Asiedu (2004), reported from NEPAD declaration document.
3
Africa. Moreover, though the existing studies are important contributions to the literature,
these papers present three main limitations, as discussed later in the paper. Thus, this paper
seeks to make a contribution to the literature by analyzing factors that drive or deter FDI in
Africa, whilst trying to deal with the limitations of the existing studies on the determinants of
FDI inflows in Africa.
The rest of the paper is organised as follows. In the next section, I analyse the trend of
FDI inflows in Africa and across African sub-regions over the period 1970-2009. Section 3 of
the paper focuses on the review of empirical studies. In section 4, I present the econometric
model and carry out the empirical analysis. Section 5 analyses the results of econometric
regressions and section 6 concludes the paper.
2. Trends of FDI inflows in Africa and across Africa sub-regions
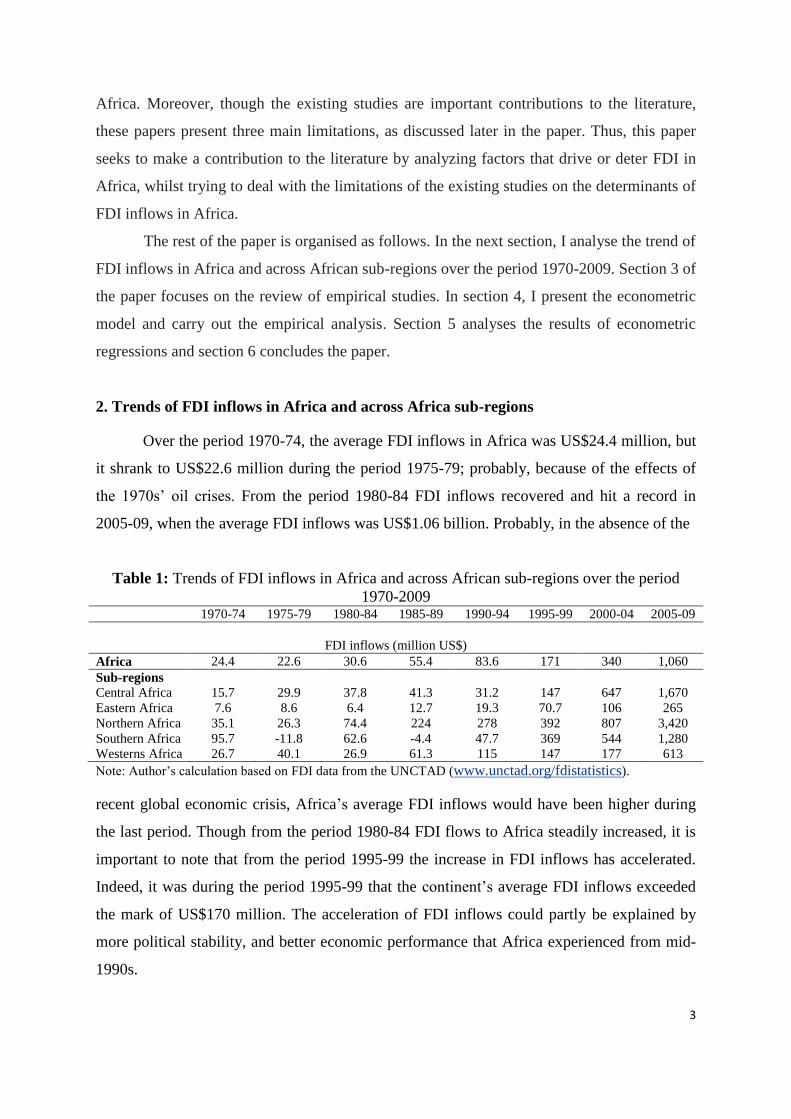
Over the period 1970-74, the average FDI inflows in Africa was US$24.4 million, but
it shrank to US$22.6 million during the period 1975-79; probably, because of the effects of
the 1970s’ oil crises. From the period 1980-84 FDI inflows recovered and hit a record in
2005-09, when the average FDI inflows was US$1.06 billion. Probably, in the absence of the
Table 1: Trends of FDI inflows in Africa and across African sub-regions over the period
1970-2009 1970-74 1975-79 1980-84 1985-89 1990-94 1995-99 2000-04 2005-09
FDI inflows (million US$)
Africa 24.4 22.6 30.6 55.4 83.6 171 340 1,060
Sub-regions
Central Africa 15.7 29.9 37.8 41.3 31.2 147 647 1,670
Eastern Africa 7.6 8.6 6.4 12.7 19.3 70.7 106 265
Northern Africa 35.1 26.3 74.4 224 278 392 807 3,420
Southern Africa 95.7 -11.8 62.6 -4.4 47.7 369 544 1,280
Westerns Africa 26.7 40.1 26.9 61.3 115 147 177 613
Note: Author’s calculation based on FDI data from the UNCTAD (www.unctad.org/fdistatistics).
recent global economic crisis, Africa’s average FDI inflows would have been higher during
the last period. Though from the period 1980-84 FDI flows to Africa steadily increased, it is
important to note that from the period 1995-99 the increase in FDI inflows has accelerated.
Indeed, it was during the period 1995-99 that the continent’s average FDI inflows exceeded
the mark of US$170 million. The acceleration of FDI inflows could partly be explained by
more political stability, and better economic performance that Africa experienced from mid-
1990s.

4
The data also show that all the African sub-regions experienced an acceleration of
FDI inflows from mid-1990s. Moreover, a detailed analysis at sub-regions level reveals that
East Africa is the least performing sub-region in attracting FDI, for all the periods except in
the period 1975-79 and 1985-89. For the latter two periods, Southern Africa was the least
performing sub-region. The data show that until the 1980s, there was no single dominant sub-
region in terms of FDI inflows. Indeed, from the 1980s, Northern Africa became the highest
performing African sub-region in attracting FDI. However, in the early 1970s, Southern
Africa was the highest performing sub-region, and in the second half of the 1970s; Western
Africa was the leading sub-region as far as FDI attractiveness is concerned.
The trend of FDI inflows differs from one African sub-region to another. In Central
Africa, the average FDI inflows was US$15.7 million, one of the lowest average amounts of
FDI inflows in the early 1970s. However, from the 1970s, the amount of FDI inflows steadily
increased until early 1990s, when FDI inflows declined in Central Africa. The decline of FDI
inflows in Central Africa could partly be explained by political instability and civil wars in
the sub-region in the early 1990s. However, from the second half of the 1990s, there was
recovery of FDI inflows in Central Africa, largely because of the beginning of oil production
and mining extraction in a number of countries in the sub-region.
Regardless of the period considered, the performance of Eastern Africa is lower than
the African average. The socialism political ideology and political instability that prevailed in
most of the Eastern African countries did not favour the development of FDI in the sub-
region. However, from the 1980s, FDI inflows steadily increased in Eastern Africa.
Northern Africa performance is higher than the continent’s average, regardless of the
period considered. Especially, during the period 2005-09, the average FDI inflows in
Northern Africa was more than three times the African average of FDI inflows. The recent
global crisis and the Arab spring events would negatively impact FDI inflows in Northern
Africa. However, given that Northern Africa is geographically the closest African sub-region
to Europe, and given that Northern Africa is highly endowed in natural resources, one can
expect that the sub-region will continue to attract a significant amount of FDI. Over the
period of analysis, it is only during the period 1975-79 that FDI inflows declined in Northern
Africa; probably, because of the effects of oil crises in the 1970s.
In Southern Africa, there were FDI outflows during the period 1975-79 and 1985-89,
partly because of the apartheid regime, which did not favour the development of FDI in the
sub-region. However, from the period 1990-94, with the end of the apartheid regime, there
5
was a steady increase in FDI inflows in Southern Africa sub-region, which accelerated from
mid-1990s. Indeed, from the period 1995-99 the performance of Southern Africa was higher
than the continent’s average.
Starting in the period 1970-74 with an amount of US$26.7 million, the average FDI
inflows in the Western Africa sub-region rose to US$40.1 million in the period 1975-79
before shrinking to US$26.9 million in the early 1980s. From the period 1985-89, FDI
inflows steadily increased and reached the amount of US$613 million, an amount however
lower than the continent’s average in the period 2005-09. Western Africa would have
performed better in the absence of civil wars and political instability that the sub-region
experienced from the early 1980s. Indeed, Western Africa has a long history of FDI; in the
period 1974-75, it was the highest performing African sub-region in attracting FDI. Recent
developments in the sub-region suggest that the future performance of Western Africa is
uncertain as far as FDI inflows are concerned. Indeed, while some countries like Senegal and
Ghana with successful democratic transition send a good signal to foreign investors, other
governments in the sub-region have to exert much more efforts to restore political stability in
their countries.
3. Review of Empirical Literature
The review of literature is based on articles published in all economic journals found
in the Econlit database. All the reviewed papers analyse factors that promote or impede FDI
in Africa and/or in Sub-Saharan Africa (SSA).
Morisset (2000) is one of the pioneer authors who analyse factors that determine FDI
flows to Africa. According to the author, African countries can also be successful in
attracting FDI that is not based on natural resources or the size of local markets, by
improving their business climate. Using FDI that does not arise from market size and the
natural resources available in the host country as an indicator of the business climate for FDI,
the paper finds that GDP growth rate and trade openness can be used to improve the business
climate. The paper combines econometric and country analyses to identify factors that
contribute to FDI attractiveness to Africa. The econometric analysis covers 29 SSA countries,
with cross-sectional and panel data over the period 1990-1997.
In the same vein, Asiedu (2006) analyses the relative influence of natural resources
and market size vis‐à‐vis government policy, host country’s institutions and political
instability in attracting FDI to SSA. The main result is that countries that are endowed with

6
natural resources or have large markets will attract more FDI. However, good infrastructure,
an educated labour force, macroeconomic stability, openness to FDI, an efficient legal
system, less corruption and political stability also promote FDI. According to the author, her
findings suggest that small countries and/or countries that lack natural resources in the region
can also attract FDI by improving their institutions and policy environment. The analysis
utilises annual panel data for 22 countries in SSA over the period 1984-2000.
Asiedu (2002) explores whether factors that affect FDI in developing countries affect
countries in SSA differently. The author finds that SSA is different from other developing
regions as far as FDI attractiveness is concerned. Indeed, the paper finds that: (a) a higher
return and better infrastructure have a positive effect on FDI to non-SSA but not to SSA; (b)
trade openness promotes FDI in SSA and non-SSA countries, but the marginal effect of
openness is lower for SSA. This is a cross-sectional analysis with data from 71 developing
countries (32 SSA and 39 non-SSA countries), and the data are averaged over the 10-year
period, 1989-1997.
In the same line with her 2002 paper, Asiedu (2004) analyses the relative performance
of SSA compared to other developing regions in attracting FDI, as well as in improving the
environment for FDI. The author argues that SSA’s share of FDI to developing countries has
declined over time, because of less attractiveness of SSA for FDI over time, relative to other
developing regions. The main finding is that, with regard to FDI determinants, SSA’s
experience can be characterised as absolute progress but relative decline. Indeed, from
1980‐89 to 1990‐99, SSA has reformed its institutions, improved its infrastructure and
liberalised its FDI regulatory framework. However, compared with other developing regions,
the degree of changes in SSA has been meagre. The analysis focused on policy-related
factors like openness to FDI, infrastructure and quality of institutions. This is not an
econometric analysis, but a statistical analysis comparing the average performance of SSA to
other developing regions.
Bende-Nabende (2002) provides an empirical assessment of the factors that
significantly influence the long-run FDI inflows in SSA. The empirical evidence based on a
co-integration analysis of 19 African countries suggests that the most dominant long-run
determinants of FDI in SSA are market growth, export-orientation policy and FDI
liberalisation. These are followed by real exchange rates, market size and openness. The
analysis covers the period 1970-2000.
7
Lemi and Asefa (2002) examine the impact of economic and political uncertainty on
FDI flows to African economies. Total FDI flows from all source countries, total U.S. FDI,
U.S. manufacturing FDI, and U.S. nonmanufacturing FDI flows to sample host countries in
Africa are analyzed. Generalized autoregressive heteroscedastic (GARCH) model is used to
generate economic uncertainty indicators of the inflation rate and the real exchange rate. The
results of the study are as follows: (a) The impact of uncertainty on the flows of FDI from all
source countries is insignificant. (b) For aggregate U.S. FDI, economic and political
uncertainties are not major concerns. (c) For U.S. manufacturing FDI, only political
instability and government policy commitment are important factors, whereas for U.S. non-
manufacturing FDI, economic uncertainties are the major impediments only when coupled
with political instability and debt burden of host countries. Other economic factors such as
labour, trade connection, size of export sector, external debt, and market size are also
significant in affecting FDI flows to African economies. The period of analysis for the flows
of FDI from all source countries is 1987-1999; whereas for U.S. FDI flows available data
spans from 1989-1998. The analysis covers 32 African countries.
Yasin (2005) empirically investigates the relationship between official development
assistances and FDI flows using panel data from 11 SSA countries for the period 1990-2003.
The results show that bilateral official development assistance has a significant and positive
effect on FDI flows. The results also show that trade openness, growth rate in the labour
force, and exchange rates have a positive and significant effect on FDI. But multilateral
development assistance, the growth rate in GDP per capita, the country’s composite risk
level, and the index for political freedom and civil liberties do not have a statistically
significant effect on FDI.
Anyanwu (2012) analyses factors that influence FDI inflows in Africa. The paper
finds that market size, openness to trade, rule of law, foreign aid, natural resources, and past
FDI inflows have a positive effect on FDI inflows. However, higher financial development
has a negative effect on FDI inflows. The paper also finds that East and Southern African
sub-regions appear positively disposed to obtain higher levels of inward FDI. The paper uses
cross-country data from 53 countries for the period 1996-2008.
Dupasquier and Osakwe (2006) examine the performance, promotion, and prospects
for FDI in Africa. Factors such as political and macroeconomic instability, low growth, weak
infrastructure, poor governance, inhospitable regulatory environments, and ill-conceived
investment promotion strategies, are identified as responsible for the poor FDI record of the
8
region. The paper emphasises the need for more trade and investment relations between
Africa and Asia. It also argues that countries in the region should pay more attention to the
improvement of relations with existing investors and offer them incentives to assist in
marketing domestic investment opportunities to potential foreign investors. Finally, the paper
emphasises the need for concerted efforts at the national, regional, and international levels in
order to attract significant investment flows to Africa given the intensification of competition
for FDI among developing countries.
The above reviewed papers are important contributions to the literature. However,
these papers have three main limitations. First, most of the existing studies on FDI
determinants in Africa use cross-sectional data and do not deal with endogeneity issues.
However, with cross-sectional data, one cannot control for country and time fixed effects,
which causes omitted variables bias and therefore, bias in the estimations. Second, most of
the papers use data from the 1980s, 1990s and early 2000s. By doing so, the existing studies
do not cover early or latest years; thus, they do not provide comprehensive time coverage for
the analysis. The exceptions are Bende-Nabende (2002) who uses data going back to the
1970s, but the year 2000 is the latest year covered by the study; and Anyanwu (2012) who
uses data spanning to the year 2008, but 1996 is the earliest year covered by the study.
However, the findings of the studies can be sensitive to the period of analysis and may
change if the period of analysis covers a larger number of years. Third, the existing papers are
not comprehensive in the sense that they cover few African countries (except Anyanwu,
2012). Indeed, in the other cases, the number of countries included in the studies ranges
between 11 and 32.
This paper contributes to the literature by analysing factors that drive FDI flows,
whilst seeking to find solutions to the limitations of the existing papers. To deal with the first
limitation, I use panel data with the system-GMM technique, which allows controlling for
country and time fixed effects whilst correcting for the endogeneity of the explanatory
variables. The review of literature shows that, this would be the first paper that uses the
system-GMM technique to analyse the determinants of FDI inflows in Africa. To deal with
the second limitation, I use FDI inflows data over the period 1970-2009. As highlighted by
the review of literature, this would be the first paper that uses FDI data over such a long
period. This paper uses FDI data from 53 African countries, which allows a comprehensive
analysis of the determinants of FDI flows to Africa.
9
4. Empirical analysis
According to the OLI paradigm, three advantages can explain why multinational
enterprises (MNEs) invest outside their home countries, or why FDI occur (Dunning, 2001).
These are ownership, locational and internalisation advantages, giving the name to the OLI
paradigm.
The ownership advantages are specific to the firms, and are advantages to overcome
the extra costs of operating in a different or less familiar environment. These advantages are
costly to generate, but can be transferred from one location to another at low cost. Examples
of ownership advantages are firm-specific technology, brand names, managerial skills that
enable MNEs to operate competitively with local enterprises in less favourable environment
to MNEs. The locational advantages are specific to the locations or countries where FDI
occur. These are advantages that make a country or a location attractive for FDI. The
locational advantages can be economic, political or social country-specific factors that attract
FDI to a country. Some locational advantages are controllable by policy makers, i.e., policy
makers can influence those factors in order to improve their countries’ attractiveness to FDI.
Examples of “controllable” locational advantages are good infrastructure, well educated
population, macroeconomic stability, political stability, just to cite a few. Other locational
advantages are not controllable by policy makers; an example is natural resources
endowment. The internalisation advantages are advantages that justify why MNEs decide to
internalise their ownership advantages directly by investing instead of selling them to other
firms. The internalisation advantages can explain vertical FDI, where a production process or
function is located abroad by MNEs to serve its production system, instead of subcontracting
to independent suppliers.
4.1 Model specification and sources of the data
The OLI paradigm highlights that firms specific advantages and country specific
advantages can explain why FDI occur or do not occur. Based on the OLI paradigm, this
paper’s empirical analysis focuses on locational advantages, and more specifically, on the
locational advantages that are controllable by policy makers. By doing so, it is possible to
highlight African countries’ specific advantages that can be influenced by policy makers to
attract more FDI to the continent. Thus, I estimate the following model:
(FDI/GDP)it = c + α(FDI/GDP)it-1 + βXit + ui + vt + εit (1)

10
The explained variable is net FDI inflows as a percentage of GDP; this is a commonly
used indicator in empirical studies on the determinants of FDI inflows. More specifically,
data on FDI inflows measure the amount of investment by non-resident investors with a
minimum of 10% of companies’ shares. Net FDI inflows are the sum of new capital invested,
profits reinvested, and inter-enterprises capital invested, all corrected from transfers of capital
in the home countries of foreign investors and the reimbursements of debt. FDI data are from
the UNCTAD database.
The first explanatory variable is five-year lagged FDI inflows as a percentage of GDP.
Because of the agglomeration effect, I expect a positive and significant effect of the lagged
FDI inflows on current FDI inflows. The intuition is that because of information and
knowledge sharing, the presence of FDI in a country will attract more FDI flows from the
same home country or other countries. In addition, the use of lagged-value of FDI inflows as
an explanatory variable allows controlling for initial conditions, like for instance the presence
of natural resources that may attract FDI to a country.
The list of explanatory variables includes X, which stands for a matrix of other
potential factors that can attract or deter FDI in a country. The X vector comprises the
following policy-related variables.
Trade openness. The effect of trade openness on FDI inflows depends on the type of
FDI. When a country receives market-seeking FDI, i.e. when foreign firms aimed at serving
local market, trade openness may reduce FDI inflows. The reason is the “tariff jumping”
theory, which argues that multinational firms that seek to serve local markets may decide to
set up subsidiaries in the host country when it is difficult to import their products in that
country. In contrast, multinational firms that are engaged in export-oriented activities may
prefer to locate in a more open economy, since trade protectionism may increase transaction
costs; thereby, reducing economic competitiveness and exports. Thus, the effect of trade
openness on FDI inflows is ambiguous. However, several authors have found that countries
that are more engaged in international trade, i.e. more open countries receive more FDI (see
Asiedu, 2002; Noorbakhsh et al., 2001; Morrisset, 2000; Aizenman and Noy, 2006).
As an indicator for trade openness, I use the sum of exports and imports as a
percentage of GDP; this is a commonly used indicator for trade openness in the literature.
Infrastructure Development. Several studies highlight the role of physical
infrastructure in economic growth and development (see the World Bank, 1994; Temple

11
1999; Demurger, 2001; Willoughby, 2003). Beyond its direct effect on economic growth,
good infrastructure may also affect economic growth by increasing the productivity of
investment and stimulates investment, either foreign or domestic. Empirically, Wheeler and
Mody (1992) find that good infrastructure is an important factor for developing countries
seeking to attract FDI from the United States. In a cross-sectional study, Loree and Guisinger
(1995) find that countries with developed infrastructure receive more FDI from the United
States than countries with less developed infrastructure. Other authors have also found a
positive effect of infrastructure on FDI (see Kumar, 2001; Asiedu, 2002; Kinda, 2010;
Ngowi, 2001; Jenkins and Thomas, 2002).
As a proxy for available physical infrastructure, I use the natural logarithm of the sum
of the number of mobile phone and telephone lines per 100 people, and I expect a positive
effect of this variable on FDI inflows.4
Macroeconomic stability. Macroeconomic stability is generally cited as one of the
factors that MNEs consider when deciding to locate in developing countries. For instance,
Asiedu (2006) reviews the results of four surveys on business environment and finds that
macroeconomic instability is cited as one of the deterrents to FDI in Africa. High inflation
rate is a sign of macroeconomic instability and a source of uncertainty in the economy. High
inflation rate may create uncertain economic environment and makes it difficult for economic
agents to extract correct signals from relative prices (Barro, 1976 and 1980). By creating
uncertain economic environment, high inflation rate reduces the expected return to
investment and so the volume of investment. Empirically, Asiedu (2006) finds that African
countries with high inflation rate less attract FDI. Based on case studies relating to seven
African countries that had attracted a significant amount of FDI, Basu and Srinivasan (2002)
conclude that macroeconomic stability was one of the factors that rendered these countries
more attractive to FDI. Likewise, Braga de Macedo et al. (2009) assess the determinants of
Chinese direct investment in Africa compared with those of global FDI. They find that
macroeconomic stability (measured by low inflation rate) is positively correlated with
Chinese and global FDI in Africa.
4 Another proxy for physical infrastructure could be electric power production or the number of paved roads.
However, these alternative proxies for physical infrastructure are not available for most of the countries and for
a large part of the analysis period. Moreover, instead of analysing only the effect of infrastructure availability,
the analysis could also consider the quality of infrastructure. However, because of data availability constraint;
this cannot be done.
12
As a measurement for inflation rate, I use the annual growth rate of consumer price
index. To correct for the effect outlier observations, I use the following variable: log (1 +
inflation rate). I expect a negative effect of inflation rate on FDI inflows.
Political Stability. Political instability can be harmful for investment and for a
country’s economic performance broadly speaking. It is not surprising that a country’s level
of political stability is one the factors that firms’ executive directors consider when making
decision for the location and the amount of investment (see for example Asiedu, 2006).
Indeed, political instability entails uncertainty when it induces change of policy makers and
economic policies. For instance, when following a political regime change, there is
repudiation of former contracts with foreign firms, the risk of expropriation increases, which
reduces the volume of FDI. Likewise, political instability in the form of civil war can destroy
a country’s physical and human capital infrastructure, which is deterrent to the productivity
of investment. Empirically, Asiedu (2006) finds that political instability negatively affects
FDI inflows in Africa. In the same vein, Woodward and Rolfe (1993) find that political
stability increases the probability that a country is selected as an investment location. Similar
results have been found by Globerman and Shapiro (2003) and Li (2006).
For the empirical analysis, I use the political risk index from the International Country
Risk Guide (ICRG). The political risk index is a composite index of twelve different
components. The index ranges between 0% and 100%, the higher the index, the lower the
country’s level of political risk.5
Return to investment. By definition, FDI activities should be profitable; therefore,
FDI will go to countries that pay higher return to capital. The intuition is clear but testing it
can be problematic, especially in Africa where most of the countries do not have well-
functioning capital markets, making it difficult to measure the return on capital. As a proxy
for the return to investment, I use the inverse of natural logarithm of real GDP per capita and
I expect a positive effect of this variable on FDI inflows. Indeed, since capital-scarce
countries tend to be poor; this implies that investment in countries with a higher income per
capita would yield lower return to investment, which suggests a positive link between the
inverse of real GDP per capita and FDI inflows. The inverse of real GDP per capita has also
been used as a proxy for the return to investment by Asiedu (2002), Jaspersen et al. (2000),
5 More details on political risk index can be found from the following website link:
http://www.prsgroup.com/ICRG_Methodology.aspx#PolRiskRating.
13
and Edwards (1990). I use GDP per capita (constant 2000 US$) as a measurement for real
income per capita.
Size of host countries’ domestic markets. Countries with larger domestic markets
are likely to attract more FDI, especially when FDI inflows aim at serving domestic market.
Thus, one can expect a positive link between the size of domestic market and FDI inflows. As
a proxy for domestic market, I use the natural logarithm of a country’s population size.
All the explanatory variables except the political stability are from the World Bank,
2012 World Development Indicators. As outlined before, my objective is to focus on
“controllable factors”, which means I focus my analysis on factors that can be influenced by
policy makers in order to attract more FDI to their countries. However, given the techniques
of estimation that I use, the risk of bias in the estimation would be minimized. Moreover,
later on, for robustness checks, I also examine the effect of natural resources on FDI inflows.
4.2 Methods of econometric estimation
As outlined in equation (1), I use panel data whilst controlling for country and time
fixed effects. More specifically, I use non-overlapping five-year averages panel data to run
regressions. The use of five-year averages data allows smoothing fluctuations in FDI data. By
controlling for country and time fixed effects, I reduce omitted variables bias and thus
endogeneity bias in the estimations. Indeed, some unobservable factors, like ideological
values can affect FDI flows; however, without controlling for country fixed effects it would
not be possible to consider the effects of those factors despite their importance. On the other
hand, time fixed effects enable to control for the effects of events that determine FDI flows
simultaneously in several countries. An example of such event is oil crises in the 1970s, or
debt crisis in the 1980s, or the recent global crisis.
The use of time and country fixed effects can reduce omitted variables bias. However,
this may not be enough to deal properly with endogeneity issues, especially in a dynamic
panel model that includes lagged value of the dependent variable in the list of independent
variables, as it is the case in this paper. Such a model suffers from endogeneity bias,
especially when the time dimension of the panel data is short (Nickell, 1981). Moreover,
some variables like trade openness for instance, may have a bidirectional relation with FDI;
thereby, causing bias in the econometric estimations (see Aizenman and Noy, 2006). To deal
with this situation, I use the system-GMM technique, proposed by Blundell and Bond (1998).
This technique has been proved more efficient in estimating a dynamic panel model, and it

14
has an additional advantage of dealing with the endogeneity of all the explanatory variables
by using their lagged values (in level and in first difference) as instrumental variables.
This paper uses five-year panel data from 53 African countries over the period 1970-
2009. However, some of the variables, like the political stability index for instance, is not
available for all the period of analysis; therefore, I use unbalanced panel data. I use two
econometric techniques to run regressions: the fixed effects model, and the system-GMM
technique. However, my comments will focus on the results found with the system-GMM
technique because those results are corrected from endogenity bias and thus, are more
convincing.
5. Results
According to the results in Table 2, in the system-GMM model, five variables are
positively and significantly linked with FDI inflows. The fixed effects model confirms this
result except that in the latter model, the lagged FDI inflows is not significant, though it has a
positive effect on FDI inflows, as expected. Moreover, the Hansen-Sargan test shows that the
lagged-values of the endogenous variables used as instruments are valid.
In the system-GMM model, the coefficient associated with the lagged-value of FDI
inflows is positive and significant at the 1% level. The result shows that a one percentage
point increase in the lagged value will increase the ratio of FDI inflows to GDP by 0.5 points.
The coefficient associated with lagged FDI inflows indicates that FDI are persistent in Africa.
This result also reveals the existence of agglomeration effect in FDI activities, and it suggests
that the presence of FDI in a country today will attract more FDI to that country in the future.
The coefficient associated with trade openness is positive and significant at the 5%
level. According to the result, a 10 percentage point increase in trade openness will increase
the ratio of FDI to GDP by 0.01 points. This result suggests that trade openness is a catalyst
factor for the improvement of African countries’ attractiveness to FDI.
The results in Table 2 also show that more politically stable African countries attract
more FDI. More specifically, according to the result, a 10 percentage point increase in the
political stability index will increase FDI inflows as a percentage of GDP by 0.01 points.
Thus, political stability has a similar effect as trade openness on FDI inflows in Africa. This
suggests that in their efforts to attract FDI, African governments should give the same weight
to political stability as they give to trade openness.

15
The coefficient associated with the natural logarithm of population is positive and
significant at the 5% level. This suggests that larger countries or countries with larger
domestic markets attract more FDI. More specifically, according to the result, a doubling in
the domestic markets size (approximated by the size of population) will increase the ratio of
FDI inflows to GDP by 1.3 points.
Table 2: Baseline results
(1) (2)
VARIABLES FDI inflows (%GDP)
Fixed Effect
FDI inflows (%GDP)
System-GMM
Five-year lagged FDI inflows 0.244 0.465***
(1.47) (4.08)
Trade openness 0.0006*** 0.001**
(2.97) (2.57)
Log(1 + inflation rate) -0.002 -0.0004
(0.65) (0.07)
Political stability 0.0005** 0.001**
(2.15) (2.09)
Infrastructure 0.002 0.004
(0.47) (0.40)
Market size = log (population) 0.085** 0.013**
(2.57) (2.30)
ROI1 = 1/[log (GDP per capita)] 5.325*** 8.147**
(2.91) (2.40)
Constant -1.462*** -0.359***
(2.66) (3.02)
Observations 180 180
R-squared (adjusted) 0.73 -
Number of countries 36 36 Sargan-Hansen test2 - 0.138 AR(1)3 - 0.033 AR(2)3 - 0.123
Note: ***, **, * denote significant coefficients at 1%, 5% and 10% level. The figures in brackets are robust t-
student. All the estimations include time fixed effects whose coefficients are not reported.
1/ Stands for return on investment.
2/Stands for the p-values associated with the Sargan-Hansen test. The p-values show that the lagged values of
the endogenous variables that I use as instruments in the system-GMM model are good.
3/ Stands for the p-values associated with the test of absence of autocorrelation of second order. The result
shows that there is no such autocorrelation in the data; thereby, validating the use of lagged variables of a
minimum of two periods as instruments in the system-GMM model.
According to the results in Table 2, African countries that offer higher return to
investment attract more FDI. In that sense, Africa is not different from the rest of the world.
Indeed, regardless of the world’s region, investments are supposed to rise where they are
profitable. The coefficient associated with the return on investment (approximated by the
inverse of the natural logarithm of real GDP per capita) is positive and significant at the 5%
level. More specifically, the result suggests that a one percentage increase in the return to
16
investment will increase FDI inflows as a percentage of GDP by 8 points in Africa. This is
higher than the sample mean value of the ratio of FDI inflows to GDP (2.7%, see appendix).
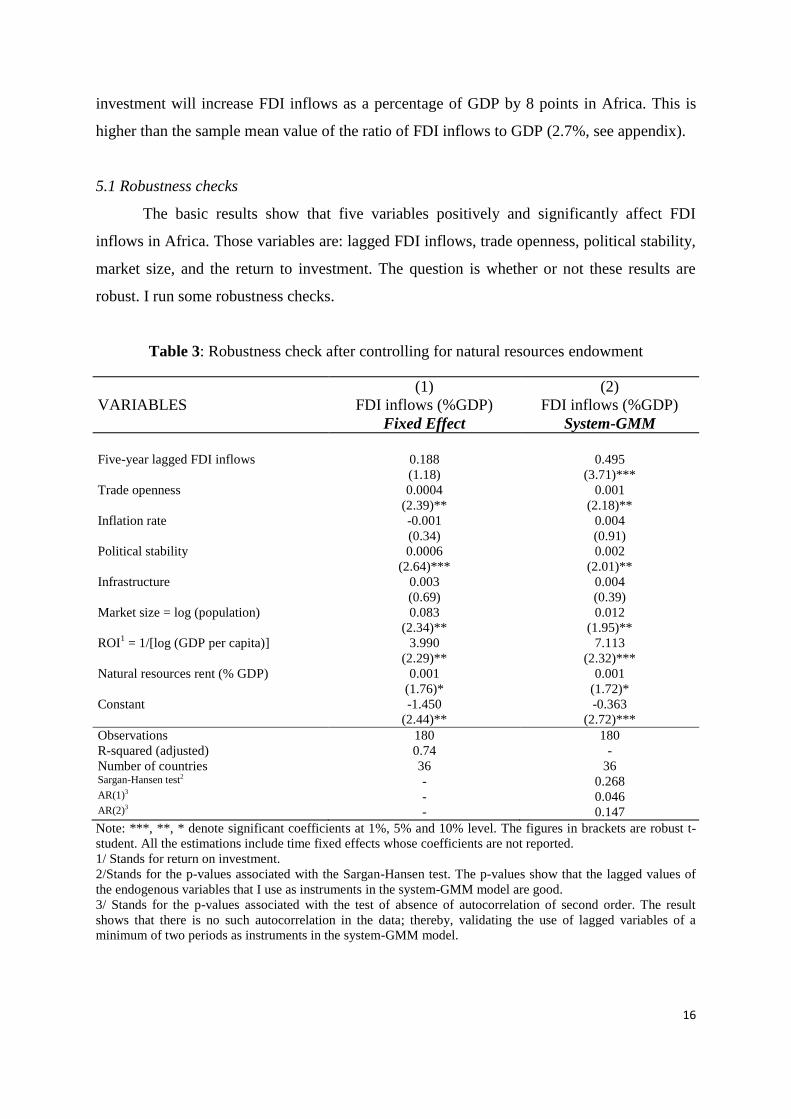
5.1 Robustness checks
The basic results show that five variables positively and significantly affect FDI
inflows in Africa. Those variables are: lagged FDI inflows, trade openness, political stability,
market size, and the return to investment. The question is whether or not these results are
robust. I run some robustness checks.
Table 3: Robustness check after controlling for natural resources endowment
(1) (2)
VARIABLES FDI inflows (%GDP)
Fixed Effect
FDI inflows (%GDP)
System-GMM
Five-year lagged FDI inflows 0.188 0.495
(1.18) (3.71)***
Trade openness 0.0004 0.001
(2.39)** (2.18)**
Inflation rate -0.001 0.004
(0.34) (0.91)
Political stability 0.0006 0.002
(2.64)*** (2.01)**
Infrastructure 0.003 0.004
(0.69) (0.39)
Market size = log (population) 0.083 0.012
(2.34)** (1.95)**
ROI1 = 1/[log (GDP per capita)] 3.990 7.113
(2.29)** (2.32)***
Natural resources rent (% GDP) 0.001 0.001
(1.76)* (1.72)*
Constant -1.450 -0.363
(2.44)** (2.72)***
Observations 180 180
R-squared (adjusted) 0.74 -
Number of countries 36 36 Sargan-Hansen test2 - 0.268 AR(1)3 - 0.046 AR(2)3 - 0.147
Note: ***, **, * denote significant coefficients at 1%, 5% and 10% level. The figures in brackets are robust t-
student. All the estimations include time fixed effects whose coefficients are not reported.
1/ Stands for return on investment.
2/Stands for the p-values associated with the Sargan-Hansen test. The p-values show that the lagged values of
the endogenous variables that I use as instruments in the system-GMM model are good.
3/ Stands for the p-values associated with the test of absence of autocorrelation of second order. The result
shows that there is no such autocorrelation in the data; thereby, validating the use of lagged variables of a
minimum of two periods as instruments in the system-GMM model.
17
In this paper, I made the choice to focus on policy-related factors for the analysis of
the drivers of FDI to Africa. Thus, in the baseline model I did not control for the effect of
natural resources endowment. However, given the importance of natural resources in the
attractiveness of FDI to Africa, it is possible to suspect that the results may be driven by the
absence of natural resources in the list of explanatory variables. To deal with this situation, as
a first robustness check, I run regressions whilst controlling for the effect of natural resources
endowment. As a proxy for natural resources endowment, I use the total natural resources
rent as a percentage of GDP. This variable is from the World Bank, 2012 World
Development Indicators. As we can see from Table 3, natural resources have a positive and
significant effect on FDI inflows in Africa, but controlling for natural resources does not call
into question the results that I initially found.
The results of the rest of robustness checks are reported in the appendix. The second
robustness check that I carry out consists of running regressions with a sub-sample of SSA
countries. By doing so, it is possible to check whether or not the results are also valid in the
sub-sample of SSA countries.6 As one can see, the results with the sub-sample of SSA
countries are qualitatively similar to those that I initially found. In other words, in the sub-
sample of SSA countries, lagged FDI inflows, trade openness, political stability, market size,
and the return to investment positively and significantly affect FDI inflows.
The analysis of the trend of FDI shows that from the 1980s, FDI inflows steadily
increase in Africa. Thus, it is important to check whether or not the results will change if the
analysis focuses only on the period during which the continent experienced a steady increase
in FDI inflows. To do so, I run regressions with data covering the period 1980-2009 only.
Table A3 shows qualitatively similar results with data over the period 1980-2009, like those I
found with data over the period 1970-2009. Thus, the results do not change with the period of
analysis.
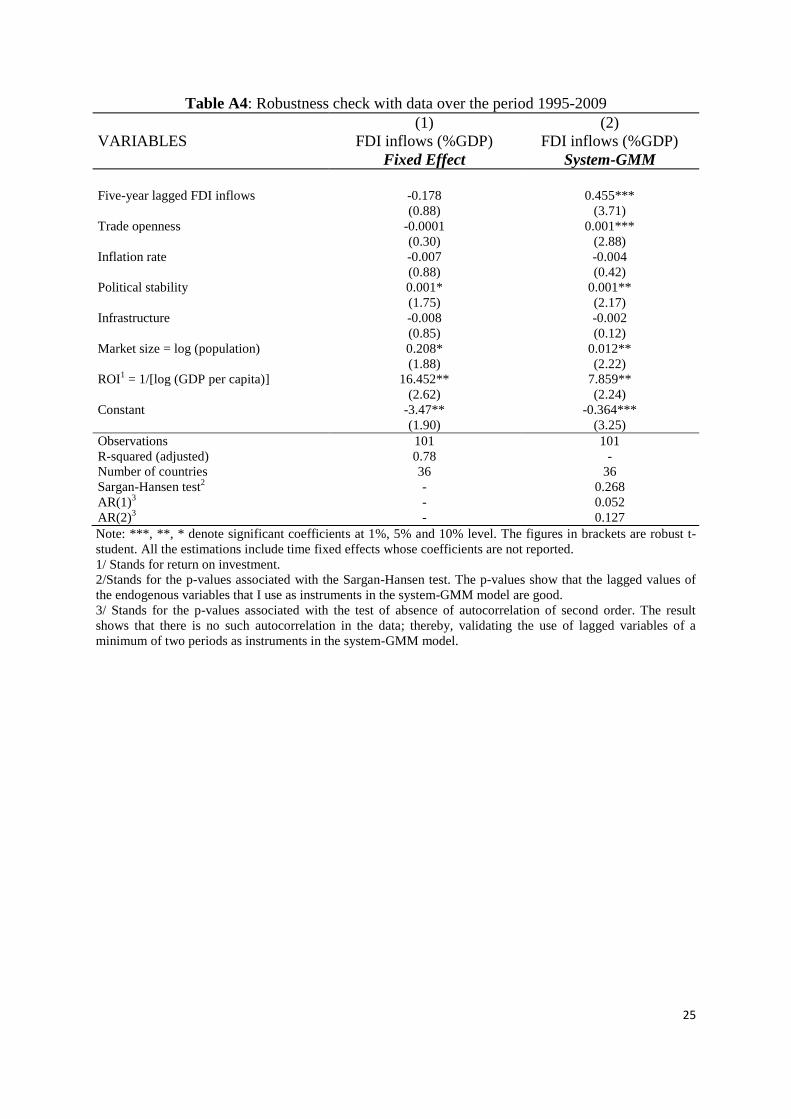
Instead of the period 1980-2009, I run regressions with data over the period 1995-
2009. Indeed, the analysis of FDI trend shows that during the period 1995-2009, the increase
in FDI inflows has accelerated in Africa. Thus, it is important to check whether or not the
five variables have the same effects on FDI inflows during the period of FDI acceleration.
The results in the appendix show that with data over the period 1995-2005, lagged FDI
6 SSA countries are the 53 African countries excluded the following six countries that are considered Middle
East and Northern African countries according to the World Bank country classification: Algeria, Djibouti,
Egypt, Libya, Morocco and Tunisia.

18
inflows, trade openness, political stability, market size, and the return to investment have
positive and significant effects on FDI inflows. This confirms the results that I initially found.
6. Conclusion
In this paper I analyse factors that drive FDI flows to Africa. For the first time in the
literature, I use five-year panel data over the period 1970-2009 with the system-GMM
technique including 53 African countries. The analysis focuses on policy-related factors, i.e.
factors that policy makers can influence to attract more FDI to their countries. The results
show that five variables are significantly and positively linked with FDI inflows. These
variables are: lagged FDI inflows, trade openness, political stability, market size, and the
return to investment.
Based on the findings of the paper, three policy stances can be suggested for the
efforts that African policy makers can do to improve the continent’s attractiveness to FDI.
Firstly, the fact that lagged FDI inflows have a positive and significant effect on current FDI
inflows indicates the persistence of FDI and the existence of agglomeration effects in FDI
activities in Africa. This suggests that the presence of FDI today in a country will attract
more FDI to that country in the future. Thus, African governments need to collaborate with
existing foreign investors in their countries in order to promote their countries to other
potential investors. For instance, country promotion trips can be organised between
government officials and existing foreign investors. Thus, African countries should avoid
mistreating traditional western foreign investors because of the arrival of new potential
investors from China or other southern emerging countries. An appropriate strategy would be
to work hand in hand with existing investors for the promotion of African countries. By doing
so, it is possible to change the perceptions about Africa and new foreign investors will
consider the continent as a destination for their investments.
Secondly, this paper highlights the need to strengthen regional integration in Africa
because regional integration can boost some of the factors that contribute to the development
of FDI in Africa. Indeed, the paper finds that lager countries, more open countries and more
politically stable countries attract more FDI. It is important to note that regional integration
can boost each of these three factors. Indeed, regional integration creates larger domestic
markets, stimulates trade and thereby can contribute to FDI attractiveness to the continent.
Regional integration can also contribute to ensure political stability across the continent.

19
Thus, this paper’s findings suggest that African countries can use regional integration to
attract FDI because regional integration can increase trade openness, enlarge the size of
domestic markets, and generate more political stability.
Thirdly, the paper highlights the need to improve the return to investment in Africa.
By doing so, African countries can attract more FDI. It is true that by international standards,
the return to investment is higher in Africa. However, African countries should strive
maintaining and improving the return to investment, because of fierce competition among
developing countries for the attractiveness of FDI. To improve the return to investment,
African countries should increase the quantity as well as the quality of physical infrastructure.
Likewise, the skills of labour force should be improved. Unskilled labour force and poor
infrastructure hamper the return to investment in Africa. Thus, by finding solutions to poor
infrastructure and unskilled labour force, the return to investment will rise and investors will
seize the opportunity to increase their investments in Africa.

20
References
Aizenman, J., and Noy, I. (2006). “FDI and Trade—Two-Way Linkages?” Quarterly Review
of Economics and Finance 46 (3):317–37.
Asiedu, E. (2006). “Foreign Direct Investment in Africa: The Role of Natural Resources,
Market Size, Government Policy, Institutions and Political Stability,” World Economy
29 (1): 63‐77.
——— (2004). “Policy Reform and Foreign Direct Investment in Africa: Absolute Progress
but Relative Decline,” Development Policy Review 22 (1): 41‐48.
——— (2002). “On the Determinants of Foreign Direct Investment to Developing Countries:
Is Africa Different?,” World Development 30 (1): 107‐19.
Anyanwu, J.C. (2012). “Why Does Foreign Direct Investment Go Where It Goes?: New
Evidence From African Countries,” Annals of Economics and Finance 13 (2): 433-70.
Barro, R. J. (1976) “Rational Expectations and the Role of Monetary Policy,” Journal of
Monetary Economics 2 (1): 1-32.
________ (1980) “A Capital Market in an Equilibrium Business Cycle Model,”
Econometrica 48 (6): 1393-417.
Basu, A., and Srinivisan, K. (2002) “Foreign Direct Investment in Africa-Some Case
Studies,” IMF Working Paper No.61. IMF: Washington, DC.
Bende‐Nabende, A. (2002). “Foreign Direct Investment Determinants in Sub‐Saharan Africa:
A Co‐Integration Analysis,” Economics Bulletin 6 (4): 1‐19.
Blomstorm, M, and Kokko, A. (1998) “Multinational Corporations and Spillovers,” Journal
of Economic Surveys 12 (3): 247-77.
Braga de Macedo J., Pereira, L. B., and Lopes, J. M. (2009) “Drivers of China’s Foreign
Direct Investment into Africa: How Specific?,” revision of paper presented at ABCDE
2007 in South África.
Blundell, R., and Bond, S. (1998). “Initial conditions and moment restrictions in dynamic
panel data models,” Journal of Econometrics 87 (1): 115-43.
De Melo, L.R. (1997) “Foreign Direct Investment and Growth in Developing Countries and
Growth: A Selective Survey,” Journal of Development Studies 34 (1): 1-34.
Demurger, S. (2001) “Infrastructure Development and Economic Growth: An Explanation for
Regional Disparities in China?” Journal of Comparative Economics 29 (1):95‐117.
Dunning, J.H. (2001). “The Eclectic (OLI) Paradigm of International Production: Past,
Present and Future,” International Journal of the Economics of Business 8(2): 173-90.
Dupasquier, C. and Osakwe, P. (2006). “Foreign Direct Investment in Africa: Performance,
Challenges, and Responsabilities,” Journal of Asian Economics 17 (2): 241‐60.
Edwards, S. (1990). “Capital Flows, Foreign Direct Investment, and Debt-Swap in
Developing Countries,” NBER working paper no. 3497. Cambridge, MA: NBER.
Globerman, S., and Shapiro, D. (2003). “Governance Infrastructure and US Foreign Direct
Investment in the Caribbean Basin,” Journal of International Business Studies 24 (1):
121-44.
Jaspersen, F.Z., Aylward, A.H., and Knox, A.D. (2000). “The effect of Risk on Private
Investment: Africa compared with Other Developing Areas,” in P. Collier and C.
Patillo (Eds), Investment and Risk in Africa. New York: St martin’s Press.
Jenkins, C., and Thomas, L. (2002). “Foreign Direct Investment in Southern Africa:
Determinants, Characteristics and Implications for Economic Growth and Poverty
Alleviation,” available at: http://www.csae.ox.ac.uk/reports/pdfs/rep2002-02.pdf.
Kinda, T. (2010). “Investment Climate and FDI in Developing Countries: Firm-Level
Evidence,” World Development 38 (4): 498-513.
21
Kumar N. (2001). “Infrastructure Availability, Foreign Direct Investment Inflows and Their
Export orientation: A Cross-Country Exploration,” available at:
http://depot.gdnet.org/cms/conference/papers/3rd_day2_6_nkumar.pdf.
Lemi, A. and Asefa. S. (2003). “Foreign Direct Investment and Uncertainty: Empirical
Evidence from Africa,” African Finance Journal 5 (1): 36‐67.
Li, Q. (2006) “Political Violence and Foreign Direct Investment,” in Research in Global
Strategic Management, Volume 12, Regional Economic Integration, pp. 225-49,
edited by Michele Fratianni and Alan M. Rugman. Elsevier Ltd.
Loree, D. W., and Guisinger, S. E. (1995). “Policy and Non-Policy Determinants of U.S.
Equity Foreign Direct Investment,” Journal of International Business Studies 26 (2):
281-299.
Mody, A., and Murshid, A. P. (2002) “Growing Up with Capital Flows,” IMF Working
PaperNo.75. IMF: Washington, DC.
Morisset, J. (2000). “Foreign Direct Investment in Africa: Policies Also Matter,”
Transnational Corporations 9 (2): 107‐25.
Ngowi, H. P. (2001). “Can Africa Increase Its Global Share of Foreign Direct Investment,”
West Africa Review 2 (2): 1-9.
Nickell, S. (1981). “Biases in dynamic models with fixed effects,” Econometrica 49 (6):
1417-26.
Noorbakhsh, F., Poloni, A. and Yousseff, A. (2001) “Human Capital and FDI Flows to
Developing Countries: New Empirical Evidence,” World Development 26 (7): 1593
1610.
Temple, J. (1999) “The New Growth Evidence,” Journal of Economic Literature 37(1): 112
156.
Wheeler, D., and Mody, A. (1992) “International Investment Location Decisions: The Case
of U.S. Firms,” Journal of International Economics 33 (1-2): 57-76.
Willoughby, C. (2003) “Infrastructure and Pro-Poor Growth: Implications of
RecentResearch,” available at:
http://www.dfid.gov.uk/r4d/PDF/Outputs/EngKar/Infrastructure_and_ProPoorGroh.p
df.
Woodward, D. and Rolfe, R. (1993). “The Location of Export-Oriented Foreign Direct
Investment,” Journal of International Business Studies 34 (1):19-40.
World Bank (1994) World Development Report 1994. Oxford: Oxford University Press.
Yasin, M. (2005). “Official Development Assistance and Foreign Direct Investment Flows to
Sub‐Saharan Africa,” African Development Review 17 (1): 23‐40.

22
Appendix
Table A1: Statistical description of the main variables
Variable Observations Mean Standard
Deviation
Minimum Maximum
FDI inflows (%
GDP)
377 2.8 5 -4.9 38
Five-Year Lagged
FDI inflows (%
GDP)
325 2.3 4.6 -4.9 38
Trade openness (%
GDP)
374 78.61 36 12.9 224.2
Log (1 + Inflation
rate)
325 0.160 0.409 -0.316 4.466
Political stability 209 52.8 12.1 15.3 78.7
Infrastructure 400 6.9 16.4 0.02 122.4
Log (population) 424 15.3 1.6 10.9 18.8
Domestic market
size
370 0.002 0.002 0.0001 0.01
List of the countries
Countries included in the analysis are indicated below. Countries marked with one star are
not sub-Saharan African countries and are considered as Middle East and Northern African
countries according to the World Bank’s country classification. Thus, in this paper by African
countries, we mean sub-Saharan countries and the 6 other non-sub-Saharan African countries.
Algeria*, Angola, Benin, Botswana, Burkina Faso, Burundi, Cameroon, Cape Verde, Central
African Republic, Chad, Congo, Dem. Rep., Congo, Rep., Cote d'Ivoire, Djibouti*,
Equatorial Guinea, Egypt*, Eritrea, Ethiopia, Gabon, Gambia, Ghana, Guinea, Guinea-
Bissau, Indonesia, Kenya, Korea, Rep., Lesotho, Liberia, Libya*, Madagascar, Malawi,
Malaysia, Mali, Mauritania, Mauritius, Morocco*, Mozambique, Namibia, Niger, Nigeria,
Rwanda, Sao Tome and Principe, Senegal, Seychelles, Sierra Leone, Singapore, Somalia,
South Africa, Sudan, Swaziland, Tanzania, Thailand, Togo, Tunisia*, Uganda, Zambia,
Zimbabwe.

23
Table A2: Robustness check excluding Northern African countries from the sample
(1) (2)
VARIABLES FDI inflows (%GDP)
Fixed Effect
FDI inflows (%GDP)
System-GMM
Five-year lagged FDI inflows 0.252 0.489***
(1.44) (4.92)
Trade openness 0.0006*** 0.001**
(2.80) (2.51)
Inflation rate -0.001 -0.0002
(0.31) (0.04)
Political stability 0.001** 0.001*
(1.96) (1.79)
Infrastructure 0.002 -0.0003
(0.38) (0.02)
Market size = log (population) 0.106** 0.010*
(1.96) (1.85)
ROI1 = 1/[log (GDP per capita)] 5.934*** 7.720**
(2.96) (1.93)
Constant -1.815** -0.309**
(2.06) (2.32)
Observations 147 147
R-squared (adjusted) 0.73 -
Number of countries 30 30 Sargan-Hansen test2 - 0.411 AR(1)3 - 0.061 AR(2) 3 - 0.107
Note: ***, **, * denote significant coefficients at 1%, 5% and 10% level. The figures in brackets are robust t-
student. All the estimations include time fixed effects whose coefficients are not reported.
1/ Stands for return on investment.
2/Stands for the p-values associated with the Sargan-Hansen test. The p-values show that the lagged values of
the endogenous variables that I use as instruments in the system-GMM model are good.
3/ Stands for the p-values associated with the test of absence of autocorrelation of second order. The result
shows that there is no such autocorrelation in the data; thereby, validating the use of lagged variables of a
minimum of two periods as instruments in the system-GMM model.

24
Table A3: Robustness check with data over the period 1980-2009
(1) (2)
VARIABLES FDI inflows (%GDP)
Fixed Effect
FDI inflows (%GDP)
System-GMM
Five-year lagged FDI inflows 0.244 0.465***
(1.47) (4.08)
Trade openness 0.0006*** 0.001**
(2.97) (2.57)
Inflation rate -0.002 -0.0004
(0.65) (0.07)
Political stability 0.0005** 0.001**
(2.15) (2.09)
Infrastructure 0.002 0.004
(0.47) (0.40)
Market size = log (population) 0.085** 0.012**
(2.57) (2.30)
ROI1 = 1/[log (GDP per capita)] 5.325*** 8.147**
(2.91) (2.40)
Constant -1.462*** -0.359**
(2.66) (3.07)
Observations 180 180
R-squared (adjusted) 0.73 -
Number of countries 36 36
Sargan-Hansen test2 - 0.138
AR(1)3 - 0.033
AR(2)3 - 0.123
Note: ***, **, * denote significant coefficients at 1%, 5% and 10% level. The figures in brackets are robust t-
student. All the estimations include time fixed effects whose coefficients are not reported.
1/ Stands for return on investment.
2/Stands for the p-values associated with the Sargan-Hansen test. The p-values show that the lagged values of
the endogenous variables that I use as instruments in the system-GMM model are good.
3/ Stands for the p-values associated with the test of absence of autocorrelation of second order. The result
shows that there is no such autocorrelation in the data; thereby, validating the use of lagged variables of a
minimum of two periods as instruments in the system-GMM model.
25
Table A4: Robustness check with data over the period 1995-2009
(1) (2)
VARIABLES FDI inflows (%GDP)
Fixed Effect
FDI inflows (%GDP)
System-GMM
Five-year lagged FDI inflows -0.178 0.455***
(0.88) (3.71)
Trade openness -0.0001 0.001***
(0.30) (2.88)
Inflation rate -0.007 -0.004
(0.88) (0.42)
Political stability 0.001* 0.001**
(1.75) (2.17)
Infrastructure -0.008 -0.002
(0.85) (0.12)
Market size = log (population) 0.208* 0.012**
(1.88) (2.22)
ROI1 = 1/[log (GDP per capita)] 16.452** 7.859**
(2.62) (2.24)
Constant -3.47** -0.364***
(1.90) (3.25)
Observations 101 101
R-squared (adjusted) 0.78 -
Number of countries 36 36
Sargan-Hansen test2 - 0.268
AR(1)3 - 0.052
AR(2)3 - 0.127
Note: ***, **, * denote significant coefficients at 1%, 5% and 10% level. The figures in brackets are robust t-
student. All the estimations include time fixed effects whose coefficients are not reported.
1/ Stands for return on investment.
2/Stands for the p-values associated with the Sargan-Hansen test. The p-values show that the lagged values of
the endogenous variables that I use as instruments in the system-GMM model are good.
3/ Stands for the p-values associated with the test of absence of autocorrelation of second order. The result
shows that there is no such autocorrelation in the data; thereby, validating the use of lagged variables of a
minimum of two periods as instruments in the system-GMM model.