AEBS HDV IWG LPB vs LPS - UNECE
14
AEBS-HDV IWG LPB and LPS AEBS-HDV-03 March 22, 23, 25 - 2021
Transcript of AEBS HDV IWG LPB vs LPS - UNECE

AEBS-HDV IWG
LPB and LPS
AEBS-HDV-03
March 22, 23, 25 - 2021

Content
• AEBS complexity (reminder)
• LCVs – LPB vs LPS
• HCVs• SS ISO 14791
• Avoidance strategies
• Data – LPB vs LPS (trucks and tractors)
• Considerations about brake performance
• How to split performance requirements

AEBS complexity(reminder from AEBS-HDV-SP-02-04)
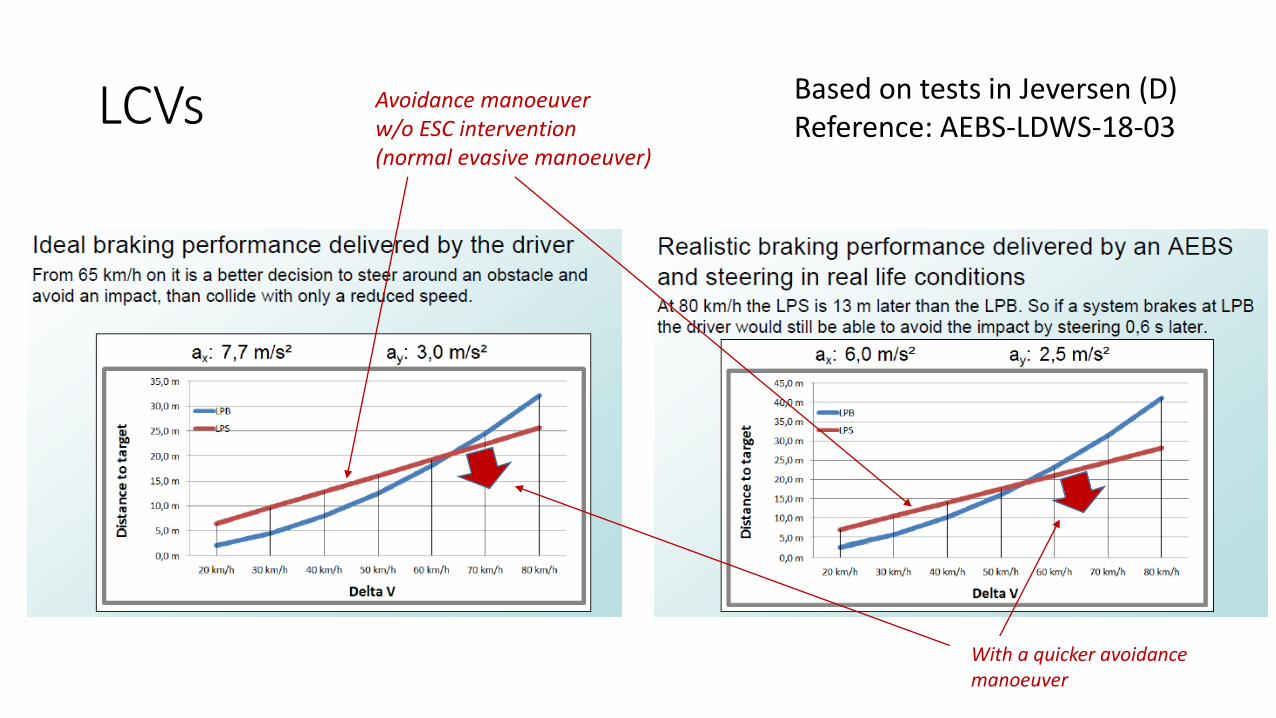
LCVs Based on tests in Jeversen (D)Reference: AEBS-LDWS-18-03
Avoidance manoeuverw/o ESC intervention(normal evasive manoeuver)
With a quicker avoidance manoeuver

HCVs - N3
• LPS• Extract from SS ISO 14791: “Since the number of variants of heavy trucks (and trailers) is tremendously
large, each truck combination is unique. So the measured result is valid only for the tested vehicle or combination and the transition of the results to obviously similar combinations is not possible.”
• However, some interesting results with regard to LPS can be analysed based on this standard. See next slides.
• LPB• With regard to braking, a simple calculation based of deceleration and brake force build-up time can be
used in first place.
6m/s²
0,6s

HCVs - N3 SS ISO 14791
target
Lane change
LPS vs car
Simulated emergency avoidance manoeuverOn the physical limits (w/o considering ESC intervention)

HCVs - N3 SS ISO 14791
3 different strategies
The most efficient

Fully ladenEmpty
Low COG High COG
80kph
40kph
LPS
LPB
LPS
LPB
1.2s 1.4s 1.6s
2s 2.1s 2.3s
1.2s 1.3s 1.4s
1.1s 1.2s 1.3s
26m 30.5m 34.5m
44.6m 47.7m 51.5m
13m 14m 15.5m
12.7m 13.5m 14.5m
(-6,5) (-6) (-5.5)
(-6,5) (-6) (-5.5)
Truck
(18.6m) (17.2m) (17m)
(-0,3m) (-0,5m) (-1m)

1.365
1.070
Tractor
T1
T2
(examples to explain the influence of the vehicle architecture on the performance, on short wheel bases)

Fully ladenEmpty
Low COG High COG
80kph
40kph
LPS
LPB
LPS
LPB
1.2s 1.4s 1.6s
1.8s 2.1s 2.2s
1.2s 1.3s 1.4s
1s 1.2s 1.3s
26m 30.5m 34.5m
39.5m 47.7m 49.5m
13m 14m 15.5m
11.5m 13.5m 14m
(-7,5) (-6) (-5,75)
2,2s
(-5,75)
Tractor
(-7.5) (-6) (-5,75)
(-1m) (-0,5m) (-1.5m)
(17.2m) (15m)(13.5m)
(23.5m)
T1
T2 49.5m
(4.5m/s²) (3.5m/s²)
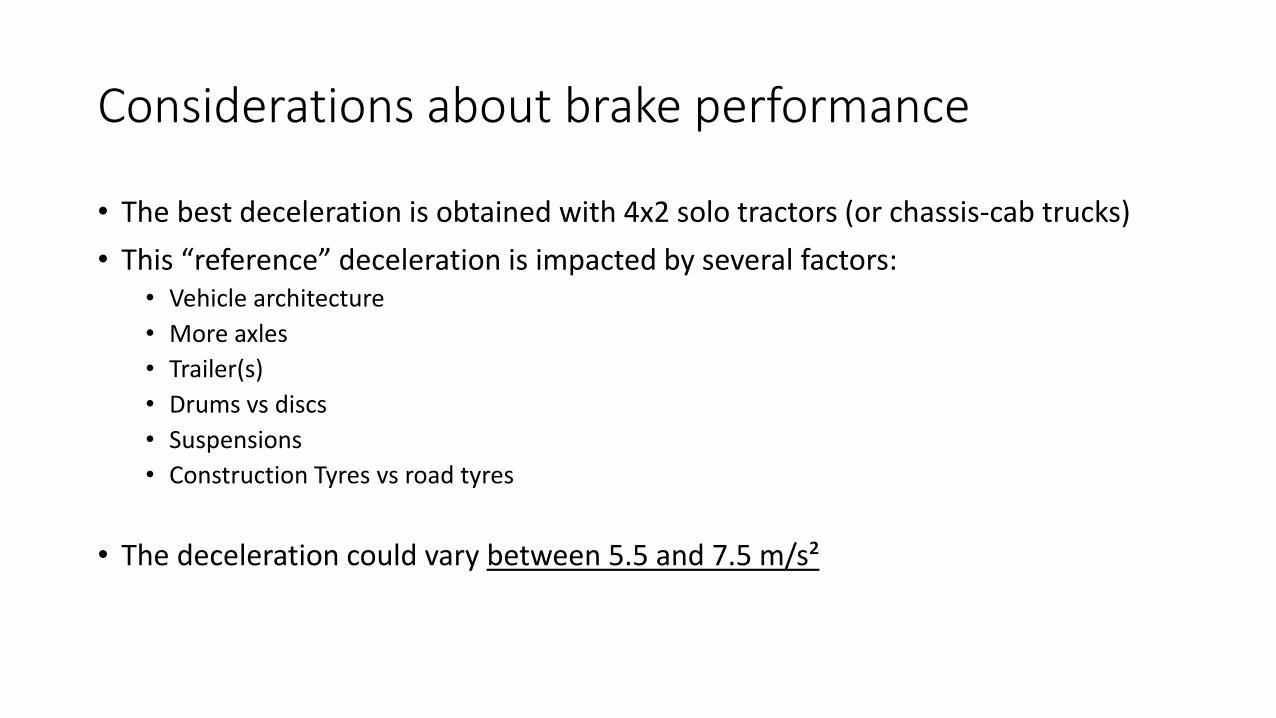
Considerations about brake performance
• The best deceleration is obtained with 4x2 solo tractors (or chassis-cab trucks)
• This “reference” deceleration is impacted by several factors:• Vehicle architecture
• More axles
• Trailer(s)
• Drums vs discs
• Suspensions
• Construction Tyres vs road tyres
• The deceleration could vary between 5.5 and 7.5 m/s²

M3 (except hydraulic braking)
N2 > 8 t
N3
M2 and N2 ≦ 8 twith pneumatic braking
M2
N2 ≦ 8 t
Row 1
Row 2
UN R131 – split of requirements
M3 with hydraulic braking

N3
Long Haul / Distribution Construction
4x2 6x2
7.5m/s² - 5.5m/s²
Leaf suspensionTyre size / typeHigh-COG
6x4
N2 > 8 tN2 ≦ 8 t
6m/s² - 6.5m/s²
DistributionLCVs
7.5m/s² - 6.5 m/s²
Braking
Steering (avoidance)
Agile vehicles(closer to M1N1)
LPS depends on many factors…
N2 N3
Hydraulic B. braking AOH (7t5 up to 20t)
Pneumatic braking (7t5 and above)
Difficult to find a
value that “fits to
all”
Slow build-up pressure time (~2s)
T1 T2
Discs……………………………………………………………………………………………………………………………………………….drums

M2 M3
Hydraulic braking(derived from M1 N1)
Pneumatic braking
European marketBuses in Japan