Ae105c CDR, June 3, 2009 p. 1 Experimental Team Jason Cerundolo Vivek Viswanathan Pelayo Bohorquez.
24
Ae105c CDR, June 3, 2009 p. 1 Experimental Team Jason Cerundolo Vivek Viswanathan Pelayo Bohorquez
-
Upload
trevor-nash -
Category
Documents
-
view
213 -
download
0
Transcript of Ae105c CDR, June 3, 2009 p. 1 Experimental Team Jason Cerundolo Vivek Viswanathan Pelayo Bohorquez.

Ae105c CDR, June 3, 2009 p. 1
Experimental Team Jason Cerundolo Vivek Viswanathan Pelayo Bohorquez

Ae105c CDR, June 3, 2009 p. 2
Experimental Level 2 Requirements
Provide experimental data, including geometry, material property, static, and dynamic data, used to verify a structural finite element model (FEM).

Ae105c CDR, June 3, 2009 p. 3
Group Interfacing
Experimental System ID Structural Dynamics
Experimental
• Statics & dynamics test data • Experimental setup descriptions• Voltage to displacements/acceleration conversions• Experimental data in engineering units• Experimental parameters used
• Mass & Geometry• Material Properties• Test Specifications
System ID
• Deadlines to meet• Experiments to perform• Test parameters• Test procedures
• Damping Coefficients• Natural Frequencies• Static Results
• Modal shapes (for correlation)• Frequencies• Damping• Static and dynamic result
Structural• Experiments to run• Requests for properties to be measured
• Theoretical model containing the modes of the dynamical system
• Modal Properties (mass, length, etc.)
DynamicsSystem Performance project level

Ae105c CDR, June 3, 2009 p. 4
Assumptions
All tests must be non-destructive.
Filters on hardware electronics do not affect data in region of interest.
– Verified by manufacturers' datasheets. The filter cut-off frequency is much higher than region of interest.
Motion of boundary condition is negligible.
Battens are always in compression.
Diagonals always in tension.
The boom's response is in the linear stress-strain region. – This is driven by the System ID and Structural teams' models and
influences experiments that are run and the processing of the data.
Longeron
Batten
Diagonal

Ae105c CDR, June 3, 2009 p. 5
Synopsis up to PDR
Geometry and material properties measurements were completed and published.
Static test were completed and in process of being published and processed.
Brainstormed ideas for dynamic testing.

Ae105c CDR, June 3, 2009 p. 6
Disposition of RFAs
Initiator Concern Recommendation Action
MarcoAddress resolution of measurements
Look at spec of lasers and precision required
Laser precision around 1 μm and confirmed to be
sufficient by other teams.

Ae105c CDR, June 3, 2009 p. 7
Progress Since PDR
Static test parameters have been published.
Dynamic testing completed. Random vibration Sine sweep Tap Test Torsion Test
Experimental descriptions, parameters, and data posted online and linked to from the wiki.
Ae105c CDR, June 3, 2009 p. 8
Technical Status
All testing and publishing is completed.
Experimental results have correlated with theoretical predictions.
Special thanks to Case Branford for help in the lab.

Ae105c CDR, June 3, 2009 p. 9
General Experimental Setup
Canister firmly mounted on pipe structure with ratcheted tie-down straps.
Laser displacement sensors measure vertical and horizontal displacement.
Shaker is attached to center of endplate.
– The shaker moves a given displacement for a given input voltage using feedback.
– A load cell measures the force applied by the shaker.
– Low load cell measurements imply modes. Signals from sensors are
processed by input boxes and captured on a PC running LabView under Windows Vista.
Tests run multiple times to ensure repeatability.
Middle Root Canister
Side Tip
Side Root
Tip
Force Shaker
Load Cell

Ae105c CDR, June 3, 2009 p. 10
General Experimental Setup

Ae105c CDR, June 3, 2009 p. 11
Static Force-Displacement Test
• Known masses were hung by the center of the end plate.
• Deflection of the boom at multiple points was measured.
• Force-displacement curve could be fit to stiffness.
Canister
Root
Middle
Tip
Displacement [mm]
1.95
4.9
Plot courtesy of Case Bradford
Time

Ae105c CDR, June 3, 2009 p. 12
Sine Sweep Test• Shaker is given sine wave
input swept through a frequency range (5 – 100 Hz).
• Time scale was logarithmic and approximately 1 octave/minute.
• FFT of displacement over FFT of load cell data shows modes of vibration.
• Modes found near 11 & 14 Hz.
Frequency [Hz]
Inte
nsi
ty r
ati
o
dis
pla
cem
ent/
forc
e

Ae105c CDR, June 3, 2009 p. 13
Tap Test
• Structure is excited by a manual tap with a hammer.
• The ring down response is measured.
– Allows easy calculation of damping.
– Ideally shows fundamental mode.
Time [s]16-0.8
0.8

Ae105c CDR, June 3, 2009 p. 14
Torsion Test
• Shaker was mounted off-axis and connected to one of the longerons not on the vertical axis of symmetry.
• Lasers were positioned off-axis.
– Difference in position is the torsion.
• Mode found near 52 Hz.
Root Same Side of Load
Tip Opposite
Side of Load
Root Opposite Side of Load
Tip Same Side of Load
Force Shaker
Load Cell
Plot goes here

Ae105c CDR, June 3, 2009 p. 15
Open Issues and Concerns
Random noise test has insufficient signal-to-noise ratio.
– Replaced by sine sweep testing. – Recommend a narrow band-limited function
generator to supply random noise in the future. • Current set up is limited to 50 MHz. • Region of interest is only up to 100 Hz.
Test Conducted with imperfect boundary condition.
– Recommend detailed study of canister mount be conducted in the future.
– Recommend a more isolating mount be used. Tap Test
– Force hammer would provide more data and allow for another check of results.
– For now, only good for damping
Ae105c CDR, June 3, 2009 p. 16
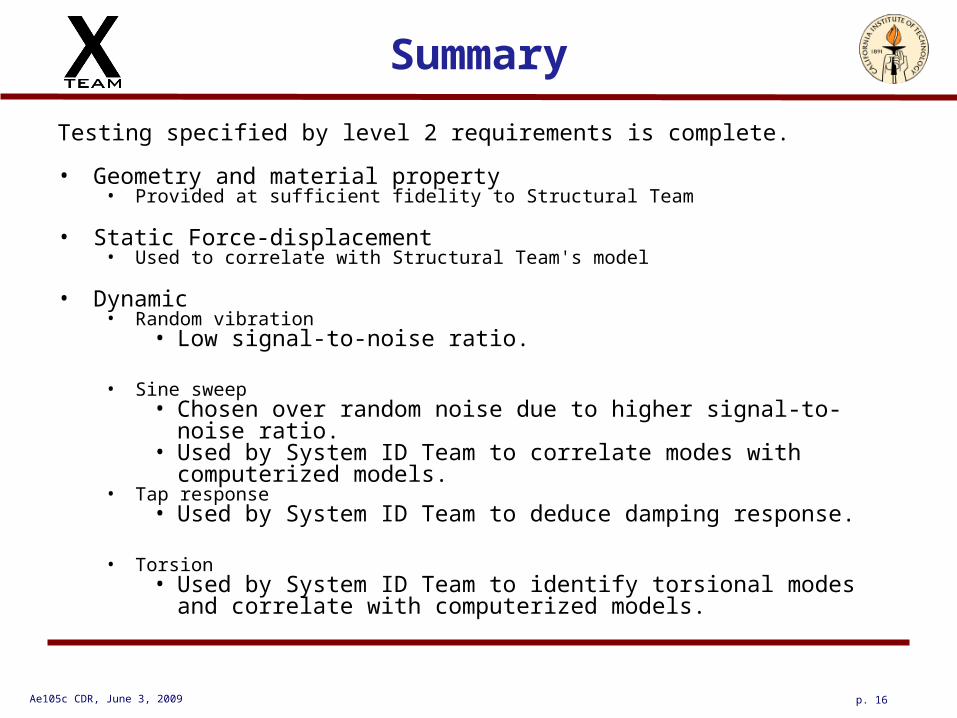
Summary
Testing specified by level 2 requirements is complete.
• Geometry and material property• Provided at sufficient fidelity to Structural Team
• Static Force-displacement• Used to correlate with Structural Team's model
• Dynamic• Random vibration
• Low signal-to-noise ratio.
• Sine sweep• Chosen over random noise due to higher signal-to-noise ratio.• Used by System ID Team to correlate modes with
computerized models.• Tap response
• Used by System ID Team to deduce damping response.
• Torsion• Used by System ID Team to identify torsional modes and
correlate with computerized models.

Ae105c CDR, June 3, 2009 p. 17
Back-up Material
Ae105c CDR, June 3, 2009 p. 18
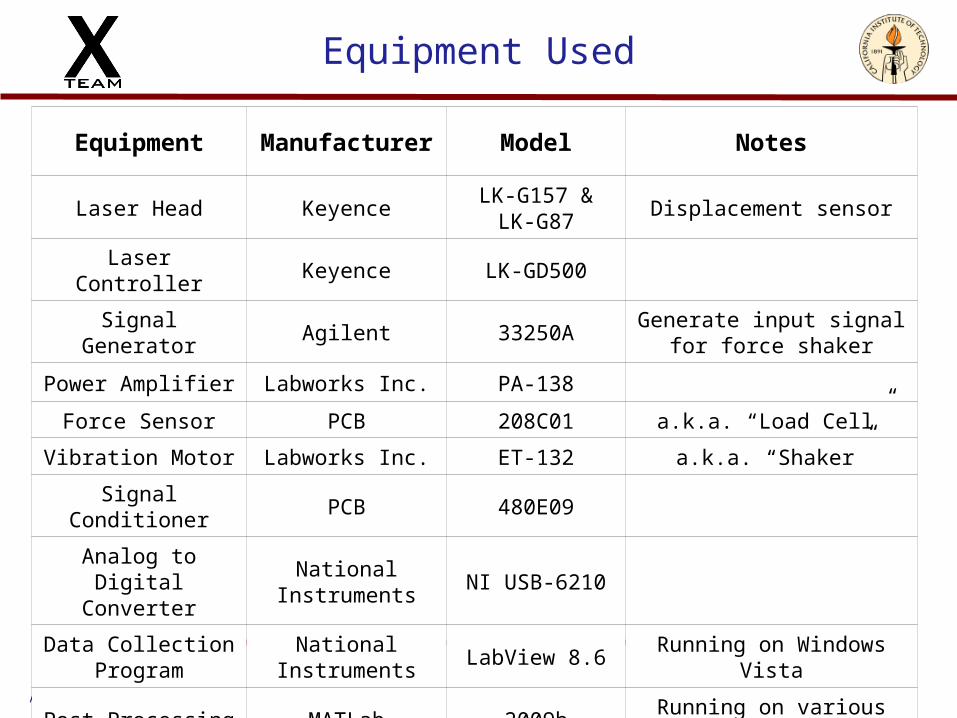
Equipment Used
EquipmentManufacture
rModel Notes
Laser Head KeyenceLK-G157 & LK-
G87Displacement sensor
Laser Controller Keyence LK-GD500
Signal Generator Agilent 33250AGenerate input signal for
force shaker
Power Amplifier Labworks Inc. PA-138
Force Sensor PCB 208C01 a.k.a. “Load Cell”
Vibration Motor Labworks Inc. ET-132 a.k.a. “Shaker”
Signal Conditioner PCB 480E09
Analog to Digital Converter
National Instruments
NI USB-6210
Data Collection Program
National Instruments
LabView 8.6Running on Windows
Vista
Post Processing MATLab 2009bRunning on various operating systems

Ae105c CDR, June 3, 2009 p. 19
Material Property Experiments
Diagonal Tension Test
Batten Compression Test
Batten Tension Test
Ae105c CDR, June 3, 2009 p. 20
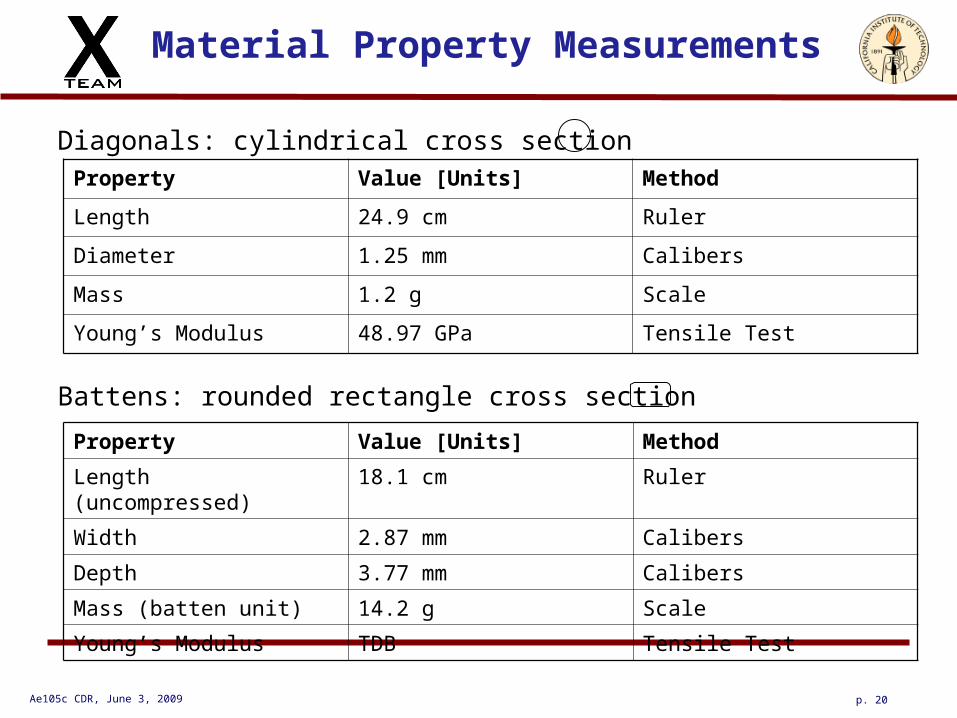
Material Property Measurements
Diagonals: cylindrical cross section
Battens: rounded rectangle cross section
Property Value [Units] Method
Length 24.9 cm Ruler
Diameter 1.25 mm Calibers
Mass 1.2 g Scale
Young’s Modulus 48.97 GPa Tensile Test
Property Value [Units] Method
Length (uncompressed) 18.1 cm Ruler
Width 2.87 mm Calibers
Depth 3.77 mm Calibers
Mass (batten unit) 14.2 g Scale
Young’s Modulus TDB Tensile Test

Ae105c CDR, June 3, 2009 p. 21
Static Test Setup
4 Laser displacement sensors
DAQ unit collects data at 100 HzWeights added to the tip
Fixed boundary condition created with two tie-down straps
Tip
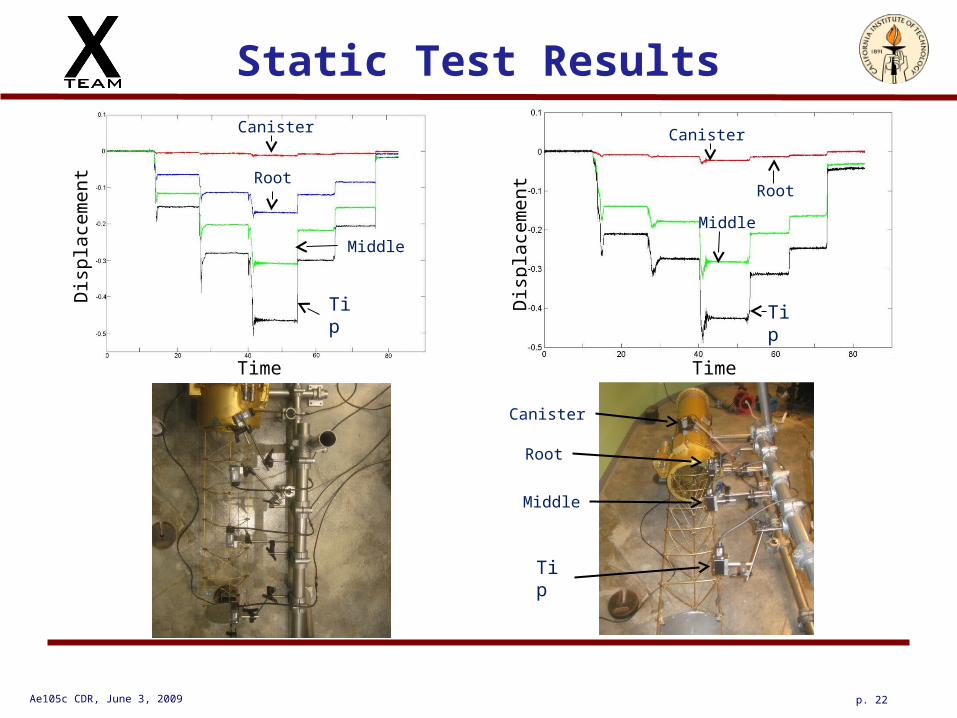
Ae105c CDR, June 3, 2009 p. 22
Static Test Results
Time
Dis
pla
cem
ent
Dis
pla
cem
ent
Time
Tip
Canister
Root
Middle
Tip
Middle
Canister
Root
Canister
Root
Middle
Tip

Ae105c CDR, June 3, 2009 p. 23
Ambient Test
• Structure is left undisturbed and response measured.
• This test gives a good indication of the noises environment in the lab.
• Can identify unexpected modes and identify regions of noise.

Ae105c CDR, June 3, 2009 p. 24
Random Vibration Test
• Shaker is given random noise from function generator.
• Test was unsuccessful – The function
generator excited up through 50 MHz.
– Region of interest was 1 – 100 Hz, only a small amount of energy was exciting those frequencies.
– This resulted in an insufficient signal-to-noise ratio.