Advice on the risk estimation matrix used by DAFF Biosecurity as
51
Advice on the risk estimation matrix used by DAFF Biosecurity as part of the Import Risk Analysis process Prepared for Senate Rural and Regional Affairs and Transport Committee by: Chris Peace Email: [email protected] 0274 713 723 Risk Management Ltd PO Box 7430 Wellington 6242 04 389 2665 Website: www.riskmgmt.co.nz Date: 10 January 2013 File name: RML 2013 CR0127 ASRRATC matrix final.docx Full citation for report: Peace, C. (2013). Advice on the risk estimation matrix used by DAFF Biosecurity as part of the Import Risk Analysis process (Client Report CR0127 Australian Senate Rural and Regional Affairs and Transport Committee). Wellington, NZ: Risk Management Ltd,
Transcript of Advice on the risk estimation matrix used by DAFF Biosecurity as

Advice on the risk estimation matrix used by DAFF Biosecurity as part of the Import
Risk Analysis process
Prepared for Senate Rural and Regional Affairs and Transport Committee
by: Chris Peace Email: [email protected]
0274 713 723 Risk Management Ltd
PO Box 7430 Wellington 6242
04 389 2665 Website: www.riskmgmt.co.nz
Date: 10 January 2013
File name: RML 2013 CR0127 ASRRATC matrix final.docx
Full citation for report:
Peace, C. (2013). Advice on the risk estimation matrix used by DAFF Biosecurity as part of the Import Risk Analysis process (Client Report CR0127 Australian Senate Rural and Regional Affairs and Transport Committee). Wellington, NZ: Risk Management Ltd,

www.riskmgmt.co.nz
DAFF Biosecurity Risk Matrix Advice Page i
Disclaimer
This is not a legal interpretation of the law generally or the of the law duty of care, the statutory duties of employers and related standards: only the courts can provide such an interpretation. Rather this is a plain English description intended to help readers understand what the courts might expect.
If any reader needs to rely on an interpretation of the law they must consult a competent legal adviser.
Limitations
This report is based on a review of Australian Government reports and international organisations documents. We have not interviewed any DAFF risk analysts or other stakeholders.
Terms of reference
In preparing this report we have followed the terms of reference in our engagement letter and used due diligence and our professional skills to gather information that appeared to be necessary to fulfil our terms of reference. The information in this report is based on:
conditions observed; or
information provided by you; or
information provided to us independently by third parties.
Although we believe the information is accurate we have not independently verified it. We cannot, therefore, give any warranty as to the accuracy or currency of such information and must disclaim any liability for any actions based on such information.
We do not guarantee compliance with statutes or relevant recognized standards nor do we guarantee we have identified all risks and hazards.
This report is current to the date of publication unless otherwise specified. Readers should bear in mind that subsequent events might affect our conclusions or recommendations given.
About Risk Management Limited
Risk Management Limited is an independent risk management consultancy established in 2003 to help clients identify, analyse, assess and manage their major risks and to monitor their critical controls over those risks.
Further information about Risk Management Limited is available at www.riskmgmt.co.nz.
About the author of the report
This report was prepared by Chris Peace, the managing director of Risk Management Limited who worked for NGC Holdings Ltd as their risk manager (2000-2003) and who had previously worked for Jardine Lloyd Thompson in New Zealand (1995-2000) and the UK (1990-1995), Marsh & McLennan in New Zealand (1985-1990) and CIGNA (NZ) Ltd (1982-1985). Between 1974 and 1980 he enforced the UK Health and Safety at Work Act 1974 in a wide range of premises.
Chris holds an MSc in Risk Management and Safety Technology and other qualifications in environmental health, air pollution control and occupational safety and health. Chris is also a Chartered Fellow of the Institution of Occupational Safety and Health (UK); details of the charter and fellowship are available from http://www.iosh.co.uk.
Between 2005-2012 Chris was part-time Lecturer in Risk Management Studies at Massey University and represented the university on the joint standards committee that wrote AS/NZS 4360: 2004 Risk Management (now replaced by AS/NZS ISO 31000: 2009 Risk Management – Principles and guidelines). He is a member of the New Zealand Society for Risk Management (www.risksociety.org.nz) and contributes to the Society’s newsletter and activities.

www.riskmgmt.co.nz
DAFF Biosecurity Risk Matrix Advice Page ii
Table of contents Executive Summary ...........................................................................................................1
Project method ...................................................................................................................3
Terms of reference ..........................................................................................................3
Processes for assessing or analysing risks ...................................................................4
WTO requirements ..........................................................................................................4
International Office of Epizootics ....................................................................................5
International Plant Protection Convention ......................................................................5
Codex Alimentarius Commission guidance ....................................................................6
AS/NZS ISO 31000 .........................................................................................................7
Comparison of the documents ........................................................................................9
Risk matrix literature review ...........................................................................................13
Origins and applications of the risk matrix ....................................................................13
Advantages, disadvantages and errors ........................................................................13
Summary .......................................................................................................................15
Review of the DAFF matrix .............................................................................................16
DAFF risk estimation matrix ..........................................................................................16
DAFF matrix design solutions .......................................................................................22
Alternative risk techniques .............................................................................................24
WTO and stakeholder expectations ..............................................................................24
Risk naming ..................................................................................................................24
Sources of information ..................................................................................................24
Establishing the nature of risk .......................................................................................25
Uncertainty ....................................................................................................................26
Consequence/likelihood matrix .....................................................................................26
Fault tree analysis .........................................................................................................27
Event tree analysis ........................................................................................................28
Bow-tie analysis ............................................................................................................29
Conclusions ..................................................................................................................30
References ........................................................................................................................31
Appendix 1. Comparative vocabulary ............................................................................33
Appendix 2. Application of the DAFF risk estimation matrix ......................................38

www.riskmgmt.co.nz
DAFF Biosecurity Risk Matrix Advice Page 1
Executive Summary Existing risk estimation matrix
The existing Australian biosecurity risk estimation matrix does not meet best practice in that: it combines likelihoods with events and consequences it is opaque in describing how to combine likelihoods probability and likelihood seem to be confused even though they are distinct concepts sources for the indicative probabilities used in recent reports are not given the labels on the consequence and likelihood scales and risk level cells are very similar.
Recommendations
We recommend the Federal Department of Agriculture, Fisheries and Forestry matrix be redesigned as a simple consequence/likelihood matrix to overcome these deficiencies.
We further recommend the Senate Rural and Regional Affairs and Transport Committee encourages the Department of Agriculture, Fisheries and Forestry (DAFF) to develop the use of fault tree, event tree and bow-tie analyses and other techniques to help understand and show the nature of import risks. This should be done in combination with a redesigned consequence/likelihood matrix to help determine the level of risk.
In particular, use of bow-tie analysis will help demonstrate to stakeholders that all significant causes, consequences and controls have been considered before any decision is made to:
reject a proposal accept a proposal subject to treatment of the risk at source, in transport or on arrival accept the proposal unconditionally.
Bow-ties might be supported by quantified fault tree or event tree analyses if the data is reliable but should be supported by a consequence/likelihood matrix to show the level of risk.
We believe this combination will give the “objective and defensible method of assessing the disease risks associated with the importation of animals, animal products, animal genetic material, feedstuffs, biological products and pathological material” sought by the Senate Rural and Regional Affairs and Transport Committee and other stakeholders and recommended by the World Trade Organization.
To aid transparency in import risk analysis and decision-making we recommend DAFF revises the Import Risk Analysis Handbook to include full details of techniques available to DAFF risk analysts and any underlying data or research validating those techniques.
We also recommend the revised Import Risk Analysis Handbook includes our draft Import risk analysis effectiveness checklist (Table 6 on page 25) developed to be an assurance tool demonstrating each import risk analysis meets the World Trade Organization criterion of a “objective and defensible” import risk analysis. This might be combined with the DAFF import risk analysis template that now seems to be in use.
Acknowledgements
Feedback on the first draft of this report has been provided by Senators and staff of RRAT. We have responded to all comments. We thank all who have provided responses and trust this report will contribute to improved biosecurity in Australia.
Research for this report has reinforced our belief there are conflicts and inconsistencies between key international biosecurity treaties and agreements. Some of those conflicts and inconsistencies have contributed to the problems highlighted by this report. DAFF may wish to raise those conflicts and inconsistencies with the relevant international agencies.
Abbreviations and definitions
In this report:
“ALOP” means appropriate level of sanitary and phytosanitary protection
“RRAT”, “you” and “your” means the Senate Rural and Regional Affairs and Transport Committee
“CBG” means the Convention on Biological Diversity

www.riskmgmt.co.nz
DAFF Biosecurity Risk Matrix Advice Page 2
“DAFF” means the Australian Federal Department of Agriculture, Fisheries and Forestry
“FAO” means the Food and Agriculture Organization of the United Nations
“IPPC” means the International Plant Protection Convention
“IRA” means import risk assessment
“ISO” means the International Standards Organization
“We”, “our” and “us” means Risk Management Ltd
“WOAH” means the World Organization for Animal Health
“WTO” means the World Trade Organization.
Vocabulary of risk terminology
The meanings and definitions of risk terminology vary between treaties, agreements and standards. To help overcome this “Tower of Babel” problem we have appended at pages 33 to 37 definitions and their sources for terms used or referred to in this report.

www.riskmgmt.co.nz
DAFF Biosecurity Risk Matrix Advice Page 3
Project method
Terms of reference
Our terms of reference were agreed to be to:
Conduct a literature review covering: o earlier DAFF Biosecurity IRA documents published on the DAFF website or
elsewhere; o any comparable Risk Estimation Matrices developed or used elsewhere; o published academic literature critiquing the design and use of matrices.
Critique the DAFF Biosecurity Risk Estimation Matrix from an informed position.
Develop and test alternative approaches to quantitative or semi-quantitative risk analysis, some using alternative matrices.
Suggest risk analysis techniques that would enable DAFF Biosecurity to report more effectively on the nature of the risk.
Report to the committee by an agreed date and attend a teleconference meeting/hearing at an agreed time.
To effect this we reviewed the following documents:
the biosecurity risk estimation matrix used by DAFF Biosecurity as part of the Import Risk Analysis process and as set out in four import risk analysis reports (Biosecurity Australia, 2006a, 2006b; DAFF, 2012a, 2012b)
Import Risk Analysis Handbook (DAFF, 2011)
international standard ISO 31000:2009. Risk management – Principles and guidelines (adopted in Australia and New Zealand as AS/NZS ISO 31000: 2009 SA/SNZ ISO, 2009)
international standard ISO 31010: 2009 Risk Management – Risk Assessment Techniques (ISO, 2009a)
draft joint handbook HB 89 Risk management – Guidelines on risk assessment techniques (SA/SNZ, 2011)
Handbook HB 436 Risk Management Guidelines: a companion to AS/SNZ 4360:2004 (SA/SNZ, 2004)
World Trade Organization Agreement on the application of sanitary and phytosanitary measures (WTO, 1997)
Food and Agriculture Organisation documents on food safety risk analysis (FAO, 1999, 2006, 2007)
Terrestrial Animal Health Code (WOAH, 2012)
academic journal articles sourced from the academic Web of Science and Business Source Complete databases used to better understand origins and applications of the risk matrix, common problems with risk matrices, and alternative approaches to quantitative or semi-quantitative risk analysis.
Arising from the reviews we developed graphical summaries of the:
AS/NZS ISO 31000 risk management process
WTO approach to risk analysis of sanitary and phytosanitary risks
FAO approach to risk analysis
WOAH approach to risk analysis.
This enabled a high-level critique of the overall DAFF approach to risk assessments and then a detailed critique of the DAFF biosecurity risk estimation matrix.
The detailed matrix critique included comparison of the matrix with guidance in the joint Australia/New Zealand Standards handbook HB 436 and handbook HB 89. This approach placed the DAFF biosecurity risk estimation matrix in the overall context of international treaties, codes, agreements and standards together with critical comment and guidance on the use of consequence/likelihood matrices used for risk analyses.

www.riskmgmt.co.nz
DAFF Biosecurity Risk Matrix Advice Page 4
Processes for assessing or analysing risks This report straddles two broad approaches and vocabularies for risk, how it is understood and how it is controlled.
The first broad area is the scientific and technical area of risk analysis as defined and described in a range of documents supporting the WTO Agreement on the application of sanitary and phytosanitary measures. Documents and risk analyses in this area are often used by biosecurity agencies considering a proposal to import some plant or animal product that may be exotic.
The second broad area covers organisations wishing to implement a risk management framework and a process for the management of risks. Documents and risk assessments in this area (AS/NZS ISO 31000 and ISO 31010:2009) are likely to be used by a wide range of organisations, including exporters and corporate functions in biosecurity agencies and to aid assessment and management of risks generally.
WTO requirements
Article 5 of the WTO Agreement on the application of sanitary and phytosanitary measures requires:
“1. Members shall ensure that their sanitary or phytosanitary measures are based on an assessment, as appropriate to the circumstances, of the risks to human, animal or plant life or health, taking into account risk assessment techniques developed by the relevant international organizations.
2. In the assessment of risks, Members shall take into account available scientific evidence; relevant processes and production methods; relevant inspection, sampling and testing methods; prevalence of specific diseases or pests; existence of pest- or disease-free areas; relevant ecological and environmental conditions; and quarantine or other treatment.
3. In assessing the risk to animal or plant life or health and determining the measure to be applied for achieving the appropriate level of sanitary or phytosanitary protection from such risk, Members shall take into account as relevant economic factors: the potential damage in terms of loss of production or sales in the event of the entry, establishment or spread of a pest or disease; the costs of control or eradication in the territory of the importing Member; and the relative cost-effectiveness of alternative approaches to limiting risks.
4. Members should, when determining the appropriate level of sanitary or phytosanitary protection, take into account the objective of minimizing negative trade effects” (WTO, 1997).
The WTO gives no definition of risk but does define risk assessment as “the evaluation of the likelihood of entry, establishment or spread of a pest or disease within the territory of an importing Member according to the sanitary or phytosanitary measures which might be applied, and of the associated potential biological and economic consequences; or the evaluation of the potential for adverse effects on human or animal health arising from the presence of additives, contaminants, toxins or disease-causing organisms in food, beverages or feedstuffs” (WTO, 1997, p. 78). The disjunctive OR in line four has been emphasised to show the definition has two meanings.
Annex A of the WTO Agreement sets out definitions including the following reference.
“Annex A 3. International standards, guidelines and recommendations
(a) for food safety, the standards, guidelines and recommendations established by the Codex Alimentarius Commission relating to food additives, veterinary drug and pesticide residues, contaminants, methods of analysis and sampling, and codes and guidelines of hygienic practice;
(b) for animal health and zoonoses, the standards, guidelines and recommendations developed under the auspices of the International Office of Epizootics;
(c) for plant health, the international standards, guidelines and recommendations developed under the auspices of the Secretariat of the International Plant Protection Convention in cooperation with regional organizations operating within the framework of the International Plant Protection Convention; and
www.riskmgmt.co.nz
DAFF Biosecurity Risk Matrix Advice Page 5
(d) for matters not covered by the above organizations, appropriate standards, guidelines and recommendations promulgated by other relevant international organizations open for membership to all Members, as identified by the Committee. [emphasis added]” (WTO, 1997, pp. 77-78).
Clause 3(d) seems to allow the International Standards Organization to be deemed to be “relevant” and its standards to be regarded as “appropriate”. A brief review of the three specified sources and ISO 31000 (as AS/NZS ISO 31000) follows.
International Office of Epizootics
Chapter 2.1 of the Terrestrial Animal Health Code (WOAH, 2012) sets out an approach to risk analysis broadly compatible with the FAO Food Safety Risk Analysis with the following exceptions:
hazard, risk, risk analysis and risk assessment are not defined
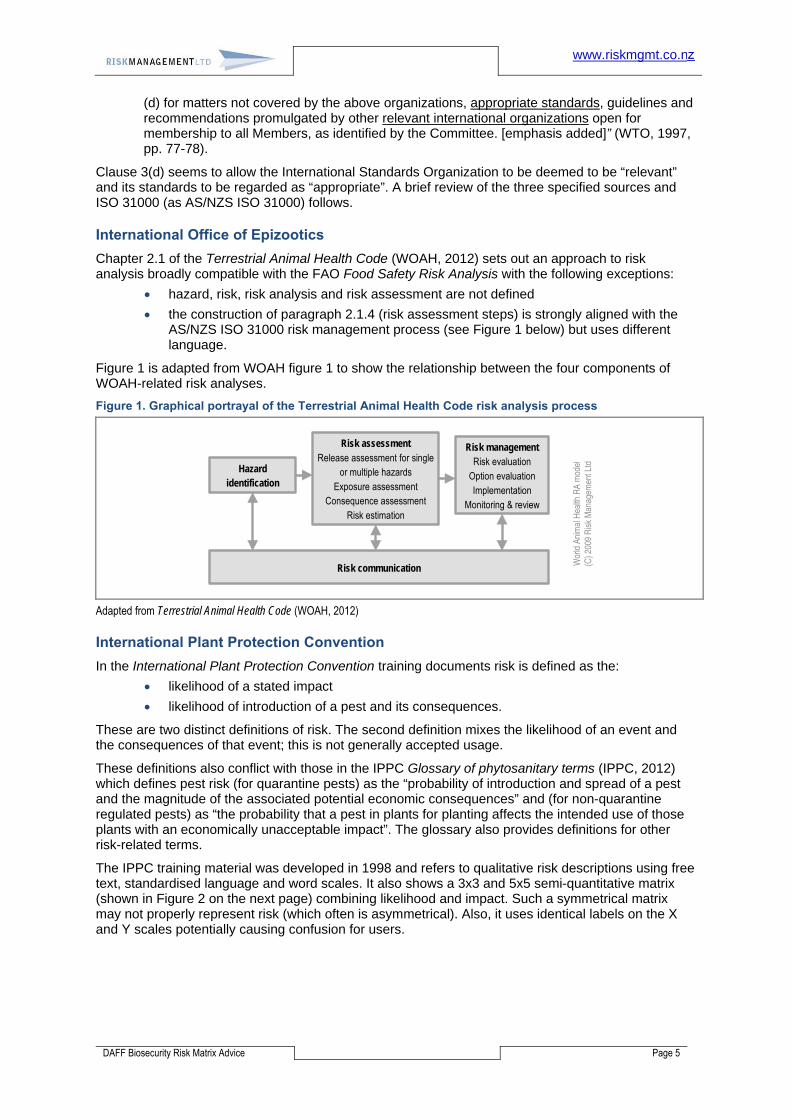
the construction of paragraph 2.1.4 (risk assessment steps) is strongly aligned with the AS/NZS ISO 31000 risk management process (see Figure 1 below) but uses different language.
Figure 1 is adapted from WOAH figure 1 to show the relationship between the four components of WOAH-related risk analyses.
Figure 1. Graphical portrayal of the Terrestrial Animal Health Code risk analysis process
Hazard identification
Risk assessmentRelease assessment for single
or multiple hazardsExposure assessment
Consequence assessmentRisk estimation
Risk managementRisk evaluation
Option evaluationImplementation
Monitoring & review
Risk communication Wor
ld A
nim
al H
ealth
RA
mod
el
(C) 2
009
Ris
k M
anag
emen
t Ltd
Adapted from Terrestrial Animal Health Code (WOAH, 2012)
International Plant Protection Convention
In the International Plant Protection Convention training documents risk is defined as the:
likelihood of a stated impact
likelihood of introduction of a pest and its consequences.
These are two distinct definitions of risk. The second definition mixes the likelihood of an event and the consequences of that event; this is not generally accepted usage.
These definitions also conflict with those in the IPPC Glossary of phytosanitary terms (IPPC, 2012) which defines pest risk (for quarantine pests) as the “probability of introduction and spread of a pest and the magnitude of the associated potential economic consequences” and (for non-quarantine regulated pests) as “the probability that a pest in plants for planting affects the intended use of those plants with an economically unacceptable impact”. The glossary also provides definitions for other risk-related terms.
The IPPC training material was developed in 1998 and refers to qualitative risk descriptions using free text, standardised language and word scales. It also shows a 3x3 and 5x5 semi-quantitative matrix (shown in Figure 2 on the next page) combining likelihood and impact. Such a symmetrical matrix may not properly represent risk (which often is asymmetrical). Also, it uses identical labels on the X and Y scales potentially causing confusion for users.

www.riskmgmt.co.nz
DAFF Biosecurity Risk Matrix Advice Page 6
Figure 2. IPPC risk matrix
Codex Alimentarius Commission guidance
In the FAO Food Safety Risk Analysis: A Guide for National Food Safety Authorities (FAO, 2006) risk is defined as “a function of the probability of an adverse health effect and the severity of that effect, consequential to a hazard(s) in food”.
“Preliminary risk management activities are taken to include: identification of a food safety problem; establishment of a risk profile; ranking of the hazard for risk assessment and risk management priority; establishment of risk assessment policy for the conduct of the risk assessment; commissioning of the risk assessment; and consideration of the result of the risk assessment” (FAO, 2007, p. 6 footnote 4,).
Risk analysis is defined as “a process consisting of three components: risk assessment, risk management and risk communication” preceded by preliminary risk management activities. These stages are summarised in Figure 3 below.
Figure 3. Graphical portrayal of the FAO risk analysis process
Ris
k co
mm
unic
atio
n
Risk assessment (qualitative or quantitative)Hazard identification
Hazard characterisationExposure assessmentRisk characterisation
Risk managementincludes selection of prevention and control options
Risk analysis
Food
Agr
icul
ture
Org
anis
atio
n R
A m
odel
(C) 2
012
Ris
k M
anag
emen
t Ltd
Preliminary risk management activitiesIdentify food safety problem; establish a risk profile; rank the hazard for risk assessment and risk management priority; establish a risk
management policy for conduct of the risk assessment; commission the risk assessment; consider the result of the risk assessment
Developed from Food Safety Risk Analysis: A Guide for National Food Safety Authorities (FAO, 2006)
Risk assessment is “a scientifically based process consisting of the following steps: (i) hazard identification, (ii) hazard characterization, (iii) exposure assessment, and (iv) risk characterization”.
www.riskmgmt.co.nz
DAFF Biosecurity Risk Matrix Advice Page 7
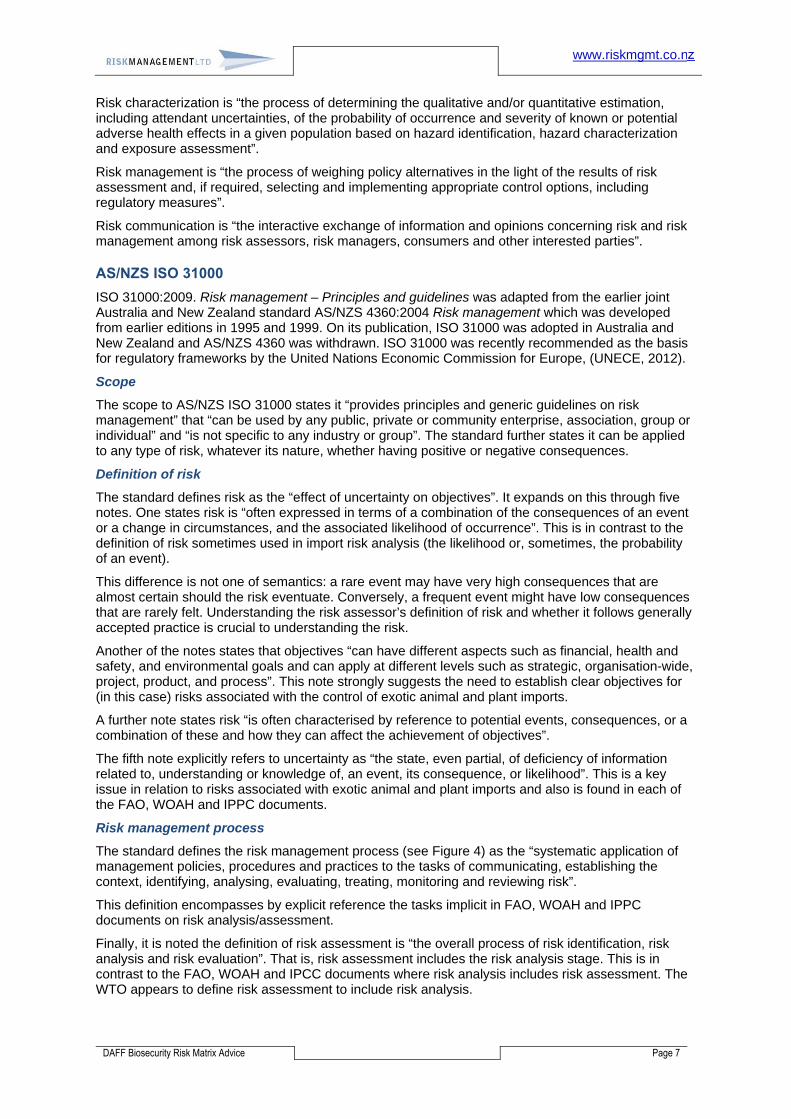
Risk characterization is “the process of determining the qualitative and/or quantitative estimation, including attendant uncertainties, of the probability of occurrence and severity of known or potential adverse health effects in a given population based on hazard identification, hazard characterization and exposure assessment”.
Risk management is “the process of weighing policy alternatives in the light of the results of risk assessment and, if required, selecting and implementing appropriate control options, including regulatory measures”.
Risk communication is “the interactive exchange of information and opinions concerning risk and risk management among risk assessors, risk managers, consumers and other interested parties”.
AS/NZS ISO 31000
ISO 31000:2009. Risk management – Principles and guidelines was adapted from the earlier joint Australia and New Zealand standard AS/NZS 4360:2004 Risk management which was developed from earlier editions in 1995 and 1999. On its publication, ISO 31000 was adopted in Australia and New Zealand and AS/NZS 4360 was withdrawn. ISO 31000 was recently recommended as the basis for regulatory frameworks by the United Nations Economic Commission for Europe, (UNECE, 2012).
Scope
The scope to AS/NZS ISO 31000 states it “provides principles and generic guidelines on risk management” that “can be used by any public, private or community enterprise, association, group or individual” and “is not specific to any industry or group”. The standard further states it can be applied to any type of risk, whatever its nature, whether having positive or negative consequences.
Definition of risk
The standard defines risk as the “effect of uncertainty on objectives”. It expands on this through five notes. One states risk is “often expressed in terms of a combination of the consequences of an event or a change in circumstances, and the associated likelihood of occurrence”. This is in contrast to the definition of risk sometimes used in import risk analysis (the likelihood or, sometimes, the probability of an event).
This difference is not one of semantics: a rare event may have very high consequences that are almost certain should the risk eventuate. Conversely, a frequent event might have low consequences that are rarely felt. Understanding the risk assessor’s definition of risk and whether it follows generally accepted practice is crucial to understanding the risk.
Another of the notes states that objectives “can have different aspects such as financial, health and safety, and environmental goals and can apply at different levels such as strategic, organisation-wide, project, product, and process”. This note strongly suggests the need to establish clear objectives for (in this case) risks associated with the control of exotic animal and plant imports.
A further note states risk “is often characterised by reference to potential events, consequences, or a combination of these and how they can affect the achievement of objectives”.
The fifth note explicitly refers to uncertainty as “the state, even partial, of deficiency of information related to, understanding or knowledge of, an event, its consequence, or likelihood”. This is a key issue in relation to risks associated with exotic animal and plant imports and also is found in each of the FAO, WOAH and IPPC documents.
Risk management process
The standard defines the risk management process (see Figure 4) as the “systematic application of management policies, procedures and practices to the tasks of communicating, establishing the context, identifying, analysing, evaluating, treating, monitoring and reviewing risk”.
This definition encompasses by explicit reference the tasks implicit in FAO, WOAH and IPPC documents on risk analysis/assessment.
Finally, it is noted the definition of risk assessment is “the overall process of risk identification, risk analysis and risk evaluation”. That is, risk assessment includes the risk analysis stage. This is in contrast to the FAO, WOAH and IPCC documents where risk analysis includes risk assessment. The WTO appears to define risk assessment to include risk analysis.

www.riskmgmt.co.nz
DAFF Biosecurity Risk Matrix Advice Page 8
Figure 4. Main elements of the risk management process
Communication and consultation Communicate and consult with internal and external stakeholders as appropriate at each stage of the risk management process and concerning the process as a whole.
Establishing the context Establish the external, internal and risk management context in which the rest of the process will take place. Criteria against which risk will be evaluated should be established and the structure of the analysis defined.
Risk identification Identify what, where, when, why and how something could happen.
Risk analysis Identify and evaluate existing controls. Determine consequences and likelihood and hence the level of risk. The analysis should consider the range of potential consequences and how these could occur.
Risk evaluation Compare estimated levels of risk against the pre-established criteria and consider the balance between potential benefits and adverse outcomes. This enables decisions to be made about the extent and nature of treatments required and about priorities.
Risk treatment Develop and implement specific cost-effective strategies and action plans for increasing potential benefits and reducing potential costs.
Monitoring and review It is necessary to monitor the effectiveness of all steps of the risk management process. This is important for continuous improvement.
Risks and the effectiveness of control and treatment measures need to be monitored to ensure changing circumstances do not alter priorities.
Risk assessment
Establishing the context (5.3)
Risk identification (5.4.2)
Risk analysis (5.4.3)
Risk evaluation (5.4.4)
Risk treatment (5.5)
Mon
itorin
g an
d re
view
(5.6
)
Com
mun
icat
ion
and
cons
ulta
tion
(5.2
)
Identify, analyse and select options that aid achievementof objectives
Adapted from AS/NZS ISO 31000: 2009 with the permission of Standards New Zealand. Only for use when the recipient has a copy of the Standard.
(5.4)
Note: the numbers in the graphic refer to the paragraph numbers in AS/NZS ISO 31000:2009
www.riskmgmt.co.nz
DAFF Biosecurity Risk Matrix Advice Page 9
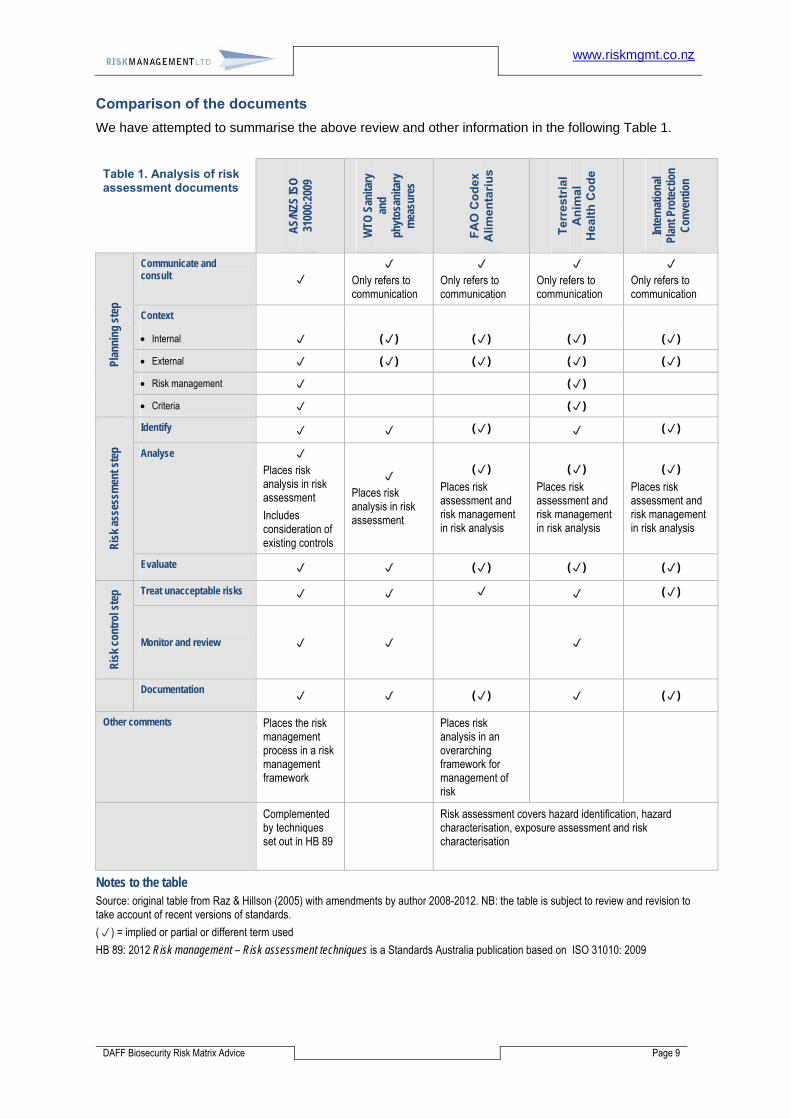
Comparison of the documents
We have attempted to summarise the above review and other information in the following Table 1.
Table 1. Analysis of risk assessment documents
AS/
NZS
ISO
31
000:
2009
WTO
San
itary
an
d ph
ytos
anita
ry
mea
sure
s
FA
O C
od
ex
Alim
enta
riu
s
Ter
rest
rial
A
nim
al
Hea
lth
Co
de
Inte
rnat
iona
l Pl
ant P
rote
ctio
n C
onve
ntio
n
Plan
ning
ste
p
Communicate and consult
Only refers to communication
Only refers to communication
Only refers to communication
Only refers to communication
Context
Internal () () () ()
External () () () ()
Risk management ()
Criteria ()
Ris
k as
sess
men
t ste
p
Identify () ()
Analyse Places risk analysis in risk assessment
Includes consideration of existing controls
Places risk analysis in risk assessment
()
Places risk assessment and risk management in risk analysis
()
Places risk assessment and risk management in risk analysis
()
Places risk assessment and risk management in risk analysis
Evaluate () () ()
Ris
k co
ntro
l ste
p Treat unacceptable risks ()
Monitor and review
Documentation () ()
Other comments Places the risk management process in a risk management framework
Places risk analysis in an overarching framework for management of risk
Complemented by techniques set out in HB 89
Risk assessment covers hazard identification, hazard characterisation, exposure assessment and risk characterisation
Notes to the table Source: original table from Raz & Hillson (2005) with amendments by author 2008-2012. NB: the table is subject to review and revision to take account of recent versions of standards.
() = implied or partial or different term used
HB 89: 2012 Risk management – Risk assessment techniques is a Standards Australia publication based on ISO 31010: 2009

www.riskmgmt.co.nz
DAFF Biosecurity Risk Matrix Advice Page 10
Key differences
The main differences between AS/NZS ISO 31000 and the FAO, WOAH and IPPC documents are in the:
definitions of risk, risk assessment and risk analysis, including use of the likelihood or probability of events or consequences
reversal of use of risk assessment and risk analysis
consultation is explicit in AS/NZS ISO 31000, and implicit in the FAO, WOAH and IPPC documents.
Common features
All the documents broadly follow the same process but only AS/NZS ISO 31000 makes this process explicit.
All the documents emphasise uncertainty and randomness in relation to causes, events, consequences and the likelihood of the consequences.
A common feature in the documents is the absence of any requirement for quantified risk analysis. The UK Health and Safety Executive has, for many years, been a leading agency for industrial risk assessments. In 1989 it published Quantified risk assessment: its input to decision making, giving a review of 16 case studies where quantified risk assessment had been used.
“10. The Health and Safety Executive draws a number of conclusions from this paper. First, QRA is an element that cannot be ignored in decision making about risk since it is the only discipline capable, however imperfectly, of enabling a number to be applied and comparisons of a sort to be made, other than of a purely qualitative kind. This said, the numerical element must be viewed with great caution and treated as only one parameter in an essentially judgemental exercise. Moreover, since any judgement on risk is distributional, risks being caused to some, as an outcome of the activity of others, it is therefore essentially political in the widest sense of the word” [Emphasis added] (HSE, 1989, p. iv)
This succinctly summarises the care needed in developing and using a quantified risk matrix or any other quantitative risk analysis technique.
The definition of risk analysis
Only AS/NZS ISO 31000 defines risk analysis as a “process to comprehend the nature of risk and to determine the level of risk” and that “risk analysis provides the basis for risk evaluation and decisions about risk treatment”. That is, the level of risk can only be determined if the nature of a risk is understood. While the FAO, WOAH and IPPC (and, possibly, WTO) documents call risk analysis risk assessment, they lack this clear requirement for understanding the nature of a risk before determining the level of risk.
For RRATC and DAFF it is critical this distinction, sequence and process for understanding the nature and then the level of risk are followed, a point we return to when reviewing a selection of DAFF import risk analyses.
Distinguishing the nature of risk and level of risk
AS/NZS ISO 31000 defines the level of risk as the “magnitude of a risk expressed in terms of the combination of consequences and their likelihood” but gives no definition for the “nature of risk”. The word “nature” is defined in the Concise Oxford Dictionary (Soanes & Stevenson, 2009) as “the basic or inherent features, qualities, or character of a person or thing”. Some simplified examples of the distinction between nature of risk and level of risk follow.
Driving on roads
A prudent driver will analyse the nature of risk and then determine the level of risk associated with driving under the prevailing conditions. Analysis of the nature of risks associated with driving would include local speed limits; time of day or night; weather conditions (clear visibility or fog; rain or dry weather); traffic density; uncertainty about hazards ahead; likelihood of pedestrians crossing the road; age and condition of the vehicle; condition of the road surface; age and experience of the driver. The combination of such factors will give an understanding of how uncertainty might affect the objectives of the driver, any passengers, the Police and other regulatory agencies and society generally.

www.riskmgmt.co.nz
DAFF Biosecurity Risk Matrix Advice Page 11
Depending on the stakeholder, the nature of risk might be seen as:
life safety (stakeholders are drivers and passengers)
regulatory (stakeholders are the Police)
road safety policy (stakeholders are politicians)
economic (stakeholders are motor vehicle insurers).
Each stakeholder will analyse the level of risk differently in terms of the types of consequences that might be felt and the likelihood of those consequences.
Adequacy of river catchments to supply water users
Risks associated with the adequacy of water supplies abstracted from river systems and associated catchments are of increasing concern. Analysis of the nature of risks would include: minimum flows to preserve future supplies and protect natural ecosystems; flooding following exceptional rainfall; quality of water required for public health, agricultural and horticultural purposes; current and likely demand for public health, agricultural and horticultural purposes; rainfall trends and patterns under current and credible climatic conditions; societal preferences. The combination of such factors will give an understanding of how uncertainty might affect the objectives of all stakeholders in river systems.
Depending on the stakeholder, the nature of risk might be seen as:
economic (stakeholders are farmers and others whose livelihoods depend on irrigation)
recreational (stakeholders are “boaties” and anglers)
environmental (stakeholders are environmentalists)
engineering (stakeholders are drainage engineers).
Each stakeholder will analyse the level of risk differently in terms of the types of consequences that might be felt and the likelihood of those consequences.
Biosecurity controls at airports
Travellers arriving at Australian airports may carry with them biological materials posing biosecurity risks. Analysis of the nature of risks would include: countries visited; nature of places visited in each country (eg, farms or forests); pests or pathogens credibly present in those places; credible impact on species and ecosystems in Australia; materials declared by the traveller; materials detected by scanning. The combination of such factors will give an understanding of how uncertainty might affect the objectives of all stakeholders in border biosecurity.
Depending on the stakeholder, the nature of risk might be seen as:
biosecurity (stakeholders are biosecurity officials, environmentalists, and those whose livelihoods depend on the absence of imported pests)
cultural (stakeholders are travellers wishing to bring with them materials from their home countries)
recreational (stakeholders are Australian residents returning from an overseas trip).
Each stakeholder will analyse the level of risk differently in terms of the types of consequences that might be felt and the likelihood of those consequences.
In the above examples, each stakeholder may be satisfied with the description of the nature of risk but will be concerned to know appropriate emphasis is placed on the quantitative or semi-quantitative analysis of the level of risk.
When developing a consequence/likelihood matrix it is most important to show consequence ranges with points that map against each other. This is far easier said than done.
Data for the nature and level of risk
It is important to keep clear the distinction and background information used for the nature of risk and level of risk.
The nature of risk may be highly qualitative but informed by some quantitative data whereas the level of risk may be more quantitative with some qualitative data. For an import risk analysis we would

www.riskmgmt.co.nz
DAFF Biosecurity Risk Matrix Advice Page 12
expect DAFF to use a report template constructed to at least consider relevant information to be used in describing the nature of the risk. This template should form part of the DAFF Import Risk Analysis Handbook. This qualitative data might also provide quantitative data to be used in determining the level of risk.
Our review of the most recent import risk analyses suggests DAFF is indeed using such a template or model. If this is the case, it is likely DAFF import risk analyses are providing the “best available information” 1 for the nature of import risks. However, they do not “explicitly address uncertainty” 2 in the development and use of the matrix.
We have been asked if the import risk analyses are adequately addressing risks for species or crops other than the subject of the import risk analysis. We are unable to answer this question as it is outside our competence and the terms of reference for this report but do recognise this is an important question meriting further investigation.
1 Principle (f), page 7, AS/NZS ISO 31000. “Risk management is based on the best available information”. 2 Principle (d), page 7, AS/NZS ISO 31000. “Risk management explicitly addresses uncertainty”
www.riskmgmt.co.nz
DAFF Biosecurity Risk Matrix Advice Page 13
Risk matrix literature review
Origins and applications of the risk matrix
The risk matrix has been in use for many years and in many forms. Ale (2007) credited Napoleon with the first use of a risk matrix based on the likelihood of consequences; Witt (1973) used a form of two-dimensional risk matrix to analyse motor vehicle premium setting; while Hussey (1978) described a two-dimensional directional policy matrix to aid decision-making.
The consequence/likelihood risk matrix appears to have been applied in the safety sciences in the late 1980s in the UK with simple versions being described in 1991 in a UK Institution of Occupational Health and Safety conference in Belfast3 and by Moore (1997) and others in the 1990s.
An approach to three-dimensional risk matrices with consequences, probability and time was developed by Antoniadis & Thorpe (2003). Their approach was not well-described but offers an alternative way of developing import risk assessment matrices to show the speed with which an unwanted organism might spread from a point of escape.
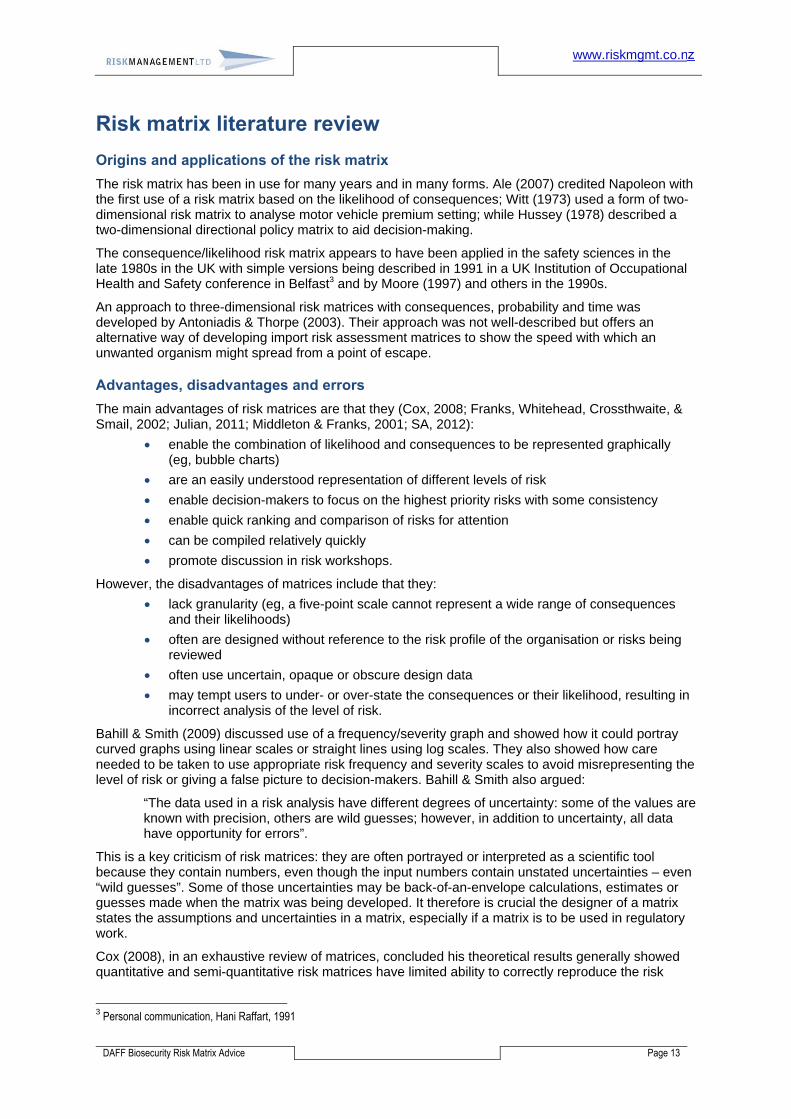
Advantages, disadvantages and errors
The main advantages of risk matrices are that they (Cox, 2008; Franks, Whitehead, Crossthwaite, & Smail, 2002; Julian, 2011; Middleton & Franks, 2001; SA, 2012):
enable the combination of likelihood and consequences to be represented graphically (eg, bubble charts)
are an easily understood representation of different levels of risk
enable decision-makers to focus on the highest priority risks with some consistency
enable quick ranking and comparison of risks for attention
can be compiled relatively quickly
promote discussion in risk workshops.
However, the disadvantages of matrices include that they:
lack granularity (eg, a five-point scale cannot represent a wide range of consequences and their likelihoods)
often are designed without reference to the risk profile of the organisation or risks being reviewed
often use uncertain, opaque or obscure design data
may tempt users to under- or over-state the consequences or their likelihood, resulting in incorrect analysis of the level of risk.
Bahill & Smith (2009) discussed use of a frequency/severity graph and showed how it could portray curved graphs using linear scales or straight lines using log scales. They also showed how care needed to be taken to use appropriate risk frequency and severity scales to avoid misrepresenting the level of risk or giving a false picture to decision-makers. Bahill & Smith also argued:
“The data used in a risk analysis have different degrees of uncertainty: some of the values are known with precision, others are wild guesses; however, in addition to uncertainty, all data have opportunity for errors”.
This is a key criticism of risk matrices: they are often portrayed or interpreted as a scientific tool because they contain numbers, even though the input numbers contain unstated uncertainties – even “wild guesses”. Some of those uncertainties may be back-of-an-envelope calculations, estimates or guesses made when the matrix was being developed. It therefore is crucial the designer of a matrix states the assumptions and uncertainties in a matrix, especially if a matrix is to be used in regulatory work.
Cox (2008), in an exhaustive review of matrices, concluded his theoretical results generally showed quantitative and semi-quantitative risk matrices have limited ability to correctly reproduce the risk
3 Personal communication, Hani Raffart, 1991
www.riskmgmt.co.nz
DAFF Biosecurity Risk Matrix Advice Page 14
ratings implied by quantitative models. This is a key theoretical finding that strongly supports our empirical finding – risk matrices are an overrated way of analysing the level of risk.
Errors in design
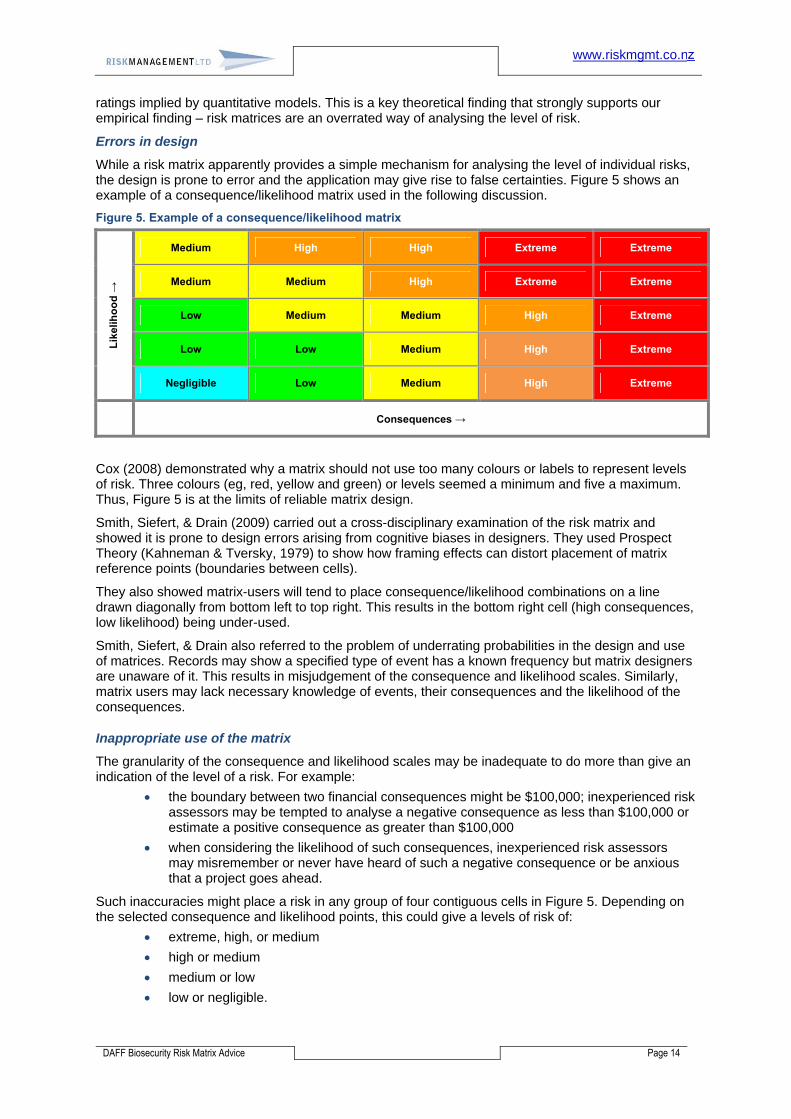
While a risk matrix apparently provides a simple mechanism for analysing the level of individual risks, the design is prone to error and the application may give rise to false certainties. Figure 5 shows an example of a consequence/likelihood matrix used in the following discussion.
Figure 5. Example of a consequence/likelihood matrix
Lik
elih
oo
d →
Medium High High Extreme Extreme
Medium Medium High Extreme Extreme
Low Medium Medium High Extreme
Low Low Medium High Extreme
Negligible Low Medium High Extreme
Consequences →
Cox (2008) demonstrated why a matrix should not use too many colours or labels to represent levels of risk. Three colours (eg, red, yellow and green) or levels seemed a minimum and five a maximum. Thus, Figure 5 is at the limits of reliable matrix design.
Smith, Siefert, & Drain (2009) carried out a cross-disciplinary examination of the risk matrix and showed it is prone to design errors arising from cognitive biases in designers. They used Prospect Theory (Kahneman & Tversky, 1979) to show how framing effects can distort placement of matrix reference points (boundaries between cells).
They also showed matrix-users will tend to place consequence/likelihood combinations on a line drawn diagonally from bottom left to top right. This results in the bottom right cell (high consequences, low likelihood) being under-used.
Smith, Siefert, & Drain also referred to the problem of underrating probabilities in the design and use of matrices. Records may show a specified type of event has a known frequency but matrix designers are unaware of it. This results in misjudgement of the consequence and likelihood scales. Similarly, matrix users may lack necessary knowledge of events, their consequences and the likelihood of the consequences.
Inappropriate use of the matrix
The granularity of the consequence and likelihood scales may be inadequate to do more than give an indication of the level of a risk. For example:
the boundary between two financial consequences might be $100,000; inexperienced risk assessors may be tempted to analyse a negative consequence as less than $100,000 or estimate a positive consequence as greater than $100,000
when considering the likelihood of such consequences, inexperienced risk assessors may misremember or never have heard of such a negative consequence or be anxious that a project goes ahead.
Such inaccuracies might place a risk in any group of four contiguous cells in Figure 5. Depending on the selected consequence and likelihood points, this could give a levels of risk of:
extreme, high, or medium
high or medium
medium or low
low or negligible.

www.riskmgmt.co.nz
DAFF Biosecurity Risk Matrix Advice Page 15
Evans (2012) argued that individual people have different risk tolerances. This can further distort how a matrix is used: people with low risk tolerance will over-rate a risk having negative consequences while those with higher risk tolerance will under-rate it.
Guidance in HB 89: 2012 Risk management – Risk assessment techniques (SA, 2012) describes the matrix as a screening tool and Donoghue (2001) describes the design of qualitative and semi-quantitative matrices to aid operational decision-making after walk-through inspections. Other authors of the articles reviewed for this paper consistently refer to the use of the matrix as a tool for ranking risks for urgency of attention.
Inappropriate quantification
Often, attempts are made to quantify a matrix by allocating scores to the consequence and likelihood scales. This might be done in Figure 5 using a linear scale (1, 2, 3, 4, 5) resulting in a range of scores from 1 (1 x 1 = 1) to 25 (5 x 5 = 25). However, these results would not match the descriptions used for the cells: the cell in the bottom right-hand corner scores 1 x 5 = 5 but is rated as extreme.
A matrix designer might try to avoid this issue by inserting a numeric risk score in each cell, resulting in a perfectly symmetrical matrix. Risk is rarely symmetrical and such a matrix would conceal events resulting in high-consequence, low-likelihood outcomes.
A matrix designer might attempt to apply asymmetrical consequence and likelihood values. For this to be a valid approach the designer would need a substantial body of data on which to base the chosen values. Such a database would take time to build and might use, for example:
historical data related to an environment that has changed, and so give false results
incomplete data, giving rise to uncertainty
data under-reported by those responsible for an adverse loss, giving rise to uncertainty about “washed” data
data reported by people on the “winning team”, giving rise to uncertainty due to over-stated results
use of data from the context of one risk that is not relevant to the context of another.
“Layering “
Further problems arise when designers attempt to reduce the apparent uncertainties in a matrix by “layering” either qualitative or quantitative pre-test questions leading to the use of a matrix. These also are subject to framing errors and designer bias, so introducing hidden uncertainties including the “probability of a probability”.
Summary
Matrices are too often poorly designed and incorrectly interpreted. If they are to be used, they must be simple, based on relevant data, used following a clear understanding of the nature of a risk, and with their limitations understood by risk assessors and decision-makers.

www.riskmgmt.co.nz
DAFF Biosecurity Risk Matrix Advice Page 16
Review of the DAFF matrix We note the Import Risk Analysis Handbook does not mention, let alone describe the use of, the DAFF risk estimation matrix. If the matrix is to be seen as a valid risk technique, capable of withstanding legal scrutiny, its development and application ought to be the subject of a detailed description.
To conduct the following review of the DAFF risk matrix we needed to see its use in the context of the overall import risk analysis. That in turn needed to be set in the context of the language and requirements in WTO, FAO, WOAH and IPPC documents.
The context of the WTO, FAO, WOAH and IPPC documents was covered earlier in this report. We now briefly review the DAFF import risk analysis process using published documents setting out the intended approach and the approach used in some examples.
DAFF risk estimation matrix
The matrix
We took account of the findings of our literature review and the ALOP statement above when reviewing the DAFF risk estimation matrix shown in the New Zealand apples report (Biosecurity Australia, 2006a), Taiwan Fresh Mangoes report (Biosecurity Australia, 2006b), draft Philippines bananas report (DAFF, 2012a), provisional final import report for fresh ginger from Fiji (DAFF, 2012a) and Malaysian pineapples report (DAFF, 2012b).
The Malaysian pineapples report was the most recent finalised report available to review (DAFF, 2012b) and an extract showing the application of the DAFF matrix has been reproduced in appendix 2 of this report.
We have reproduced below the standard DAFF matrix as used in each of the import risk analysis reports reviewed by us (Biosecurity Australia, 2006a, 2006b; DAFF, 2012a, 2012b). The one shown in our Figure 6 is table 2.5 extracted from the Malaysian pineapples report.
Figure 6. DAFF risk estimation matrix
Table 1: Risk estimation matrix
Lik
elih
oo
d o
f en
try,
es
tab
lish
men
t o
r sp
read
High likelihood
Negligible risk
Very low risk
Low risk Moderate risk
High risk Extreme risk
Moderate Negligible risk
Very low risk
Low risk Moderate risk
High risk Extreme risk
Low Negligible risk
Negligible risk
Very low risk
Low risk Moderate risk
High risk
Very low Negligible risk
Negligible risk
Negligible risk
Very low risk Low risk Moderate risk
Extremely low
Negligible risk
Negligible risk
Negligible risk
Negligible risk
Very low risk Low risk
Negligible likelihood
Negligible risk
Negligible risk
Negligible risk
Negligible risk
Negligible risk
Very low risk
Negligible impact
Very low Low Moderate High Extreme impact
Consequences of entry, establishment or spread
Source: Biosecurity Australia (2006a, 2006b) & DAFF (2012a, 2012b)
www.riskmgmt.co.nz
DAFF Biosecurity Risk Matrix Advice Page 17
Overall design of the matrix
The matrix is a 6x6 matrix. This is a little unusual but quite acceptable for risks with an especially wide range of consequences and associated likelihoods. However, and while we are not specialists in biosecurity, we feel intuitively a 6x6 matrix is larger than might be needed for import risk analyses. It may be possible to redesign and simplify the DAFF matrix to a 5x5 matrix. On page 23 we have suggested what this might look like.
Labelling of the matrix
In the matrix the X axis is for the consequences of entry, establishment or spread whereas the Y axis is labelled likelihood of entry, establishment or spread. While this difference may seem subtle and of small importance it is actually of considerable importance. For example:
there is a negligible likelihood of foot and mouth disease entering Australia
there is a high likelihood that extreme consequences would follow foot and mouth disease entering Australia.
Both statements are true and, confusingly, each could be made by using the DAFF matrix.
Unreliability of qualitative descriptors
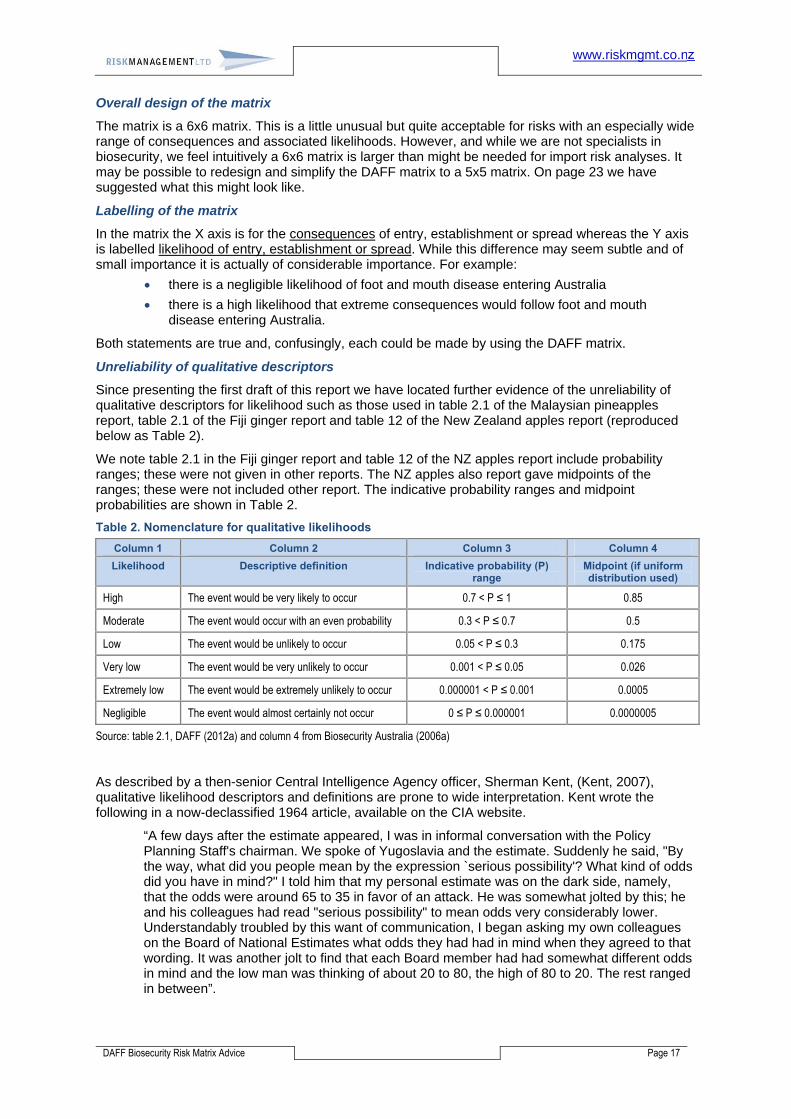
Since presenting the first draft of this report we have located further evidence of the unreliability of qualitative descriptors for likelihood such as those used in table 2.1 of the Malaysian pineapples report, table 2.1 of the Fiji ginger report and table 12 of the New Zealand apples report (reproduced below as Table 2).
We note table 2.1 in the Fiji ginger report and table 12 of the NZ apples report include probability ranges; these were not given in other reports. The NZ apples also report gave midpoints of the ranges; these were not included other report. The indicative probability ranges and midpoint probabilities are shown in Table 2.
Table 2. Nomenclature for qualitative likelihoods
Column 1 Column 2 Column 3 Column 4
Likelihood Descriptive definition Indicative probability (P) range
Midpoint (if uniform distribution used)
High The event would be very likely to occur 0.7 < P ≤ 1 0.85
Moderate The event would occur with an even probability 0.3 < P ≤ 0.7 0.5
Low The event would be unlikely to occur 0.05 < P ≤ 0.3 0.175
Very low The event would be very unlikely to occur 0.001 < P ≤ 0.05 0.026
Extremely low The event would be extremely unlikely to occur 0.000001 < P ≤ 0.001 0.0005
Negligible The event would almost certainly not occur 0 ≤ P ≤ 0.000001 0.0000005
Source: table 2.1, DAFF (2012a) and column 4 from Biosecurity Australia (2006a)
As described by a then-senior Central Intelligence Agency officer, Sherman Kent, (Kent, 2007), qualitative likelihood descriptors and definitions are prone to wide interpretation. Kent wrote the following in a now-declassified 1964 article, available on the CIA website.
“A few days after the estimate appeared, I was in informal conversation with the Policy Planning Staff's chairman. We spoke of Yugoslavia and the estimate. Suddenly he said, "By the way, what did you people mean by the expression `serious possibility'? What kind of odds did you have in mind?" I told him that my personal estimate was on the dark side, namely, that the odds were around 65 to 35 in favor of an attack. He was somewhat jolted by this; he and his colleagues had read "serious possibility" to mean odds very considerably lower. Understandably troubled by this want of communication, I began asking my own colleagues on the Board of National Estimates what odds they had had in mind when they agreed to that wording. It was another jolt to find that each Board member had had somewhat different odds in mind and the low man was thinking of about 20 to 80, the high of 80 to 20. The rest ranged in between”.

www.riskmgmt.co.nz
DAFF Biosecurity Risk Matrix Advice Page 18
The same issues arose following publication of the 2004 draft New Zealand apples report.
“The approach used in the 2004 draft was to assign descriptive terms to quantitative ranges, (‘high’, ‘moderate’, ‘low’, etc). These terms were used throughout the text to represent these quantitative ranges. However, this caused some confusion with some stakeholders applying their own interpretation to the terms rather than the meanings set out in the methodology. In order to overcome this problem, in the revised draft and this final IRA, the descriptive terms are only used for qualitative values. Numbers are given for quantitative values” (Biosecurity Australia, 2006a, p. 42).
Such variations in interpretation have led to a body of research on judgement indicating there are large differences in the way people understand phrases such as those in Table 2 above and that may lead to confusion and errors in communication. Research by Budescu, Broomell, & Por (2009) examined interpretations of likelihood terms used by the Intergovernmental Panel on Climate Change (IPCC) to communicate uncertainty. The terms use a set of probabilities accompanied by global interpretational guidelines. The research found respondents' judgments deviated significantly from the IPCC guidelines, even when the respondents had access to these guidelines.
From this research and our experience we find it likely that DAFF risk analysts may place their own interpretations on the words used in table 2.1 of the Malaysian pineapple report (DAFF, 2012b) and other DAFF/Biosecurity reports. In making this statement we are aware the word likely is, itself, open to interpretation. We therefore suggest there is an 80% probability of idiosyncratic 4 interpretation of the DAFF nomenclature for qualitative likelihoods. This probability might be revised following research within DAFF.
Entry, establishment and spread as causes of an event
The methodology described in the Malaysian pineapples report sets out the matrix methodology including the probability of entry (broken into import and distribution), establishment and spread. These are referred to as “events” in table 2.1 Nomenclature for qualitative likelihoods in the DAFF report (see Table 2 on the previous page) but the term event is not defined in relevant WTO, FAO, WOAH and IPPC documents.
AS/NZS ISO 31000 defines event as an “occurrence or change of a particular set of circumstances.
Note 1 An event can be one or more occurrences, and can have several causes.
Note 2 An event can consist of something not happening.
Note 3 An event can sometimes be referred to as an ‘incident’ or ‘accident’.
Note 4 An event without consequences can also be referred to as a ‘near miss’, ‘incident’, ‘near hit’ or ‘close call’”.
We believe establishment is better thought of as an occurrence or change in specific circumstances while entry, import and distribution are causes of establishment. This then enables more clarity in describing the nature of risk.
Consequence is defined in AS/NZS ISO 31000 as the “outcome of an event affecting objectives.
Note 1 An event can lead to a range of consequences.
Note 2 A consequence can be certain or uncertain and can have positive or negative effects on objectives.
Note 3 Consequences can be expressed qualitatively or quantitatively.
Note 4 Initial consequences can escalate through knock-on effects”.
Event or consequence?
The construction of the DAFF matrix method seems to suggest it is based on the likelihood of an event. If this is so, the approach is wrong. Risk is the likelihood of the consequences of an event, not likelihood of an event. It is important to try to understand both the causes of an event and the event giving rise to the consequences, but it is essential to keep these distinctions clear.
4 Idiosyncratic: a mode of behaviour or way of thought peculiar to an individual (Soanes & Stevenson, 2009).

www.riskmgmt.co.nz
DAFF Biosecurity Risk Matrix Advice Page 19
Probability and likelihood
The methodology refers to qualitative likelihoods for the probabilities. The terms probability and likelihood are often used interchangeably but they are not the same. Probability is a “measure of the chance of occurrence expressed as a number between 0 and 1, where 0 is impossibility and 1 is absolute certainty” (ISO, 2009b) whereas likelihood is the “chance of something happening”. That said, likelihood may be “defined, measured or determined objectively or subjectively, qualitatively or quantitatively, and described using general terms or mathematically (such as a probability or a frequency over a given time period)” (SA/SNZ ISO, 2009).
If the term probability is used it should be expressed numerically, with uncertainty about the accuracy of the numbers clearly stated. If the term likelihood is used, it should be described in terms such as “almost certain” or “almost incredible” leaving no doubt there is uncertainty.
Combination of qualitative likelihood terms
Table 2.2 in the Malaysian pineapples report (and other DAFF reports) sets out rules for combining descriptive likelihoods. No rationale or source for these rules is given, making the rules opaque and difficult to comment on. They appear to be the result of combining probabilities and so may be based on logic. If this is the case, DAFF officials should be able to explain it.
However, the need for that table 2.2 only exists if a risk analyst needs to estimate the qualitative likelihood of three events giving rise to the likelihood of a specified consequence. This is not good risk analysis practice and is not necessary if establishment of a pest is seen as an event or change in specific circumstances while entry, import and distribution are causes of establishment.
The Fijian ginger report includes indicative probabilities (see our Table 2 above) so it is possible DAFF has been using probabilities in earlier reports but without disclosing them. We therefore used the indicative probability ranges from the Fijian ginger report and combined the highest numerical probabilities indicated in Table 2 and show the results in Table 3 below. The calculations were repeated for the lowest numerical probabilities and the results are shown in Table 4.
The results from Table 3 tend to support the earlier use of probabilities by DAFF in that most of the highest probabilities combine to support the likelihood labels (18/21). However, somewhat less of the lowest probabilities combine to support the likelihood labels (15/21). Overall, it is likely the rules for combining qualitative likelihoods are based on probabilities. This leaves unanswered the question:
“What is the source of the probability ranges?”
It is good practice to cite a source for such probability ranges. The best source would be peer reviewed published in a scientific journal but in-house research might also give assurance to decision-makers and provide a defensible position.
Table 3. Combination of highest probabilities for events
High Moderate Low Very low Extremely low
Negligible
≤1 ≤0.7 ≤0.3 ≤0.05 ≤0.001 ≤0.000001
High ≤1 ≤1 ≤0.7 ≤0.3 ≤0.05 ≤0.001 ≤0.000001
Moderate ≤0.7 - ≤0.49 ≤0.21 ≤0.035 ≤0.0007 ≤0.0000007
Low ≤0.3 - - ≤0.09 ≤0.0015 ≤0.00003 ≤0.00000003
Very low ≤0.05 - - - ≤0.0025 ≤0.00005 ≤0.0.00000005
Extremely low
≤0.001 - - - - ≤0.000001 ≤0.000000001
Negligible ≤0.000001 - - - - - ≤0.0000000000001
www.riskmgmt.co.nz
DAFF Biosecurity Risk Matrix Advice Page 20
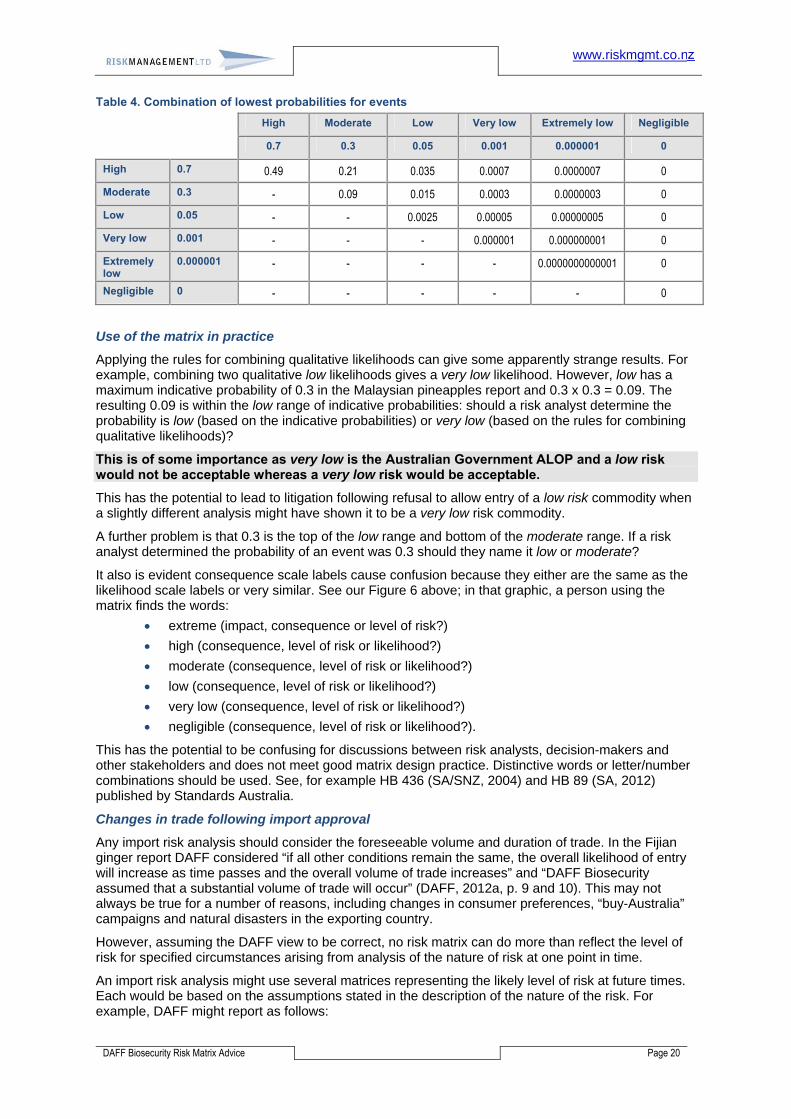
Table 4. Combination of lowest probabilities for events
High Moderate Low Very low Extremely low Negligible
0.7 0.3 0.05 0.001 0.000001 0
High 0.7 0.49 0.21 0.035 0.0007 0.0000007 0
Moderate 0.3 - 0.09 0.015 0.0003 0.0000003 0
Low 0.05 - - 0.0025 0.00005 0.00000005 0
Very low 0.001 - - - 0.000001 0.000000001 0
Extremely low
0.000001 - - - - 0.0000000000001 0
Negligible 0 - - - - - 0
Use of the matrix in practice
Applying the rules for combining qualitative likelihoods can give some apparently strange results. For example, combining two qualitative low likelihoods gives a very low likelihood. However, low has a maximum indicative probability of 0.3 in the Malaysian pineapples report and 0.3 x 0.3 = 0.09. The resulting 0.09 is within the low range of indicative probabilities: should a risk analyst determine the probability is low (based on the indicative probabilities) or very low (based on the rules for combining qualitative likelihoods)?
This is of some importance as very low is the Australian Government ALOP and a low risk would not be acceptable whereas a very low risk would be acceptable.
This has the potential to lead to litigation following refusal to allow entry of a low risk commodity when a slightly different analysis might have shown it to be a very low risk commodity.
A further problem is that 0.3 is the top of the low range and bottom of the moderate range. If a risk analyst determined the probability of an event was 0.3 should they name it low or moderate?
It also is evident consequence scale labels cause confusion because they either are the same as the likelihood scale labels or very similar. See our Figure 6 above; in that graphic, a person using the matrix finds the words:
extreme (impact, consequence or level of risk?)
high (consequence, level of risk or likelihood?)
moderate (consequence, level of risk or likelihood?)
low (consequence, level of risk or likelihood?)
very low (consequence, level of risk or likelihood?)
negligible (consequence, level of risk or likelihood?).
This has the potential to be confusing for discussions between risk analysts, decision-makers and other stakeholders and does not meet good matrix design practice. Distinctive words or letter/number combinations should be used. See, for example HB 436 (SA/SNZ, 2004) and HB 89 (SA, 2012) published by Standards Australia.
Changes in trade following import approval
Any import risk analysis should consider the foreseeable volume and duration of trade. In the Fijian ginger report DAFF considered “if all other conditions remain the same, the overall likelihood of entry will increase as time passes and the overall volume of trade increases” and “DAFF Biosecurity assumed that a substantial volume of trade will occur” (DAFF, 2012a, p. 9 and 10). This may not always be true for a number of reasons, including changes in consumer preferences, “buy-Australia” campaigns and natural disasters in the exporting country.
However, assuming the DAFF view to be correct, no risk matrix can do more than reflect the level of risk for specified circumstances arising from analysis of the nature of risk at one point in time.
An import risk analysis might use several matrices representing the likely level of risk at future times. Each would be based on the assumptions stated in the description of the nature of the risk. For example, DAFF might report as follows:
www.riskmgmt.co.nz
DAFF Biosecurity Risk Matrix Advice Page 21
Our IRA for the first 12 months of import shows the nature of risk to be XXX [the body of evidence inserted here]. Arising from this and using risk matrix X the level of risk is estimated to be [insert label or number].
However, to the end of year 5, trade is likely to have increased by Z% changing the nature of risk to YYY [the additional body of evidence inserted here]. Arising from this and using risk matrix Y the level of risk is estimated to be [insert label or number].
The analysed levels of risk shown in each of a series of matrices might in turn be graphed to show change over time within ranges. This might be of value to decision-makers assuming the context of the proposed export remains the same over that time. Given the uncertainties around the matrix such a graph would need to be clearly tagged with assumptions and uncertainties.
Appropriate level of sanitary and phytosanitary protection (ALOP) and risk criteria
When deciding if a risk is acceptable it is necessary to have some way of evaluating the risk, after analysis, to decide if the level of risk is above or below pre-determined criteria.
In the NZ apples report (Biosecurity Australia, 2006a, p. 4) the matrix is introduced by the phrase
“ALOP can be illustrated using a ‘risk estimation matrix’ (see Table 1)”.
This is followed by a copy of the matrix. There is a brief discussion in the report of a claim by a stakeholder that the matrix did not represent government policy on ALOP, but this was rejected by Biosecurity Australia. As the matrix was not supported by any description of the underlying analytical work that precedes use of the matrix this might not have been a defensible rejection.
To try to compare the generic management of risk described in AS/NZS ISO 31000 and the WTO, FAO, WOAH and IPPC documents we have considered what ALOP can be equated with, and believe it is close to the concept of “risk criteria”.
The term risk criteria is defined in AS/NZS ISO 31000 as the “terms of reference by which the significance of risk is assessed.
Note 1 Risk criteria are based on organizational objectives, and external and internal context.
Note 2 Risk criteria can be derived from standards, laws, policies and other requirements”.
For import risk analysis, organisational objectives will be the objectives of the Australian Government, as expressed in legislation and standards, laws, policies and other requirements.
The Biosecurity Australia Import Risk Analysis Handbook states:
“Like many other WTO Members, Australia expresses its ALOP in qualitative terms.
The Australian Government, with the agreement of all state and territory governments, has expressed Australia’s ALOP as providing a high level of sanitary and phytosanitary protection aimed at reducing risk to a very low level, but not to zero” (DAFF, 2011, p. 33).
This strongly suggests import risk analysis should also be in qualitative terms, although some quantification may be possible and useful if the data is reliable.
It also allows for an “ALOP line” to be drawn across a matrix to indicate acceptable and unacceptable levels of risk. Such a line may be straight or curved; in the DAFF matrix it is a straight line.
Consequence scales – geographical impacts
The methodology in the DAFF matrix describes the assessment of consequences. Four levels of consequence are considered for four levels of Australian community, viz:
“Local: an aggregate of households or enterprises (a rural community, a town or a local government area).
District: a geographically or geopolitically associated collection of aggregates (generally a recognised section of a state or territory, such as ‘Far North Queensland’).
Regional: a geographically or geopolitically associated collection of districts in a geographic area (generally a state or territory, although there may be exceptions with larger states such as Western Australia).
www.riskmgmt.co.nz
DAFF Biosecurity Risk Matrix Advice Page 22
National: Australia wide (Australian mainland states and territories and Tasmania)” (DAFF, 2012a).
The four levels of consequence are, as shown, reasonable but may apply to any size of community. For example, a small community might be a major contributor to the regional or national economy. As shown, such a contribution might be understated. The reverse might be true with a pest having trivial national impacts felt catastrophically at a local level.
This problem can be overcome by developing consequence scales based on, for example, national GDP, percentage of national crop at risk, or viable planting area at risk.
Does the matrix overstate or understate of the level of risk?
It is possible the rules for combining qualitative likelihoods either overstate or understate the level of risk in some cases. As noted, the rules are opaque with no source cited and therefore leave in doubt their reliability.
Two of the reports provide indicative probability ranges. These would be most helpful if their sources were cited; we are again left with doubt about the provenance and reliability of the indicative probabilities. Furthermore, our calculations (Table 3 and Table 4 above) suggest that some indicative probability range combinations may give results that breach the DAFF rules for combining qualitative likelihoods.
Overall, combining the likelihoods and/or their indicative probabilities may either overstate or understate the level of import risk.
Is there increased biosecurity risk arising from use of the matrix?
From our response to the previous question, the simple answer might be yes. However, we have re-read the four IRA reports and been impressed with the qualitative analyses and their summary risk evaluations. In the Fijian ginger report there is a very clear link between the qualitative nature of risk descriptions and selected likelihood description. We also specifically note the 2006 NZ apples report used a more quantitative approach making more transparent the analysed levels of risk for each pest.
Thus, it seems likely the DAFF IRA approach is sound up to the use of the matrix and rules for the combination of qualitative likelihoods. In this part of the risk analysis there is the possibility of increased biosecurity risk.
The converse may also be true: the matrix may be overstating the level of biosecurity risk.
DAFF matrix design solutions
Can the DAFF matrix be improved? The answer is a guarded “yes” as the matrix requires major redesign to be a true consequence/likelihood matrix.
Risk perception
To improve the design of the matrix DAFF risk analysts need to know and understand the perception of risk in DAFF and external stakeholders, including RRAT.
Risk perception is defined in the ISO Risk Management Vocabulary (ISO, 2009b) as “the stakeholder’s view on a risk” and “reflects the stakeholder’s needs, issues, knowledge, belief and values”.
Risk perceptions of external stakeholders may be intuitive feelings, based on media reports (Slovic, 2000). Some stakeholders may believe that levels of risk are increasing whereas the reverse may be the case. DAFF risk analysts need to understand the risk perceptions of external stakeholders as distinct from their professional perception of risk.
In Australia, public perceptions of biosecurity risks may be shaded by, for example, environmental damage caused by the release of wild rabbits in the 1800s and the harm caused by cane toads. Or there may be a proposal to import from overseas an exotic species or a species already in Australia that can carry some disease or pest (for example, the recent change to allow imports of European rabbits that might carry epizootic rabbit enteropathy).
Such risk perceptions should be incorporated into risk criteria used to analyse the consequences of a given import risk.

www.riskmgmt.co.nz
DAFF Biosecurity Risk Matrix Advice Page 23
Generic scales
Scales relevant to the consequences of the risk event and the likelihood of those consequences should be developed by DAFF. The best source of unbiased guidance on this is the now out-of-date joint Standards Australia/Standards New Zealand handbook HB 436 (SA/SNZ, 2004, pp. 50-57) 5.
DAFF risk analysts should submit their proposed consequence and likelihood scales and matrix to senior managers (and possibly politicians) for independent approval. This “governance” level should not have been party to the development of the scales.
The levels of risk allocated to the cells in the matrix might be labelled:
acceptable, indiscernible level of risk, no further action required
tolerable level of risk, some action required to modify the risk
unacceptable level of risk, prohibit entry.
These align with the comments by Cox (2008) who suggested a limited number of defined levels of risk.
An example of a partially developed consequence/likelihood import risk analysis matrix is shown in Table 5 below. The grey shaded cells show the level of risk; empty cells need to be completed by DAFF.
Table 5. Indicative revised risk estimation matrix
Note 2 Almost certain Expected to occur in most circumstances
Unacceptable level of risk, prohibit entry
Lik
elih
oo
d →
Likely Would probably occur in most circumstances
Note 3
Possible Could occur at some time
Unlikely Not expected to occur
Tolerable level of risk, some action required to modify the risk
Rare May occur only in exceptional circumstances
Acceptable indiscernible level of risk, no further action required
Consequence → Insignificant Minor Moderate Major Catastrophic
Economic consequences Note 1 Note 1 Note 1 Note 1 Note 1
Impact on ecosystems Note 1 Note 1 Note 1 Note 1 Note 1
Mortality/morbidity Note 1 Note 1 Note 1 Note 1 Note 1
Note 1. Enter relevant information in each cell to show the consequences expressed in terms of economic consequences (dollars, percentage of GDP, etc), mortality/morbidity, native species and ecosystems, reversibility, etc.
Note 2. Substitute likelihood terms and descriptions relevant to Australian biosecurity requirements.
Note 3. The level of risk cells need to be completed. For convenience they could be coloured suggesting the level (eg, red, amber, green).
The revised matrix and a description of how it was developed should form part of each import risk analysis report.
5 HB 436 was under revision at the time of writing this report.
www.riskmgmt.co.nz
DAFF Biosecurity Risk Matrix Advice Page 24
Alternative risk techniques
WTO and stakeholder expectations
If matrices have so many deficiencies, are there alternative risk techniques that are less error-prone or less likely to mislead? To help answer this question we have used international standards and handbooks giving more guidance than is available in FAO, WOAH and IPPC documents.
In AS/NZS ISO 31000 risk analysis is the “process to comprehend the nature of risk and to determine the level of risk [our emphasis added].
Note 1: Risk analysis provides the basis for risk evaluation and decisions about risk treatment.
Note 2: Risk analysis includes risk estimation”.
(The FAO, WOAH and IPPC documents – but not the WTO agreement on SPS measures – call this risk assessment, not risk analysis.) The risk analysis definition aligns with the requirements of the WTO for an importing country to have “an objective and defensible method of assessing the disease risks associated with the importation of animals, animal products, animal genetic material, feedstuffs, biological products and pathological material”. To satisfy the WTO, a risk assessment must go beyond:
“… mere ‘possibilities’ of invasion, while allowing that the actual probabilities it required instead need not be numerical but could be based on substantial but qualitative evidence. In effect, it imposes on those arguing for a restriction on imports an onus to establish some substantial (but not necessarily numerical) probability of the establishment of a pest in the importing country” [emphasis added] (Franklin, Sisson, Burgman, & Martin, 2008).
While this mentions the use of non-mathematical probabilities it specifically refers to “substantial but qualitative evidence”.
How that evidence is gathered and presented is a matter for best practice risk analysis involving stakeholders and recognised risk assessment techniques.
Risk naming
We believe a risk name should be a short risk description giving a “structured statement of risk usually containing four elements: sources, events, causes and consequences” (ISO, 2009b). The term “risk source” means an “element which alone or in combination has the intrinsic potential to give rise to risk” and “a risk source can be tangible or intangible” (ISO, 2009c); it might be a family of pest species or the food item proposed to be imported. The terms “event” and “consequences” have already been discussed. With these points in mind, we review possible risk techniques.
Sources of information
We reviewed techniques set out in international standard ISO 31010: 2009 Risk management – Risk assessment techniques (published in Australia with amendments as HB 89: 2012 Risk management – Risk assessment techniques) and identified the following as possible alternative techniques for understanding the level of risk. Some techniques are qualitative, some are quantitative, while others can be either qualitative or quantitative:
consequence/likelihood matrix (as distinct from the likelihood/event/consequence matrix used by DAFF)
decision tree analysis
Delphi techniques
failure mode and effect analysis (FMEA)
failure mode, effects and criticality analysis (FMECA)
fault tree analysis
event tree analysis
bow-tie analysis
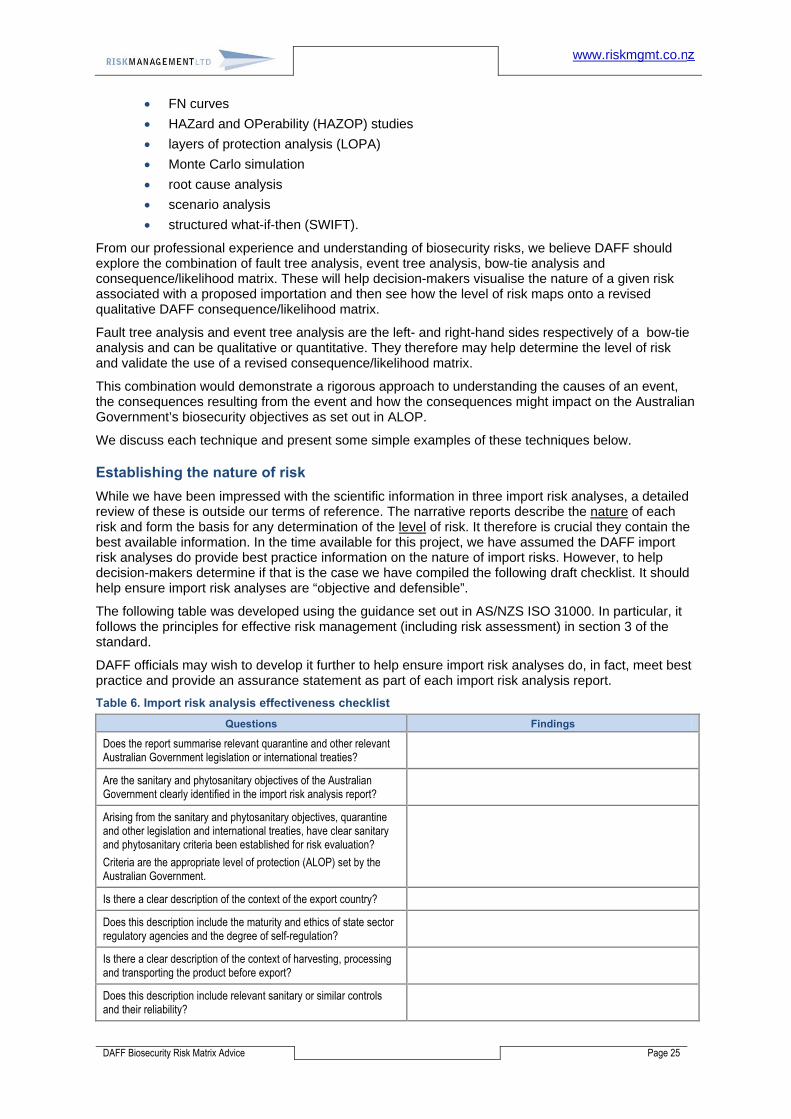
www.riskmgmt.co.nz
DAFF Biosecurity Risk Matrix Advice Page 25
FN curves
HAZard and OPerability (HAZOP) studies
layers of protection analysis (LOPA)
Monte Carlo simulation
root cause analysis
scenario analysis
structured what-if-then (SWIFT).
From our professional experience and understanding of biosecurity risks, we believe DAFF should explore the combination of fault tree analysis, event tree analysis, bow-tie analysis and consequence/likelihood matrix. These will help decision-makers visualise the nature of a given risk associated with a proposed importation and then see how the level of risk maps onto a revised qualitative DAFF consequence/likelihood matrix.
Fault tree analysis and event tree analysis are the left- and right-hand sides respectively of a bow-tie analysis and can be qualitative or quantitative. They therefore may help determine the level of risk and validate the use of a revised consequence/likelihood matrix.
This combination would demonstrate a rigorous approach to understanding the causes of an event, the consequences resulting from the event and how the consequences might impact on the Australian Government’s biosecurity objectives as set out in ALOP.
We discuss each technique and present some simple examples of these techniques below.
Establishing the nature of risk
While we have been impressed with the scientific information in three import risk analyses, a detailed review of these is outside our terms of reference. The narrative reports describe the nature of each risk and form the basis for any determination of the level of risk. It therefore is crucial they contain the best available information. In the time available for this project, we have assumed the DAFF import risk analyses do provide best practice information on the nature of import risks. However, to help decision-makers determine if that is the case we have compiled the following draft checklist. It should help ensure import risk analyses are “objective and defensible”.
The following table was developed using the guidance set out in AS/NZS ISO 31000. In particular, it follows the principles for effective risk management (including risk assessment) in section 3 of the standard.
DAFF officials may wish to develop it further to help ensure import risk analyses do, in fact, meet best practice and provide an assurance statement as part of each import risk analysis report.
Table 6. Import risk analysis effectiveness checklist
Questions Findings
Does the report summarise relevant quarantine and other relevant Australian Government legislation or international treaties?
Are the sanitary and phytosanitary objectives of the Australian Government clearly identified in the import risk analysis report?
Arising from the sanitary and phytosanitary objectives, quarantine and other legislation and international treaties, have clear sanitary and phytosanitary criteria been established for risk evaluation?
Criteria are the appropriate level of protection (ALOP) set by the Australian Government.
Is there a clear description of the context of the export country?
Does this description include the maturity and ethics of state sector regulatory agencies and the degree of self-regulation?
Is there a clear description of the context of harvesting, processing and transporting the product before export?
Does this description include relevant sanitary or similar controls and their reliability?

www.riskmgmt.co.nz
DAFF Biosecurity Risk Matrix Advice Page 26
Questions Findings
Which stakeholders did the risk analysts communicate with before, during and on completion of risk analysis?
Which stakeholders did the risk analysts consult with before, during and on completion of risk analysis?
Does the report clearly identify the stakeholders’ concerns about the proposal and associated risks?
Did the risk analysts follow a consistent process meeting best practice to identify risks, understand the nature of each risk and then determine the level of each risk?
Which techniques were used to identify the risks associated with the proposed import?
Does each risk name set out the:
risk source
possible causes of the risk event
the risk event
possible consequences
impacts on the sanitary and phytosanitary objectives
Which risk analysis techniques did the risk analysts use?
Did those techniques enable “triangulation” to show the different characteristics of each risk and so build a comprehensive picture of each risk?
Is the description of the nature of each risk clear and unambiguous?
Has uncertainty been discussed in relation to the nature of each risk and how did this inform the use of any quantitative risk analysis?
How was the level of each risk determined?
Has the level of each risk been compared with other, similar risks that have been accepted or rejected by the Australian Government?
Has the import risk analysis been adapted to any unusual features of the proposal and is any such adaptation clearly identified?
Overall, is the import risk analysis systematic and structured?
Does the risk assessment process provide the best available information to decision-makers in a useful and usable way?
Uncertainty
Risk is not defined in the WTO, FAO, WOAH or IPPC documents but it is defined in AS/NZS ISO AS/NZS ISO 31000 as “the effect of uncertainty on objectives”. Note 5 to that definition further defines uncertainty as “the state, even partial, of deficiency of information related to, understanding or knowledge of, an event, its consequence, or likelihood”.
AS/NZS ISO 31000 also sets out 11 principles for effective risk management, including risk assessment and risk analysis. Principle (d) states:
“Risk management explicitly addresses uncertainty.
Risk management explicitly takes account of uncertainty, the nature of that uncertainty, and how it can be addressed”.
It therefore is essential any import risk analysis openly addresses uncertainty. As will be seen, uncertainty about numerical data may make any quantitative import risk analysis of doubtful value.
Consequence/likelihood matrix
A consequence/likelihood matrix is a qualitative or semi-quantitative risk analysis “tool for ranking and displaying risks by defining ranges for consequence and likelihood” (ISO, 2009b). It is one way of

www.riskmgmt.co.nz
DAFF Biosecurity Risk Matrix Advice Page 27
combining qualitative or semi-quantitative estimates of the consequences of a risk and the likelihood of the specified consequence occurring. This tells something about the level of risk – that is, the “magnitude of a risk expressed in terms of the combination of consequences and their likelihood” (ISO, 2009b).
Risks with multiple consequences can be plotted on a matrix to show risk levels for each combination of consequence and likelihood. If designed to take account of the context of an organisation or a specific risk assessment, a matrix can aid risk ranking to help a risk assessor evaluate risks or decide on priorities for further risk analysis or for risk treatment.
It also is possible to plot three levels of risk on a matrix:
the level of risk with no controls in place or assuming controls have failed
the level of risk with current controls in place, taking account of their individual or collective effectiveness
the level of risk that might be achieved after any treatments have been implemented to modify an otherwise unacceptable level of risk.
This helps identify controls that, individually or collectively, are key controls because they have some major effects on the level of risk. This in turn would guide DAFF biosecurity staff in their decisions about auditing and checking on import controls.
Fault tree analysis
Fault tree analysis (FTA) is a “top down”, logic-based analysis tool for identifying “events” that can combine through AND or OR gates to result in a specified “top event”. The events may be initiating events, changes in circumstances or failure of controls (IEC, 1990; ISO, 2009a). A fault tree can be used as the left-hand side in bow-tie analysis, in which case the causal events flow from left to right resulting in the top event.
A well-constructed qualitative FTA can give very good information about how the top event might occur. A large FTA can be time-consuming to develop but can help identify where there is complexity in a system.
Four basic symbols commonly used in fault tree analysis are shown in Table 7.
Table 7. Symbols for use in fault tree analysis
Symbol Function Description
Event description block
Name or description of the event, the event code, and probability of occurrence (as required) are included within the symbol
Alternatively a general gate symbol whose function is defined within the symbol
AND gate
The output event occurs only if all input events occur at the same time
OR gate The output event occurs if any of the input events occur, either alone or in combination
Basic event Event described by a basic component or part failure which cannot be subdivided. It marks the lowest level of development in the tree
Quantitative output
A fault tree analysis can be quantified by assigning probabilities to initiating events or faults. These are then combined through AND and OR logic gates. In an AND gate, the probabilities are multiplied. In an OR gate, the probabilities are added.
Event probabilities mostly depend on historical data. If there has been a change in that data or in the conditions of use or operation of the system, a quantified FTA may be very inaccurate.
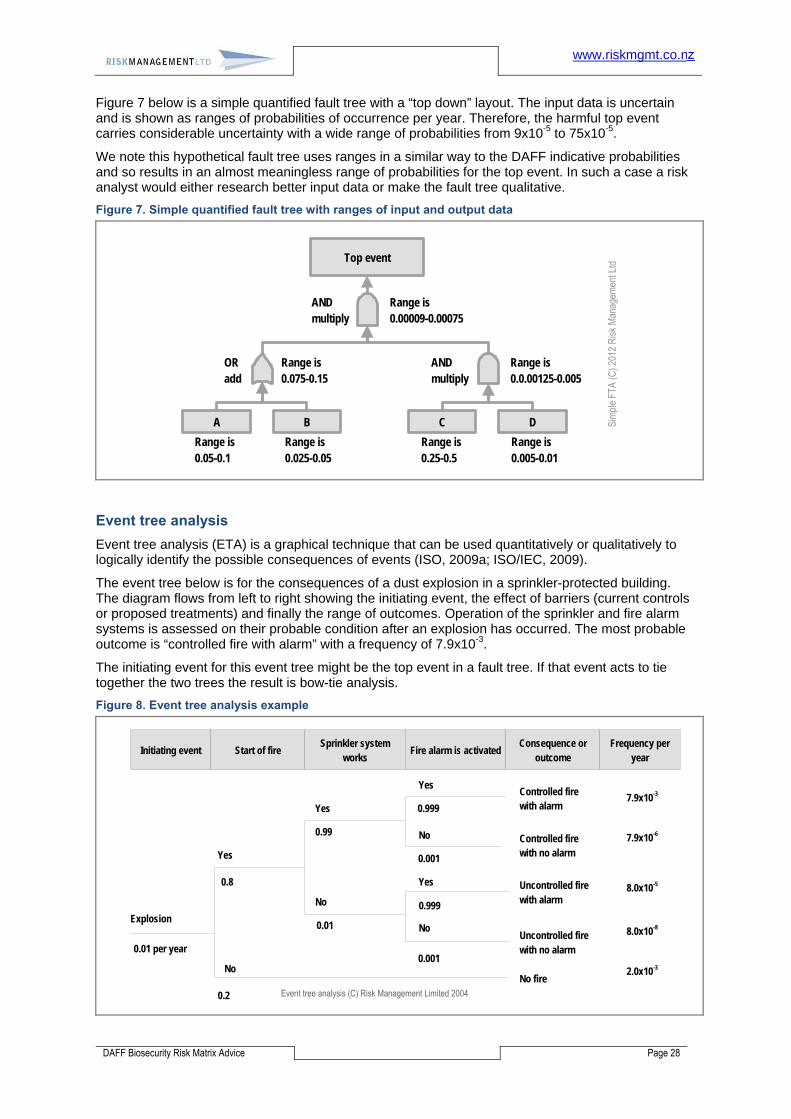
www.riskmgmt.co.nz
DAFF Biosecurity Risk Matrix Advice Page 28
Figure 7 below is a simple quantified fault tree with a “top down” layout. The input data is uncertain and is shown as ranges of probabilities of occurrence per year. Therefore, the harmful top event carries considerable uncertainty with a wide range of probabilities from 9x10⁻⁵ to 75x10-5.
We note this hypothetical fault tree uses ranges in a similar way to the DAFF indicative probabilities and so results in an almost meaningless range of probabilities for the top event. In such a case a risk analyst would either research better input data or make the fault tree qualitative.
Figure 7. Simple quantified fault tree with ranges of input and output data
Top event
A B C D
ORadd
ANDmultiply
Range is 0.05-0.1
Range is 0.025-0.05
Range is 0.25-0.5
Range is 0.005-0.01
Range is 0.075-0.15
ANDmultiply
Range is 0.0.00125-0.005
Range is 0.00009-0.00075
Sim
ple
FTA
(C) 2
012
Ris
k M
anag
emen
t Ltd
Event tree analysis
Event tree analysis (ETA) is a graphical technique that can be used quantitatively or qualitatively to logically identify the possible consequences of events (ISO, 2009a; ISO/IEC, 2009).
The event tree below is for the consequences of a dust explosion in a sprinkler-protected building. The diagram flows from left to right showing the initiating event, the effect of barriers (current controls or proposed treatments) and finally the range of outcomes. Operation of the sprinkler and fire alarm systems is assessed on their probable condition after an explosion has occurred. The most probable outcome is “controlled fire with alarm” with a frequency of 7.9x10⁻³.
The initiating event for this event tree might be the top event in a fault tree. If that event acts to tie together the two trees the result is bow-tie analysis.
Figure 8. Event tree analysis example
Event tree analysis (C) Risk Management Limited 2004
Initiating event Start of fireSprinkler system
worksFire alarm is activated
Consequence or outcome
Frequency per year
Explosion
0.01 per year
Yes
Yes
Yes
Yes
No
No
No
No
Controlled firewith alarm
Controlled firewith no alarm
Uncontrolled firewith alarm
Uncontrolled firewith no alarm
No fire
0.8
0.2
0.99
0.01
0.999
0.001
0.999
0.001
7.9x10⁻³
7.9x10⁻⁶
8.0x10⁻⁵
8.0x10⁻⁸
2.0x10⁻³

www.riskmgmt.co.nz
DAFF Biosecurity Risk Matrix Advice Page 29
Bow-tie analysis
Bow-ties graphically display the relationship between initiating events, events, controls, consequences and impacts on objectives using a combination of fault tree analysis and event-tree analysis to convey information about controls for prevention, detection, halting or recovering from an event (Cockshott, 2005; Franks et al., 2002).
Bow-ties are often easier to understand than fault trees and event trees, as they show how causes flow to consequences. An example of a generic bow-tie is shown below.
Figure 9. A generic bow-tie
Fault tree analysis(NB: the tree has been rotated through 90o)
Event tree analysis
Bow tie analysis (C) 2010-2012 Risk Management Ltd
Risk source 3
Risk source 2
Risk source 1
Initiating event 3
Initiating event 1
Initiating event 2 Key Event (3)
Consequence 1
Consequence 2
Consequence 3
Consequence 4
Consequence 5
Event 1
Event 2
Escalationfactor 1
Direct causesUnderlying or root causes
Obj
ectiv
es
Escalationfactor 2
C17
C1
C2
C3
C4
C5
C6
C7
C8
C9
C10
C11
C12C13
C14
C15
C16
C = control
This bow-tie has three risk sources and is for negative impacts on objectives (ALOP in an import risk analysis). Each risk source gives rise to an initiating event but for event 1 to occur, initiating events 1 and 2 must combine. On the right-hand side, consequence 3 gives rise to two knock-on consequences. The bow-tie also shows:
controls C1-3 are intended to modify the risk sources
controls C4-6 and C8 and C9 are intended to change the nature and magnitude of likelihood
event 3 is the key event (the top event of a fault tree)
controls C10-16 are intended to change the nature and magnitude of likelihood or change the consequences
controls C15 and C16 might also share the consequences with another party (eg, through insurance)
escalation factor 1 (eg, public outrage about event 2) is modified by control C7 (eg, spare capacity) and escalation factor 2 (eg, public outrage about consequence 1) is modified by control C17 (eg, a crisis communications plan).
In summary, bow-tie analysis enables the display of many causes of an event, the many possible consequences of that event and, for an import risk analysis, where the sanitary or phytosanitary controls act.
In the time available and with the information at our disposal, we have not been able to develop a bow-tie for an import risk analysis. However, Figure 10 suggests how one might be used in conjunction with a revised consequence/likelihood matrix and quantified fault tree and event tree analyses.
Please note: Figure 10 shows one risk source (the origin of pest X) and no controls or escalation factors have been included in the bow-tie. Using bow-tie analysis for the New Zealand apple import risk analysis might have required lines of analysis for each pest organism.
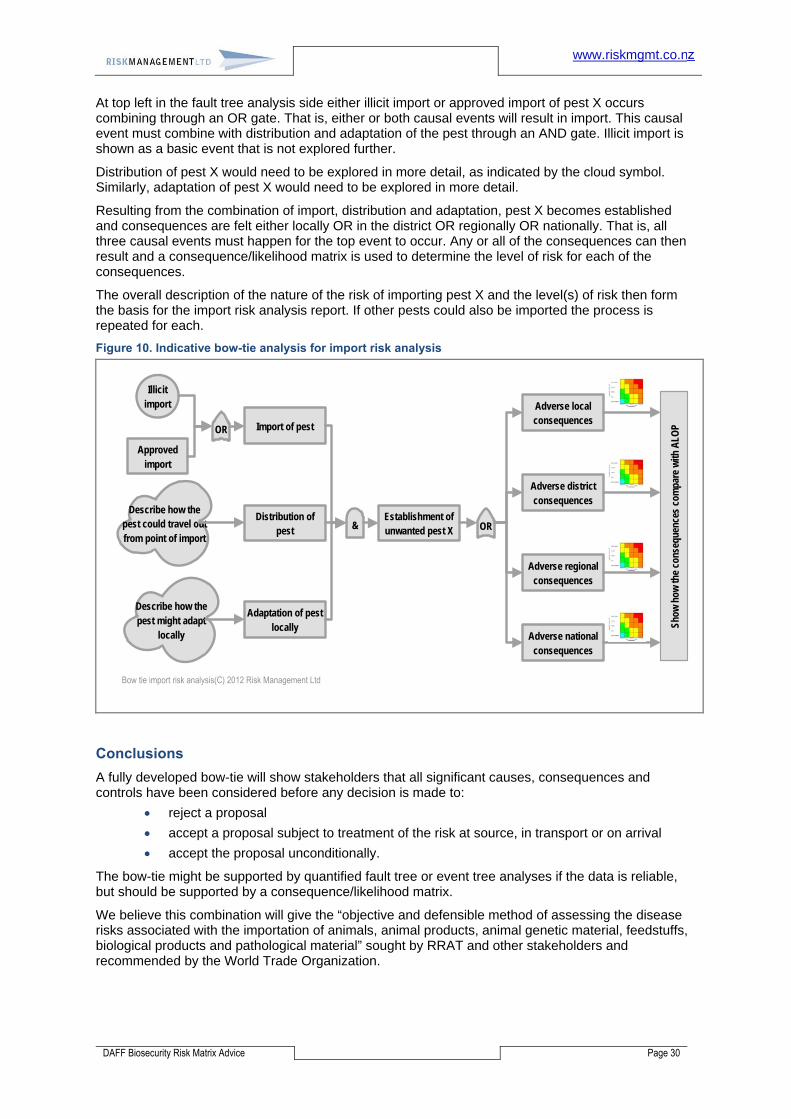
www.riskmgmt.co.nz
DAFF Biosecurity Risk Matrix Advice Page 30
At top left in the fault tree analysis side either illicit import or approved import of pest X occurs combining through an OR gate. That is, either or both causal events will result in import. This causal event must combine with distribution and adaptation of the pest through an AND gate. Illicit import is shown as a basic event that is not explored further.
Distribution of pest X would need to be explored in more detail, as indicated by the cloud symbol. Similarly, adaptation of pest X would need to be explored in more detail.
Resulting from the combination of import, distribution and adaptation, pest X becomes established and consequences are felt either locally OR in the district OR regionally OR nationally. That is, all three causal events must happen for the top event to occur. Any or all of the consequences can then result and a consequence/likelihood matrix is used to determine the level of risk for each of the consequences.
The overall description of the nature of the risk of importing pest X and the level(s) of risk then form the basis for the import risk analysis report. If other pests could also be imported the process is repeated for each.
Figure 10. Indicative bow-tie analysis for import risk analysis
Bow tie import risk analysis(C) 2012 Risk Management Ltd
Establishment of unwanted pest X
Import of pest
Distribution of pest
Adaptation of pest locally
Adverse local consequences
Adverse district consequences
Adverse regional consequences
Adverse national consequences
& OR
Illicit import
Show
how
the
cons
eque
nces
com
pare
with
ALO
P
Approved import
OR
Describe how the pest could travel out from point of import
Describe how the pest might adapt
locally
Conclusions
A fully developed bow-tie will show stakeholders that all significant causes, consequences and controls have been considered before any decision is made to:
reject a proposal
accept a proposal subject to treatment of the risk at source, in transport or on arrival
accept the proposal unconditionally.
The bow-tie might be supported by quantified fault tree or event tree analyses if the data is reliable, but should be supported by a consequence/likelihood matrix.
We believe this combination will give the “objective and defensible method of assessing the disease risks associated with the importation of animals, animal products, animal genetic material, feedstuffs, biological products and pathological material” sought by RRAT and other stakeholders and recommended by the World Trade Organization.

www.riskmgmt.co.nz
DAFF Biosecurity Risk Matrix Advice Page 31
References Ale, B. (2007). Risk is of all time (Working Paper). Delft, Holland,
Antoniadis, D., & Thorpe, A. (2003). Evaluation of risks using 3D Risk Matrix.
Bahill, A. T., & Smith, E. D. (2009). An Industry Standard Risk Analysis Technique. Engineering Management Journal, 21(4), 16-29.
Biosecurity Australia. (2006a). Final Import Risk Analysis Report for Apples from New Zealand (Report). Canberra, Australia: Author. Retrieved from www.biosecurityaustralia.gov.au, 1 December 2012
Biosecurity Australia. (2006b). Policy for the Importation of Fresh Mangoes (Mangifera indica L.) from Taiwan (Report). Canberra, Australia: Author. Retrieved from www.biosecurityaustralia.gov.au, 13 December 2012
Budescu, D. V., Broomell, S., & Por, H.-H. (2009). Improving Communication of Uncertainty in the Reports of the Intergovernmental Panel on Climate Change. Psychological Science (Wiley-Blackwell), 20(3), 299-308.
Cockshott, J. E. (2005). Probability bow-ties: a transparent risk management tool. Process Safety and Environmental Protection, 83(4 B), 307-316.
Cox, L. (2008). What’s Wrong with Risk Matrices? Risk Analysis, 28(2), 497-512.
DAFF. (2011). Import Risk Analysis Handbook (Report). Canberra, Australia: Department of Agriculture Fisheries and Forestry Biosecurity. Retrieved from www.biosecurityaustralia.gov.au, 1 December 2012
DAFF. (2012a). Provisional final import risk analysis report for fresh ginger from Fiji (Report). Canberra, Australia: Department of Agriculture Fisheries and Forestry. Retrieved from http://www.daff.gov.au/ba/ira/current-plant/ginger_from_fiji/ba2012-18-provfinal-fiji-ginger, 14 December 2012
DAFF. (2012b). Provisional final import risk analysis report for the importation of fresh decrowned pineapple (Ananas comosus (L.) Merr.) fruit from Malaysia (Report). Canberra, Australia: Department of Agriculture Fisheries and Forestry Biosecurity. Retrieved from www.biosecurityaustralia.gov.au, 1 December 2012
Donoghue, A. M. (2001). The design of hazard risk assessment matrices for ranking occupational health risks and their application in mining and minerals processing. Occupational Medicine-Oxford, 51(2), 118-123.
Evans, D. (2012). Risk intelligence: how to live with uncertainty. London, UK: Free Press.
FAO. (1999). Principles and guidelines for the conduct of microbiological risk assessment (Guidance Note CAC/GL 30). Geneva, Switzerland: Food and Agriculture Organisation,
FAO. (2006). Food Safety Risk Analysis: A Guide for National Food Safety Authorities (Food and Nutrition Paper 87). Rome: WHO/FAO,
FAO. (2007). Working Principles for Risk Analysis for Application by National Governments (Guidance Note CAC/GL 62-2007). Rome: World Health Organisation,
Franklin, J., Sisson, S. A., Burgman, M. A., & Martin, J. K. (2008). Evaluating extreme risks in invasion ecology: learning from banking compliance. Diversity & Distributions, 14(4), 581-591.
Franks, A., Whitehead, R., Crossthwaite, P., & Smail, L. (2002). Application of QRA in operational safety issues (Research Report RR 025 Health and Safety Executive). Sudbury, UK: HSE Books. Retrieved from www.hse.gov.uk/research/, 12 January 2003
HSE. (1989). Quantified risk assessment: its input to decision making. London, UK: HMSO.
Hussey, D. E. (1978). Portfolio Analysis: Practical Experience with the Directional Policy Matrix. Long Range Planning, 11(4), 2-8.
IEC 1025:1990. Fault tree analysis Geneva, Switzerland: International Electrotechnical Commission.
IPPC. (2012). Glossary of phytosanitary terms (Glossary ISPM 5). Geneva: Secretariat of the International Plant Protection Convention. Retrieved from https://www.ippc.int/, 13 December 2012
ISO 9000:2005. Quality management systems - fundamentals and vocabulary Geneva: International Standards Organisation.
ISO 31010:2009a. Risk Management - Risk Assessment Techniques Geneva, Switzerland: International Standards Organisation.
ISO Guide 73:2009b. Risk management - vocabulary - guidelines for use in standards Geneva, Switzerland: International Standards Organisation.

www.riskmgmt.co.nz
DAFF Biosecurity Risk Matrix Advice Page 32
ISO 31000:2009c. Risk management – Principles and guidelines Geneva: International Standards Organisation.
ISO/IEC 62502 Ed. 1/CDV:2009. Analysis techniques for dependability - Event Tree Analysis Geneva, Switzerland: International Standards Organisation.
Julian, T. (2011). What’s right with risk matrices? An great tool for managers. Retrieved 26 July 2012, from http://31000risk.wordpress.com/article/what-s-right-with-risk-matrices-3dksezemjiq54-4/.
Kahneman, D., & Tversky, A. (1979). Prospect theory: an analysis of decision under risk. Econometrica, 47(2), 263-291.
Kent, S. (2007). Words of Estimative Probability, Central Intelligence Agency. Retrieved 28 December, 2012, from https://www.cia.gov/library/center-for-the-study-of-intelligence/csi-publications/books-and-monographs/sherman-kent-and-the-board-of-national-estimates-collected-essays/6words.html.
Middleton, M., & Franks, A. (2001). Using Risk Matrices. Chemical Engineer (723), pp. 34-37.
Moore, D. (1997). The Use of a Ranking Matrix and Recommendation Prioritization System for Process Hazard Analysis Studies. Process Safety Progress, 16(2), 83-85.
Raz, T., & Hillson, D. (2005). A Comparative Review of Risk Management Standards. Risk Management: an international journal, 7(4), 53-66.
SA HB 89:2012. Risk management – Guidelines on risk assessment techniques Sydney: Standards Australia.
SA/SNZ HB 436:2004. Risk Management Guidelines: a companion to AS/SNZ 4360:2004 Wellington, NZ: Standards New Zealand.
SA/SNZ HB 89 (draft):2011. Risk management – Guidelines on risk assessment techniques Wellington, NZ: Standards New Zealand.
SA/SNZ ISO AS/NZS ISO 31000:2009. Risk management – Principles and guidelines Wellington, NZ: Standards New Zealand.
Slovic, P. (2000). Perception of Risk. In P. Slovic (Ed.), The perception of risk (pp. 220-231). London, UK: Earthscan Publications Ltd.
Smith, E. D., Siefert, W. T., & Drain, D. (2009). Risk matrix input data biases. Systems Engineering, 12(4), 344-360.
Soanes, C., & Stevenson, A. (Eds.). (2009) The Concise Oxford Dictionary (11th ed.). Oxford, UK: Oxford University Press Ltd.
UNECE. (2012). Risk Management in Regulatory Frameworks: Towards a Better Management of Risks (Report). Geneva: United Nations Economic Commission for Europe. Retrieved from http://www.unece.org/fileadmin/DAM/trade/wp6/documents/2012/WP6_2012_05E.pdf, 27 November 2012
Witt, R. C. (1973). Pricing and Underwriting Risk in Automobile Insurance: A Probabilistic View. Journal of Risk & Insurance, 40(4), 509-531.
WOAH. (2012). Terrestrial Animal Health Code (International agreement). Paris: World Organisation for Animal Health. Retrieved from http://www.oie.int/eng/normes/Mcode/en_sommaire.htm, 13 December 2012
WTO. (1997). Agreement on the application of sanitary and phytosanitary measures (International agreement). Geneva: World Trade Organisation. Retrieved from https://www.wto.org/english/docs_e/legal_e/15-sps.pdf, 5 August 2012
www.riskmgmt.co.nz
DAFF Biosecurity Risk Matrix Advice Page 33
Appendix 1. Comparative vocabulary The following risk-related terms are used in the treaties, agreements and standards documents cited in this report. Each term is listed alphabetically and the source document referenced.
Appropriate level of sanitary or phytosanitary protection is “the level of protection deemed appropriate by the Member establishing a sanitary or phytosanitary measure to protect human, animal or plant life or health within its territory.
Note: Many Members otherwise refer to this concept as the ‘acceptable level of risk’".
(WTO, 1997)
Communication and consultation are “continual and iterative processes that an organisation conducts to provide, share or obtain information and to engage in dialogue with stakeholders regarding the management of risk
Note 1. The information can relate to the existence, nature, form, likelihood, significance, evaluation, acceptability and treatment of the management of risk.
Note 2. Consultation is a two-way process of informed communication between an organization and its stakeholders on an issue prior to making a decision or determining a direction on that issue. Consultation is:
a process which impacts on a decision through influence rather than power; and
an input to decision making, not joint decision making.
(SA/SNZ ISO, 2009).
Consequence is the “outcome of an event affecting objectives.
Note 1 An event can lead to a range of consequences.
Note 2 A consequence can be certain or uncertain and can have positive or negative effects on objectives.
Note 3 Consequences can be expressed qualitatively or quantitatively.
Note 4 Initial consequences can escalate through knock-on effects”.
(SA/SNZ ISO, 2009)
Control is a “measure that is modifying risk.
Note 1 Controls include any process, policy, device, practice, or other actions which modify risk.
Note 2 Controls may not always exert the intended or assumed modifying effect” .
(SA/SNZ ISO, 2009)
Control means “prevention, elimination, or reduction of hazards and/or minimization of risks”.
(FAO, 1999)
Effectiveness is the extent to which planned activities are realised and planned results achieved (ISO 9000
(ISO, 2005).
Event is an “occurrence or change of a particular set of circumstances.
Note 1 An event can be one or more occurrences, and can have several causes.
Note 2 An event can consist of something not happening.
Note 3 An event can sometimes be referred to as an “incident” or “accident”.
Note 4 An event without consequences can also be referred to as a ‘near miss’, ‘incident’, ‘near hit’ or ‘close call’”
www.riskmgmt.co.nz
DAFF Biosecurity Risk Matrix Advice Page 34
(SA/SNZ ISO, 2009)
External context is the “external environment in which the organisation seeks to achieve its objectives.
Note: External context can include:
the cultural, social, political, legal, regulatory, financial, technological, economic, natural and competitive environment, whether international, national, regional or local;
key drivers and trends having impact on the objectives of the organization; and relationships with, and perceptions and values of external stakeholders”
(SA/SNZ ISO, 2009).
Frequency is a “measure of the likelihood of an event expressed as a number of events or outcomes per defined unit of time”.
(ISO, 2009b)
Hazard is a “source of potential harm.
Note: Hazard can be a risk source”.
(ISO, 2009b).
Hazard is “a biological, chemical or physical agent in, or condition of, food with the potential to cause an adverse health effect”
(FAO, 1999)
Hazard characterization is “the qualitative and/or quantitative evaluation of the nature of the adverse health effects associated with the hazard. For the purpose of Microbiological Risk Assessment the concerns relate to microorganisms and/or their toxins”.
(FAO, 1999)
Hazard identification is “the identification of biological, chemical, and physical agents capable of causing adverse health effects and which may be present in a particular food or group of foods.
(FAO, 1999)
Internal context is the “internal environment in which the organization seeks to achieve its objectives
Note: Internal context can include:
governance, organizational structure, roles and accountabilities;
policies, objectives, and the strategies that are in place to achieve them;
the capabilities, understood in terms of resources and knowledge (e.g. capital, time, people, processes, systems and technologies);
information systems, information flows and decision-making processes (both formal and informal);
relationships with, and perceptions and values of, internal stakeholders;
the organization's culture;
standards, guidelines and models adopted by the organization; and form and extent of contractual relationships”.
(SA/SNZ ISO, 2009)
Level of risk is the “magnitude of a risk expressed in terms of the combination of consequences and their likelihood”.
(SA/SNZ ISO, 2009)
Likelihood is the “chance of something happening.
Note 1: In risk management terminology, the word “likelihood” is used to refer to the chance of something happening, whether defined, measured or determined objectively or subjectively, qualitatively or quantitatively, and described using general terms or mathematically (such as a probability or a frequency over a given time period).

www.riskmgmt.co.nz
DAFF Biosecurity Risk Matrix Advice Page 35
Note 2: The English term “likelihood” does not have a direct equivalent in some languages; instead, the equivalent of the term “probability” is often used. However, in English, “probability” is often narrowly interpreted as a mathematical term. Therefore, in risk management terminology, “likelihood” is used with the intent that it should have the same broad interpretation as the term “probability” has in many languages other than English”.
(SA/SNZ ISO, 2009)
Probability is a “measure of the chance of occurrence expressed as a number between 0 and 1, where 0 is impossibility and 1 is absolute certainty”.
(ISO, 2009b)
Quantitative risk assessment is a “risk assessment that provides numerical expressions of risk and indication of the attendant uncertainties (stated in the 1995 Expert Consultation definition on Risk Analysis)”.
(FAO, 1999)
Qualitative risk assessment is a “risk assessment based on data which, while forming an inadequate basis for numerical risk estimations, nonetheless, when conditioned by prior expert knowledge and identification of attendant uncertainties permits risk ranking or separation into descriptive categories of risk.
(FAO, 1999)
Risk is “the effect of uncertainty on objectives.
Note 1: An effect is a deviation from the expected – positive or negative.
Note 2: Objectives can have different aspects such as financial, health and safety, and environmental goals and can apply at different levels such as strategic, organisation-wide, project, product, and process.
Note 3: Risk is often characterised by reference to potential events, consequences, or a combination of these and how they can affect the achievement of objectives.
Note 4: Risk is often expressed in terms of a combination of the consequences of an event or a change in circumstances, and the associated likelihood of occurrence.
Note 5: Uncertainty is the state, even partial, of deficiency of information related to, understanding or knowledge of, an event, its consequence, or likelihood”.
(SA/SNZ ISO, 2009)
Risk is “a function of the probability of an adverse health effect and the severity of that effect, consequential to a hazard(s) in food”.
(FAO, 1999)
Risk analysis is “a process consisting of three components: risk assessment, risk management and risk communication”.
(FAO, 1999)
Risk assessment is “a scientifically based process consisting of the following steps: (i) hazard identification, (ii) hazard characterization, (iii) exposure assessment, and (iv) risk characterization.
(FAO, 1999)
Risk characterization is “the process of determining the qualitative and/or quantitative estimation, including attendant uncertainties, of the probability of occurrence and severity of known or potential adverse health effects in a given population based on hazard identification, hazard characterization and exposure assessment”.
(FAO, 1999)
Risk communication is “the interactive exchange of information and opinions concerning risk and risk management among risk assessors, risk managers, consumers and other interested parties.
(FAO, 1999)
www.riskmgmt.co.nz
DAFF Biosecurity Risk Matrix Advice Page 36
Risk estimate is the “output of risk characterization”.
(FAO, 1999)
Risk appetite is the “amount and type of risk an organisation is prepared to pursue, retain or take”.
(ISO, 2009b)
Risk assessment is “the overall process of risk identification, risk analysis and risk evaluation”.
(SA/SNZ ISO, 2009)
Risk assessment: “the evaluation of the likelihood of entry, establishment or spread of a pest or disease within the territory of an importing Member according to the sanitary or phytosanitary measures which might be applied, and of the associated potential biological and economic consequences; or the evaluation of the potential for adverse effects on human or animal health arising from the presence of additives, contaminants, toxins or disease-causing organisms in food, beverages or feedstuffs”.
(WTO, 1997, p. 78)
Risk criteria are the “terms of reference by which the significance of risk is assessed.
Note 1 Risk criteria are based on organizational objectives, and external and internal context.
Note 2 Risk criteria can be derived from standards, laws, policies and other requirements”.
(SA/SNZ ISO, 2009)
Risk description is a “structured statement of risk usually containing four elements: sources, events, causes and consequences”.
(ISO, 2009b)
Risk evaluation is the “process of comparing the results of risk analysis against risk criteria to determine whether the level of risk is acceptable or tolerable.
Note: Risk evaluation assists in the decision about risk treatment”.
(SA/SNZ ISO, 2009)
Risk identification is the “process of finding, recognising and describing risks”.
(SA/SNZ ISO, 2009)
Risk management is “the coordinated activities to direct and control an organisation with regard to risk”.
(SA/SNZ ISO, 2009)
Risk management is “the process of weighing policy alternatives in the light of the results of risk assessment and, if required, selecting and implementing appropriate control1 options, including regulatory measures”.
(FAO, 1999)
Risk management context is described in paragraph 5.3.4 of AS/NZS ISO 31000.
(SA/SNZ ISO, 2009)
Risk management framework is a “set of components that provide the foundations and organisational arrangements for designing, implementing, monitoring, reviewing and continually improving risk management throughout the organisation”.
(SA/SNZ ISO, 2009)
Risk management plan is a “scheme within the risk management framework specifying the approach, the management components and resources to be applied to the management of risk.
Note 1 Management components typically include procedures, practices, assignment of responsibilities, sequence and timing of activities.
Note 2 The risk management plan can be applied to a particular product, process and project, and part or whole of the organisation.
www.riskmgmt.co.nz
DAFF Biosecurity Risk Matrix Advice Page 37
(SA/SNZ ISO, 2009)
Risk management process is the “systematic application of management policies, procedures and practices to the tasks of communicating, establishing the context, identifying, analysing, evaluating, treating, monitoring and reviewing risk”.
(SA/SNZ ISO, 2009)
Risk matrix is a “tool for ranking and displaying risks by defining ranges for consequences and likelihood”.
(ISO, 2009b)
Risk perception is “the stakeholder’s view on a risk.
Note: Risk perception reflects the stakeholder’s needs, issues, knowledge, belief and values”.
(ISO, 2009b)
Risk profile is a “description of any set of risks.
Note: The set of risks can contain those that relate to the whole organisation, part of the organisation, or as otherwise defined”.
(SA/SNZ ISO, 2009)
Risk profile is the “description of the food safety problem and its context”.
(FAO, 1999)
Risk source is an “element which alone or in combination has the intrinsic potential to give rise to risk.
Note: A risk source can be tangible or intangible”.
(SA/SNZ ISO, 2009)
Transparent means the “characteristics of a process where the rationale, the logic of development, constraints, assumptions, value judgements, decisions, limitations and uncertainties of the expressed determination are fully and systematically stated, documented, and accessible for review”.
(FAO, 1999)
Uncertainty analysis is “a method used to estimate the uncertainty associated with model inputs, assumptions and structure/form”.
(FAO, 1999)
See also note 5 to the definition of “risk” in AS/NZS ISO 31000.
Vulnerability is the “intrinsic properties of something resulting in susceptibility to a risk source that can lead to a consequence”.
(ISO, 2009b)

www.riskmgmt.co.nz
DAFF Biosecurity Risk Matrix Advice Page 38
Appendix 2. Application of the DAFF risk estimation matrix The following is reproduced from the Biosecurity Australia Provisional final import risk analysis report for the importation of fresh decrowned pineapple (Ananas comosus (L.) Merr.) fruit from Malaysia (DAFF, 2012b)
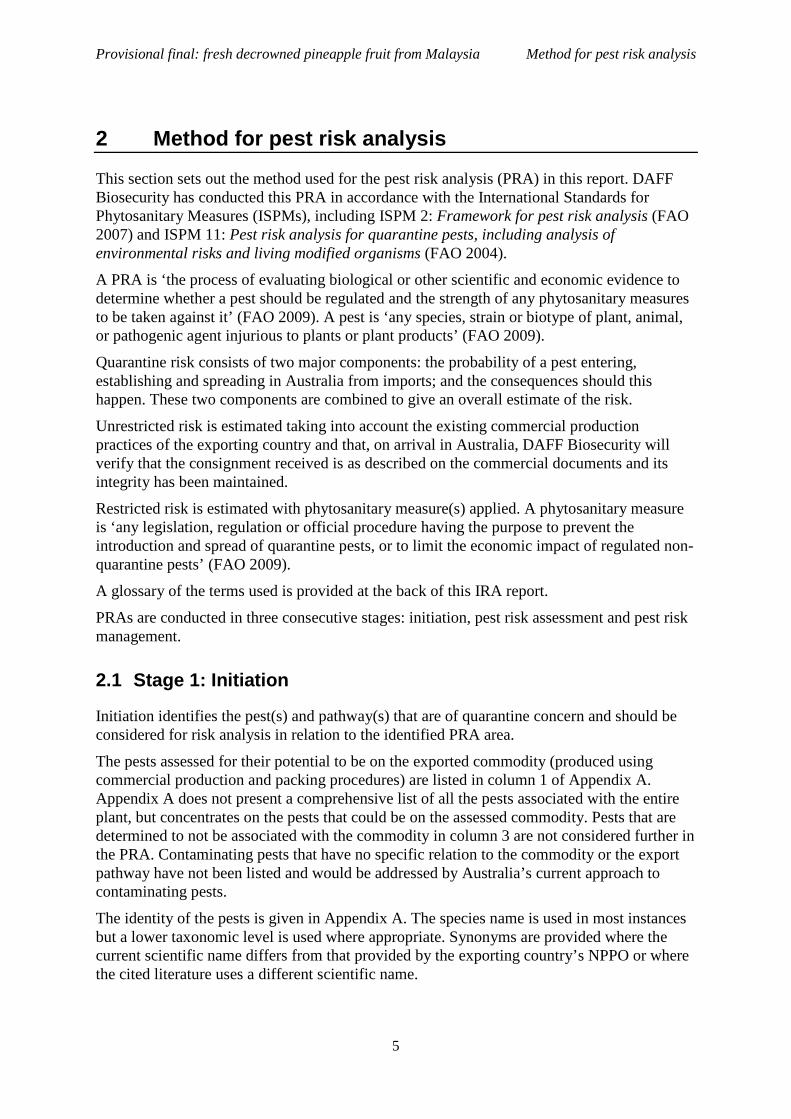
Provisional final: fresh decrowned pineapple fruit from Malaysia Method for pest risk analysis
5
2 Method for pest risk analysis
This section sets out the method used for the pest risk analysis (PRA) in this report. DAFF Biosecurity has conducted this PRA in accordance with the International Standards for Phytosanitary Measures (ISPMs), including ISPM 2: Framework for pest risk analysis (FAO 2007) and ISPM 11: Pest risk analysis for quarantine pests, including analysis of environmental risks and living modified organisms (FAO 2004).
A PRA is ‘the process of evaluating biological or other scientific and economic evidence to determine whether a pest should be regulated and the strength of any phytosanitary measures to be taken against it’ (FAO 2009). A pest is ‘any species, strain or biotype of plant, animal, or pathogenic agent injurious to plants or plant products’ (FAO 2009).
Quarantine risk consists of two major components: the probability of a pest entering, establishing and spreading in Australia from imports; and the consequences should this happen. These two components are combined to give an overall estimate of the risk.
Unrestricted risk is estimated taking into account the existing commercial production practices of the exporting country and that, on arrival in Australia, DAFF Biosecurity will verify that the consignment received is as described on the commercial documents and its integrity has been maintained.
Restricted risk is estimated with phytosanitary measure(s) applied. A phytosanitary measure is ‘any legislation, regulation or official procedure having the purpose to prevent the introduction and spread of quarantine pests, or to limit the economic impact of regulated non-quarantine pests’ (FAO 2009).
A glossary of the terms used is provided at the back of this IRA report.
PRAs are conducted in three consecutive stages: initiation, pest risk assessment and pest risk management.
2.1 Stage 1: Initiation
Initiation identifies the pest(s) and pathway(s) that are of quarantine concern and should be considered for risk analysis in relation to the identified PRA area.
The pests assessed for their potential to be on the exported commodity (produced using commercial production and packing procedures) are listed in column 1 of Appendix A. Appendix A does not present a comprehensive list of all the pests associated with the entire plant, but concentrates on the pests that could be on the assessed commodity. Pests that are determined to not be associated with the commodity in column 3 are not considered further in the PRA. Contaminating pests that have no specific relation to the commodity or the export pathway have not been listed and would be addressed by Australia’s current approach to contaminating pests.
The identity of the pests is given in Appendix A. The species name is used in most instances but a lower taxonomic level is used where appropriate. Synonyms are provided where the current scientific name differs from that provided by the exporting country’s NPPO or where the cited literature uses a different scientific name.

Provisional final: fresh decrowned pineapple fruit from Malaysia Method for pest risk analysis
6
For this PRA, the ‘PRA area’ is defined as Australia for pests that are absent, or of limited distribution and under official control. For areas with regional freedom from a pest, the ‘PRA area’ may be defined on the basis of a state or territory of Australia or may be defined as a region of Australia consisting of parts of a state or territory or several states or territories.
For pests that had been considered by DAFF Biosecurity in other risk assessments and for which import policies already exist, a judgement based on the specific circumstances was made on the likelihood of entry of pests on the commodity and whether existing policy is adequate to manage the risks associated with its import. Where appropriate, the previous risk assessment was taken into consideration when developing the new policy.
2.2 Stage 2: Pest risk assessment
A pest risk assessment (for quarantine pests) is: ‘the evaluation of the probability of the introduction and spread of a pest and of the likelihood of associated potential economic consequences’ (FAO 2009).
In this PRA, pest risk assessment was divided into the following interrelated processes:
2.2.1 Pest categorisation Pest categorisation identifies which of the pests with the potential to be on the commodity are quarantine pests for Australia and require pest risk assessment. A ‘quarantine pest’ is a pest of potential economic importance to the area endangered thereby and not yet present there, or present but not widely distributed and being officially controlled, as defined in ISPM 5: Glossary of phytosanitary terms (FAO 2009).
The pests identified in Stage 1 were categorised using the following primary elements to identify the quarantine pests for the commodity being assessed:
presence or absence in the PRA area regulatory status potential for establishment and spread in the PRA area potential for economic consequences (including environmental consequences) in the PRA
area.
The results of pest categorisation are set out in columns 4–7 in Appendix A. The steps in the categorisation process are considered sequentially, with the assessment terminating with a ‘Yes’ in column 4 or the first ‘No’ in columns 5 or 6. The quarantine pests identified during pest categorisation were carried forward for pest risk assessment and are listed in Table 4.1.
2.2.2 Assessment of the probability of entry, establishment and spread Details of how to assess the ‘probability of entry’, ‘probability of establishment’ and ‘probability of spread’ of a pest are given in ISPM 11 (FAO 2004). A summary of this process is given below, followed by a description of the qualitative methodology used in this IRA.
Probability of entry The probability of entry describes the probability that a quarantine pest will enter Australia as a result of trade in a given commodity, be distributed in a viable state in the PRA area and

Provisional final: fresh decrowned pineapple fruit from Malaysia Method for pest risk analysis
7
subsequently be transferred to a host. It is based on pathway scenarios depicting necessary steps in the sourcing of the commodity for export, its processing, transport and storage, its use in Australia and the generation and disposal of waste. In particular, the ability of the pest to survive is considered for each of these various stages.
The probability of entry estimates for the quarantine pests for a commodity are based on the use of the existing commercial production, packaging and shipping practices of the exporting country. Details of the existing commercial production practices for the commodity are set out in Section 3. These practices are taken into consideration by DAFF Biosecurity when estimating the probability of entry.
For the purpose of considering the probability of entry, DAFF Biosecurity divides this step of this stage of the PRA into two components:
Probability of importation: the probability that a pest will arrive in Australia when a given commodity is imported.
Probability of distribution: the probability that the pest will be distributed, as a result of the processing, sale or disposal of the commodity, in the PRA area and subsequently transfer to a susceptible part of a host.
Factors considered in the probability of importation include:
distribution and incidence of the pest in the source area occurrence of the pest in a life-stage that would be associated with the commodity mode of trade (e.g. bulk, packed) volume and frequency of movement of the commodity along each pathway seasonal timing of imports pest management, cultural and commercial procedures applied at the place of origin speed of transport and conditions of storage compared with the duration of the lifecycle of
the pest vulnerability of the life-stages of the pest during transport or storage incidence of the pest likely to be associated with a consignment commercial procedures (e.g. refrigeration) applied to consignments during transport and
storage in the country of origin, and during transport to Australia.
Factors considered in the probability of distribution include:
commercial procedures (e.g. refrigeration) applied to consignments during distribution in Australia
dispersal mechanisms of the pest, including vectors, to allow movement from the pathway to a host
whether the imported commodity is to be sent to a few or many destination points in the PRA area
proximity of entry, transit and destination points to hosts time of year at which import takes place intended use of the commodity (e.g. for planting, processing or consumption) risks from by-products and waste

Provisional final: fresh decrowned pineapple fruit from Malaysia Method for pest risk analysis
8
Probability of establishment Establishment is defined as the ‘perpetuation for the foreseeable future, of a pest within an area after entry’ (FAO 2004). In order to estimate the probability of establishment of a pest, reliable biological information (lifecycle, host range, epidemiology, survival, etc.) is obtained from the areas where the pest currently occurs. The situation in the PRA area can then be compared with that in the areas where it currently occurs and expert judgement used to assess the probability of establishment.
Factors considered in the probability of establishment in the PRA area include:
availability of hosts, alternative hosts and vectors suitability of the environment reproductive strategy and potential for adaptation minimum population needed for establishment cultural practices and control measures
Probability of spread Spread is defined as ‘the expansion of the geographical distribution of a pest within an area’ (FAO 2004). The probability of spread considers the factors relevant to the movement of the pest, after establishment on a host plant or plants, to other susceptible host plants of the same or different species in other areas. In order to estimate the probability of spread of the pest, reliable biological information is obtained from areas where the pest currently occurs. The situation in the PRA area is then carefully compared with that in the areas where the pest currently occurs and expert judgement used to assess the probability of spread.
Factors considered in the probability of spread include:
suitability of the natural and/or managed environment for natural spread of the pest presence of natural barriers potential for movement with commodities, conveyances or by vectors intended use of the commodity potential vectors of the pest in the PRA area potential natural enemies of the pest in the PRA area
Assigning qualitative likelihoods for the probability of entry, establishment and spread
In its qualitative PRAs, DAFF Biosecurity uses the term ‘likelihood’ for the descriptors it uses for its estimates of probability of entry, establishment and spread. Qualitative likelihoods are assigned to each step of entry, establishment and spread. Six descriptors are used: high; moderate; low; very low; extremely low; and negligible (Table 2.1). Descriptive definitions for these descriptors are given in Table 2.1. The standardised likelihood descriptors provide guidance to the risk analyst and promote consistency between different risk analyses.
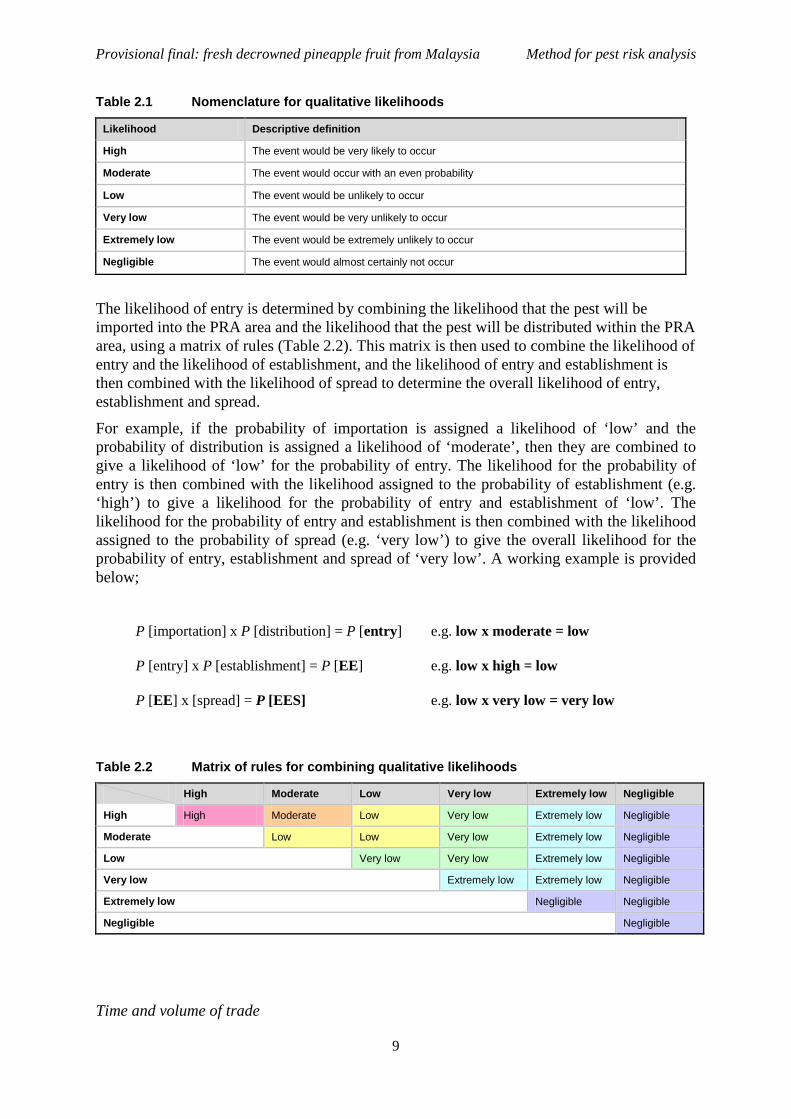
Provisional final: fresh decrowned pineapple fruit from Malaysia Method for pest risk analysis
9
Table 2.1 Nomenclature for qualitative likelihoods
Likelihood Descriptive definition
High The event would be very likely to occur
Moderate The event would occur with an even probability
Low The event would be unlikely to occur
Very low The event would be very unlikely to occur
Extremely low The event would be extremely unlikely to occur
Negligible The event would almost certainly not occur
The likelihood of entry is determined by combining the likelihood that the pest will be imported into the PRA area and the likelihood that the pest will be distributed within the PRA area, using a matrix of rules (Table 2.2). This matrix is then used to combine the likelihood of entry and the likelihood of establishment, and the likelihood of entry and establishment is then combined with the likelihood of spread to determine the overall likelihood of entry, establishment and spread.
For example, if the probability of importation is assigned a likelihood of ‘low’ and the probability of distribution is assigned a likelihood of ‘moderate’, then they are combined to give a likelihood of ‘low’ for the probability of entry. The likelihood for the probability of entry is then combined with the likelihood assigned to the probability of establishment (e.g. ‘high’) to give a likelihood for the probability of entry and establishment of ‘low’. The likelihood for the probability of entry and establishment is then combined with the likelihood assigned to the probability of spread (e.g. ‘very low’) to give the overall likelihood for the probability of entry, establishment and spread of ‘very low’. A working example is provided below;
P [importation] x P [distribution] = P [entry] e.g. low x moderate = low
P [entry] x P [establishment] = P [EE] e.g. low x high = low
P [EE] x [spread] = P [EES] e.g. low x very low = very low
Table 2.2 Matrix of rules for combining qualitative likelihoods
High Moderate Low Very low Extremely low Negligible
High High Moderate Low Very low Extremely low Negligible
Moderate Low Low Very low Extremely low Negligible
Low Very low Very low Extremely low Negligible
Very low Extremely low Extremely low Negligible
Extremely low Negligible Negligible
Negligible Negligible
Time and volume of trade
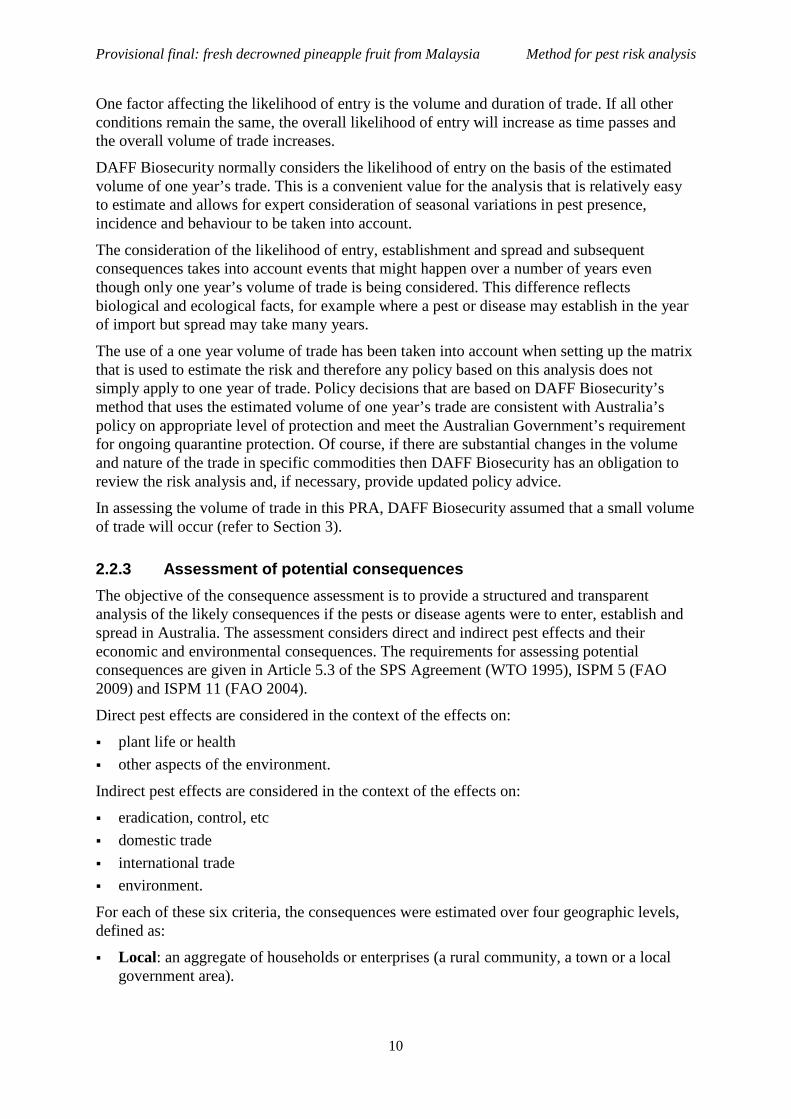
Provisional final: fresh decrowned pineapple fruit from Malaysia Method for pest risk analysis
10
One factor affecting the likelihood of entry is the volume and duration of trade. If all other conditions remain the same, the overall likelihood of entry will increase as time passes and the overall volume of trade increases.
DAFF Biosecurity normally considers the likelihood of entry on the basis of the estimated volume of one year’s trade. This is a convenient value for the analysis that is relatively easy to estimate and allows for expert consideration of seasonal variations in pest presence, incidence and behaviour to be taken into account.
The consideration of the likelihood of entry, establishment and spread and subsequent consequences takes into account events that might happen over a number of years even though only one year’s volume of trade is being considered. This difference reflects biological and ecological facts, for example where a pest or disease may establish in the year of import but spread may take many years.
The use of a one year volume of trade has been taken into account when setting up the matrix that is used to estimate the risk and therefore any policy based on this analysis does not simply apply to one year of trade. Policy decisions that are based on DAFF Biosecurity’s method that uses the estimated volume of one year’s trade are consistent with Australia’s policy on appropriate level of protection and meet the Australian Government’s requirement for ongoing quarantine protection. Of course, if there are substantial changes in the volume and nature of the trade in specific commodities then DAFF Biosecurity has an obligation to review the risk analysis and, if necessary, provide updated policy advice.
In assessing the volume of trade in this PRA, DAFF Biosecurity assumed that a small volume of trade will occur (refer to Section 3).
2.2.3 Assessment of potential consequences The objective of the consequence assessment is to provide a structured and transparent analysis of the likely consequences if the pests or disease agents were to enter, establish and spread in Australia. The assessment considers direct and indirect pest effects and their economic and environmental consequences. The requirements for assessing potential consequences are given in Article 5.3 of the SPS Agreement (WTO 1995), ISPM 5 (FAO 2009) and ISPM 11 (FAO 2004).
Direct pest effects are considered in the context of the effects on:
plant life or health other aspects of the environment.
Indirect pest effects are considered in the context of the effects on:
eradication, control, etc domestic trade international trade environment.
For each of these six criteria, the consequences were estimated over four geographic levels, defined as:
Local: an aggregate of households or enterprises (a rural community, a town or a local government area).

Provisional final: fresh decrowned pineapple fruit from Malaysia Method for pest risk analysis
11
District: a geographically or geopolitically associated collection of aggregates (generally a recognised section of a state or territory, such as ‘Far North Queensland’).
Regional: a geographically or geopolitically associated collection of districts in a geographic area (generally a state or territory, although there may be exceptions with larger states such as Western Australia).
National: Australia wide (Australian mainland states and territories and Tasmania).
For each criterion, the magnitude of the potential consequence at each of these levels was described using four categories, defined as:
Indiscernible: pest impact unlikely to be noticeable. Minor significance: expected to lead to a minor increase in mortality/morbidity of hosts
or a minor decrease in production but not expected to threaten the economic viability of production. Expected to decrease the value of non-commercial criteria but not threaten the criterion’s intrinsic value. Effects would generally be reversible.
Significant: expected to threaten the economic viability of production through a moderate increase in mortality/morbidity of hosts, or a moderate decrease in production. Expected to significantly diminish or threaten the intrinsic value of non-commercial criteria. Effects may not be reversible.
Major significance: expected to threaten the economic viability through a large increase in mortality/morbidity of hosts, or a large decrease in production. Expected to severely or irreversibly damage the intrinsic ‘value’ of non-commercial criteria.
The estimates of the magnitude of the potential consequences over the four geographic levels were translated into a qualitative impact score (A-G)2 using table 2.33. For example, a consequence with a magnitude of ‘significant’ at the ‘district’ level will have a consequence impact score of D.
Table 2.3 Decision rules for determining the consequence impact score based on the magnitude of consequences at four geographic scales
Geographic scale
Local District Region Nation
Mag
nitu
de Indiscernible A A A A
Minor significance B C D E
Significant C D E F
Major significance D E F G
The overall consequence for each pest is achieved by combining the qualitative impact scores (A–G) for each direct and indirect consequence using a series of decision rules (Table 2.4). These rules are mutually exclusive, and are assessed in numerical order until one applies.
2 In earlier qualitative IRAs, the scale for the impact scores went from A to F and did not explicitly allow for the rating ‘indiscernible’ at all four levels. This combination might be applicable for some criteria. In this report, the impact scale of A-F has changed to become B-G and a new lowest category A (‘indiscernible’ at all four levels) was added. The rules for combining impacts in Table 2.4 were adjusted accordingly. 3 The decision rules for determining the consequence impact score are presented in a simpler form in Table 2.3 from earlier IRAs, to make the table easier to use. The outcome of the decision rules is the same as the previous table and makes no difference to the final impact score.

Provisional final: fresh decrowned pineapple fruit from Malaysia Method for pest risk analysis
12
Table 2.4 Decision rules for determining the overall consequence rating for each pest
2.2.4 Estimation of the unrestricted risk Once the above assessments are completed, the unrestricted risk can be determined for each pest or groups of pests. This is determined by using a risk estimation matrix (Table 2.5) to combine the estimates of the probability of entry, establishment and spread and the overall consequences of pest establishment and spread. Therefore, risk is the product of likelihood and consequence.
When interpreting the risk estimation matrix, note the descriptors for each axis are similar (e.g. low, moderate, high) but the vertical axis refers to likelihood and the horizontal axis refers to consequences. Accordingly, a ‘low’ likelihood combined with ‘high’ consequences, is not the same as a ‘high’ likelihood combined with ‘low’ consequences – the matrix is not symmetrical. For example, the former combination would give an unrestricted risk rating of ‘moderate’, whereas, the latter would be rated as a ‘low’ unrestricted risk.
Rule The impact scores for consequences of direct and indirect criteria Overall consequence rating
1 Any criterion has an impact of ‘G’; or
more than one criterion has an impact of ‘F’; or
a single criterion has an impact of ‘F’ and each remaining criterion an ‘E’.
Extreme
2 A single criterion has an impact of ‘F’; or
all criteria have an impact of ‘E’.
High
3 One or more criteria have an impact of ‘E’; or
all criteria have an impact of ‘D’.
Moderate
4 One or more criteria have an impact of ‘D’; or
all criteria have an impact of ‘C’.
Low
5 One or more criteria have an impact of ‘C’; or
all criteria have an impact of ‘B’.
Very Low
6 One or more but not all criteria have an impact of ‘B’, and
all remaining criteria have an impact of ‘A’.
Negligible

Provisional final: fresh decrowned pineapple fruit from Malaysia Method for pest risk analysis
13
Table 2.5 Risk estimation matrix Li
kelih
ood
of p
est e
ntry
, est
ablis
hmen
t an
d sp
read
High Negligible
risk Very low risk Low risk Moderate risk High risk Extreme risk
Moderate Negligible risk
Very low risk Low risk Moderate risk High risk Extreme risk
Low Negligible risk
Negligible risk
Very low risk Low risk Moderate risk High risk
Very low Negligible risk
Negligible risk
Negligible risk
Very low risk Low risk Moderate risk
Extremely low
Negligible risk
Negligible risk
Negligible risk
Negligible risk
Very low risk Low risk
Negligible Negligible risk
Negligible risk
Negligible risk
Negligible risk
Negligible risk
Very low risk
Negligible Very low Low Moderate High Extreme
Consequences of pest entry, establishment and spread
2.2.5 Australia’s appropriate level of protection (ALOP) The SPS Agreement defines the concept of an ‘appropriate level of sanitary or phytosanitary protection (ALOP)’ as the level of protection deemed appropriate by the WTO Member establishing a sanitary or phytosanitary measure to protect human, animal or plant life or health within its territory.
Australia expresses its ALOP in qualitative terms. Australia’s ALOP, which reflects community expectations through government policy, is currently expressed as providing a high level of sanitary or phytosanitary protection aimed at reducing risk to a very low level, but not to zero. The band of cells in Table 2.5 marked ‘very low risk’ represents Australia’s ALOP.
2.3 Stage 3: Pest risk management
Pest risk management describes the process of identifying and implementing phytosanitary measures to manage risks to achieve Australia’s ALOP, while ensuring that any negative effects on trade are minimised.
The conclusions from pest risk assessment are used to decide whether risk management is required and if so, the appropriate measures to be used. Where the unrestricted risk estimate exceeds Australia’s ALOP, risk management measures are required to reduce this risk to a very low level. The guiding principle for risk management is to manage risk to achieve Australia’s ALOP. The effectiveness of any proposed phytosanitary measure (or combination of measures) is evaluated, using the same approach as used to evaluate the unrestricted risk, to ensure it reduces the restricted risk for the relevant pest or pests to meet Australia’s ALOP.
ISPM 11 (FAO 2004) provides details on the identification and selection of appropriate risk management options and notes that the choice of measures should be based on their effectiveness in reducing the probability of entry of the pest.
Examples given of measures commonly applied to traded commodities include:
options for consignments – e.g., inspection or testing for freedom from pests, prohibition of parts of the host, a pre-entry or post-entry quarantine system, specified conditions on preparation of the consignment, specified treatment of the consignment, restrictions on end-use, distribution and periods of entry of the commodity
Provisional final: fresh decrowned pineapple fruit from Malaysia Method for pest risk analysis
14
options preventing or reducing infestation in the crop – e.g., treatment of the crop, restriction on the composition of a consignment so it is composed of plants belonging to resistant or less susceptible species, harvesting of plants at a certain age or specified time of the year, production in a certification scheme
options ensuring that the area, place or site of production or crop is free from the pest – e.g., pest-free area, pest-free place of production or pest-free production site
options for other types of pathways – e.g., consider natural spread, measures for human travellers and their baggage, cleaning or disinfestations of contaminated machinery
options within the importing country – e.g., surveillance and eradication programs prohibition of commodities – if no satisfactory measure can be found
Risk management measures are identified for each quarantine pest where the risk exceeds Australia’s ALOP. These are presented in the ‘Pest Risk Management’ section of this report.