Adverse Consequences of OECD Government Interventions in
57
BCG WHITE PAPER Adverse Consequences of OECD Government Interventions in Pharmaceutical Markets on the U.S. Economy and Consumer JULY 1, 2004
Transcript of Adverse Consequences of OECD Government Interventions in
B C G W H I T E PA P E R
Adverse Consequences of OECDGovernment Interventions in
Pharmaceutical Markets on the U.S. Economy and Consumer
J U LY 1 , 2 0 0 4
Adverse Consequences of OECD Government Interventions
in Pharmaceutical Markets on the U.S. Economy and Consumer
A White Paper prepared by
THE BOSTON CONSULTING GROUP, INC
Charles-André Brouwers
Martin B. Silverstein, M.D.
Tory Wolff
July 1, 2004
© The Boston Consulting Group, 2004
Page 2
About the authors
Charles-André Brouwers is a Vice President and Director of the Boston Consulting Group in the New York
office. Martin B. Silverstein, M.D., is a Senior Vice President and Director in the Boston office and head of
BCG’s North Americas Health Care Practice. Tory Wolff is a Manager in the Boston office.
Acknowledgements
The authors would like to thank the BCG project team for their contributions: Nikhil Bhojwani (Boston),
Daphne Psacharopoulos (Boston), Raja Shankar (Washington, D.C.), as well as Martin Reeves, Vice
President and Director in BCG’s New York office.
The authors would also like to acknowledge the contributions of Kevin Hassett (American Enterprise
Institute), PhRMA and its MemberAdvisory Board throughout this project.
For further contact
The authors welcome your questions and comments. For inquiries about this report, please contact:
Charles-André Brouwers, New York e-mail: [email protected]
Martin B. Silverstein, Boston e-mail: [email protected]
Tory Wolff, Boston e-mail: [email protected]
TABLE OF CONTENTS
PREFACE...................................................................................................................................... 1
EXECUTIVE SUMMARY .......................................................................................................... 2
1. OVERVIEW OF GOVERNMENT INTERVENTIONS IN THE OECD....................... 4
TYPES OF GOVERNMENT INTERVENTION ...................................................................................... 4 Price controls .......................................................................................................................... 6 Volume controls ...................................................................................................................... 6 Spend controls......................................................................................................................... 7
OECD COUNTRIES – PROLIFERATING INTERVENTIONS ................................................................ 7 THE CONTRASTING U.S. APPROACH – MARKET-DRIVEN............................................................... 9
2. ADVERSE CONSEQUENCES FOR OECD CONSUMERS AND COUNTRIES ...... 10
TRADE-OFF’S FOR OECD CONSUMERS ...................................................................................... 12 Reduced access to innovation ............................................................................................... 12 Health consequences of reduced access ............................................................................... 16
NEGATIVE CONSEQUENCES FOR OECD ECONOMIES .................................................................. 20 Inefficiency through misallocating resources to older drugs ............................................... 20 Struggling local pharmaceutical industry ............................................................................ 22
3. NEGATIVE CONSEQUENCES FOR THE U.S. CONSUMER AND ECONOMY.... 24
LOWER REVENUES TO FUND GLOBAL PHARMACEUTICAL RESEARCH .......................................... 24 Volume scenarios .................................................................................................................. 25 Price scenarios...................................................................................................................... 26 The likely range..................................................................................................................... 27
LOWER GLOBAL R&D INVESTMENT........................................................................................... 32 FEWER INNOVATIVE THERAPIES FOR U.S. CONSUMERS .............................................................. 35 HIGHER PRICES FOR DRUGS FOR U. S. CONSUMERS .................................................................... 37 FEWER JOBS FOR THE U.S. ECONOMY........................................................................................ 40
APPENDIX 1 – METHODOLOGY.......................................................................................... 44
INTRODUCTION .......................................................................................................................... 44 DATA ......................................................................................................................................... 45
Sources .................................................................................................................................. 45 Volume units.......................................................................................................................... 45 Currency units....................................................................................................................... 46
SAMPLE...................................................................................................................................... 46 Sample countries ................................................................................................................... 46 Sample disease categories .................................................................................................... 47
ANALYSIS .................................................................................................................................. 47
APPENDIX 2 – BIBLIOGRAPHY ........................................................................................... 50
1
Preface
This white paper summarizes the findings of a Boston Consulting Group study commissioned by
Pharmaceutical Research and Manufacturers of America (PhRMA) and conducted between April
and May 2004. The objective of the study was to evaluate the impact of pharmaceutical cost
controls in non-U.S. OECD markets on the U.S. consumer and economy, and inform the U.S.
policy debate in the context of the Medicare Prescription Drug, Improvement and Modernization
Act of 2003.
Our study drew on four main strands of research:
− a detailed review of the approaches taken by a cross-cutting sample of OECD
countries to controlling drug costs: Canada, France, Germany, Japan, Poland, Spain,
the United Kingdom, and the United States
− a survey of the extensive literature including academic studies and reports
− a detailed analysis of primary data from IMS for a selected set of disease areas and
the commercial experience of drug therapies in the outpatient setting (including anti-
diabetics, anti-psychotics, anti-depressants, statins, and selected anti-cancer agents)
− a series of interviews with pharmaceutical executives.
A detailed description of the methodology and sources used in this analysis – including the
rationale for selection of countries and diseases studied – is laid out in the appendices. Where
appropriate, we have also noted sources in footnotes.
Note: In this document, we use the term “OECD” to refer to OECD countries excluding the
United States.
2
Executive Summary
Healthcare represents a significant share of OECD economies, 10 percent of GDP across the
OECD, 14 percent in the United States itself. Demographic forces and therapeutic innovation
are fuelling a steady growth in this sector of the economy and OECD governments are finding it
even more difficult to balance this increasing demand for healthcare products and services with
the ability of the healthcare system to finance it. Pharmaceutical spending represent one of the
smaller shares of total healthcare cost (10.5 percent in the United States), but it is one that
government policy makers can address more easily because of the limited number of
manufacturers and distributors.
In addressing the need to ensure that the dollars spent on pharmaceuticals are optimally applied,
the United States relies mostly on competition and market forces. By contrast, most other OECD
countries have traditionally intervened to limit drug costs through government-mandated controls
on price, volume and overall spend control. This difference in approach raises an important
question for the United States: to what extent do these policies of other countries produce
negative consequences for the US economy and consumer? Our analysis shows that OECD
interventions do appear to keep drug expenditures lower in the OECD countries – but at a cost,
both to themselves and to the United States.
Within OECD countries, patients experience reduced access to innovative medicines – launch
delays of 1-2 years are typical, adoption rates are slower, and even peak penetration rates lag
U.S. rates by 15-20 percent – and therefore are prevented from receiving the full therapeutic
benefits of these drugs. Also, OECD countries spend significantly more on branded versions of
drugs that are off-patent compared with the United States which focuses spend on the cheaper

3
pure generic copies. And there is evidence that the cost control policies in OECD countries
have contributed to the migration of R&D activities out of those countries to the United States.
To measure the full impact of such distortions on the United States, we evaluated a counter-
factual situation in which the OECD government interventions did not exist. Under different
scenarios for correcting the pricing level and consumption level in the OECD, we find that drug
revenues per treated OECD patient would increase by a factor of two to three, and that global
drug revenues would increase by 35-45 percent, equating to an incremental $17-22 billion that
would have been invested in biopharmaceutical R&D in 2003.
From this dynamic, several negative consequences for economies and patients globally emerge:
specifically, fewer medicines, the missed opportunity for lower pricing from incremental
competition and fewer jobs. Supposing that a level of incremental R&D investment had
materialized over the past decade culminating in the incremental $17-22 billion R&D spend in
2003, we estimate there would be 10-13 extra drug launches a year – a 50 percent increase. In
addition, there would potentially be 110-140 additional drugs overall in the global
pharmacopoeia, of which 35-40 would likely be in new drug classes. In the United States, we
estimate, there would be 20-30 thousand extra R&D jobs (with even greater increases overseas),
15-20 thousand extra pharmaceutical jobs, and a further – 55-65 thousand elsewhere in the
economy.
4
1. Overview of Government Interventions in the OECD
Types of government intervention
Across the OECD, 1 governments have for some time intervened in markets to control the sales
and distribution of pharmaceuticals. Whether intended to limit the consumption or the cost of
drugs, or motivated by a desire to protect the local pharmaceutical industry, these interventions
are intensifying. Because these controls tend to focus on the point at which drugs first enter the
national health systems (at launch), they usually end up targeting the newest and most innovative
medicines.
The control strategies deployed by OECD governments are many and varied. They can be
directed either at the supply of medicines (the manufacturers) or at the demand (wholesalers,
retailers, doctors, and patients). And they are deployed in environments where the state funds
part or all of health care, acting effectively like a monopsony. They do have a common goal,
however: to limit the total cost of drugs for the national health system. This goal can be
achieved in three ways: price controls, volume controls, and spend/profit controls. (Exhibit 1 and
Exhibit 2)
1 As noted in the preface, OECD references in the following pages exclude the United States.

5
OECD GOVERNMENTS EMPLOY A RANGE OF INTERVENTIONS TO CONTROL DRUG COST
• Profit controls• Revenue controls
• Physician Rx budgets• Physician healthcare
budgets
• Marketing spend limits• Product volume caps
• Prescribing guidelines• Positive/negative lists• Formularies• Parallel import dispensing
targets/incentives
• Cost plus pricing• Pharmacoeconomic criteria• Molecule/class reference
pricing• Cross-country reference
pricing• Mandatory rebates• Price cuts/price freezes
• Co-payments/co-insurance• Generic substitution
incentives
Su
pp
lyD
eman
d
x =Price controls Volume controls Spending controls
Note: Molecule/class reference pricing: pricing/reimbursement the same for drugs with same active ingredient or therapeutic bene fit; Mandatory rebates: one-off discounts or ‘voluntary’ contributions to budget deficits; Positive lists similar to formularies; formularies can be used to steer prescribing among reimbursable drugs;
EXHIBIT 1EXHIBIT 1
GOVERNMENT INTERVENTIONS CONTINUE TO PROLIFERATE
1970s-1980s 1990s 2000s
U.K. Germany JapanPoland Canada
S U P P L Y
D E M A N D
SpainFrance
Price
Price
Volume
Spending
Volume
Spending
• Co-payments/co-insurance
• Generic substitution incentives
• Prescribing guidelines
• Parallel import dispensing targets/ incentives
• Physician Rx budgets
• Physician healthcare budgets
• Positive/negative lists
• Cost plus pricing
• Cross-country reference pricing
• Mandatory rebates
• Pharmacoeconomic criteria
• Price cuts/price freezes
• Marketing spend limits
• Product volume caps
• Profit controls
• Revenue controls
• Molecule/class reference pricing
• Formularies
Tools currently used by governments to manage drug costs in their state health insurance systems
Date of initial implementation:
Note: Analysis is summary of individual country studies
EXHIBIT 2EXHIBIT 2
6
The Boston Consulting Group published a detailed survey of these interventions in 1999; here
we offer a few summary highlights:2
Price controls
Price controls – in various forms – are used across almost all countries in the OECD. One of the
most common approaches to controlling price is to set the reimbursement price of a drug to some
selected benchmark. For example, Germany’s molecule/class reference-pricing scheme is based
on a drug-class benchmark, and caps the government-approved reimbursement price to the
lowest third of prices of other drugs within the same drug class. And Canada’s Patented
Medicine Prices Review board uses cross-country reference pricing to set the government-
approved price for a drug to its median price in a basket of other countries. Other countries resort
to direct price-setting methods: in France, for example, where the reimbursed price of a drug is
directly set by the Economic Committee on Medicines and subject to repricing every four years.3
Volume controls
Lower prices achieved through price controls can encourage increased utilization, and thereby
could mitigate the broader objective of reducing cost. Hence the various forms of volume 2 Analysis of cost control tools was developed from the following sources: United Kingdom: U.K. Department of Health (http://www.dh.gov.uk/PolicyAndGuidance/MedicinesPharmacyAndIndustryServices/fs/en); “United Kingdom – Pharmaceutical Pricing and Reimbursement Policies,” LSE study on healthcare, http://pharmacos.eudra.org/F3/g10/p6.htm; ABPI; Germany: LSE study on healthcare in Germany, http://pharmacos.eudra.org/F3/g10/p6.htm; “International Review of Pharmacoeconomic, pricing and reimbursement news in the second half of 2003,” Decision Resourses, March 12, 2004; France: “France – Pharmaceutical Pricing and Reimbursement,” LSE study http://pharmacos.eudra.org/F3/g10/p6.htm; “International Review of Pharmacoeconomic, pricing and reimbursement news in the second half of 2003,” Decision Resources, March 12, 2004; Spain: “World Pharmaceutical Market Spain,” Epsicom Business Intelligence February 14, 2003; “Pharmaceutical regulation in Europe,” Parlos Kanavos, Harvard Medical School; “Spain – Pricing and Reimbursement of Pharmaceuticals,” LSE study, http://pharmacos.eudra.org/F3/g10/p6.htm; Japan: j“Japan – Pricing and Reimbursement of Pharrmaceuticals,” LSE study, http://pharmacos.eudra.org/F3/g10/p6.htm; “Pricing of Prescription Drugs,”U.S. International Trade Commission, 2000; “World Pharmaceutical Markets – Japan,” Epsicom Business Intelligence, March 2003 ; “Pharmaceutical Administration and Regulations in Japan,” JPMA 2003; Canada: Annual Report 2002 of the Patented Medicine Prices Review Board, Canada; “Canada – Pharmaceutical Pricing and Reimbursement,” LSE study, http://pharmacos.eudra.org/F3/g10/p6.htm 3 Cross-national prices for drugs are checked by the Economic Committee on Medicines when setting prices. Also since 2003, France has reference pricing for certain products with generic substitution rates below 45% and extended it to products with generic substitution rates of less than 60% in 2004.
7
controls that have also been widely deployed across the OECD. These can be directed at
reducing supply, as with France’s product volume caps included in individual “framework
agreements” between each pharmaceutical company and the Economic Committee of Medicines.
Much more frequently, however, interventions aim at controlling demand through prescribing
guidelines and various kinds of formularies or positive/negative lists which take the prescribing
decision out of the hands of the physician treating a patient.
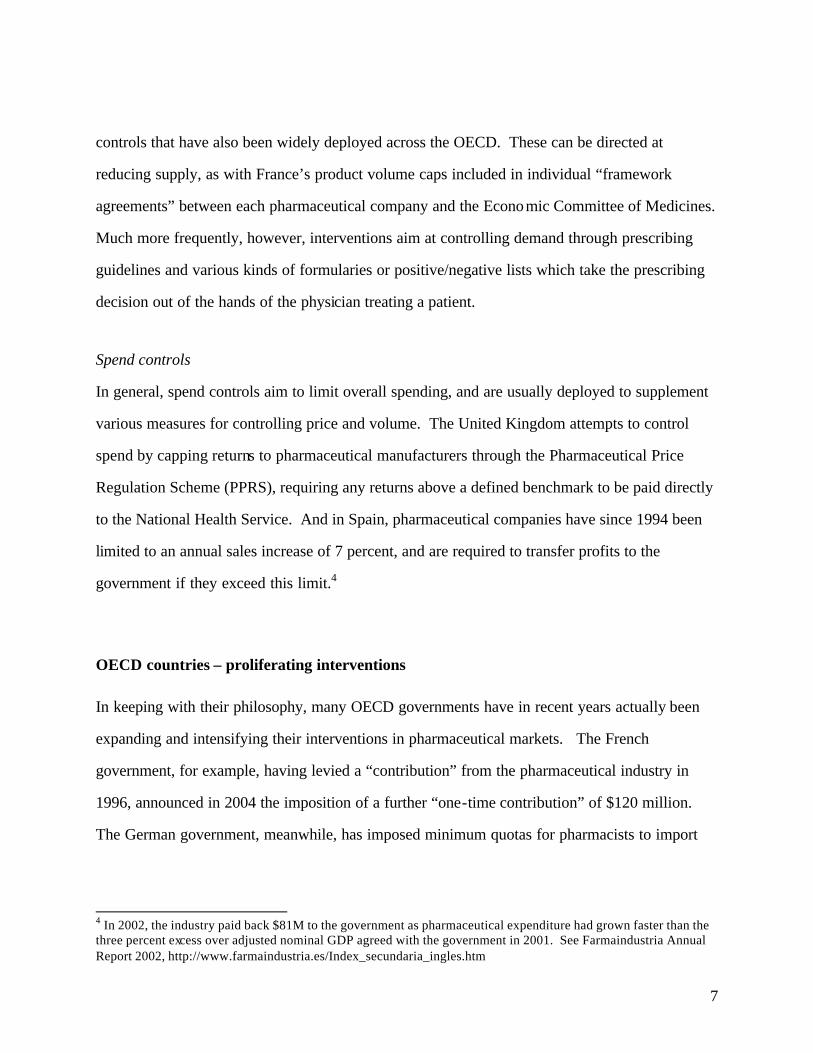
Spend controls
In general, spend controls aim to limit overall spending, and are usually deployed to supplement
various measures for controlling price and volume. The United Kingdom attempts to control
spend by capping returns to pharmaceutical manufacturers through the Pharmaceutical Price
Regulation Scheme (PPRS), requiring any returns above a defined benchmark to be paid directly
to the National Health Service. And in Spain, pharmaceutical companies have since 1994 been
limited to an annual sales increase of 7 percent, and are required to transfer profits to the
government if they exceed this limit.4
OECD countries – proliferating interventions
In keeping with their philosophy, many OECD governments have in recent years actually been
expanding and intensifying their interventions in pharmaceutical markets. The French
government, for example, having levied a “contribution” from the pharmaceutical industry in
1996, announced in 2004 the imposition of a further “one-time contribution” of $120 million.
The German government, meanwhile, has imposed minimum quotas for pharmacists to import
4 In 2002, the industry paid back $81M to the government as pharmaceutical expenditure had grown faster than the three percent excess over adjusted nominal GDP agreed with the government in 2001. See Farmaindustria Annual Report 2002, http://www.farmaindustria.es/Index_secundaria_ingles.htm

8
drugs from countries with lower drug prices,5 despite evidence that the bulk of the potential
savings on these imported drugs is captured by distributors and that little is passed on to the
payor or consumer.6 Further, Germany recently introduced mandatory rebates on on-patent
drugs, and has since raised these mandatory rebates from 6 percent in 2003 to 16 percent in
2004. The Japanese government similarly has set about mandating price cuts every two years
over the past decade, with each cut averaging 6-7 percent. (Exhibit 3).
JAPAN HAS MANDATED PRICE REDUCTIONS THROUGH 1990s
Source: “Pharmaceutical Administration and Regulations in Japan”, JPMA 2003; “World Pharmaceutical Markets – Japan”, Epsicom Business Intelligence, March 2003; OECD Health Data 2003
1992 1993 1994 1995 1996 1997 1998 1999 2000 2001 2002
100
8.1%
R-Zone15%
6.6%
R-Zone13%
6.8%
R-Zone11%
4.4%
R-Zone10%
9.7%
R-Zone5%
7%
R-Zone2%
6.3%
Leads to $3.1B loss in revenue
Average reimbursement price reductions (1992 price = 100)
Year
R-Zone (“reasonable zone ”) is the government mandated difference between the wholesale price and the official reimbursement price
EXHIBIT 3EXHIBIT 3
It is important to note that these interventions are imposed in the context of state-run health-
insurance systems—essentially, centralized environments where consumers or employers are not
free to make choices among health plans that offer varying levels of access to innovative
pharmaceuticals.
5 These are called parallel imports within the European Union. Typically countries with more aggressive systems of price control end up exporting drugs under this system. 6 See LSE health and Social Care, January 2004, special research paper “The Economic Impact of Pharmaceutical Parallel Trade in European Union Member States.” The study estimates that 86 percent of the price difference is gained by parallel importers, 13 percent is gained by payors, and 1 percent is gained by pharmacists, leaving none for consumers.
9
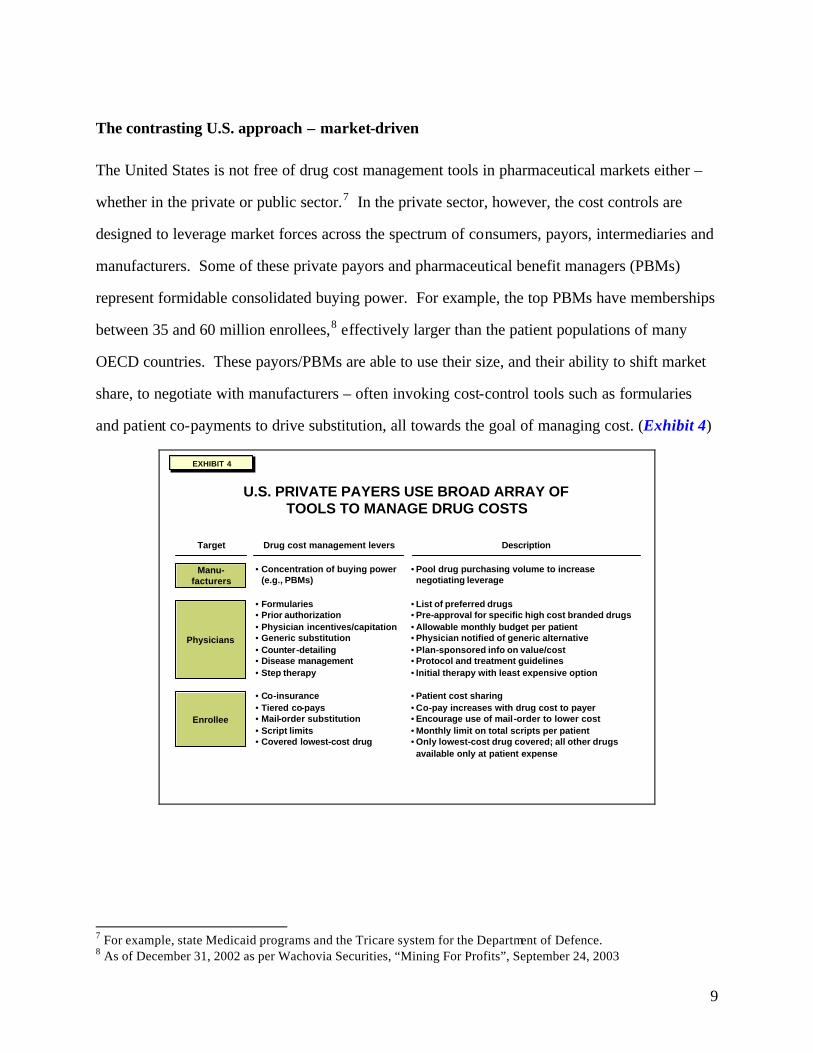
The contrasting U.S. approach – market-driven
The United States is not free of drug cost management tools in pharmaceutical markets either –
whether in the private or public sector.7 In the private sector, however, the cost controls are
designed to leverage market forces across the spectrum of consumers, payors, intermediaries and
manufacturers. Some of these private payors and pharmaceutical benefit managers (PBMs)
represent formidable consolidated buying power. For example, the top PBMs have memberships
between 35 and 60 million enrollees,8 effectively larger than the patient populations of many
OECD countries. These payors/PBMs are able to use their size, and their ability to shift market
share, to negotiate with manufacturers – often invoking cost-control tools such as formularies
and patient co-payments to drive substitution, all towards the goal of managing cost. (Exhibit 4)
U.S. PRIVATE PAYERS USE BROAD ARRAY OF TOOLS TO MANAGE DRUG COSTS
Drug cost management levers
• Concentration of buying power (e.g., PBMs)
• Formularies • Prior authorization• Physician incentives/capitation• Generic substitution • Counter-detailing • Disease management• Step therapy
• Co-insurance • Tiered co-pays• Mail-order substitution • Script limits • Covered lowest-cost drug
Description
• Pool drug purchasing volume to increase negotiating leverage
• List of preferred drugs• Pre-approval for specific high cost branded drugs• Allowable monthly budget per patient• Physician notified of generic alternative• Plan-sponsored info on value/cost• Protocol and treatment guidelines• Initial therapy with least expensive option
• Patient cost sharing• Co-pay increases with drug cost to payer• Encourage use of mail-order to lower cost• Monthly limit on total scripts per patient• Only lowest-cost drug covered; all other drugs available only at patient expense
Manu-facturers
Physicians
Enrollee
Target
EXHIBIT 4EXHIBIT 4
7 For example, state Medicaid programs and the Tricare system for the Department of Defence. 8 As of December 31, 2002 as per Wachovia Securities, “Mining For Profits”, September 24, 2003
10
The PBM industry itself confirms the importance of scale in influencing its relationships with
pharmaceutical companies. As one PBM executive from Medco explained: “What we do at a
macro level is leverage our size and our book of business to drive fundamental scale advantages
and value for our customers… our broad client base makes us very attractive to the brand
manufacturers who we negotiate with directly on rebates.”9
Given the competitive environment, how and when payors/PBMs deploy such controls is driven
by market dynamics. Payors/PBMs have to compete for customers on the basis of the quality
and cost of their coverage. In such a competitive market, they must respond to market
preferences in managing the trade-offs between cost control and patient benefit – for instance, in
determining which drugs to drop from a formulary, or which drugs to place in a non-preferred,
higher co-pay tier. In this way, the U.S. system is able to achieve the very high usage of
generics, for example, compared with the OECD countries we analyzed.
2. Adverse consequences for OECD consumers and countries
What has been the effect of the various market interventions imposed by OECD governments? It
does appear that controls achieve some of the political and social objectives for which they were
designed. Specifically, they seem to have been effective at holding down the aggregate growth
of drug spending where applied, especially since the mid-1990s.10 While U.S. prescription drug
costs grew at an annual rate of 10 percent between 1992 and 2001, other countries saw slower
rates of growth ranging from 0 percent (Japan) to 4-5 percent (France and the United Kingdom)
to 7.5 percent (Canada). (It is worth noting that according to recent research by the Office of the
Actuary at the Centers for Medicare and Medicaid Services (CMS), the overall drug cost growth
in the United States in recent years has been driven mainly by higher volumes and by shifting the 9 Timothy C. Wentworth, Group President, National Accounts, Medco, 14th Annual Wachovia Securities Nantucket Equity Conference, June 23, 2004. 10 OECD Health Data 2003.
11
mix toward newer, more innovative medicines rather than by increased pricing across a fixed
basket of medicines.11 This reflects the impact of the many new drug categories introduced over
the past decade as well as the introduction of more innovative products in existing categories).
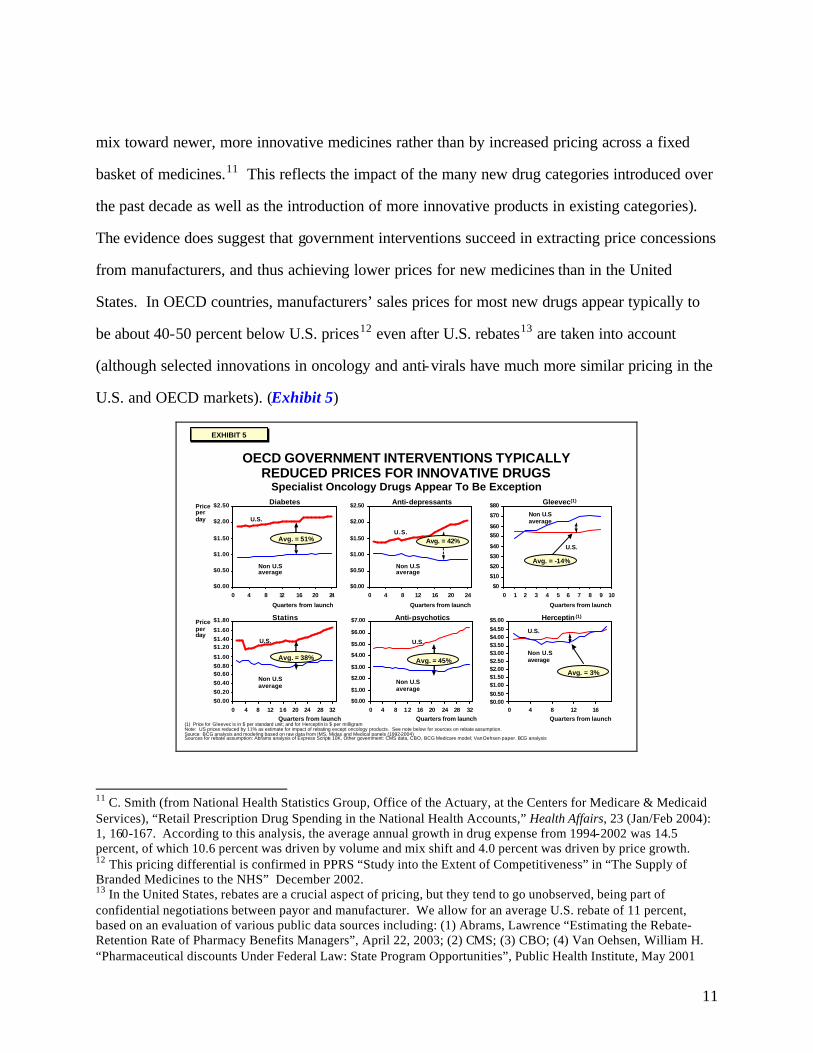
The evidence does suggest that government interventions succeed in extracting price concessions
from manufacturers, and thus achieving lower prices for new medicines than in the United
States. In OECD countries, manufacturers’ sales prices for most new drugs appear typically to
be about 40-50 percent below U.S. prices12 even after U.S. rebates13 are taken into account
(although selected innovations in oncology and anti-virals have much more similar pricing in the
U.S. and OECD markets). (Exhibit 5)
$0.00
$0.50
$1.00
$1.50
$2.00
$2.50
0 4 8 12 16 20 24
OECD GOVERNMENT INTERVENTIONS TYPICALLY REDUCED PRICES FOR INNOVATIVE DRUGS
Specialist Oncology Drugs Appear To Be Exception
(1) Price for Gleevec is in $ per standard unit; and for Herceptin is $ per milligram Note: US prices reduced by 11% as estimate for impact of rebating except oncology products. See note below for sources on rebate assumption.Source: BCG analysis and modeling based on raw data from IMS, Midas and Medical panels (1992-2004)Sources for rebate assumption: Abrams analysis of Express Scripts 10K, Other government: CMS data, CBO, BCG Medicare model; Van Oehsen paper. BCG analysis
$0.00
$0.50
$1.00
$1.50
$2.00
$2.50
0 4 8 12 16 20 24
U.S.
Non U.S average
Diabetes
Quarters from launch
Price per day
Avg. = 51%U.S.
Non U.S average
Anti-depressants
Quarters from launch
Avg. = 42%
$0
$10
$20
$30
$40
$50
$60
$70
$80
0 1 2 3 4 5 6 7 8 9 10
U.S.
Non U.S average
Gleevec(1)
Quarters from launch
$0.00
$0.20
$0.40
$0.60$0.80
$1.00
$1.20$1.40
$1.60
$1.80
0 4 8 12 16 20 24 28 32
U.S.
Non U.S average
Statins
Quarters from launch
Price per day
Avg. = 38%
$0.00
$1.00
$2.00
$3.00
$4.00
$5.00
$6.00
$7.00
0 4 8 12 16 20 24 28 32
U.S.
Non U.S average
Anti-psychotics
Quarters from launch
Avg. = 45%
$0.00$0.50
$1.00$1.50$2.00$2.50$3.00$3.50$4.00$4.50
$5.00
0 4 8 12 16
U.S.
Non U.S average
Herceptin (1)
Quarters from launch
Avg. = -14%
Avg. = 3%
EXHIBIT 5EXHIBIT 5
11 C. Smith (from National Health Statistics Group, Office of the Actuary, at the Centers for Medicare & Medicaid Services), “Retail Prescription Drug Spending in the National Health Accounts,” Health Affairs, 23 (Jan/Feb 2004): 1, 160-167. According to this analysis, the average annual growth in drug expense from 1994-2002 was 14.5 percent, of which 10.6 percent was driven by volume and mix shift and 4.0 percent was driven by price growth. 12 This pricing differential is confirmed in PPRS “Study into the Extent of Competitiveness” in “The Supply of Branded Medicines to the NHS” December 2002. 13 In the United States, rebates are a crucial aspect of pricing, but they tend to go unobserved, being part of confidential negotiations between payor and manufacturer. We allow for an average U.S. rebate of 11 percent, based on an evaluation of various public data sources including: (1) Abrams, Lawrence “Estimating the Rebate-Retention Rate of Pharmacy Benefits Managers”, April 22, 2003; (2) CMS; (3) CBO; (4) Van Oehsen, William H. “Pharmaceutical discounts Under Federal Law: State Program Opportunities”, Public Health Institute, May 2001

12
While our purpose is not to assess the overall societal impact of health care policy for OECD
countries, it is worth noting that there is an emerging literature which suggests that market
interventions do lead to adverse effects for the OECD. A recent study by Bain, for example,
concludes that market interventions in Germany actually leads to a net economic loss for the
society. 14 Let us review some of the particular adverse consequences of interventions that
emerged from our analysis of selected disease areas and are relevant for policy making in the
United States.
Trade-off’s for OECD consumers
Whatever the short-term cost benefits, OECD patients are in other ways disadvantaged by the
market interventions imposed by their governments: they have less chance of getting the latest
drugs, and their chances of recovery or effective relief are to that extent compromised.
Reduced access to innovation
Patients in OECD countries typically gain access to innovative medicines – if at all – only after a
substantial delay and at a level of availability usually well below that enjoyed by U.S. patients.
14 Gilbert, Rosenberg, “Imbalanced innovation: The High Cost of Europe’s Free Ride”, In Vivo, 2004. Gilbert and Rosenberg are with Bain.
13
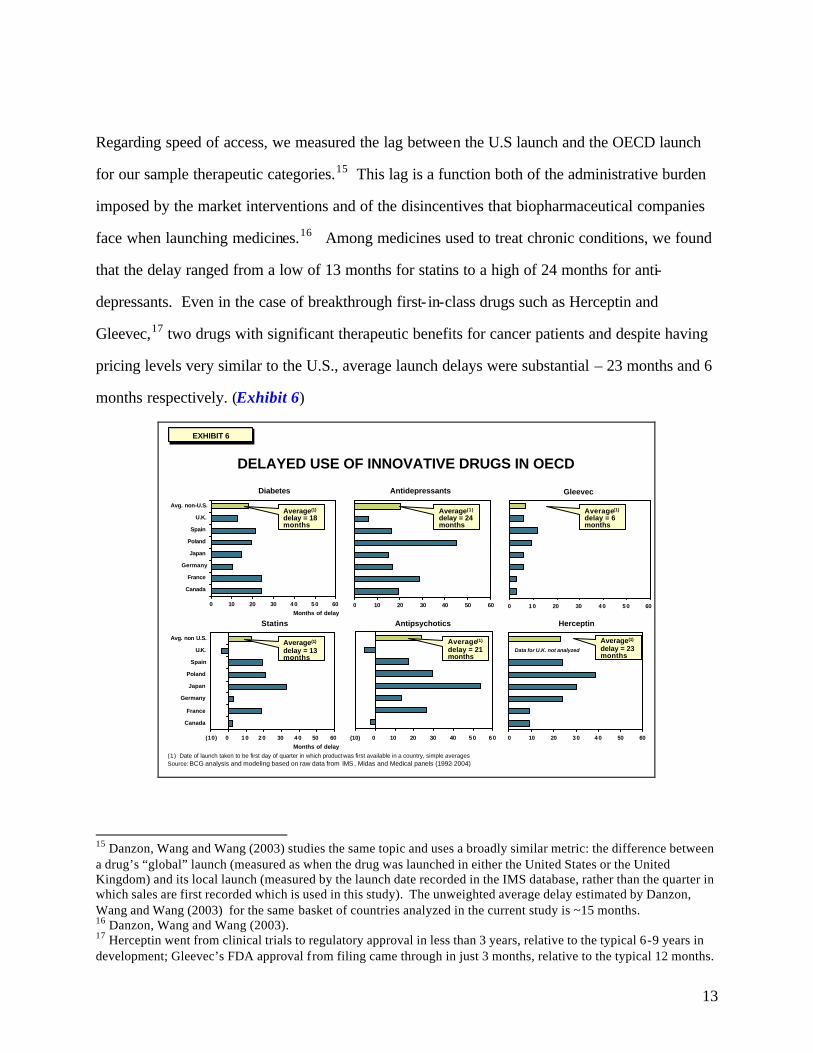
Regarding speed of access, we measured the lag between the U.S launch and the OECD launch
for our sample therapeutic categories.15 This lag is a function both of the administrative burden
imposed by the market interventions and of the disincentives that biopharmaceutical companies
face when launching medicines.16 Among medicines used to treat chronic conditions, we found
that the delay ranged from a low of 13 months for statins to a high of 24 months for anti-
depressants. Even in the case of breakthrough first- in-class drugs such as Herceptin and
Gleevec,17 two drugs with significant therapeutic benefits for cancer patients and despite having
pricing levels very similar to the U.S., average launch delays were substantial – 23 months and 6
months respectively. (Exhibit 6)
DELAYED USE OF INNOVATIVE DRUGS IN OECD
0 10 20 30 40 50 60
Avg. non-U.S.
U.K.
Spain
Poland
Japan
Germany
France
Canada
Diabetes
0 10 20 30 40 50 60
Antidepressants
(10) 0 10 20 30 40 50 60
Avg. non U.S.
U.K.
Spain
Poland
Japan
Germany
France
Canada
Statins
0 10 20 30 40 50 60
Herceptin
0 10 20 30 40 50 60
Gleevec
Average(1)
delay = 6 months
Average(1)
delay = 23 months
(1) Date of launch taken to be first day of quarter in which product was first available in a country, simple averagesSource: BCG analysis and modeling based on raw data from IMS, Midas and Medical panels (1992-2004)
Months of delay
Months of delay(10) 0 10 20 30 40 50 60
Antipsychotics
Average(1)
delay = 24 months
Average(1)
delay = 18 months
Average(1)
delay = 13 months
Average(1)
delay = 21 months
Data for U.K. not analyzed
EXHIBIT 6EXHIBIT 6
15 Danzon, Wang and Wang (2003) studies the same topic and uses a broadly similar metric: the difference between a drug’s “global” launch (measured as when the drug was launched in either the United States or the United Kingdom) and its local launch (measured by the launch date recorded in the IMS database, rather than the quarter in which sales are first recorded which is used in this study). The unweighted average delay estimated by Danzon, Wang and Wang (2003) for the same basket of countries analyzed in the current study is ~15 months. 16 Danzon, Wang and Wang (2003). 17 Herceptin went from clinical trials to regulatory approval in less than 3 years, relative to the typical 6-9 years in development; Gleevec’s FDA approval from filing came through in just 3 months, relative to the typical 12 months.
14
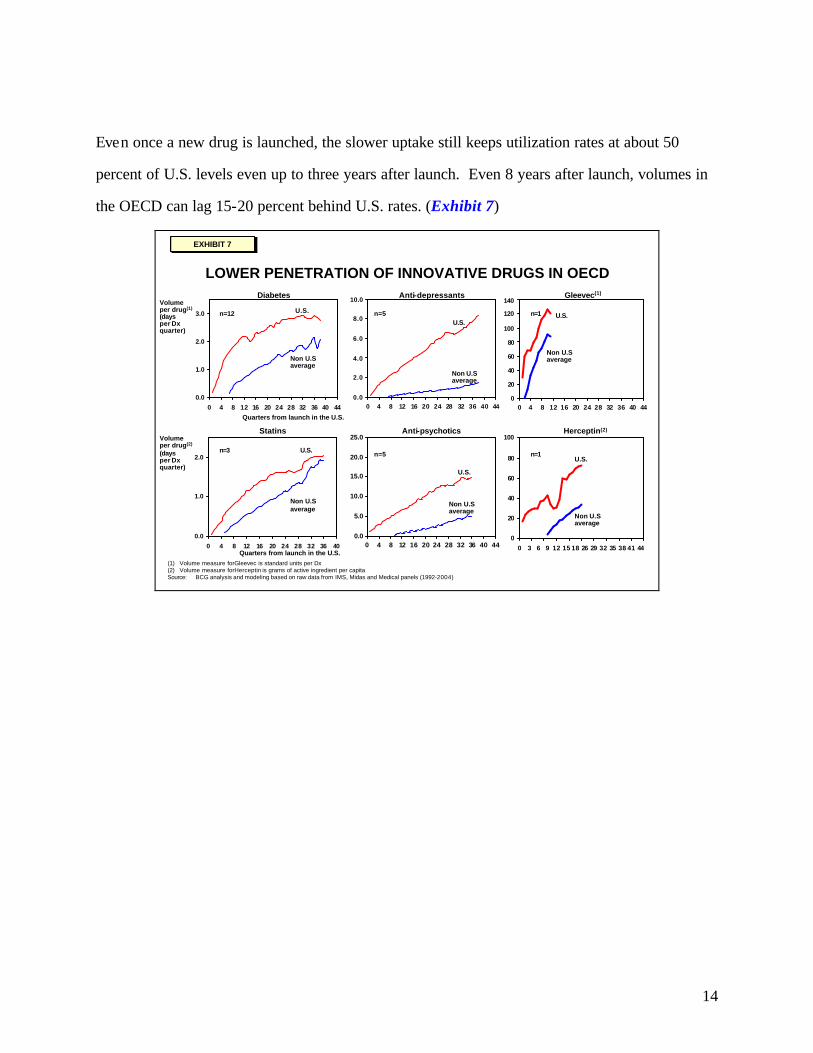
Even once a new drug is launched, the slower uptake still keeps utilization rates at about 50
percent of U.S. levels even up to three years after launch. Even 8 years after launch, volumes in
the OECD can lag 15-20 percent behind U.S. rates. (Exhibit 7)
LOWER PENETRATION OF INNOVATIVE DRUGS IN OECD
(1) Volume measure forGleevec is standard units per Dx(2) Volume measure forHerceptin is grams of active ingredient per capitaSource: BCG analysis and modeling based on raw data from IMS, Midas and Medical panels (1992-2004)
0
20
40
60
80
100
0 3 6 9 12 15 18 26 29 32 35 38 41 44
0.0
1.0
2.0
3.0
0 4 8 12 16 20 24 28 32 36 40 44
U.S.
Non U.S average
Diabetes
Quarters from launch in the U.S.
Volume per drug(1)
(daysper Dxquarter)
0.0
2.0
4.0
6.0
8.0
10.0
0 4 8 12 16 20 24 28 32 36 40 44
U.S.
Non U.S average
Anti-depressants
0.0
1.0
2.0
0 4 8 12 16 20 24 28 32 36 40
U.S.
Non U.S average
Statins
Quarters from launch in the U.S.
0.0
5.0
10.0
15.0
20.0
25.0
0 4 8 12 16 20 24 28 32 36 40 44
U.S.
Non U.S average
Anti-psychoticsVolumeper drug(2)
(daysper Dxquarter)
U.S.
Non U.S average
Herceptin(2)
U.S.
Non U.S average
Gleevec(1)
0
20
40
60
80
100
120
140
0 4 8 12 16 20 24 28 32 36 40 44
n=12
n=3
n=5
n=5 n=1
n=1
EXHIBIT 7EXHIBIT 7
15
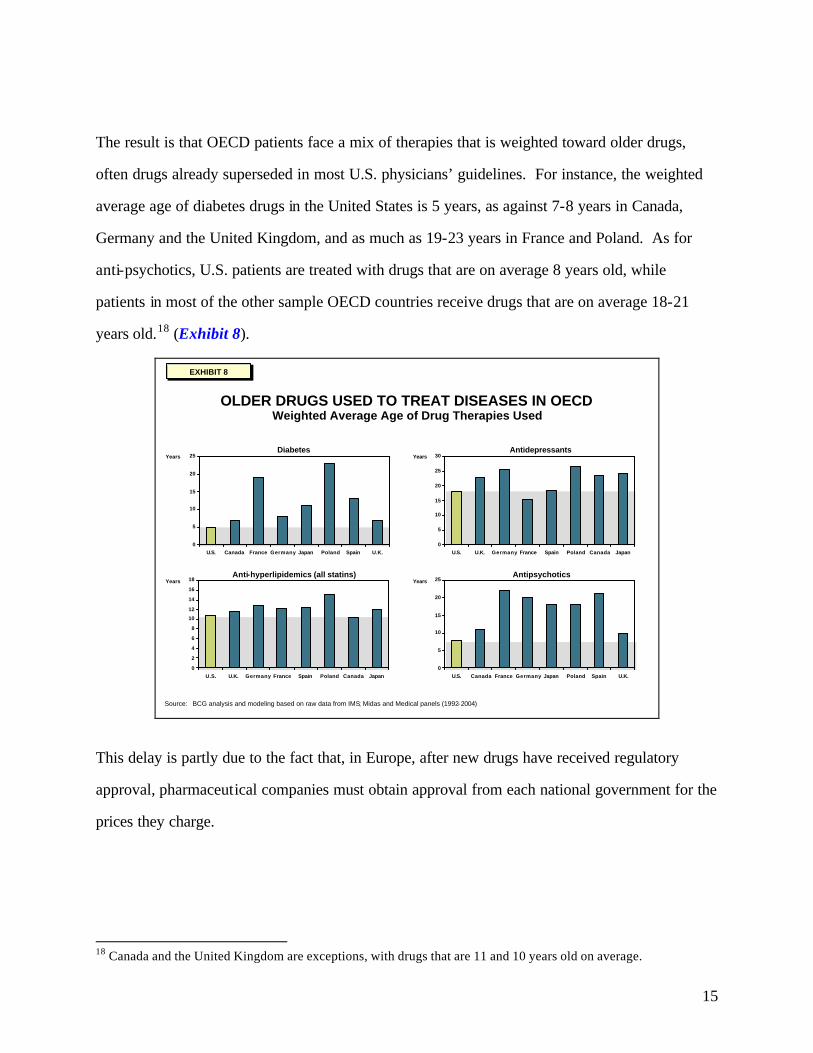
The result is that OECD patients face a mix of therapies that is weighted toward older drugs,
often drugs already superseded in most U.S. physicians’ guidelines. For instance, the weighted
average age of diabetes drugs in the United States is 5 years, as against 7-8 years in Canada,
Germany and the United Kingdom, and as much as 19-23 years in France and Poland. As for
anti-psychotics, U.S. patients are treated with drugs that are on average 8 years old, while
patients in most of the other sample OECD countries receive drugs that are on average 18-21
years old.18 (Exhibit 8).
EXHIBIT 8EXHIBIT 8
0
2
4
6
8
10
12
14
16
18
U.S. U.K. Germany France Spain Poland Canada Japan
Anti-hyperlipidemics (all statins)Years
OLDER DRUGS USED TO TREAT DISEASES IN OECDWeighted Average Age of Drug Therapies Used
0
5
10
15
20
25
U.S. Canada France Germany Japan Poland Spain U.K.
Diabetes
0
5
10
15
20
25
30
U.S. U.K. Germany France Spain Poland Canada Japan
YearsAntidepressants
0
5
10
15
20
25
U.S. Canada France Germany Japan Poland Spain U.K.
AntipsychoticsYears
Source: BCG analysis and modeling based on raw data from IMS; Midas and Medical panels (1992-2004)
Years
This delay is partly due to the fact that, in Europe, after new drugs have received regulatory
approval, pharmaceutical companies must obtain approval from each national government for the
prices they charge.
18 Canada and the United Kingdom are exceptions, with drugs that are 11 and 10 years old on average.
16
Health consequences of reduced access
For many patients, older medicines prove efficacious. Furthermore, there is a rich academic
literature that asserts that curtailed access to innovative drugs has a negative impact on health
outcomes. For example, one study found that the availability of new drugs (measured by NCE
launches) was responsible for 40 percent of the increase in life expectancy over a 14-year time
period from 1986-2000.19 Certainly for the disease areas we studied, reduced access can lead to
compromises in health outcomes for afflicted patient populations.
19 “The Impact of Drug Launches on Longevity: Evidence from Longitudinal, Disease-Level Data from 52 Countries, 1982-2001,” Frank R. Lichtenberg, NBER working paper # 9754, June 2003
17
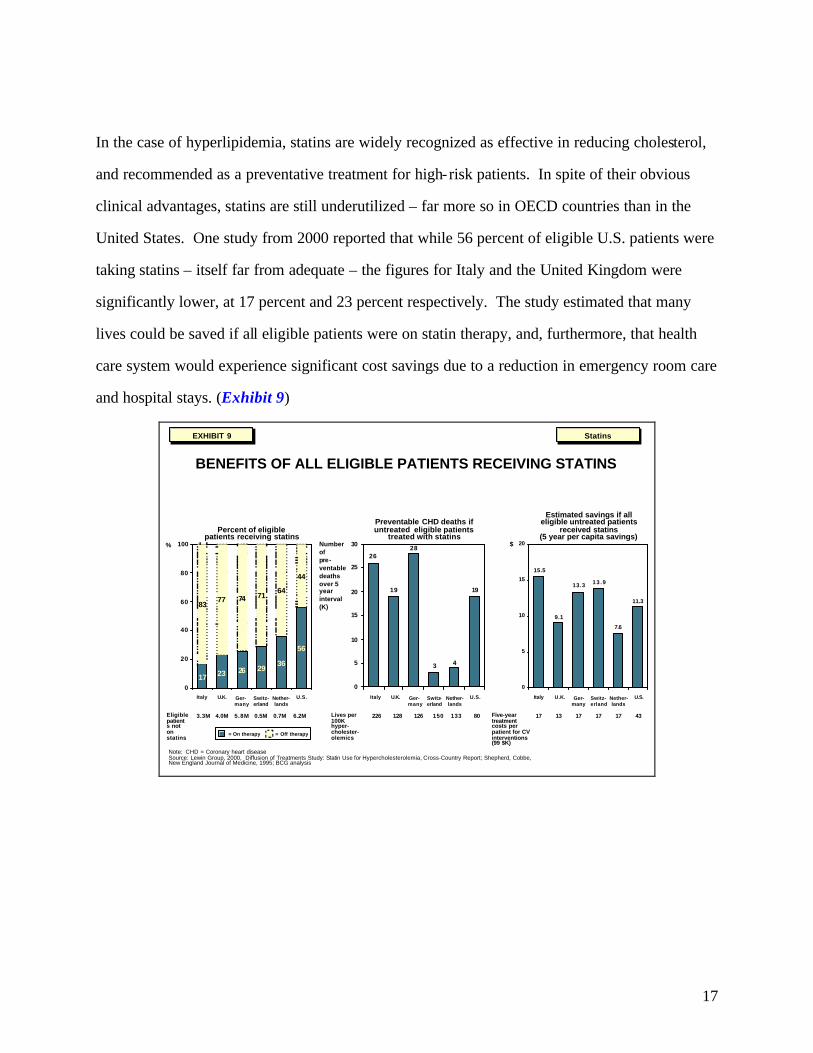
In the case of hyperlipidemia, statins are widely recognized as effective in reducing cholesterol,
and recommended as a preventative treatment for high-risk patients. In spite of their obvious
clinical advantages, statins are still underutilized – far more so in OECD countries than in the
United States. One study from 2000 reported that while 56 percent of eligible U.S. patients were
taking statins – itself far from adequate – the figures for Italy and the United Kingdom were
significantly lower, at 17 percent and 23 percent respectively. The study estimated that many
lives could be saved if all eligible patients were on statin therapy, and, furthermore, that health
care system would experience significant cost savings due to a reduction in emergency room care
and hospital stays. (Exhibit 9)
BENEFITS OF ALL ELIGIBLE PATIENTS RECEIVING STATINS
Note: CHD = Coronary heart diseaseSource: Lewin Group, 2000, Diffusion of Treatments Study: Statin Use for Hypercholesterolemia, Cross-Country Report; Shepherd, Cobbe, New England Journal of Medicine, 1995; BCG analysis
StatinsStatins
19
43
28
19
26
0
5
10
15
20
25
30
11.3
7.6
13 .913.3
9.1
15.5
0
5
10
15
20
17 23 26 2936
56
8377 74 71
64
44
0
20
40
60
80
100%
Percent of eligible patients receiving statins
$
Estimated savings if all eligible untreated patients
received statins (5 year per capita savings)
Number ofpre-ventabledeaths over 5 yearinterval (K)
Preventable CHD deaths if untreated eligible patients
treated with statins
17 13 17 17 17 43Five-year treatmentcosts per patient for CV interventions (99 $K)
Lives per 100K hyper-cholester-olemics
3.3M 4.0M 5.8M 0.5M 0.7MEligiblepatients not on statins
Italy U.K. Ger-many
Switz-erland
Nether-lands
U.S. Italy U.K. Ger-many
Switz-erland
Nether-lands
U.S.Italy U.K. Ger-many
Switz-erland
Nether-lands
U.S.
6.2M 226 128 126 150 133 80
= On therapy = Off therapy
EXHIBIT 9EXHIBIT 9
18
Psychosis is a disease that has a highly disruptive effect on its affected patients’ lives, on the
economy and on society in general. Patients using newer “atypical” anti-psychotics, rather than
the traditional typical anti-psychotics, show marked improvements in both so-called negative and
positive side effects,20 and have higher compliance rates.21
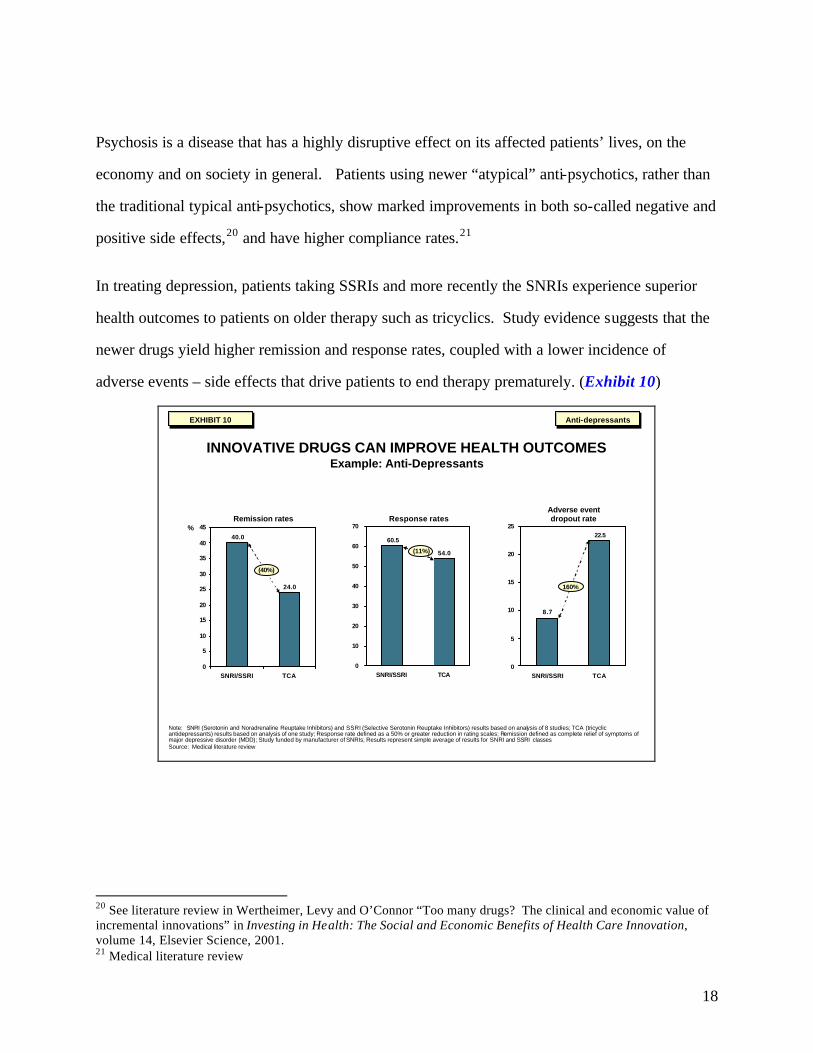
In treating depression, patients taking SSRIs and more recently the SNRIs experience superior
health outcomes to patients on older therapy such as tricyclics. Study evidence suggests that the
newer drugs yield higher remission and response rates, coupled with a lower incidence of
adverse events – side effects that drive patients to end therapy prematurely. (Exhibit 10)
INNOVATIVE DRUGS CAN IMPROVE HEALTH OUTCOMESExample: Anti-Depressants
Anti-depressantsAnti-depressants
40.0
24.0
0
5
10
15
20
25
30
35
40
45
SNRI/SSRI TCA
%Remission rates Response rates
Adverse event dropout rate
54.0
60.5
0
10
20
30
40
50
60
70
SNRI/SSRI TCA
22.5
8.7
0
5
10
15
20
25
SNRI/SSRI TCA
(40%)
(11%)
160%
Note: SNRI (Serotonin and Noradrenaline Reuptake Inhibitors) and SSRI (Selective Serotonin Reuptake Inhibitors) results based on analysis of 8 studies; TCA (tricyclicantidepressants) results based on analysis of one study; Response rate defined as a 50% or greater reduction in rating scales; Remission defined as complete relief of symptoms of major depressive disorder (MDD); Study funded by manufacturer of SNRIs; Results represent simple average of results for SNRI and SSRI classesSource: Medical literature review
EXHIBIT 10EXHIBIT 10
20 See literature review in Wertheimer, Levy and O’Connor “Too many drugs? The clinical and economic value of incremental innovations” in Investing in Health: The Social and Economic Benefits of Health Care Innovation, volume 14, Elsevier Science, 2001. 21 Medical literature review
19
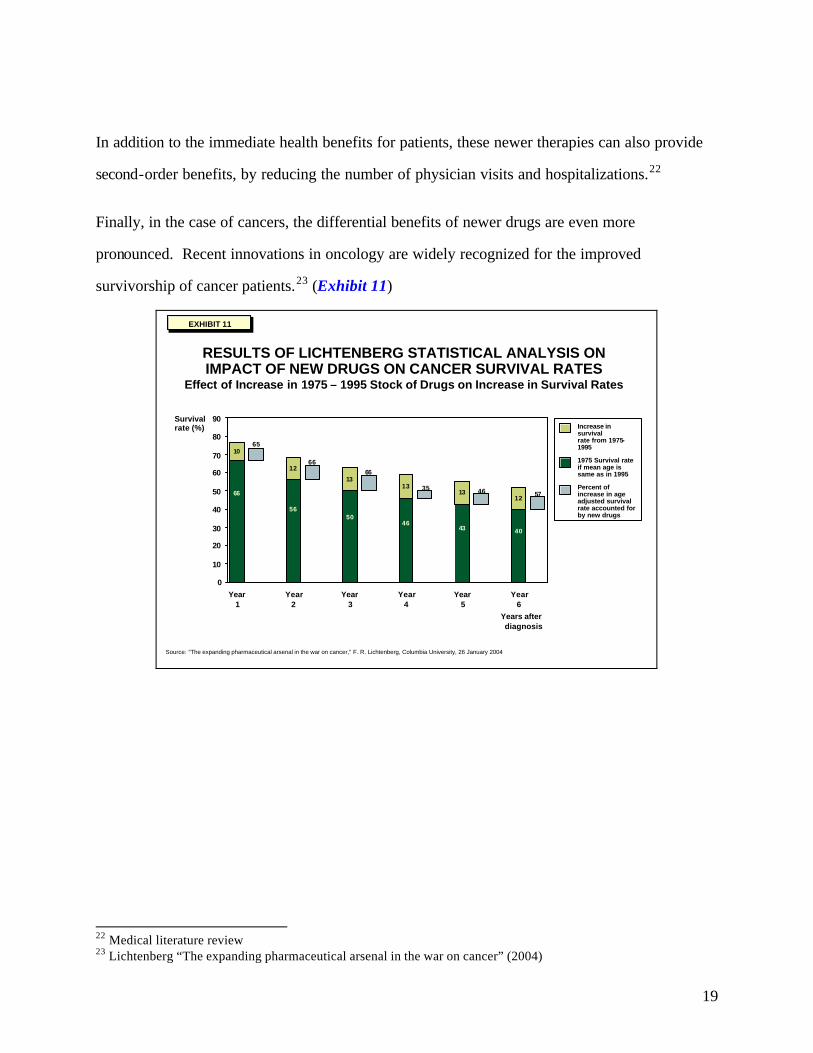
In addition to the immediate health benefits for patients, these newer therapies can also provide
second-order benefits, by reducing the number of physician visits and hospitalizations.22
Finally, in the case of cancers, the differential benefits of newer drugs are even more
pronounced. Recent innovations in oncology are widely recognized for the improved
survivorship of cancer patients.23 (Exhibit 11)
RESULTS OF LICHTENBERG STATISTICAL ANALYSIS ON IMPACT OF NEW DRUGS ON CANCER SURVIVAL RATES
Effect of Increase in 1975 – 1995 Stock of Drugs on Increase in Survival Rates
Source: “The expanding pharmaceutical arsenal in the war on cancer,” F. R. Lichtenberg, Columbia University, 26 January 2004
66
5650
4643 40
10
12
1313
1312
0
10
20
30
40
50
60
70
80
90
Year1
Year2
Year3
Year4
Year5
Year6
Increase in survival rate from 1975-1995
1975 Survival rate if mean age is same as in 1995
Percent of increase in age adjusted survival rate accounted for by new drugs
Survival rate (%)
65
6666
35 46 57
Years after diagnosis
EXHIBIT 11EXHIBIT 11
22 Medical literature review 23 Lichtenberg “The expanding pharmaceutical arsenal in the war on cancer” (2004)
20
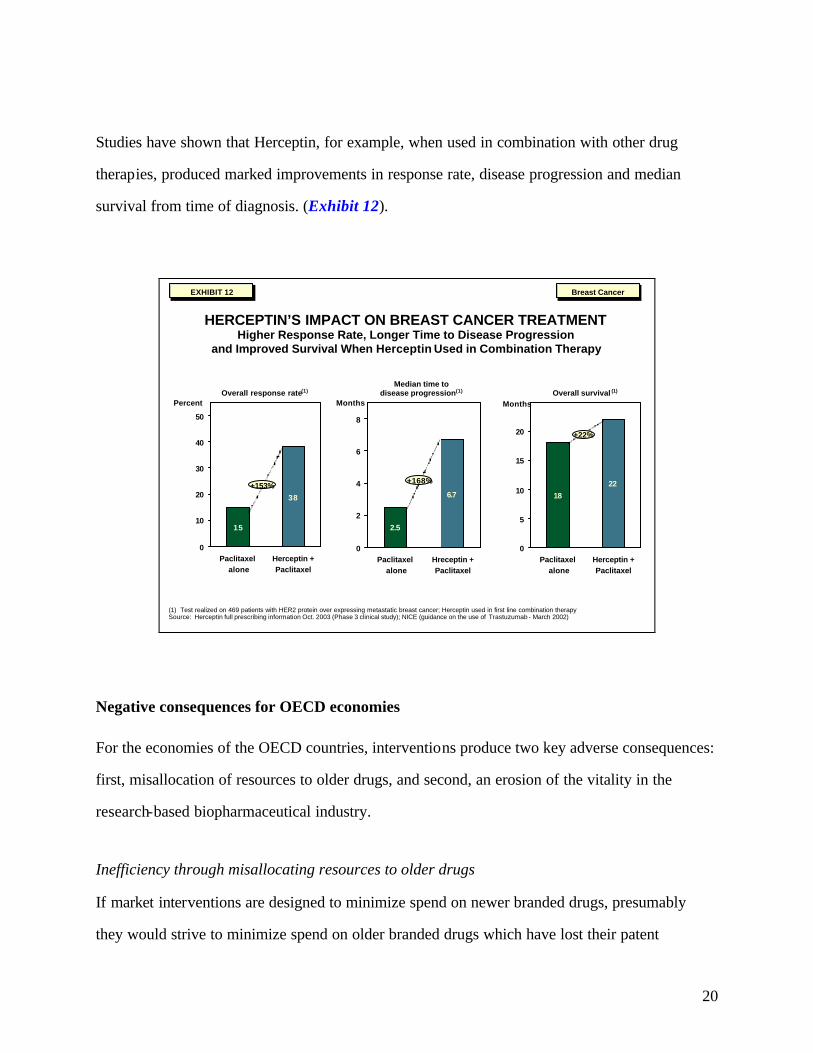
Studies have shown that Herceptin, for example, when used in combination with other drug
therapies, produced marked improvements in response rate, disease progression and median
survival from time of diagnosis. (Exhibit 12).
HERCEPTIN’S IMPACT ON BREAST CANCER TREATMENTHigher Response Rate, Longer Time to Disease Progression
and Improved Survival When Herceptin Used in Combination Therapy
(1) Test realized on 469 patients with HER2 protein over expressing metastatic breast cancer; Herceptin used in first line combination therapySource: Herceptin full prescribing information Oct. 2003 (Phase 3 clinical study); NICE (guidance on the use of Trastuzumab - March 2002)
2.5
6.7
0
2
4
6
8
Paclitaxel alone
Hreceptin +Paclitaxel
15
38
0
10
20
30
40
50
Paclitaxel alone
Herceptin +Paclitaxel
PercentOverall response rate(1)
Months
Median time to disease progression(1)
18
22
0
5
10
15
20
Paclitaxel alone
Herceptin +Paclitaxel
MonthsOverall survival (1)
+22%
+168%+153%
Breast CancerBreast CancerEXHIBIT 12EXHIBIT 12
Negative consequences for OECD economies
For the economies of the OECD countries, interventions produce two key adverse consequences:
first, misallocation of resources to older drugs, and second, an erosion of the vitality in the
research-based biopharmaceutical industry.
Inefficiency through misallocating resources to older drugs
If market interventions are designed to minimize spend on newer branded drugs, presumably
they would strive to minimize spend on older branded drugs which have lost their patent

21
protection. It turns out that that is not the case in many OECD countries. Consider what
happens with off-patent drugs. As soon as a drug loses patent protection, several companies
typically start manufacturing it in direct competition with one another. In OECD markets, some
of these manufacturers will attempt to brand and market their versions as the original
manufacturer has. Others produce pure generics. Interestingly, based on historical data, the
new “branded generics” usually obtain a higher price than the “pure generic” copies do. The
spend that goes into branding the generic provides negligible incremental benefit for the patient
or the health system over the pure generic copy.
Competitive markets understand this. The share of pure generics in the U.S. market is
accordingly about twice that of the branded versions. Across European countries, by contrast,
the share of pure generics is only about one-third that of the branded versions.24 (Exhibit 13)
HIGHER SHARE OF BRANDED GENERICS MAKES OECD DRUG SPEND LESS EFFICIENT THAN IN U.S.
EfficientUnbranded generics
and
Branded on patent drugs
Inefficient Branded generics
Share of volume by brand status
0
10
20
30
40
50
60
70
80
90
100
Canada France Germany Japan U.K. Average U.S.
Branded generics are inefficient because they are more expensive than unbranded generics
Branded generics are inefficient because they are more expensive than unbranded generics
Note: Data is for 1999Source: BCG analysis of data in Danzon (2003), Health Affairs, pp W3-525 – originally from calculations from IMS Health Midas data set 1999
Originator on patent
Unbranded generic
Branded generic
EXHIBIT 13EXHIBIT 13
24 BCG analysis of data in Danzon (2003), Health Affairs, p. W3-525.
22
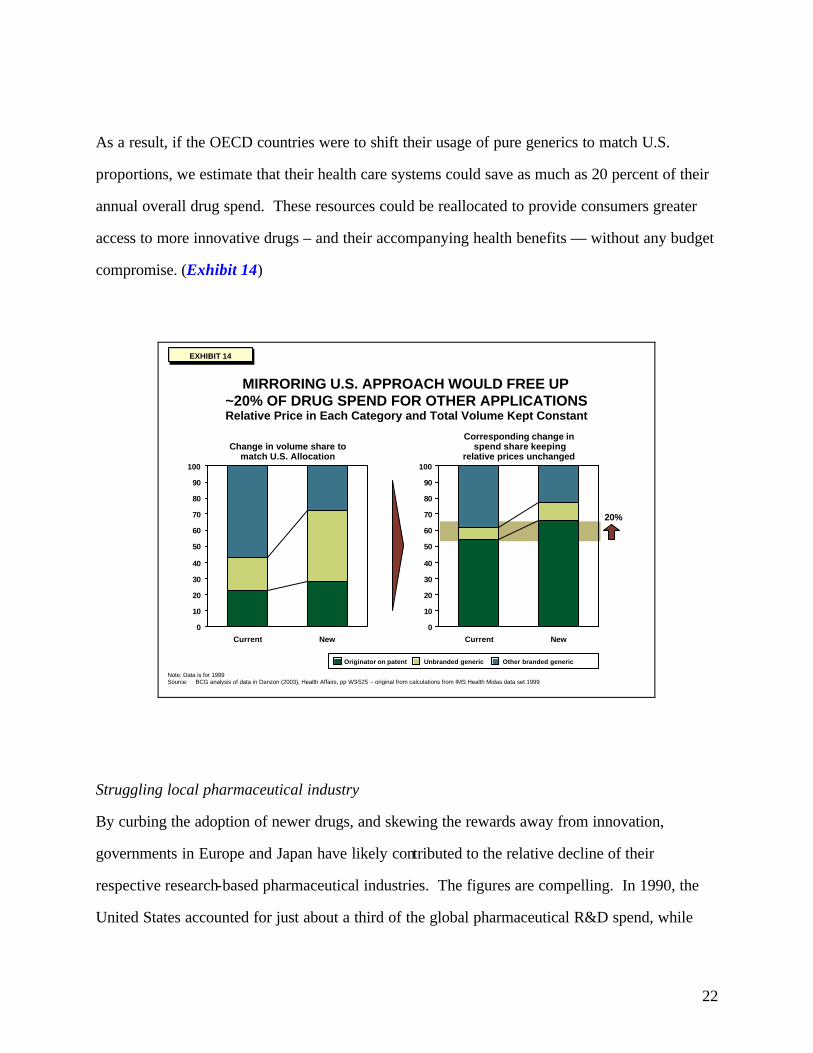
As a result, if the OECD countries were to shift their usage of pure generics to match U.S.
proportions, we estimate that their health care systems could save as much as 20 percent of their
annual overall drug spend. These resources could be reallocated to provide consumers greater
access to more innovative drugs – and their accompanying health benefits — without any budget
compromise. (Exhibit 14)
MIRRORING U.S. APPROACH WOULD FREE UP ~20% OF DRUG SPEND FOR OTHER APPLICATIONSRelative Price in Each Category and Total Volume Kept Constant
Note: Data is for 1999Source: BCG analysis of data in Danzon (2003), Health Affairs, pp W3-525 – original from calculations from IMS Health Midas data set 1999
0
10
20
30
40
50
60
70
80
90
100
Current New
Change in volume share tomatch U.S. Allocation
0
10
20
30
40
50
60
70
80
90
100
Current New
Corresponding change in spend share keeping
relative prices unchanged
20%
Originator on patent Unbranded generic Other branded generic
EXHIBIT 14EXHIBIT 14
Struggling local pharmaceutical industry
By curbing the adoption of newer drugs, and skewing the rewards away from innovation,
governments in Europe and Japan have likely contributed to the relative decline of their
respective research-based pharmaceutical industries. The figures are compelling. In 1990, the
United States accounted for just about a third of the global pharmaceutical R&D spend, while
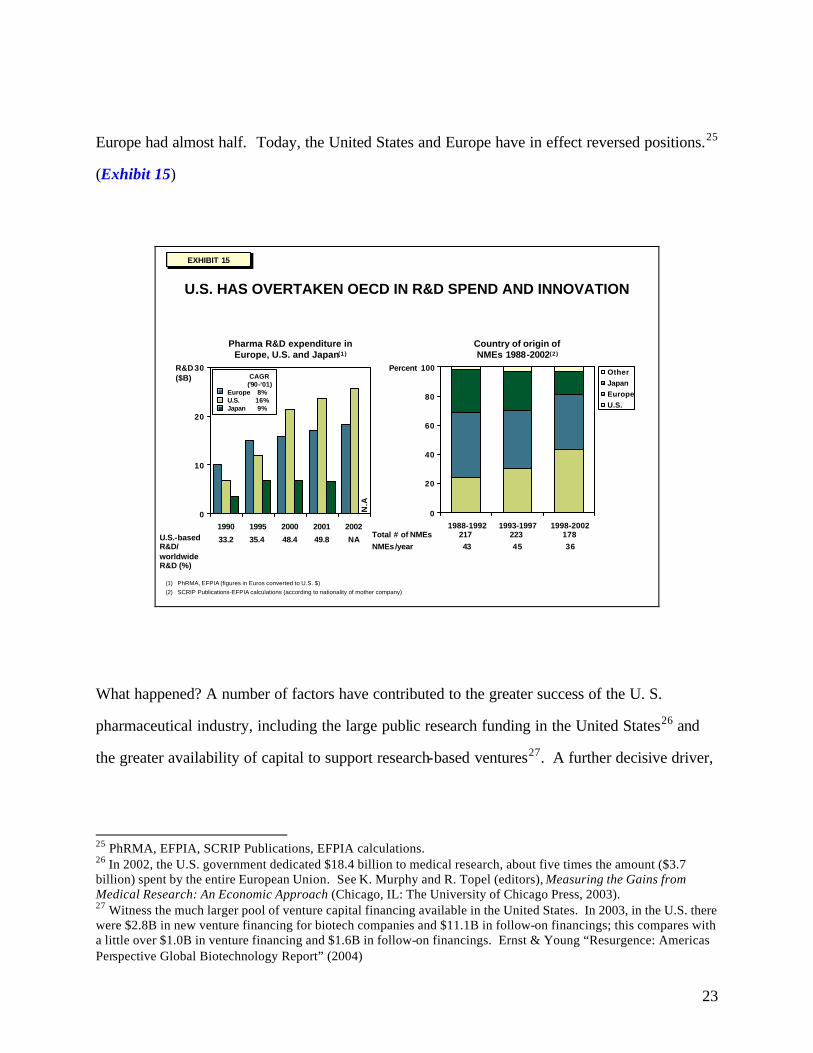
23
Europe had almost half. Today, the United States and Europe have in effect reversed positions.25
(Exhibit 15)
EXHIBIT 15EXHIBIT 15
U.S. HAS OVERTAKEN OECD IN R&D SPEND AND INNOVATION
(1) PhRMA, EFPIA (figures in Euros converted to U.S. $)(2) SCRIP Publications-EFPIA calculations (according to nationality of mother company)
0
10
20
30
1990 1995 2000 2001 2002
R&D($B)
Pharma R&D expenditure in Europe, U.S. and Japan(1)
N.A
U.S.-based R&D/ worldwide R&D (%)
33.2
0
20
40
60
80
100
1988-1992 1993-1997 1998-2002
OtherJapanEuropeU.S.
Percent
Country of origin of NMEs 1988-2002(2)
CAGR('90-'01)
8%16%9%
EuropeU.S.Japan
Total # of NMEsNMEs/year
21743
22345
17836
35.4 48.4 49.8 NA
What happened? A number of factors have contributed to the greater success of the U. S.
pharmaceutical industry, including the large public research funding in the United States26 and
the greater availability of capital to support research-based ventures27. A further decisive driver,
25 PhRMA, EFPIA, SCRIP Publications, EFPIA calculations. 26 In 2002, the U.S. government dedicated $18.4 billion to medical research, about five times the amount ($3.7 billion) spent by the entire European Union. See K. Murphy and R. Topel (editors), Measuring the Gains from Medical Research: An Economic Approach (Chicago, IL: The University of Chicago Press, 2003). 27 Witness the much larger pool of venture capital financing available in the United States. In 2003, in the U.S. there were $2.8B in new venture financing for biotech companies and $11.1B in follow-on financings; this compares with a little over $1.0B in venture financing and $1.6B in follow-on financings. Ernst & Young “Resurgence: Americas Perspective Global Biotechnology Report” (2004)
24
however has been the greater ability of U.S. based companies to invest in their own growth
through R&D.
Because the U.S. market rewards innovation better than other markets, and U.S.-headquartered
companies have a disproportionate share of the U.S. market, they have a greater ability—and
incentive—to invest in R&D. In this context, a number of international pha rmaceutical
companies have been increasing their presence and investment in the United States. Novartis
has moved their Research headquarters to the United States, and many other companies are
rebalancing their center of gravity towards the United States (for example, GSK and Aventis) at
least partially reflecting the benefits of keeping research and development activities near the
most important market.
3. Negative Consequences for the U.S. consumer and economy
Lower revenues to fund global pharmaceutical research
The adverse consequences of OECD market interventions are also borne by U.S. consumers. By
imposing government controls on prices and restraining the market penetration of innovative
therapies in their home markets, OECD governments are, in effect, sharply reducing the global
returns to pharmaceutical innovation and the global pool of cash available for research on new
medicines. Our analysis highlights the disparate contributions made across countries. Take the
case of diabetes: on a per-patient basis (that is. for each person diagnosed with diabetes),
revenues for innovative drugs in the OECD are just one-third those of the United States over the
lifecycle of the drug. 28 This great disparity is driven both by lower usage of innovative drugs in
28 As noted below, this estimate is based on an analysis of the experience of new drugs for diabetes and hyperlipidemia.
25
OECD countries (as a result of delays in launch, slower adoption rates and lower peak
penetration), and by the lower pricing imposed through government interventions.
How can the impact of such distortions on the economics of the biopharmaceutical industry be
measured? One way is to consider the counter-factual situation – one in which the OECD
government interventions did not exist. By comparing the estimated figures of what the world
would be without OECD interventions with those of the real world today, we can get a good idea
of the cost that these interventions impose on the United States. In the hypothetical world
without cost controls, revenues for the pharmaceutical industry would not be distorted; our
assumption is that all OECD markets for pharmaceuticals would function more like the U.S.
market, both in the receptiveness to new drugs (volume uptake) and in the rewards they offered
manufacturers (price). Below we describe our approach and assumptions defining a reasonable
upper and lower bound to both volume and price as they might have been under this hypothesis,
and hence defining a range of estimates of the revenues lost to the industry:
Volume scenarios
Consider first of all the volume of drugs consumed per patient: To ascertain the difference
between OECD and U.S. volumes for a specific disease, you need to distinguish two
components:
(a) The total amount of drug treatment for the disease – measured, for example, by “days-of-
treatment” prescribed per diagnosed patient. (For some diseases, such as diabetes, an OECD
patient tends to receive more drug therapy than a U.S. patient does, while for other diseases, such
as depression, the reverse holds true.)
(b) The share which innovative drugs have of the total treatment prescribed.
26
Using these two measures, we can devise two scenarios in which to calculate the volume of
innovative medicines that would be prescribed in the OECD in the absence of government
controls. In the first scenario, component (a) remains the same, but component (b) changes to
match the U. S. experience. In other words, the current amount of drug treatment for a given
disease remains unchanged (the same number of days-of-treatment per patient), but the share of
innovative drugs shifts to match that of the United States. Implicit in this assumption is the view
that local physicians retain their basic treatment strategies, using drug therapies, non-drug
therapies, and no therapy in their actual current proportions. We call this scenario the
“innovative share of total prescriptions” assumption. Note that it consistently leads to higher
volumes of innovative drugs in OECD countries, since in the real world their adoption of
innovative drugs in the diseases we studied always lags the U.S. adoption rates.
In the second scenario, component (a) changes as well as component (b) to reflect U.S.
experience. The total amount of drug treatment per OECD patient – specifically, the number of
days-of-treatment per patient – changes to match that of a U.S. patient. In other words, if U.S.
physicians typically prescribe a specified number of days-of-treatment with innovative drugs per
patient, then the OECD physician is assumed to do the same. Implicit in this assumption is the
view that innovative drugs – through their greater perceived potency or other features – reshape
the overall prescribing habits of physicians universally. For example, a drug offering a superior
side-effect profile might be prescribed more frequently, resulting on average in more days-of-
treatment for the patient population. We call this scenario the “volume of prescriptions”
assumption.
Price scenarios
In the absence of government interventions, we assume that prices will rise for innovative drugs
across the OECD. The question is: how much? Here again are two possible scenarios.
27
In the more conservative one, drug prices across the OECD are assumed to match the higher U.S.
levels, though adjusted to reflect differences in the GDP per capita (which principally means
adjusting prices in OECD countries to reflect their lower per capita GDP relative to the United
States). Implicit in this assumption is the view that what consumers are willing to pay for drugs
is somehow linked to their incomes. Some might view this as being reflective of local “ability
to pay.” If so, it is misconceived given the readiness of OECD consumers to pay equal or higher
prices vis-à-vis U.S. consumers for products such as computers, music CDs, or movie tickets.
We call this assumption “U.S. pricing adjusted for GDP per capita.”
In the second scenario, drug prices in the OECD countries are assumed to match U.S. levels
without any adjustment -- simply in accord with the currency exchange rate. Implicit in this
assumption is the view that the underlying microeconomics which drives pricing decisions –
including marginal revenue and marginal cost – works in the same basic way across OECD
countries as it does in the United States. We call this assumption “unadjusted U.S. pricing.”
The likely range
In our hypothetical intervention-free world, the total volume and the average pricing in OECD
markets would likely lie somewhere between the two sets of assumptions in each case. So we
can use the alternative scenarios to frame a reasonable range of how these markets would have
behaved for each class of drugs in our sample.
In the case of diabetes, the typical OECD patient currently receives more “days of treatment”
than the U.S. patient – but, as noted above, with drugs significantly older on average. Now, take
scenario 1 for both volume and price – in other words, assume that, without government
interventions, volume in OECD countries match the U.S. innovative share of total prescriptions
and pricing in OECD countries would match U.S. prices adjusted for GDP per capita. In that
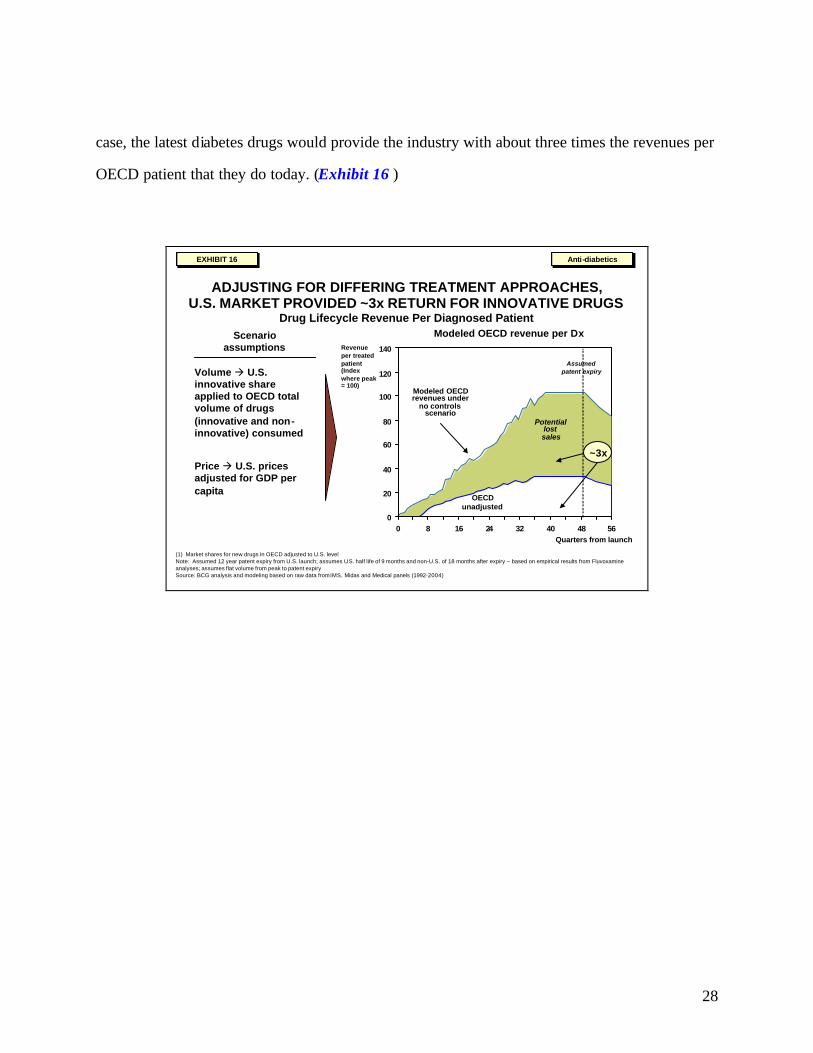
28
case, the latest diabetes drugs would provide the industry with about three times the revenues per
OECD patient that they do today. (Exhibit 16 )
EXHIBIT 17EXHIBIT 17
ADJUSTING FOR DIFFERING TREATMENT APPROACHES,U.S. MARKET PROVIDED ~3x RETURN FOR INNOVATIVE DRUGS
Drug Lifecycle Revenue Per Diagnosed Patient
(1) Market shares for new drugs in OECD adjusted to U.S. level Note: Assumed 12 year patent expiry from U.S. launch; assumes U.S. half life of 9 months and non-U.S. of 18 months after expiry – based on empirical results from Fluvoxamine analyses; assumes flat volume from peak to patent expirySource: BCG analysis and modeling based on raw data from IMS, Midas and Medical panels (1992-2004)
Anti-diabeticsAnti-diabetics
0
20
40
60
80
100
120
140
0 8 16 24 32 40 48 56
Revenue per treated patient(Index where peak = 100)
Volume à U.S. innovative share applied to OECD total volume of drugs (innovative and non-innovative) consumed
Price à U.S. prices adjusted for GDP per capita
OECD unadjusted
Quarters from launch
Modeled OECD revenues under
no controls scenario
Potential lost sales
~3x
Modeled OECD revenue per DxScenario assumptions
Assumed patent expiry
EXHIBIT 16EXHIBIT 16
29
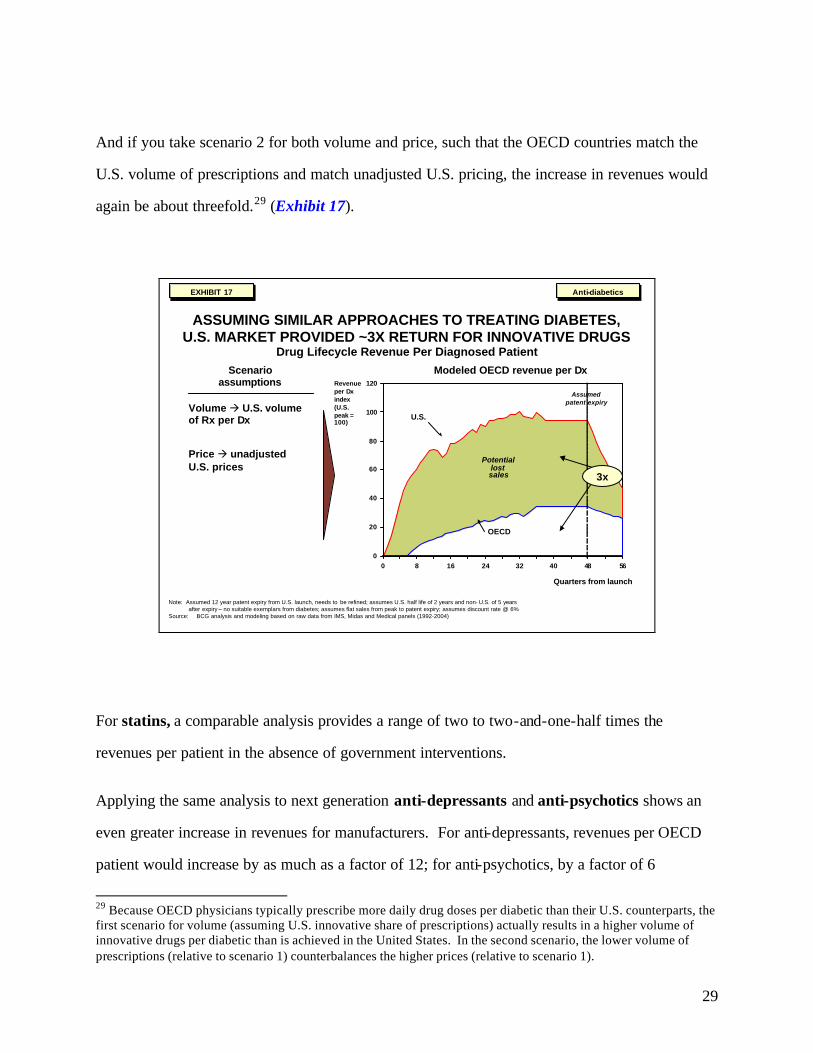
And if you take scenario 2 for both volume and price, such that the OECD countries match the
U.S. volume of prescriptions and match unadjusted U.S. pricing, the increase in revenues would
again be about threefold.29 (Exhibit 17).
EXHIBIT 18EXHIBIT 18
ASSUMING SIMILAR APPROACHES TO TREATING DIABETES, U.S. MARKET PROVIDED ~3X RETURN FOR INNOVATIVE DRUGS
Drug Lifecycle Revenue Per Diagnosed Patient
0
20
40
60
80
100
120
0 8 16 24 32 40 48 56
Revenue per Dxindex(U.S. peak = 100)
U.S.
OECD
Quarters from launch
3x
Anti-diabeticsAnti-diabetics
Note: Assumed 12 year patent expiry from U.S. launch, needs to be refined; assumes U.S. half life of 2 years and non- U.S. of 5 years after expiry – no suitable exemplars from diabetes; assumes flat sales from peak to patent expiry; assumes discount rate @ 6%
Source: BCG analysis and modeling based on raw data from IMS, Midas and Medical panels (1992-2004)
Potential lost sales
Modeled OECD revenue per Dx
Assumed patent expiry
Volume à U.S. volume of Rx per Dx
Price à unadjusted U.S. prices
Scenario assumptions
EXHIBIT 17EXHIBIT 17
For statins, a comparable analysis provides a range of two to two-and-one-half times the
revenues per patient in the absence of government interventions.
Applying the same analysis to next generation anti-depressants and anti-psychotics shows an
even greater increase in revenues for manufacturers. For anti-depressants, revenues per OECD
patient would increase by as much as a factor of 12; for anti-psychotics, by a factor of 6
29 Because OECD physicians typically prescribe more daily drug doses per diabetic than their U.S. counterparts, the first scenario for volume (assuming U.S. innovative share of prescriptions) actually results in a higher volume of innovative drugs per diabetic than is achieved in the United States. In the second scenario, the lower volume of prescriptions (relative to scenario 1) counterbalances the higher prices (relative to scenario 1).
30
(estimates under scenario 2 in each case in which OECD countries match the U.S. volume of
prescriptions and the U.S. unadjusted price). One of the underlying reasons for the larger impact
in these diseases compared with diabetes and statins is likely the greater difference in the OECD
and U.S. approaches to treating the diseases, making these results potentially less reflective of
the experience of other drug categories.
To sum up the analysis30, the experience of innovative drugs across our diseases indicates a
substantial potential to increase revenues in the absence of government cost controls. It also
indicates a wide range depending on which disease areas are considered. Some of the difference
is certainly reflective of differing patterns of treatment and some is probably due to the way that
market interventions vary by disease area.
30 It was not possible to develop a fully comparable analysis for recent anti-cancer drugs (Gleevec, Herceptin) because of the limited data available
31
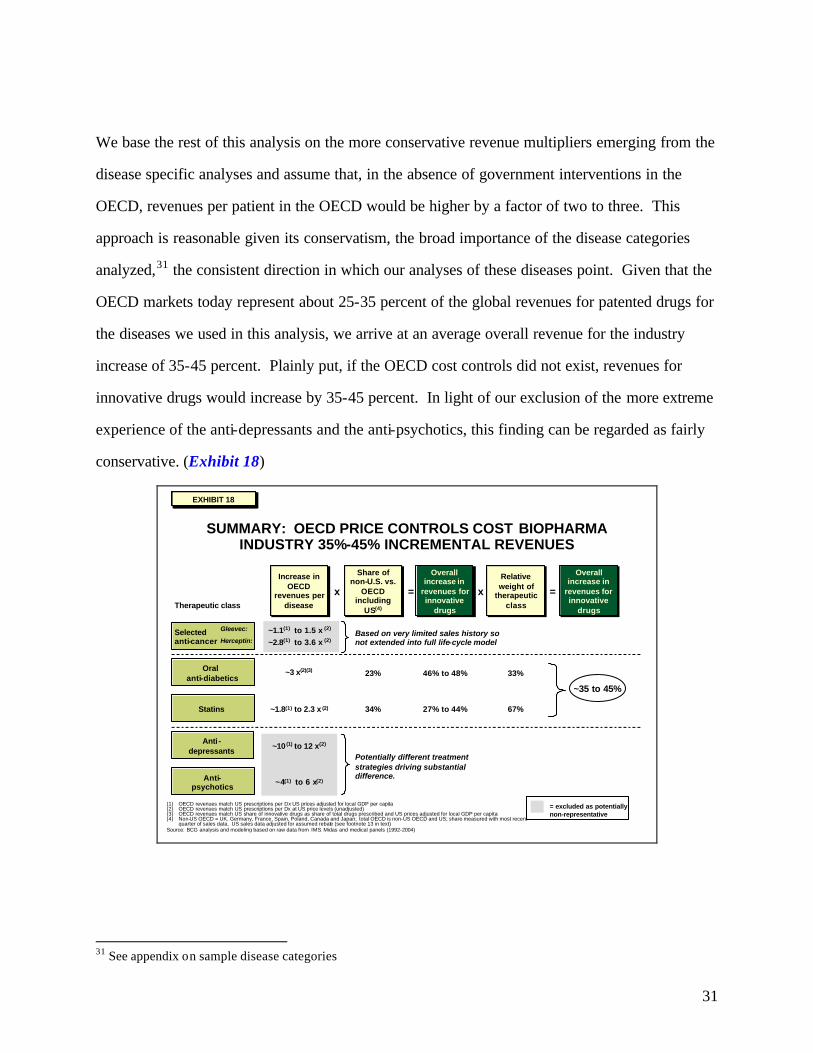
We base the rest of this analysis on the more conservative revenue multipliers emerging from the
disease specific analyses and assume that, in the absence of government interventions in the
OECD, revenues per patient in the OECD would be higher by a factor of two to three. This
approach is reasonable given its conservatism, the broad importance of the disease categories
analyzed,31 the consistent direction in which our analyses of these diseases point. Given that the
OECD markets today represent about 25-35 percent of the global revenues for patented drugs for
the diseases we used in this analysis, we arrive at an average overall revenue for the industry
increase of 35-45 percent. Plainly put, if the OECD cost controls did not exist, revenues for
innovative drugs would increase by 35-45 percent. In light of our exclusion of the more extreme
experience of the anti-depressants and the anti-psychotics, this finding can be regarded as fairly
conservative. (Exhibit 18)
Exhibits for whitepaper_29Jun04_11pm.ppt
SUMMARY: OECD PRICE CONTROLS COST BIOPHARMAINDUSTRY 35%-45% INCREMENTAL REVENUES
(1) OECD revenues match US prescriptions per Dx US prices adjusted for local GDP per capita(2) OECD revenues match US prescriptions per Dx at US price levels (unadjusted)(3) OECD revenues match US share of innovative drugs as share of total drugs prescribed and US prices adjusted for local GDP per capita(4) Non-US OECD = UK. Germany, France, Spain, Poland, Canada and Japan; total OECD is non-US OECD and US; share measured with most recent
quarter of sales data. US sales data adjusted for assumed rebate (see footnote 13 in text)Source: BCG analysis and modeling based on raw data from IMS: Midas and medical panels (1992-2004)
~35 to 45%
Increase in OECD
revenues per disease
Increase in OECD
revenues per disease
Share of non-U.S. vs.
OECD including
US(4)
Share of non-U.S. vs.
OECD including
US(4)
Overall increase in
revenues for innovative
drugs
Overall increase in
revenues for innovative
drugs
x =Relative weight of
therapeutic class
Relative weight of
therapeutic class
Overall increase in
revenues for innovative
drugs
Overall increase in
revenues for innovative
drugs
x =
~3 x(2)(3) 23% 46% to 48% 33%
~1.8(1) to 2.3 x (2) 34% 27% to 44% 67%
~10 (1) to 12 x(2)
~4(1) to 6 x(2)
~1.1(1) to 1.5 x (2)
~2.8(1) to 3.6 x (2)
Oral anti-diabetics
Statins
Anti -depressants
Anti-psychotics
Selected anti-cancer
Gleevec:
Herceptin:
= excluded as potentially non-representative
Based on very limited sales history so not extended into full life-cycle model
Potentially different treatment strategies driving substantial difference.
Therapeutic class
Exhibit 19Exhibit 19EXHIBIT 18EXHIBIT 18
31 See appendix on sample disease categories
32
Lower global R&D investment
Such increased returns to innovation would have significant consequences for the level of R&D.
The business of researching and developing drugs is a notoriously risky one. The Boston
Consulting Group has estimated that almost three-quarters of investment in new drugs is spent on
projects that fail somewhere along the research and development process.32 But the high
potential rewards attract investment and encourage the pursuit of riskier projects, whereas lower
returns merely discourage overall investment and drive researchers toward more conservative
projects.33
32 Analysis based on the model, reported in The Boston Consulting Group “A Revolution In R&D” (2001). 33 Basic portfolio management theory demonstrates that to achieve a certain targeted risk-adjusted return for a portfolio of projects, a company must consider four variables: the projected overall profits to the projects, the overall investment cost, the time horizon for investment and profit and the riskiness of projects. If the overall profits are lower, and a company cannot substantially change the investment cost or time horizon (for the pharmaceutical industry, these variables are determined more by science and regulation than by management policy), the company will tend to exclude riskier projects
33
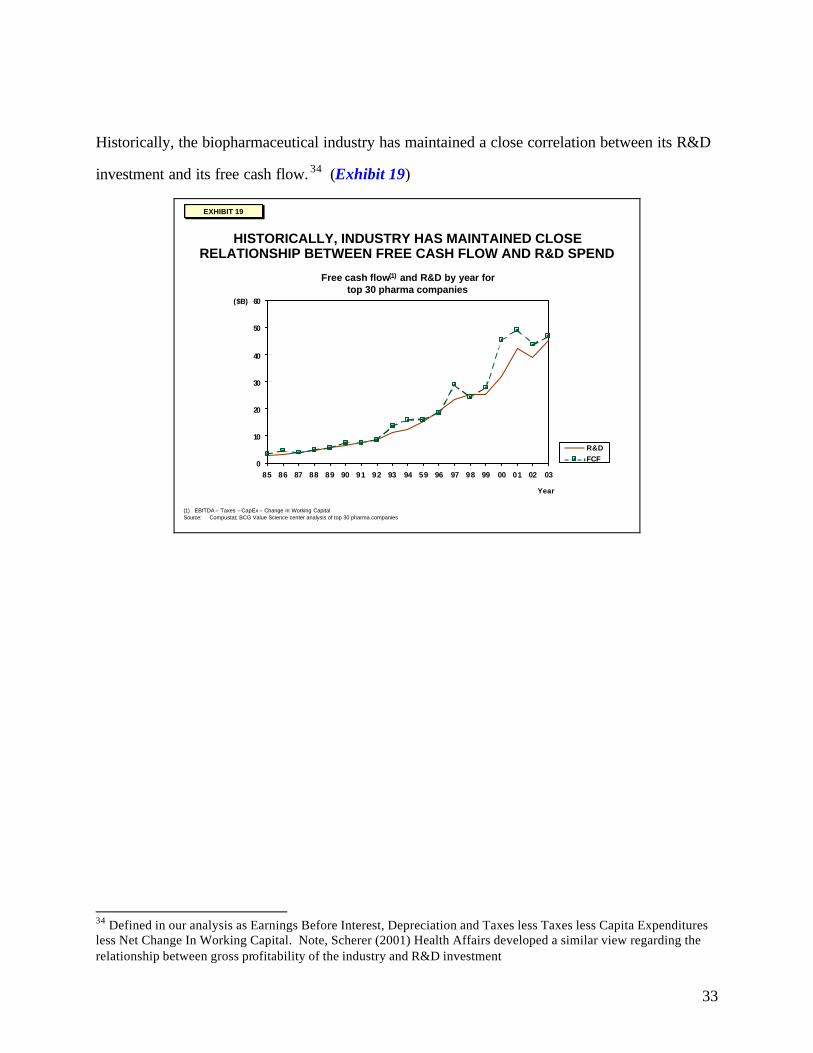
Historically, the biopharmaceutical industry has maintained a close correlation between its R&D
investment and its free cash flow. 34 (Exhibit 19)
EXHIBIT 20EXHIBIT 20
HISTORICALLY, INDUSTRY HAS MAINTAINED CLOSE RELATIONSHIP BETWEEN FREE CASH FLOW AND R&D SPEND
0
10
20
30
40
50
60
85 86 87 88 89 90 91 92 93 94 59 96 97 98 99 00 01 02 03
($B)
Year
Free cash flow(1) and R&D by year for top 30 pharma companies
(1) EBITDA – Taxes – CapEx – Change in Working CapitalSource: Compustat; BCG Value Science center analysis of top 30 pharma companies
R&DFCF
EXHIBIT 19EXHIBIT 19
34 Defined in our analysis as Earnings Before Interest, Depreciation and Taxes less Taxes less Capita Expenditures less Net Change In Working Capital. Note, Scherer (2001) Health Affairs developed a similar view regarding the relationship between gross profitability of the industry and R&D investment
34
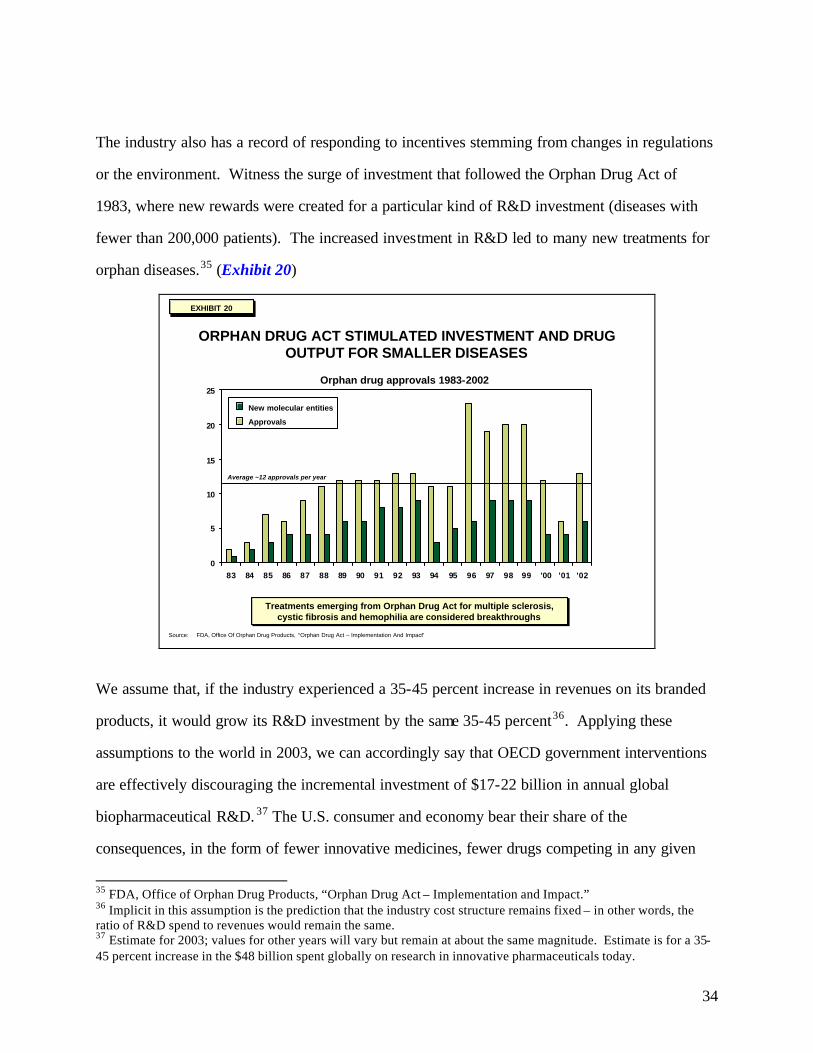
The industry also has a record of responding to incentives stemming from changes in regulations
or the environment. Witness the surge of investment that followed the Orphan Drug Act of
1983, where new rewards were created for a particular kind of R&D investment (diseases with
fewer than 200,000 patients). The increased investment in R&D led to many new treatments for
orphan diseases.35 (Exhibit 20)
EXHIBIT 21EXHIBIT 21
ORPHAN DRUG ACT STIMULATED INVESTMENT AND DRUG OUTPUT FOR SMALLER DISEASES
0
5
10
15
20
25
83 84 85 86 87 88 89 90 91 92 93 94 95 96 97 98 99 '00 '01 '02
Orphan drug approvals 1983-2002
Approvals
New molecular entities
Treatments emerging from Orphan Drug Act for multiple sclerosis,cystic fibrosis and hemophilia are considered breakthroughs
Treatments emerging from Orphan Drug Act for multiple sclerosis,cystic fibrosis and hemophilia are considered breakthroughs
Source: FDA, Office Of Orphan Drug Products, “Orphan Drug Act – Implementation And Impact”
Average ~12 approvals per year
EXHIBIT 20EXHIBIT 20
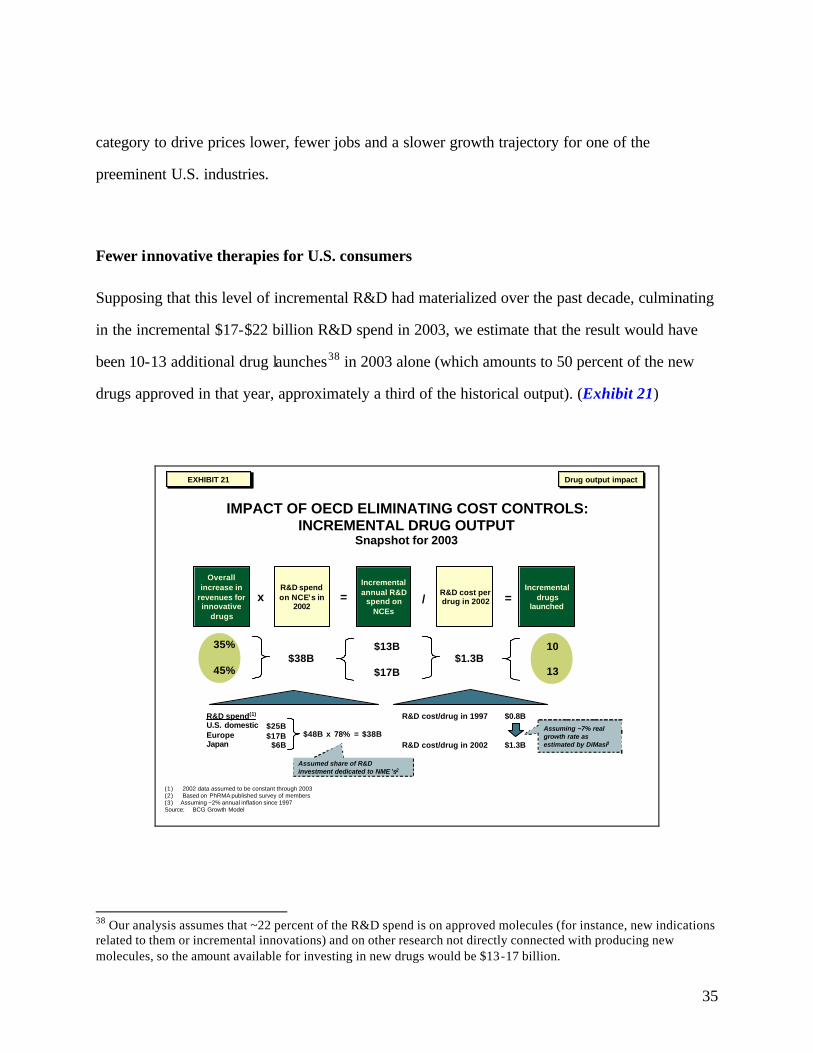
We assume that, if the industry experienced a 35-45 percent increase in revenues on its branded
products, it would grow its R&D investment by the same 35-45 percent36. Applying these
assumptions to the world in 2003, we can accordingly say that OECD government interventions
are effectively discouraging the incremental investment of $17-22 billion in annual global
biopharmaceutical R&D. 37 The U.S. consumer and economy bear their share of the
consequences, in the form of fewer innovative medicines, fewer drugs competing in any given
35 FDA, Office of Orphan Drug Products, “Orphan Drug Act – Implementation and Impact.” 36 Implicit in this assumption is the prediction that the industry cost structure remains fixed – in other words, the ratio of R&D spend to revenues would remain the same. 37 Estimate for 2003; values for other years will vary but remain at about the same magnitude. Estimate is for a 35-45 percent increase in the $48 billion spent globally on research in innovative pharmaceuticals today.
35
category to drive prices lower, fewer jobs and a slower growth trajectory for one of the
preeminent U.S. industries.
Fewer innovative therapies for U.S. consumers
Supposing that this level of incremental R&D had materialized over the past decade, culminating
in the incremental $17-$22 billion R&D spend in 2003, we estimate that the result would have
been 10-13 additional drug launches38 in 2003 alone (which amounts to 50 percent of the new
drugs approved in that year, approximately a third of the historical output). (Exhibit 21)
EXHIBIT 22EXHIBIT 22
IMPACT OF OECD ELIMINATING COST CONTROLS: INCREMENTAL DRUG OUTPUT
Snapshot for 2003
Overall increase in
revenues for innovative
drugs
R&D spend on NCE’s in
2002
Incremental annual R&D
spend on NCEs
R&D cost per drug in 2002
Incremental drugs
launchedx = / =
$38B$13B
$17B$1.3B
10
13
35%
45%
R&D spend(1)
U.S. domesticEuropeJapan
$48B x 78% = $38B$25B$17B
$6B
R&D cost/drug in 1997 $0.8B
R&D cost/drug in 2002 $1.3B
Assuming ~7% real growth rate as estimated by DiMasi3
Assumed share of R&D investment dedicated to NME ’s2
Drug output impactDrug output impact
(1) 2002 data assumed to be constant through 2003(2) Based on PhRMA published survey of members(3) Assuming ~2% annual inflation since 1997Source: BCG Growth Model
EXHIBIT 21EXHIBIT 21
38 Our analysis assumes that ~22 percent of the R&D spend is on approved molecules (for instance, new indications related to them or incremental innovations) and on other research not directly connected with producing new molecules, so the amount available for investing in new drugs would be $13-17 billion.
36
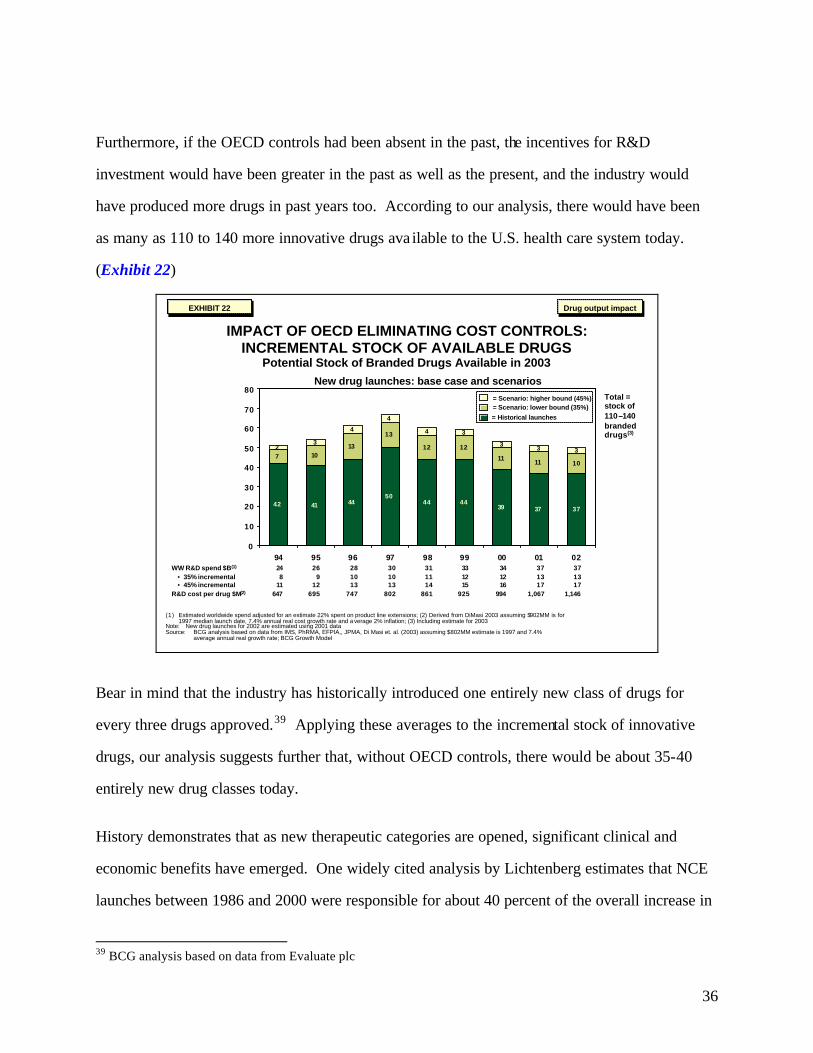
Furthermore, if the OECD controls had been absent in the past, the incentives for R&D
investment would have been greater in the past as well as the present, and the industry would
have produced more drugs in past years too. According to our analysis, there would have been
as many as 110 to 140 more innovative drugs ava ilable to the U.S. health care system today.
(Exhibit 22)
EXHIBIT 23EXHIBIT 23
IMPACT OF OECD ELIMINATING COST CONTROLS: INCREMENTAL STOCK OF AVAILABLE DRUGS
Potential Stock of Branded Drugs Available in 2003
(1) Estimated worldwide spend adjusted for an estimate 22% spent on product line extensions; (2) Derived from DiMasi 2003 assuming $902MM is for 1997 median launch date, 7.4% annual real cost growth rate and a verage 2% inflation; (3) Including estimate for 2003
Note: New drug launches for 2002 are estimated using 2001 dataSource: BCG analysis based on data from IMS, PhRMA, EFPIA,, JPMA, Di Masi et. al. (2003) assuming $802MM estimate is 1997 and 7.4%
average annual real growth rate; BCG Growth Model
42 41 4450
44 4439 37 37
7 1013
13
12 12
1111 10
23
4
4
4 3
33 3
0
10
20
30
40
50
60
70
80
94 95 96 97 98 99 00 01 02
New drug launches: base case and scenarios
WW R&D spend $B(1)
• 35% incremental• 45% incremental
R&D cost per drug $M(2)
248
11647
269
12695
281013
747
301013
802
311114
861
331215
925
341216
994
371317
1,067
Total = stock of 110–140 branded drugs(3)
371317
1,146
= Historical launches= Scenario: lower bound (35%)= Scenario: higher bound (45%)
Drug output impactDrug output impactEXHIBIT 22EXHIBIT 22
Bear in mind that the industry has historically introduced one entirely new class of drugs for
every three drugs approved.39 Applying these averages to the incremental stock of innovative
drugs, our analysis suggests further that, without OECD controls, there would be about 35-40
entirely new drug classes today.
History demonstrates that as new therapeutic categories are opened, significant clinical and
economic benefits have emerged. One widely cited analysis by Lichtenberg estimates that NCE
launches between 1986 and 2000 were responsible for about 40 percent of the overall increase in
39 BCG analysis based on data from Evaluate plc
37
longevity achieved over the same time period.40 Other analyses have underscored the high
returns to drug treatments in individual diseases. Some examples: in heart disease, the return to
adding statin therapy to heart attack survivors is estimated to range from four-to-nine times the
incremental cost.41 In Alzheimer’s Disease, one recent study estimated that treatment of
diagnosed patients with donepezil can substantially reduce overall annual patient costs, the
savings being derived mostly from reduced in-patient hospitalizations and nursing facility
expenditure.42
Quantifying the potential impact of these new medicines is beyond the scope of this study.
However, many have tried to do this: For example, Murphy and Topol have estimated that a 10
percent reduction in mortality due to heart disease could yield a present value of as much as $5.5
trillion to current and future generations. A similar reduction in mortality due to cancer is
estimated to have a present value of $4.4 trillion. 43
Higher prices for drugs for U. S. consumers
Between 75 and 100 drugs of the incremental stock (which we estimate would be available in the
absence of OECD cost controls) would likely have been added to existing categories. The
addition of drugs to a class in this way can yield two benefits. First, the additional drugs can
provide significant health benefits, by offering a differentiated therapeutic profile – efficacy, side
effects, dosing requirements, delivery system and other features.44 Second, the addition of new
40 Lichtenberg, “Impact of New Drug Launches On Longevity: Evidence From Longitudinal, Disease Level Data From 52 Countries 1982-2001”, NBER Working Paper 9754, 2003 41 MEDTAP International, “The Value of Investment In Health Care” 2004 42 Hill, et al, “The Effect of Donepezil Therapy on Health Costs In A Medicare Managed Care Plan”, Managed Care Interface, March 2002. Total annual average costs per diagnosed patient were estimated at $12,000 without the therapy and around $8,000 with the therapy (including the cost of the drug). 43 Murphy, Topol, Measuring the Gains from Medical Research: An Economic Approach, University of Chicago, 2003 44 For a b road review of the literature, see Wertheimer, Levy and O’Connor “Too many drugs? The clinical and economic value of incremental innovations” in Investing in Health: The Social and Economic Benefits of Health Care Innovation, volume 14, Elsevier Science, 2001.
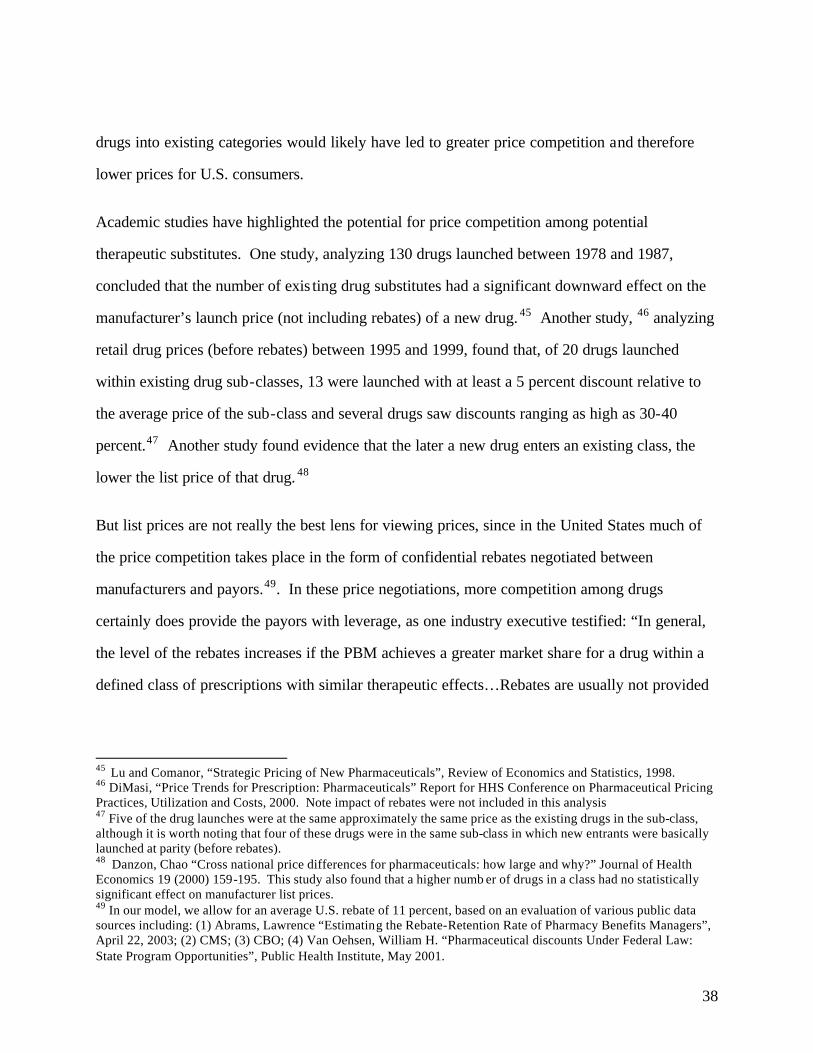
38
drugs into existing categories would likely have led to greater price competition and therefore
lower prices for U.S. consumers.
Academic studies have highlighted the potential for price competition among potential
therapeutic substitutes. One study, analyzing 130 drugs launched between 1978 and 1987,
concluded that the number of exis ting drug substitutes had a significant downward effect on the
manufacturer’s launch price (not including rebates) of a new drug. 45 Another study, 46 analyzing
retail drug prices (before rebates) between 1995 and 1999, found that, of 20 drugs launched
within existing drug sub-classes, 13 were launched with at least a 5 percent discount relative to
the average price of the sub-class and several drugs saw discounts ranging as high as 30-40
percent.47 Another study found evidence that the later a new drug enters an existing class, the
lower the list price of that drug. 48
But list prices are not really the best lens for viewing prices, since in the United States much of
the price competition takes place in the form of confidential rebates negotiated between
manufacturers and payors.49. In these price negotiations, more competition among drugs
certainly does provide the payors with leverage, as one industry executive testified: “In general,
the level of the rebates increases if the PBM achieves a greater market share for a drug within a
defined class of prescriptions with similar therapeutic effects…Rebates are usually not provided
45 Lu and Comanor, “Strategic Pricing of New Pharmaceuticals”, Review of Economics and Statistics, 1998. 46 DiMasi, “Price Trends for Prescription: Pharmaceuticals” Report for HHS Conference on Pharmaceutical Pricing Practices, Utilization and Costs, 2000. Note impact of rebates were not included in this analysis 47 Five of the drug launches were at the same approximately the same price as the existing drugs in the sub-class, although it is worth noting that four of these drugs were in the same sub-class in which new entrants were basically launched at parity (before rebates). 48 Danzon, Chao “Cross national price differences for pharmaceuticals: how large and why?” Journal of Health Economics 19 (2000) 159-195. This study also found that a higher numb er of drugs in a class had no statistically significant effect on manufacturer list prices. 49 In our model, we allow for an average U.S. rebate of 11 percent, based on an evaluation of various public data sources including: (1) Abrams, Lawrence “Estimating the Rebate-Retention Rate of Pharmacy Benefits Managers”, April 22, 2003; (2) CMS; (3) CBO; (4) Van Oehsen, William H. “Pharmaceutical discounts Under Federal Law: State Program Opportunities”, Public Health Institute, May 2001.
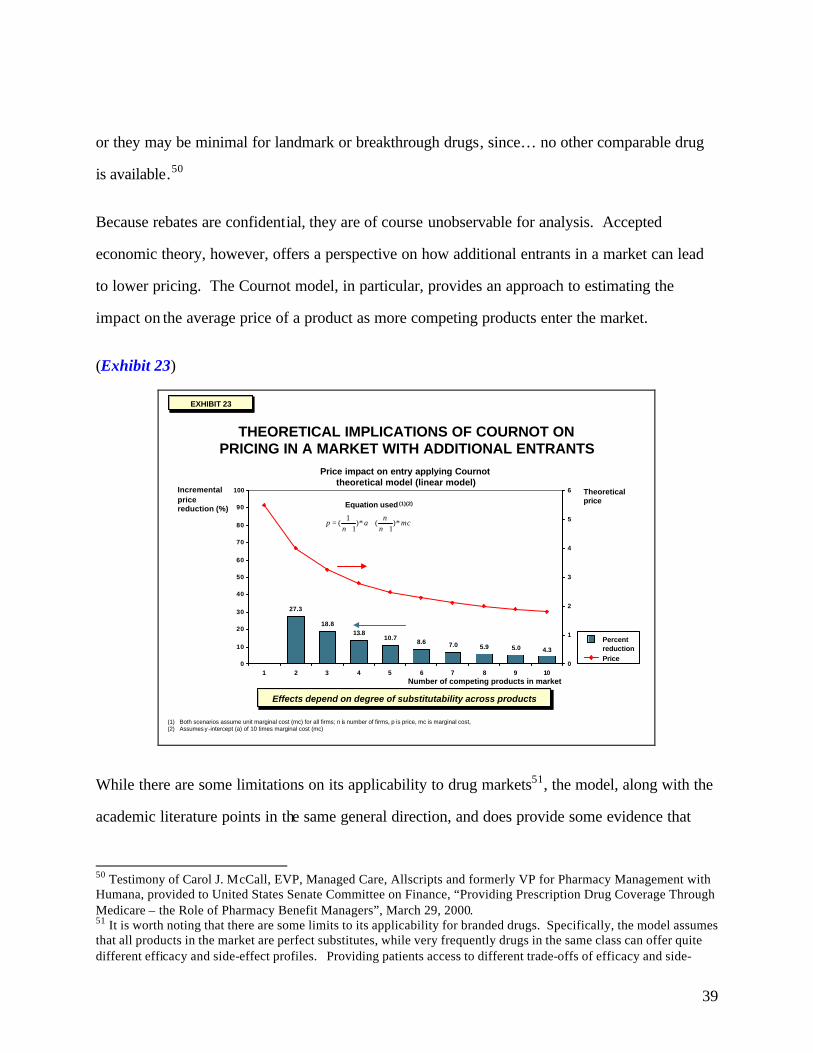
39
or they may be minimal for landmark or breakthrough drugs, since… no other comparable drug
is available.50
Because rebates are confidential, they are of course unobservable for analysis. Accepted
economic theory, however, offers a perspective on how additional entrants in a market can lead
to lower pricing. The Cournot model, in particular, provides an approach to estimating the
impact on the average price of a product as more competing products enter the market.
(Exhibit 23)
EXHIBIT 24EXHIBIT 24
THEORETICAL IMPLICATIONS OF COURNOT ON PRICING IN A MARKET WITH ADDITIONAL ENTRANTS
27.3
18.813.8
10.78.6 7.0 5.9 5.0 4.3
0
10
20
30
40
50
60
70
80
90
100
1 2 3 4 5 6 7 8 9 100
1
2
3
4
5
6
Price impact on entry applying Cournot theoretical model (linear model)
Theoreticalprice
Number of competing products in market
mcn
na
np *)
1(*)
11
(+
++
=
Equation used (1)(2)
Incremental price reduction (%)
(1) Both scenarios assume unit marginal cost (mc) for all firms; n is number of firms, p is price, mc is marginal cost,(2) Assumes y -intercept (a) of 10 times marginal cost (mc)
Percent reductionPrice
Effects depend on degree of substitutability across productsEffects depend on degree of substitutability across products
EXHIBIT 23EXHIBIT 23
While there are some limitations on its applicability to drug markets51, the model, along with the
academic literature points in the same general direction, and does provide some evidence that
50 Testimony of Carol J. McCall, EVP, Managed Care, Allscripts and formerly VP for Pharmacy Management with Humana, provided to United States Senate Committee on Finance, “Providing Prescription Drug Coverage Through Medicare – the Role of Pharmacy Benefit Managers”, March 29, 2000. 51 It is worth noting that there are some limits to its applicability for branded drugs. Specifically, the model assumes that all products in the market are perfect substitutes, while very frequently drugs in the same class can offer quite different efficacy and side-effect profiles. Providing patients access to different trade-offs of efficacy and side-
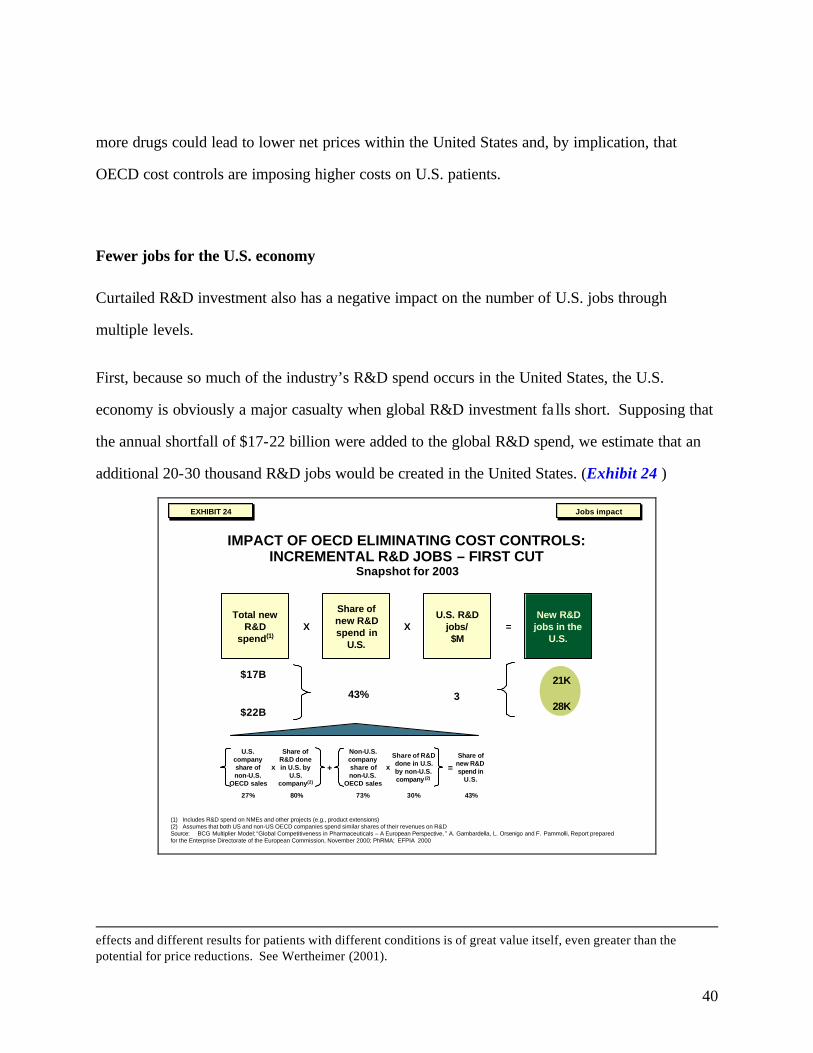
40
more drugs could lead to lower net prices within the United States and, by implication, that
OECD cost controls are imposing higher costs on U.S. patients.
Fewer jobs for the U.S. economy
Curtailed R&D investment also has a negative impact on the number of U.S. jobs through
multiple levels.
First, because so much of the industry’s R&D spend occurs in the United States, the U.S.
economy is obviously a major casualty when global R&D investment fa lls short. Supposing that
the annual shortfall of $17-22 billion were added to the global R&D spend, we estimate that an
additional 20-30 thousand R&D jobs would be created in the United States. (Exhibit 24 )
EXHIBIT 25EXHIBIT 25
IMPACT OF OECD ELIMINATING COST CONTROLS: INCREMENTAL R&D JOBS – FIRST CUT
Snapshot for 2003
Jobs impactJobs impact
Total newR&D
spend(1)X
U.S. R&D jobs/$M
XNew R&D
jobs in the U.S.
=
Share of new R&D spend in
U.S.
43% 3
21K
28K
$17B
$22B
(1) Includes R&D spend on NMEs and other projects (e.g., product extensions)(2) Assumes that both US and non-US OECD companies spend similar shares of their revenues on R&DSource: BCG Multiplier Model; “Global Competitiveness in Pharmaceuticals – A European Perspective, ” A. Gambardella, L. Orsenigo and F. Pammolli, Report prepared for the Enterprise Directorate of the European Commission, November 2000; PhRMA; EFPIA 2000
27%
U.S. company share of non-U.S.
OECD sales
Share of R&D done in U.S. by
U.S. company(2)
+
Non-U.S. company share of non-U.S.
OECD sales
Share of R&D done in U.S. by non-U.S. company (2)
x x =
80% 73% 30%
Share of new R&D spend in
U.S.
43%
EXHIBIT 24EXHIBIT 24
effects and different results for patients with different conditions is of great value itself, even greater than the potential for price reductions. See Wertheimer (2001).
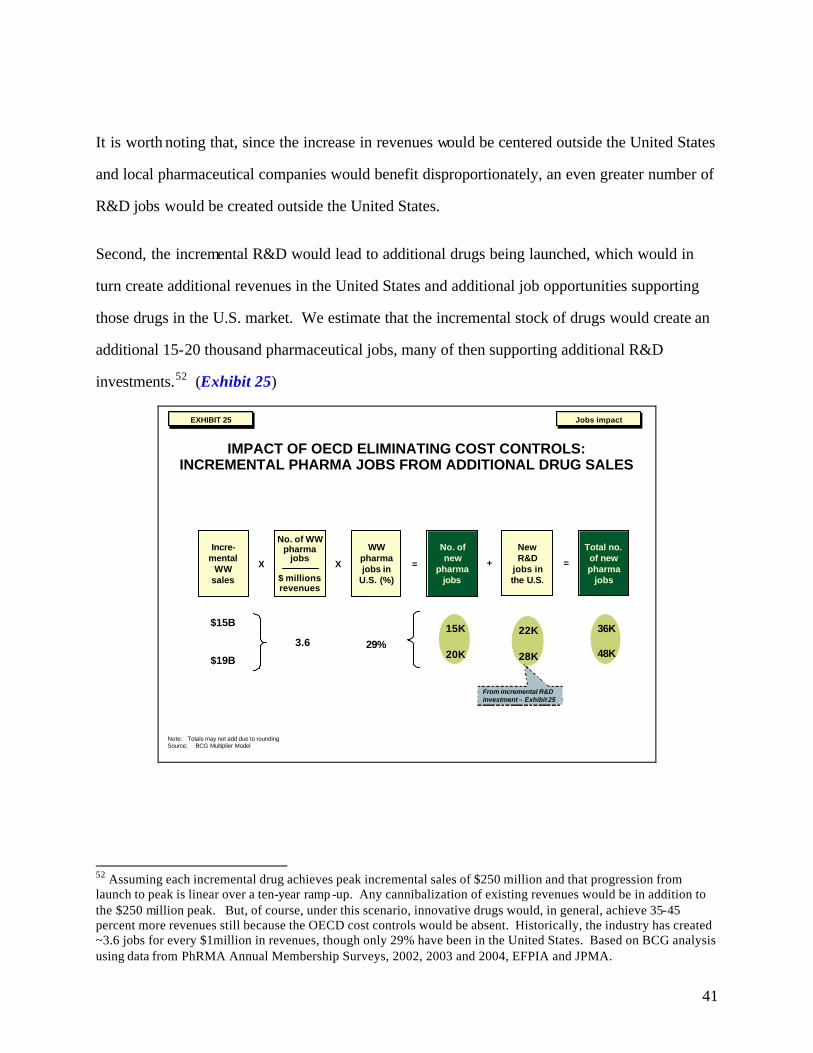
41
It is worth noting that, since the increase in revenues would be centered outside the United States
and local pharmaceutical companies would benefit disproportionately, an even greater number of
R&D jobs would be created outside the United States.
Second, the incremental R&D would lead to additional drugs being launched, which would in
turn create additional revenues in the United States and additional job opportunities supporting
those drugs in the U.S. market. We estimate that the incremental stock of drugs would create an
additional 15-20 thousand pharmaceutical jobs, many of then supporting additional R&D
investments.52 (Exhibit 25)
EXHIBIT 26EXHIBIT 26
IMPACT OF OECD ELIMINATING COST CONTROLS: INCREMENTAL PHARMA JOBS FROM ADDITIONAL DRUG SALES
X X =
Incre-mental
WW sales
No. of WWpharma
jobs
$ millions revenues
WW pharma jobs in
U.S. (%)
No. of new
pharma jobs
3.6 29%
15K
20K
$15B
$19B
+ =
New R&D
jobs in the U.S.
Total no. of new pharma
jobs
36K
48K
22K
28K
Jobs impactJobs impact
From incremental R&D investment – Exhibit 25
Note: Totals may not add due to roundingSource: BCG Multiplier Model
EXHIBIT 25EXHIBIT 25
52 Assuming each incremental drug achieves peak incremental sales of $250 million and that progression from launch to peak is linear over a ten-year ramp -up. Any cannibalization of existing revenues would be in addition to the $250 million peak. But, of course, under this scenario, innovative drugs would, in general, achieve 35-45 percent more revenues still because the OECD cost controls would be absent. Historically, the industry has created ~3.6 jobs for every $1million in revenues, though only 29% have been in the United States. Based on BCG analysis using data from PhRMA Annual Membership Surveys, 2002, 2003 and 2004, EFPIA and JPMA.
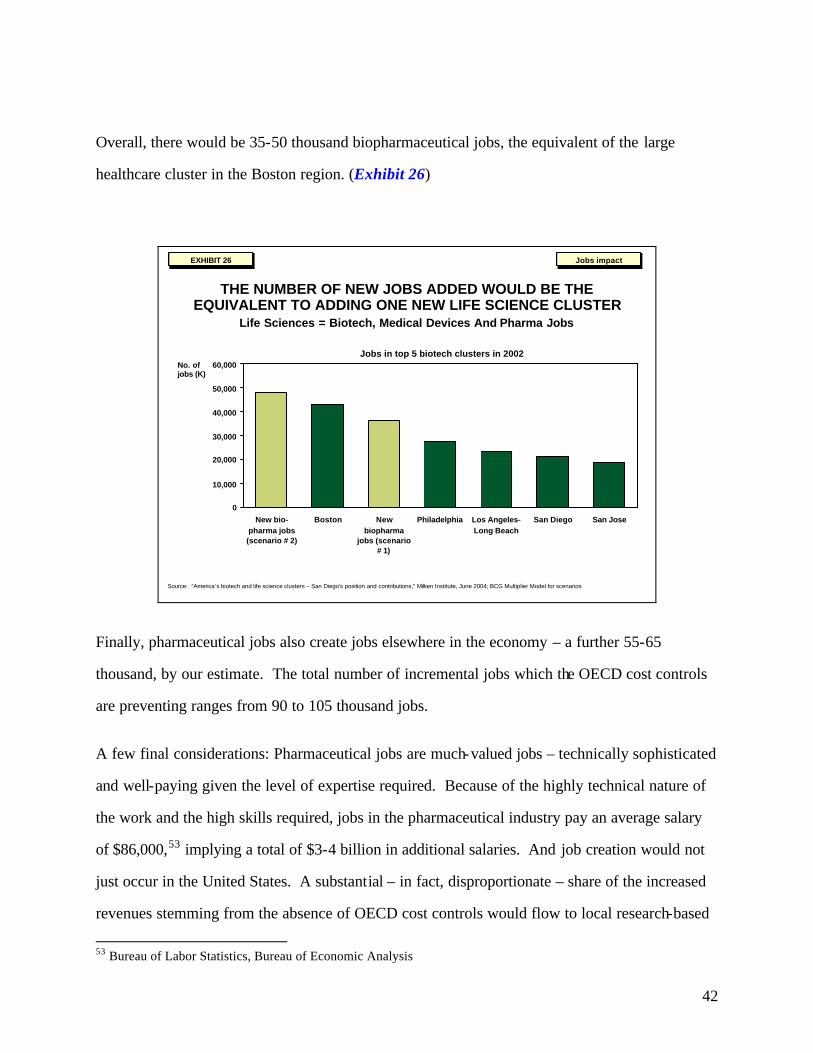
42
Overall, there would be 35-50 thousand biopharmaceutical jobs, the equivalent of the large
healthcare cluster in the Boston region. (Exhibit 26)
EXHIBIT 27EXHIBIT 27
THE NUMBER OF NEW JOBS ADDED WOULD BE THE EQUIVALENT TO ADDING ONE NEW LIFE SCIENCE CLUSTER
Life Sciences = Biotech, Medical Devices And Pharma Jobs
Jobs impactJobs impact
Source: “America’s biotech and life science clusters – San Diego's position and contributions,” Milken Institute, June 2004; BCG Multiplier Model for scenarios
0
10,000
20,000
30,000
40,000
50,000
60,000
New bio-pharma jobs(scenario # 2)
Boston Newbiopharma
jobs (scenario# 1)
Philadelphia Los Angeles-Long Beach
San Diego San Jose
Jobs in top 5 biotech clusters in 2002No. of jobs (K)
EXHIBIT 26EXHIBIT 26
Finally, pharmaceutical jobs also create jobs elsewhere in the economy – a further 55-65
thousand, by our estimate. The total number of incremental jobs which the OECD cost controls
are preventing ranges from 90 to 105 thousand jobs.
A few final considerations: Pharmaceutical jobs are much-valued jobs – technically sophisticated
and well-paying given the level of expertise required. Because of the highly technical nature of
the work and the high skills required, jobs in the pharmaceutical industry pay an average salary
of $86,000,53 implying a total of $3-4 billion in additional salaries. And job creation would not
just occur in the United States. A substantial – in fact, disproportionate – share of the increased
revenues stemming from the absence of OECD cost controls would flow to local research-based
53 Bureau of Labor Statistics, Bureau of Economic Analysis
43
pharmaceutical companies in the OECD, encouraging them to invest further in R&D and create
new jobs locally – not just R&D jobs, but also jobs supporting the commercialization of the
resulting increment in patented drugs.
44
Appendix 1 – Methodology
Introduction
Our assessment of the impact of OECD government interventions derives from the analysis and
modeling that we conducted on a set of volume and price data for a sample of drug classes and
for a sample of eight countries – complemented by existing literature and macro-economic data.
More specifically, this report draws on four main streams of research:
1) Analysis and modeling based on primary data from IMS, focusing on four disease
areas54 and selective anti-cancer agents55
2) A variety of secondary sources, such as academic publications and government
reports.
3) A detailed review of the approaches taken by a sample of OECD countries to
controlling drug costs: Canada, France, Germany, Japan, Poland, Spain, and the
United Kingdom, as well as the United States.
4) A series of interviews with pharmaceutical executives
The purpose of this Appendix is to give a technical explanation of the first of these streams – the
items of data, the selection of samples, and the analytical methods.
54 Diabetes, hyperlipidimia, schizophrenia and depression 55 Gleevec and Herceptin
45
Data
Sources
The volume and price data used in this study are for the period 1992-2003 from IMS Health, a
global pharmaceutical market research company (it was in 1992 that fully reliable and
comprehensive data first became available from IMS). The data are drawn from the IMS Midas
and Medical panel databases, supplemented by the IMS institutional sales panel.
- The Midas data report sales through pharmacies, which for most products account for over
80 percent of sales in each country.
- The Medical panel data were used to correct for differences in prescribing patterns across
different drugs – differences that could otherwise skew results.
- The institutional sales panel was used to analyze those drugs that are administered mainly in
institutional settings – some cancer drugs, for instance.
We also used the Evaluate drug sales database56 where noted below, as well as disease-
prevalence data from various sources.57
Volume units
For volume of sales or consumption of any particular drug, we used the measure “days of
treatment per diagnosed.” It is calculated in the following way: We take standard units (single
recommended dosage) as a starting point. The various other measures available, such as pack
size or grams of active ingredient, all suffer from systematic aberrations.58 We then refine this
56 The Evaluate database contains net sales as reported in the financial statements of pharmaceutical manufacturers. It also contains useful details on each molecule, such as pharmacological class and technology (biotech, for example). The database is maintained by the British pharmaceutical data company Evaluate plc. 57 For instance, the Diabetes World Atlas for diabetes prevalence, and several official sources for OECD economic and health care data. For a full list of sources, see the bibliography. 58 See Danzon, Wang and Wang (2003) “Data and methodology” section for a review of the issues with these alternative measures
46
measure by correcting for different average daily doses across drugs. Otherwise, a “twice-a-day”
drug might appear to provide greater volume of treatment than a “once-a-day” drug, for example.
Finally, we correct for differing levels of prevalence across countries, by using a “per diagnosed”
basis as opposed to a “per capita” basis for our metrics.
Currency units
Throughout our analysis, we use U.S. dollars as our unit. To convert local currencies into
dollars, we used a dynamic exchange rate – the prevalent exchange rate for each time period –
rather than a fixed exchange rate, and thereby smoothed out the changes over time that result
from currency fluctuations. By contrast, using a constant exchange rate over a long period of
time builds in systematic differences, and complicates the task of comparing prices across
countries. Note, however, that it would not affect our analysis substantially.
Sample
Sample countries
Our analysis focused on seven (out of a possible 29) non-U.S. countries as a representative
sample of the OECD: the United Kingdom, Germany, France, Spain, Poland, Canada, and Japan.
This sample was carefully selected to ensure the following features: a large overall share of the
OECD population and economy, a mix of higher- and lower- income countries, and a mix of
drug-cost control strategies. The marginal refinement that any additional country might have
provided was far outweighed by the data acquisition costs involved. Our sample is an ample
one, representing: 61 percent of the total non-U.S. OECD GDP, 65 percent of the total non-U.S.
OECD health care spend, and 51 percent of the total non-U.S. OECD population. (If you include
the United States in the calculation, the figures are then 75 percent of the total OECD GDP, 80
percent of the total OECD health care spend, and 65 percent of the total OECD population.)
47
Sample disease categories
Our sample disease categories (which can encompass several drug classes) are anti-diabetics,
anti-psychotics, anti-depressants, and anti-hyperlipidemics, as well as a pair of innovative
oncology drugs. We arrived at this selection of samples by applying a set of objective criteria to
the Evaluate database. We first ranked all drug classes according to two measures: the level of
innovation, as measured by the lifetime-projected sales of drugs launched since 1992; and the
presence of large patent expiries. A shortlist of six classes emerged, from which we discarded
two: hypertension, because it was already a very mature market in 1992 (the earliest year for
which IMS data are available), and because the large number of drugs made it an extremely
expensive category to study; and drugs for treating Acid Reflux disease, because recent
developments there – for instance, the launch of Nexium and the shift of Prevacid to over-the-
counter – have not yet had a chance to play out across the OECD. Hence, our remnant of four
main classes, all of them chronic categories. To this selection we then added a pair of oncology
drugs, to represent breakthrough therapies and an acute category. The two oncology drugs were
selected on the basis of conversations with physicians, who highlighted them as particularly
innovative. The selected therapeutic categories jointly represent about 14 percent of the total
global pharmaceutical market.59
Analysis
Using the IMS data, we developed a composite view of “per-patient product life-cycle revenue
curves” for the OECD countries, singly and jointly, and for the United States. Each view is
represented as a curve, and what it maps out is, essentially, the revenues for a “typical”
innovative drug in each year. The sum of the area under the curve represents the total
59 Based on 2002 revenues as estimated by IMS audited worldwide revenue data. Total worldwide revenues are $400 billion, while the sum of anti-cholesterol (ranked #2, $21.7 billion), anti-depressants (ranked #3, $17.1 billion), anti-psychotics (ranked #6, $9.5 billion) and oral anti-diabetes drugs (ranked #8, $8.0 billion) is $56 billion. Analysis does not include the two oncology drugs we analyzed which would have marginal impact.
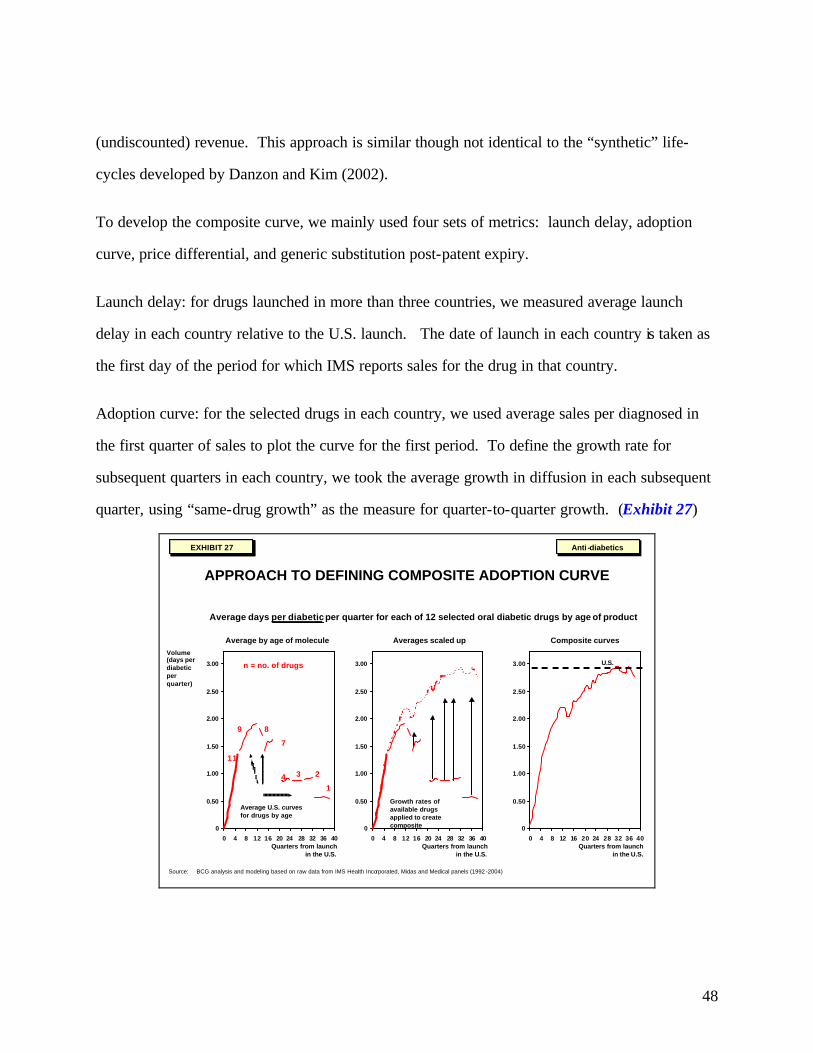
48
(undiscounted) revenue. This approach is similar though not identical to the “synthetic” life-
cycles developed by Danzon and Kim (2002).
To develop the composite curve, we mainly used four sets of metrics: launch delay, adoption
curve, price differential, and generic substitution post-patent expiry.
Launch delay: for drugs launched in more than three countries, we measured average launch
delay in each country relative to the U.S. launch. The date of launch in each country is taken as
the first day of the period for which IMS reports sales for the drug in that country.
Adoption curve: for the selected drugs in each country, we used average sales per diagnosed in
the first quarter of sales to plot the curve for the first period. To define the growth rate for
subsequent quarters in each country, we took the average growth in diffusion in each subsequent
quarter, using “same-drug growth” as the measure for quarter-to-quarter growth. (Exhibit 27)
EXHIBIT 28EXHIBIT 28
APPROACH TO DEFINING COMPOSITE ADOPTION CURVE
0
0.50
1.00
1.50
2.00
2.50
3.00
0 4 8 12 16 20 24 28 32 36 40
Volume(days per diabetic per quarter)
11
8
3
1
Average days per diabeticper quarter for each of 12 selected oral diabetic drugs by age of product
Growth rates of available drugs applied to create composite
Averages scaled up
Quarters from launchin the U.S.
Quarters from launchin the U.S.
U.S.
Composite curves
Quarters from launchin the U.S.
Average U.S. curvesfor drugs by age
n = no. of drugs
9
7
24
Average by age of molecule
0
0.50
1.00
1.50
2.00
2.50
3.00
0 4 8 12 16 20 24 28 32 36 40
0
0.50
1.00
1.50
2.00
2.50
3.00
0 4 8 12 16 20 24 28 32 36 40
Anti-diabeticsAnti -diabetics
Source: BCG analysis and modeling based on raw data from IMS Health Incorporated, Midas and Medical panels (1992 -2004)
EXHIBIT 27EXHIBIT 27
49
To develop the curve for the OECD countries jointly, we used a disease-prevalence-weighted
average.
Price differential: across a number of drugs and classes, the average price difference between the
OECD countries and the United States remained reasonably stable. Our measure was a simple
average price of dosage strengths available in multiple countries indexed to the U.S. price. By
using that simple average price, we could correct for differences resulting from a mix of dosage
strengths.
Generic substitution: for all relevant examples, we calculated a “half- life” following patent
expiry, to model the lifecycle curve post patent. This measure was, unavoidably, based on
limited data, but that does not affect the overall picture significantly as it is also the least
sensitive part of the model, being further out in time and corresponding to a period of declining
sales.
Having created these composite curves, we were duly equipped to make the requisite comparison
for a typical innovative drug – its lifetime revenue stream per diagnosed patient in the U.S. and
OECD markets.
50
Appendix 2 – Bibliography
Abrams, (2003). “Estimating the Rebate-Retention Rate of Pharmacy Benefits Managers,”
http://www.nu-retail.com/.
Acemoglu, Linn, (2003). “Market Size in Innovation: Theory and Evidence From the Pharmaceutical
Industry,” NBER.
Blachier, “France – Pharmaceutical Pricing and Reimbursement,” LSE.
Boston Consulting Group, (2001). “A Revolution In R&D.”
Cleanthous, (2002). “Patient Welfare Implications of Innovation in the U.S. Antidepressant Market,” Yale
Dept. of Economics.
Corvari, “Canada – Pharmaceutical Pricing and Reimbursement,” LSE.
Danzon, Furukawa, (2003). “Prices and Availability of Pharmaceuticals: Evidence From Nine Countries,”
Health Affairs.
Danzon, Wang, Wang, (2003). “The Impact of Price Regulation on The Launch Delay of New Drugs –
Evidence from Twenty-Five Major Markets in the 1990s,” NBER.
Danzon, Pauly, (2002). “Health Insurance and the Growth in Pharmaceutical Expenditures,” U. Penn.
Danzon, Chao, (2000). “Cross National Price Differences for Pharmaceuticals: How Large and Why?,”
Journal of Health Economics.
Danzon, (1999). “Making Sense of Drug Prices,” Regulation.
Danzon, Kim, (1998). “International Price Comparisons For Pharmaceuticals,” Pharmacoeconomics.
Danzon, (1997). “Price Discrimination For Pharmaceuticals: Welfare Effects in US and EU,” IJEB.
DiMasi, (2000). “Price Trends for Prescription Pharmaceuticals: 1995-1999,” Tufts Center for the Study
of Drug Development.
Ernst & Young, (2003). “Health Care Systems and Health Market Reform in the G20 Countries,” World
Economic Forum.
Ernst & Young, (2004). “Resurgence: America’s Perspective Global Biotechnology Report.”
Ess, Schneeweiss, Szucz, (2003). “European Healthcare Policies For Controlling Drug Expenditures,”
Pharmacoeconomics.
Frank, Berndt, Busch (2003). “Quality-Constant Price Indexes for the Ongoing Treatment of
Schizophrenia: An Exploratory Study,” NBER.
Ganslandt, Maskus, (2003). “The Price Impact of Parallel Trade in Pharmaceutical Products: Evidence
from the European Union.”
51
Giaccotto, Santerre, Vernon, (2003). “Explaining Pharmaceutical R&D Growth Rates at the Industry
Level: New Perspectives and Insights,” Joint Center.
Gilbert, Rosenberg, (2004). “Imbalanced Innovation: The Cost of Europe’s ‘Free Ride’,” In Vivo.
Grabowski, (2002). “Patents, Innovation and Access to New Pharmaceuticals,” Duke Working Paper.
Grabowski, Vernon, DiMasi, (2002). “Returns on R&D for 1990s New Drug Introductions,” Tufts.
Grabowski, (1994). “Health Reform and Pharmaceutical Innovation,” AEI.
Graham, (2002). “Fantasy of Reference Pricing and the Promise of Choice in BC’s Pharmacare,” Fraser
Institute Public Policy.
Grubert, (2004). “International Review of Pharmacoeconomic, Pricing and Reimbursement News in the
Second Half of 2003,” Decision Resources.
Kanavos, Costa-i-Font, Merkur, Gemmill, (2004). “Economic Impact of Pharmaceutical Parallel Trade
in European Union Member States: A Stakeholder Analysis,” LSE.
Kanavos, (2000). “Pharmaceutical regulation in Europe,” Informa Group plc.
Kullman, (2003). “United Kingdom - Pharmaceutical Pricing and Reimbursement Policies,” LSE.
Kyle, (2003). “Pharmaceutical Price Controls and Entry Strategies,” CMU.
Kyle, (2003). “Role of Firm Characteristics in Pharmaceutical Product Launches,” CMU.
Kyle, (2002). “Entry in Pharmaceutical Markets,” CMU.
Lichtenberg, (2004). “The Expanding Pharmaceutical Arsenal in the War on Cancer,” Columbia
University.
Lichtenberg, (2003). “The Impact of Drug Launches on Longevity: Evidence from Longitudinal, Disease-
Level Data from 52 Countries, 1982-2001,” NBER.
Lichtenberg, (2002). “Benefits and Costs of Newer Drugs: An Update,” NBER.
Love, (2003). “Evidence Regarding R&D Investments in Innovative and Non-Innovative Medicines,”
CPT.
Lu, Comanor, (1998). “Strategic Pricing of New Pharmaceuticals,” Review of Economics and Statistics.
Montoro, “Spain – Pricing and Reimbursement of Pharmaceuticals,” LSE.
Murphy, Topel, (2003). Measuring the Gains from Medical Research: An Economic Approach, The
University of Chicago Press.
Nesbitt, (2000). “Pricing of Prescription Drugs,” USITC.
none, “Germany – Pharmaceutical Pricing and Reimbursement Policies,” LSE.
none, “Japan – Pricing and Regulation of Pharmaceuticals,” LSE.
none, (2004). “PhRMA 2004 report,” PhRMA.
none, (2004) 14th Annual Wachovia Securities Nantucket Equity Conference
http://www.corporate-ir.net/ireye/ir_site.zhtml?ticker=MHS&script=400.
52
none, (2003). “World Pharmaceutical Market Spain,” Epsicom Business Intelligence.
none, (2003). “World Pharmaceutical Markets – Japan,” Epsicom Business Intelligence.
none, (2003). “Pharmaceutical Administration and Regulations in Japan,” JPMA.
none, (2002). Annual Report 2002 of the Patented Medicine Prices Review Board, Canada.
none, (2002). “PPRS: The Study into the Extent of Competition in the Supply of Branded Medicines to the NHS,” Department of Health and the Association of the British Pharmaceutical Industry.
none, (2002). Farmaindustria Annual Report.
none, (2002). “Changing Patterns of Pharmaceutical Innovation,” NIHCM.
none, (2001) “The Orphan Drug Act Implementation and Impact,” Department Of Health and Human
Services.
none, (2001) Testimony of Carol J. McCall provided to United States Senate Committee on Finance,
“Providing Prescription Drug Coverage Through Medicare – the Role of Pharmacy Benefit
Managers.”
none, (2000). “Pricing of Prescription Drugs,” U.S. International Trade Commission.
Scherer, (2001). “Link Between Gross Profitability and Pharmaceutical R&D Spending,” Health Affairs.
Schweitzer, (1997). “Pharmaceutical Economics and Policy,” Oxford University Press.
Smith, (2004). “Retail Prescription Drug Spending in the National Health Accounts,” Health Affairs.
Van Oehsen, (2001). “Pharmaceutical Discounts Under Federal Law: State Program Opportunities,” Public Health Institute.
Vernon, (2004). “Examining the Link Between Price Regulation, Reimportation and Pharmaceutical
R&D Investment,” Joint Center.
Vernon, (2003). “Simulating Impact of Price Regulation on Pharmaceutical Innovation,” Pharm dev regul.
Vernon, (2002). “Drug Research and Price Controls,” Health and Medicine.
Veviel, Perry, Pavlovsky, (2003). “Mining for Profits: We Initiated Coverage of the Pharmacy benefit
Manager Industry,” Wachovia Securities.
Walde, Choi, Higgins, (2003). “Heath Care Industry Market Update,” Centers for Medicare and Medicaid
Services.
Wertheimer, Levy, O’Connor, (2001). “Too many drugs? The clinical and economic value of incremental
Innovations,” Investing in Health: The Social and Economic Benefits of Health Care Innovation.
Wilson et al, (2003). “Model to Assess the Cost Effectiveness of Statins in Achieving the UK National
Service Framework Target Cholesterol Levels,” Pharmacoeconomics.
Youman, Wilso, Harraf, Kalra, (2003). “The Economic Burden of Stroke in UK,” Pharmacoeconomics.
Young, Surrusco, (2001). “Rx R&D Myths: The Case Against the Drug Indystry’s R&D ‘Scare Card,’”
Public Citizen.
AmsterdamAthensAtlantaAucklandBangkokBarcelonaBeijingBerlinBostonBrusselsBudapestBuenos AiresChicagoCologneCopenhagenDallasDüsseldorfFrankfurt HamburgHelsinkiHong Kong
HoustonIstanbulJakartaKuala LumpurLisbonLondonLos AngelesMadridMelbourneMexico CityMiamiMilan MonterreyMoscowMumbaiMunichNagoyaNew DelhiNew YorkOsloParis
PragueRomeSan FranciscoSantiagoSão PauloSeoulShanghaiSingaporeStockholmStuttgartSydneyTaipeiTokyoTorontoViennaWarsawWashingtonZürich
www.bcg.com
BCG