CCTV Camera,Dome camera,outdoor Camera,Wireless Camera, Spy Camera in India

AdvancingtheFutureofHealthcare
2013AnnualReport

2013 was a year of strategic focus for CONMED Corporation as we
navigated a challenging global operating environment. We achieved
a number of key accomplishments in 2013 that reflect our team’s
hard work and position the Company for future success. While our
top-line growth was short of what we had anticipated at the start
of 2013, we adjusted expense levels to deliver earnings within our
forecasted range. This is a tribute to the Company’s talented team,
which produced results despite a soft worldwide economy. During
the year, we launched new products, continued to support R&D
activities, and restructured manufacturing.
In 2014 there has been a number of important changes and
developments at CONMED that added to the changes we started to
make in 2013 with the addition of Brian Concannon and Dirk Kuyper
to the Board. Effective as of March 1, 2014, we added Jerome
Lande and Curt Hartman to the Board. At this time, Bruce Daniels
and Stuart Schwartz announced they would be retiring from the
Board. We wish to thank them for their significant contributions
over the years. Then, in July, the Board appointed Curt Hartman,
an independent director of the Company, as Interim Chief Executive
Officer following the decision by Joe Corasanti to step down as
President and Chief Executive Officer and a member of the Board
of Directors. In addition, Gene Corasanti, the founder of CONMED,
decided to retire from the Board and as an employee after 44 years
of service to the Company.
Joe’s leadership was instrumental in growing CONMED into a
leading global supplier of medical technology devices. Under his
tenure, the Company expanded revenues, earnings, cash flow
and its return to shareholders through internal growth and the
completion of more than twenty acquisitions. We are also grateful
to Gene Corasanti, a true entrepreneur who founded the Company
in 1970 with one product idea and strategic vision that became the
foundation for the worldwide organization that CONMED is today.
We thank Joe and Gene for their many years of service and wish
them all the best.
The CONMED Board has formed an executive search committee
comprised of five independent directors that will immediately begin
a process to identify a permanent CEO. We intend to retain an
executive search firm to assist in the process.
Curt Hartman already has deep knowledge of CONMED’s business
and operations from more than 22 years of experience in the
medical device industry through his various executive roles at
Stryker Corporation. The Board is confident that Curt’s leadership
will help continue to position the company for future growth,
profitability and improved execution.
In addition to these changes, the Board also appointed a new
director, Charles Farkas. Charles is a Senior Partner at Bain &
Company and the former North American Head of Bain’s Healthcare
Practice. Charles has 35 years of experience advising executives in
the health care industry and he will serve as a member of the Audit
Committee as well as the Board’s executive search committee for
a permanent CEO. With the addition of Mr. Farkas, CONMED has
appointed five new independent board members since July of 2013.
We believe there are many opportunities ahead for the Company
to enhance operational execution, growth and profitability. With
several upcoming new product introductions and a strong, global
market presence, we believe CONMED is well-positioned for future
growth. In addition, the Board of Directors and management team
remain committed to driving shareholder value and we will continue
to take any actions that enable us to achieve this objective.
As always, thank you for your continued support.
Sincerely,
Mark Tryniski
Chairman of the Board
LetterToTheShareholdersAugust 8, 2014
To Our Shareholders:
CONMED Corporation

FinancialHighlightsNet Sales (in $ millions)
Sales CAGR = 2.4%
Adjusted Net Income (in $ millions)
2This amount represents adjusted net income excluding the $3.7 million impact of the medical device tax.
Adjusted Net Income CAGR = 14.8% Without the medical device tax in 2013, the Adjusted Net Income CAGR = 16.9%
2009 2010 2011 2012 2013 20132
$60.0
$50.0
$40.0
$30.0
$20.0
$10.0
$-
29.2
37.6
43.0
51.7
50.8
54.5
Reconciliation of Reported Net Income to Non-GAAP Net Income Before Adjusted Items and Amortization of Debt Discount1 (In thousands except per share amounts) (Unaudited) 2009 2010 2011 2012 2013Reported net income $ 12,137 $ 30,346 $ 752 $ 40,481 $ 35,939 ________ ________ ________ ________ ________Facility consolidation costs 12,704 2,397 3,467 7,052 6,489Costs associated with the termination of a product offering — 2,489 — — 2,137 ________ ________ ________ ________ ________ Total cost of sales 12,704 4,886 3,467 7,052 8,626 ________ ________ ________ ________ ________Administrative consolidation costs 4,080 2,176 792 6,497 8,750New plant/facility consolidation costs 2,726 — — — —Net pension gain (1,882 ) — — — —Product recall 5,992 — — — —Costs associated with the purchase of a distributor — — 300 704 —Costs associated with purchase of a business — — — 1,194 —Legal arbitration and patent dispute costs — — — 1,555 3,206Pension settlement costs — — — — 1,443 ________ ________ ________ ________ ________ Total other expense 10,916 2,176 1,092 9,950 13,399 ________ ________ ________ ________ ________Impairment of goodwill — — 60,302 — —Amortization of debt discount 4,111 4,244 3,903 — —(Gain) loss on early extinguishment of debt (1,083 ) 79 — — 263 ________ ________ ________ ________ ________Total adjusted expense before income taxes 26,648 11,385 68,764 17,002 22,288Provision (benefit) for income taxes on adjusted expense (9,633 ) (4,139 ) (26,515 ) (5,829 ) (7,473 ) ________ ________ ________ ________ ________Adjusted net income $ 29,152 $ 37,592 $ 43,001 $ 51,654 $ 50,754 ________ ________ ________ ________ ________ ________ ________ ________ ________ ________ Per share data:Reported net income Basic $ 0.42 $ 1.06 $ 0.03 $ 1.43 $ 1.30 Diluted 0.42 1.05 0.03 1.41 1.28
Adjusted net income Basic $ 1.00 $ 1.31 $ 1.52 $ 1.83 $ 1.83 Diluted 1.00 1.30 1.50 1.80 1.811 This table is provided to reconcile certain financial disclosures. Management has provided the above reconciliation of net income before adjusted items and amortization of debt discount as an additional measure that investors can use to compare operating performance between reporting periods. Management believes this reconciliation provides a useful presentation of operating performance.
2009 2010 2011 2012 2013
$780.0
$760.0
$740.0
$720.0
$700.0
$680.0
$660.0
$640.0
694.
7
713.
7 725.
1
767.
1
762.
7
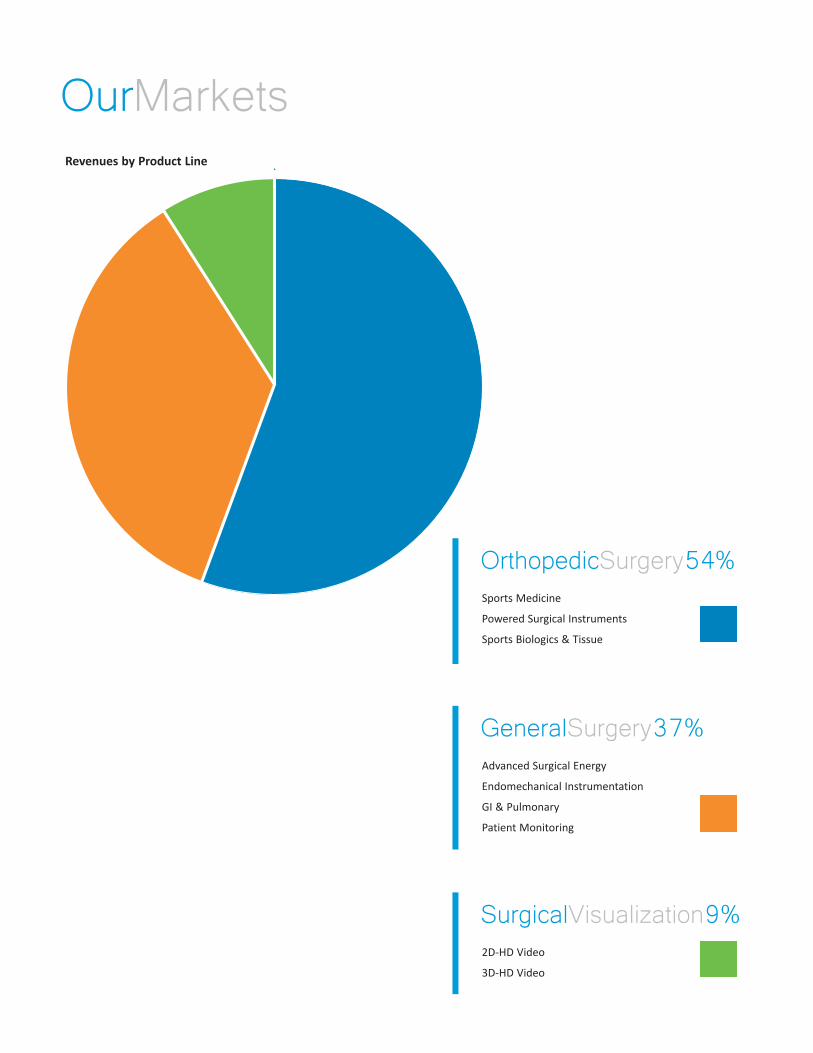
Sports Medicine
Powered Surgical Instruments
Sports Biologics & Tissue
OrthopedicSurgery54%
OurMarkets
Advanced Surgical Energy
Endomechanical Instrumentation
GI & Pulmonary
Patient Monitoring
GeneralSurgery37%
2D-HD Video
3D-HD Video
SurgicalVisualization9%
Revenues by Product Line

ProductSpotlight
Bipolar Arthroscopic RF System
Designed by RF technology innovators, CONMED’s new bi-polar RF Arthroscopic
Energy System offers a versatile, intuitive design and user interface for arthroscopic
ablation, coagulation and dissection. The system consists of a radio frequency
generator, bi-polar probes and optional wired or wireless foot controls. The
single-use bi-polar probes are engineered for shoulder, knee, hip and extremity
arthroscopy procedures and have the ability to change power settings from the
sterile field as well as measure joint fluid temperature.
EDGE™
All-Suture Anchor System for Instability
CONMED continues its history of innovation in shoulder arthroscopy with the
Y-Knot® Flex System for instability repairs. With the market’s smallest double
loaded all-suture anchor* and innovative instrumentation, this system was
designed to help surgeons achieve ideal anchor placement. The small size of these
anchors gives surgeons the option to implant more anchors and more sutures in
closer proximity to each other while the flexible instrumentation provides direct
access to the glenoid.
Y-Knot®FlexSystem
Self-Punching All-Suture Anchor System for Rotator Cuff
A true innovation, Y-Knot RC anchors are currently the world’s only self-punching
all-suture anchors for rotator cuff repairs. Designed to eliminate the trade-off of
traditional fixation methods, these anchors require less bone removal than larger
metal anchors, provide a simpler, self-punching technique compared to PEEK/
Biocomposite anchors and deliver greater pullout strength than other all-suture
anchors*. These anchors provide advantages in the soft bone of older patients and
when bone real estate is limited.
Y-Knot®RC
*Data on file.

Powered Instruments System
Built upon 50 years of dependable power and engineering expertise, the Hall 50
System combines precise performance, reliable power and convenient sterilization into
one solution that delivers unmatched value for hospitals, surgeons and OR staff. The
lighter, ergonomically-designed handpieces provide a comfortable, high-performance
clinical experience while the autoclavable lithium batteries deliver dependable, long-
lasting power. The unique, multi-tray system also provides hospitals with new levels of
sterilization convenience that have already proven valuable to clinicians.
Hall50™
True HD 3MOS Surgical Camera System and Direct LED Light Source
The new 2DHD Surgical Camera System continues CONMED’s reputation for high-
quality surgical visualization technology that’s both durable and dependable. The
new autoclavable camera head features best-in-class 3-chip 3MOS technology that
improves the processing of light to create a pure image with exceptional resolution.
The new LED light source also provides improved light sensitivity for clearer clinical
visualization. CF-rated for multi-specialty procedures, this newest visualization
technology is a versatile and cost-effective solution for hospitals and surgery centers.
2DHDSurgicalCameraSystem
Arthroscopic Resection System
CONMED’s next generation of powered instrument consoles for arthroscopic
resection, the new D4000 has intuitive features that deliver new levels of simplicity,
versatility and performance. Designed with an easy-to-use interface, the touch screen
displays allow users to quickly and simply adjust a wide range of settings while the
dual handpiece ports deliver plug and play convenience. The D4000 is also directly
integrated with CONMED’s 24k® Pump to automatically detect and adjust fluid levels,
helping to maintain the surgical site and aid clinical visualization.
D4000™
ProductSpotlightCont.

Board Members
Mark E. Tryniski Chairman of the Board of Directors
Brian Concannon Director
Bruce F. Daniels Director
Charles M. Farkas Director
Jo Ann Golden Director
Curt R. Hartman Interim Chief Executive Officer & Director
Dirk M. Kuyper Director
Jerome J. Lande Director
Stephen M. Mandia Director
Stuart J. Schwartz Director
Corporate Officers
Curt R. Hartman Interim Chief Executive Officer & Director
William W. Abraham Executive Vice President, Business Development
Terence M. Bergé Corporate Vice President, Treasurer & Assistant Controller
Heather L. Cohen, Esq. Executive Vice President, Human Resources, Deputy General Counsel & Secretary
Joseph G. Darling Executive Vice President, Commercial Operations
Daniel S. Jonas, Esq. Executive Vice President, Legal Affairs & General Counsel
Gregory R. Jones Executive Vice President, Quality Assurance/Regulatory Affairs
Luke A. Pomilio Executive Vice President, Controller & Corporate General Manager
Robert D. Shallish, Jr. Executive Vice President, Finance & Chief Financial Officer
Mark D. Snyder Executive Vice President, Manufacturing Operations & Supply Chain
Shareholder Information
Interested shareholders may obtain a copy of the Company’s Annual Report without charge upon written request to:
Investor Relations Department CONMED Corporation 525 French Road Utica, NY 13502
Transfer Agent/Registrar Registrar and Transfer Company 10 Commerce Drive Cranford, NJ 07016 800-368-5948 www.rtco.com
Corporate Office
CONMED Corporation 525 French Road Utica, NY 13502 Phone (315) 797-8375 Fax (315) 797-0321 Customer Service 1-800-448-6506 email: [email protected] website: www.conmed.com
Ethics Policy Available at www.conmed.com
Stock
CONMED Corporation’s stock is traded on the NASDAQ Global Select Stock Market with the symbol: CNMD
Independent Registered Public Accounting Firm PricewaterhouseCoopers LLP 677 Broadway Albany, NY 12207
General Counsel Daniel S. Jonas, Esq. 525 French Road Utica, NY 13502
Special Counsel Sullivan & Cromwell, LLP 125 Broad Street New York, NY 10004
CorporateInformation

United StatesSecurities and Exchange Commission
Washington, D.C.20549
Form 10-KAnnual Report Pursuant to Section 13 or 15(d) of
the Securities Exchange Act of 1934
For the fiscal year ended December 31, 2013 Commission file number 0-16093
CONMED CORPORATION(Exact name of registrant as specified in its charter)
New York 16-0977505(State or other jurisdiction of incorporation or organization) (I.R.S. Employer Identification No.)
525 French Road, Utica, New York 13502(Address of principal executive offices) (Zip Code)
(315) 797-8375(Registrant's telephone number, including area code)
Securities registered pursuant to Section 12(g) of the Act:
Common Stock, $.01 par value per share
(Title of class)
Indicate by check mark if the registrant is a well-known seasoned issuer (as defined in Rule 405 of the Securities Act).Yes No
Indicate by check mark if the registrant is not required to file reports pursuant to Section 13 or Section 15(d) of the Exchange Act.Yes No
Indicate by check mark whether the registrant (1) has filed all reports required to be filed by Section 13 or 15(d) of the Securities Exchange Act of 1934 during the preceding 12 months (or for such shorter period that the registrant was required to file such reports), and (2) has been subject to such filing requirements for the past 90 days.Yes No
Indicate by check mark whether the registrant has submitted electronically and posted on its corporate Web site, if any, every Interactive Data File required to be submitted and posted pursuant to Rule 405 of Regulation S-T (§232.405 of this chapter) during the preceding 12 months (or for such shorter period that the registrant was required to submit and post such files). Yes No
Indicate by check mark if disclosure of delinquent filers pursuant to Item 405 of Regulation S-K is not contained herein, and will not be contained, to the best of registrant's knowledge, in definitive proxy or information statements incorporated by reference in Part III of this Form 10-K or any amendment to this Form 10-K.
Indicate by check mark whether the registrant is a large accelerated filer, an accelerated filer, a non-accelerated filer, or a smaller reporting company. See the definitions of “accelerated filer and large accelerated filer” in Rule 12b-2 of the Exchange Act (Check one).
Large accelerated filer Accelerated filer Non-accelerated filer Smaller reporting company Indicate by check mark whether the registrant is a shell company (as defined in Rule 12b-2 of the Exchange Act).
Yes No
As of June 30, 2013, the last business day of the registrant’s most recently completed second fiscal quarter, the aggregate market value of the shares of voting common stock held by non-affiliates of the registrant was approximately $861,668,334 based upon the closing price of the Company’s common stock on the NASDAQ Stock Market.
The number of shares of the registrant's $0.01 par value common stock outstanding as of February 19, 2014 was 27,206,496.
DOCUMENTS INCORPORATED BY REFERENCE:
Portions of the Definitive Proxy Statement or other informational filing for the 2014 Annual Meeting of Shareholders are incorporated by reference into Part III of this report.

1
CONMED CORPORATIONANNUAL REPORT ON FORM 10-K
FOR YEAR ENDED DECEMBER 31, 2013 TABLE OF CONTENTS
Part I
Page Item 1.Item 1A.Item 2.Item 3.Item 4.
Part II Item 5.
Item 6.Item 7.
Item 7A.
Item 8.Item 9.
Item 9A.Item 9B. Part III Item 10.Item 11.Item 12.
Item 13.
Item 14. Part IV Item 15.
Business 2Risk Factors 9Properties 15Legal Proceedings 15Mine Safety Disclosures 16
Market for Registrant's Common Equity, Related StockholderMatters and Issuer Purchases of Equity Securities 16
Selected Financial Data 19Management's Discussion and Analysis of Financial
Condition and Results of Operations 21Quantitative and Qualitative Disclosures About
Market Risk 31Financial Statements and Supplementary Data 32Changes In and Disagreements with Accountants on
Accounting and Financial Disclosure 32Controls and Procedures 32Other Information 32
Directors, Executive Officers and Corporate Governance 33Executive Compensation 33Security Ownership of Certain Beneficial Owners and
Management and Related Stockholder Matters 33Certain Relationships and Related Transactions, and Director
Independence 33Principal Accounting Fees and Services 33
Exhibits, Financial Statement Schedules 34
Signatures 35

2
CONMED CORPORATIONItem 1. Business
Forward Looking Statements
This Annual Report on Form 10-K for the Fiscal Year Ended December 31, 2013 (“Form 10-K”) contains certain forward-looking statements (as such term is defined in the Private Securities Litigation Reform Act of 1995) and information relating to CONMED Corporation (“CONMED”, the “Company”, “we” or “us” — references to “CONMED”, the “Company”, “we” or “us” shall be deemed to include our direct and indirect subsidiaries unless the context otherwise requires) which are based on the beliefs of our management, as well as assumptions made by and information currently available to our management.
When used in this Form 10-K, the words “estimate,” “project,” “believe,” “anticipate,” “intend,” “expect” and similar expressions are intended to identify forward-looking statements. These statements involve known and unknown risks, uncertainties and other factors, including those identified under the caption “Item 1A-Risk Factors” and elsewhere in this Form 10-K which may cause our actual results, performance or achievements, or industry results, to be materially different from any future results, performance or achievements expressed or implied by such forward-looking statements. Such factors include, among others, the following:
• general economic and business conditions;• changes in foreign exchange and interest rates;• cyclical customer purchasing patterns due to budgetary and other constraints;• changes in customer preferences;• competition;• changes in technology;• the introduction and acceptance of new products;• the ability to evaluate, finance and integrate acquired businesses, products and companies;• changes in business strategy;• the availability and cost of materials;• the possibility that United States or foreign regulatory and/or administrative agencies may initiate enforcement actions
against us or our distributors;• future levels of indebtedness and capital spending;• quality of our management and business abilities and the judgment of our personnel;• the availability, terms and deployment of capital;• the risk of litigation, especially patent litigation as well as the cost associated with patent and other litigation;• the risk of a lack of allograft tissues due to reduced donations of such tissues or due to tissues not meeting the appropriate
high standards for screening and/or processing of such tissues; • changes in regulatory requirements; and• various other factors referenced in this Form 10-K.
See “Item 7-Management’s Discussion and Analysis of Financial Condition and Results of Operations”, “Item 1-Business” and “Item 1A-Risk Factors” for a further discussion of these factors. You are cautioned not to place undue reliance on these forward-looking statements, which speak only as of the date hereof. We do not undertake any obligation to publicly release any revisions to these forward-looking statements to reflect events or circumstances after the date of this Form 10-K or to reflect the occurrence of unanticipated events.
General
CONMED Corporation was incorporated under the laws of the State of New York in 1970 by Eugene R. Corasanti, the Company’s founder and Chairman of the Board. CONMED is a medical technology company with an emphasis on surgical devices and equipment for minimally invasive procedures and monitoring. The Company’s products are used by surgeons and physicians in a variety of specialties including orthopedics, general surgery, gynecology, neurosurgery, and gastroenterology. Headquartered in Utica, New York, the Company’s 3,600 employees distribute its products worldwide from several manufacturing locations.
We have historically used strategic business acquisitions and exclusive distribution relationships to diversify our product offerings, increase our market share in certain product lines, realize economies of scale and take advantage of growth opportunities in the healthcare field.
We are committed to offering products with the highest standards of quality, technological excellence and customer service. Substantially all of our facilities have attained certification under the ISO international quality standards and other domestic and international quality accreditations.
3
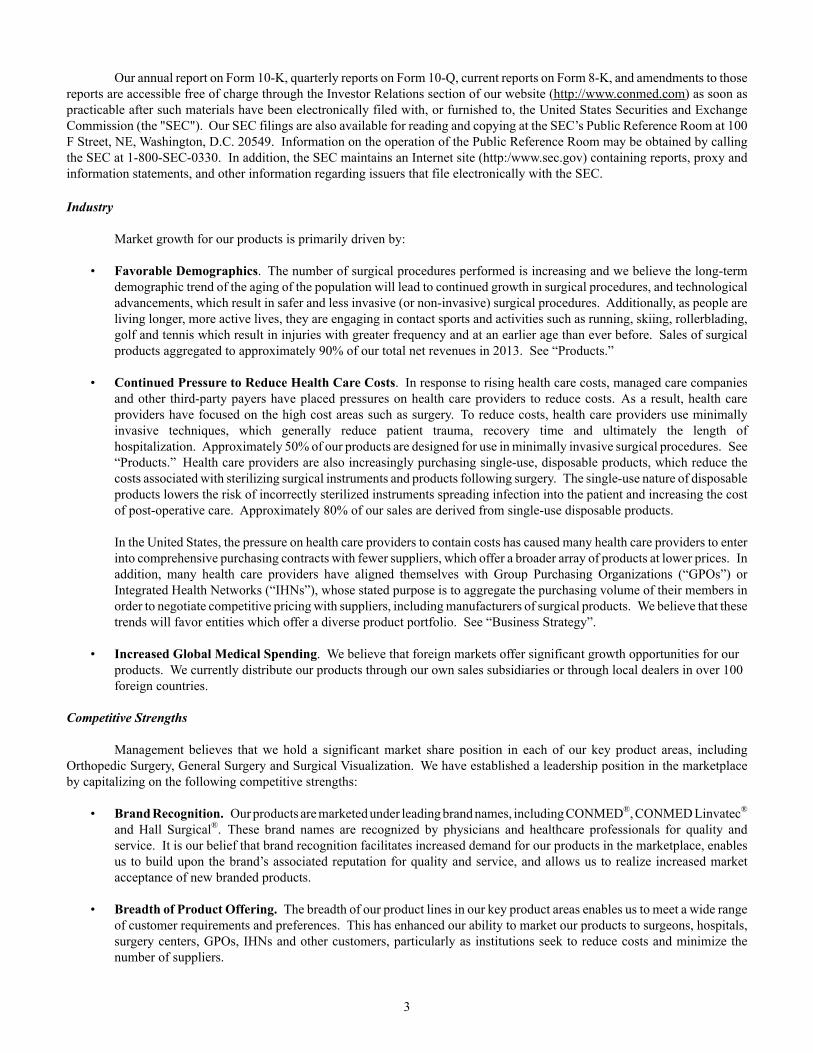
Our annual report on Form 10-K, quarterly reports on Form 10-Q, current reports on Form 8-K, and amendments to those
reports are accessible free of charge through the Investor Relations section of our website (http://www.conmed.com) as soon as practicable after such materials have been electronically filed with, or furnished to, the United States Securities and Exchange Commission (the "SEC"). Our SEC filings are also available for reading and copying at the SEC’s Public Reference Room at 100 F Street, NE, Washington, D.C. 20549. Information on the operation of the Public Reference Room may be obtained by calling the SEC at 1-800-SEC-0330. In addition, the SEC maintains an Internet site (http:/www.sec.gov) containing reports, proxy and information statements, and other information regarding issuers that file electronically with the SEC. Industry
Market growth for our products is primarily driven by:
• Favorable Demographics. The number of surgical procedures performed is increasing and we believe the long-term demographic trend of the aging of the population will lead to continued growth in surgical procedures, and technological advancements, which result in safer and less invasive (or non-invasive) surgical procedures. Additionally, as people are living longer, more active lives, they are engaging in contact sports and activities such as running, skiing, rollerblading, golf and tennis which result in injuries with greater frequency and at an earlier age than ever before. Sales of surgical products aggregated to approximately 90% of our total net revenues in 2013. See “Products.”
• Continued Pressure to Reduce Health Care Costs. In response to rising health care costs, managed care companies and other third-party payers have placed pressures on health care providers to reduce costs. As a result, health care providers have focused on the high cost areas such as surgery. To reduce costs, health care providers use minimally invasive techniques, which generally reduce patient trauma, recovery time and ultimately the length of hospitalization. Approximately 50% of our products are designed for use in minimally invasive surgical procedures. See “Products.” Health care providers are also increasingly purchasing single-use, disposable products, which reduce the costs associated with sterilizing surgical instruments and products following surgery. The single-use nature of disposable products lowers the risk of incorrectly sterilized instruments spreading infection into the patient and increasing the cost of post-operative care. Approximately 80% of our sales are derived from single-use disposable products.
In the United States, the pressure on health care providers to contain costs has caused many health care providers to enter into comprehensive purchasing contracts with fewer suppliers, which offer a broader array of products at lower prices. In addition, many health care providers have aligned themselves with Group Purchasing Organizations (“GPOs”) or Integrated Health Networks (“IHNs”), whose stated purpose is to aggregate the purchasing volume of their members in order to negotiate competitive pricing with suppliers, including manufacturers of surgical products. We believe that these trends will favor entities which offer a diverse product portfolio. See “Business Strategy”.
• Increased Global Medical Spending. We believe that foreign markets offer significant growth opportunities for our
products. We currently distribute our products through our own sales subsidiaries or through local dealers in over 100 foreign countries.
Competitive Strengths
Management believes that we hold a significant market share position in each of our key product areas, including Orthopedic Surgery, General Surgery and Surgical Visualization. We have established a leadership position in the marketplace by capitalizing on the following competitive strengths:
• Brand Recognition. Our products are marketed under leading brand names, including CONMED®, CONMED Linvatec® and Hall Surgical®. These brand names are recognized by physicians and healthcare professionals for quality and service. It is our belief that brand recognition facilitates increased demand for our products in the marketplace, enables us to build upon the brand’s associated reputation for quality and service, and allows us to realize increased market acceptance of new branded products.
• Breadth of Product Offering. The breadth of our product lines in our key product areas enables us to meet a wide range of customer requirements and preferences. This has enhanced our ability to market our products to surgeons, hospitals, surgery centers, GPOs, IHNs and other customers, particularly as institutions seek to reduce costs and minimize the number of suppliers.

4
• Successful Integration of Acquisitions. We seek to build growth platforms around our core markets through focused acquisitions of complementary businesses and product lines. These acquisitions have enabled us to diversify our product portfolio, expand our sales and marketing capabilities and strengthen our presence in key geographical markets.
• Strategic Marketing and Distribution Channels. We market our products domestically through five focused sales force groups consisting of approximately 275 employee sales representatives and 215 sales professionals employed by independent sales agent groups. Our dedicated sales professionals are highly knowledgeable in the applications and procedures for the products they sell. Our sales representatives foster close professional relationships with physicians, surgeons, hospitals, outpatient surgery centers and physicians’ offices. Additionally, we maintain a global presence through sales subsidiaries and branches located in key international markets. We directly service hospital customers located in these markets through an employee-based international sales force of approximately 185 sales representatives. We also maintain distributor relationships domestically and in numerous countries worldwide. See “Marketing.”
• Operational Improvements and Manufacturing. We are focused on continuously improving our supply chain effectiveness, strengthening our manufacturing processes and optimizing our plant network to increase operational efficiencies within the organization. Substantially all of our products are manufactured and assembled from components we produce. Our strategy has historically been to vertically integrate our manufacturing facilities in order to develop a competitive advantage. This integration provides us with cost efficient and flexible manufacturing operations which permit us to allocate capital more efficiently. Additionally, we attempt to exploit commercial synergies between operations, such as the procurement of common raw materials and components used in production.
• Technological Leadership. Research and development efforts are closely aligned with our key business objectives, namely developing and improving products and processes, applying innovative technology to the manufacture of products for new global markets and reducing the cost of producing core products. These efforts are evidenced by recent product introductions, such as the Y-Knot® Flex System for instability repairs, Y-Knot® RC anchors for rotator cuffs, the D4000 Resection System, the IM8000 2DHD Camera System, Hall 50™ Powered Instrument System, GS2000 50L Insufflator, EntriPort line of trocars, new D-Flex probes, and DetachaTip® III Multi-Use Endosurgery Instruments.
Business Strategy
Our principal objectives are to improve the quality of surgical outcomes and patient care through the development of innovative medical devices, the refinement of existing products and the development of new technologies which reduce risk, trauma, cost and procedure time. We believe that by meeting these objectives we will enhance our ability to anticipate and adapt to customer needs and market opportunities, and provide shareholders with superior investment returns. We intend to achieve future growth and earnings development through the following initiatives:
• Introduction of New Products and Product Enhancements. We continually pursue organic growth through the development of new products and enhancements to existing products. We seek to develop new technologies which improve the durability, performance and usability of existing products. In addition to our internal research and development efforts, we receive new ideas for products and technologies, particularly in procedure-specific areas, from surgeons, inventors and other healthcare professionals.
• Pursue Strategic Acquisitions. We pursue strategic acquisitions, distribution and similar arrangements in existing and new growth markets to achieve increased operating efficiencies, geographic diversification and market penetration. Targeted companies have historically included those with proven technologies and established brand names which provide potential sales, marketing and manufacturing synergies.
• Realize Manufacturing and Operating Efficiencies. We continually review our production systems for opportunities to reduce operating costs, consolidate product lines or identical process flows, reduce inventory requirements and optimize existing processes. Our vertically integrated manufacturing facilities allow for further opportunities to reduce overhead, increase operating efficiencies and capacity utilization.
• Geographic Diversification. We believe that significant growth opportunities exist for our surgical products outside the United States. Principal foreign markets for our products include Europe, Latin America and Asia/Pacific Rim. Critical elements of our future sales growth in these markets include leveraging our existing relationships with foreign surgeons, hospitals, third-party payers and foreign distributors, maintaining an appropriate presence in emerging market countries and continually evaluating our routes-to-market.

5
• Active Participation In The Medical Community. We believe that excellent working relationships with physicians and others in the medical industry enable us to gain an understanding of new therapeutic and diagnostic alternatives, trends and emerging opportunities. Active participation allows us to quickly respond to the changing needs of physicians and patients. In addition, we are an active sponsor of medical education both in the United States and internationally, offering new and innovative surgical techniques as well as other medical education materials for use with our products.
Products
The following table sets forth the percentage of net sales for each of our product lines during each of the three years ended December 31:
Year Ended December 31, 2011 2012 2013Orthopedic surgery 51% 54% 54%General surgery 40% 37% 37%Surgical visualization 9% 9% 9%
Consolidated net sales 100% 100% 100%Net Sales (in thousands) $ 725,077 $ 767,140 $ 762,704
Orthopedic Surgery
A significant portion of our business is derived from sales in our orthopedic surgery product lines, including sports medicine, powered surgical instruments and sports biologics and tissue. These lines are marketed under a number of reputable brands, including Hall®, CONMED Linvatec®, Concept® and Shutt®.
We offer a comprehensive range of devices and products to repair injuries which have occurred in the articulating joint areas of the body. Many of these injuries are the result of sports related events or similar traumas. Our sports medicine products include powered resection instruments, arthroscopes, reconstructive systems, tissue repair sets, metal and bioabsorbable implants as well as related disposable products and fluid management systems. It is our standard practice to place some of these products, such as shaver consoles and pumps, with certain customers at no charge in exchange for commitments to purchase disposable products over certain time periods. This capital equipment is loaned and subject to return if certain minimum single-use purchases are not met. Single-use products include products such as shaver blades, burs and pump tubing. We have benefited from the introduction of new arthroscopic products and technologies, such as bioabsorbable screws, “push-in” and “screw-in” suture anchors, and resection shavers.
As a market leader in sports medicine, we compete with Smith & Nephew, plc, Arthrex, Inc., Stryker Corporation, ArthroCare Corporation, Johnson & Johnson: DePuy Mitek, Inc., and Biomet, Inc..
Our powered instruments offering is sold principally under the Hall® Surgical brand name, for use in large and small bone orthopedic, arthroscopic, oral/maxillofacial, podiatric, plastic, ENT, neurological, spinal and cardiothoracic surgeries. Our newest product is the Hall 50™ Powered Instrument System, specifically designed to meet the requirements of most orthopedic applications. The modularity and versatility of the Hall 50™ Powered Instrument System allows a facility to purchase a single power system to perform total joint arthroplasty, trauma, arthroscopy, and some small bone procedures.
As a market leader in powered instruments, our competition includes Stryker Corporation, Medtronic, (Midas Rex and Xomed divisions), Synvasive Technology, Inc., Synthes, Inc., MicroAire Surgical Instruments, LLC, and Zimmer Holdings, Inc.
As more fully described in Note 4 to the Consolidated Financial Statements, on January 3, 2012, the Company entered into the Sports Medicine Joint Development and Distribution Agreement (the "JDDA") with Musculoskeletal Transplant Foundation (“MTF”) to obtain MTF's worldwide promotion rights with respect to allograft tissues within the field of sports medicine and related products. Under the terms of this agreement, we are now the exclusive worldwide promoter of these allograft tissues, which includes the reconstruction and/or replacement of tendon, ligament, cartilage or menisci, along with the correction of deformities within the extremities.
Surgical Visualization

6
Our surgical visualization product line offers endoscopic imaging and capture devices for the complete spectrum of surgical needs including 2DHD and 3DHD vision technologies. The 3DHD vision system is an advanced three dimensional, or 3D, vision system which employs a flat screen monitor and passive glasses. It is used by surgeons during complex minimally invasive surgical procedures, with applications in gynecologic, urologic, bariatric, thoracic and general surgery. Competition includes Smith & Nephew, plc, Arthrex, Inc., Stryker Corporation, Olympus, Inc. and Karl Storz GmbH.
General Surgery
Our general surgery product line offers a large range of products in the areas of advanced energy, endomechanical instrumentation, gastrointestinal, pulmonary and patient monitoring.
CONMED is one of the medical device industry’s leading technology sources for advanced energy solutions for a range of surgical needs. We offer an extensive line of state-of-the-art electrosurgical generators, handpieces, smoke management systems, and accessories. Our competition includes Covidien Ltd.; Valley Labs, Medline Industries, Inc., ERBE Elektromedizin GmbH, and Megadyne.
Our endomechanical instrumentation products offer a full line of unique instruments including trocars, clip appliers, scissors, and surgical staplers used in the minimally invasive laparoscopic and gynecological surgery. We offer a unique and premium uterine manipulator called VCARE® for use in increasing the efficiency of laparoscopic hysterectomies and other gynecologic laparoscopic procedures. This offering competes with such companies as Johnson & Johnson: Ethicon Endo-Surgery, Inc., Covidien Ltd; U.S. Surgical and Applied Medical Resources Corporation.
Our gastrointestinal (GI) and pulmonary offering includes a comprehensive line of minimally invasive diagnostic and therapeutic products used in conjunction with procedures which require flexible endoscopy. This offering includes mucosal management devices, forceps, scope management accessories, bronchoscopy devices, dilatation, stricture management devices, hemostasis, biliary devices, and polypectomy. Our competition includes Boston Scientific Corporation - Endoscopy, Cook Medical, Inc., Olympus America, Inc. and STERIS Corporation - U.S. Endoscopy.
Our patient monitoring offering includes a line of vital signs and cardiac monitoring products including pulse oximetry equipment & sensors, ECG electrodes and cables, cardiac defibrillation & pacing pads and blood pressure cuffs. We also offer a complete line of suction instruments and tubing for use in the operating room, as well as a line of IV products for use in the critical care areas of the hospital. This offering competition includes Covidien Ltd: Kendall and 3M Company.
Marketing
A significant portion of our products are distributed domestically directly to more than 6,000 hospitals and other healthcare institutions as well as through medical specialty distributors and surgeons. We are not dependent on any single customer and no single customer accounted for more than 10% of our net sales in 2011, 2012 and 2013.
A significant portion of our U.S. sales are to customers affiliated with GPOs, IDNs and other large national or regional accounts, as well as to the Veterans Administration and other hospitals operated by the Federal government. For hospital inventory management purposes, some of our customers prefer to purchase our products through independent third-party medical product distributors.
In order to provide a high level of expertise to the medical specialties we serve, our domestic sales force consists of approximately 275 employee sales representatives who are specially trained in our various product offerings. We also have 215 sales representatives working for independent sales agent groups selling orthopedic products.
Each employee sales representative is assigned a defined geographic area and compensated on a commission basis or through a combination of salary and commission. The sales force is supervised and supported by either area directors or district managers. Sales agent groups are used in the United States to sell our orthopedic products. These sales agent groups are paid a commission for sales made to customers while home office sales and marketing management provide the overall direction for sales of our products.
Our health systems organization is responsible for interacting with large regional and national accounts (e.g. GPOs, IDNs, etc.). We have contracts with many such organizations and believe that the loss of any individual group purchasing contract will not adversely impact our business. In addition, all of our sales professionals are required to work closely with distributors where applicable and maintain close relationships with end-users.

7
Each of our dedicated sales professionals is highly knowledgeable in the applications and procedures for the products they sell. Our sales professionals provide surgeons and medical personnel with information relating to the technical features and benefits of our products.
Maintaining and expanding our international presence is an important component of our long-term growth plan. Our products are sold in over 100 foreign countries. International sales efforts are coordinated through local country dealers or through direct in country sales. We distribute our products through sales subsidiaries and branches with offices located in Australia, Austria, Belgium, Canada, China, Denmark, Finland, France, Germany, Italy, Korea, the Netherlands, Poland, Spain, Sweden and the United Kingdom. In these countries, our sales are denominated in the local currency and amounted to approximately 36% of our total net sales in 2013. In the remaining countries where our products are sold through independent distributors, sales are denominated in United States dollars.
We sell to a diversified base of customers around the world and, therefore, believe there is no material concentration of credit risk.
Manufacturing
We manufacture substantially all of our products and assemble them from components, many of which we produce. Our strategy has historically been to vertically integrate our manufacturing facilities in order to develop a competitive advantage. This integration provides us with cost efficient and flexible manufacturing operations which permit us to allocate capital more efficiently. Additionally, we attempt to exploit commercial synergies between operations, such as the procurement of common raw materials and components used in production.
Raw material costs constitute a substantial portion of our cost of production. We use numerous raw materials and components in the design, development and manufacturing of our products. Substantially all of our raw materials and select components used in the manufacturing process are procured from external suppliers. We work closely with multiple suppliers to ensure continuity of supply while maintaining high quality and reliability. As a consequence of best supply chain practices, new product development and acquisitions, we often form strategic partnerships with key suppliers. As a consequence of these supplier partnerships, components and raw materials may be sole sourced. Due to the strength of these suppliers and the variety of products we provide, the risk of supplier interruption does not pose an overall material adverse effect on our financial and operational performance. To date, this strategy has served us well, as we provide excellent service levels and product availability to our customers.
All of our products are classified as medical devices subject to regulation by numerous agencies and legislative bodies, including the United States Food and Drug Administration (“FDA”) and comparable foreign counterparts. The FDA’s Quality System Regulations set forth standards for our product design and manufacturing processes, require the maintenance of certain records and provide for on-site inspections of our facilities by the FDA. In many of the foreign countries in which we manufacture and distribute our products we are subject to regulatory requirements affecting, among other things, product performance standards, packaging requirements, labeling requirements, import laws and onsite inspection by independent bodies with the authority to issue or not issue certifications we may require to be able to sell products in certain countries. Regulatory requirements affecting the Company vary from country to country. The timeframes and costs for regulatory submission and approval from foreign agencies or legislative bodies may vary from those required by the FDA. Certain requirements for approval from foreign agencies or legislative bodies may also differ from those of the FDA.
We believe that our production and inventory management practices are characteristic of those in the medical device industry. Substantially all of our products are stocked in inventory and are not manufactured to order or to individual customer specifications. We schedule production and maintain adequate levels of safety stock based on a number of factors including, experience, knowledge of customer ordering patterns, demand, manufacturing lead times and optimal quantities required to maintain the highest possible service levels. Customer orders are generally processed for immediate shipment and backlog of firm orders is therefore not considered material to an understanding of our business.
Research and Development
New and improved products play a critical role in our continued sales growth. Internal research and development efforts focus on the development of new products and product technological and design improvements aimed at complementing and expanding existing product lines. We continually seek to leverage new technologies which improve the durability, performance and usability of existing products. In addition, we maintain close working relationships with surgeons, inventors and operating room personnel who often make new product and technology disclosures, principally in procedure-specific areas. For clinical

8
and commercially promising disclosures, we seek to obtain rights to these ideas through negotiated agreements. Such agreements typically compensate the originator through payments based upon a percentage of licensed product net sales. Annual royalty expense approximated $2.9 million, $2.5 million and $2.3 million in 2011, 2012, and 2013, respectively.
Amounts expended for Company research and development was approximately $28.7 million, $28.2 million and $25.8 million during 2011, 2012, and 2013, respectively.
We have rights to intellectual property, including United States patents and foreign equivalent patents which cover a wide range of our products. We own a majority of these patents and have exclusive and non-exclusive licensing rights to the remainder. In addition, certain of these patents have currently been licensed to third parties on a non-exclusive basis. We believe that the development of new products and technological and design improvements to existing products will continue to be of primary importance in maintaining our competitive position.
Government Regulation and Quality Systems
Substantially all of our products are classified as class II medical devices subject to regulation by numerous agencies and legislative bodies, including the FDA and comparable foreign counterparts. Authorization to commercially market our products in the U.S. is granted by the FDA under a procedure referred to as 510(k) premarket notification. This process requires us to demonstrate that our new products or significantly modified products are substantially equivalent to a legally marketed device which was on the market prior to May 28, 1976 or is currently on the U.S. market and does not require premarket approval. We must continually meet certain FDA requirements to market our products in the United States. (Our products are classified as Class I, IIa, IIb and III in the European Union (EU) and subject to regulation by the Medical Device Directive.) Our FDA clearance is subject to continual review and future discovery of previously unknown events could result in restrictions being placed on a product’s marketing or notification from the FDA to halt the distribution of certain medical devices.
Medical device regulations continue to evolve world-wide. Products marketed in the EU and other countries require preparation of technical files and design dossiers which demonstrate compliance with applicable international regulations. As government regulations continue to change, there is a risk that the distribution of some of our products may be interrupted or discontinued if they do not meet the country specific requirements.
Our operations are supported by quality system/regulatory compliance personnel tasked with monitoring compliance to design controls, process controls and the other relevant government regulations for all of our design, manufacturing, distribution and servicing activities. We and substantially all of our products are subject to the provisions of the Federal Food, Drug and Cosmetic Act of 1938, as amended by the Medical Device Amendments of 1976, Safe Medical Device Act of 1990, Medical Device Modernization Act of 1997, Medical User Fee and Modernization Act of 2002 and similar international regulations, such as the European Union Medical Device Directives.
As a manufacturer of medical devices, the FDA’s Quality System Regulations as specified in Title 21, Code of Federal Regulation (CFR) part 820, set forth requirements for our product design and manufacturing processes, require the maintenance of certain records, provide for on-site inspection of our facilities and continuing review by the FDA. Many of our products are also subject to industry-defined standards. Such industry-defined product standards are generally formulated by committees of the Association for the Advancement of Medical Instrumentation (AAMI), International Electrotechnical Commission (IEC) and the International Organization for Standardization (ISO). We believe that our products and processes presently meet applicable standards in all material respects.
As noted above, our facilities are subject to periodic inspection by the FDA for, among other things, conformance to Quality System Regulation and Current Good Manufacturing Practice (“CGMP”) requirements. Following an inspection, the FDA typically provides its observations, if any, in the form of a Form 483 (Notice of Inspectional Observations) with specific observations concerning potential violation of regulations. Although we respond to all Form 483 observations and correct deficiencies expeditiously, there can be no assurance that the FDA will not take further action including issuing a warning letter, seizing product and imposing fines. During the third quarter of 2013, the FDA inspected our Centennial, CO manufacturing facility and issued a Form 483 with observations on September 20, 2013. The Company subsequently submitted responses to the Observations, and the FDA issued a Warning Letter on January 30, 2014 relating to the inspection and the responses to the Form 483 Observations. Accordingly, we are undertaking corrective actions that may involve additional costs for the Company. These remediation costs are not expected to be material, however there can be no assurance that the actions undertaken by the Company will ensure that the Company will not undertake recalls, voluntary or otherwise, nor can there be any assurance that a future inspection by the FDA will not result in an additional Form 483 or warning letter, or other regulatory actions which may include consent decrees or fines.
9
We market our products in several foreign countries and therefore are subject to regulations affecting, among other things, product standards, sterilization, packaging requirements, labeling requirements, import laws and onsite inspection by independent bodies with the authority to issue or not issue certifications we may require to be able to sell products in certain countries. Many of the regulations applicable to our devices and products in these countries are similar to those of the FDA. The member countries of the European Union have adopted the European Medical Device Directives, which create a single set of medical device regulations for all member countries. These regulations require companies that wish to manufacture and distribute medical devices in the European Union maintain quality system certification through European Union recognized Notified Bodies. These Notified Bodies authorize the use of the CE Mark allowing free movement of our products throughout the member countries. Requirements pertaining to our products vary widely from country to country, ranging from simple product registrations to detailed submissions such as those required by the FDA. We believe that our products and quality procedures currently meet applicable standards for the countries in which they are marketed.
Our products may become subject to recall or market withdrawal regulations and we have made product recall decisions in the past. No product recall has had a material effect on our financial condition, however there can be no assurance that regulatory issues will not have a material adverse effect in the future.
Any change in existing federal, state, foreign laws or regulations, or in the interpretation or enforcement thereof, or the promulgation or any additional laws or regulations may result in a material adverse effect on our financial condition, results of operations or cash flows.
Employees
As of December 31, 2013, we had approximately 3,600 full-time employees, including approximately 2,200 in operations, 130 in research and development, and the remaining in sales, marketing and related administrative support. We believe that we have good relations with our employees and have never experienced a strike or similar work stoppage. None of our domestic employees are represented by a labor union. Item 1A. Risk Factors
An investment in our securities, including our common stock, involves a high degree of risk. Investors should carefully consider the specific factors set forth below as well as the other information included or incorporated by reference in this Form 10-K. See “Forward Looking Statements”.
Our financial performance is dependent on conditions in the healthcare industry and the broader economy. The results of our business are directly tied to the economic conditions in the healthcare industry and the broader economy as a whole. Significant volatility in the financial markets and foreign currency exchange rates and depressed economic conditions in both domestic and international markets, have presented significant business challenges since the second half of 2008. While we returned to revenue growth in 2010, 2011 and 2012, we experienced a sales decline in 2013. We are cautiously optimistic that the domestic economic environment is improving, however conditions in Europe and elsewhere may present significant business challenges for the Company. While there can be no assurance that improvement in the overall economic environment will be sustained, we will continue to monitor and manage the impact of the overall economic environment on the Company. Approximately 20% of our revenues are derived from the sale of capital products. The sales of such products are negatively impacted if hospitals and other healthcare providers are unable to secure the financing necessary to purchase these products or otherwise defer purchases.
Our significant international operations subject us to foreign currency fluctuations and other risks associated with operating in foreign countries.
A significant portion of our revenues are derived from foreign sales. Approximately 51% of our total 2013 consolidated net sales were to customers outside the United States. We have sales subsidiaries in a significant number of countries in Europe as well as Australia, Canada, China and Korea. In those countries in which we have a direct presence, our sales are denominated in the local currency and those sales denominated in local currency amounted to approximately 36% of our total net sales in 2013. The remaining 15% of sales to customers outside the United States was on an export basis and transacted in United States dollars.
Because a significant portion of our operations consist of sales activities in foreign jurisdictions, our financial results may be affected by factors such as changes in foreign currency exchange rates or weak economic conditions in the markets in which we distribute products. While we have implemented a hedging strategy, our revenues may be unfavorably impacted from foreign
10
currency translation if the United States dollar strengthens as compared with currencies such as the Euro. Our international presence exposes us to certain other inherent risks, including: • imposition of limitations on conversions of foreign currencies into dollars or remittance of dividends and other payments
by international subsidiaries;• imposition or increase of withholding and other taxes on remittances and other payments by international subsidiaries;• trade barriers;• political risks, including political instability;• reliance on third parties to distribute our products;• hyperinflation in certain foreign countries; and• imposition or increase of investment and other restrictions by foreign governments.
We cannot assure you that such risks will not have a material adverse effect on our business and results of operations.
Our financial performance is subject to the risks inherent in our acquisition strategy, including the effects of increased borrowing and integration of newly acquired businesses or product lines.
A key element of our business strategy has been to expand through acquisitions and we may seek to pursue additional acquisitions in the future. Our success is dependent in part upon our ability to integrate acquired companies or product lines into our existing operations. We may not have sufficient management and other resources to accomplish the integration of our past and future acquisitions and implementing our acquisition strategy may strain our relationship with customers, suppliers, distributors, manufacturing personnel or others. There can be no assurance that we will be able to identify and make acquisitions on acceptable terms or that we will be able to obtain financing for such acquisitions on acceptable terms. In addition, while we are generally entitled to customary indemnification from sellers of businesses for any difficulties that may have arisen prior to our acquisition of each business, acquisitions may involve exposure to unknown liabilities and the amount and time for claiming under these indemnification provisions is often limited. As a result, our financial performance is now and will continue to be subject to various risks associated with the acquisition of businesses, including the financial effects associated with any increased borrowing required to fund such acquisitions or with the integration of such businesses.
Our financial performance may be adversely impacted by the healthcare reform legislation.
The Patient Protection and Affordable Care Act and Health Care and Education Affordability Reconciliation Act were enacted into law in the U.S. in March 2010. Effective January 1, 2013, as part of this legislation, a 2.3% excise tax has been imposed upon sales within the U.S. of certain medical device products. In 2013, this excise tax has imposed an additional expense of approximately 0.8% of total global sales and we expect a similar impact in 2014. Other provisions of this legislation, including Medicare provisions aimed at improving quality and decreasing costs, comparative effectiveness research, an independent payment advisory board, and pilot programs to evaluate alternative payment methodologies, could meaningfully change the way health care is developed and delivered, and may adversely affect our business and results of operations. Further, we cannot predict what healthcare programs and regulations will be ultimately implemented at the federal or state level, or the effect of any future legislation or regulation in the U.S. or internationally. However, any changes that lower reimbursements to hospitals for surgical procedures or reduce medical procedure volumes could adversely affect our results of operations and cash flows.
Failure to comply with regulatory requirements may result in recalls, fines or materially adverse implications.
Substantially all of our products are classified as class II medical devices subject to regulation by numerous agencies and legislative bodies, including the FDA and comparable foreign counterparts. As a manufacturer of medical devices, our manufacturing processes and facilities are subject to on-site inspection and continuing review by the FDA for compliance with the Quality System Regulations. We received a warning letter from the FDA related to our Centennial, CO facility on January 30, 2014 and are currently undertaking corrective actions that will result in additional costs to the Company. These remediation costs are not expected to be material, however there can be no assurance that the actions undertaken by the Company will ensure that the Company will not undertake recalls, voluntary or otherwise, nor can there be any assurance that a future inspection by the FDA will not result in an additional Form 483 or warning letter, or other regulatory actions which may include consent decrees or fines. Manufacturing and sales of our products outside the United States are also subject to foreign regulatory requirements which vary from country to country. Moreover, we are generally required to obtain regulatory clearance or approval prior to marketing a new product. The time required to obtain approvals from foreign countries may be longer or shorter than that required for FDA clearance, and requirements for foreign approvals may differ from FDA requirements. Failure to comply with applicable domestic and/or foreign regulatory requirements may result in:
• fines or other enforcement actions;

11
• recall or seizure of products;• total or partial suspension of production;• loss of certification;• withdrawal of existing product approvals or clearances;• refusal to approve or clear new applications or notices;• increased quality control costs; or• criminal prosecution.
Failure to comply with Quality System Regulations and applicable foreign regulations could result in a material adverse effect on our business, financial condition or results of operations.
If we are not able to manufacture products in compliance with regulatory standards, we may decide to cease manufacturing of those products and may be subject to product recall.
In addition to the Quality System Regulations, many of our products are also subject to industry-defined standards. We may not be able to comply with these regulations and standards due to deficiencies in component parts or our manufacturing processes. If we are not able to comply with the Quality System Regulations or industry-defined standards, we may not be able to fill customer orders and we may decide to cease production of non-compliant products. Failure to produce products could affect our profit margins and could lead to loss of customers.
Our products are subject to product recall and we have made product recalls in the past. Although no recall has had a material adverse effect on our business or financial condition, we cannot assure you that regulatory issues will not have a material adverse effect on our business, financial condition or results of operations in the future or that product recalls will not harm our reputation and our customer relationships. The highly competitive market for our products may create adverse pricing pressures. The market for our products is highly competitive and our customers have numerous alternatives of supply. Many of our competitors offer a range of products in areas other than those in which we compete, which may make such competitors more attractive to surgeons, hospitals, group purchasing organizations and others. In addition, several of our competitors are large, technically competent firms with substantial assets. Competitive pricing pressures or the introduction of new products by our competitors could have an adverse effect on our revenues. See “Products” for a further discussion of these competitive forces.
Factors which may influence our customers’ choice of competitor products include:
• changes in surgeon preferences;• increases or decreases in healthcare spending related to medical devices;• our inability to supply products to them as a result of product recall, market withdrawal or back-order;• the introduction by competitors of new products or new features to existing products;• the introduction by competitors of alternative surgical technology; and• advances in surgical procedures, discoveries or developments in the healthcare industry.
We use a variety of raw materials in our businesses, and significant shortages or price increases could increase our operating costs and adversely impact the competitive positions of our products.
Our reliance on certain suppliers and commodity markets to secure raw materials used in our products exposes us to volatility in the prices and availability of raw materials. In some instances, we participate in commodity markets that may be subject to allocations by suppliers. A disruption in deliveries from our suppliers, price increases, or decreased availability of raw materials or commodities, could have an adverse effect on our ability to meet our commitments to customers or increase our operating costs. We believe that our supply management practices are based on an appropriate balancing of the foreseeable risks and the costs of alternative practices. Nonetheless, price increases or the unavailability of some raw materials may have an adverse effect on our results of operations or financial condition.
Cost reduction efforts in the healthcare industry could put pressures on our prices and margins.
In recent years, the healthcare industry has undergone significant change driven by various efforts to reduce costs. Such efforts include national healthcare reform, trends towards managed care, cuts in Medicare, consolidation of healthcare distribution companies and collective purchasing arrangements by GPOs and IHNs. Demand and prices for our products may be adversely affected by such trends.

12
We may not be able to keep pace with technological change or to successfully develop new products with wide market acceptance, which could cause us to lose business to competitors.
The market for our products is characterized by rapidly changing technology. Our future financial performance will depend in part on our ability to develop and manufacture new products on a cost-effective basis, to introduce them to the market on a timely basis, and to have them accepted by surgeons.
We may not be able to keep pace with technology or to develop viable new products. Factors which may result in delays of new product introductions or cancellation of our plans to manufacture and market new products include:
• capital constraints;• research and development delays;• delays in securing regulatory approvals; or• changes in the competitive landscape, including the emergence of alternative products or solutions which reduce or
eliminate the markets for pending products.
Our new products may fail to achieve expected levels of market acceptance.
New product introductions may fail to achieve market acceptance. The degree of market acceptance for any of our products will depend upon a number of factors, including:
• our ability to develop and introduce new products and product enhancements in the time frames we currently estimate;• our ability to successfully implement new technologies;• the market’s readiness to accept new products;• having adequate financial and technological resources for future product development and promotion;• the efficacy of our products; and• the prices of our products compared to the prices of our competitors’ products.
If our new products do not achieve market acceptance, we may be unable to recover our investments and may lose business to competitors.
In addition, some of the companies with which we now compete, or may compete in the future, have or may have more extensive research, marketing and manufacturing capabilities and significantly greater technical and personnel resources than we do, and may be better positioned to continue to improve their technology in order to compete in an evolving industry. See “Products” for a further discussion of these competitive forces.
Our senior credit agreement contains covenants which may limit our flexibility or prevent us from taking actions.
Our senior credit agreement contains, and future credit facilities are expected to contain, certain restrictive covenants which will affect, and in many respects significantly limit or prohibit, among other things, our ability to:
• incur indebtedness;• make investments;• engage in transactions with affiliates;• pay dividends or make other distributions on, or redeem or repurchase, capital stock;• sell assets; and• pursue acquisitions.
These covenants, unless waived, may prevent us from pursuing acquisitions, significantly limit our operating and financial flexibility and limit our ability to respond to changes in our business or competitive activities. Our ability to comply with such provisions may be affected by events beyond our control. In the event of any default under our credit agreement, the credit agreement lenders may elect to declare all amounts borrowed under our credit agreement, together with accrued interest, to be due and payable. If we were unable to repay such borrowings, the credit agreement lenders could proceed against collateral securing the credit agreement which consists of substantially all of our property and assets. Our credit agreement also contains a material adverse effect clause which may limit our ability to access additional funding under our credit agreement should a material adverse change in our business occur.
Our leverage and debt service requirements may require us to adopt alternative business strategies.

13
As of December 31, 2013, we had $215.6 million of debt outstanding, representing 21% of total capitalization. See “Management’s Discussion and Analysis of Financial Condition and Results of Operations—Liquidity and Capital Resources”.
The degree to which we are leveraged could have important consequences to investors, including but not limited to the following:
• a portion of our cash flow from operations must be dedicated to debt service and will not be available for operations, capital expenditures, acquisitions, dividends and other purposes;
• our ability to obtain additional financing in the future for working capital, capital expenditures, acquisitions or general corporate purposes may be limited or impaired, or may be at higher interest rates;
• we may be at a competitive disadvantage when compared to competitors that are less leveraged;• we may be hindered in our ability to adjust rapidly to market conditions;• our degree of leverage could make us more vulnerable in the event of a downturn in general economic conditions or other
adverse circumstances applicable to us; and• our interest expense could increase if interest rates in general increase because a portion of our borrowings, including
our borrowings under our credit agreement, are and will continue to be at variable rates of interest.
We may not be able to generate sufficient cash to service our indebtedness, which could require us to reduce our expenditures, sell assets, restructure our indebtedness or seek additional equity capital.
Our ability to satisfy our obligations will depend upon our future operating performance, which will be affected by prevailing economic conditions and financial, business and other factors, many of which are beyond our control. We may not have sufficient cash flow available to enable us to meet our obligations. If we are unable to service our indebtedness, we will be forced to adopt an alternative strategy that may include actions such as foregoing acquisitions, reducing or delaying capital expenditures, selling assets, restructuring or refinancing our indebtedness or seeking additional equity capital. We cannot assure you that any of these strategies could be implemented on terms acceptable to us, if at all. See “Management’s Discussion and Analysis of Financial Condition and Results of Operations – Liquidity and Capital Resources” for a discussion of our indebtedness and its implications.
We rely on a third party to obtain, process and distribute sports medicine allograft tissue. If such tissue cannot be obtained, is not accepted by the market or is not accepted under numerous government regulations, our results of operations could be negatively impacted.
As described in Note 4 to the Consolidated Financial Statements, on January 3, 2012, we entered into an agreement with Muskuloskeletal Transplant Foundation ("MTF") to obtain MTF's worldwide promotional, marketing and distribution rights with respect to allograft tissues within the field of sports medicine. The supply of human tissue is dependent on donors and MTF has numerous relationships with donor groups. Likewise, the supply of tissues available for use as allografts depends on the continued successful processing of donated tissues by MTF at its processing facilities. We cannot be certain, however, that the supply of human tissue will continue to be available at current levels or will be of sufficiently high standards to meet the high processing standards maintained for such tissues by MTF, or in volumes sufficient to meet our customers' needs, or that MTF will be able to continue to process tissues to its high standards in volumes sufficient to keep pace with demand. We expect that the Company's share of revenue streams related to MTF's sports medicine allograft product line would decline in proportion to any decline or disruption in the supply of processed tissues.
The FDA and several states have statutory authority to regulate allograft processing and allograft-based materials. The FDA could identify deficiencies in future inspections of MTF or MTF's suppliers or promulgate future regulatory rulings that could disrupt our business, reducing profitability.
If we infringe third parties’ patents, or if we lose our patents or they are held to be invalid, we could become subject to liability and our competitive position could be harmed.
Much of the technology used in the markets in which we compete is covered by patents. We have numerous U.S. patents and corresponding foreign patents on products expiring at various dates from 2014 through 2031 and have additional patent applications pending. See “Research and Development” for a further description of our patents. The loss of our patents could reduce the value of the related products and any related competitive advantage. Competitors may also be able to design around our patents and to compete effectively with our products. In addition, the cost of enforcing our patents against third parties and defending our products against patent infringement actions by others could be substantial. We cannot assure you that: • pending patent applications will result in issued patents;• patents issued to or licensed by us will not be challenged by competitors;

14
• our patents will be found to be valid or sufficiently broad to protect our technology or provide us with a competitive advantage; or
• we will be successful in defending against pending or future patent infringement claims asserted against our products.
Ordering patterns of our customers may change resulting in reductions in sales. Our hospital and surgery center customers purchase our products in quantities sufficient to meet their anticipated demand. Likewise, our healthcare distributor customers purchase our products for ultimate resale to healthcare providers in quantities sufficient to meet the anticipated requirements of the distributors’ customers. Should inventories of our products owned by our hospital, surgery center and distributor customers grow to levels higher than their requirements, our customers may reduce the ordering of products from us. This could result in reduced sales during a financial accounting period.
We can be sued for producing defective products and our insurance coverage may be insufficient to cover the nature and amount of any product liability claims.
The nature of our products as medical devices and today’s litigious environment should be regarded as potential risks which could significantly and adversely affect our financial condition and results of operations. The insurance we maintain to protect against claims associated with the use of our products have deductibles and may not adequately cover the amount or nature of any claim asserted against us. We are also exposed to the risk that our insurers may become insolvent or that premiums may increase substantially. See “Legal Proceedings” for a further discussion of the risk of product liability actions and our insurance coverage.
Damage to our physical properties as a result of windstorm, earthquake, fire or other natural or man-made disaster may cause a financial loss and a loss of customers.
Although we maintain insurance coverage for physical damage to our property and the resultant losses that could occur during a business interruption, we are required to pay deductibles and our insurance coverage is limited to certain caps. For example, our deductible for windstorm damage to our Florida property amounts to 2% of any loss. Further, while insurance reimburses us for our lost gross earnings during a business interruption, if we are unable to supply our customers with our products for an extended period of time, there can be no assurance that we will regain the customers’ business once the product supply is returned to normal.
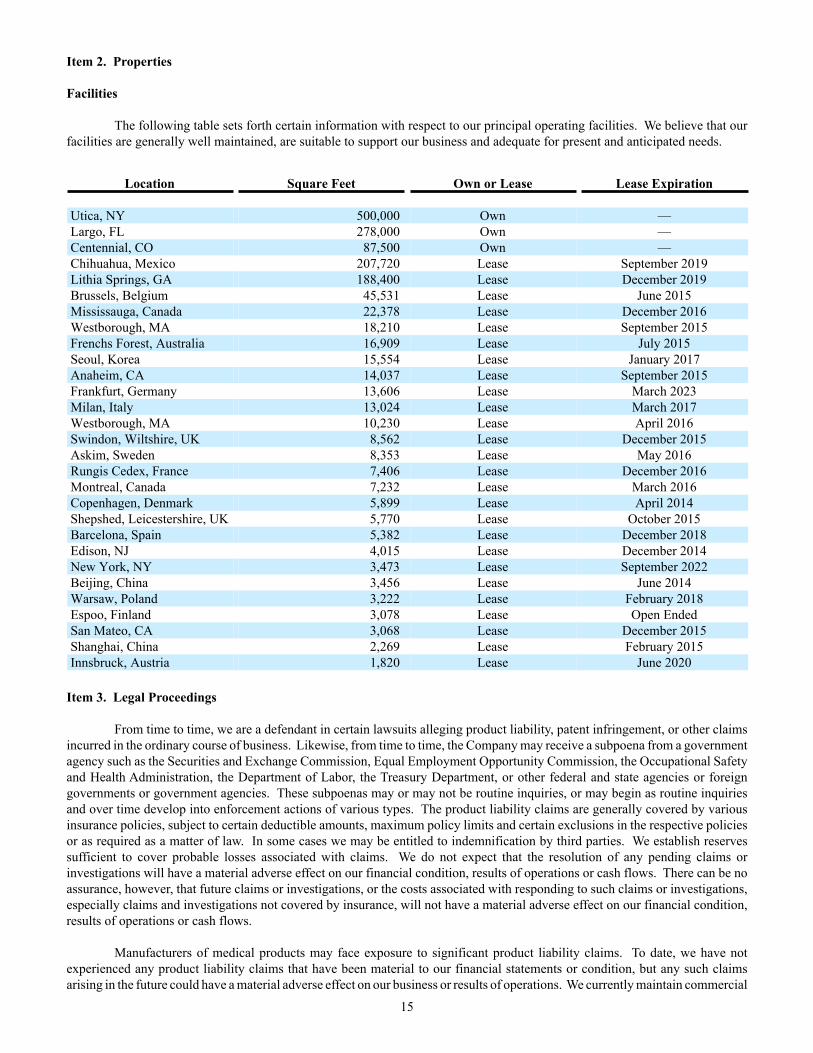
15
Item 2. Properties
Facilities
The following table sets forth certain information with respect to our principal operating facilities. We believe that our facilities are generally well maintained, are suitable to support our business and adequate for present and anticipated needs.
Location Square Feet Own or Lease Lease Expiration
Utica, NY 500,000 Own —Largo, FL 278,000 Own —Centennial, CO 87,500 Own —Chihuahua, Mexico 207,720 Lease September 2019Lithia Springs, GA 188,400 Lease December 2019Brussels, Belgium 45,531 Lease June 2015Mississauga, Canada 22,378 Lease December 2016Westborough, MA 18,210 Lease September 2015Frenchs Forest, Australia 16,909 Lease July 2015Seoul, Korea 15,554 Lease January 2017Anaheim, CA 14,037 Lease September 2015Frankfurt, Germany 13,606 Lease March 2023Milan, Italy 13,024 Lease March 2017Westborough, MA 10,230 Lease April 2016Swindon, Wiltshire, UK 8,562 Lease December 2015Askim, Sweden 8,353 Lease May 2016Rungis Cedex, France 7,406 Lease December 2016Montreal, Canada 7,232 Lease March 2016Copenhagen, Denmark 5,899 Lease April 2014Shepshed, Leicestershire, UK 5,770 Lease October 2015Barcelona, Spain 5,382 Lease December 2018Edison, NJ 4,015 Lease December 2014New York, NY 3,473 Lease September 2022Beijing, China 3,456 Lease June 2014Warsaw, Poland 3,222 Lease February 2018Espoo, Finland 3,078 Lease Open EndedSan Mateo, CA 3,068 Lease December 2015Shanghai, China 2,269 Lease February 2015Innsbruck, Austria 1,820 Lease June 2020
Item 3. Legal Proceedings
From time to time, we are a defendant in certain lawsuits alleging product liability, patent infringement, or other claims incurred in the ordinary course of business. Likewise, from time to time, the Company may receive a subpoena from a government agency such as the Securities and Exchange Commission, Equal Employment Opportunity Commission, the Occupational Safety and Health Administration, the Department of Labor, the Treasury Department, or other federal and state agencies or foreign governments or government agencies. These subpoenas may or may not be routine inquiries, or may begin as routine inquiries and over time develop into enforcement actions of various types. The product liability claims are generally covered by various insurance policies, subject to certain deductible amounts, maximum policy limits and certain exclusions in the respective policies or as required as a matter of law. In some cases we may be entitled to indemnification by third parties. We establish reserves sufficient to cover probable losses associated with claims. We do not expect that the resolution of any pending claims or investigations will have a material adverse effect on our financial condition, results of operations or cash flows. There can be no assurance, however, that future claims or investigations, or the costs associated with responding to such claims or investigations, especially claims and investigations not covered by insurance, will not have a material adverse effect on our financial condition, results of operations or cash flows.
Manufacturers of medical products may face exposure to significant product liability claims. To date, we have not experienced any product liability claims that have been material to our financial statements or condition, but any such claims arising in the future could have a material adverse effect on our business or results of operations. We currently maintain commercial

16
product liability insurance of $25 million per incident and $25 million in the aggregate annually, which we believe is adequate. This coverage is on a claims-made basis. There can be no assurance that claims will not exceed insurance coverage, that the carriers will be solvent or that such insurance will be available to us in the future at a reasonable cost.
Our operations are subject, and in the past have been subject, to a number of environmental laws and regulations governing, among other things, air emissions, wastewater discharges, the use, handling and disposal of hazardous substances and wastes, soil and groundwater remediation and employee health and safety. In some jurisdictions environmental requirements may be expected to become more stringent in the future. In the United States certain environmental laws can impose liability for the entire cost of site restoration upon each of the parties that may have contributed to conditions at the site regardless of fault or the lawfulness of the party’s activities. While we do not believe that the present costs of environmental compliance and remediation are material, there can be no assurance that future compliance or remedial obligations would not have a material adverse effect on our financial condition, results of operations or cash flows.
In September 2012, Bonutti Skeletal Innovations, LLC filed a complaint in the United States District Court for the Middle District of Florida against CONMED and certain of its subsidiaries. The Complaint asserts that select CONMED products infringe patents allegedly owned by Bonutti Skeletal Innovations. On the same day that it sued CONMED, Bonutti Skeletal Innovations sued several other orthopedic companies. The Company believes that the products in question do not infringe the patents-in-suit and intends to vigorously defend the claims. A range of potential losses cannot be estimated at this time.
During the third quarter of 2013, the FDA inspected our Centennial, CO manufacturing facility and issued a Form 483 with observations on September 20, 2013. The Company subsequently submitted responses to the Observations, and the FDA issued a Warning Letter on January 30, 2014 relating to the inspection and the responses to the Form 483 Observations. Accordingly, we are undertaking corrective actions that may involve additional costs for the Company. These remediation costs are not expected to be material, however there can be no assurance that the actions undertaken by the Company will ensure that the Company will not undertake recalls, voluntary or otherwise, nor can there be any assurance that a future inspection by the FDA will not result in an additional Form 483 or warning letter, or other regulatory actions which may include consent decrees or fines.
Item 4. Mine Safety Disclosures
Not applicable.PART II
Item 5. Market for the Registrant’s Common Equity, Related Stockholder Matters and Issuer Purchases of Equity Securities
Our common stock, par value $.01 per share, is traded on the NASDAQ Stock Market under the symbol “CNMD”. At January 31, 2014, there were 729 registered holders of our common stock and approximately 4,984 accounts held in “street name”.
The following table sets forth quarterly high and low sales prices for the years ended December 31, 2012 and 2013, as reported by the NASDAQ Stock Market.
2012Period High LowFirst Quarter $ 30.47 $ 26.00Second Quarter 30.42 26.03Third Quarter 29.25 25.85Fourth Quarter 29.33 25.71
2013Period High LowFirst Quarter $ 34.29 $ 28.03Second Quarter 34.04 30.42Third Quarter 33.96 31.07Fourth Quarter 42.50 33.25

17
Our Board of Directors has authorized a share repurchase program as noted below; also see Note 7 to the Consolidated Financial Statements. The following table provides information about Company purchases of equity securities that are registered by the Company pursuant to Section 12 of the Exchange Act during the quarter ended December 31, 2013:
ISSUER PURCHASES OF EQUITY SECURITIES
Period
(a)Total
Number ofShares
Purchased
(b) Average
Price Paid per Share1
(c) Total
Number of Shares
Purchased as Part of Publicly
Announced Program2
(d)ApproximateDollar Value
of SharesThat May YetBe Purchased
Under theProgram
October 1, 2013 toOctober 31, 2013 — $ — $ 60,128,968
November 1, 2013 toNovember 30, 2013 — $ — — 60,128,968
December 1, 2013 toDecember 31, 2013 146,905 $ 39.67 146,905 54,301,615
Total 146,905 146,905
1Average price paid per share includes cash paid for commissions.
2Our Board of Directors authorized a $200.0 million share repurchase program. There is no expiration date governing the period over which the Company can make its share repurchases under the share repurchase program.
On February 29, 2012, the Board of Directors adopted a cash dividend policy and declared an initial quarterly dividend of $0.15 per share. On October 28, 2013, the Board of Directors increased the quarterly dividend to $0.20 per share. The fourth quarter dividend for 2013 was paid on January 6, 2014 to shareholders of record as of December 16, 2013. The total dividend payable at December 31, 2013 was $5.5 million and is included in other current liabilities in the consolidated balance sheet. Future decisions as to the payment of dividends will be at the discretion of the Board of Directors, subject to conditions then existing, including our financial requirements and condition and the limitation and payment of cash dividends contained in debt agreements.
Information relating to compensation plans under which equity securities of CONMED Corporation are authorized for issuance is set forth below:
Equity Compensation Plan Information
Plan category
Number of securities to be issued upon exercise of
outstanding options, warrants and rights
(a)
Weighted-average exercise price of outstanding options,
warrants and rights(b)
Number of securities remaining available for
future issuance under equity compensation plans (excluding securities
reflected in column (a))(c)
Equity compensation plansapproved by security holders 1,606,739 $25.55 1,145,915Equity compensation plansnot approved by securityholders — — —Total 1,606,739 $25.55 1,145,915

18
Performance Graph
The performance graph below compares the yearly percentage change in the Company’s Common Stock with the cumulative total return of the NASDAQ Composite Index and the cumulative total return of the Standard & Poor’s Health Care Equipment Index. In each case, the cumulative total return assumes reinvestment of dividends into the same class of equity securities at the frequency with which dividends are paid on such securities during the applicable fiscal year.

19
Item 6. Selected Financial Data
The following table sets forth selected historical financial data for the years ended December 31, 2009, 2010, 2011, 2012 and 2013. The financial data set forth below should be read in conjunction with the information under “Management’s Discussion and Analysis of Financial Condition and Results of Operations” included in Item 7 of this Form 10-K and the Financial Statements of the Company and the notes thereto.
FIVE YEAR SUMMARY OF SELECTED FINANCIAL DATA
Years Ended December 31,2009 2010 2011 2012 2013
(in thousands, except per share data)
Statements of Operations Data (1): Net sales $ 694,739 $ 713,723 $ 725,077 $ 767,140 $ 762,704Cost of sales (2) 357,407 348,339 350,143 361,297 350,287Gross profit 337,332 365,384 374,934 405,843 412,417Selling and administrative 266,310 276,463 276,615 302,469 310,730Research and development 31,837 29,652 28,651 28,214 25,831Impairment of goodwill (3) — — 60,302 — —Medical device excise tax — — — — 5,949Other expense (4) 10,916 2,176 1,092 9,950 13,399Income from operations 28,269 57,093 8,274 65,210 56,508(Gain) loss on early extinguishment of debt (5) (1,083) 79 — — 263Amortization of debt discount 4,111 4,244 3,903 — —Interest expense 7,086 7,113 6,676 5,730 5,613Income (loss) before income taxes 18,155 45,657 (2,305) 59,480 50,632Provision (benefit) for income taxes 6,018 15,311 (3,057) 18,999 14,693Net income $ 12,137 $ 30,346 $ 752 $ 40,481 $ 35,939
Per Share Data Basic earnings per share $ 0.42 $ 1.06 $ .03 $ 1.43 $ 1.30
Diluted earnings per share $ 0.42 $ 1.05 $ .03 $ 1.41 $ 1.28
Dividends per share of common stock $ — $ — $ — $ 0.60 $ 0.65
Weighted Average Number of CommonShares In Calculating:
Basic earnings per share 29,074 28,715 28,246 28,301 27,722Diluted earnings per share 29,142 28,911 28,633 28,653 28,114
Other Financial Data: Depreciation and amortization $ 41,283 $ 41,807 $ 42,687 $ 46,616 $ 47,867Capital expenditures 21,444 14,732 17,552 21,532 18,445
Balance Sheet Data (at period end): Cash and cash equivalents $ 10,098 $ 12,417 $ 26,048 $ 23,720 $ 54,443Total assets 958,413 985,773 935,594 1,078,849 1,090,508Long-term obligations 302,791 219,344 231,339 346,637 372,924Total shareholders’ equity 576,515 586,563 573,071 606,998 606,319
20
(1) Results of operations of acquired businesses have been recorded in the financial statements since the date of acquisition.
(2) In 2009, 2010, 2011, 2012 and 2013, we incurred charges related to the restructuring of certain of our operations of $12.7 million, $2.4 million, $3.5 million, $7.1 million and $6.5 million, respectively; in 2010 and 2013 we incurred charges of $2.5 million and $2.1 million, respectively, related to the termination of a product offering. See additional discussion in Note 15 to the Consolidated Financial Statements.
(3) During 2011, we recorded a $60.3 million charge for the impairment of goodwill related to the legacy CONMED Patient Care reporting unit. Refer to Note 4 to the Consolidated Financial Statements for further details.
(4) Other expense includes the following:
2009 2010 2011 2012 2013
New plant/facility consolidation $ 2,726 $ — $ — $ — $ —Net pension gain (1,882) — — — —Product recall 5,992 — — — —Administrative consolidation costs 4,080 2,176 792 6,497 8,750Costs associated with purchase of a distributor — — 300 704 —Costs associated with legal arbitration and patentdispute — — — 1,555 3,206Pension settlement expense — — — — 1,443Costs associated with purchase of a business — — — 1,194 —Other expense $ 10,916 $ 2,176 $ 1,092 $ 9,950 $ 13,399
See additional discussion in Note 11 to the Consolidated Financial Statements.
(5) Includes in 2010 and 2013, a charge of $0.1 million and $0.3 million, respectively, related to a loss on the early extinguishment of debt. Includes in 2009, a gain of $1.1 million on the early extinguishment of debt. See additional discussion in Note 5 to the Consolidated Financial Statements.

21
Item 7. Management’s Discussion and Analysis of Financial Condition and Results of Operations
The following discussion should be read in conjunction with Selected Financial Data (Item 6), and our Consolidated Financial Statements and related notes contained elsewhere in this report. Overview of CONMED Corporation
CONMED Corporation (“CONMED”, the “Company”, “we” or “us”) is a medical technology company with an emphasis on surgical devices and equipment for minimally invasive procedures and monitoring. The Company’s products are used by surgeons and physicians in a variety of specialties including orthopedics, general surgery, gynecology, neurosurgery, and gastroenterology.
During 2011 and 2012, we undertook a variety of restructuring initiatives aimed at improving efficiency and internal effectiveness. These initiatives included changes in management lines of reporting and culminated in the implementation of a functional organizational structure. Under the new structure, we are now organized by function rather than by operating segment. Executives reporting in to the CEO include those responsible for operations and supply chain management, research and development, sales, marketing and certain corporate functions. Our chief operating decision maker (the CEO) evaluates the various global product portfolios on a net sales basis and evaluates profitability, investment and cash flow metrics on a consolidated worldwide basis due to shared infrastructure and resources. As a result, we have discontinued accounting and reporting for our businesses as five separate, operating segments. Effective January 1, 2013, we are accounting and reporting for our business as a single segment entity engaged in the development, manufacturing and sale on a global basis of surgical devices and related equipment.
As part of this reporting structure change, we also restructured our product lines. Orthopedic surgery consists of sports medicine instrumentation and small bone, large bone and specialty powered surgical instruments and service fees related to the promotion and marketing of sports medicine allograft tissue. General surgery consists of a complete line of endo-mechanical instrumentation for minimally invasive laparoscopic and gastrointestinal procedures, a line of cardiac monitoring products as well as electrosurgical generators and related instruments. Surgical visualization consists of 2D and 3D video systems for use in minimally invasive orthopedic and general surgery. These product lines as a percentage of consolidated net sales are as follows:
2011 2012 2013Orthopedic surgery 51% 54% 54%General surgery 40 37 37Surgical visualization 9 9 9
Consolidated net sales 100% 100% 100%
A significant amount of our products are used in surgical procedures with approximately 80% of our revenues derived from the sale of disposable products. Our capital equipment offerings also facilitate the ongoing sale of related disposable products and accessories, thus providing us with a recurring revenue stream. We manufacture substantially all of our products in facilities located in the United States and Mexico. We market our products both domestically and internationally directly to customers and through distributors. International sales approximated 50%, 50% and 51% in 2011, 2012 and 2013, respectively. Business Environment and Opportunities
The aging of the worldwide population along with lifestyle changes, continued cost containment pressures on healthcare systems and the desire of clinicians and administrators to use less invasive (or noninvasive) procedures are important trends which are driving the long-term growth in our industry. We believe that with our broad product offering of high quality surgical and patient care products, we can capitalize on this growth for the benefit of the Company and our shareholders.
In order to further our growth prospects, we have historically used strategic business acquisitions and exclusive distribution relationships to continue to diversify our product offerings, increase our market share and realize economies of scale. We have a variety of research and development initiatives focused in each of our principal product lines as continued innovation and commercialization of new proprietary products and processes are essential elements of our long-term growth strategy. Our reputation as an innovator is exemplified by recent new product introductions such as the Y-Knot® Flex System for instability repairs featuring the smallest double-loaded (1.8mm) anchors available and curved, flexible instrumentation to help

22
surgeons achieve ideal anchor placement and the Y-Knot® RC anchors for rotator cuffs are the world’s only self-punching all-suture anchors which helps simplify techniques while its small size is designed to improve placement options; the new D4000 Resection System featuring an intuitive touchscreen display and direct pump integration for a seamless clinical experience; the IM8000 2DHD Camera System can be used in multi-specialty procedures and includes a new autoclavable camera head featuring proprietary CMOS technology for clear, crisp imagery and a new LS8000 LED light source providing improved light sensitivity for clearer visualization; the new Hall 50™ Powered Instrument System can be used in total joint replacements featuring lighter, ergonomically-designed handpieces to provide a comfortable, high-performance clinical experience while the new Hall UL-approved autoclavable lithium batteries deliver dependable, long-lasting power and the unique, multi-tray system also provides hospitals with new levels of sterilization convenience; the new GS2000 50L Insufflator features the market’s fastest flow rate and a dual-tank shuttle valve system to help provide clear and consistent laparoscopic visualization; the EntriPort line of trocars help deliver effective sealing and clear visualization in a wide range of sizes optimal for nearly every minimally invasive abdominal surgical application; our new D-Flex probes were designed for use with the da Vinci® Surgical System and enable non-contact hemostasis with argon gas and our DetachaTip® III Multi-Use Endosurgery Instruments offer the optimal blend of performance and cost efficiency - combining precise, reliable, and comfortable performance with dramatically reduced procedural costs.
Business Challenges Significant volatility in the financial markets and foreign currency exchange rates as well as depressed economic conditions in both domestic and international markets, have presented significant business challenges since the second half of 2008. While we returned to revenue growth in 2010, 2011 and 2012, we experienced a sales decline during 2013. We are cautiously optimistic that the domestic economic environment is improving, however conditions in Europe and elsewhere may present significant business challenges for the Company. While there can be no assurance that improvement in the overall economic environment will be sustained, we will continue to monitor and manage the impact of the overall economic environment on the Company.
Over the past few years we successfully completed certain of our operational restructuring plans whereby we consolidated manufacturing and distribution centers as well as restructured certain of our administrative functions. We continue to restructure both operations and administrative functions as necessary throughout the organization. However, we cannot be certain such activities will be completed in the estimated time period or that planned cost savings will be achieved.
Our facilities are subject to periodic inspection by the United States Food and Drug Administration (“FDA”) and foreign regulatory agencies or notified bodies for, among other things, conformance to Quality System Regulation and Current Good Manufacturing Practice (“CGMP”) requirements and foreign or international standards. We are committed to the principles and strategies of systems-based quality management for improved CGMP compliance, operational performance and efficiencies through our Company-wide quality systems initiatives. However, there can be no assurance that our actions will ensure that we will not receive a warning letter or be the subject of other regulatory action, which may include consent decrees or fines, that we will not conduct product recalls or that we will not experience temporary or extended periods during which we may not be able to sell products in foreign countries. During the third quarter of 2013, the FDA inspected our Centennial, CO manufacturing facility and issued a Form 483 with observations on September 20, 2013. The Company subsequently submitted responses to the Observations, and the FDA issued a Warning Letter on January 30, 2014 relating to the inspection and the responses to the Form 483 Observations. Accordingly, we are undertaking corrective actions that may involve additional costs for the Company. These remediation costs are not expected to be material, however there can be no assurance that the actions undertaken by the Company will ensure that the Company will not undertake recalls, voluntary or otherwise, nor can there be any assurance that a future inspection by the FDA will not result in an additional Form 483 or warning letter, or other regulatory actions which may include consent decrees or fines.
Critical Accounting Policies
Preparation of our financial statements requires us to make estimates and assumptions which affect the reported amounts of assets, liabilities, revenues and expenses. Note 1 to the Consolidated Financial Statements describes the significant accounting policies used in preparation of the Consolidated Financial Statements. The most significant areas involving management judgments and estimates are described below and are considered by management to be critical to understanding the financial condition and results of operations of CONMED Corporation. Revenue Recognition
Revenue is recognized when title has been transferred to the customer which is at the time of shipment. The following policies apply to our major categories of revenue transactions:

23
• Sales to customers are evidenced by firm purchase orders. Title and the risks and rewards of ownership are transferred to the customer when product is shipped under our stated shipping terms. Payment by the customer is due under fixed payment terms and collectability is reasonably assured.
• We place certain of our capital equipment with customers on a loaned basis in return for commitments to purchase related single-use products over time periods generally ranging from one to three years. In these circumstances, no revenue is recognized upon capital equipment shipment as the equipment is loaned and subject to return if certain minimum single-use purchases are not met. Revenue is recognized upon the sale and shipment of the related single-use products. The cost of the equipment is amortized over its estimated useful life.
• We recognize revenues related to the promotion and marketing of sports medicine allograft tissue in accordance with the contractual terms of our agreement with Musculoskeletal Transplant Foundation (“MTF”) on a net basis as our role is limited to that of an agent earning a commission or fee. MTF records revenue when the tissue is shipped to the customer. Our services are completed at this time and net revenues for the “Service Fee” for our promotional and marketing efforts are then recognized based on a percentage of the net amounts billed by MTF to its customers. The timing of revenue recognition is determined through review of the net billings made by MTF each month. Our net commission Service Fee is based on the contractual terms of our agreement and is currently 50%. This percentage can vary over the term of the agreement but is contractually determinable. Our Service Fee revenues are recorded net of amortization of the acquired assets, which are being expensed over the expected useful life of 25 years.
• Product returns are only accepted at the discretion of the Company and in accordance with our “Returned Goods Policy”. Historically the level of product returns has not been significant. We accrue for sales returns, rebates and allowances based upon an analysis of historical customer returns and credits, rebates, discounts and current market conditions.
• Our terms of sale to customers generally do not include any obligations to perform future services. Limited warranties are provided for capital equipment sales and provisions for warranty are provided at the time of product sale based upon an analysis of historical data.
• Amounts billed to customers related to shipping and handling have been included in net sales. Shipping and handling costs included in selling and administrative expense were $13.0 million, $12.8 million and $12.6 million for 2011, 2012 and 2013, respectively.
• We sell to a diversified base of customers around the world and, therefore, believe there is no material concentration of credit risk.
• We assess the risk of loss on accounts receivable and adjust the allowance for doubtful accounts based on this risk assessment. Historically, losses on accounts receivable have not been material. Management believes that the allowance for doubtful accounts of $1.4 million at December 31, 2013 is adequate to provide for probable losses resulting from accounts receivable.
Inventory Valuation
We write-off excess and obsolete inventory resulting from the inability to sell our products at prices in excess of current carrying costs. The markets in which we operate are highly competitive, with new products and surgical procedures introduced on an on-going basis. Such marketplace changes may result in our products becoming obsolete. We make estimates regarding the future recoverability of the costs of our products and record a provision for excess and obsolete inventories based on historical experience, expiration of sterilization dates and expected future trends. If actual product life cycles, product demand or acceptance of new product introductions are less favorable than projected by management, additional inventory write-downs may be required.
Goodwill and Intangible Assets
We have a history of growth through acquisitions. Assets and liabilities of acquired businesses are recorded at their estimated fair values as of the date of acquisition. Goodwill represents costs in excess of fair values assigned to the underlying net assets of acquired businesses. Effective January 1, 2013, we are reporting our business as a single operating segment, and goodwill as a single reporting unit. Changes in our structure are further discussed in Note 8 to the Consolidated Financial Statements. Customer relationships, trademarks, tradenames, patents, and other intangible assets primarily represent allocations of purchase price to identifiable intangible assets of acquired businesses. Promotional, marketing and distribution rights represent intangible

24
assets created under our Sports Medicine Joint Development and Distribution Agreement (the "JDDA") with Musculoskeletal Transplant Foundation (“MTF”). We have accumulated goodwill of $248.4 million and other intangible assets of $319.4 million as of December 31, 2013.
In accordance with FASB guidance, goodwill and intangible assets deemed to have indefinite lives are not amortized, but are subject to at least annual impairment testing. It is our policy to perform our annual impairment testing in the fourth quarter. The identification and measurement of goodwill impairment involves the estimation of the fair value of our business. Estimates of fair value are based on the best information available as of the date of the assessment, which primarily incorporate management assumptions about expected future cash flows and other valuation techniques. Future cash flows may be affected by changes in industry or market conditions or the rate and extent to which anticipated synergies or cost savings are realized with newly acquired entities. During 2013, we completed our goodwill impairment testing with data as of October 1, 2013. We performed a Step 1 impairment test in accordance with ASC 350 utilizing the market capitalization approach to determine whether the fair value of a reporting unit is less than its carrying amount. Based upon our assessment, we believe the fair value continues to exceed carrying value by 99%.
During 2011, we estimated the fair value of the legacy CONMED Patient Care reporting unit (refer to Note 8 for discussion regarding the change in operating segments) utilizing both a market-based approach and an income approach. Under the income approach, we utilized a discounted cash flow valuation methodology and measured the goodwill impairment in accordance with ASC 350. The first step of the impairment test determined the carrying value exceeded fair value and therefore we proceeded to Step 2. Under Step 2, we calculated the amount of impairment loss by measuring the amount the carrying value of goodwill exceeded the implied fair value of the goodwill. We determined the goodwill of our legacy CONMED Patient Care reporting unit was impaired as a result of lower future earnings due to pricing pressures in a number of our product lines and consequently we recorded a goodwill impairment charge of $60.3 million to reduce the carrying amount of the reporting unit's goodwill to its implied fair value.
Intangible assets with a finite life are amortized over the estimated useful life of the asset and are evaluated each reporting period to determine whether events and circumstances warrant a revision to the remaining period of amortization. Intangible assets subject to amortization are reviewed for impairment whenever events or changes in circumstances indicate that its carrying amount may not be recoverable. The carrying amount of an intangible asset subject to amortization is not recoverable if it exceeds the sum of the undiscounted cash flows expected to result from the use of the asset. An impairment loss is recognized by reducing the carrying amount of the intangible asset to its current fair value.
Customer relationship assets arose principally as a result of the 1997 acquisition of Linvatec Corporation. These assets represent the acquisition date fair value of existing customer relationships based on the after-tax income expected to be derived during their estimated remaining useful life. The useful lives of these customer relationships were not and are not limited by contract or any economic, regulatory or other known factors. The estimated useful life of the Linvatec customer relationship assets was determined as of the date of acquisition as a result of a study of the observed pattern of historical revenue attrition during the 5 years immediately preceding the acquisition of Linvatec Corporation. This observed attrition pattern was then applied to the existing customer relationships to derive the future expected useful life of the customer relationships. This analysis indicated an annual attrition rate of 2.6%. Assuming an exponential attrition pattern, this equated to an average remaining useful life of approximately 38 years for the Linvatec customer relationship assets. Customer relationship intangible assets arising as a result of other business acquisitions are being amortized over a weighted average life of 15 years. The weighted average life for customer relationship assets in aggregate is 33 years.
We evaluate the remaining useful life of our customer relationship intangible assets each reporting period in order to determine whether events and circumstances warrant a revision to the remaining period of amortization. In order to further evaluate the remaining useful life of our customer relationship intangible assets, we perform an analysis and assessment of actual customer attrition and activity as events and circumstances warrant. This assessment includes a comparison of customer activity since the acquisition date and review of customer attrition rates. In the event that our analysis of actual customer attrition rates indicates a level of attrition that is in excess of that which was originally contemplated, we would change the estimated useful life of the related customer relationship asset with the remaining carrying amount amortized prospectively over the revised remaining useful life.
We test our customer relationship assets for recoverability whenever events or changes in circumstances indicate that the carrying amount may not be recoverable. Factors specific to our customer relationship assets which might lead to an impairment charge include a significant increase in the annual customer attrition rate or otherwise significant loss of customers, significant decreases in sales or current-period operating or cash flow losses or a projection or forecast of losses. We do not believe that there have been events or changes in circumstances which would indicate the carrying amount of our customer relationship assets might not be recoverable.
25
For all other indefinite lived intangible assets, we perform a qualitative impairment test in accordance with ASC 350. Based upon this assessment, we have determined that it is unlikely that our indefinite lived intangible assets are impaired.
See Note 4 to the Consolidated Financial Statements for further discussion of goodwill and other intangible assets.
Pension Plan
We sponsor a defined benefit pension plan (the “pension plan”) that was frozen in 2009. It covered substantially all our United States based employees at the time it was frozen. Major assumptions used in accounting for the plan include the discount rate, expected return on plan assets, rate of increase in employee compensation levels and expected mortality. Assumptions are determined based on Company data and appropriate market indicators, and are evaluated annually as of the plan’s measurement date. A change in any of these assumptions would have an effect on net periodic pension costs reported in the consolidated financial statements.
The weighted-average discount rate used to measure pension liabilities and costs is set by reference to the Citigroup Pension Liability Index. However, this index gives only an indication of the appropriate discount rate because the cash flows of the bonds comprising the index do not match precisely the projected benefit payment stream of the plan. For this reason, we also consider the individual characteristics of the plan, such as projected cash flow patterns and payment durations, when setting the discount rate. The rates used in determining 2013 and 2014 pension expense are 3.90% and 4.75%, respectively.
We have used an expected rate of return on pension plan assets of 8.0% for purposes of determining the net periodic pension benefit cost. In determining the expected return on pension plan assets, we consider the relative weighting of plan assets, the historical performance of total plan assets and individual asset classes and economic and other indicators of future performance. In addition, we consult with financial and investment management professionals in developing appropriate targeted rates of return.
Pension expense in 2014 is not expected to be material. Pension expense was $2.6 million in 2013, including $1.4 million in pension settlement expenses resulting from a higher level of lump sum withdrawals from pension plan participants during 2013. In addition, we do not expect to make any contributions to the pension plan for the 2014 plan year.
In performing a sensitivity analysis on our pension plan expense, we do not believe a 0.25% increase or decrease in discount rate or investment return would have a material impact on our pension expense.
See Note 9 to the Consolidated Financial Statements for further discussion. Stock-based Compensation
All share-based payments to employees, including grants of employee stock options, restricted stock units, performance share units and stock appreciation rights are recognized in the financial statements based at their fair values. Compensation expense is generally recognized using a straight-line method over the vesting period. Compensation expense for performance share units is recognized using the graded vesting method. Income Taxes
The recorded future tax benefit arising from deductible temporary differences and tax carryforwards is approximately $33.0 million at December 31, 2013. Management believes that earnings during the periods when the temporary differences become deductible will be sufficient to realize the related future income tax benefits. The Company is subject to taxation in the United States and various states and foreign jurisdictions. Taxing authority examinations can involve complex issues and may require an extended period of time to resolve. Our Federal income tax returns have been examined by the Internal Revenue Service (“IRS”) for calendar years ending through 2012. Tax years subsequent to 2012 are subject to future examination.
Consolidated Results of Operations
The following table presents, as a percentage of net sales, certain categories included in our consolidated statements of comprehensive income for the periods indicated:

26
Year Ended December 31, 2011 2012 2013Net sales 100.0% 100.0% 100.0%Cost of sales 48.3 47.1 45.9
Gross margin 51.7 52.9 54.1Selling and administrative expense 38.1 39.4 40.7Research and development expense 4.0 3.7 3.4Impairment of goodwill 8.3 — —Medical device excise tax — — 0.8Other expense 0.2 1.3 1.8
Income from operations 1.1 8.5 7.4Loss on early extinguishment of debt — — 0.0Amortization of debt discount 0.5 — —Interest expense 0.9 0.7 0.7Income (loss) before income taxes (0.3) 7.8 6.7Provision (benefit) for income taxes (0.4) 2.5 1.9
Net income 0.1% 5.3% 4.8%
2013 Compared to 2012
Sales for 2013 were $762.7 million, a decrease of $4.4 million (-0.6%) compared to sales of $767.1 million in 2012 with the decreases occurring in our orthopedic surgery and visualization product lines. In local currency, excluding the effects of the hedging program, sales increased 0.2%. Sales of capital equipment decreased $2.2 million (-1.4%) to $153.7 million in 2013 from $155.9 million in 2012; sales of single-use products decreased $2.2 million (-0.4%) to $609.0 million in 2013 from $611.2 million in 2012. In local currency, excluding the effects of the hedging program, sales of capital equipment decreased 0.8% while single-use increased 0.4%.
• Orthopedic surgery sales decreased $3.7 million (-0.9%) in 2013 to $410.2 million from $413.9 million in 2012 mainly due to lower sales in our resection product offerings and large bone burs and blades. In local currency, excluding the effects of the hedging program, sales increased 0.1%.
• General surgery sales remained relatively flat with a $0.1 million (0.0%) increase in 2013 to $286.7 million from $286.6 million in 2012 mainly due to increased sales in our endomechanical, gastrointestinal and pulmonary product offerings offset by decreased sales in our advanced energy and patient monitoring product offerings. In local currency, excluding the effects of the hedging program, sales increased 0.5%.
• Surgical visualization sales decreased $0.8 million (-1.2%) in 2013 to $65.8 million from $66.6 million in 2012 mainly due to lower video system product sales. In local currency, excluding the effects of the hedging program, sales decreased -0.9%.
Cost of sales decreased to $350.3 million in 2013 as compared to $361.3 million in 2012. Gross profit margins increased
1.2 percentage points to 54.1% in 2013 as compared to 52.9% in 2012. The increase in gross profit margins of 1.2 percentage points is primarily a result of the lower costs resulting from the restructuring initiatives we have completed throughout our operation.
Selling and administrative expense increased to $310.7 million in 2013 compared to $302.5 million in 2012. Selling and administrative expense as a percentage of net sales increased to 40.7% in 2013 from 39.4% in 2012. This increase of 1.3 percentage points is attributable to higher benefit costs, lower overall sales, and higher selling and marketing expenses during the period.
Research and development expense was $25.8 million in 2013 compared to $28.2 million in 2012. As a percentage of net sales, research and development expense decreased to 3.4% in 2013 compared to 3.7% in 2012. The decrease of 0.3 percentage points is mainly the result of the timing of projects.
In accordance with the Patient Protection and Affordable Care Act and Health Care and Education Affordability Reconciliation Act, the Company was required in 2013 to begin paying a 2.3% excise tax imposed upon sales within the U.S. of certain medical device products. The medical device excise tax expense totaled $5.9 million in 2013.

27
As discussed in Note 11 to the Consolidated Financial Statements, other expense in 2013 consisted of an $8.8 million
charge related to administrative consolidation expenses, $3.2 million in legal costs associated with a patent infringement claim and a $1.4 million pension settlement expense as further described in Note 10. Other expense in 2012 consisted of a $6.5 million charge related to administrative consolidation expenses, a $0.7 million charge related to the purchase of the Company's former distributor for the Nordic region of Europe, $1.6 million in costs associated with a contractual dispute with a former distributor and $1.2 million in costs associated with the purchase of Viking Systems, Inc..
As discussed in Note 5 to the Consolidated Financial Statements, we entered into an amended and restated senior credit agreement on January 17, 2013. In connection with the refinancing, we recorded a $0.3 million loss on the early extinguishment of debt related to the write-off of unamortized deferred financing costs under the then existing senior credit agreement.
Interest expense was $5.6 million in 2013 compared to $5.7 million in 2012. The decrease in interest expense is due to lower weighted average interest rates on higher weighted average borrowings outstanding in 2013 as compared to the same period a year ago. The weighted average interest rates on our borrowings decreased to 2.39% in 2013 as compared to 3.03% in 2012. A provision for income taxes was recorded at an effective rate of 29.0% in 2013 and 31.9% in 2012 as compared to the Federal statutory rate of 35.0%. The effective tax rate is lower than that recorded in the same period a year ago as a result of a greater proportion of earnings in foreign jurisdictions where the corporate tax rate and deduction for notional interest on equity allowed against taxable profits in Europe result in effective tax rates lower than the statutory rate, tax benefits recorded in the third quarter of 2013 as a result of taxing authority determinations, and tax benefits related to business tax provisions, including the research and development credit ($0.8 million), that were enacted in the first quarter of 2013, retroactive to January 1, 2012. A reconciliation of the United States statutory income tax rate to our effective tax rate is included in Note 6 to the Consolidated Financial Statements. 2012 Compared to 2011
Sales for 2012 were $767.1 million, an increase of $42.0 million (5.8%) compared to sales of $725.1 million in 2011 with the increases in our orthopedic surgery and surgical visualization product lines. The distribution agreement with Musculoskeletal Transplant Foundation ("MTF") accounted for a 3.9% annual sales increase. In local currency, excluding the effects of the hedging program, sales increased 5.7%. Sales of capital equipment decreased $6.1 million (-3.8%) to $155.9 million in 2012 from $162.0 million in 2011; sales of single-use products increased $48.1 million (8.5%) to $611.2 million in 2012 from $563.1 million in 2011. In local currency, excluding the effects of the hedging program, sales of capital equipment decreased 3.7% while single-use products increased 8.4%. We believe the overall decline in capital sales is driven by capital purchasing constraints in hospitals due to depressed economic conditions.
• Orthopedic surgery sales increased $42.7 million (11.5%) in 2012 to $413.9 million from $371.2 million in 2011 mainly due to the distribution agreement with MTF, increased sales of our procedure specific, large bone burs and blades and small bone handpiece product offerings. In local currency, excluding the effects of the hedging program sales increased 11.4%.
• General surgery sales decreased $0.8 million (-0.3%) in 2012 to $286.6 million from $287.4 million in 2011 mainly due to lower sales in our patient monitoring products and advanced energy products offset by increases in our gastrointestinal and pulmonary products. In local currency, excluding the effects of the hedging program, sales decreased -0.4%.
• Surgical visualization sales remained relatively flat, with a $0.1 million (0.2%) increase in 2012 to $66.6 million from $66.5 million in 2011 due to higher video systems sales. In local currency, excluding the effects of the hedging program, sales increased 0.7% .
Cost of sales increased to $361.3 million in 2012 as compared to $350.1 million in 2011. Gross profit margins increased 1.2 percentage points to 52.9% in 2012 as compared to 51.7% in 2011. The increase in gross profit margins of 1.2 percentage points is primarily a result of the distribution agreement we entered into during 2012 with MTF as further described in Note 4 to the Consolidated Financial Statements (1.5 percentage points) and product mix offset by the impact of unfavorable foreign exchange rates on sales and higher restructuring charges than the same period a year ago.
Selling and administrative expense increased to $302.5 million in 2012 compared to $276.6 million in 2011. Selling and administrative expense as a percentage of net sales increased to 39.4% in 2012 from 38.1% in 2011. This increase of 1.3 percentage points is primarily attributable to higher selling expenses mainly related to our MTF distribution agreement and acquisition of our

28
former distributor for the Nordic region of Europe.
Research and development expense was $28.2 million in 2012 compared to $28.7 million in 2011. As a percentage of net sales, research and development expense decreased to 3.7% in 2012 compared to 4.0% in 2011. The decrease of 0.3 percentage points is mainly a result of relatively flat spending on increased sales in 2012.
During 2011, we recorded a $60.3 million charge for the impairment of goodwill related to our legacy Patient Care reporting unit. Refer to Note 4 to the Consolidated Financial Statements for further details.
As discussed in Note 11 to the Consolidated Financial Statements, other expense in 2012 consisted of a $6.5 million charge related to administrative consolidation expenses, a $0.7 million charge related to the purchase of the Company's former distributor for the Nordic region of Europe, $1.6 million in costs associated with a contractual dispute with a former distributor and $1.2 million in costs associated with the purchase of Viking Systems, Inc.. Other expense in 2011 consisted of a $0.8 million charge related to the consolidation of administrative functions and a $0.3 million charge related to the purchase of the Company's former distributor for the Nordic region of Europe.
Amortization of debt discount was $3.9 million in 2011. The debt discount on the Notes was amortized through November 2011.
Interest expense was $5.7 million in 2012 compared to $6.7 million in 2011. The decrease in interest expense is due to lower weighted average interests rates on higher weighted average borrowings outstanding in 2012 as compared to the same period a year ago. The weighted average interest rates on our borrowings decreased to 3.03% in 2012 as compared to 3.66% in 2011.
A provision for income taxes was recorded at an effective rate of 31.9% in 2012 and -132.6% in 2011 as compared to the Federal statutory rate of 35.0%. Income tax expense recorded in 2012 was higher than recorded in the same period a year ago as a result of increased pre-tax earnings, offset by higher earnings in foreign jurisdictions where the tax rates are lower than the statutory federal rate and tax benefits recorded in 2012 as a result of determinations received from multiple taxing authorities. A reconciliation of the United States statutory income tax rate to our effective tax rate is included in Note 6 to the Consolidated Financial Statements.
Liquidity and Capital Resources Our liquidity needs arise primarily from capital investments, working capital requirements and payments on indebtedness under the amended and restated senior credit agreement, described below. We have historically met these liquidity requirements with funds generated from operations and borrowings under our revolving credit facility. In addition, we have historically used term borrowings, including borrowings under the amended and restated senior credit agreement and borrowings under separate loan facilities, in the case of real property purchases, to finance our acquisitions. We also have the ability to raise funds through the sale of stock or we may issue debt through a private placement or public offering. We believe that our cash on hand, cash from operating activities and proceeds from our amended and restated senior credit agreement provide us with sufficient financial resources to meet our anticipated capital requirements and obligations as they come due.
We had total cash on hand at December 31, 2013 of $54.4 million, of which approximately $45.2 million was held by our foreign subsidiaries outside the United States with unremitted earnings. During the fourth quarter of 2011, we repatriated $16.2 million of foreign earnings to the United States. We do not currently intend to repatriate additional funds held outside of the United States in the foreseeable future. If we were to repatriate these funds, we would be required to accrue and pay taxes on such amounts. Operating cash flows
Our net working capital position was $260.9 million at December 31, 2013. Net cash provided by operating activities was $103.0 million in 2011, $95.2 million in 2012 and $80.9 million in 2013 generated on net income of $0.8 million in 2011, $40.5 million in 2012 and $35.9 million in 2013.
The decrease in cash provided by operating activities is primarily the result of the payments related to the medical device excise tax that became effective January 1, 2013 and changes in working capital accounts in 2013.
Investing cash flows

29
Net cash used in investing activities during 2013, consisted primarily of capital expenditures. Capital expenditures were $17.6 million, $21.5 million and $18.4 million in 2011, 2012 and 2013, respectively. Capital expenditures are expected to approximate $20.0 million in 2014. The decrease in the cash used in investing activities during 2013 is the result of $64.1 million in payments related to the distribution and development agreement with MTF and purchase of Viking Systems, Inc. for $22.5 million during 2012. Financing cash flows
Financing activities in 2013 resulted in a use of cash of $31.3 million compared to proceeds of cash of $11.4 million in 2012. During 2013, we repurchased common stock totaling $50.6 million compared to only $3.9 million in 2012. We also had a $34.0 million payment associated with the distribution and development agreement with MTF. Finally, we made $16.7 million in dividend payments in 2013 compared to $12.9 million in 2012; 2012 included only three quarters of payments as this was the first year we paid dividends. This increased use of cash in 2013 was offset by $17.3 million in proceeds from the issuance of common stock under our equity compensation plans and employee stock purchase plan during 2013 compared to only $10.2 million in 2012 as a result of increases in exercises in 2013. 2012 also consisted of $53.6 million in repayments of term borrowings under our then outstanding senior credit agreement.
On January 17, 2013, we entered into an amended and restated $350.0 million senior credit agreement (the "amended and restated senior credit agreement"). The amended and restated senior credit agreement consists of a $350.0 million revolving credit facility expiring on January 17, 2018. In connection with the refinancing, we recorded a $0.3 million loss on the early extinguishment of debt related to the write-off of unamortized deferred financing costs under the then existing senior credit agreement. Interest rates are at LIBOR plus 1.625% (1.795% at December 31, 2013) or an alternative base rate. For those borrowings where we elect to use the alternative base rate, the base rate will be the greater of the Prime Rate, the Federal Funds Rate in effect on such date plus 0.50%, or the one month Eurocurrency rate plus 1%, plus an additional margin of 0.625%. As described in Note 4, we entered into a distribution and development agreement with MTF on January 3, 2012 and used cash on hand and available borrowings under our revolving credit facility to fund the up front payment of $63.0 million and contingent payment made on January 3, 2013 of $34.0 million. We expect to fund the remaining $50.0 million in contingent payments, including the $16.7 million paid on January 3, 2014, through cash on hand and available borrowings under our revolving credit facility as these payments come due over the next three years.
There were $208.0 million in borrowings outstanding under the revolving credit facility as of December 31, 2013. Our available borrowings on the revolving credit facility at December 31, 2013 were $134.2 million with approximately $7.8 million of the facility set aside for outstanding letters of credit.
The amended and restated senior credit agreement is collateralized by substantially all of our personal property and assets. The senior credit agreement contains covenants and restrictions which, among other things, require the maintenance of certain financial ratios, and restrict dividend payments and the incurrence of certain indebtedness and other activities, including acquisitions and dispositions. We were in full compliance with these covenants and restrictions as of December 31, 2013. We are also required, under certain circumstances, to make mandatory prepayments from net cash proceeds from any issuance of equity and asset sales.
We have a mortgage note outstanding in connection with the Largo, Florida property and facilities bearing interest at 8.25% per annum with semiannual payments of principal and interest through June 2019. The principal balance outstanding on the mortgage note aggregated $7.6 million at December 31, 2013. The mortgage note is collateralized by the Largo, Florida property and facilities.
Our Board of Directors has authorized a $200.0 million share repurchase program. Through December 31, 2013, we have repurchased a total of 5.7 million shares of common stock aggregating $145.7 million under this authorization and have $54.3 million remaining available for share repurchases. The repurchase program calls for shares to be purchased in the open market or in private transactions from time to time. We may suspend or discontinue the share repurchase program at any time. We repurchased $50.6 million under the share repurchase program in 2013. We have financed the repurchases and may finance additional repurchases through operating cash flow and from available borrowings under our revolving credit facility.
Management believes that cash flow from operations, including cash and cash equivalents on hand and available borrowing capacity under our amended and restated senior credit agreement, will be adequate to meet our anticipated operating working capital requirements, debt service, funding of capital expenditures and common stock repurchases in the foreseeable future. See “Item 1. Business – Forward Looking Statements.” Restructuring

30
During 2011, 2012 and 2013, we continued our operational restructuring plan which includes the transfer of additional production lines from manufacturing facilities located in the United States to our manufacturing facility in Chihuahua, Mexico and the consolidation of our Finland operations into our Largo, Florida and Utica, New York manufacturing facilities. During the first quarter of 2013, we began the consolidation of our Westborough, Massachusetts operations into our Largo, Florida and Chihuahua, Mexico facilities. For the years ending December 31, 2011, 2012 and 2013, we charged $3.5 million, $7.1 million, and $6.5 million, respectively, to cost of goods sold related to our restructuring plan. These costs include severance and other charges associated with the transfer of production to Mexico and consolidation of our Finland and Westborough, Massachusetts operations. We expect this phase of our plan to be substantially completed in the first quarter of 2014.
As part of our ongoing restructuring, the Company discontinued a patient monitoring product offering and incurred $2.1 million in costs which were charged to cost of goods sold during the year ending December 31, 2013.
During 2011, 2012 and 2013, we consolidated certain administrative functions throughout the Company and incurred $0.8 million, $6.5 million, and $8.8 million, respectively, in related costs consisting principally of severance charges. These costs were charged to other expense.
We have recorded an accrual in current liabilities of $3.1 million at December 31, 2013 mainly related to severance and lease impairment costs associated with the restructuring. We expect this phase of our plan and related cash payments to be substantially completed in 2014.
We plan to continue to restructure both operations and administrative functions as necessary throughout the organization. As the restructuring plan progresses, we will incur additional charges, including employee termination and other exit costs. We estimate restructuring costs associated with the Finland and Westborough, Massachusetts consolidations and other legal costs related to a patent dispute will approximate $4.0 million to $5.0 million in 2014 and will be charged to cost of goods sold and other expense.
During February 2014, the Company announced a new phase of the restructuring plan to consolidate our Centennial, Colorado manufacturing operations into other existing CONMED manufacturing facilities. We expect this plan to be completed over the next 24 months and are in the process of determining the total costs expected to be incurred.
Refer to Note 15 to the Consolidated Financial Statements for further discussions regarding restructuring.
Contractual Obligations
The following table summarizes our contractual obligations for the next five years and thereafter (amounts in thousands) as of December 31, 2013. Purchase obligations represent purchase orders for goods and services placed in the ordinary course of business. There were no capital lease obligations as of December 31, 2013.
Payments Due by Period
TotalLess than
1 Year 1-3
Years 3-5
YearsMore than
5 Years
Long-term debt $ 215,575 $ 1,140 $ 2,573 $ 211,026 $ 836Contingent consideration 50,000 16,667 33,333 — —Purchase obligations 40,130 39,996 134 — —Operating lease obligations 28,529 6,723 9,926 6,874 5,006Total contractual obligations $ 334,234 $ 64,526 $ 45,966 $ 217,900 $ 5,842
In addition to the above contractual obligations, we are required to make periodic interest payments on our long-term debt obligations (see additional discussion under Item 7A. “Quantitative and Qualitative Disclosures About Market Risk—Interest Rate Risk” and Note 5 to the Consolidated Financial Statements). The above table also does not include unrecognized tax benefits of approximately $0.6 million, the timing and certainty of recognition for which is not known. (See Note 6 to the Consolidated Financial Statements).
Stock-based Compensation

31
We have reserved shares of common stock for issuance to employees and directors under three shareholder-approved share-based compensation plans (the "Plans"). The Plans provide for grants of options, stock appreciation rights (“SARs”), dividend equivalent rights, restricted stock, restricted stock units (“RSUs”), performance share units (“PSUs”) and other equity-based and equity-related awards. The exercise price on all outstanding options and SARs is equal to the quoted fair market value of the stock at the date of grant. RSUs and PSUs are valued at the market value of the underlying stock on the date of grant. Stock options, SARs, RSUs and PSUs are non-transferable other than on death and generally become exercisable over a five year period from date of grant. Stock options and SARs expire ten years from date of grant. SARs are only settled in shares of the Company’s stock. (See Note 7 to the Consolidated Financial Statements).
New Accounting Pronouncements
See Note 14 to the Consolidated Financial Statements for a discussion of new accounting pronouncements.
Item 7A. Quantitative and Qualitative Disclosures About Market Risk
Market risk is the potential loss arising from adverse changes in market rates and prices such as commodity prices, foreign currency exchange rates and interest rates. In the normal course of business, we are exposed to various market risks, including changes in foreign currency exchange rates and interest rates. We manage our exposure to these and other market risks through regular operating and financing activities and as necessary through the use of derivative financial instruments.
Foreign currency risk
Approximately 51% of our total 2013 consolidated net sales were to customers outside the United States. We have sales subsidiaries in a significant number of countries in Europe as well as Australia, Canada, China and Korea. In those countries in which we have a direct presence, our sales are denominated in the local currency amounting to approximately 36% of our total net sales in 2013. The remaining 15% of sales to customers outside the United States was on an export basis and transacted in United States dollars.
Because a significant portion of our operations consist of sales activities in foreign jurisdictions, our financial results may be affected by factors such as changes in foreign currency exchange rates or weak economic conditions in the markets in which we distribute products. During 2013, foreign currency exchange rates, including the effects of the hedging program, caused sales to decrease by approximately $2.3 million and income before income taxes to decrease by approximately $1.5 million, compared to sales and income before income taxes in 2012.
We hedge forecasted intercompany sales denominated in foreign currencies through the use of forward contracts. We account for these forward contracts as cash flow hedges. To the extent these forward contracts meet hedge accounting criteria, changes in their fair value are not included in current earnings but are included in accumulated other comprehensive loss. These changes in fair value will be recognized into earnings as a component of sales or cost of sales when the forecasted transaction occurs. The notional contract amounts for forward contracts outstanding at December 31, 2013 which have been accounted for as cash flow hedges totaled $132.4 million. Net realized gains (losses) recognized for forward contracts accounted for as cash flow hedges approximated -$4.7 million, $3.8 million and $0.2 million for the years ended December 31, 2011, 2012, and 2013 respectively. Net unrealized losses on forward contracts outstanding which have been accounted for as cash flow hedges and which have been included in other comprehensive income totaled $1.4 million at December 31, 2013. It is expected these unrealized losses will be recognized in the consolidated statement of comprehensive income in 2014 and 2015.
We also enter into forward contracts to exchange foreign currencies for United States dollars in order to hedge our currency transaction exposures on intercompany receivables denominated in foreign currencies. These forward contracts settle each month at month-end, at which time we enter into new forward contracts. We have not designated these forward contracts as hedges and have not applied hedge accounting to them. The notional contract amounts for forward contracts outstanding at December 31, 2013 which have not been designated as hedges totaled $42.0 million. Net realized gains (losses) recognized in connection with those forward contracts not accounted for as hedges approximated $0.0 million, -$2.1 million and -$0.3 million for the years ended December 31, 2011, 2012, and 2013, respectively, offsetting gains (losses) on our intercompany receivables of -$0.3 million, $0.8 million and -$0.8 million for the years ended December 31, 2011, 2012, and 2013, respectively. These gains and losses have been recorded in selling and administrative expense in the consolidated statements of comprehensive income.
We record these forward foreign exchange contracts at fair value; the net fair value for forward foreign exchange contracts outstanding at December 31, 2013 was $2.2 million and is included in other current liabilities in the Consolidated Balance Sheets.
Refer to Note 13 in the Consolidated Financial Statements for further discussion.

32
Interest rate risk
At December 31, 2013, we had approximately $208.0 million of variable rate long-term debt outstanding under our senior credit agreement. Assuming no repayments, if market interest rates for similar borrowings averaged 1.0% more in 2014 than they did in 2013, interest expense would increase, and income before income taxes would decrease by $2.1 million. Comparatively, if market interest rates for similar borrowings average 1.0% less in 2014 than they did in 2013, our interest expense would decrease, and income before income taxes would increase by $2.1 million.
Item 8. Financial Statements and Supplementary Data
Our 2013 Financial Statements are included elsewhere herein.
Item 9. Changes In and Disagreements with Accountants on Accounting and Financial Disclosures
There were no changes in or disagreement with accountants on accounting and financial disclosure.
Item 9A. Controls and Procedures
As of the end of the period covered by this report, an evaluation was carried out by CONMED Corporation’s management, with the participation of our Chief Executive Officer and Chief Financial Officer, of the effectiveness of our disclosure controls and procedures (as defined in Rule 13a-15(e) under the Securities Exchange Act of 1934). Based upon that evaluation, our Chief Executive Officer and Chief Financial Officer concluded that these disclosure controls and procedures were effective as of the end of the period covered by this report. In addition, no change in our internal control over financial reporting (as defined in Rule 13a-15(f) under the Securities Exchange Act of 1934) occurred during the fourth quarter of the year ended December 31, 2013 that has materially affected, or is reasonably likely to materially affect, our internal control over financial reporting.
Management’s Report on Internal Control over Financial Reporting and the Report of Independent Registered Public Accounting Firm thereon are set forth in Part IV, Item 15 of the Annual Report on Form 10-K.
Item 9B. Other Information
Not applicable.

33
PART III
Item 10. Directors, Executive Officers and Corporate Governance
The information required by this item is incorporated herein by reference to the sections captioned “Proposal One: Election of Directors” and “Directors, Executive Officers, Other Company Officers and Nominees for the Board of Directors” in CONMED Corporation’s definitive Proxy Statement or other informational filing to be filed with the Securities and Exchange Commission on or about April 10, 2014. Item 11. Executive Compensation
The information required by this item is incorporated herein by reference to the sections captioned “Compensation Discussion and Analysis”, “Summary Compensation Table”, “Grants of Plan-Based Awards”, “Outstanding Equity Awards at Fiscal Year-End”, “Option Exercises and Stock Vested”, “Pension Benefits”, “Non-Qualified Deferred Compensation”, “Potential Payments on Termination or Change-in-Control”, “Director Compensation” and “Board of Directors Interlocks and Insider Participation; Certain Relationships and Related Transactions” in CONMED Corporation’s definitive Proxy Statement or other informational filing to be filed with the Securities and Exchange Commission on or about April 10, 2014.
Item 12. Security Ownership of Certain Beneficial Owners and Management and Related Stockholder Matters
The information required by this item is incorporated herein by reference to the section captioned “Security Ownership of Certain Beneficial Owners and Management” in CONMED Corporation’s definitive Proxy Statement or other informational filing to be filed with the Securities and Exchange Commission on or about April 10, 2014.
Item 13. Certain Relationships and Related Transactions, and Director Independence
The information required by this item is incorporated herein by reference to the section captioned “Board of Directors Interlocks and Insider Participation; Certain Relationships and Related Transactions” in CONMED Corporation’s definitive Proxy Statement or other informational filing to be filed with the Securities and Exchange Commission on or about April 10, 2014.
Item 14. Principal Accounting Fees and Services
The information required by this item is incorporated herein by reference to the section captioned “Principal Accounting Fees and Services” in CONMED Corporation’s definitive Proxy Statement or other informational filing to be filed with the Securities and Exchange Commission on or about April 10, 2014.

34
PART IV
Item 15. Exhibits, Financial Statement Schedules
Index to Financial Statements
(a)(1) List of Financial Statements Page in Form 10-K
Management’s Report on Internal Control Over Financial Reporting 40
Report of Independent Registered Public Accounting Firm 41
Consolidated Balance Sheets at December 31, 2012 and 2013 42
Consolidated Statements of Comprehensive Income for the Years Ended December 31, 2011, 2012 and 2013
43
Consolidated Statements of Shareholders’ Equity for the Years Ended December 31, 2011, 2012 and 2013
44
Consolidated Statements of Cash Flows for the Years Ended December 31, 2011, 2012 and 2013 46
Notes to Consolidated Financial Statements 48
(2) List of Financial Statement Schedules
Valuation and Qualifying Accounts (Schedule II) 75
All other schedules have been omitted because they are not applicable, or the required information is shown in the financial statements or notes thereto.
(3) List of Exhibits
The exhibits listed on the accompanying Exhibit Index on page 37 below are filed as part of this Form 10-K.

35
SIGNATURES
Pursuant to the requirements of Section 13 or 15(d) of the Securities Exchange Act of 1934, the registrant has duly caused this report to be signed on its behalf by the undersigned, thereunto duly authorized on the date indicated below.
CONMED CORPORATION By: /s/ Joseph J. CorasantiJoseph J. Corasanti(President and ChiefExecutive Officer) Date:February 24, 2014
Pursuant to the requirements of the Securities Exchange Act of 1934, this report has been signed below by the following persons on behalf of the registrant and in the capacities and on the dates indicated.

36
Signature Title Date /s/ EUGENE R. CORASANTI Chairman of the Board Eugene R. Corasanti of Directors February 24, 2014 /s/ JOSEPH J. CORASANTI President, Chief Executive Joseph J. Corasanti Officer and Director February 24, 2014 /s/ ROBERT D. SHALLISH, JR. Executive Vice President-Finance Robert D. Shallish, Jr. and Chief Financial Officer (Principal Financial Officer) February 24, 2014 /s/ LUKE A. POMILIO Executive Vice President- Luke A. Pomilio Controller and Corporate General Manager (Principal
Accounting Officer)February 24, 2014
/s/ BRIAN CONCANNONBrian Concannon Director February 24, 2014
/s/ BRUCE F. DANIELS Bruce F. Daniels Director February 24, 2014 /s/ JO ANN GOLDEN Jo Ann Golden Director February 24, 2014 /s/ DIRK M. KUYPERDirk M. Kuyper Director February 24, 2014
/s/ STEPHEN M. MANDIA Stephen M. Mandia Director February 24, 2014 /s/ STUART J. SCHWARTZ Stuart J. Schwartz Director February 24, 2014 /s/ MARK E. TRYNISKI Mark E. Tryniski Director February 24, 2014

37
Exhibit Index
Exhibit No. Description
3.1 - Amended and Restated By-Laws, as adopted by the Board of Directors on April 29, 2011 (Incorporated
by reference to the Company’s Current Report on Form 10-Q filed with the Securities and ExchangeCommission on May 2, 2011).
3.2 - 1999 Amendment to Certificate of Incorporation and Restated Certificate of Incorporation of CONMED
Corporation (Incorporated by reference to Exhibit 3.2 of the Company’s Annual Report on Form 10-Kfor the year ended December 31, 1999).
4.1 - See Exhibit 3.1. 4.2 - See Exhibit 3.2.
4.3 - Guarantee and Collateral Agreement, dated August 28, 2002, made by CONMED Corporation andcertain of its subsidiaries in favor of JP Morgan Chase Bank (Incorporated by reference to Exhibit 10.2of the Company’s Quarterly Report on Form 10-Q for the quarter ended September 30, 2002).
4.4 - First Amendment to Guarantee and Collateral Agreement, dated June 30, 2003, made by CONMED
Corporation and certain of its subsidiaries in favor of JP Morgan Chase Bank and the several banks andother financial institutions or entities from time to time parties thereto (Incorporated by reference toExhibit 10.2 of the Company’s Quarterly Report on Form 10-Q for the quarter ended June 30, 2003).
4.5 - Second Amendment to Guarantee and Collateral Agreement, dated April 13, 2006, made by CONMED
Corporation and certain of its subsidiaries in favor of JP Morgan Chase Bank and the several banks andother financial institutions or entities from time to time parties thereto (Incorporated by reference to theCompany’s Current Report on Form 8-K filed with the Securities and Exchange Commission on April19, 2006).
4.6 - Third Amendment to Guarantee and Collateral Agreement, dated as of January 17, 2013, made byCONMED Corporation and certain of its subsidiaries in favor of JP Morgan Chase Bank (Incorporatedby reference to Exhibit 4.6 of the Company's Annual Report on Form 10-K for the year ended December31, 2012).
10.1+ - Employment Agreement between the Company and Eugene R. Corasanti, dated October 31, 2006
(Incorporated by reference to Exhibit 10.2 of the Company’s Current Report on Form 8-K filed with theSecurities and Exchange Commission on November 2, 2006).
10.2+ - Amended and Restated Employment Agreement, dated October 30, 2009, by and between CONMEDCorporation and Joseph J. Corasanti, Esq. (Incorporated by reference to the Exhibit 10.1 of theCompany’s Quarterly Report on Form 10-Q for the quarter ended September 30, 2009).
10.3 - Amended and Restated Employee Stock Option Plan (including form of Stock Option Agreement)
(Incorporated by reference to Exhibit 10.6 of the Company’s Annual Report on Form 10-K for the yearended December 31, 1996).
10.4 - Stock Option Plan for Non-Employee Directors of CONMED Corporation (Incorporated by reference to
Exhibit 10.5 of the Company’s Annual Report on Form 10-K for the year ended December 31, 1996).

38
10.5 - Amendment to Stock Option Plan for Non-employee Directors of CONMED Corporation (Incorporated
by reference to the Company’s Definitive Proxy Statement for the 2002 Annual Meeting filed with theSecurities and Exchange Commission on April 17, 2002).
10.6 - Amended and Restated 1999 Long Term Incentive Plan (Incorporated by reference to Exhibit 4.3 of the
Company’s Registration Statement on Form S-8 on November 3, 2009).
10.7 - 2002 Employee Stock Purchase Plan (Incorporated by reference to the Company’s Definitive Proxy
Statement for the 2002 Annual Meeting filed with the Securities and Exchange Commission on April 17,2002).
10.8 - Amendment to CONMED Corporation 2002 Employee Stock Purchase Plan (Incorporated by reference
to Exhibit 10.11 of the Company’s Annual Report on Form 10-K for the year ended December 31, 2005).
10.9 - 2006 Stock Incentive Plan (Incorporated by reference to Exhibit 4.3 of the Company’s Registration
Statement on Form S-8 on August 8, 2006).
10.10 - Amended and Restated 2007 Non-Employee Director Equity Compensation Plan of CONMED
Corporation (Incorporated by reference to Exhibit 4.3 of the Company’s Registration Statement on FormS-8 on August 3, 2010).
10.11 - Amended and Restated Long Term Incentive Plan (Incorporated by reference to Exhibit 4.3 of theCompany’s Registration Statement on Form S-8 on July 27, 2012).
10.12 - Amended and Restated Credit Agreement, dated January 17, 2013, among CONMED Corporation, JPMorgan Chase Bank and the several banks and other financial institutions or entities from time to timeparties thereto (Incorporated by reference to Exhibit 10.1 of the Company’s Current Report on Form 8-Kfiled with the Securities and Exchange Commission on January 18, 2013).
10.13 - Change in Control Severance Agreement for Joseph J. Corasanti (Incorporated by reference to Exhibit
10.1 of the Company’s Quarterly Report on Form 10-Q for the quarter ended June 30, 2008).
10.14 - Change in Control Severance Agreement for Robert D. Shallish, Jr. (Incorporated by reference to Exhibit
10.2 of the Company’s Quarterly Report on Form 10-Q for the quarter ended June 30, 2008).
10.15 - Change in Control Severance Agreement for Daniel S. Jonas (Incorporated by reference to Exhibit 10.4
of the Company’s Quarterly Report on Form 10-Q for the quarter ended June 30, 2008).
10.16 - Change in Control Severance Agreement for Luke A. Pomilio (Incorporated by reference to Exhibit 10.5
of the Company’s Quarterly Report on Form 10-Q for the quarter ended June 30, 2008).
10.17 - Executive Severance Agreement for Joseph G. Darling (Incorporated by reference to Exhibit 10.28 of the
Company's Annual Report on Form 10-K for the year ended December 31, 2008).
10.18 - Change in Control Severance Agreement for Joseph G. Darling (Incorporated by reference to Exhibit10.1 of the Company’s Quarterly Report on Form 10-Q for the quarter ended March 31, 2010).

39
10.19 - Sports Medicine Joint Development and Distribution Agreement by and between MusculoskeletalTransplant Foundation, Inc. and CONMED Corporation dated as of January 3, 2012 (Incorporated byreference to Exhibit 10.1 of the Company's Current Report on Form 8-K dated January 3, 2012).
14 - Code of Ethics. The CONMED code of ethics may be accessed via the Company’s website at http://
www.CONMED.com/conmed_investor_template.php
21* - Subsidiaries of the Registrant. 23* - Consent of Independent Registered Public Accounting Firm. 31.1* - Certification of Joseph J. Corasanti pursuant to Rule 13a-14(a) and Rule 15d-14(a) of the Securities
Exchange Act, as adopted pursuant to Section 302 of the Sarbanes-Oxley Act of 2002.
31.2* - Certification of Robert D. Shallish, Jr. pursuant to Rule 13a-14(a) and Rule 15d-14(a) of the Securities
Exchange Act, as adopted pursuant to Section 302 of the Sarbanes-Oxley Act of 2002.
32.1* - Certifications of Joseph J. Corasanti and Robert D. Shallish, Jr. pursuant to 18 U.S.C. Section 1350, as
adopted pursuant to Section 906 of the Sarbanes-Oxley Act of 2002.
101* The following materials from CONMED Corporation's Annual Report on Form 10-K for the year ended December 31, 2013 formatted in XBRL (Extensible Business Reporting Language): (i) Consolidated Statements of Comprehensive Income for the three years ended December 31, 2013, (ii) Consolidated Balance Sheets at December 31, 2013 and 2012, (iii) Consolidated Statements of Shareholders' Equity for the three years ended December 31, 2013 (iv) Consolidated Statements of Cash Flows for the three years ended December 31, 2013, (v) Notes to the Consolidated Financial Statements for the year ended December 31, 2013 and (vi) Schedule II - Valuation and Qualifying Accounts. In accordance with Rule 406T of Regulation S-T, the XBRL related information in Exhibit 101 to this Annual Report on Form 10-K shall not be deemed to be “filed” for purposes of Section 18 of the Exchange Act, or otherwise subject to the liability of that section, and shall not be part of any registration statement or other document filed under the Securities Act or the Exchange Act, except as shall be expressly set forth by specific reference in such filing.
* Filed herewith
+ Management contract or compensatory plan or arrangement.
40
MANAGEMENT’S REPORT ON INTERNAL CONTROLOVER FINANCIAL REPORTING
The management of CONMED Corporation is responsible for establishing and maintaining adequate internal control over financial reporting. Internal control over financial reporting is a process designed to provide reasonable assurance regarding the reliability of financial reporting and the preparation of financial statements for external reporting purposes in accordance with generally accepted accounting principles. Our internal control over financial reporting includes policies and procedures that pertain to the maintenance of records that, in reasonable detail, accurately and fairly reflect transactions and dispositions of assets; provide reasonable assurances that transactions are recorded as necessary to permit preparation of financial statements in accordance with accounting principles generally accepted in the United States of America, and that receipts and expenditures are being made only in accordance with authorizations of management and the directors of the Company; and provide reasonable assurance regarding prevention or timely detection of unauthorized acquisition, use or disposition of our assets that could have a material effect on our financial statements. Because of its inherent limitations, internal control over financial reporting may not prevent or detect misstatements. Management assessed the effectiveness of CONMED’s internal control over financial reporting as of December 31, 2013. In making its assessment, management utilized the criteria set forth by the Committee of Sponsoring Organizations of the Treadway Commission (“COSO”) in “Internal Control-Integrated Framework”, released in 1992. Management has concluded that based on its assessment, CONMED’s internal control over financial reporting was effective as of December 31, 2013. The effectiveness of the Company’s internal control over financial reporting as of December 31, 2013 has been audited by PricewaterhouseCoopers LLP, an independent registered public accounting firm, as stated in their report which appears herein. /s/ Joseph J. CorasantiJoseph J. CorasantiPresident andChief Executive Officer /s/ Robert D. Shallish, Jr.Robert D. Shallish, Jr.Executive Vice President-Finance andChief Financial Officer

41
REPORT OF INDEPENDENT REGISTERED PUBLIC ACCOUNTING FIRM To the Board of Directors and Shareholders of CONMED Corporation In our opinion, the accompanying consolidated balance sheets and the related consolidated statements of comprehensive income, of shareholders’ equity and of cash flows present fairly, in all material respects, the financial position of CONMED Corporation and its subsidiaries at December 31, 2013 and 2012, and the results of their operations and their cash flows for each of the three years in the period ended December 31, 2013 in conformity with accounting principles generally accepted in the United States of America. In addition, in our opinion, the financial statement schedule listed in the index appearing under Item 15(a)(2) presents fairly, in all material respects, the information set forth therein when read in conjunction with the related consolidated financial statements. Also in our opinion, the Company maintained, in all material respects, effective internal control over financial reporting as of December 31, 2013, based on criteria established in Internal Control - Integrated Framework (1992) issued by the Committee of Sponsoring Organizations of the Treadway Commission (COSO). The Company's management is responsible for these financial statements and financial statement schedule, for maintaining effective internal control over financial reporting and for its assessment of the effectiveness of internal control over financial reporting, included in the accompanying Management's Report on Internal Control over Financial Reporting. Our responsibility is to express opinions on these financial statements, on the financial statement schedule, and on the Company's internal control over financial reporting based on our integrated audits. We conducted our audits in accordance with the standards of the Public Company Accounting Oversight Board (United States). Those standards require that we plan and perform the audits to obtain reasonable assurance about whether the financial statements are free of material misstatement and whether effective internal control over financial reporting was maintained in all material respects. Our audits of the financial statements included examining, on a test basis, evidence supporting the amounts and disclosures in the financial statements, assessing the accounting principles used and significant estimates made by management, and evaluating the overall financial statement presentation. Our audit of internal control over financial reporting included obtaining an understanding of internal control over financial reporting, assessing the risk that a material weakness exists, and testing and evaluating the design and operating effectiveness of internal control based on the assessed risk. Our audits also included performing such other procedures as we considered necessary in the circumstances. We believe that our audits provide a reasonable basis for our opinions.
A company’s internal control over financial reporting is a process designed to provide reasonable assurance regarding the reliability of financial reporting and the preparation of financial statements for external purposes in accordance with generally accepted accounting principles. A company’s internal control over financial reporting includes those policies and procedures that (i) pertain to the maintenance of records that, in reasonable detail, accurately and fairly reflect the transactions and dispositions of the assets of the company; (ii) provide reasonable assurance that transactions are recorded as necessary to permit preparation of financial statements in accordance with generally accepted accounting principles, and that receipts and expenditures of the company are being made only in accordance with authorizations of management and directors of the company; and (iii) provide reasonable assurance regarding prevention or timely detection of unauthorized acquisition, use, or disposition of the company’s assets that could have a material effect on the financial statements.
Because of its inherent limitations, internal control over financial reporting may not prevent or detect misstatements. Also, projections of any evaluation of effectiveness to future periods are subject to the risk that controls may become inadequate because of changes in conditions, or that the degree of compliance with the policies or procedures may deteriorate.
/s/ PricewaterhouseCoopers LLPAlbany, New YorkFebruary 24, 2014

42
CONMED CORPORATIONCONSOLIDATED BALANCE SHEETS
December 31, 2012 and 2013 (In thousands except share and per share amounts)
2012 2013ASSETS Current assets:
Cash and cash equivalents $ 23,720 $ 54,443Accounts receivable, less allowance for doubtful
accounts of $1,203 in 2012 and $1,384 in 2013 139,124 140,426Inventories 156,228 143,211Income taxes receivable 2,897 3,805Deferred income taxes 11,931 13,202Prepaid expenses and other current assets 14,993 17,045
Total current assets 348,893 372,132Property, plant and equipment, net 139,041 138,985Deferred income taxes 1,057 1,183Goodwill 248,502 248,428Other intangible assets, net 334,185 319,440Other assets 7,171 10,340
Total assets $ 1,078,849 $ 1,090,508
LIABILITIES AND SHAREHOLDERS' EQUITY Current liabilities:
Current portion of long-term debt $ 1,050 $ 1,140Accounts payable 23,622 27,448Accrued compensation and benefits 33,511 33,426Income taxes payable 2,706 2,116Other current liabilities 64,325 47,135
Total current liabilities 125,214 111,265
Long-term debt 160,802 214,435Deferred income taxes 99,199 113,199Other long-term liabilities 86,636 45,290
Total liabilities 471,851 484,189
Commitments and contingencies
Shareholders' equity: Preferred stock, par value $.01 per share; authorized
500,000 shares, none issued or outstanding — —Common stock, par value $.01 per share; 100,000,000
authorized; 31,299,194 issued in 2012 and 2013, respectively 313 313Paid-in capital 324,322 326,436Retained earnings 377,907 395,889Accumulated other comprehensive loss (27,581) (17,572)Less: Treasury stock, at cost;
2,925,801 and 3,718,332 shares in 2012 and 2013, respectively (67,963) (98,747)
Total shareholders' equity 606,998 606,319Total liabilities and shareholders' equity $ 1,078,849 $ 1,090,508
The accompanying notes are an integral part of the consolidated financial statements.

43
CONMED CORPORATIONCONSOLIDATED STATEMENTS OF COMPREHENSIVE INCOME
Years Ended December 31, 2011, 2012 and 2013 (In thousands except per share amounts)
2011 2012 2013Net sales $ 725,077 $ 767,140 $ 762,704Cost of sales 350,143 361,297 350,287
Gross profit 374,934 405,843 412,417
Selling and administrative expense 276,615 302,469 310,730Research and development expense 28,651 28,214 25,831Impairment of goodwill 60,302 — —Medical device excise tax — — 5,949Other expense 1,092 9,950 13,399 366,660 340,633 355,909
Income from operations 8,274 65,210 56,508Loss on early extinguishment of debt — — 263Amortization of debt discount 3,903 — —Interest expense 6,676 5,730 5,613
Income (loss) before income taxes (2,305) 59,480 50,632
Provision (benefit) for income taxes (3,057) 18,999 14,693
Net income $ 752 $ 40,481 $ 35,939
Per share data:
Basic $ 0.03 $ 1.43 $ 1.30Diluted $ 0.03 $ 1.41 $ 1.28
Dividends per share of common stock $ — $ 0.60 $ 0.65
Other comprehensive income (loss), before tax:Foreign currency translation adjustments $ (1,937) $ 1,995 $ (1,193)Pension liability (20,250) 1,387 18,175Cash flow hedging gain (loss) 6,690 (6,507) (404)Other comprehensive income (loss), before tax (14,745) 37,356 52,517Provision (benefit) for income taxes related to items of othercomprehensive income (5,010) (1,892) 6,569Comprehensive income (loss) $ (9,735) $ 39,248 $ 45,948
The accompanying notes are an integral part of the consolidated financial statements.
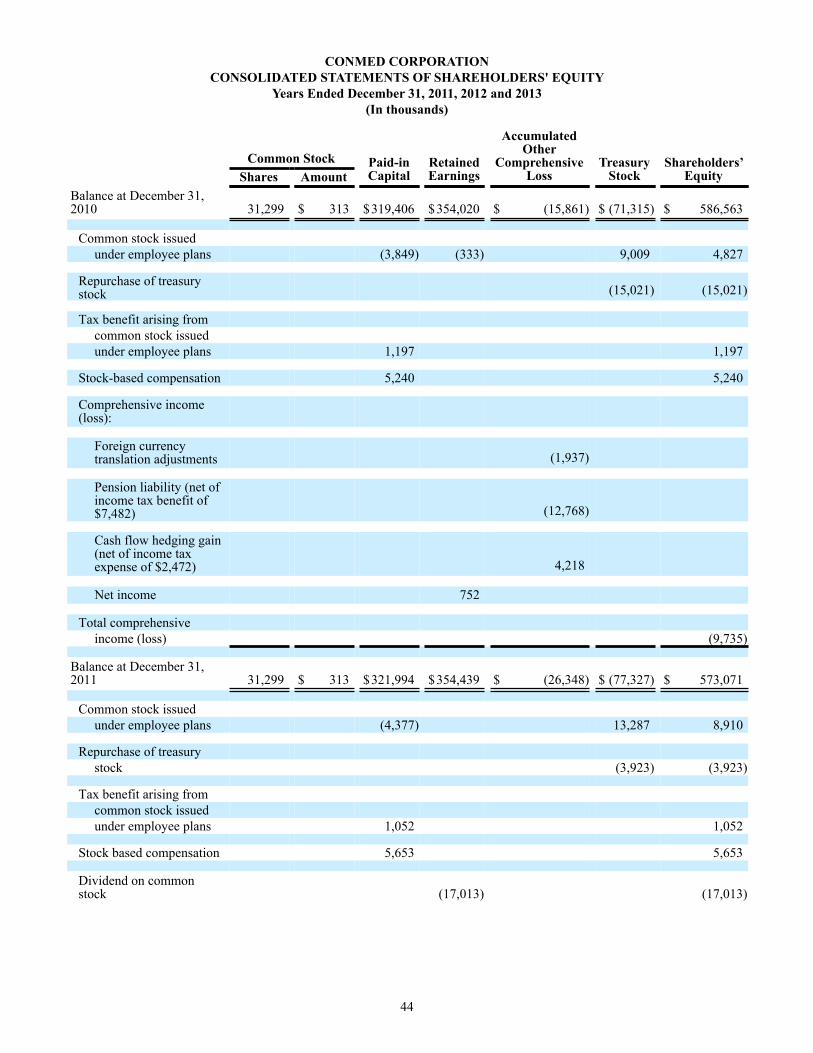
44
CONMED CORPORATIONCONSOLIDATED STATEMENTS OF SHAREHOLDERS' EQUITY
Years Ended December 31, 2011, 2012 and 2013 (In thousands)
Common Stock Paid-inCapital
RetainedEarnings
AccumulatedOther
ComprehensiveLoss
TreasuryStock
Shareholders’Equity Shares Amount
Balance at December 31,2010 31,299 $ 313 $319,406 $354,020 $ (15,861) $ (71,315) $ 586,563
Common stock issuedunder employee plans (3,849) (333) 9,009 4,827
Repurchase of treasurystock (15,021) (15,021)
Tax benefit arising fromcommon stock issuedunder employee plans 1,197 1,197
Stock-based compensation 5,240 5,240
Comprehensive income(loss):
Foreign currencytranslation adjustments (1,937)
Pension liability (net ofincome tax benefit of$7,482) (12,768)
Cash flow hedging gain(net of income taxexpense of $2,472) 4,218
Net income 752
Total comprehensiveincome (loss) (9,735)
Balance at December 31,2011 31,299 $ 313 $321,994 $354,439 $ (26,348) $ (77,327) $ 573,071
Common stock issuedunder employee plans (4,377) 13,287 8,910
Repurchase of treasurystock (3,923) (3,923)
Tax benefit arising fromcommon stock issuedunder employee plans 1,052 1,052
Stock based compensation 5,653 5,653
Dividend on commonstock (17,013) (17,013)
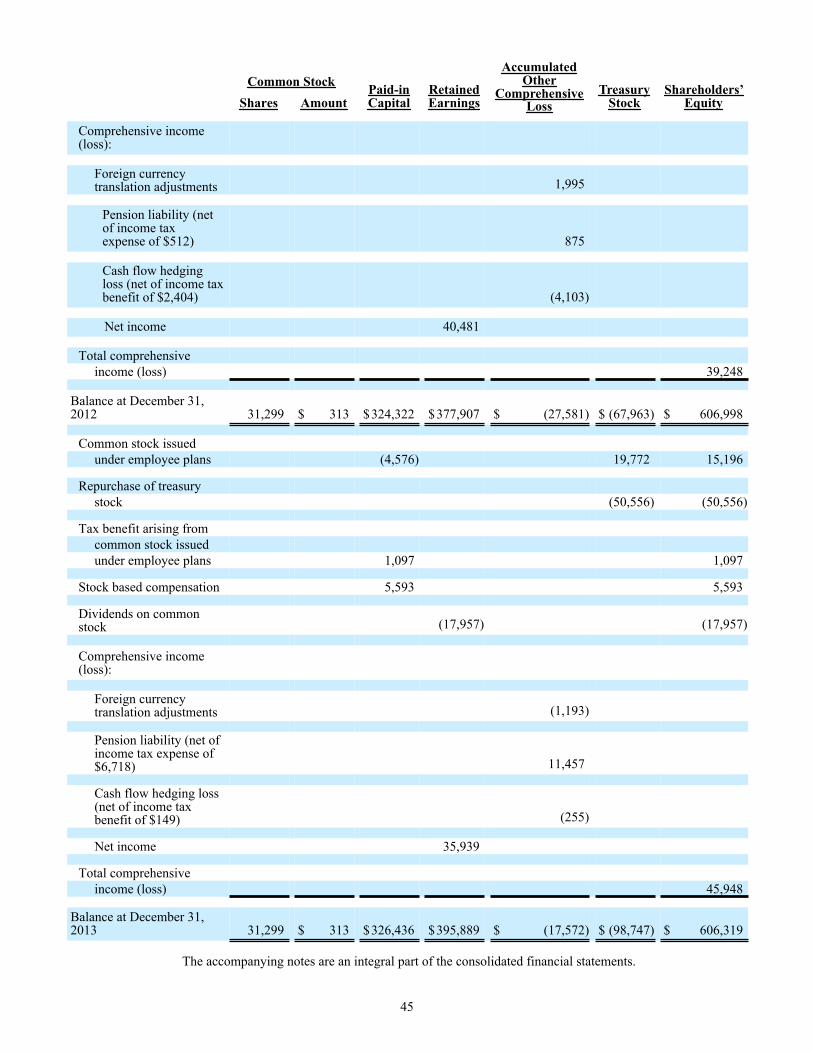
45
Common Stock Paid-inCapital
RetainedEarnings
AccumulatedOther
ComprehensiveLoss
TreasuryStock
Shareholders’EquityShares Amount
Comprehensive income(loss):
Foreign currencytranslation adjustments 1,995
Pension liability (netof income taxexpense of $512) 875
Cash flow hedgingloss (net of income taxbenefit of $2,404) (4,103)
Net income 40,481
Total comprehensiveincome (loss) 39,248
Balance at December 31,2012 31,299 $ 313 $324,322 $377,907 $ (27,581) $ (67,963) $ 606,998
Common stock issuedunder employee plans (4,576) 19,772 15,196
Repurchase of treasurystock (50,556) (50,556)
Tax benefit arising fromcommon stock issuedunder employee plans 1,097 1,097
Stock based compensation 5,593 5,593
Dividends on commonstock (17,957) (17,957)
Comprehensive income(loss):
Foreign currencytranslation adjustments (1,193)
Pension liability (net ofincome tax expense of$6,718) 11,457
Cash flow hedging loss(net of income taxbenefit of $149) (255)
Net income 35,939
Total comprehensiveincome (loss) 45,948
Balance at December 31,2013 31,299 $ 313 $326,436 $395,889 $ (17,572) $ (98,747) $ 606,319
The accompanying notes are an integral part of the consolidated financial statements.

46
CONMED CORPORATIONCONSOLIDATED STATEMENTS OF CASH FLOWS
Years Ended December 31, 2011, 2012 and 2013 (In thousands)
2011 2012 2013Cash flows from operating activities:
Net income $ 752 $ 40,481 $ 35,939Adjustments to reconcile net income
to net cash provided by operating activities: Depreciation 18,519 18,635 18,653Amortization of debt discount 3,903 — —Amortization, all other 20,265 27,981 29,214Stock-based compensation 5,240 5,653 5,593Deferred income taxes (13,098) 12,946 7,218Income tax benefit of stock
option exercises 1,197 1,052 1,097Excess tax benefit from stock
option exercises (1,363) (1,206) (1,518)Loss on early extinguishment of debt — — 263Impairment of goodwill 60,302 — —Increase (decrease) in cash flows from changes in assets and
liabilities, net of effects from acquisitions: Accounts receivable 8,464 1,687 (798)Inventories (7,850) 3,810 (1,817)Accounts payable 2,649 259 4,223Income taxes 4,838 (6,497) (1,098)Accrued compensation and benefits 1,673 767 (71)Other assets (4,243) (1,210) (5,222)Other liabilities 1,745 (9,159) (10,727)
102,241 54,718 45,010Net cash provided by operating activities 102,993 95,199 80,949
Cash flows from investing activities: Payments related to business acquisitions and distribution agreements,
net of cash acquired (4,191) (86,253) —Proceeds from sale of property — 1,836 —Purchases of property, plant and equipment (17,552) (21,532) (18,445)
Net cash used in investing activities (21,743) (105,949) (18,445)
Cash flows from financing activities: Net proceeds from common stock issued
under employee plans 6,117 10,165 17,264Repurchase of common stock (15,021) (3,923) (50,556)Excess tax benefit from stock option exercises 1,363 1,206 1,518Payments on senior credit agreement (1,350) (53,588) —Proceeds of senior credit agreement 58,000 73,000 55,000Payments related to distribution agreement — — (34,000)Payments on mortgage notes (894) (969) (1,050)Payments on senior subordinated notes (111,766) (100) (227)Payments related to issuance of debt — — (1,725)Dividends paid on common stock — (12,862) (16,696)Other, net (3,148) (1,576) (824)
Net cash provided by (used in) financing activities (66,699) 11,353 (31,296)
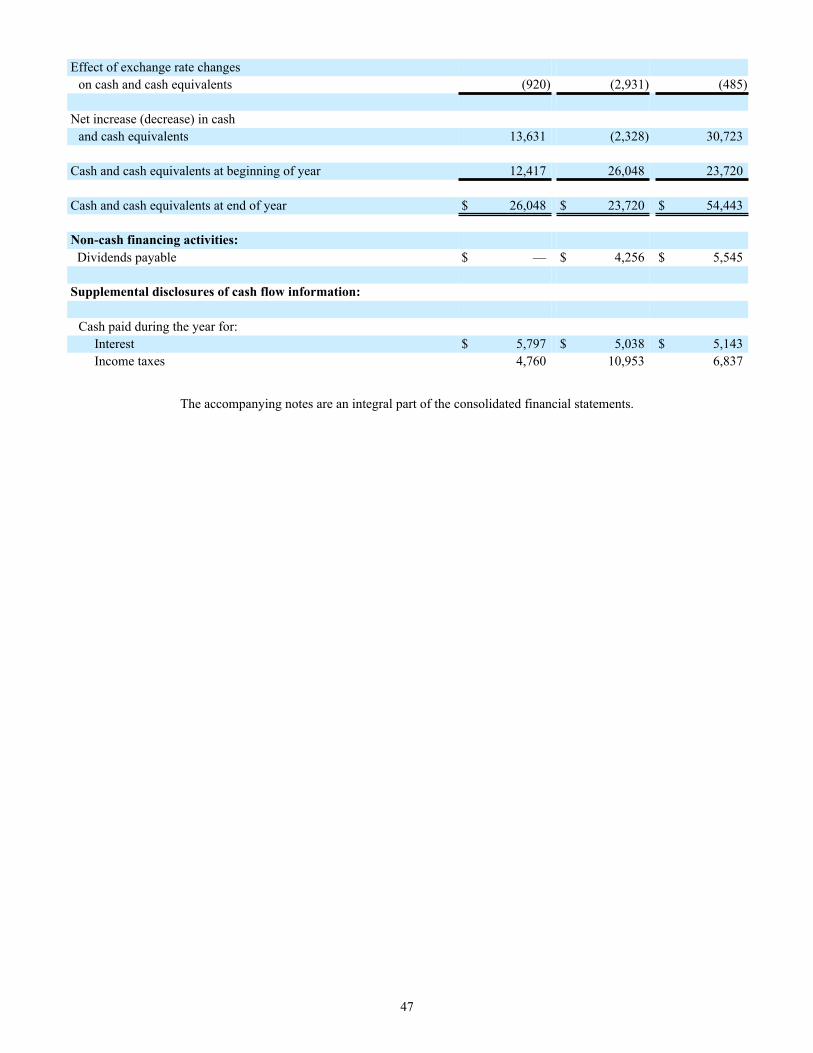
47
Effect of exchange rate changes on cash and cash equivalents (920) (2,931) (485)
Net increase (decrease) in cash and cash equivalents 13,631 (2,328) 30,723
Cash and cash equivalents at beginning of year 12,417 26,048 23,720
Cash and cash equivalents at end of year $ 26,048 $ 23,720 $ 54,443
Non-cash financing activities: Dividends payable $ — $ 4,256 $ 5,545
Supplemental disclosures of cash flow information:
Cash paid during the year for: Interest $ 5,797 $ 5,038 $ 5,143Income taxes 4,760 10,953 6,837
The accompanying notes are an integral part of the consolidated financial statements.

48
CONMED CORPORATIONNOTES TO CONSOLIDATED FINANCIAL STATEMENTS
(in thousands except per share amounts)
Note 1 — Operations and Significant Accounting Policies Organization and operations
CONMED Corporation (“CONMED”, the “Company”, “we” or “us”) is a medical technology company with an emphasis on surgical devices and equipment for minimally invasive procedures and monitoring. The Company’s products are used by surgeons and physicians in a variety of specialties including orthopedics, general surgery, gynecology, neurosurgery, and gastroenterology. Principles of consolidation
The consolidated financial statements include the accounts of CONMED Corporation and its controlled subsidiaries. All significant intercompany accounts and transactions have been eliminated. Income taxes receivable and income taxes payable at December 31, 2012 have been revised by $2.7 million to conform to the current year presentation which presents these balances net by jurisdiction. We have reclassified the promotional, marketing and distribution rights totaling $143.4 million at December 31, 2012 from Other Assets to Other Intangible Assets to conform to current year presentation.
Use of estimates
The preparation of financial statements in conformity with accounting principles generally accepted in the United States of America requires management to make estimates and judgments which affect the reported amounts of assets, liabilities, related disclosure of contingent assets and liabilities at the date of the financial statements, and the reported amount of revenues and expenses during the reporting period. Estimates are used in accounting for, among other things, allowances for doubtful accounts, rebates and sales allowances, inventory allowances, purchased in-process research and development, pension benefits, goodwill and intangible assets, contingencies and other accruals. We base our estimates on historical experience and on various other assumptions which are believed to be reasonable under the circumstances. Due to the inherent uncertainty involved in making estimates, actual results reported in future periods may differ from those estimates. Estimates and assumptions are reviewed periodically, and the effect of revisions are reflected in the consolidated financial statements in the period they are determined to be necessary.
Cash and cash equivalents
We consider all highly liquid investments with an original maturity of three months or less to be cash equivalents. Inventories
Inventories are valued at the lower of cost or market. Cost is determined on the FIFO (first-in, first-out) method of accounting.
We write-off excess and obsolete inventory resulting from the inability to sell our products at prices in excess of current carrying costs. We make estimates regarding the future recoverability of the costs of our products and record a provision for excess and obsolete inventories based on historical experience, expiration of sterilization dates and expected future trends.
Property, plant and equipment
Property, plant and equipment are stated at cost and depreciated using the straight-line method over the following estimated useful lives:

49
Building and improvements 12 to 40 years Leasehold improvements Shorter of life of asset or life of lease Machinery and equipment 2 to 15 years
Goodwill and other intangible assets
We have a history of growth through acquisitions. Assets and liabilities of acquired businesses are recorded at their estimated fair values as of the date of acquisition. Goodwill represents costs in excess of fair values assigned to the underlying net assets of acquired businesses. Effective January 1, 2013, we are reporting our business as a single operating segment, and goodwill as a single reporting unit. Changes in our structure are further discussed in Note 8 to the Consolidated Financial Statements. Customer relationships, trademarks, tradenames, patents, and other intangible assets primarily represent allocations of purchase price to identifiable intangible assets of acquired businesses. Promotional, marketing and distribution rights represent intangible assets created under our Sports Medicine Joint Development and Distribution Agreement (the "JDDA") with Musculoskeletal Transplant Foundation (“MTF”). We have accumulated goodwill of $248.4 million and other intangible assets of $319.4 million as of December 31, 2013.
In accordance with FASB guidance, goodwill and intangible assets deemed to have indefinite lives are not amortized, but are subject to at least annual impairment testing. It is our policy to perform our annual impairment testing in the fourth quarter. The identification and measurement of goodwill impairment involves the estimation of the fair value of our business. Estimates of fair value are based on the best information available as of the date of the assessment, which primarily incorporate management assumptions about expected future cash flows and other valuation techniques. Future cash flows may be affected by changes in industry or market conditions or the rate and extent to which anticipated synergies or cost savings are realized with newly acquired entities. During 2013, we completed our goodwill impairment testing with data as of October 1, 2013. We performed a Step 1 impairment test in accordance with ASC 350 utilizing the market capitalization approach to determine whether the fair value of a reporting unit is less than its carrying amount. Based upon our assessment, we believe the fair value continues to exceed carrying value by 99%.
During 2011, we estimated the fair value of the legacy CONMED Patient Care reporting unit (refer to Note 8 for discussion regarding the change in operating segments) utilizing both a market-based approach and an income approach. Under the income approach, we utilized a discounted cash flow valuation methodology and measured the goodwill impairment in accordance with ASC 350. The first step of the impairment test determined the carrying value exceeded fair value and therefore we proceeded to Step 2. Under Step 2, we calculated the amount of impairment loss by measuring the amount the carrying value of goodwill exceeded the implied fair value of the goodwill. We determined the goodwill of our legacy CONMED Patient Care reporting unit was impaired as a result of lower future earnings due to pricing pressures in a number of our product lines and consequently we recorded a goodwill impairment charge of $60.3 million to reduce the carrying amount of the reporting unit's goodwill to its implied fair value.
Intangible assets with a finite life are amortized over the estimated useful life of the asset and are evaluated each reporting period to determine whether events and circumstances warrant a revision to the remaining period of amortization. Intangible assets subject to amortization are reviewed for impairment whenever events or changes in circumstances indicate that its carrying amount may not be recoverable. The carrying amount of an intangible asset subject to amortization is not recoverable if it exceeds the sum of the undiscounted cash flows expected to result from the use of the asset. An impairment loss is recognized by reducing the carrying amount of the intangible asset to its current fair value.
Customer relationship assets arose principally as a result of the 1997 acquisition of Linvatec Corporation. These assets represent the acquisition date fair value of existing customer relationships based on the after-tax income expected to be derived during their estimated remaining useful life. The useful lives of these customer relationships were not and are not limited by contract or any economic, regulatory or other known factors. The estimated useful life of the Linvatec customer relationship assets was determined as of the date of acquisition as a result of a study of the observed pattern of historical revenue attrition during the 5 years immediately preceding the acquisition of Linvatec Corporation. This observed attrition pattern was then applied to the existing customer relationships to derive the future expected useful life of the customer relationships. This analysis indicated an annual attrition rate of 2.6%. Assuming an exponential attrition pattern, this equated to an average remaining useful life of approximately 38 years for the Linvatec customer relationship assets. Customer relationship intangible assets arising as a result of other business acquisitions are being amortized over a weighted average life of 15 years. The weighted average life for customer relationship assets in aggregate is 33 years.
We evaluate the remaining useful life of our customer relationship intangible assets each reporting period in order to determine whether events and circumstances warrant a revision to the remaining period of amortization. In order to further evaluate

50
the remaining useful life of our customer relationship intangible assets, we perform an analysis and assessment of actual customer attrition and activity as events and circumstances warrant. This assessment includes a comparison of customer activity since the acquisition date and review of customer attrition rates. In the event that our analysis of actual customer attrition rates indicates a level of attrition that is in excess of that which was originally contemplated, we would change the estimated useful life of the related customer relationship asset with the remaining carrying amount amortized prospectively over the revised remaining useful life.
We test our customer relationship assets for recoverability whenever events or changes in circumstances indicate that the carrying amount may not be recoverable. Factors specific to our customer relationship assets which might lead to an impairment charge include a significant increase in the annual customer attrition rate or otherwise significant loss of customers, significant decreases in sales or current-period operating or cash flow losses or a projection or forecast of losses. We do not believe that there have been events or changes in circumstances which would indicate the carrying amount of our customer relationship assets might not be recoverable.
For all other indefinite lived intangible assets, we perform a qualitative impairment test in accordance with ASC 350. Based upon this assessment, we have determined that it is unlikely that our indefinite lived intangible assets are impaired.
Other long-lived assets
We review asset carrying amounts for impairment (consisting of intangible assets subject to amortization and property, plant and equipment) whenever events or circumstances indicate that such carrying amounts may not be recoverable. If the sum of the expected future undiscounted cash flows is less than the carrying amount of the asset, an impairment loss is recognized by reducing the recorded value to its current fair value.
Translation of foreign currency financial statements
Assets and liabilities of foreign subsidiaries have been translated into United States dollars at the applicable rates of exchange in effect at the end of the period reported. Revenues and expenses have been translated at the applicable weighted average rates of exchange in effect during the period reported. Translation adjustments are reflected in accumulated other comprehensive loss. Transaction gains and losses are included in net income.
Foreign exchange and hedging activity
We manage our foreign currency transaction risks through the use of forward contracts to hedge forecasted cash flows associated with foreign currency transaction exposures. We account for these forward contracts as cash flow hedges. To the extent these forward contracts meet hedge accounting criteria, changes in their fair value are not included in current earnings but are included in accumulated other comprehensive loss. These changes in fair value will be reclassified into earnings as a component of sales or cost of sales when the forecasted transaction occurs.
We also enter into forward contracts to exchange foreign currencies for United States dollars in order to hedge our currency transaction exposures on intercompany receivables denominated in foreign currencies. These forward contracts settle each month at month-end, at which time we enter into new forward contracts. We have not designated these forward contracts as hedges and have not applied hedge accounting to them. We record these forward contracts at fair value with resulting gains and losses included in selling and administrative expense in the consolidated statements of comprehensive income.
Income taxes
Deferred income tax assets and liabilities are based on the difference between the financial statement and tax basis of assets and liabilities and operating loss and tax credit carryforwards as measured by the enacted tax rates that are anticipated to be in effect in the respective jurisdictions when these differences reverse. The deferred income tax provision generally represents the net change in the assets and liabilities for deferred income taxes. A valuation allowance is established when it is necessary to reduce deferred income tax assets to amounts for which realization is likely. In assessing the need for a valuation allowance, we estimate future taxable income, considering the feasibility of ongoing tax planning strategies and the realizability of tax loss carryforwards. Valuation allowances related to deferred tax assets may be impacted by changes to tax laws, changes to statutory tax rates and ongoing and future taxable income levels.
Deferred income taxes are not provided on the unremitted earnings of subsidiaries outside of the United States when it is expected that these earnings are permanently reinvested. Such earnings may become taxable upon a repatriation of assets from a subsidiary or the sale or liquidation of a subsidiary. Deferred income taxes are provided when the Company no longer considers

51
subsidiary earnings to be permanently invested, such as in situations where the Company’s subsidiaries plan to make future dividend distributions.
Revenue recognition
Revenue is recognized when title has been transferred to the customer which is at the time of shipment. The following policies apply to our major categories of revenue transactions:
• Sales to customers are evidenced by firm purchase orders. Title and the risks and rewards of ownership are transferred to the customer when product is shipped under our stated shipping terms. Payment by the customer is due under fixed payment terms and collectability is reasonably assured.
• We place certain of our capital equipment with customers on a loaned basis in return for commitments to purchase related single-use products over time periods generally ranging from one to three years. In these circumstances, no revenue is recognized upon capital equipment shipment as the equipment is loaned and subject to return if certain minimum single-use purchases are not met. Revenue is recognized upon the sale and shipment of the related single-use products. The cost of the equipment is amortized over its estimated useful life.
• We recognize revenues related to the promotion and marketing of sports medicine allograft tissue in accordance with the contractual terms of our agreement with Musculoskeletal Transplant Foundation (“MTF”) on a net basis as our role is limited to that of an agent earning a commission or fee. MTF records revenue when the tissue is shipped to the customer. Our services are completed at this time and net revenues for the “Service Fee” for our promotional and marketing efforts are then recognized based on a percentage of the net amounts billed by MTF to its customers. The timing of revenue recognition is determined through review of the net billings made by MTF each month. Our net commission Service Fee is based on the contractual terms of our agreement and is currently 50%. This percentage can vary over the term of the agreement but is contractually determinable. Our Service Fee revenues are recorded net of amortization of the acquired assets, which are being expensed over the expected useful life of 25 years.
• Product returns are only accepted at the discretion of the Company and in accordance with our “Returned Goods Policy”. Historically the level of product returns has not been significant. We accrue for sales returns, rebates and allowances based upon an analysis of historical customer returns and credits, rebates, discounts and current market conditions.
• Our terms of sale to customers generally do not include any obligations to perform future services. Limited warranties are provided for capital equipment sales and provisions for warranty are provided at the time of product sale based upon an analysis of historical data.
• Amounts billed to customers related to shipping and handling have been included in net sales. Shipping and handling costs included in selling and administrative expense were $13.0 million, $12.8 million and $12.6 million for 2011, 2012 and 2013, respectively.
• We sell to a diversified base of customers around the world and, therefore, believe there is no material concentration of credit risk.
• We assess the risk of loss on accounts receivable and adjust the allowance for doubtful accounts based on this risk assessment. Historically, losses on accounts receivable have not been material. Management believes that the allowance for doubtful accounts of $1.4 million at December 31, 2013 is adequate to provide for probable losses resulting from accounts receivable.
Earnings and dividends per share
Basic earnings per share (“basic EPS”) is computed by dividing net income by the weighted average number of common shares outstanding for the reporting period. Diluted earnings per share (“diluted EPS”) gives effect to all dilutive potential shares outstanding resulting from employee stock options, restricted stock units, performance share units and stock appreciation rights (“SARs”) during the period. The following table sets forth the computation of basic and diluted earnings per share at December 31, 2011, 2012 and 2013, respectively:

52
2011 2012 2013
Net income $ 752 $ 40,481 $ 35,939
Basic-weighted average shares outstanding 28,246 28,301 27,722
Effect of dilutive potential securities 387 352 392
Diluted-weighted average shares outstanding 28,633 28,653 28,114
Basic EPS $ 0.03 $ 1.43 $ 1.30
Diluted EPS $ 0.03 $ 1.41 $ 1.28
The shares used in the calculation of diluted EPS exclude options to purchase shares where the exercise price was greater than the average market price of common shares for the year. Such shares aggregated approximately 0.7 million, 0.4 million and 0.0 million at December 31, 2011, 2012 and 2013, respectively.
On February 29, 2012, the Board of Directors adopted a cash dividend policy and declared an initial quarterly dividend of $0.15 per share. On October 28, 2013, the Board of Directors increased the quarterly dividend to $0.20 per share. The fourth quarter dividend for 2013 was paid on January 6, 2014 to shareholders of record as of December 16, 2013. The total dividend payable at December 31, 2013 was $5.5 million and is included in other current liabilities in the consolidated balance sheet.
Stock-based compensation
All share-based payments to employees, including grants of employee stock options, restricted stock units, performance share units and stock appreciation rights are recognized in the financial statements based at their fair values. Compensation expense is generally recognized using a straight-line method over the vesting period. Compensation expense for performance share units is recognized using the graded vesting method.
We issue shares under our stock based compensation plans out of treasury stock whereby treasury stock is reduced by the weighted average cost of such treasury stock. To the extent there is a difference between the cost of the treasury stock and the exercise price of shares issued under stock based compensation plans, we record gains to paid in capital; losses are recorded to paid in capital to the extent any gain was previously recorded, otherwise the loss is recorded to retained earnings. Accumulated other comprehensive loss
Accumulated other comprehensive loss consists of the following:

53
Cash FlowHedging
Gain (Loss)aPension
Liabilitya
CumulativeTranslation
Adjustments
AccumulatedOther
ComprehensiveLoss
Balance, December 31, 2012 $ (1,130) $ (30,375) $ 3,924 $ (27,581)
Other comprehensive incomebefore reclassifications (158) 8,618 (1,193) 7,267
Amounts reclassified from accumulated other comprehensive income before taxb (153) 4,502 — 4,349
Tax expense (benefit) 56 (1,663) — (1,607)Total amounts reclassified from other accumulatedcomprehensive income (97) 2,839 — 2,742
Net current-period other comprehensive income (255) 11,457 (1,193) 10,009
Balance, December 31, 2013 $ (1,385) $ (18,918) $ 2,731 $ (17,572) (a) All amounts are net of tax. (b) The cash flow hedging gain (loss) and pension liability accumulated other comprehensive income components are included in sales or cost of sales and as a component of net periodic pension cost, respectively. Refer to Note 13 and Note 9, respectively, for further details.
Note 2 — Inventories
Inventories consist of the following at December 31,:
2012 2013
Raw materials $ 45,115 $ 39,029Work in process 14,229 14,736Finished goods 96,884 89,446 $ 156,228 $ 143,211
Note 3 — Property, Plant and Equipment
Property, plant and equipment consist of the following at December 31,:
2012 2013
Land $ 4,243 $ 4,243Building and improvements 92,775 95,397Machinery and equipment 176,102 180,064Construction in progress 5,508 8,750 278,628 288,454
Less: Accumulated depreciation (139,587) (149,469) $ 139,041 $ 138,985
We lease various manufacturing facilities, office facilities and equipment under operating leases. Rental expense on these
operating leases was approximately $6,221, $6,416, and $6,713 for the years ended December 31, 2011, 2012 and 2013, respectively. The aggregate future minimum lease commitments for operating leases at December 31, 2013 are as follows:

54
2014 $ 6,7232015 5,7822016 4,1442017 3,4922018 3,382Thereafter 5,006
Note 4 – Goodwill and Other Intangible Assets
The changes in the net carrying amount of goodwill for the years ended December 31, are as follows:
2012 2013Balance as of January 1, $ 234,815 $ 248,502
Goodwill resulting from business acquisitions 13,702 —
Foreign currency translation (15) (74)
Balance as of December 31, $ 248,502 $ 248,428
During 2013, we finalized the allocation of purchase price related to our 2012 acquisition of Viking Systems, Inc.. We recorded a deferred tax asset of $8.3 million relating to the acquired net operating losses, which resulted in a corresponding reduction to goodwill. This is reflected in the 2012 amounts above. There have been no other changes in the consideration paid, working capital, or other acquired assets and liabilities, other than those described above, since December 31, 2012.
During the fourth quarter of 2011 we performed our annual goodwill impairment testing. We estimated the fair value of our legacy CONMED Patient Care reporting unit (refer to Note 8 for discussion regarding the change in operating segments) utilizing both a market-based approach and an income approach. Under the income approach, we utilized a discounted cash flow valuation methodology and measured the goodwill impairment in accordance with ASC 350. The first step of the impairment test determined the carrying value exceeded fair value and therefore we proceeded to Step 2. Under Step 2, we calculated the amount of impairment loss by measuring the amount the carrying value of goodwill exceeded the implied fair value of the goodwill. We determined the goodwill of our legacy CONMED Patient Care reporting unit was impaired as a result of lower future earnings due to pricing pressures in a number of our product lines and consequently we recorded a goodwill impairment charge of $60.3 million to reduce the carrying amount of the unit's goodwill to its implied fair value.
Total accumulated impairment losses aggregated $106,991 at December 31, 2012 and 2013, respectively.
Other intangible assets consist of the following:

55
December 31, 2012 December 31, 2013
GrossCarryingAmount
AccumulatedAmortization
GrossCarryingAmount
AccumulatedAmortization
Amortized intangible assets:
Customer relationships $ 135,690 $ (50,083) $ 135,690 $ (54,982)
Promotional, marketing & distribution rights 149,376 (6,000) 149,376 (12,000)
Patents and other intangible assets 56,212 (37,554) 53,903 (39,091)
Unamortized intangible assets:
Trademarks and tradenames 86,544 — 86,544 —
$ 427,822 $ (93,637) $ 425,513 $ (106,073)
Customer relationships, trademarks, tradenames, patents and other intangible assets primarily represent allocations of purchase price to identifiable intangible assets of acquired businesses. Promotional, marketing and distribution rights represent intangible assets created under our Sports Medicine Joint Development and Distribution Agreement (the "JDDA") with Musculoskeletal Transplant Foundation (“MTF”).
On January 3, 2012, the Company entered into the JDDA with MTF to obtain MTF's worldwide promotion rights with respect to allograft tissues within the field of sports medicine and related products. The initial consideration from the Company included a $63.0 million up-front payment for the rights and certain assets, with an additional $84.0 million contingently payable over a four year period depending on MTF meeting supply targets for tissue. On January 3, 2013 and January 3, 2014, we paid $34.0 million and $16.7 million, respectively, of the additional consideration; $16.7 million of the additional consideration is due within the next fiscal year with the remainder due in equal installments in each year thereafter. The $50.0 million related to the remaining contingent obligation as of December 31, 2013 is accrued in other current and other long term liabilities as we believe it is probable MTF will meet the supply targets.
Trademarks and tradenames were recognized principally in connection with the 1997 acquisition of Linvatec Corporation. We continue to market products, release new product and product extensions and maintain and promote these trademarks and tradenames in the marketplace through legal registration and such methods as advertising, medical education and trade shows. It is our belief that these trademarks and tradenames will generate cash flow for an indefinite period of time. Therefore, our trademarks and tradenames intangible assets are not amortized.
Amortization expense related to intangible assets which are subject to amortization is included as a reduction of revenue (for amortization related to our promotional, marketing and distribution rights) and in selling and administrative expense (for all other intangible assets) in the consolidated statements of comprehensive income. The weighted average amortization period for intangible assets which are amortized is 27 years. Customer relationships are being amortized over a weighted average life of 33 years. Promotional, marketing and distribution rights are being amortized over a weighted average life of 25 years. Patents and other intangible assets are being amortized over a weighted average life of 15 years. Amortization expense for the year ending December 31, 2013 and estimated amortization expense related to intangible assets for each of the five succeeding years is as follows:

56
Amortizationincluded in
expense
Amortizationrecorded as areduction of
revenue Total2013 $ 7,721 $ 6,000 $ 13,7212014 7,031 6,000 $ 13,0312015 6,642 6,000 $ 12,6422016 6,539 6,000 $ 12,5392017 6,527 6,000 $ 12,5272018 6,470 6,000 $ 12,470
Note 5 — Long Term Debt
Long-term debt consists of the following at December 31,:
2012 2013
Revolving line of credit $ 153,000 $ 208,000
2.50% convertible senior subordinated notes 227 —
Mortgage notes 8,625 7,575
Total long-term debt 161,852 215,575
Less: Current portion 1,050 1,140
$ 160,802 $ 214,435
On January 17, 2013, we entered into an amended and restated $350.0 million senior credit agreement (the "amended and restated senior credit agreement"). The amended and restated senior credit agreement consists of a $350.0 million revolving credit facility expiring on January 17, 2018. In connection with the refinancing, we recorded a $0.3 million loss on the early extinguishment of debt related to write-off of unamortized deferred financing costs under the then existing senior credit agreement. There were $208.0 million in borrowings outstanding on the revolving credit facility as of December 31, 2013. Our available borrowings on the revolving credit facility at December 31, 2013 were $134.2 million with approximately $7.8 million of the facility set aside for outstanding letters of credit. As described in Note 4, we entered into a distribution and development agreement with Musculoskeletal Transplant Foundation (“MTF”) on January 3, 2012 and used cash on hand and available borrowings under our revolving credit facility to fund the up front payment of $63.0 million and contingent payment made on January 3, 2013 of $34.0 million.
Interest rates on the amended and restated senior credit agreement are at LIBOR plus 1.625% (1.795% at December 31, 2013) or an alternative base rate. For those borrowings where we elect to use the alternative base rate, the base rate will be the greater of the Prime Rate, the Federal Funds Rate in effect on such date plus 0.50%, or the one month Eurocurrency rate plus 1%, plus an additional margin of 0.625%.
The amended and restated senior credit agreement is collateralized by substantially all of our personal property and assets. The amended and restated senior credit agreement contains covenants and restrictions which, among other things, require the maintenance of certain financial ratios (the most restrictive of which is the senior leverage ratio), and restrict dividend payments and the incurrence of certain indebtedness and other activities, including acquisitions and dispositions. We are also required, under certain circumstances, to make mandatory prepayments from net cash proceeds from any issuance of equity and asset sales.
We have a mortgage note outstanding in connection with the Largo, Florida property and facilities bearing interest at 8.25% per annum with semiannual payments of principal and interest through June 2019. The principal balance outstanding on
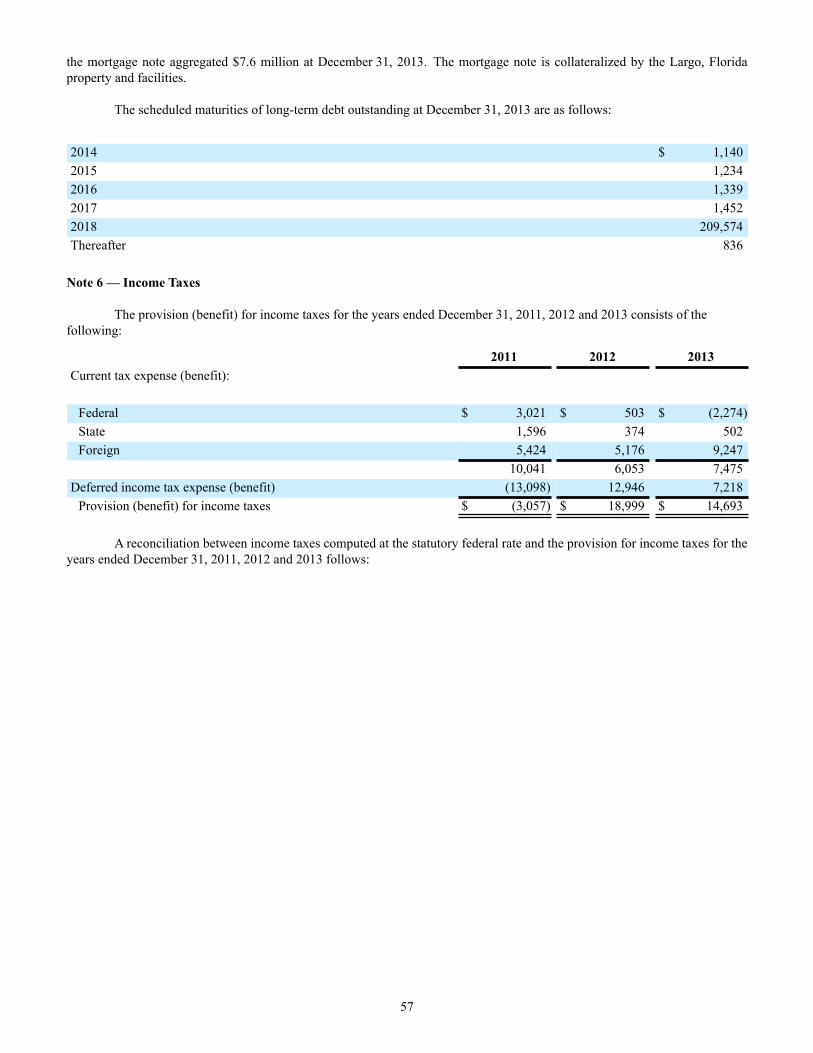
57
the mortgage note aggregated $7.6 million at December 31, 2013. The mortgage note is collateralized by the Largo, Florida property and facilities. The scheduled maturities of long-term debt outstanding at December 31, 2013 are as follows:
2014 $ 1,1402015 1,2342016 1,3392017 1,4522018 209,574Thereafter 836
Note 6 — Income Taxes
The provision (benefit) for income taxes for the years ended December 31, 2011, 2012 and 2013 consists of the following:
2011 2012 2013Current tax expense (benefit):
Federal $ 3,021 $ 503 $ (2,274)State 1,596 374 502Foreign 5,424 5,176 9,247 10,041 6,053 7,475
Deferred income tax expense (benefit) (13,098) 12,946 7,218Provision (benefit) for income taxes $ (3,057) $ 18,999 $ 14,693
A reconciliation between income taxes computed at the statutory federal rate and the provision for income taxes for the years ended December 31, 2011, 2012 and 2013 follows:

58
2011 2012 2013Tax provision (benefit) at statutory rate based on income before income taxes (35.0)% 35.0% 35.0%
State income taxes, net of federal tax benefit 22.7 1.5 1.8
Stock-based compensation (1.6) (0.2) (0.5)
Foreign income taxes 1.4 (4.0) (3.1)
Impact of repatriation of foreign earnings (57.5) — —
Research & development credit (32.3) — (2.8)
Settlement of taxing authority examinations (6.5) (0.8) (2.0)
European permanent deduction — — (2.4)
Non deductible/non-taxable items (13.3) 1.3 2.9
Other, net (10.5) (0.9) 0.1
(132.6)% 31.9% 29.0%
The tax effects of the significant temporary differences which comprise the deferred income tax assets and liabilities at December 31, 2012 and 2013 are as follows:
2012 2013Assets:
Inventory $ 4,370 $ 3,445Net operating losses 7,716 6,450Capitalized research and development 2,730 2,286Deferred compensation 2,905 3,025Accounts receivable 2,759 2,642Employee benefits 5,725 5,601Accrued pension 8,081 (173)Research and development credit 3,378 5,027Other 4,335 4,365Foreign tax credit — 332
41,999 33,000
Liabilities: Goodwill and intangible assets 111,770 114,075Depreciation 13,070 13,486State taxes 2,992 3,914Contingent interest 378 339
128,210 131,814
Net liability $ (86,211) $ (98,814)

59
Income (loss) before income taxes consists of the following U.S. and foreign income:
2011 2012 2013
U.S. income (loss) $ (20,521) $ 33,121 $ 20,106Foreign income 18,216 26,359 30,526
Total income (loss) $ (2,305) $ 59,480 $ 50,632 The amount of Federal net operating loss carryforward is $18.4 million and begins to expire in 2025. The amount of Federal Research and Development credit carryforward available is $5.0 million. These credits begin to expire in 2027. The amount of Foreign Tax Credit Carryforward is $0.3 million and begins to expire in 2022.
Deferred tax amounts include approximately $3.3 million of future tax benefits associated with state tax credits which have an indefinite carryforward period.
As a result of the contingent interest deferred tax liability realized upon the convertible notes repurchase during the fourth quarter of 2011, the Company reevaluated our unremitted foreign earnings and tax credit carryforwards. Based upon this assessment, we repatriated $16.2 million of foreign earnings to the United States. The Company recorded a net tax benefit of $1.3 million in 2011 to recognize the tax liabilities and related foreign tax credit benefits associated with the repatriation. It is our intention to permanently reinvest the remaining amount of unremitted foreign earnings.
U.S. income and foreign withholding taxes have not been recognized on the excess of the amount for financial reporting over the tax basis of investments in foreign subsidiaries that are essentially permanent in duration. The amount of such temporary differences totaled $80.1 million as of December 31, 2013. It is not practicable given the complexities of the hypothetical foreign tax credit calculation to determine the tax liability on this temporary difference.
The Company is subject to taxation in the United States and various states and foreign jurisdictions. Taxing authority examinations can involve complex issues and may require an extended period of time to resolve. Our Federal income tax returns have been examined by the Internal Revenue Service (“IRS”) for calendar years ending through 2012.
We recognize tax liabilities in accordance with the provisions for accounting for uncertainty in income taxes. Such guidance prescribes a recognition threshold and measurement attribute for the financial statement recognition and measurement of a tax position taken or expected to be taken in a tax return.
The following table summarizes the activity related to our unrecognized tax benefits for the years ending December 31,:
2011 2012 2013
Balance as of January 1, $ 1,330 $ 2,343 $ 1,587
Increases for positions taken in prior periods 283 30 70
Increases for positions taken in current periods 789 1,129 1,132
Decreases in unrecorded tax positions related to settlement with thetaxing authorities — (1,857) (1,010)
Decreases in unrecorded tax positions related to lapse of statute oflimitations (59) (58) (90)
Balance as of December 31, $ 2,343 $ 1,587 $ 1,689

60
If the total unrecognized tax benefits of $1.7 million at December 31, 2013 were recognized, it would reduce our annual effective tax rate. The amount of interest accrued in 2013 related to these unrecognized tax benefits was not material and is included in the provision for income taxes in the consolidated statements of comprehensive income. It is reasonably possible that the amount of unrecognized tax benefits, each of which are individually insignificant, could change in the next 12 months as a result of the anticipated completion of taxing authority examinations and lapse of statute of limitations. The range of change in unrecognized tax benefits is estimated between $0.0 million and $1.2 million.
Note 7 – Shareholders’ Equity
Our shareholders have authorized 500,000 shares of preferred stock, par value $.01 per share, which may be issued in one or more series by the Board of Directors without further action by the shareholders. As of December 31, 2012 and 2013, no preferred stock had been issued.
Our Board of Directors has authorized a $200.0 million share repurchase program. Through December 31, 2013, we have repurchased a total of 5.7 million shares of common stock aggregating $145.7 million under this authorization and have $54.3 million remaining available for share repurchases. The repurchase program calls for shares to be purchased in the open market or in private transactions from time to time. We may suspend or discontinue the share repurchase program at any time. During 2013, we repurchased 1.6 million shares for an aggregate cost of $50.6 million. During 2012, we repurchased 0.1 million shares for an aggregated cost of $3.9 million. During 2011, we repurchased 0.7 million shares for an aggregate cost of $15.0 million.
We have reserved 7.0 million shares of common stock for issuance to employees and directors under three shareholder-approved share-based compensation plans (the "Plans") of which approximately 1.1 million shares remain available for grant at December 31, 2013. The exercise price on all outstanding options and stock appreciation rights (“SARs”) is equal to the quoted fair market value of the stock at the date of grant. Restricted stock units (“RSUs”) and performance stock units (“PSUs”) are valued at the market value of the underlying stock on the date of grant. Stock options, SARs, RSUs and PSUs are non-transferable other than on death and generally become exercisable over a five year period from date of grant. Stock options and SARs expire ten years from date of grant. SARs are only settled in shares of the Company’s stock. The issuance of shares pursuant to the exercise of stock options and SARs and vesting of RSUs and PSUs are from the Company’s treasury stock.
Total pre-tax stock-based compensation expense recognized in the consolidated statements of comprehensive income was $5.2 million, $5.7 million and $5.6 million for the years ended December 31, 2011, 2012 and 2013, respectively. This amount is included in selling and administrative expenses on the consolidated statements of comprehensive income. Tax related benefits of $1.9 million, $2.1 million and $2.1 million were also recognized for the years ended December 31, 2011, 2012 and 2013, respectively. Cash received from the exercise of stock options was $5.6 million, $9.6 million and $16.7 million for the years ended December 31, 2011, 2012 and 2013, respectively, and is reflected in cash flows from financing activities in the consolidated statements of cash flows.
The Company uses the Black-Scholes option pricing model to estimate the fair value of options and SARs at the date of grant. Use of a valuation model requires management to make certain assumptions with respect to select model inputs. Expected volatilities are based upon historical volatility of the Company’s stock over a period equal to the expected life of each option and SAR grant. The risk free interest rate is based on the option and SAR grant date for a traded U.S. Treasury bond with a maturity date closest to the expected life. The expected annual dividend yield is based on the Company's anticipated cash dividend payouts. The expected life represents the period of time that the options and SARs are expected to be outstanding based on a study of historical data of option holder exercise and termination behavior. The following table illustrates the assumptions used in estimating fair value in the years ended December 31, 2011, 2012 and 2013.
2011 2012 2013Fair value of options & SARs $ 10.43 $ 7.38 $ 9.77Expected stock price volatility 35.52% 35.84% 35.88%Risk-free interest rate 1.59% 0.62% 1.04%Expected annual dividend yield —% 2.00% 1.79%Expected life of options & SARs(years) 6.3 6.4 6.3

61
The following table illustrates the stock option and SAR activity for the year ended December 31, 2013.
Numberof
Shares(in 000’s)
Weighted-AverageExercise
Price
Outstanding at December 31, 2012 1,769 $ 25.35
Granted 164 $ 32.94Forfeited (9) $ 25.96Exercised (794) $ 26.62
Outstanding at December 31, 2013 1,130 $ 25.55Exercisable at December 31, 2013 659 $ 24.40
The weighted average remaining contractual term for stock options and SARs outstanding and exercisable at December 31, 2013 was 6.0 years and 4.5 years, respectively. The aggregate intrinsic value of stock options and SARs outstanding and exercisable at December 31, 2013 was $19.2 million and $11.9 million, respectively. The aggregate intrinsic value of stock options and SARs exercised during the years ended December 31, 2011, 2012 and 2013 was $2.0 million, $3.3 million and $4.7 million, respectively.
The following table illustrates the RSU and PSU activity for the year ended December 31, 2013.
Numberof
Shares(in 000’s)
Weighted-Average
Grant-DateFair Value
Outstanding at December 31, 2012 521 $ 24.25
Granted 211 $ 33.02Vested (168) $ 23.76Forfeited (88) $ 30.55
Outstanding at December 31, 2013 476 $ 27.14
The weighted average fair value of awards of RSUs and PSUs granted in the years ended December 31, 2011, 2012 and 2013 was $27.48, $26.18 and $33.02, respectively.
The total fair value of shares vested was $3.6 million, $4.4 million and $7.1 million for the years ended December 31, 2011, 2012 and 2013, respectively.
As of December 31, 2013, there was $13.1 million of total unrecognized compensation cost related to nonvested stock options, SARs, RSUs and PSUs granted under the Plan which is expected to be recognized over a weighted average period of 3.4 years.
We offer to our employees a shareholder-approved Employee Stock Purchase Plan (the “Employee Plan”), under which we have reserved 1.0 million shares of common stock for issuance to our employees. The Employee Plan provides employees with the opportunity to invest from 1% to 10% of their annual salary to purchase shares of CONMED common stock through the exercise of stock options granted by the Company at a purchase price equal to 95% of the fair market value of the common stock on the exercise date. During 2013, we issued approximately 18,000 shares of common stock under the Employee Plan. No stock-based compensation expense has been recognized in the accompanying consolidated financial statements as a result of common stock issuances under the Employee Plan.
Note 8 — Business Segments and Geographic Areas
During 2011 and 2012, we undertook a variety of restructuring initiatives aimed at improving efficiency and internal effectiveness. These initiatives included changes in management lines of reporting and culminated in the implementation of a functional organizational structure. Under the new structure, we are now organized by function rather than by operating segment.

62
Executives reporting in to the CEO include those responsible for operations and supply chain management, research and development, sales, marketing and certain corporate functions. Our chief operating decision maker (the CEO) evaluates the various global product portfolios on a net sales basis and evaluates profitability, investment and cash flow metrics on a consolidated worldwide basis due to shared infrastructure and resources. As a result, we have discontinued accounting and reporting for our businesses as five separate, operating segments. Effective January 1, 2013, we are accounting and reporting for our business as a single segment entity engaged in the development, manufacturing and sale on a global basis of surgical devices and related equipment.
As part of this reporting structure change, we also restructured our product lines. Orthopedic surgery consists of sports medicine instrumentation and small bone, large bone and specialty powered surgical instruments and service fees related to the promotion and marketing of sports medicine allograft tissue. General surgery consists of a complete line of endo-mechanical instrumentation for minimally invasive laparoscopic and gastrointestinal procedures, a line of cardiac monitoring products as well as electrosurgical generators and related instruments. Surgical visualization consists of 2D and 3D video systems for use in minimally invasive orthopedic and general surgery. These product lines' net sales are as follows:
2011 2012 2013
Orthopedic surgery $ 371,245 $ 413,891 $ 410,171General surgery 287,350 286,606 286,747Surgical visualization 66,482 66,643 65,786
Consolidated net sales $ 725,077 $ 767,140 $ 762,704
Net sales information for geographic areas consists of the following:
2011 2012 2013
United States $ 364,588 $ 382,256 $ 375,473Canada 65,794 73,746 73,457United Kingdom 32,106 31,653 28,471Japan 34,178 33,997 36,705Australia 40,122 40,835 38,752All other countries 188,289 204,653 209,846
Total $ 725,077 $ 767,140 $ 762,704
Sales are attributed to countries based on the location of the customer. There were no significant investments in long-lived assets located outside the United States at December 31, 2012 and 2013. No single customer represented over 10% of our consolidated net sales for the years ended December 31, 2011, 2012 and 2013.
Note 9 — Employee Benefit Plans
We sponsor an employee savings plan (“401(k) plan”) covering substantially all of our Untied States based employees. We also sponsor a defined benefit pension plan (the “pension plan”) that was frozen in 2009. It covered substantially all our United States based employees at the time it was frozen.
Total employer contributions to the 401(k) plan were $6.3 million, $6.7 million and $7.3 million during the years ended December 31, 2011, 2012 and 2013, respectively.
We use a December 31, measurement date for our pension plan. Gains and losses are amortized on a straight-line basis over the average remaining service period of active participants. The following table provides a reconciliation of the projected benefit obligation, plan assets and funded status of the pension plan at December 31,:
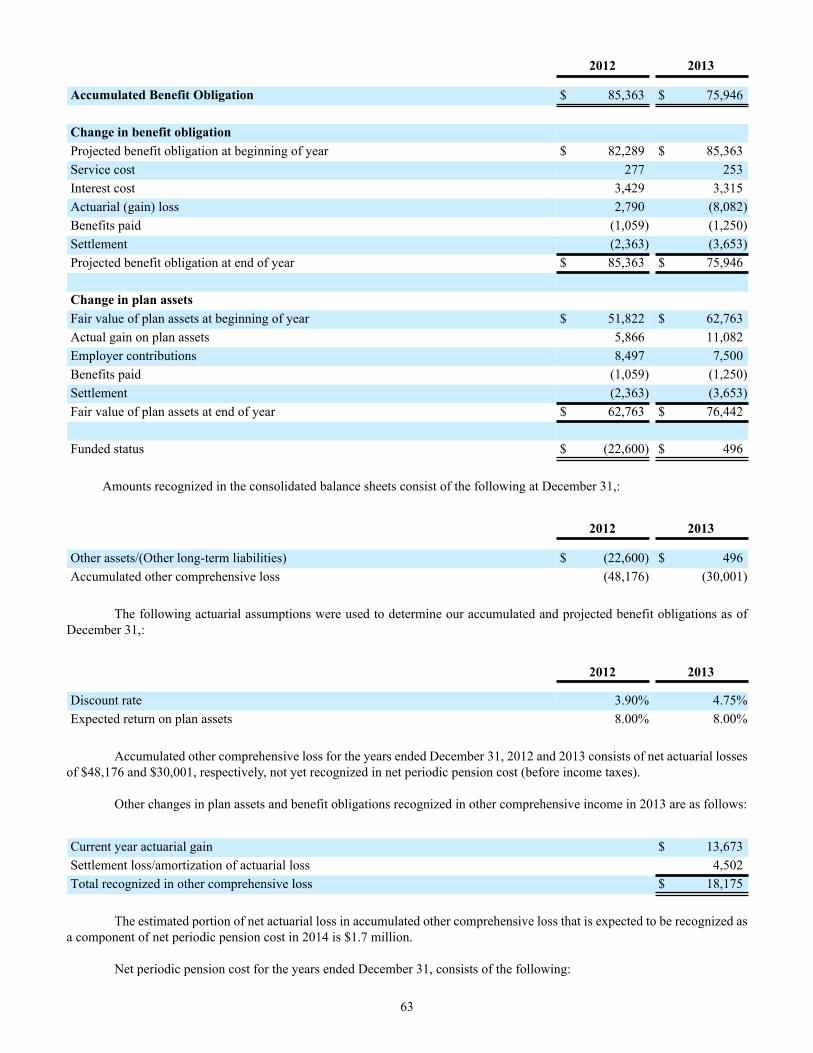
63
2012 2013
Accumulated Benefit Obligation $ 85,363 $ 75,946
Change in benefit obligation Projected benefit obligation at beginning of year $ 82,289 $ 85,363Service cost 277 253Interest cost 3,429 3,315Actuarial (gain) loss 2,790 (8,082)Benefits paid (1,059) (1,250)Settlement (2,363) (3,653)Projected benefit obligation at end of year $ 85,363 $ 75,946
Change in plan assets Fair value of plan assets at beginning of year $ 51,822 $ 62,763Actual gain on plan assets 5,866 11,082Employer contributions 8,497 7,500Benefits paid (1,059) (1,250)Settlement (2,363) (3,653)Fair value of plan assets at end of year $ 62,763 $ 76,442
Funded status $ (22,600) $ 496
Amounts recognized in the consolidated balance sheets consist of the following at December 31,:
2012 2013
Other assets/(Other long-term liabilities) $ (22,600) $ 496Accumulated other comprehensive loss (48,176) (30,001)
The following actuarial assumptions were used to determine our accumulated and projected benefit obligations as of December 31,:
2012 2013
Discount rate 3.90% 4.75%Expected return on plan assets 8.00% 8.00%
Accumulated other comprehensive loss for the years ended December 31, 2012 and 2013 consists of net actuarial losses of $48,176 and $30,001, respectively, not yet recognized in net periodic pension cost (before income taxes).
Other changes in plan assets and benefit obligations recognized in other comprehensive income in 2013 are as follows:
Current year actuarial gain $ 13,673Settlement loss/amortization of actuarial loss 4,502Total recognized in other comprehensive loss $ 18,175
The estimated portion of net actuarial loss in accumulated other comprehensive loss that is expected to be recognized as a component of net periodic pension cost in 2014 is $1.7 million.
Net periodic pension cost for the years ended December 31, consists of the following:

64
2011 2012 2013
Service cost $ 281 $ 277 $ 253Interest cost on projected benefit obligation 3,519 3,429 3,315Return on plan assets (4,378) (4,566) (5,491)Amortization of loss 1,578 2,876 3,059Settlement expense — — 1,443Net periodic pension cost $ 1,000 $ 2,016 $ 2,579
The following actuarial assumptions were used to determine our net periodic pension benefit cost for the years ended December 31,:
2011 2012 2013
Discount rate 5.41% 4.30% 3.90%Expected return on plan assets 8.00% 8.00% 8.00%
In determining the expected return on pension plan assets, we consider the relative weighting of plan assets, the historical
performance of total plan assets and individual asset classes and economic and other indicators of future performance. In addition, we consult with financial and investment management professionals in developing appropriate targeted rates of return.
Asset management objectives include maintaining an adequate level of diversification to reduce interest rate and market risk and providing adequate liquidity to meet immediate and future benefit payment requirements.
The allocation of pension plan assets by category is as follows at December 31,:
Percentage of PensionPlan Assets
TargetAllocation
2012 2013 2013
Equity securities 76% 79% 75%Debt securities 24 21 25
Total 100% 100% 100%
As of December 31, 2013, the Plan held 27,562 shares of our common stock, which had a fair value of $1.2 million. We believe that our long-term asset allocation on average will approximate the targeted allocation. We regularly review our actual asset allocation and periodically rebalance the pension plan’s investments to our targeted allocation when deemed appropriate.
The following table sets forth the fair value of Plan assets as of December 31,:
2012 2013
Common Stock $ 25,124 $ 31,412Money Market Fund 5,209 7,018Mutual Funds 22,810 28,726Fixed Income Securities 9,620 9,286
Total Assets at Fair Value $ 62,763 $ 76,442
FASB guidance, defines fair value, establishes a framework for measuring fair value and related disclosure requirements. A valuation hierarchy was established for disclosure of the inputs to the valuations used to measure fair value. This hierarchy prioritizes the inputs into three broad levels as follows. Level 1 inputs are quoted prices (unadjusted) in active markets for identical assets or liabilities. Level 2 inputs are quoted prices for similar assets and liabilities in active markets, quoted prices for identical or similar assets in markets that are not active, inputs other than quoted prices that are observable for the asset or liability, including

65
interest rates, yield curves and credit risks, or inputs that are derived principally from or corroborated by observable market data through correlation. Level 3 inputs are unobservable inputs based on our own assumptions used to measure assets and liabilities at fair value. A financial asset or liability’s classification within the hierarchy is determined based on the lowest level input that is significant to the fair value measurement.
Following is a description of the valuation methodologies used for assets measured at fair value. There have been no changes in the methodologies used at December 31, 2012 and 2013:
CommonStock:
Common stock is valued at the closing price reported on the common stock’s respective stock exchange and is classified within level 1 of the valuation hierarchy.
MoneyMarket Fund:
These investments are public investment vehicles valued using $1 for the Net Asset Value (NAV). The money market fund is classified within level 2 of the valuation hierarchy.
MutualFunds:
These investments are public investment vehicles valued using the NAV provided by the administrator of the fund. The NAV is based on the value of the underlying assets owned by the fund, minus its liabilities, and then divided by the number of shares outstanding. The NAV is a quoted price in an active market and is classified within level 1 of the valuation hierarchy.
Fixed IncomeSecurities:
Valued at the closing price reported on the active market on which the individual securities are traded and are classified within level 1 of the valuation hierarchy.
The methods described above may produce a fair value calculation that may not be indicative of net realizable value or reflective of future fair values. Furthermore, while the Plan believes its valuation methods are appropriate and consistent with other market participants, the use of different methodologies or assumptions to determine the fair value of certain financial instruments could result in a different fair value measurement at the reporting date.
The following table sets forth by level, within the fair value hierarchy, the Plan's assets at fair value as of December 31, 2012 and December 31, 2013:
December 31, 2012 Level 1 Level 2 Total
Common Stock $ 25,124 $ — $ 25,124Money Market Fund — 5,209 5,209Mutual Funds 22,810 — 22,810Fixed Income Securities 9,620 — 9,620
$ 57,554 $ 5,209 $ 62,763
December 31, 2013 Level 1 Level 2 Total
Common Stock $ 31,412 $ — $ 31,412Money Market Fund — 7,018 7,018Mutual Funds 28,726 — 28,726Fixed Income Securities 9,286 — 9,286
$ 69,424 $ 7,018 $ 76,442
We do not expect to make any contributions to our pension plan for the 2014 Plan year.
The following table summarizes the benefits expected to be paid by our pension plan in each of the next five years and in aggregate for the following five years. The expected benefit payments are estimated based on the same assumptions used to measure the Company’s projected benefit obligation at December 31, 2013 and reflect the impact of expected future employee service.

66
2014 $5,3322015 3,1402016 3,1002017 3,3512018 3,9732019-2023 23,943
Note 10 — Legal Matters and Contingencies
From time to time, we are a defendant in certain lawsuits alleging product liability, patent infringement, or other claims incurred in the ordinary course of business. Likewise, from time to time, the Company may receive a subpoena from a government agency such as the Securities and Exchange Commission, Equal Employment Opportunity Commission, the Occupational Safety and Health Administration, the Department of Labor, the Treasury Department, or other federal and state agencies or foreign governments or government agencies. These subpoenas may or may not be routine inquiries, or may begin as routine inquiries and over time develop into enforcement actions of various types. The product liability claims are generally covered by various insurance policies, subject to certain deductible amounts, maximum policy limits and certain exclusions in the respective policies or as required as a matter of law. In some cases we may be entitled to indemnification by third parties. We establish reserves sufficient to cover probable losses associated with claims. We do not expect that the resolution of any pending claims or investigations will have a material adverse effect on our financial condition, results of operations or cash flows. There can be no assurance, however, that future claims or investigations, or the costs associated with responding to such claims or investigations, especially claims and investigations not covered by insurance, will not have a material adverse effect on our financial condition, results of operations or cash flows.
Manufacturers of medical products may face exposure to significant product liability claims. To date, we have not experienced any product liability claims that have been material to our financial statements or condition, but any such claims arising in the future could have a material adverse effect on our business or results of operations. We currently maintain commercial product liability insurance of $25 million per incident and $25 million in the aggregate annually, which we believe is adequate. This coverage is on a claims-made basis. There can be no assurance that claims will not exceed insurance coverage, that the carriers will be solvent or that such insurance will be available to us in the future at a reasonable cost.
Our operations are subject, and in the past have been subject, to a number of environmental laws and regulations governing, among other things, air emissions, wastewater discharges, the use, handling and disposal of hazardous substances and wastes, soil and groundwater remediation and employee health and safety. In some jurisdictions environmental requirements may be expected to become more stringent in the future. In the United States certain environmental laws can impose liability for the entire cost of site restoration upon each of the parties that may have contributed to conditions at the site regardless of fault or the lawfulness of the party’s activities. While we do not believe that the present costs of environmental compliance and remediation are material, there can be no assurance that future compliance or remedial obligations would not have a material adverse effect on our financial condition, results of operations or cash flows.
In September 2012, Bonutti Skeletal Innovations, LLC filed a complaint in the United States District Court for the Middle District of Florida against CONMED and certain of its subsidiaries. The Complaint asserts that select CONMED products infringe patents allegedly owned by Bonutti Skeletal Innovations. On the same day that it sued CONMED, Bonutti Skeletal Innovations sued several other orthopedic companies. The Company believes that the products in question do not infringe the patents-in-suit and intends to vigorously defend the claims. A range of potential losses cannot be estimated at this time.
During the third quarter of 2013, the FDA inspected our Centennial, CO manufacturing facility and issued a Form 483 with observations on September 20, 2013. The Company subsequently submitted responses to the Observations, and the FDA issued a Warning Letter on January 30, 2014 relating to the inspection and the responses to the Form 483 Observations. Accordingly, we are undertaking corrective actions that may involve additional costs for the Company. These remediation costs are not expected to be material, however there can be no assurance that the actions undertaken by the Company will ensure that the Company will not undertake recalls, voluntary or otherwise, nor can there be any assurance that a future inspection by the FDA will not result in an additional Form 483 or warning letter, or other regulatory actions which may include consent decrees or fines.
Note 11 — Other Expense
Other expense for the year ended December 31, consists of the following:

67
2011 2012 2013Administrative consolidation costs $ 792 $ 6,497 $ 8,750Costs associated with purchase of a distributor 300 704 —Costs associated with legal arbitration and patent dispute — 1,555 3,206Pension settlement expense — — 1,443Costs associated with purchase of a business — 1,194 —Other expense $ 1,092 $ 9,950 $ 13,399
During 2011, 2012 and 2013, we consolidated certain administrative functions and incurred $0.8 million, $6.5 million
and $8.8 million respectively, in related costs consisting principally of severance charges and the write-off of certain patents.
During 2011, we purchased the Company's former distributor for the Nordic region of Europe. We incurred $0.3 million and $0.7 million in 2011 and 2012, respectively, in charges associated with this purchase.
During 2012, we incurred legal costs related to a contractual dispute with a former distributor. The dispute was resolved in the second quarter of 2012. We incurred costs totaling $1.6 million.
During 2013, we incurred $3.2 million in legal costs associated with a patent infringement claim as further described in Note 10.
During 2013, we had a higher level of lump sum withdrawals from pension plan participants. This resulted in an acceleration of the recognition of a portion of our projected benefit obligation and we therefore recorded a pension settlement expense of $1.4 million. Refer to Note 9 for details.
During 2012, we acquired Viking Systems Inc. as further described in Note 16. We incurred a total of $1.2 million in costs associated with the purchase.
Note 12 — Guarantees
We provide warranties on certain of our products at the time of sale. The standard warranty period for our capital and reusable equipment is generally one year. Liability under service and warranty policies is based upon a review of historical warranty and service claim experience. Adjustments are made to accruals as claim data and historical experience warrant.
Changes in the carrying amount of service and product warranties for the year ended December 31, are as follows:
2011 2012 2013
Balance as of January 1, $ 3,363 $ 3,618 $ 3,636
Provision for warranties 4,344 4,163 3,061Claims made (4,089) (4,145) (4,275)
Balance as of December 31, $ 3,618 $ 3,636 $ 2,422
Note 13 – Fair Value Measurement
We enter into derivative instruments for risk management purposes only. We operate internationally and, in the normal course of business, are exposed to fluctuations in interest rates, foreign exchange rates and commodity prices. These fluctuations can increase the costs of financing, investing and operating the business. We use forward contracts, a type of derivative instrument, to manage certain foreign currency exposures.
By nature, all financial instruments involve market and credit risks. We enter into forward contracts with major investment grade financial institutions and have policies to monitor the credit risk of those counterparties. While there can be no assurance, we do not anticipate any material non-performance by any of these counterparties.

68
Foreign Currency Forward Contracts. We hedge forecasted intercompany sales denominated in foreign currencies through the use of forward contracts. We account for these forward contracts as cash flow hedges. To the extent these forward contracts meet hedge accounting criteria, changes in their fair value are not included in current earnings but are included in accumulated other comprehensive loss. These changes in fair value will be recognized into earnings as a component of sales or cost of sales when the forecasted transaction occurs. The notional contract amounts for forward contracts outstanding at December 31, 2013 which have been accounted for as cash flow hedges totaled $132.4 million. Net realized gains (losses) recognized for forward contracts accounted for as cash flow hedges approximated -$4.7 million, $3.8 million and $0.2 million for the years ended December 31, 2011, 2012, and 2013, respectively. Net unrealized losses on forward contracts outstanding which have been accounted for as cash flow hedges and which have been included in other comprehensive income totaled $1.4 million at December 31, 2013. It is expected these unrealized losses will be recognized in the consolidated statement of comprehensive income in 2014 and 2015.
We also enter into forward contracts to exchange foreign currencies for United States dollars in order to hedge our currency transaction exposures on intercompany receivables denominated in foreign currencies. These forward contracts settle each month at month-end, at which time we enter into new forward contracts. We have not designated these forward contracts as hedges and have not applied hedge accounting to them. The notional contract amounts for forward contracts outstanding at December 31, 2013 which have not been designated as hedges totaled $42.0 million. Net realized gains (losses) recognized in connection with those forward contracts not accounted for as hedges approximated $0.0 million, -$2.1 million and -$0.3 million for the years ended December 31, 2011, 2012, and 2013, respectively, offsetting gains (losses) on our intercompany receivables of -$0.3 million, $0.8 million and -$0.8 million for the years ended December 31, 2011, 2012, and 2013, respectively. These gains and losses have been recorded in selling and administrative expense in the consolidated statements of comprehensive income.
We record these forward foreign exchange contracts at fair value; the following table summarizes the fair value for forward foreign exchange contracts outstanding at December 31, 2012 and December 31, 2013:
December 31, 2012
AssetBalance Sheet
LocationFair
Value
LiabilitiesBalance Sheet
LocationFair
Value
Net FairValue
Derivatives designated as hedgedinstruments:
Foreign exchange contracts Other current liabilities $ (457) Other current liabilities $ 2,249 $ 1,792
Derivatives not designated ashedging instruments:
Foreign exchange contracts Other current liabilities — Other current liabilities 150 150
Total derivatives $ (457) $ 2,399 $ 1,942

69
December 31, 2013
AssetBalance Sheet
LocationFair
Value
LiabilitiesBalance Sheet
LocationFair
Value
Net FairValue
Derivatives designated as hedgedinstruments:
Foreign exchange contractsOther currentliabilities $ (975)
Other currentliabilities $ 3,172 $ 2,197
Derivatives not designated ashedging instruments:
Foreign exchange contractsOther currentliabilities (52)
Other currentliabilities 78 26
Total derivatives $ (1,027) $ 3,250 $ 2,223
Our forward foreign exchange contracts are subject to a master netting agreement and qualify for netting in the consolidated balance sheets. Accordingly, at December 31, 2012 and December 31, 2013 we have recorded the net fair value of $1.9 million and $2.2 million, respectively, in other current liabilities.
Fair Value Disclosure. FASB guidance defines fair value, establishes a framework for measuring fair value and related disclosure requirements. This guidance applies when fair value measurements are required or permitted. The guidance indicates, among other things, that a fair value measurement assumes that the transaction to sell an asset or transfer a liability occurs in the principal market for the asset or liability or, in the absence of a principal market, the most advantageous market for the asset or liability. Fair value is defined based upon an exit price model.
Valuation Hierarchy. A valuation hierarchy was established for disclosure of the inputs to the valuations used to measure fair value. This hierarchy prioritizes the inputs into three broad levels as follows. Level 1 inputs are quoted prices (unadjusted) in active markets for identical assets or liabilities. Level 2 inputs are quoted prices for similar assets and liabilities in active markets, quoted prices for identical or similar assets in markets that are not active, inputs other than quoted prices that are observable for the asset or liability, including interest rates, yield curves and credit risks, or inputs that are derived principally from or corroborated by observable market data through correlation. Level 3 inputs are unobservable inputs based on our own assumptions used to measure assets and liabilities at fair value. A financial asset or liability’s classification within the hierarchy is determined based on the lowest level input that is significant to the fair value measurement.
Valuation Techniques. Assets and liabilities carried at fair value and measured on a recurring basis as of December 31, 2013 consist of forward foreign exchange contracts. The Company values its forward foreign exchange contracts using quoted prices for similar assets. The most significant assumption is quoted currency rates. The value of the forward foreign exchange contract assets and liabilities were determined within Level 2 of the valuation hierarchy and are listed in the table above.
The carrying amounts reported in our balance sheets for cash and cash equivalents, accounts receivable, accounts payable and long-term debt approximate fair value. Note 14 - New Accounting Pronouncements
In February 2013, the FASB issued Accounting Standards Update, Comprehensive Income (Topic 220): Presentation of Items Reclassified out of Accumulated Other Comprehensive Income. This guidance requires enhanced disclosures relating to reclassifications out of accumulated other comprehensive income. This guidance is effective for interim and annual periods beginning after December 15, 2012. The implementation of this new guidance did not have a material impact on our consolidated financial statements.
Effective January 2013, Accounting Standards Update 2011-11: Disclosures about Offsetting Assets and Liabilities, requires entities to disclose both gross information and net information about both instruments and transactions eligible for offset in the statement of financial position and instruments and transactions subject to an agreement similar to a master netting arrangement. The adoption of this guidance did not have a material impact on the financial statements.

70
In July 2013, the FASB issued ASU No. 2013-11: Presentation of an Unrecognized Tax Benefit When a Net Operating Loss Carryforward, a Similar Tax Loss, or a Tax Credit Carryforward Exists. This ASU is intended to provide guidance and reduce diversity in practice in the presentation of an unrecognized tax benefit when a tax loss or credit carryforward exists. The provisions of this ASU are effective for periods beginning after December 15, 2013 and must be applied prospectively for unrecognized tax benefits that exist at the effective date. Early adoption is permitted. We early adopted this guidance. There are no material effects on, or changes to, our financial statements or disclosures as a result of this ASU.
Note 15 – Restructuring
During 2011, 2012, and 2013 we incurred the following restructuring costs:
2011 2012 2013
Facility consolidation costs $ 3,467 $ 7,052 $ 6,489Termination of a product offering — — 2,137Restructuring costs included in cost of sales $ 3,467 $ 7,052 $ 8,626
Restructuring costs included in other expense $ 792 $ 6,497 $ 8,750
During 2008, we announced a plan to restructure certain of our operations. During 2011, 2012 and 2013, we continued our operational restructuring plan which includes the transfer of additional production lines from manufacturing facilities located in the United States to our manufacturing facility in Chihuahua, Mexico and the consolidation of our Finland operations into our Largo, Florida and Utica, New York manufacturing facilities. In the first quarter of 2013, we began the consolidation of our Westborough, Massachusetts operations into our Largo, Florida and Chihuahua, Mexico facilities. For the years ending December 31, 2011, 2012 and 2013, we charged $3.5 million, $7.1 million, and $6.5 million, respectively, to cost of goods sold. These costs include severance and other charges associated with the transfer of production to Mexico and consolidation of our Finland and Westborough, Massachusetts operations. We expect this phase of our plan and related cash payments to be substantially completed in the first quarter of 2014.
In the third quarter of 2013, as part of our ongoing restructuring, the Company discontinued a patient monitoring product offering and incurred $2.1 million in costs which were charged to cost of goods sold.
Restructuring costs included in other expense are described more fully in Note 11.
We have recorded an accrual in current liabilities of $3.1 million at December 31, 2013 mainly related to severance and lease impairment costs associated with the restructuring. Below is a rollforward of the accrual:
Balance as of January 1, 2013 $ 4,120
Expenses incurred 3,895
Payments made (4,887)
Balance, December 31, 2013 $ 3,128
During February 2014, the Company announced a new phase of the restructuring plan to consolidate our Centennial, Colorado manufacturing operations into other existing CONMED manufacturing facilities. We expect this plan to be completed over the next 24 months and are in the process of determining the total costs expected to be incurred. Note 16 – Business Acquisition
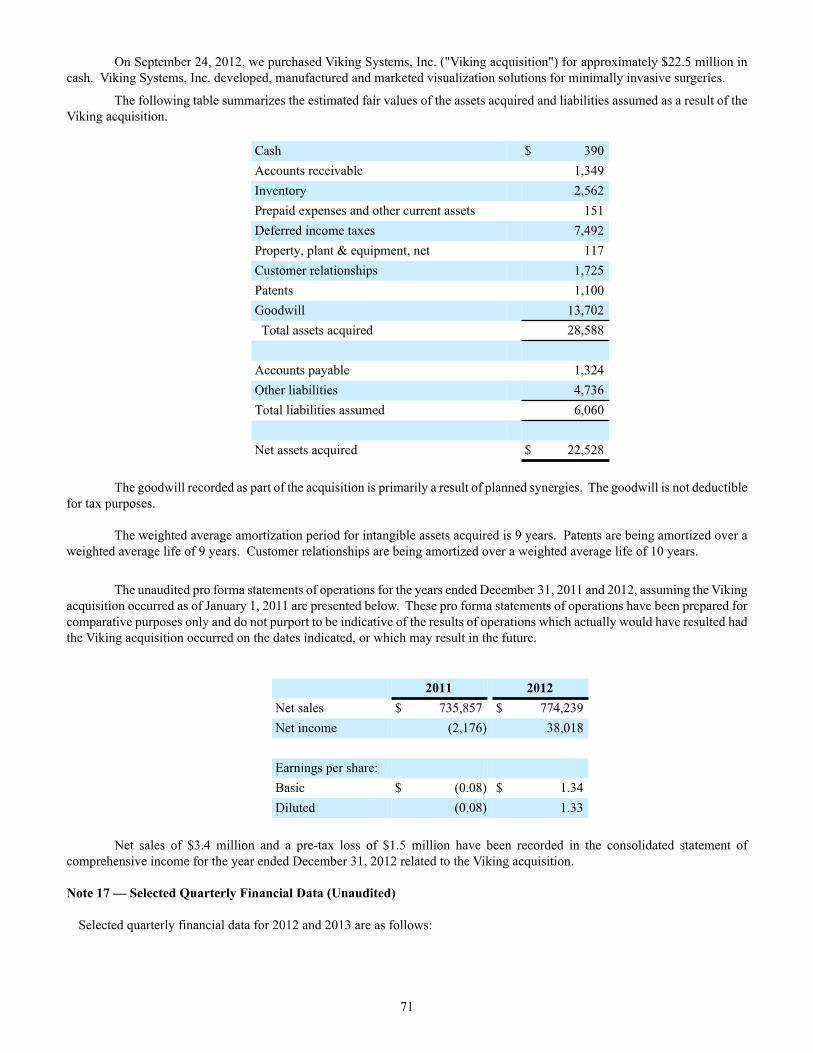
71
On September 24, 2012, we purchased Viking Systems, Inc. ("Viking acquisition") for approximately $22.5 million in cash. Viking Systems, Inc. developed, manufactured and marketed visualization solutions for minimally invasive surgeries.
The following table summarizes the estimated fair values of the assets acquired and liabilities assumed as a result of the Viking acquisition.
Cash $ 390Accounts receivable 1,349Inventory 2,562Prepaid expenses and other current assets 151Deferred income taxes 7,492Property, plant & equipment, net 117Customer relationships 1,725Patents 1,100Goodwill 13,702 Total assets acquired 28,588
Accounts payable 1,324Other liabilities 4,736Total liabilities assumed 6,060
Net assets acquired $ 22,528
The goodwill recorded as part of the acquisition is primarily a result of planned synergies. The goodwill is not deductible for tax purposes.
The weighted average amortization period for intangible assets acquired is 9 years. Patents are being amortized over a weighted average life of 9 years. Customer relationships are being amortized over a weighted average life of 10 years.
The unaudited pro forma statements of operations for the years ended December 31, 2011 and 2012, assuming the Viking acquisition occurred as of January 1, 2011 are presented below. These pro forma statements of operations have been prepared for comparative purposes only and do not purport to be indicative of the results of operations which actually would have resulted had the Viking acquisition occurred on the dates indicated, or which may result in the future.
2011 2012Net sales $ 735,857 $ 774,239Net income (2,176) 38,018
Earnings per share:Basic $ (0.08) $ 1.34Diluted (0.08) 1.33
Net sales of $3.4 million and a pre-tax loss of $1.5 million have been recorded in the consolidated statement of comprehensive income for the year ended December 31, 2012 related to the Viking acquisition.
Note 17 — Selected Quarterly Financial Data (Unaudited)
Selected quarterly financial data for 2012 and 2013 are as follows:

72
Three Months Ended March June September December2012 Net sales $ 194,316 $ 189,695 $ 181,885 $ 201,244Gross profit 100,911 99,732 97,913 107,287Net income 9,968 10,296 9,320 10,897EPS:
Basic .36 .36 .33 .38Diluted .35 .36 .32 .38
Three Months Ended March June September December2013 Net sales $ 187,014 $ 192,993 $ 179,255 $ 203,442Gross profit 102,682 102,916 95,424 111,395Net income 10,492 9,533 5,687 10,227EPS:
Basic .37 .35 .21 .37Diluted .37 .34 .20 .36
Items Included In Selected Quarterly Financial Data:
2012
First Quarter
During the first quarter of 2012, we incurred $1.5 million in costs associated with the moving of additional product lines to our manufacturing facility in Chihuahua, Mexico. These costs were charged to cost of goods sold – see Note 15.
During the first quarter of 2012, we recorded a charge of $0.3 million to other expense related to consolidating certain administrative functions - see Note 11 and Note 15.
During the first quarter of 2012, we incurred $0.7 million in costs associated with the purchase of the Company's former distributor for the Nordic region of Europe - see Note 11.
During the first quarter of 2012, we recorded a charge of $1.0 million to other expense related to legal costs associated with a contractual dispute with a former distributor - see Note 11. Second Quarter
During the second quarter of 2012, we incurred $1.2 million in costs associated with the moving of additional product lines to our manufacturing facility in Chihuahua, Mexico and consolidation of our Finland operations into our Largo, Florida and Utica, New York manufacturing facilities. These costs were charged to cost of goods sold – see Note 15.
During the second quarter of 2012, we recorded a charge of $1.2 million to other expense related to consolidating certain administrative functions - see Note 11 and Note 15.
During the second quarter of 2012, we recorded a charge of $0.5 million to other expense related to legal costs associated with a contractual dispute with a former distributor - see Note 11.
Third Quarter

73
During the third quarter of 2012, we incurred $1.8 million in costs associated with the moving of additional product lines to our manufacturing facility in Chihuahua, Mexico and consolidation of our Finland operations into our Largo, Florida and Utica, New York manufacturing facilities. These costs were charged to cost of goods sold – see Note 15.
During the third quarter of 2012, we recorded a charge of $1.9 million to other expense related to consolidating certain administrative functions - see Note 11 and Note 15.
During the third quarter of 2012, we recorded a charge of $0.7 million to other expense related to the acquisition of Viking Systems, Inc. - see Notes 11 and 16.
Fourth Quarter
During the fourth quarter of 2012, we incurred $2.5 million in costs associated with the moving of additional product lines to our manufacturing facility in Chihuahua, Mexico and consolidation of our Finland operations into our Largo, Florida and Utica, New York manufacturing facilities. These costs were charged to cost of goods sold – see Note 15.
During the fourth quarter of 2012, we recorded a charge of $3.1 million to other expense related to consolidating certain administrative functions - see Note 11 and Note 15.
During the fourth quarter of 2012, we recorded a charge of $0.5 million to other expense related to the acquisition of Viking Systems, Inc. - see Notes 11 and 16.
2013
First Quarter
During the first quarter of 2013, we incurred $1.6 million in costs associated with the moving of additional product lines to our manufacturing facility in Chihuahua, Mexico, consolidation of our Finland operations into our Largo, Florida and Utica, New York manufacturing facilities and consolidation of our Westborough, Massachusetts operations into our Largo, Florida and Chihuahua, Mexico manufacturing facilities. These costs were charged to cost of goods sold – see Note 15.
During the first quarter of 2013, we recorded a charge of $1.6 million to other expense related to consolidating certain administrative functions - see Note 11 and Note 15.
During the first quarter of 2013, we recorded a charge of $0.2 million to other expense related to legal costs associated with a patent infringement claim - see Note 10 and Note 11.
During the first quarter of 2013, we recorded a $0.3 million loss on the early extinguishment of debt related to write-off of unamortized deferred financing costs under the then existing senior credit agreement - see Note 5.
Second Quarter
During the second quarter of 2013, we incurred $1.6 million in costs associated with the moving of additional product lines to our manufacturing facility in Chihuahua, Mexico, consolidation of our Finland operations into our Largo, Florida and Utica, New York manufacturing facilities and consolidation of our Westborough, Massachusetts operations into our Largo, Florida and Chihuahua, Mexico manufacturing facilities. These costs were charged to cost of goods sold – see Note 15.
During the second quarter of 2013, we recorded a charge of $1.6 million to other expense related to consolidating certain administrative functions - see Note 11 and Note 15.
During the second quarter of 2013, we recorded a charge of $0.5 million to other expense related to legal costs associated with a patent infringement claim - see Note 10 and Note 11.
Third Quarter
During the third quarter of 2013, we incurred $1.1 million in costs associated with the moving of additional product lines to our manufacturing facility in Chihuahua, Mexico, consolidation of our Finland operations into our Largo, Florida and Utica, New York manufacturing facilities and consolidation of our Westborough, Massachusetts operations into our Largo, Florida and Chihuahua, Mexico manufacturing facilities. These costs were charged to cost of goods sold – see Note 15.

74
During the third quarter of 2013, the Company discontinued a patient monitoring product offering and incurred $2.1 million in costs which were charged to cost of goods sold - see Note 15.
During the third quarter of 2013, we recorded a charge of $3.1 million to other expense related to consolidating certain administrative functions - see Note 11 and Note 15.
During the third quarter of 2013, we recorded a charge of $1.5 million to other expense related to legal costs associated with a patent infringement claim - see Note 10 and Note 11.
Fourth Quarter
During the fourth quarter of 2013, we incurred $2.1 million in costs associated with the moving of additional product lines to our manufacturing facility in Chihuahua, Mexico, consolidation of our Finland operations into our Largo, Florida and Utica, New York manufacturing facilities and consolidation of our Westborough, Massachusetts operations into our Largo, Florida and Chihuahua, Mexico manufacturing facilities. These costs were charged to cost of goods sold – see Note 15.
During the fourth quarter of 2013, we recorded a charge of $2.4 million to other expense related to consolidating certain administrative functions - see Note 11 and Note 15.
During the fourth quarter of 2013, we recorded a charge of $1.0 million to other expense related to legal costs associated with a patent infringement claim - see Note 10 and Note 11.
During the fourth quarter of 2013, we recorded a $1.4 million pension settlement expense to other expense - see Note 9 and Note 11.

75
SCHEDULE II—Valuation and Qualifying Accounts(in thousands)
Column C Additions Column B
Balance atBeginning of
Period
Charged toCosts andExpenses
Charged toOther
Accounts
Column EColumn A Column D Balance at End
of PeriodDescription Deductions2013
Allowance for bad debts $ 1,203 $ 421 $ — $ (240) $ 1,384Sales returns and
allowance 3,609 398 — (909) 3,098Deferred tax asset
valuation allowance — — — — —
2012
Allowance for bad debts $ 1,183 $ 530 $ — $ (510) $ 1,203Sales returns and
allowance 4,097 317 — (805) 3,609Deferred tax asset
valuation allowance — — — — —
2011
Allowance for bad debts $ 1,066 $ 3,935 $ — $ (3,818) $ 1,183Sales returns and
allowance 3,980 291 — (174) 4,097Deferred tax asset
valuation allowance 226 — — (226) —

EXHIBIT 21
CONMED CorporationSubsidiaries of the Registrant
Name State or Country of Incorporation Aspen Laboratories, Inc. ColoradoCONMED Andover Medical, Inc. New YorkCONMED Deutschland GmbH GermanyCONMED Endoscopic Technologies, Inc. MassachusettsCONMED France SAS FranceCONMED Italia SrL ItalyCONMED Linvatec Australia PTY LTD AustraliaCONMED Linvatec (Beijing) Medical Appliances Co., Ltd ChinaCONMED Linvatec Biomaterials OY FinlandCONMED U.K. Ltd. United KingdomConsolidated Medical Equipment Company S. de R.L. de C.V. MexicoConsolidated Medical Equipment International, Inc. New YorkGWH Limited Partnership FloridaLargo Lakes I Limited Partnership DelawareLinvatec Corporation FloridaLinvatec Austria GmbH AustriaLinvatec Belgium NV BelgiumLinvatec Canada ULC CanadaLinvatec Denmark ApS DenmarkLinvatec Europe SPRL BelgiumLinvatec Finland OY FinlandLinvatec Korea Ltd. KoreaLinvatec Nederland B.V. NetherlandsLinvatec Polska Sp. z.o.o PolandLinvatec Spain S.L. SpainLinvatec Sweden AB SwedenViking Systems, Inc. Delaware

EXHIBIT 23
CONSENT OF INDEPENDENT REGISTERED PUBLIC ACCOUNTING FIRM
We hereby consent to the incorporation by reference in the Registration Statements on Form S-8 (Nos. 333-74497, 333-78987, 333-90444, 333-124202, 333-136453, 333-145150, 333-162834, 333-168493 and 333-182878) of CONMED Corporation of our report dated February 24, 2014 relating to the consolidated financial statements, financial statement schedule and the effectiveness of internal control over financial reporting, which appears in this Form 10-K.
/s/ PricewaterhouseCoopers LLPAlbany, New YorkFebruary 24, 2014

Exhibit 31.1CERTIFICATION PURSUANT TO
SECTION 302 OF THE SARBANES-OXLEY ACT OF 2002
I, Joseph J. Corasanti, certify that:
1. I have reviewed this annual report on Form 10-K of CONMED Corporation;
2. Based on my knowledge, this report does not contain any untrue statement of a material fact or omit to state a material fact necessary to make the statements made, in light of the circumstances under which such statements were made, not misleading with respect to the period covered by this report;
3. Based on my knowledge, the financial statements, and other financial information included in this report, fairly present in all material respects the financial condition, results of operations and cash flows of the registrant as of, and for, the periods presented in this report;
4. The registrant's other certifying officer and I are responsible for establishing and maintaining disclosure controls and procedures (as defined in Exchange Act Rules 13a-15(e) and 15d-15(e)) and internal control over financial reporting (as defined in Exchange Act Rules 13a-15(f) and 15d-15(f)) for the registrant and have:
a) designed such disclosure controls and procedures, or caused such disclosure controls and procedures to be designed under our supervision, to ensure that material information relating to the registrant, including its consolidated subsidiaries, is made known to us by others within those entities, particularly during the period in which this report is being prepared;
b) designed such internal control over financial reporting, or caused such internal control over financial reporting to be designed under our supervision, to provide reasonable assurance regarding the reliability of financial reporting and the preparation of financial statements for external purposes in accordance with generally accepted accounting principles;
c) evaluated the effectiveness of the registrant's disclosure controls and procedures and presented in this report our conclusions about the effectiveness of the disclosure controls and procedures, as of the end of the period covered by this report based on such evaluation; and
d) disclosed in this report any change in the registrant's internal control over financial reporting that occurred during the registrant's most recent fiscal quarter (the registrant's fourth fiscal quarter in the case of an annual report) that has materially affected, or is reasonably likely to materially affect, the registrant's internal control over financial reporting;
5. The registrant's other certifying officer and I have disclosed, based on our most recent evaluation of internal control over financial reporting, to the registrant's auditors and the audit committee of the registrant's board of directors (or persons performing the equivalent functions):
a) all significant deficiencies and material weaknesses in the design or operation of internal control over financial reporting which are reasonably likely to adversely affect the registrant's ability to record, process, summarize and report financial information; and
b) any fraud, whether or not material, that involves management or other employees who have a significant role in the registrant's internal control over financial reporting.
February 24, 2014
/s/ Joseph J. CorasantiJoseph J. CorasantiPresident andChief Executive Officer

Exhibit 31.2CERTIFICATION PURSUANT TO
SECTION 302 OF THE SARBANES-OXLEY ACT OF 2002
I, Robert D. Shallish, Jr. certify that:
1. I have reviewed this annual report on Form 10-K of CONMED Corporation;
2. Based on my knowledge, this report does not contain any untrue statement of a material fact or omit to state a material fact necessary to make the statements made, in light of the circumstances under which such statements were made, not misleading with respect to the period covered by this report;
3. Based on my knowledge, the financial statements, and other financial information included in this report, fairly present in all material respects the financial condition, results of operations and cash flows of the registrant as of, and for, the periods presented in this report;
4. The registrant's other certifying officer and I are responsible for establishing and maintaining disclosure controls and procedures (as defined in Exchange Act Rules 13a-15(e) and 15d-15(e)) and internal control over financial reporting (as defined in Exchange Act Rules 13a-15(f) and 15d-15(f)) for the registrant and have:
a) designed such disclosure controls and procedures, or caused such disclosure controls and procedures to be designed under our supervision, to ensure that material information relating to the registrant, including its consolidated subsidiaries, is made known to us by others within those entities, particularly during the period in which this report is being prepared;
b) designed such internal control over financial reporting, or caused such internal control over financial reporting to be designed under our supervision, to provide reasonable assurance regarding the reliability of financial reporting and the preparation of financial statements for external purposes in accordance with generally accepted accounting principles;
c) evaluated the effectiveness of the registrant's disclosure controls and procedures and presented in this report our conclusions about the effectiveness of the disclosure controls and procedures, as of the end of the period covered by this report based on such evaluation; and
d) disclosed in this report any change in the registrant's internal control over financial reporting that occurred during the registrant's most recent fiscal quarter (the registrant's fourth fiscal quarter in the case of an annual report) that has materially affected, or is reasonably likely to materially affect, the registrant's internal control over financial reporting;
5. The registrant's other certifying officer and I have disclosed, based on our most recent evaluation of internal control over financial reporting, to the registrant's auditors and the audit committee of the registrant's board of directors (or persons performing the equivalent functions):
a) all significant deficiencies and material weaknesses in the design or operation of internal control over financial reporting which are reasonably likely to adversely affect the registrant's ability to record, process, summarize and report financial information; and
b) any fraud, whether or not material, that involves management or other employees who have a significant role in the registrant's internal control over financial reporting.
February 24, 2014
/s/ Robert D. Shallish Jr.Robert D. Shallish, Jr.Executive Vice President - Finance andChief Financial Officer

Exhibit 32.1
CERTIFICATIONSPURSUANT TO SECTION 906 OF THE SARBANES-OXLEY ACT OF 2002
(SUBSECTIONS (a) AND (b) OF SECTION 1350, CHAPTER 63 OF TITLE 18, UNITED STATES CODE)
Pursuant to section 906 of the Sarbanes-Oxley Act of 2002 (subsections (a) and (b) of section 1350, chapter 63 of title 18, United States Code), each of the undersigned officers of CONMED Corporation, a New York corporation (the “Corporation”), does hereby certify that:
The Annual Report on Form 10-K for the year ended December 31, 2013 (the “Form 10-K”) of the Corporation fully complies with the requirements of section 13(a) or 15(d) of the Securities Exchange Act of 1934 and information contained in the Form 10-K fairly presents, in all material respects, the financial condition and results of operations of the Corporation.
Date: February 24, 2014 /s/Joseph J. Corasanti Joseph J. Corasanti President and Chief Executive Officer
Date: February 24, 2014 /s/Robert D. Shallish, Jr. Robert D. Shallish, Jr. Executive Vice President-Finance and Chief Financial Officer