Advancing the Quality of Cost-Benefit Analysis for …...aspects of applying CBA to policymaking,...
52
Advancing the Quality of Cost-Benefit Analysis for Justice Programs Carl Matthies Vera Institute of Justice March 2014 Cost-Benefit Analysis Unit
Transcript of Advancing the Quality of Cost-Benefit Analysis for …...aspects of applying CBA to policymaking,...

Advancing the Quality of Cost-Benefit Analysis for Justice Programs
Carl Matthies
Vera Institute of Justice
March 2014
Cost
-Benefit
Analy
sis
Unit
Cost
-Benefit
Analy
sis
Unit

© 2014 Vera Institute of Justice. All rights reserved.
Additional copies can be obtained from the communications department of the Vera Institute of Justice,
233 Broadway, 12th floor, New York, NY 10279, (212) 334-1300. This report is available online at
www.vera.org/cbamethods.
Please direct requests for additional information about this paper to Carl Matthies at

About This Paper
This white paper describes and discusses the main methodological challenges to performing cost-
benefit analyses (CBAs) of justice-system investments. It is a product of the Vera Institute of
Justice’s national Cost-Benefit Knowledge Bank for Criminal Justice project. The paper was shaped
with input from the Cost-Benefit Methods Working Group, which Vera convened in 2012 to help
advance the use of rigorous CBAs to inform criminal-justice policy decisions. The goals of the
working group were to:
Foster the use of CBA in justice policy by providing information on cost-benefit methods to
criminal justice researchers and practitioners;
Provide guidance on some of the complicated areas of justice-related CBAs, such as
measuring social benefits and addressing data limitations;
Provide advice on increasing the policy relevance of CBA; and
Investigate areas for further research.
The working group consisted of researchers and policymakers with diverse backgrounds. Some
members were drawn from the ranks of academia and possess a deep understanding of CBA methods
and concepts, while others have prominent roles in justice planning and administration in state and
local government, with firsthand knowledge of the questions policymakers need answered, the
available data, and the political and practical dimensions of policy decisions. The working-group
members were:
Mike Clark, chief economist, Kentucky Legislative Research Commission
Meredith Farrar-Owens, director, Virginia Criminal Sentencing Commission
Lynn A. Karoly, senior economist, RAND Corporation
Mike Lawlor, under secretary, Criminal Justice Policy and Planning Division, Office of
Policy and Management, State of Connecticut
Lee Ann Labecki, former director, Office of Research, Evaluation, and Strategic Policy
Development, Pennsylvania Commission on Crime and Delinquency
Kristin Misner, chief of staff, Office of the Deputy Mayor for Health and Human Services,
City of New York
John Roman, senior fellow, Urban Institute
Diane E. Shoop, manager, Outreach and Policy Support, Pennsylvania Commission
on Sentencing
Ronald Villa, deputy chief operating officer, City of San Diego
David L. Weimer, Edwin E. Witte Professor of Political Economy, University of
Wisconsin–Madison

Table of Contents
Introduction...................................................................................................................... 1
Section I: Perspectives ...................................................................................................... 4
Taxpayers ..................................................................................................................... 4
Crime Victims ................................................................................................................ 5
Offenders ...................................................................................................................... 5
The Rest of Society ........................................................................................................ 6
Selecting Perspectives to Include in a CBA ...................................................................... 7
Section II: The Evaluation Component of CBA: Predicting or Measuring Program Impacts ..... 8
Barriers to Evaluation ..................................................................................................... 9
How Impacts Are Estimated ........................................................................................... 9
Non-Experimental Design ............................................................................................ 9
Experimental Design ................................................................................................. 10
Quasi-Experimental Design ....................................................................................... 14
Meta-Analysis ........................................................................................................... 16
Section III: Valuing the Costs and Impacts of Justice Policies and Programs ....................... 18
Program Costs ............................................................................................................. 18
Taxpayer Costs ............................................................................................................ 19
Costs of Crime ............................................................................................................. 21
Victim Costs ................................................................................................................ 21
Using Victim and Societal Cost-of-Crime Estimates in a CBA ........................................... 25
Offender Costs ............................................................................................................ 26
Time Horizons and Discounting ..................................................................................... 28
Section IV: Dealing with Uncertainty in Impacts ................................................................ 30
Sensitivity Analysis ....................................................................................................... 30
Partial Sensitivity Analysis ......................................................................................... 31
Best-Case and Worst-Case Scenarios ......................................................................... 34
Break-Even Analysis ................................................................................................. 34
Monte Carlo Analysis ................................................................................................ 35
Section V: Making CBAs Clearer and More Accessible ........................................................ 36
General Recommendations ........................................................................................... 37
Documentation ............................................................................................................ 38
Reporting Results ........................................................................................................ 38
Conclusion ...................................................................................................................... 40
Appendix: Regression Analysis ......................................................................................... 42
Glossary ......................................................................................................................... 43

Vera Institute of Justice 1
Introduction
Cost-benefit analysis is an economic assessment tool that compares the costs and benefits of policies
and programs for the time they produce their impacts. The hallmark of CBA is that costs and benefits
are both expressed in monetary terms so that they can be directly compared. CBA supplies
policymakers with information to weigh the pros and cons of alternative investments and enables them
to identify options that are cost-effective and will have the greatest net social benefit. Because benefits
are always expressed in dollar terms, CBA also enables decision makers to compare policies and
programs that have different purposes and outcomes.
Although CBA is a well-established economic method, it has not been widely used in criminal
justice. Promoting knowledge about CBA and addressing methodological issues specific to criminal
justice can help increase the quantity and the quality of cost-benefit studies in the field. This report
offers guidance on important conceptual and practical issues surrounding the use of CBA to inform
justice policymaking.
How This Paper Is Organized
This white paper covers five topics: selecting perspectives to include in justice-related CBAs;
predicting and measuring the impacts of justice initiatives; monetizing (that is, placing dollar values
on) justice initiatives; dealing with uncertainty; and making cost-benefit studies clearer and more
accessible. These are key elements of cost-benefit analysis and can be challenging in the criminal
justice context.
Who Should Read This Paper
This paper is intended for anyone who conducts, plans to conduct, or wants to learn how to conduct a
cost-benefit study of a justice-related policy or program. Researchers, evaluators, analysts (including
legislative, policy, budget, and fiscal analysts), criminologists, and those in similar or related
professions may find the paper useful.
Readers who do not intend to get “into the weeds” of doing a CBA but are curious about its
methods may find some passages rather technical. For a discussion focused more on the pragmatic
aspects of applying CBA to policymaking, please see the 2014 companion paper, Using Cost-Benefit
Analysis for Justice Policymaking.
This white paper is not intended to be a comprehensive primer on cost-benefit analysis. Much more
thorough treatments of the subject are available, covering a broader range of topics in greater depth and
exploring the use of CBA in a wide variety of policy arenas. Readers are encouraged to avail
themselves of these resources, some of which are listed in the References section. Readers will note
that in some instances the paper gives advice or recommendations, while elsewhere it provides
information readers may use to weigh decisions and communicate when explaining their work. This is
primarily because, as stated earlier, not all issues pertaining to cost-benefit analysis in criminal justice
have clear right or wrong answers.

Vera Institute of Justice 2
Guiding Principles
This paper is guided by six key principles adapted from the Society for Benefit Cost Analysis and
endorsed by the Cost-Benefit Methods Working Group.1 These principles are enumerated in Figure 1
and discussed below.
Figure 1. Principles for cost-benefit analysis (CBA) and justice policymaking
1. Cost-benefit analysis is a decision tool, not a decision rule.
CBA can improve the decision-making process by providing a clear, systematic assessment of the
decision’s effects. CBA is not intended to replace the role of the decision maker or be used in lieu of
existing decision-making processes. Rather, consider CBA a tool that adds information about the
efficient use of resources to the other sources of information that decision makers rely on.2
2. Analysts should strive to quantify all impacts of a policy alternative relative to current policy, and to
monetize costs and benefits for all members of society.
All policies generate costs and benefits. To accurately depict future conditions, cost-benefit analysts
should attempt to quantify all impacts and monetize the costs and benefits of a proposed policy change
relative to the status quo. But not all outcomes can be quantified or monetized. In such cases, analysts
should document the qualitative outcomes along with the quantitative results. The analysis should also
discuss who is affected by the current policy and who would be affected by the policy alternative.
3. Transparency in a CBA enhances its value.
1 Richard O. Zerbe, Tyler Blake Davis, Nancy Garland, and Tyler Scott, Toward Principles and Standards in the Use of
2 Matthew J. Kotchen, “Cost-benefit analysis,” in Encyclopedia of Climate and Weather, second edition, edited by Stephen
H. Schneider, Michael Mastrandrea, and Terry L. Root (Oxford, UK: Oxford University Press, 2011).
1. CBA is a decision tool, not a decision rule.
2. Analysts should strive to quantify all impacts of a policy alternative relative to
current policy, and to monetize costs and benefits for all members of society.
3. Transparency in a CBA enhances its value.
4. A CBA should disclose areas of uncertainty and clearly describe how uncertainty
has been addressed.
5. The effort required for a CBA should not outweigh the expected value of the
resulting information.
6. The pursuit of a perfect analysis should not prevent the completion of a useful one.

Vera Institute of Justice 3
Transparency makes a CBA replicable and helps foster the reader’s trust. Assumptions and
calculations should be sufficiently clear and detailed in the analysis to allow technical audiences to
replicate it or, at a minimum, understand the steps taken in the analysis. When readers trust a CBA,
their focus can shift from the technical details to the decision-making process.3 Transparency also
relates to clarity, that is, presenting the analysis in a way that is understandable and meaningful to
policy audiences.
4. A CBA should disclose areas of uncertainty and clearly describe how uncertainty has been addressed.
A cost-benefit study is stronger when its authors address uncertainty. Some uncertainty is inevitable
when forecasting policy effects and monetizing costs and benefits. Uncertainty should not paralyze the
analysis; rather, analysts should explicitly acknowledge and address it by exploring the sensitivity of
net benefits to the assumptions and estimates that they employed. They should document any
uncertainty about predictions and valuations, as well as other assumptions that might affect the policy
recommendation. They should also discuss the sensitivity techniques they used to address uncertainty.
5. The effort required for a CBA should not outweigh the expected value of the resulting information.
Some key issues can be addressed by using another less time-consuming form of economic analysis,
such as cost-effectiveness analysis or fiscal-impact analysis. Before conducting a CBA, decision
makers and analysts should consider whether the answer to the question being asked is worth the effort
that will be expended to conduct the analysis. Moreover, when conducting a CBA, the analytic effort
should focus on the factors most likely to affect the results.
6. The pursuit of a perfect analysis should not prevent the completion of a useful one.
Perfection is an unattainable and therefore unreasonable standard in economic analysis. A CBA that
meets basic requirements regarding objectivity and methodology can provide valuable information and
contribute to the decision-making process, so long as the study’s limitations are explicit.4
3 Richard O. Zerbe et al., 2010, p. 35.
4 Ibid., p. 36.

Vera Institute of Justice 4
Section I: Perspectives
A distinguishing feature of cost-benefit analysis is its comprehensiveness. Whereas other forms of
economic analysis, such as fiscal-impact studies, typically adopt the narrow perspective of a single
government agency, CBA aims to capture the costs and benefits to all parties affected by the policy
under examination. This means including not only the perspectives of organized stakeholders, but of
all relevant members of society, to provide a complete view of the policy’s impact. Parties whose
perspectives are included in a CBA are said to have standing in the analysis.
In practice, studies may not account for all perspectives, given the many challenges of conducting
rigorous CBAs, as well as diverse opinions about which perspectives matter in an analysis. We
recommend that:
Justice CBAs should include at least the taxpayer and crime-victim perspectives.
CBAs should be explicit about any relevant perspectives that are excluded and the reasons for
the exclusion.
When reporting the results of a CBA, analysts should disaggregate and display the costs,
benefits, and net benefits (or other metrics) for each perspective included in the study.
This section of the white paper provides some background on perspectives—including the perspectives
typically included in justice-related CBAs—and explains how to select the perspectives to include in a
study.
Taxpayers
Whether they introduce new programs, change sentencing laws, or attempt to make the justice system
more efficient, justice-related policies affect taxpayers, who fund government operations. Cost-benefit
studies therefore routinely include the taxpayer perspective in their calculations.
The taxpayer perspective is synonymous with the government perspective, although these parties
don’t always agree about how public funds should be spent. Still, it is appropriate to treat the
government and taxpayer perspectives as equivalent in CBA. Bear in mind that the taxpayer
perspective includes all agencies affected by a program or policy, not just those that directly involve
A few notes about terminology
Throughout this paper, important terms are italicized in the text and defined in the glossary. The
authors assumed a basic understanding of budgeting vocabulary and its usage among readers.
(For example, this paper doesn’t spell out what it means to use cost as a verb, but does explain
micro-costing.)
A note about the word program and similar terms: Although program, policy, project, intervention,
and initiative aren’t by definition interchangeable, this paper often uses one of those words when
another could apply. Justice-related programs, policies, projects, interventions, and initiatives can
all be subject to CBA, and all five terms are used in this paper.

Vera Institute of Justice 5
criminal justice. (See “Taxpayer Costs” on page 19 for more information on how to estimate costs and
benefits for this perspective.)
Crime Victims
Because public safety is often the central goal of justice policies, the perspective of crime victims is a
critical part of justice-related CBAs. Crime victims may experience financial, psychological, and
physical harms. These harms can be expressed in dollars as tangible costs, such as medical expenses
and lost property, and as intangible costs, such as fear of crime or pain and suffering. When
victimization is prevented or reduced, the avoided harms are counted as benefits. (See “Victim Costs”
on page 21 for information about how to estimate the values of tangible and intangible costs and
benefits to victims.)
Offenders
An ongoing debate among analysts is about when to include the perspective of offenders in justice-
related CBAs. Although there is no hard-and-fast rule, most in the field agree that offenders should not
have standing with respect to their illegal activities, precisely because the activities are prohibited.
Otherwise, the CBA would be at odds with the rule of law, a scenario that could lead to the absurd
interpretation of stolen property as merely a transfer of goods from the victim to the offender, with no
net change in social welfare.5 Thus, the benefits criminals derive from engaging in illegal activity
should not typically be deducted from the total benefits of a crime-reduction program. Studies that
analyze the decriminalization of victimless offenses are a different story: when evaluating proposals to
legalize, tax, and regulate prostitution or marijuana, for example, the anticipated benefits to producers
and consumers in these black markets should be taken into account, because under the new law these
parties would no longer be engaging in illegitimate activities.
The offender perspective is multifaceted, and just as most economists argue that offenders lack
standing with respect to criminal activities and costs incurred from legitimate punishment for those
crimes, there is widespread agreement that offenders do have standing as participants in the criminal
justice system. The rationale for including the offender perspective is that if CBA is used to decide
between two programs with the same impact and benefits to the rest of society, the program that leads
to better outcomes for offenders is preferable. Thus, CBAs of justice-related programs—such as
reentry services for formerly incarcerated persons or a prison education program—should capture the
costs and benefits to program participants.
Consider a program that teaches job skills to people in the last months of their prison sentence.
The program may confer future benefits to participants in the form of better job prospects and higher
earnings. But the program may impose costs such as fees, transportation expenses, or even lost wages,
if participants could have been earning income instead.
5 Andrew S. Rajkumar and Michael T. French, “Drug Use, Crime Costs, and the Economic Benefits of Treatment.” Journal
of Quantitative Criminology 13, no. 3 (1997), 291-323.

Vera Institute of Justice 6
The Rest of Society
Taxpayers, crime victims, and offenders are not the only groups affected by criminal justice policies.
For instance, reduced crime might benefit communities and businesses through increased property
values and commercial activity. Defendants released to pretrial supervision might be able to keep their
jobs. Children whose parents complete a drug treatment program might perform better in school. CBAs
sometimes refer to parties affected indirectly as “society” or “the societal perspective,” even though
society includes everyone.
In some cases, societal costs and benefits may be hard to quantify because of insufficient
information to isolate the impacts of a policy on all members of society. At other times the impacts
may be difficult to convert into dollar values. (See Section III on page 18 for a description of methods
used to measure the value of an outcome or impact in dollars.) Figure 2 illustrates the trade-off
between comprehensiveness and analytical effort.
Figure 2. The trade-off between comprehensiveness and analytical effort in cost-benefit analysis
The societal perspective also comes into play when justice policies or programs have broad economic
repercussions, known as general equilibrium effects. For instance, draconian drug laws could spur
enough growth in incarceration to trigger new prison construction and affect the price of concrete and
other building materials. Another example would be a highly successful large-scale reentry program
Source: Adapted from Alex Cowell, Approach for Conducting Cost, Cost-Effectiveness, and Benefit-Cost Analyses
of SVORI programs. Research Triangle Park, NC: RTI International, 2006.
http://www.rti.org/pubs/rria_economic_analysis.pdf (accessed January 16, 2014).

Vera Institute of Justice 7
that provides vocational training. The program’s graduates could displace members of the existing
workforce; with fewer graduates committing new crimes, declining inmate populations could result in
prison closures and job loss in the corrections sector. It is uncommon, however, for justice policies and
programs to have an impact large enough to cause general equilibrium effects.
Naturally, there is overlap among people’s roles and their perspectives. For example, a person who
commits an offense may be a taxpayer as well as a victim of crime. In reality these roles can and do
coexist, however, those nuances aren’t typically captured in the context of CBA.
Selecting Perspectives to Include in a CBA
The perspectives that analysts include or exclude in a study can affect its results—such as whether the
CBA has a net benefit—and if so, the size of the net benefit. That is why analyses should be as
comprehensive as possible and include all relevant perspectives. Figure 3 illustrates how net benefits
can change depending on the perspectives included. For example, the net benefit of adult drug courts
per participant in the state of Washington is $4,767 if taxpayer and victim perspectives are included,
but drops dramatically to $372 when only the taxpayer perspective is included.
Figure 3. Options to reduce crime in Washington State:
Benefits and costs by perspective, per participant (2006 dollars)
TAXPAYER
COSTS
BENEFITS NET BENEFITS (BENEFITS
MINUS COSTS)
For taxpayers For victims For taxpayers
Total
Adult drug courts $4,333 $4,705 $4,395 $372 $4,767
Intensive supervision: treatment-oriented programs $7,124 $9,369 $9,318 $2,245 $11,563
Vocational education in prison $1,182 $6,806 $8,114 $5,624 $13,738
Source: Steve Aos, Marna Miller, and Elizabeth Drake, Evidence-Based Public Policy Options to Reduce Future Prison
Construction, Criminal Justice Costs, and Crime Rate (Olympia: Washington State Institute for Public Policy, 2006), No.
06-10-1201, http://www.wsipp.wa.gov/rptfiles/06-10-1201.pdf (accessed February 3, 2014).
But practical or methodological limitations may make a comprehensive approach impossible. When
the benefits and costs associated with a perspective can be credibly measured, the perspective should
be included in the CBA’s calculations. When there isn’t a reliable way to estimate quantitatively how a
perspective is affected by a policy—or to place a monetary value on that effect—the study should
describe the costs and benefits from that perspective qualitatively. Most justice-related CBAs report
results from the perspectives of taxpayers, victims, and, when applicable, offenders (for example, when
they are program participants), while excluding or simply alluding to other costs and benefits.

Vera Institute of Justice 8
Apart from the practical challenges of conducting a thorough study, the question of who has
standing in a CBA is potentially contentious. Some policymakers may be interested in only the
taxpayer perspective, viewing these costs and benefits as the most salient because they have the most
clear-cut fiscal or budgetary impacts. But analysts should strive to present all relevant perspectives
and disaggregate costs and benefits by perspective to give decision makers the ability to weigh them
as they see fit. At a minimum, analysts should document the perspectives they included in a study
and explain which ones they excluded or discussed only qualitatively, as well as how they made
those choices.
Keep in Mind
When reporting the results of a cost-benefit analysis, consider displaying the costs, benefits, and net
benefits (or other metrics) for each perspective, as in Figure 3 above. Disaggregating the information
this way improves transparency by allowing readers to see each party’s costs and benefits, and the
contribution of each perspective to the CBA’s bottom line.
Section II: The Evaluation Component of CBA: Predicting or Measuring Program Impacts
Cost-benefit analysis requires predicting or measuring the effects of policy alternatives. Many sources
of information can help to make these predictions or measurements, including evaluations of similar
policies in the decision maker’s jurisdiction or elsewhere.6 CBA uses evaluation as an empirical basis
for assessing the impacts, both beneficial and detrimental, of a program. These effects are then
translated into dollar amounts to determine the program’s net present value. CBA has thus been
characterized as “the merger of evaluation and valuation” and also described, in the crime-prevention
context, as a “second-generation evaluation tool,” with a prerequisite of rigorous evaluation to
determine whether programs had any detectable impact on crime.7, 8
Not every person conducting a cost-benefit study of a justice program will be in the position to
evaluate the program. But any person conducting or planning a CBA will need to understand some
basics about evaluation to perform a high-quality economic study. A quality CBA based on poorly
done evaluations could yield spurious results and undermine the study’s credibility.
This section describes barriers to evaluation, three basic ways to estimate program impacts, the
fundamental elements of a good evaluation design, meta-analysis, and some of the common pitfalls in
evaluating justice programs.
6 Anthony E. Boardman, David H. Greenberg, Aidan R. Vining, and David L. Weimer, Cost-Benefit Analysis: Concepts
and Practice, third edition. (Upper Saddle River, NJ: Prentice Hall, 2011), 279-313. 7 Edwin W. Zedlewski, “Conducting Cost Benefit Analyses in Criminal Justice Evaluations: Do We Dare?” European
Journal on Criminal Policy and Research, Special Issue: The Costs of Crime 15, no. 4 (2009), 355-364. 8 John Roman and Graham Farrell, “Cost-Benefit Analysis for Crime Prevention: Opportunity Costs, Routine Savings and
Crime Externalities,” Crime Prevention Studies 14 (2002), 53-92.

Vera Institute of Justice 9
Barriers to Evaluation
Not every program is amenable to evaluation. For example, some justice-involved populations are
exposed to a suite of programs. With an eye on the budget, policymakers may want to know the effect
of each program. Yet in such cases the effects of individual programs cannot be disentangled. This is
what is known as an identification problem. It is frustrating for researchers and practitioners to accept
that a program or policy’s effects are in a sense unknowable. Thus it is critical to guard against the
temptation to amass more yet uninformative data or to make unfounded assumptions or leaps of logic
in a vain attempt to overcome an identification problem. The existence of an entire sub-discipline of
program “evaluability assessments” testifies to the importance of recognizing this type of barrier.9
For programs that do not have an inherent identification problem, a second challenge remains:
access to data of adequate quantity and quality. Sometimes this is merely a matter of patience. It would
be inappropriate to evaluate a probation program aimed at reducing recidivism two weeks after it
commences, unless by then it is already an obvious failure; more time is needed for results to be
meaningful. At other times, if not enough people are exposed to a program to make valid inferences
about its impacts, as with highly specialized programs, the problem is referred to as insufficient
statistical power.10
Getting the right data can also present a barrier to program evaluation. Important outcomes are
often difficult to measure reliably and may not be captured in existing data. How much crime is
prevented by notification systems that alert victims to the imminent release of the offenders who
victimized them? This is not an easy outcome to measure. It can therefore be tempting to build an
evaluation using data that can be readily captured, even though that data is an ambiguous measure of
effectiveness. For example, changes in the number of calls for service and the number of arrests are not
per se evidence that a crime-control program is or is not working. Similarly, conviction rate is not an
especially useful outcome for gauging a jurisdiction’s adherence to due process.
How Impacts Are Estimated
Another major area of confusion over program evaluation is about which methods produce reliable
estimates of effect size. Program evaluations can have a non-experimental (that is, observational),
experimental, or quasi-experimental design. Each design has advantages and disadvantages. Figure 4
summarizes the three evaluation methods and provides a justice-related example from the research
literature for each method.
Non-Experimental Design
Justice programs are often evaluated by comparing specific outcomes before and after implementation.
This approach is relatively easy and intuitively appealing. For example, a police department might
measure the impact of a gang task force by comparing the number of gang-related crimes in its
9 For more information on identification problems in social science, see Charles Manski’s books Identification Problems in
the Social Sciences (Cambridge, MA: Harvard University Press, 1995) and Identification for Prediction and Decision
(Cambridge, MA: Harvard University Press, 2007). 10
For more information on statistical power, see Paul Ellis’s book The Essential Guide to Effect Sizes: Statistical Power,
Meta-Analysis, and the Interpretation of Research Results (Cambridge, UK: Cambridge University Press, 2010), 45-82.

Vera Institute of Justice 10
jurisdiction before the task force was created to the number of gang-related crimes committed after its
formation. The program’s effectiveness would be equated with the percentage change in the number or
rate of gang-related crimes. Although it is reasonable to suppose that the task force would have a
significant impact on gang crime, there is nothing in the pre-test and post-test comparisons that
eliminates or reduces the possibility of alternative explanations. The decline in gang crime could be the
result of collective efficacy in gang-afflicted communities, a voluntary cease-fire negotiated by warring
gangs, a delayed impact of routine policing, or some other coincident factor. Attributing the entire
impact to the task force would require a strong assumption that no other factor played a role in the
observed change. Because these confounding factors cannot be ruled out, the basic pre-test and post-
test comparison is considered a non-experimental method.
As a second example of a non-experimental evaluation design, consider a scenario in which agency
leaders want to know how a community policing program has shaped constituents’ views about law
enforcement. This is a hard construct to quantify. Suppose the department mailed a survey on attitudes
about local police to residents who had called them for assistance. The results of such a survey should
not be interpreted as a reliable measure of constituent attitudes overall, because people who call the
police for assistance may be predisposed to hold a favorable view of law enforcement. By limiting the
evaluation to this population, the agency would have introduced a selection bias. This bias would not
necessarily be eliminated by mailing the survey to everyone, as attitudes toward police may differ
between those who submit responses and those who do not.
To meet the scientific standard for demonstrating causality, program evaluations must provide a
credible counterfactual, that is, a sense of what would have occurred without the program. In the first
example, the counterfactual is, “What would have happened to gang crime numbers in the absence of
the task force?”—a different question from “What were gang crime numbers before the task force?”
The counterfactual in an impact evaluation is represented by a control group or comparison group,
which should resemble the individuals, neighborhood, or jurisdiction that is exposed to the program as
closely as possible.
Experimental Design
The experimental design method for identifying program impacts is to conduct a randomized
controlled trial (RCT). RCTs are the gold-standard method for estimating program effect sizes because
they approximate laboratory conditions. The act of randomizing program exposure creates a near-
perfect counterfactual or control group. If participant and non-participant individuals, neighborhoods,
or jurisdictions (as the case may be) are selected at random, in a large enough sample, the two groups
should be essentially equivalent. As a result, any difference in outcome between the groups is for the
most part attributable to the program’s effects. However, attrition from one or both groups may not be
random, in which case the groups are no longer equivalent. For instance, if the program is demanding,
some participants may drop out before reaping all of its ostensible benefits. Under such circumstances,
the outcomes for those who fail to complete the program should still be tracked; this estimated impact
becomes the intent-to-treat effect. Also bear in mind that although RCT is the most rigorous standard
for estimating an effect size within a sample population, this does not necessarily mean that the result
can be generalized to other populations or settings. For example, the estimated impact of a program

Vera Institute of Justice 11
Figure 4. Overview of evaluation methods
Description Advantages Disadvantages Example
Experimental Design
Randomized Controlled
Trial
Individuals are randomly
assigned to a treatment group
and a control group.
Highest internal validity because it
guards against systematic differences
between groups. With sufficient
sample size, true random assignment
negates confounding factors, observed
or unobserved.
May be impractical or infeasible. May
raise ethical concerns of denying
services to control group.
In Philadelphia, legal representation for indigent
defendants accused of murder is essentially
assigned at random: one in every five is
represented by a public defender, while the
remainder have court-appointed private attorneys.
Anderson and Heaton (2012) were able to exploit
this system to compare the efficacy of two
sources of criminal-defense counsel in terms of
verdicts and sentencing.11
Quasi-Experimental Design
Instrumental Variables
This method is usually a two-
stage regression in which the
first regression involves using
one or more variables to
predict a treatment variable
and the second regression
uses first-stage predicted
values of the treatment to
predict the outcome of
interest.
Enables causal inference when a
RCT is infeasible. Can correct issues
with omitted variables, selection bias,
and reverse causality to give an
unbiased, consistent effect-size
estimate by removing the variation in
the treatment variable that is
correlated with the regression error
term. An instrumental variable
should affect only the outcome of
interest through its correlation with
the treatment.
In practice it can be difficult to find
valid instrumental variables and to
prove their validity.
Cook and Ludwig (2004) estimated the social
cost of gun ownership by examining the
relationship between household gun-ownership
prevalence and homicide rates for the 200 largest
U.S. counties.12
To adjust for the reverse
causation of crime and gun prevalence (i.e.,
crime can affect gun prevalence and vice versa),
the authors used the counties’ rural population in
1950, a number correlated with current homicide
rates solely through its correlation with current
household gun prevalence.
11
James A. Anderson and Paul Heaton, How Much Difference Does the Lawyer Make? The Effect of Defense Counsel on Murder Case Outcomes, RAND Working
Paper (Santa Monica, CA: RAND Corporation, 2012), WR-870. 12
Philip J. Cook and Jens Ludwig, The Social Costs of Gun Ownership, The Sanford School Working Paper Series SAN04-07; National Bureau of Economic Research
Working Paper No. 10736 (Durham, NC: Duke University, 2004), http://www.nber.org/papers/w10736 (accessed January 16, 2014).

Vera Institute of Justice 12
Description Advantages Disadvantages Example
Quasi-Experimental Design (continued)
Propensity Score Matching
This method creates a
comparison group based on
observable characteristics that
are predictive of assignment
to the treatment group.
Program effects are estimated
by comparing outcomes for
treatment-group members
relative to comparison-group
members with the same or
nearly the same score.
Reduces bias arising from differences
of observable characteristics between
the program and comparison groups.
Enables creation of a comparison
group even without complete overlap
in the observed traits of treated and
untreated groups. Often the most
feasible method for programs that
were not implemented with
evaluation in mind.
Difficult trade-off between matching on
enough variables and what’s known as
the curse of dimensionality (too many
traits to find good matches for all
treated individuals). By definition the
method controls only for observed
factors that may affect assignment to
treatment and outcome. Any
unobserved factors that affect
assignment to treatment—and possibly
outcome—cannot be accounted for in
the matching procedure.
Sampson et al. (2006) attempted to disentangle
the effect of marriage on criminal activity by
matching individuals within a cohort of males
born in Boston between 1924 and 1932 who had
been adjudicated as juvenile delinquents.13
Propensity scores were based on 20 traits,
including IQ score, extroversion, age at first
arrest, and parents’ criminality. The authors
found that married men were, on average, 35
percent less likely to engage in criminal activity
than their matched unmarried counterparts.
Regression Discontinuity
This method compares subjects
who fall immediately above
and below some threshold—
such as age, test score, or
income—used as the sole
criterion for assignment into
treatment and control groups.
Can yield an unbiased estimate of the
treatment effect without
randomization. Well suited to realities
of program implementation, in which
treatment assignment is seldom
random and is often based on a
threshold value.
Can be difficult to attain adequate
statistical power; assumes a linear and
parallel relationship between
assignment variable (e.g., test score)
and the outcome variable for treated and
untreated groups.
Berk and Rauma (1983) studied the impact of
transitional aid on parolee outcomes. Parolees
must have worked 652 hours over a 12-month
period of incarceration to be eligible for aid.14
The recidivism rate was approximately 13
percent lower among people who received
transitional aid.
13
Robert J. Sampson, John H. Laub, and Christopher Wimer, “Does Marriage Reduce Crime? A Counterfactual Approach to Within-Individual Causal Effects,”
Criminology 44, no. 3 (2006), 465-508. 14
Richard A. Berk and David Rauma, “Capitalizing on Nonrandom Assignment to Treatments: A Regression-Discontinuity Evaluation of a Crime-Control Program,”
Journal of the American Statistical Association 78, no. 381 (1983), 21-27.

Vera Institute of Justice 13
Description Advantages Disadvantages Example
Quasi-Experimental Design (continued)
Difference-in-Differences
This method entails a pre-test
and post-test comparison of
matched treatment and control
groups to account for other
factors that affect both groups
and could influence outcomes.
Provides a more rigorous test of
treatment effect than simple before-
and-after comparisons; can be
designed to account for confounding
factors that might explain the
differences in outcomes between
groups.
Assumes that the treatment and control
groups would have followed the same
trajectory but for the treatment. In other
words, this method usually does not
control for unobserved time-variant
differences in the groups, a factor that
also may have influenced treatment
decision.
La Vigne et al. (2011) measured the impact of
public surveillance cameras in Chicago and
Washington, DC, by comparing the net change in
crime for areas with cameras after accounting for,
or “differencing out” changes in comparable
control areas.15
The researchers also measured
crime changes in areas adjacent to the cameras, to
test for displacement of crime or diffusion of
benefits.
Pre-Test and Post-Test
Comparison
This is a comparison of the
same group or unit of analysis
before and after a given
treatment or intervention.
Straightforward and relatively
inexpensive. Reasonable when other
factors are unlikely to affect the
outcome, when the same trend in
outcome is seen repeatedly, and when
experimental or other quasi-
experimental designs are infeasible.
Does not control for unobserved factors
that may affect both the receipt of
treatment and the outcome(s). Some pre-
test and post-test designs may
approximate quasi-experiments by
taking into account seasonal and other
time-related trends.
Cochran et al. (1994) compared homicide counts
in Oklahoma before and after the death penalty
was reinstituted and a high-profile execution was
carried out. 16
Stolzenberg and D’Alesso (1994)
examined the long-term effect of Minnesota’s
sentencing reform on reducing unwarranted
(i.e., not legally mandated) sentencing disparities
using an interrupted time series.17
15
Nancy La Vigne et al., 2011, ix-xii. 16
John K. Cochran, Mitchell B. Chamlin, and Mark Seth, “Deterrence or Brutalization? An Impact Assessment of Oklahoma’s Return to Capital Punishment,”
Criminology 32, no. 1 (1994), 107-134. 17
Lisa Stolzenberg and Stewart J. D’Alessio, “Sentencing and Unwarranted Disparity: An Empirical Assessment of the Long-Term Impact of Sentencing Guidelines in
Minnesota,” Criminology 32, no. 2 (1994), 301-310.

Vera Institute of Justice 14
designed to teach business skills to a random sample of inmates with demonstrated intellectual ability
and pro-social behavior should not be generalized to the entire inmate population, which may not share
those traits.
Setting up an RCT for program evaluation purposes can be costly and time-consuming, although
opportunities for low-cost experiments occasionally arise. Programmatic treatments are randomly
assigned for reasons other than an evaluation, such as when capacity is limited. Researchers can take
advantage of the randomization and make use of routinely collected administrative data to conduct a
low-cost rigorous evaluation.18
Nevertheless, ethical issues and operational realities often make an
RCT impossible or highly impractical. Fortunately, there are quasi-experimental methods that can
provide credible estimates of program effects. These research designs rely on the existence of a
credible counterfactual—created by researchers or by chance—that mimics experimental conditions.
Quasi-Experimental Design
Quasi-experimental evaluations frequently rely on some form of regression analysis to estimate effect
sizes. Regression is a statistical modeling technique used to calculate how changes in one or more
factors, called independent variables, correlate with changes in an outcome of interest, called the
dependent variable. In the context of program evaluation, the independent variable of greatest interest
is a treatment variable indicating whether the unit of analysis was part of the treatment group or part of
the control group. The estimated amount by which the treatment variable changes the outcome is the
effect-size estimate.
Regression analysis is a highly versatile method. The outcome modeled can be discrete counts
(e.g., monthly burglary reports for a law enforcement agency), continuous (e.g., court processing time
from arraignment to sentencing), ordinal (e.g., a “fear of crime” scale ranging from 1 to 5), or
probabilistic (e.g., likelihood of recidivism within three years post-release). Similarly, depending on
the circumstances, the treatment can be a yes-or-no (binary) variable, or a categorical or continuous
variable that reflects the treatment dosage.
An all too common bias called simultaneity arises when an explanatory variable is determined
jointly with the dependent variable. As an illustration, Figure 5 is a scatter plot of index crime rates on
police officers per capita for large U.S. cities. Notice that officers per capita appears to be positively
correlated with the index crime rate (i.e., the regression line through the data slopes upward), contrary
to expectations if one believes that having more officers helps to control crime. The scatter plot
illustrates how a simple regression analysis can be misleading. The number of police and the index
crime rate affect each other. The number of police per capita may reduce crime, but increases in crime
may cause policymakers to increase the size of the police force.
18
Coalition for Evidence-Based Policy, Rigorous Program Evaluation on a Budget: How Low-Cost Randomized
Controlled Trials Are Possible in Many Areas of Social Policy (Washington, DC: CEBP, 2012),
http://coalition4evidence.org/wp-content/uploads/Rigorous-Program-Evaluations-on-a-Budget-March-2012.pdf (accessed
February 3, 2014).

Vera Institute of Justice 15
Figure 5. Relationship between police-force size and crime in large U.S. cities, 2007
Source: Paul Heaton, Hidden in Plain Sight: What Cost-of-Crime Research Can Tell Us About Investing in Police (Santa
Monica, CA: Rand Corporation, 2009), http://www.rand.org/pubs/occasional_papers/OP279/ (accessed February 3, 2014).
Instrumental variables. Analysts can overcome the simultaneity problem by introducing instrumental
variables, a method that usually involves a two-stage regression. The first regression uses one or more
variables to predict a treatment variable. The second regression uses the predicted values of the
treatment variable from the first stage to predict the outcome of interest. An instrumental variable is a
variable whose only effect on the outcome is through its effect on the treatment variable. In the
example of the relationship between crime and police-force size, terrorist events and election years can
be used as instrumental variables; they present situations in which the size of a police force is at least
temporarily increased without regard to the crime rate. By first regressing police-force size on the
instruments, one obtains predicted values for police per capita that are uncorrelated with the index
crime rate. The outcome can then be regressed on the predicted values to obtain unbiased estimates of
the impact of police on crime. Finding valid instruments can be challenging. The instrument must
strongly predict the explanatory variable that is jointly determined with the outcome, while having no
discernible relationship to other explanatory variables in the regression model, thus demonstrating
quasi-random conditions.
Propensity score matching. For programs that target individuals, such as electronic monitoring or
pretrial diversion, a technique called propensity score matching is sometimes used to ensure that
program participants are compared to the subset of non-participants who are most similar to them, thus
reducing bias. The propensity score reflects the degree of similarity (on observed characteristics)
between any program participants and non-participants, and serves as the basis for matching. The score

Vera Institute of Justice 16
is derived by estimating the impact of these observed characteristics on the probability of receiving the
treatment. A glaring potential problem with the propensity score method is that treatment and control
individuals may differ markedly in ways that are not observed.
Regression discontinuity. In some instances, program assignment is determined by a threshold score
on a risk- or needs-assessment test. If the cutoff score is somewhat arbitrary and a sufficient number of
people score just above or below the cutoff, the effect of the program can be estimated from the
difference in outcomes for these barely eligible and ineligible groups. This method is known as
regression discontinuity.
Difference-in-differences (DiD). This approach compares net changes between treatment and control
groups, before the treatment or intervention versus afterward. Static (time-invariant) differences
between the groups are factored out of the equation, while observable time-variant differences can be
included in the regression model. Unobserved differences that change over time can be controlled for
through inclusion of a second control group to generate a triple-differences estimate. For example,
Heaton estimated the public-safety impact of repealing Sunday liquor laws in parts of Virginia using
the difference in crime rates before versus after repeals took effect, on Sundays versus other days of
the week, and in affected versus unaffected jurisdictions.19
Looking at other days of the week
unaffected by the repeal controlled for unobserved changes within repeal jurisdictions over time, such
as a local increase in police personnel. Looking at jurisdictions that did not repeal the law controlled
for unobserved changes that might affect crime on Sundays throughout Virginia, such as the release of
large numbers of inmates to alleviate state prison overcrowding. DiD is often applied to place-based
interventions, thus such an evaluation method might be appropriate for the aforementioned gang task-
force study (see “Non-Experimental Design,” page 9), as long as one or more neighborhoods with a
similar gang problem unaddressed by the task force exist as a comparison group.20, 21
Pre-test and post-test comparison. This approach can be considered quasi-experimental under some
circumstances. An intervention likely to have an immediate observable impact can be analyzed in a
manner similar to regression discontinuity, by comparing brief periods immediately before and after its
implementation to mitigate the confounding effect of time
Meta-Analysis
When an agency or jurisdiction considers implementing a program that has been used and evaluated
elsewhere, meta-analysis can indicate the expected effect size. Meta-analysis uses the results of prior
studies to estimate a program’s average impact, which can then be used in a CBA.
Although it is less labor-intensive than carrying out an evaluation, meta-analysis still requires
19
Paul Heaton, “Sunday Liquor Laws and Crime,” Journal of Public Economics 96, nos. 1-2 (2012), 42-52. 20
Jeffrey Grogger, “The Effects of Civil Gang Injunctions on Reported Violent Crime: Evidence from Los Angeles
County,” The Journal of Law and Economics 45, no. 1 (2002), 79-86. 21
Nancy G. La Vigne, Samantha S. Lowry, Joshua Markman, and Allison Dwyer, Evaluating the Use of Public
Surveillance Cameras for Crime Control and Prevention (Washington, DC: Urban Institute, 2011), 17.

Vera Institute of Justice 17
calculations and scrutiny of the literature, weighting the results according to the strength of the
evaluation. If an agency is considering a program that has been meta-analyzed, it is still advisable to
verify that the meta-analysis was done well. A meta-analytic review must include the following:
Clear, logical criteria for inclusion and exclusion of studies;
An explicit and sufficiently thorough search strategy; and
Systematic coding and analysis of the studies included.
Meta-analysis has been applied to a number of justice investments, such as corrections-based
education, vocation, and work programs for adult offenders.22
They searched eight literature databases
and contacted fellow researchers to find relevant published and unpublished studies. Studies were
excluded unless they 1) evaluated an educational, vocational, or work program for convicted offenders;
2) estimated the program’s impact on some measure of recidivism; 3) included a control or comparison
group, and 4) were published in English after 1975. Studies were weighted according to the estimate
precision, follow-up period, and type of recidivism outcome. (For example, reconviction was weighted
more heavily than rearrest.) Effect sizes were standardized as odds ratios—the proportion of program
and comparison participants who recidivated. Although the effect size was statistically significant, the
authors declared the results inconclusive, arguing that selection bias in the program groups was
potentially strong enough to account for the difference in outcomes.
Meta-analysis has the appeal of deriving an estimate from a number of studies. It might then
bolster the decision makers’ confidence in a program or policy’s effectiveness, much like consulting
several independent ratings reports before buying an appliance reassures consumers of its quality. But
meta-analysis results may over-summarize and should be interpreted cautiously. The impact of a small
pilot program evaluated several years ago might not correspond to the impact of the more extensive
version planned for another jurisdiction, even if the programs otherwise seem very similar. Effects of
time, place, and scale, as well as subtle differences in how the programs are implemented, can lead to
disparities between an estimated and an actual impact.
Keep in Mind
Program evaluations pose numerous challenges, the first of which is that an evaluation may not even
be feasible. For instance, law enforcement interventions, such as intelligence-led policing, can be
difficult to study. These programs may represent a series of incremental policy changes that become “a
different way of doing things” over time.
CBA’s goal of comprehensiveness makes program evaluation even more demanding. Programs
often have ramifications upstream and downstream in the justice system, and measuring these impacts
can require linking data from disparate sources. Important long-term benefits of justice programs, like
educational attainment and employment, may not be captured in a traditional evaluation due to time
and budget constraints or because the information is gathered by a government agency not involved in
22
David B. Wilson, Catherine A. Gallagher, and Doris L. MacKenzie, “A Meta-Analysis of Corrections-Based Education,
Vocation, and Work Programs for Adult Offenders, Journal of Research in Crime and Delinquency 37, no. 4 (2000), 347-
368.
Vera Institute of Justice 18
the evaluation. Nonetheless, measuring such impacts would be vital for predicting benefits and,
therefore, for determining the program’s net present value.
The reliance on recidivism as an outcome also presents a challenge. Although recidivism is the best
index available for measuring the impact of programs on people’s propensity to reoffend, it is an
imperfect measure of criminal activity. There is no consistent definition of recidivism. Law
enforcement agencies may count rearrest as recidivism, courts may use reconviction as the definition,
correctional agencies may use recommitment, and probation departments may include technical
violations in their definition. For a court system that is heavily backlogged, it will take longer for
reconviction and recommitment data to accumulate, but using rearrest will overstate the burden of
recidivism on courts and corrections. As with many other issues that arise in conducting evaluations
for CBAs, there is no clear right or wrong answer, but there is an obligation to be clear about how
terms are defined and how those definitions can affect the results.
Section III: Valuing the Costs and Impacts of Justice Policies and Programs
Quantifying program impacts is the end product for many social science studies. But with CBA, both
the impacts and the resources expended to achieve them must be monetized to the extent possible. As
discussed in Section I, programs can affect government spending, crime victimization, participants,
and overall social welfare. Monetizing the positive and negative impacts to all relevant perspectives is
the crux of CBA’s contribution to economic analysis. But deriving credible dollar-value estimates of
some harms and benefits is also one of the biggest challenges in justice-related CBAs.
This section includes a discussion about estimating the costs of implementing a justice policy or
program and then focuses on valuing the impacts on taxpayers, victims, offenders, and the rest of
society. Our recommendations, many of which follow from those laid out in Section I, are that analysts
should do the following:
Use appropriate cost figures, being careful in particular to use marginal costs rather than
average costs for initiatives that will affect government spending—and therefore taxpayers—on
the margin.
Examine all the resources used to implement a policy or program, including the time costs of
employees and other stakeholders, when estimating the cost of a justice initiative.
Assess impacts beyond those to the criminal justice system, when applicable.
Disaggregate taxpayer costs by unit or level of government, when appropriate.
Explain the methods and sources used for all calculations.
Provide qualitative information on impacts and the monetary values of impacts when
quantitative information is unavailable or unreliable.
Program Costs
Justice system programs and policies involve allocating resources that would otherwise be put to some
alternative use. In the same way that defining the treatment and counterfactual are prerequisites for

Vera Institute of Justice 19
program evaluation, distinguishing the cost of an initiative or intervention from “business as usual”
operations is essential when estimating program costs. (See “Non-Experimental Design,” page 9.)
Intrepid accounting is necessary to estimate accurately the cost of a program or policy relative to the
status quo or other options, as policies and programs may receive public and private funding and can
involve collaboration among multiple agencies and nongovernmental organizations.
A wide range of resources may be used—and costs incurred—in the implementation of justice
policies and programs. Direct costs such as staff salary, benefits, office supplies, and other equipment
apply to virtually every program. Similarly, when a new facility is built specifically for a program,
capital expenses like project planning, real estate, and construction should figure in the program cost
estimate, along with indirect costs and start-up costs for furniture and equipment.
Determining the cost of a criminal justice initiative can be a straightforward process. Some
programs have dedicated resources, such as equipment and a certain number of full-time employees of
known pay grade. Perhaps the program is neatly compartmentalized as one or more line items in a
budget or is funded entirely through a grant. But even in these instances, analysts should know that
what is appropriated is not always the same as what is spent. Additionally, the cost to taxpayers may
not represent the full program cost if the program makes use of donated goods and services. For
instance, the full cost of a job-training program for inmates that uses government employees as
trainers, volunteers as mentors, and donated supplies should include taxpayer costs as well as the
economic value of donated time and supplies.
In other instances, estimating the costs of a criminal justice policy or program is more complex,
requiring a careful assessment of the personnel and agencies involved. One approach to estimating
employee time and other variable program costs is transactional and institutional cost analysis (TICA),
which “micro-costs” government expenses by tracking every employee activity associated with a
particular program or policy. The time spent by each employee involved in the transaction is then
multiplied by the employee’s wage rate and summed for all employees. TICA has been used in
comparing the costs of several problem-solving courts to standard case processing by multiplying the
duration of court appearances, drug tests, treatment sessions, and other transactions by the salaries of
the judges, attorneys, bailiffs, court reporters, case managers, and service providers involved in those
transactions. 23
Accurate micro-costing requires the ability to differentiate between what is a
programmatic element and what is “business as usual.” Thus, a prerequisite for micro-costing is
consultation with program personnel to create a logic model or flowchart defining the program and any
alternatives to which it will be compared.
Some people who work in government are inclined to dismiss employee time costs for programs
run by existing staff, arguing that the employees’ time is like a fixed cost, already paid for regardless
of the activity. This notion is incompatible with CBA, a tool for determining whether a particular use
of time and other readily monetizable resources is more beneficial than an alternative use.
Taxpayer Costs
Taxpayers fund the operations of law enforcement, courts, corrections, and various public-sector
23
Shannon Carey and Michael Finigan, A Detailed Cost Analysis in a Mature Drug Court Setting: A Cost-Benefit
Evaluation of the Multnomah County Drug Court (Portland, OR: NPC Research, 2003).

Vera Institute of Justice 20
functions linked to the justice system. Decision makers want to know how much justice policies and
programs will affect government costs, so accurate estimation of these costs is critical to CBA.
Consider a policy that has the effect of increasing the number of arrests for a particular crime. To
conduct a CBA of such a policy, analysts would need to estimate not only the increased cost to the
police, but also, depending on the type of crime, the additional costs related to the increased use of
court and corrections resources for trying and incarcerating more people—or supervising them (for
example, through parole or probation).
Taxpayer costs should be calculated using the marginal cost of each activity. The marginal cost is
the amount of change in total cost when a unit of production changes. In the context of the criminal
justice system, it is how much the total operating costs of an agency change when workload (such as
arrests, court filings, or jail days) changes because of a policy or program.
It is critical to use marginal costs in CBA calculations. One of the most fundamental errors an
analyst can make is using average costs, a mistake that usually results in overestimating the costs or the
avoided costs related to a policy change. This is because the average cost includes fixed costs—such
as administration and other overhead costs—that policy changes rarely alter. (For more information,
refer to Vera’s Guide to Calculating Justice-System Marginal Costs.24
)
The difference between average and marginal costs is often considerable. In 2011, for example, the
average annual per-inmate cost of incarceration in Massachusetts was an estimated $46,000, whereas
the marginal cost was only $9,000.25
Average cost includes costs for administration, utilities, and other
expenses that will not change when the prison population is slightly reduced or increased. A small
change in the population affects expenses such as food, clothing, and medical care: these are the
marginal costs of a small increase or decrease in the prison population.
Marginal costs depend on the size of the change in workload and how the government adjusts the
budget in response to this change. This means that more than one marginal cost could potentially be
used in justice CBAs. Marginal costs that change immediately with even a small change in workload
are called short-run marginal costs. When a policy has a larger impact on workload, staffing costs need
to be considered, yet it may take time for the government to change staffing levels. Thus, a long-run
marginal cost includes the short-run marginal cost as well as the staffing costs that change as
governments make adjustments to staffing levels in future budget cycles.
Cost-benefit studies of criminal justice initiatives should use the long-run marginal cost when the
effect of the policy on workload is expected to affect staffing needs. Analysts should use the short-run
marginal cost when the policy impact is not large enough to affect staffing.
24
Christian Henrichson and Sarah Galgano, A Guide to Calculating Justice-System Marginal Costs (New York: Vera
Institute of Justice, 2013), http://cbkb.org/publication/a-guide-to-calculating-justice-system-marginal-costs/ (accessed
January 16, 2014). 25
Paul Heroux, “Addressing the prison’s budget and population,” Taunton Daily Gazette, February 11, 2011.

Vera Institute of Justice 21
Keep in Mind
The outcomes of criminal justice policies and programs sometimes affect spending in other areas of
government. Longer sentences for offenders who have children may increase costs for the foster care
system; releasing elderly inmates to alleviate overcrowding may impose a greater burden on state-
subsidized health care for the indigent; and reduced enforcement of truancy laws might cost public
schools money. A careful CBA should take into account these possible effects beyond the criminal
justice system.
Cost-benefit studies usually report the total taxpayer cost as one figure. However, it may be helpful
to report costs by the level of government—that is, federal, state, or local. In some instances, it might
also be appropriate to disaggregate taxpayer costs by unit of government, such as a corrections or
social services department.
Costs of Crime
Crime causes substantial financial, psychological, and physical harm. Over the past few decades,
economists have used a variety of methods to assign dollar values to these harms and estimate the costs
of crime to victims, society as a whole, and offenders themselves. This section discusses the costs each
group bears, describes the methods used for estimating them, provides cost estimates from recent
studies, and discusses the costs of crime in the context of cost-benefit analysis.
Victim Costs
Victim costs, also referred to as victimization costs, are losses suffered by crime victims and include
tangible and intangible costs. Tangible costs are those that easily translate into financial losses, such as
medical costs, reduced income, and damaged or stolen property incurred because a person was the
victim of a crime. Intangible costs refer to losses such as pain, suffering, and reduced quality of life
that a crime victim may experience and are usually harder to monetize than tangible losses. CBAs of
criminal justice policies need estimates of the dollar value of these intangibles. Such non-market goods
obviously have value, but how much is not so obvious, which is why these values are called shadow
prices in economic parlance.
The Bottom-Up Approach
Placing a dollar value on victimization can be challenging, but several studies have estimated tangible
and intangible victim costs by using the cost-of-illness or jury-compensation methods. The cost-of-
illness approach measures direct, tangible costs like medical expenses (obtained from hospital
databases) and lost earnings. The jury-compensation approach uses the money awarded to victims by
juries to estimate the indirect or intangible victim costs of crime. Relying as they do on adding up the
costs in actual criminal cases, the cost-of-illness and jury-compensation methods are collectively
referred to as the “bottom-up” approach to estimating victim costs.
The main strength of the bottom-up approach is that these estimates are based on amounts that
were paid to plaintiffs in an effort to “make them whole.” This allows for offense-specific estimates
and also illustrates that the victimization cost of a crime like assault or burglary is highly skewed. In

Vera Institute of Justice 22
most cases the physical, psychological, and financial harm is minor, but a relatively few extreme cases
(for example, when a crime leaves the victim paralyzed) greatly increases the average victimization
cost to many times the median victimization cost.
But the approach also has drawbacks. Some jury awards incorporated in bottom-up estimates were
from cases involving death or bodily injury that was not the result of a crime, so using this method
assumes that juries award the same amount for injuries regardless of whether they were caused by a
defective product, medical malpractice, or a criminal act. In addition, crimes adjudicated in civil court
that result in jury awards may not be representative of all crimes, and research has shown regional and
plaintiff gender bias in jury awards. Figure 6 summarizes the tangible and intangible victim cost
estimates from jury compensation and cost-of-illness studies. All values are expressed in 2012 dollars.
Figure 6. Estimated tangible plus intangible victim costs per crime using a bottom-up approach
Offense Category
Roman (2010) Cohen & Piquero
(2009) McCollister, French
& Fang (2010)
Murder/Manslaughter $1,673,679 $5,106,000 $9,032,940
Rape $167,236 $149,850 $213,617
Armed robbery $320,543a $32,190 n/e
Robbery n/e $13,320 $24,155
Aggravated assault $155,260b $41,070 $101,675
Assault n/e $4,995 n/e
Arson n/e $63,270 $5,492
Larceny/Theft $2,841 $500 $11
Motor vehicle theft $20,301 $6,105 $280
Burglary (household) $5,945 $2,220 $343
Fraud n/e $1,221 n/e
Vandalism n/e $411 n/e
n/e = Not estimated
Sources: John K. Roman, “How Do We Measure the Severity of Crimes? New Estimates of the Cost of Criminal
Victimization,” Measuring Crime and Criminality: Advances in Criminological Theory 17, no. 37 (2010), 37-70; Mark A.
Cohen and Alex R. Piquero, “New Evidence on the Monetary Value of Saving a High Risk Youth.” Vanderbilt Law and
Economics Research Paper No. 08-07, Journal of Quantitative Criminology 25, no. 1 (2009), p. 33, Table 5; and Katherine
E. McCollister, Michael T. French, and Hai Fang, “The Cost of Crime to Society: New Crime-Specific Estimates for Policy
and Program Evaluation,” Drug and Alcohol Dependence 108, nos. 1-2 (2010), p. 105, Table 5,
www.ncbi.nlm.nih.gov/pubmed/20071107 (accessed February 3, 2014). The authors’ estimates have been adjusted to 2012
dollars using the Bureau of Labor Statistics’ Consumer Price Index Inflation Calculator,
http://www.bls.gov/data/inflation_calculator.htm, accessed August 21, 2013. a This calculation uses Roman’s estimate for robbery for the cost of armed robbery.
b This calculation uses Roman’s estimate for assault for the cost of aggravated assault.
The Top-Down Approach
The cost of crime to society is not the same as the sum of victimization costs across all crime
categories in a jurisdiction, because crime imposes costs even on those not directly victimized. In a

Vera Institute of Justice 23
broad sense, crimes are a transgression against all members of society, a belief underscored by the
legal convention that prosecutors represent “The People” in criminal trials.
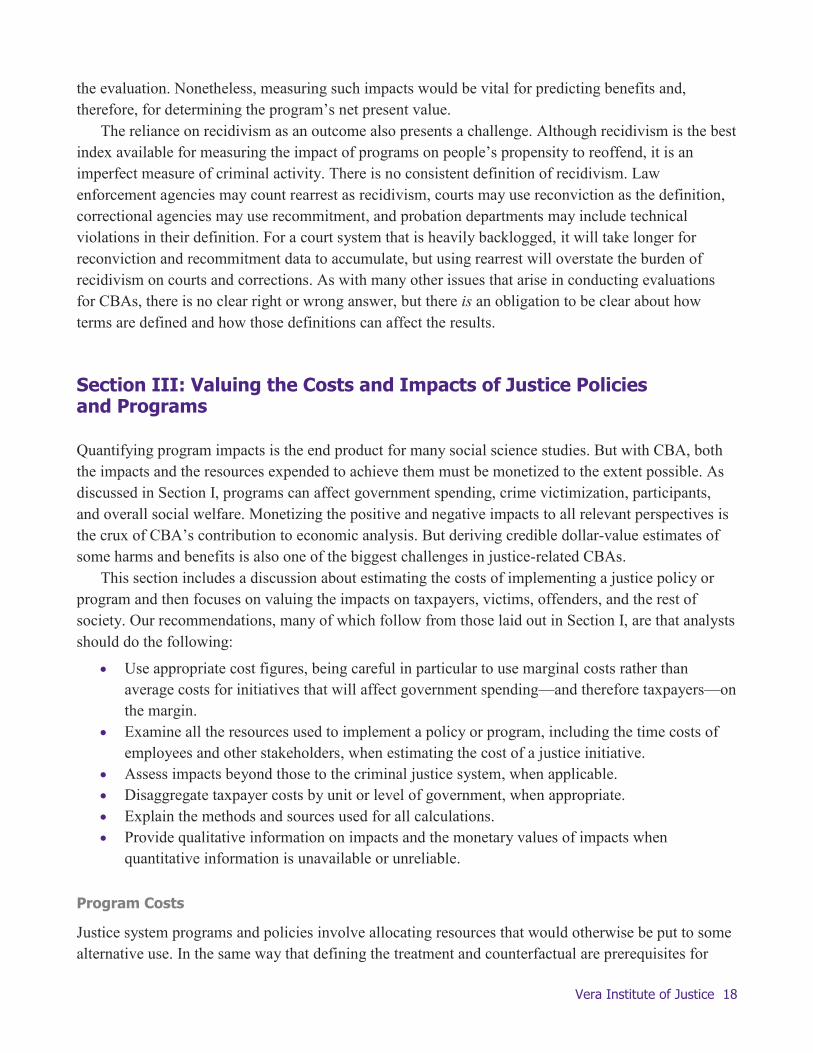
Economists use two methods to estimate societal costs of crime: contingent valuation and hedonic
pricing. Whereas the bottom-up approach of cost-of-illness and jury-compensation methods attempts
to sum up the costs borne by crime victims specifically, contingent valuation and hedonic pricing
methods attempt to capture the cost of crime to society as a whole or the value society places on the
amenity of public safety. As such, these methods are referred to as “top-down” approaches to
estimating crime costs.
The contingent valuation method relies on surveys that ask people to place a dollar value on
changes in crime levels. A survey might ask individuals how much they are willing to pay for a
reduction in crime, or how much they would have to be compensated for an increase in crime rate.26, 27
In theory, contingent-valuation estimates encompass victimization costs, tangible crime avoidance
costs, and the associated intangible fear of crime felt by potential victims and even offenders.
Contingent-valuation estimates therefore tend to be significantly higher than jury award and cost-of-
illness estimates.
Contingent valuation has at least three limitations. First, there is some debate as to which costs
survey respondents actually take into account—tangible or intangible. Second, contingent-valuation
surveys may overstate what people are willing to pay to avoid crime because respondents don’t have to
pay the amount they specify. Third, the surveys require respondents to make a difficult appraisal––the
valuation of a minute reduction in the risk of victimization––the type of assessment usually left to
actuarial statisticians.
Yet despite its flaws, leading economists are of the opinion that the contingent-valuation shadow
price of a crime is less precise but more correct than estimates based on a bottom-up approach.
Because contingent valuation attempts to measure crime’s effect on property values, the monetary
value of fear of crime, social degradation, and avoidance behavior by potential victims, shadow prices
based on contingent valuation present more of a neighborhood or community perspective on crime.
In addition to contingent-valuation surveys, researchers use hedonic pricing to infer how individuals
value public safety. Hedonic prices are determined by collecting information about property
characteristics, such as square footage and number of bedrooms for homes across a large area (such as
a city or county) and neighborhood characteristics, such as public school quality and access to transit.
This information is then put into a regression model to tease out or “unbundle” the portion of area
property values attributable to intangible benefits like less noise pollution. Several studies have
estimated the dollar value residents place on crime and potential victimization by examining the effects
of crime on property values.28
Shadow prices developed through hedonic pricing typically do not apply to specific types of
offenses, such as rape or theft, but to broader categories of violent and property crime or to crime
26
Mark A. Cohen and Alex R. Piquero, “New Evidence on the Monetary Value of Saving a High Risk Youth,” Vanderbilt
Law and Economics Research Paper No. 08-07. Journal of Quantitative Criminology 25, no. 1 (2009), 25-49. 27
Mark A. Cohen, “Pain, Suffering, and Jury Awards: A Study of the Cost of Crime to Victims,” Law & Society Review 22,
no. 3 (1988), 537-556, http://www.jstor.org/stable/3053629 (accessed February 3, 2014). 28
Allen K. Lynch and David W. Rasmussen, “Measuring the impact of crime on house prices,” Applied Economics 33, no.
15 (2001), 1981-1989.
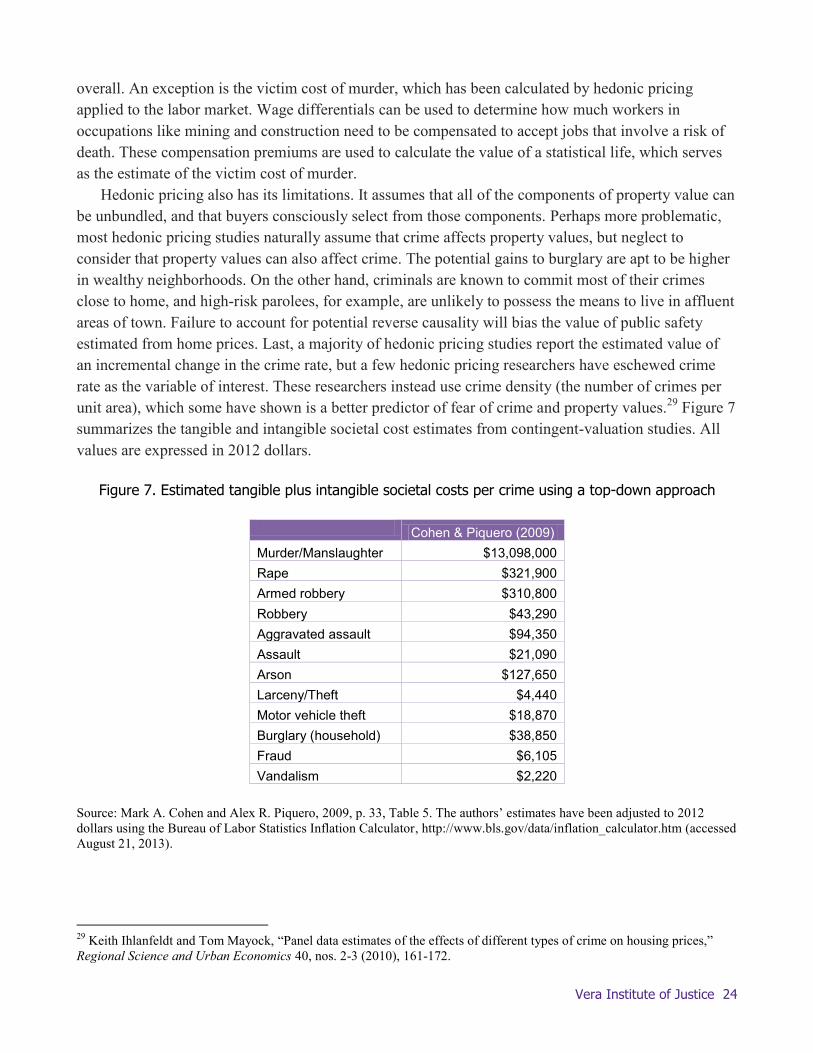
Vera Institute of Justice 24
overall. An exception is the victim cost of murder, which has been calculated by hedonic pricing
applied to the labor market. Wage differentials can be used to determine how much workers in
occupations like mining and construction need to be compensated to accept jobs that involve a risk of
death. These compensation premiums are used to calculate the value of a statistical life, which serves
as the estimate of the victim cost of murder.
Hedonic pricing also has its limitations. It assumes that all of the components of property value can
be unbundled, and that buyers consciously select from those components. Perhaps more problematic,
most hedonic pricing studies naturally assume that crime affects property values, but neglect to
consider that property values can also affect crime. The potential gains to burglary are apt to be higher
in wealthy neighborhoods. On the other hand, criminals are known to commit most of their crimes
close to home, and high-risk parolees, for example, are unlikely to possess the means to live in affluent
areas of town. Failure to account for potential reverse causality will bias the value of public safety
estimated from home prices. Last, a majority of hedonic pricing studies report the estimated value of
an incremental change in the crime rate, but a few hedonic pricing researchers have eschewed crime
rate as the variable of interest. These researchers instead use crime density (the number of crimes per
unit area), which some have shown is a better predictor of fear of crime and property values.29
Figure 7
summarizes the tangible and intangible societal cost estimates from contingent-valuation studies. All
values are expressed in 2012 dollars.
Figure 7. Estimated tangible plus intangible societal costs per crime using a top-down approach
Cohen & Piquero (2009)
Murder/Manslaughter $13,098,000
Rape $321,900
Armed robbery $310,800
Robbery $43,290
Aggravated assault $94,350
Assault $21,090
Arson $127,650
Larceny/Theft $4,440
Motor vehicle theft $18,870
Burglary (household) $38,850
Fraud $6,105
Vandalism $2,220
Source: Mark A. Cohen and Alex R. Piquero, 2009, p. 33, Table 5. The authors’ estimates have been adjusted to 2012
dollars using the Bureau of Labor Statistics Inflation Calculator, http://www.bls.gov/data/inflation_calculator.htm (accessed
August 21, 2013).
29
Keith Ihlanfeldt and Tom Mayock, “Panel data estimates of the effects of different types of crime on housing prices,”
Regional Science and Urban Economics 40, nos. 2-3 (2010), 161-172.
Vera Institute of Justice 25
Using Victim and Societal Cost-of-Crime Estimates in a CBA
A comprehensive cost-benefit analysis of an initiative that affects crime, whether directly or indirectly,
should take into account the shadow price of crime. If a policy or program reduces crime, the costs of
avoided victimization and fear of crime are counted as benefits. If a policy or program increases crime,
victim costs are incurred.
When reporting on victim and societal costs of crime in a CBA, be explicit about the method used
to obtain the estimates. Top-down cost estimates are more appropriate for CBA because they are more
comprehensive than estimates based on a bottom-up approach and provide a measure of the full
externality of criminal offenses on society. The disadvantage of using top-down estimates is that they
reduce transparency because estimates are harder to disaggregate into types of costs. Figure 8
illustrates this problem in comparing the elements of bottom-up and top-down victim-cost estimates
for the crime of rape. Both analysts and policymakers may find the greater precision of bottom-up
estimates appealing, but should be aware of the important costs these estimates fail to capture.
Figure 8. Victim costs of rape: Comparison of bottom-up vs. top-down approaches
Bottom-Up Approach
Top-Down Approach
Out-of-pocket costs $650 Included
Lost productivity $2,800 Included
Counseling $2,800 Included
Pain and suffering $103,500 Included
Justice-system costs $3,250 Included
Avoidance costs; prevention costs; fear Not included Included
Total $113,000 $237,000
Source: Mark A. Cohen, “Economic Cost of Crime and Public Policy Decisions” (presentation at seminar on “The Costs
of Crime and Violence in Latin America and the Caribbean: Methodological Innovations and New Dimensions,”
Inter-American Development Bank, Washington, DC, Jan. 24, 2013,
http://www.livestream.com/idbcitizensecurity/video?clipId=pla_70100625-3061-4771-a060-b791e4b1933f , accessed
February 4, 2014).
Readers of your CBA may be skeptical about intangible costs, especially given that for certain types of
offenses, intangible costs can be several times larger than tangible costs. Presenting tangible and
intangible costs in separate columns, as in Figure 9, provides a more complete and comprehensible
view of victim costs, and shows that the full cost of victimization for serious violent crimes is much
higher than the tangible costs alone.

Vera Institute of Justice 26
Figure 9. Victim costs of crime30
VICTIM COSTS ($)
Type of Offense Tangible Intangible Total
Murder $737,517 $8,442,000 $8,442,000
Rape/Sexual assault $5,556 $199,642 $205,085
Aggravated assault $8,700 $95,023 $96,254
Robbery $3,299 $22,575 $24,211
Motor vehicle theft $6,114 $262 $6,352
Arson $11,452 $5,133 $16,127
Household burglary $1,362 $321 $1,653
Larceny/Theft $480 $10 $489
Source: Katherine E. McCollister, Michael T. French, and Hai Fang, “The Cost of Crime to Society: New Crime-Specific
Estimates for Policy and Program Evaluation,” Drug and Alcohol Dependence 108, nos. 1-2 (2010), 98-109,
www.ncbi.nlm.nih.gov/pubmed/20071107 (accessed February 3, 2014).
Keep in Mind
The studies and methods described above represent some of the best available research on victim and
societal crime costs, but further research is needed. Notice that most studies do not calculate these
costs for drug offenses, even though substance abuse affects health outcomes and generates medical
costs for users and society. Cohen and Piquero have estimated the lifetime cost of a heavy drug user at
$1.15 million to $1.3 million, and though the user bears much of the cost, this figure does include the
cost of child neglect and endangerment.31
Likewise, there are few estimates on social costs of white-
collar crimes, even though the tangible victim costs inflicted by fraud, insider trading, and other forms
of business-related theft may far exceed the tangible costs of street crimes. Future research should
address these limitations. In the meantime, using current victim or societal cost-of-crime figures is
better than excluding these estimates from cost-benefit analysis.
Offender Costs
All government spending has an opportunity cost, that is, an alternative is forgone because money is
spent on a given program or service and not on something else. To aid in the evaluation of programs
30
For most offenses, values in the Total column do not equal the sum of the values in the Tangible and Intangible columns.
The tangible and intangible costs of murder are estimated using two distinct methodologies. Tangible costs reflect the value
of forgone lifetime earnings, whereas intangible costs represent the value of a statistical life. (See W. Kip Viscusi and
Joseph E. Aldy, “The Value of a Statistical Life: A Critical Review of Market Estimates Throughout the World,” The
Journal of Risk and Uncertainty 27, no. 1 [2003], 5-76, http://camra.msu.edu/documents/ViscusiandAldy2003.pdf,
accessed February 21, 2014.) The two estimates should not be combined to create a “total victim cost per murder.” The
tangible and intangible costs for the other offenses listed in Figure 9 include valuations of the risk of homicide costs
attributable to those crimes; therefore the total victim costs were adjusted to avoid double-counting. For more information
about these calculations, see Katherine McCollister et al., 2010. 31
Cohen and Piquero, 2009, 46.

Vera Institute of Justice 27
that decrease recidivism or divert offenders from prison altogether, researchers have calculated the
opportunity cost of incarceration. They do this either by using survey data on the legitimate earnings of
offenders prior to imprisonment or by assuming full-time employment at minimum wage, yielding
estimates of $14,626/year (1997 USD) and $13,624/year (2008 USD), respectively (see Figure 10).
Justice programs may help offenders become more productive. Statistically, an offender is more likely
to achieve a higher salary with gains in educational attainment and vocational training, and is more
likely to have a longer and more productive career with increased health and longevity. If an
adolescent is diverted from a life of chronic drug abuse, for example, this saves an estimated $43,500
in productivity loss due to drug-related illness and $125,000 to $220,000 in productivity loss due to
premature death.32
Figure 10. Estimated costs of crime to offenders, in forgone earnings
McCollister et al. (2010)
Cohen & Piquero (2009)
Rajkumar &
French (1997)
Murder/Manslaughter $158,954 $155,400 n/e
Rape $9,857 $4,995 n/e
Armed robbery n/e $8,880 n/e
Robbery $4,571 $4,440 $1,747
Aggravated assault $2,275 $7,104 $1,284
Assault n/e $1,443 n/e
Arson $625 $777 n/e
Larceny/Theft $174 $777 $74
Motor vehicle theft $592 $1,110 $186
Burglary (household) $729 $1,110 $366
Embezzlement $706 n/e n/e
Fraud $706 $777 n/e
Stolen property $1,211 n/e n/e
Forgery $706 n/e $183
Vandalism $750 n/e n/e
n/e = Not estimated
Sources: McCollister, French, & Fang (2010), page 7, Table 4; Cohen & Piquero (2009), page 33, Table 5. Rajkumar &
French (1997), page 301, Table 1. These authors’ estimates have been adjusted to 2012 dollars using the Bureau of Labor
Statistics’ Consumer Price Index Inflation Calculator (http://www.bls.gov/data/inflation_calculator.htm; accessed August
21, 2013.)
In CBA, offenders also have standing with respect to policies that involve due process or other
constitutional issues. Empirical inquiry into the cost of due-process violations is lacking, and it is not
altogether clear how analysts would quantify these concepts. As with other indirect or intangible costs,
the challenge of quantifying the cost should not prevent considering these important impacts in a
qualitative sense.
32
Ibid, p. 44.

Vera Institute of Justice 28
Time Horizons and Discounting
Justice system programs and policies can generate costs and benefits over a span of several years,
decades, or indefinitely. In CBA, the period over which benefits and costs are assessed is referred to as
the time horizon or the time frame. For example, the time horizon for a new jail could be 30 years, the
expected period that the facility will be operating.
To compare projects with different time horizons—or even projects with the same time horizon but
with different timing of cost and benefit streams—economists use a technique called discounting.
Discounting adjusts future costs and benefits downward, by an annual percentage called the discount
rate, in recognition of the time value of money. This is the concept that money is worth more now than
later, whether it is spent for immediate gratification or invested for profit. For this reason, CBA results
should be expressed in terms of net present value, the net difference in costs and benefits after
discounting.
Selecting appropriate discount rates and time horizons is important because they can affect cost-
benefit results and thus policy recommendations. The higher the discount rate, the more steeply future
costs and benefits depreciate. A lower discount rate decreases the value of future costs and benefits
less, keeping them closer to current dollar values. A time horizon that does not capture future costs and
benefits can make a project’s return on investment seem better or worse than it is.
Figure 11 demonstrates how time horizons and discount rates affect cost-benefit findings and the
resulting policy recommendations. Consider two programs, A and B. The only cost for Program A is
an upfront investment of $45,000, while Program B has upfront costs of $20,000, followed by annual
costs of $2,500. Both programs yield $6,000 per year in benefits. Figure 11 shows the net present value
for each program using three discount rates—0, 3, and 7 percent—and computes the net present value
at 10-year and 20-year time horizons. When the time value of money is taken into account, Program B,
with its lower initial costs, has a higher net present value than Program A at year 10. If the discount
rate is 7 percent, Program A does not even recoup its initial costs after 10 years. However, by year 20,
the ongoing annual costs of Program B have diminished the net present value, and Program A looks
like a better option, underscoring the importance of the time horizon choice.

Vera Institute of Justice 29
Figure 11. Discounting with 0, 3, and 7 percent rates
TIME PROGRAM A PROGRAM B
0% 3% 7% 0% 3% 7%
Year 0 ($45,000) ($45,000) ($45,000) ($20,000) ($20,000) ($20,000)
Year 1 $6,000 $5,825 $5,607 $3,500 $3,398 $3,271
Year 2 $6,000 $5,656 $5,241 $3,500 $3,299 $3,057
Year 3 $6,000 $5,491 $4,898 $3,500 $3,203 $2,857
Year 4 $6,000 $5,331 $4,577 $3,500 $3,110 $2,670
Year 5 $6,000 $5,176 $4,278 $3,500 $3,019 $2,495
Year 6 $6,000 $5,025 $3,998 $3,500 $2,931 $2,332
Year 7 $6,000 $4,879 $3,736 $3,500 $2,846 $2,180
Year 8 $6,000 $4,736 $3,492 $3,500 $2,763 $2,037
Year 9 $6,000 $4,599 $3,264 $3,500 $2,682 $1,904
Year 10 $6,000 $4,465 $3,050 $3,500 $2,604 $1,779
Net present value (10-year time horizon) $15,000 $6,181 ($2,859) $15,000 $9,856 $4,583
Year 11 $6,000 $4,335 $2,851 $3,500 $2,528 $1,663
Year 12 $6,000 $4,208 $2,664 $3,500 $2,455 $1,554
Year 13 $6,000 $4,086 $2,490 $3,500 $2,383 $1,452
Year 14 $6,000 $3,967 $2,327 $3,500 $2,314 $1,357
Year 15 $6,000 $3,851 $2,175 $3,500 $2,247 $1,269
Year 16 $6,000 $3,739 $2,032 $3,500 $2,181 $1,186
Year 17 $6,000 $3,630 $1,899 $3,500 $2,118 $1,108
Year 18 $6,000 $3,524 $1,775 $3,500 $2,056 $1,036
Year 19 $6,000 $3,422 $1,659 $3,500 $1,996 $968
Year 20 $6,000 $3,322 $1,551 $3,500 $1,938 $904
Net present value (20-year time horizon) $75,000 $44,265 $18,564 $50,000 $32,071 $17,079

Vera Institute of Justice 30
Keep in Mind
Ideally, CBAs should measure costs and benefits for as long as they persist, but in practice may
estimate them for a shorter duration. Few CBAs estimate intergenerational impacts of investments
even when they are viewed as potentially sizeable, because of the practical impediments to carrying
out such a long-term evaluation. Analysts sometimes avoid the issue of time horizons and discounting
by estimating the net benefits on a within-year basis. This is reasonable for programs with stable costs
and benefit streams that are roughly contemporaneous.
CBAs of programs with large start-up costs and/or significant lag time between costs incurred and
benefits realized should clearly document the time horizon and discount rate used in the analysis,
because the effect of discounting becomes more pronounced over longer time frames. Political realities
may influence elected officials to favor programs that promise net benefits in the short term, even if
another option might offer greater benefits in the long term.
Finally, recognize that a long time horizon implies a strong assumption about the state of the world
remaining fairly constant. The pace of innovation may render public safety technologies obsolete much
more quickly than anticipated, or an unforeseen demographic shift may cause a correctional program’s
reach—and therefore its impact—to fall short of projections. This uncertainty highlights the need for
challenging the inputs and assumptions of CBA, a topic discussed in Section IV.
Section IV: Dealing with Uncertainty in Impacts
Some degree of uncertainty is inherent in even the most rigorous cost-benefit study. The impacts of
policies or programs may be difficult to measure or predict, and the value of those impacts may be
hard to monetize. Cost-benefit studies must make assumptions and use estimates to calculate the
expected costs and benefits of a policy or program. But what if the assumptions and estimates are off?
Would different information change the bottom line results drastically, slightly, or not at all?
A cost-benefit study isn’t meant to guarantee precise costs and benefits, and will be misleading if
its results are calculated using only point estimates for the CBA model’s inputs. A CBA that considers
a range of possible scenarios and explains the likely outcomes will not only be more credible than one
that looks only at the base-case scenario, but more informative.
Sensitivity analysis is a tool for assessing a cost-benefit model’s tolerance to deviations from the
base-case scenario. It can also be used to calculate the likelihood of achieving a certain result, for
example, the probability that a project will break even.
This section provides an overview of sensitivity analysis and describes four types: partial
sensitivity analysis, best-case and worst-case scenarios, break-even analysis, and Monte Carlo
analysis.
Sensitivity Analysis
Sensitivity analysis is a group of techniques that can be used to examine the degree of uncertainty in a
CBA and how that affects a study’s results. Sensitivity analysis provides a way to show how a study’s

Vera Institute of Justice 31
results would be affected and how responsive or sensitive those results would be to changes in the
values of specific variables.
To illustrate the different types of sensitivity analysis, consider a cost-benefit analysis of a
hypothetical prison education program for first-time offenders that aims to improve employment
outcomes and reduce recidivism. This CBA examines only the recidivism outcome. For purposes of
this CBA, recidivism is defined as a reconviction, and the program’s impact on recidivism is assumed
to apply equally across offense categories. The program’s recidivism impact is estimated relative to
three-year reconviction patterns for a cohort of inmates who would have been eligible for the program
but were released just before it started. Bottom-up estimates similar to those discussed in Section III
are used to approximate recidivism costs. Recidivism impact, estimated from tracking post-release
outcomes for the earliest cohort of participants, is a statistically significant 12 percent decrease
(−12%), but standard errors for the estimate are large, indicating that the recidivism impact may fall
anywhere between a 25 percent decrease (−25%) and a 2 percent decrease (−2%). Program attrition is
a cause for concern, because participants who don’t complete the program appear to fare no better than
the comparison group post-release. Program cost varies by individuals’ needs but is known to range
from $2,000 to $4,000 with a mean of $2,500. The base-case scenario is shown in Figure 12.
Figure 12. Base-case scenario for a hypothetical prison education program
BASELINE RECONVICTION RATE PER 100 PAROLEES COST PER RECONVICTION
Year 1 Year 2 Year 3 Justice System
Victim (Tangible)
Victim (Intangible) Offender Total
Homicide 0.06 0.03 0.03 $385,040 $592,000 $6,776,300 $250,000 $8,003,340
Sex assault 0.44 0.30 0.15 $91,800 $21,644 $772,170 $50,000 $935,614
Robbery 0.61 0.25 0.21 $61,850 $7,800 $11,770 $15,000 $96,360
Assault 0.45 0.29 0.34 $36,680 $22,680 $35,000 $40,000 $134,360
Property crime 6.23 3.16 1.95 $20,200 $5,000 $0 $10,000 $35,200
Drug crime 9.04 5.92 4.76 $13,100 $0 $0 $3,000 $16,100
Other crime 3.11 2.55 1.90 $24,280 $0 $0 $750 $25,030
Program costs (100 participants)
($232,000)
($232,000)
Program benefits $93,866 $18,673 $161,000 $32,396 $305,955
Net present value ($138,114) $18,673 $161,000 $32,396 $73,955
Note: The average program cost per graduate is $2,500. The average program cost per nongraduate is $500. The program
attrition rate is 9%, and the expected three-year impact on recidivism for program graduates is a 12% decrease. The
discount rate used in calculations is 3%.
Partial Sensitivity Analysis
In a partial sensitivity analysis, variables are selected one at a time and their values are changed while
holding the values of other variables constant to see how much the CBA results change in response.

Vera Institute of Justice 32
Figure 13 illustrates the results of a basic partial sensitivity analysis that looks at the effect of changes
in recidivism on the net benefit of the hypothetical prison education program when program costs and
other inputs are held constant. The figure indicates that a 25 percent reduction in recidivism would lead
to a net benefit of more than $405,000, a 15 percent reduction would result in a net benefit of
$150,000, and a 2 percent reduction would generate a net cost of $181,000.
Figure 13. Partial sensitivity analysis results for a hypothetical prison education program
Change in Recidivism −2% −10% −15% −20% −25%
Program costs $232,000 $232,000 $232,000 $232,000 $232,000
Program benefits $51,000 $255,000 $382,450 $510,000 $637,400
Net benefit −$181,000 $23,000 $150,450 $278,000 $405,400
Conducting a partial sensitivity analysis for all variables can highlight the ones that have the greatest
impact on the program’s net present value. This information is sometimes conveyed graphically using
what’s called a tornado diagram. This is a bar chart that ranks model inputs by the amount the net
benefit deviates from base-case estimates over a percentile (or percentage deviations) of the inputs.
Figure 14 depicts a tornado diagram of the hypothetical prison education program. The central axis is
the expected net present value of the program, about $74,000 for 100 participants, as shown in Figure
12; the bars show how much the net present value increases (to the right) or decreases (to the left)
within the 5th and 95th percentile range for the variables indicated, holding all other variables constant
at the base-case scenario value. The recidivism impact, the program cost, and the rate of reconvictions
for serious violent crime are the variables that have the greatest influence on the net present value, and
only recidivism impact and program cost have enough influence to push the program’s net present
value below zero.

Vera Institute of Justice 33
Figure 14. Tornado diagram of a hypothetical prison education program (10 most-influential variables)
Note: The total net present value of the hypothetical prison education program for 100 participants is $73,955.
Legend
Value of variable is increasing.
Value of variable is decreasing.

Vera Institute of Justice 34
Best-Case and Worst-Case Scenarios
These scenarios establish the upper (best-case) and lower (worst-case) boundaries of a cost-benefit
study’s results. This type of sensitivity analysis shows how a broad range of a program’s possible
outcomes affects the bottom line. The best-case scenario uses all of the most-favorable assumptions
about the program’s outcomes, such as the upper limit of the estimated effect on recidivism and the
lowest projected program attrition rate; the worst-case scenario uses all of the least-favorable
assumptions, such as the lower limit estimate of recidivism impact and the highest projected program
attrition rate.
For the prison education program, the best-case scenario—when accounting only for the impact on
recidivism—is that recidivism decreases by 25 percent. As Figure 13 shows, this would yield a net
benefit of more than $405,000 for 100 participants. If discount rate and program cost are also near their
lower bounds, and if baseline recidivism rates and crime costs are near their peak values, the net
present value increases to only about $440,000. Conversely, the most unfavorable assumptions result
in a net present value of approximately −$340,000.
To project best and worst outcomes that are plausible, refer to existing research on similar
programs, possibly including a pilot study of the program under consideration. Keep in mind that best-
case and worst-case scenarios are extreme cases; the odds of them occurring should be low unless
input estimates are badly off the mark.
Break-Even Analysis
Break-even analysis can be used in the following situations: if the goal is to determine a policy’s
minimum necessary effectiveness; if the policy’s most likely effects cannot be estimated; or if there are
no comparable studies to help determine the policy’s best-case and worst-case scenarios. This type of
sensitivity analysis estimates what effect size a policy must have for its benefits to equal its costs, that
is, to break even. By definition, breaking even results in a net benefit of $0.
If exceeding the break-even point is feasible, benefits would potentially outweigh the costs. If
reaching the break-even point is not feasible, the costs are likely to exceed the benefits. Consider the
hypothetical prison education program: According to the CBA model, the policy would need to reduce
recidivism by 9.1 percent to be economically neutral.
As with partial sensitivity analysis and best-case and worst-case scenario analysis, break-even
analysis can be applied to inputs other than program effect size. It is not uncommon, especially in the
financial industry, for cost-benefit studies to solve for the discount rate at which the program breaks
even as an index of its profitability. In this case, a 21.75 percent break-even discount rate indicates that
the program is a good investment (under the base-case scenario) because the break-even discount rate
is much higher than the prevailing time value of money.33
33
The guideline at the Office of Management and Budget, the Executive branch office that evaluates federal programs
using CBA, is to set the discount rate at 3 and 7 percent for CBAs of non-regulatory programs. See Office of Management
and Budget, Circular A-94: Guidelines and Discount Rates for Benefit-Cost Analysis of Federal Programs (Washington,
DC: OMB, 1992), http://www.whitehouse.gov/omb/circulars_a094 (accessed February 3, 2014).

Vera Institute of Justice 35
Monte Carlo Analysis
The three methods previously described may not fully characterize the uncertainty associated with a
cost-benefit study, because they convey little about the likelihood of certain program outcomes. For
this, Monte Carlo analysis can be helpful. This method can be used to examine multiple variables
simultaneously and simulate thousands of scenarios, resulting in a range of possible outcomes and the
probabilities that they will occur. Monte Carlo simulation repeatedly draws random values for each
model input to create a probability distribution of outcomes. The CBA results can then be expressed as
the estimated probability that the program will yield net benefits or as the range of forecasted net
present values within some confidence interval.
To illustrate, consider again the prison education program for first-time offenders. Suppose the
program cost varies by individuals’ needs but is known to range from $2,000 to $4,000, with a mean of
$3,000. Figure 15 depicts the probability distribution of net present values for 3,000 simulations of this
hypothetical program. The distribution indicates that the program is forecast to have a 60 percent
probability of achieving a positive net present value (i.e., a 60.60 percent “certainty” of net present
value results that are cost-neutral or better, colored blue). The 5th and 95th percentiles are marked as
vertical lines, indicating that the program has a 5 percent chance of a net present value exceeding
$283,063 and an equal probability of a net present value of less than −$175,702. A risk-averse agency
might therefore opt against making this investment in first-time offenders. Note, however, that the
calculus might change if the analysis included the program’s impact on employment earnings.
Monte Carlo simulations can be done with some effort using ordinary spreadsheet applications.
Special statistical software packages can be used to conduct the analysis in seconds, which can make
the procedure seem seductively simple. Recognize that Monte Carlo analysis increases data
requirements. The outcome probability distribution it produces is only as reliable as the model and the
variable distributions that serve as inputs, so if the effect-size estimate is biased, the Monte Carlo
results will be too.

Vera Institute of Justice 36
Figure 15. Monte Carlo analysis results for a hypothetical prison education program
Keep in Mind
Sensitivity analysis is part of making cost-benefit analysis transparent to others. Although the idea may
seem paradoxical, practitioners come across as more dependable when they explicitly address
uncertainty. A CBA report should clearly state its underlying assumptions, how estimates were
obtained, and where potential errors might exist.
Section V: Making CBAs Clearer and More Accessible Cost-benefit analyses can be difficult to understand, and the technical details of a study may be
complex and hard to follow. But analysts should strive to make their reports clear and accessible.
Doing so enhances the value of their work by making their studies more useful to policymakers as well
as other analysts. Figure 16 summarizes the recommendations that Vera’s Cost-Benefit Analysis
Methods Working Group made for improving the clarity of cost-benefit studies. (For more about the
working group, see “About This Paper” before the Table of Contents.)

Vera Institute of Justice 37
Figure 16. Ways to improve the clarity of a CBA
GENERAL RECOMMENDATIONS
Include a 1- to 2-page executive summary.
Include detailed appendices.
Define all CBA-related terms.
Define all criminal justice-related terms.
Provide a visual model (e.g., a diagram or flowchart) of the CBA.
DOCUMENTATION
Be explicit about which costs and benefits the analysis includes.
Describe the costs and benefits that have not been quantitatively measured/monetized.
Document the limitations of the analysis.
Document the details of the sensitivity analysis.
Share your CBA model in electronic format when feasible.
REPORTING RESULTS
Net present value is the preferred summary metric.
Tables and figures should be understandable on their own, independent of the text.
Costs and benefits should be shown in the same table.
Costs, benefits, and net benefits should be disaggregated by perspective.
General Recommendations
The working group made several recommendations to improve the clarity of cost-benefit methods and
results. First, begin a CBA with an executive summary. Write the executive summary for a
nontechnical audience and summarize the study’s main points and most important details. A good rule
is to write the executive summary under the assumption that the reader won’t have time to read the rest
of the report.
Don’t bog down the main body of a study with technical details. Instead, include a thorough set of
appendices with information such as assumptions underlying the study, derivations of costs and
benefits, modeling equations, data sources, and a glossary of key terms. Make the appendices
sufficiently detailed to allow others to see what you have done and to possibly re-create your work.
Define criminal justice and CBA-related terms, either in the main body of the text or in a sidebar or
glossary. Do not assume that every reader understands the terminology you use or defines terms
exactly as you do. Certain CBA terms (such as discounting, marginal costs, and effect size) have
commonly accepted definitions, but will be unfamiliar to some readers. And keep in mind that some
criminal justice terms can have different meanings. Statutory definitions for criminal offenses can vary
by jurisdiction, and recidivism can be measured in numerous ways. Well-defined terms will increase
the clarity of the analysis and help prevent inappropriate comparisons of results.

Vera Institute of Justice 38
Provide a visual representation of the CBA, such as a diagram or flowchart. Visuals depict the
relationships among resource investments (costs), outcomes, and the changes that occur as a result
(benefits) and serve to connect the dots for readers. Such visuals should clearly illustrate how the costs
of an initiative lead to the outcomes that generate benefits. Don’t make diagrams so complex or
detailed that they overwhelm readers.
Documentation
To paraphrase the Golden Rule, you should provide as much documentation for others as you would
want them to provide to you. This means that you should document all perspectives, program impacts,
marginal costs, shadow prices, assumptions, limitations, and data sources in the study. A CBA should
explain which costs and benefits have been included, by perspective, and which ones have not been
monetized and/or quantitatively measured. Acknowledge uncertainty by specifying how sensitivity
analyses were conducted and being up-front about any assumptions—including any reasonable
alternatives—that would affect the findings. Finally, when feasible, provide electronic copies of the
raw data, the CBA model (including any statistical coding), and any relevant information that can help
others understand, evaluate, replicate, or build on your work.
Reporting Results
Analysts can present CBA results in a number of ways, but some are clearer and more useful than
others. The consensus among cost-benefit analysts is that net present value, which is the sum of all
discounted costs and benefits over the lifetime of a program, is the correct summary metric.34
A
benefit-cost ratio (BCR) can identify whether a program has positive net benefits. But BCRs alone will
not provide sufficient information to decide among multiple programs with positive net benefits. The
program with the highest BCR may not yield the highest net benefits, the metric decision makers
should pay attention to. Some CBAs will report an internal rate of return (IRR), which is the discount
rate at which the program is cost-neutral. Compare the IRR with the current interest rate to determine
whether the projected benefits exceed the cost of borrowing capital. Like the BCR, the IRR won’t help
people compare programs, because it communicates nothing about net benefits. And a program may
have more than one IRR, a factor that is potentially confusing.
Because tables and figures are meant to highlight important information, some readers will tend to
skip over the text and refer directly to the visuals. Policymakers will naturally gravitate to the study’s
bottom line. CBAs should therefore feature a summary table showing the costs, benefits, and net
benefits for each perspective included. Tables and figures should be titled and include explanatory
notes to clarify, for example, the source of an input or the meaning of an axis label, row, or column
heading. See Figure 17 for an example of a thoroughly documented table of cost-benefit results.
34
Zerbe et al., 2010, p. 41.

Vera Institute of Justice 39
Figure 17. Example: Table of cost-benefit results
Source: Cindy Redcross, Megan Millenky, Timothy Rudd, and Valerie Levshin, More Than a Job: Final Results from the
Evaluation of the Center for Employment Opportunities (CEO) Transitional Jobs Program (Washington, DC: Office of
Planning, Research and Evaluation, Administration for Children and Families, U.S. Department of Health and Human
Services, 2012), OPRE Report 2011-18, p. 67.
Finally, when reporting results, it is important to remind readers that net benefits are not the same as
taxpayer savings. Net benefits include social benefits, productivity savings, and benefit transfers (that
is, monetary savings realized by an agency other than the one making the investment) that may not
translate into budgetary savings. Even benefits that accrue to taxpayers require budgetary actions or
decisions to go from theoretical gains on paper to actual cost savings.
Keep in Mind
Authors who communicate clearly about their decisions, their data, and their calculations make their
work more accessible. In so doing, they offer readers and decision makers a deeper, more nuanced, and
more meaningful look into a CBA and its results.

Vera Institute of Justice 40
Conclusion
Although CBA is a well-established economic method, its use in justice policy has not yet met its
potential. This white paper draws on the experience and recommendations of Vera’s Cost-Benefit
Methods Working Group about important conceptual and practical issues in conducting
justice-related CBA.
The paper examines five topics: selecting perspectives; predicting and measuring the impacts of
justice-system initiatives; monetizing justice-system initiatives; addressing uncertainty; and making
cost-benefit studies clearer and more accessible. The key recommendations:
Include taxpayer and victim perspectives, at a minimum, in an analysis. Discuss any relevant
perspectives that are excluded and the reasons for the exclusion.
Assess impacts beyond those to the criminal justice system.
Be careful to avoid bias and identification issues, which can threaten the validity of program
evaluation results.
Evaluate programs using an experimental design (random assignment) when feasible, and if it
is not, use quasi-experimental methods to create as plausible a counterfactual as possible.
A careful meta-analysis may be the best and easiest means to estimate effect sizes for criminal
justice programs that have already been evaluated extensively.
Use appropriate cost figures, being careful to use marginal costs rather than average costs for
policies that will affect government spending on the margin.
Include victim or societal cost-of-crime figures and state explicitly the source of the estimates.
Top-down estimates are more inclusive; if you use bottom-up estimates, be aware of the
important costs they fail to capture.
When reporting results, disaggregate and display the costs, benefits, and net benefits (or other
metrics) for each perspective included in the study.
Report the results of analysis as a net present value, which is the sum of all discounted costs
and benefits over the lifetime of the project.
Provide qualitative information about impacts and their monetary values when quantitative
information is unavailable or unreliable.
Apply sensitivity analysis; the study should present a range of possible scenarios and explain
the likely outcomes.
Strive to make reports clear and accessible.
Document thoroughly the assumptions, decisions, sources, data, methods, and calculations that
went into conducting the study. Provide enough information to help others evaluate and
understand your work, if not replicate it.
Because many questions pertaining to cost-benefit analysis in criminal justice lack clear right and
wrong answers, and because many challenges are associated with this work, this paper could have the
unintended effect of discouraging people from using CBA. We hope not. It may help to bear in mind
the axiom “Don’t let the perfect be the enemy of the good.” Even if not all costs and benefits can be
adequately evaluated, going through the disciplined thought process of conducting a CBA can yield
useful information and insights to aid in the decision-making process.
Vera Institute of Justice 41
The science behind CBA and justice program evaluation is dynamic. Our collective understanding
of how impacts can be measured and monetized is evolving, as is our information technology. On the
whole, these advances are improving the quality, quantity, and accessibility of data for CBAs, and
should reduce the uncertainty related to some inputs and the cost of conducting an analysis.
Cost-benefit analysis can provide useful information to help policymakers better understand the
consequences of criminal justice policies and programs and of their decisions. We hope the
information in this white paper will aid analysts if they run into practical and conceptual challenges
when conducting cost-benefit studies, and will help to increase the quantity and the quality of CBAs.

Vera Institute of Justice 42
Appendix: Regression Analysis
At its most basic, a regression model resembles the equation for a line, with the formula
. In this equation, is the outcome for the ith unit of analysis in the data, is the treatment
status for the ith unit of analysis in the data, is the average treatment effect (the average amount by
which treatment changes the outcome), and is the intercept (the average value of Y when
T is zero, that is, the average outcome for the comparison groups). The last term, , is the error term
for the ith unit of analysis, the residual variation in the outcome that is not explained by the treatment.
The error term is used to test the hypothesis that the average treatment effect is not equal to zero by
establishing the range of possible values for . An effect-size estimate with a range that does not
include zero is said to be statistically significant.
Certain conditions must be met for regression analysis to produce reliable effect-size estimates.
Ideally the error term is truly random. If the sign and magnitude of the error term systematically
changes over time or with different values of the Xs, a situation called heteroskedasticity, the test of
statistical significance may give an incorrect result because the range of possible values for is biased.
Multicollinearity refers to the situation in which two or more explanatory variables in the model are
moderately to strongly correlated with each other, creating a redundancy that increases the range of
possible values for . When the explanatory variables are correlated with the error term, a problem
known as endogeneity, both the range and estimated average effect size for will be biased.
Regression models typically include a number of independent variables so that the effect size is
estimated after taking into account—or controlling for—the variation in outcome that is explained by
other factors (such as education, criminal record, or drug addiction). Including additional factors
reduces the error term and can mitigate the problem of omitted variable bias, which is inaccuracy in an
effect-size estimate due to one or more important factors that are missing from the regression model,
affecting both participation and the outcome. For example, in estimating the recidivism effect size of a
voluntary DUI court, motivation to get sober is a key factor in whether a person elects to enter the
program as well as whether they complete it. Omitting the variable of motivation will bias the effect
size, making the program appear more effective than it is. Thus, the voluntary DUI court suffers from
selection bias like the survey on attitudes toward police cited in the section on non-experimental design
(see page 9).

Vera Institute of Justice 43
Glossary
Average cost: Total cost divided by the quantity of output. For example, the average cost of probation is
calculated by dividing total probation department expenditures by the average probation population.
Base-case scenario: A starting point, that is, a preliminary result based on plausible or best-estimate
assumptions about the value of inputs into the cost-benefit model. The base-case scenario is typically the
result on which one conducts sensitivity analysis.
Best-case and worst-case scenarios: A type of sensitivity analysis used to establish the upper (best-case)
and lower (worst-case) boundaries of a cost-benefit study’s results. A best-case scenario uses all of the
most-favorable assumptions about the program or policy’s outcomes; the worst-case scenario uses all of the
least-favorable assumptions.
Break-even analysis: A method of sensitivity analysis used to determine how great a policy’s impact must
be for its benefits to equal its costs. By definition, “breaking even” results in a net benefit of $0.
Comparison group: A group that serves as the counterfactual when estimating the effects of an
intervention using a quasi-experimental method. A comparison group should resemble the group exposed
to the intervention (the treatment group) as closely as possible, but unlike a control group it is not created
through random assignment.
Control group: A group that serves as the counterfactual when estimating the effects of an intervention
using an experimental design, which randomly assigns exposure to the intervention so that the intervention
is essentially the only difference between groups.
Contingent valuation: A method that uses surveys to estimate the monetary value of something that is not
commonly traded in the marketplace, such as environmental preservation or crime reduction. For example,
a contingent-valuation survey might ask individuals what they are willing to pay for a 10 percent reduction
in violent crime.
Cost-benefit analysis: A type of economic analysis that compares the costs and benefits of policies and
programs over a long term. The hallmark of CBA is that both costs and benefits are monetized, allowing
the comparison of initiatives with different purposes and outcomes.
Cost-of-illness approach: A method that measures tangible victim costs, such as medical costs and lost
earnings, using information from hospital databases and typical salary rates.
Counterfactual: A representation of the outcome that would have occurred in the absence of the
intervention being studied. See control group and comparison group.

Vera Institute of Justice 44
Difference-in-differences: An evaluation technique that estimates the treatment effect by subtracting the
change in the treatment group from the change in the comparison group before and after the intervention.
Discounting: This technique translates future costs and benefits into present-day values to account for the
time value of money. See time value of money.
Discount rate: A rate used to reduce or discount future costs and benefits to account for the time value of
money. The federal Office of Management and Budget (OMB) recommends both 3 and 7 percent discount
rates. The 3 percent rate is the rate of return for the average consumer. The 7 percent rate is OMB’s
estimate of the average rate of return for private investments.
Effect size: A measure of the magnitude of a policy or program’s effectiveness. In cost-benefit analysis,
the effect size is a key input for calculating the costs and benefits a policy generates.
Endogeneity: A bias that arises when a correlation exists between an explanatory variable and the error
term in a regression model. See omitted variable bias, selection bias, and simultaneity.
Experimental design: A research design in which treatment and control groups are created through a
random-assignment process.
General equilibrium effects: The effects of a program or policy on the economy as a whole.
Identification problem: A situation in which it is not possible to estimate the effect of a particular
variable, such as a program, on an outcome because other variables could explain the observed outcomes
equally well. This occurs frequently in the context of the inability to tease out the effect of individual
program components from the whole.
Instrumental variable: An instrumental variable is a variable whose only effect on the dependent variable
is through its effect on the treatment variable. Instrumental variables can be used to correct for endogeneity
in regression analysis. See endogeneity.
Intent-to-treat effect: The estimated treatment effect for all subjects assigned to a program, including
individuals who drop out or are noncompliant.
Hedonic pricing: A technique to estimate the dollar value of items that are not commonly traded in the
marketplace, by measuring their impact on the prices of market goods, often real estate. Hedonic pricing
can be used to estimate the value of crime by measuring how changes in crime rates affect local property
values, for instance.
Intangible costs: Costs that cannot be measured directly in dollar terms. Examples of intangible costs
include pain and suffering, lost confidence in the justice system, and reduced quality of life.

Vera Institute of Justice 45
Jury-compensation method: A method to estimate the intangible costs of crime using the money awarded
to victims by juries.
Marginal cost: The amount of change in total cost when output changes by one unit. In the context of the
criminal justice system, it is the amount the total operating costs of an agency change when workload (such
as arrests, court filings, or jail intakes) changes because of a policy or program.
Meta-analysis: A method of estimating a program’s impact by aggregating results from numerous studies.
Monte Carlo analysis: A type of sensitivity analysis that examines multiple variables simultaneously and
simulates thousands of scenarios, resulting in a range of possible outcomes and the probabilities that they
will occur.
Non-experimental design: A method of research that creates treatment and control groups without
attempts to control for differences between the groups.
Omitted variable bias: A bias that occurs when a model leaves out one or more important explanatory
variables. The treatment effect is confounded with the effect of the missing variable, leading to over- or
under-estimation of the true effect.
Opportunity cost: The value of the best forgone alternative use of a resource.
Partial-sensitivity analysis: A type of sensitivity analysis in which the value of only one variable is
changed while holding the values of other variables constant to see how much cost-benefit analysis results
change in response.
Perspectives: Used to describe parties—such as taxpayers and crime victims—whose costs and benefits
are included in a cost-benefit analysis. It is also said that perspectives included in an analysis have
standing.
Pre-test and post-test comparisons: A comparison of the same group before and after some treatment or
intervention.
Quasi-experimental design: A type of research that uses a variety of statistical methods to create a
treatment group and a comparison group and that simulates an experimental design.
Regression analysis: A statistical technique used to model how changes in one or more variables, called
independent variables, affect an outcome of interest, called the dependent variable. In cost-benefit analysis,
this technique can be used to estimate marginal costs.

Vera Institute of Justice 46
Regression discontinuity: A quasi-experimental design that estimates the causal effects of an intervention
by comparing outcomes for individuals who fall immediately below and above a threshold that determines
assignment into treatment and control groups.
Selection bias: A bias that occurs when assignment to a program is influenced by a factor that also affects
the outcome of interest. For example, participation in many correctional programs is conditional on good
behavior, confounding estimation of the effect of the program itself on behavior.
Shadow prices: Estimates of the dollar value of intangible costs and benefits that cannot be directly
measured. See contingent valuation, hedonic pricing, and jury compensation method.
Simultaneity: In regression analysis, simultaneity refers to the problem of a dependent variable and an
explanatory variable being jointly determined. For example, the size of a police force can affect the amount
of crime, but the amount of crime can also affect the size of a police force.
Standing: See perspectives.
Statistical power: The probability that a statistical test will reject the null hypothesis when the null
hypothesis is false. It is a measure of the sample size required to be confident that an effect, if present, will
be detectable.
Statistical significance: An effect size is called statistically significant if the estimate for the study
population is highly unlikely, usually 5 percent chance or less, to be observed if the true effect size
is zero.
Tangible costs: Costs that can be measured directly in dollar terms. Tangible costs to crime victims include
medical expenses, property damage and loss, and lost wages.
Time frame: The period over which benefits and costs are assessed.
Time horizon: See time frame.
Time value of money: The concept that money is worth more today than in the future because people
prefer to spend now rather than later and because today’s dollar can be invested for a profit.
Victimless offense: An action that has been ruled illegal but does not directly violate or threaten the rights
of another individual. In the United States, victimless crimes include prostitution, gambling, and drug use.

Vera Institute of Justice 47
Acknowledgments
The author would like to thank the Bureau of Justice Assistance for generously supporting this effort
and Vera’s Cost-Benefit Knowledge Bank for Criminal Justice (CBKB) as a whole. The CBKB staff is
also grateful to the economists and justice-system practitioners—some of whom we are fortunate
enough to count as advisers and friends—who have made important advances in cost-benefit analysis
through their collaborations. A note of gratitude is also due Tina Chiu and Jules O. Verdone for such
thorough review of the document. The author would especially like to thank the Cost-Benefit Methods
Working Group members for their many valuable contributions to this publication, from thoughtful
input about the content and objectives of the white papers at the initial roundtable meeting to
constructive comments throughout the drafting and review processes.
The Cost-Benefit Knowledge Bank for Criminal Justice is a project of Vera’s Cost-Benefit Analysis
Unit and is funded by the U.S. Department of Justice’s Bureau of Justice Assistance. CBKB helps to
broaden the knowledge base of practitioners and policymakers about criminal justice cost-benefit
analysis, deepen the knowledge and practice in this area, and support practitioners in building their
capacity to promote, use, and interpret cost-benefit analysis in criminal justice settings.
Vera’s Cost-Benefit Analysis Unit provides policymakers with clear, accessible information on
the economic pros and cons associated with criminal and juvenile justice investments so that they can
identify effective, affordable interventions for their jurisdictions and allocate resources accordingly.
The Vera Institute of Justice is an independent nonprofit organization that combines expertise in
research, demonstration projects, and technical assistance to help leaders in government and civil
society improve the systems people rely on for justice and safety.
This project is supported by Grant No. 2009-MU-BX K029 awarded by the Bureau of Justice
Assistance. The Bureau of Justice Assistance is a component of the Office of Justice Programs, which
also includes the Bureau of Justice Statistics, the National Institute of Justice, the Office of Juvenile
Justice and Delinquency Prevention, the Office for Victims of Crime, the Community Capacity
Development Office, and the Office of Sex Offender Sentencing, Monitoring, Apprehending,
Registering, and Tracking. Points of view or opinions in this document are those of the author and
do not necessarily represent the official position or policies of the U.S. Department of Justice.

Vera Institute of Justice 48
Suggested Citation
Carl Matthies, Advancing the Quality of Cost-Benefit Analysis for Justice
Programs. New York: Vera Institute of Justice, 2014.