
Advancing comfort technology and analytics to personalize ...
119
Advancing comfort technology and analytics to personalize thermal experience in the built environment By Jihyun Kim A dissertation submitted in partial satisfaction of the requirements for the degree of Doctor of Philosophy in Architecture in the Graduate Division of the University of California, Berkeley Committee in charge: Professor Gail Brager, Chair Professor Stefano Schiavon, Professor Edward Arens Professor Joan Walker Spring 2018
Transcript of Advancing comfort technology and analytics to personalize ...
Advancing comfort technology and analytics to personalize thermal experience in the built environment
By
Jihyun Kim
A dissertation submitted in partial satisfaction of the
requirements for the degree of
Doctor of Philosophy
in
Architecture
in the
Graduate Division
of the
University of California, Berkeley
Committee in charge:
Professor Gail Brager, Chair Professor Stefano Schiavon,
Professor Edward Arens Professor Joan Walker
Spring 2018

Advancing comfort technology and analytics to personalize thermal experience in the built environment
© 2018
By Jihyun Kim

1
Abstract
Advancing comfort technology and analytics to personalize thermal experience in the built environment
by
Jihyun Kim
Doctor of Philosophy in Architecture
University of California, Berkeley
Professor Gail Brager, Chair
Nearly 60% of global energy consumption in buildings is used for space heating and cooling to provide occupant comfort. Yet, a large portion of occupants are dissatisfied with the buildings’ thermal environment. There are many reasons for thermal dissatisfaction in buildings, but a fundamental cause is the current practice of delivering uniform thermal conditions based on universal rules, without accounting for individual differences in comfort requirements. To address these issues, a growing body of research has emerged to better reflect individual’ comfort requirements. This dissertation contributes to this research by providing the following primary innovations: 1) Internet-connected personal comfort system (PCS) and 2) personal comfort models that can help to deliver personalized comfort experiences in occupied spaces. In particular, I developed and field-tested the new capabilities of PCS (data reporting, wireless connectivity) that could support individualized learning and coordinated controls with other building systems. I also proposed a new framework for thermal comfort modeling – personal comfort models that can predict individuals’ thermal comfort, instead of the average response of a large population, using Internet of Things and machine learning. As a practical use case, I developed a set of personal comfort models using the PCS field study data to demonstrate how the proposed framework can be implemented. The results showed that personal comfort models produced superior accuracy over conventional comfort models (PMV, adaptive) and that PCS heating and cooling control behavior was a strong predictor of individuals’ thermal preference and could be used as an individualized comfort feedback for HVAC controls. The results of this dissertation showed a synergistic effect between PCS and personal comfort models that could enable occupant-centric comfort management in buildings.

i
Dedication
To my Lord and Savior Jesus Christ, in whom all things are possible. To my parents and husband, for their unconditional love and support during this journey.

ii
Acknowledgements
This dissertation would not have been possible without the help, support, and guidance of numerous people. My sincere gratitude goes to my committee, Professors Gail Brager, Stefano Schiavon, Edward Arens, and Joan Walker, for helping me to develop research ideas and challenging me to achieve more than I thought I could during my dissertation work.
I am also grateful to my project team: Fred Bauman, Paul Raftery, Hui Zhang, and Yongchao Zhai at the Center for the Built Environment for their collaboration and help throughout the field studies, which was crucial for the success of this dissertation; Michael Andersen, Gabe Fierro, Professor David Culler, Sam Kumar, Francisco Peralta, Justin Palmer, and Noah Pitts for their brilliant contributions to the making and testing of Personal Comfort System chairs; Andy Jain, Gary Behrens, Win Maung, and Domenico Caramagno for their support and assistance with the field study facilities; and the individuals at the San Mateo County and Sutardja Dai Hall buildings who kindly agreed to participate in the field studies.
Finally, I would like to acknowledge the support from my friends and family: Caroline Karmann, Dove Feng, Rongxin Yin, Yuxun Zhou, Soazig Kaam, and Wonhee Ko – whose friendship made my academic pursuit enjoyable; Joyce Park and Eric Gee for their generosity and sacrifice during my transition from maternity leave; my brother and sister, Sam and Sarah Kim for always believing in me; my parents, Iksoo and Hwaok Kim for their love and prayers during the long years of my education; my husband, Peter Lai who never ceased to support and cheer me through all the ups and downs of this PhD journey and my two lovely daughters who made this process fun and meaningful.
This research was supported by the California Energy Commission (CEC) Public Interest Energy Research (PIER) Buildings Program. Partial funding was also provided by the Center for the Built Environment, University of California, Berkeley.
iii
TABLE OF CONTENTS
1. Introduction .......................................................................................................... 1 1.1 Background – comfort prediction and control ........................................................... 2 1.2 Statement of the problem ......................................................................................... 4 1.3 Objectives ................................................................................................................. 5 1.4 Dissertation overview ................................................................................................ 5
2 A field study with Internet-connected PCS ........................................................... 6 2.1 Background ............................................................................................................... 6 2.2 Methods .................................................................................................................... 7 2.3 Results .................................................................................................................... 12 2.4 Discussion .............................................................................................................. 25 2.5 Summary ................................................................................................................ 29
3 A framework of personal comfort models ........................................................... 31 3.1 Background ............................................................................................................. 31 3.2 Problem definition ................................................................................................... 31 3.3 Personal comfort models ........................................................................................ 33 3.4 A modeling framework ............................................................................................ 36 3.5 Integration into thermal controls ............................................................................. 44 3.6 Discussion .............................................................................................................. 46 3.7 Summary ................................................................................................................ 49
4 Developing personal comfort models using occupant heating and cooling behavior ..................................................................................................................... 51 4.1 Background ............................................................................................................. 51 4.2 Methods .................................................................................................................. 55 4.3 Results and discussion ........................................................................................... 61 4.4 Limitations ............................................................................................................... 70 4.5 Summary ................................................................................................................ 70
5 Overall discussion .............................................................................................. 72 5.1 Lessons learned ..................................................................................................... 72 5.2 Implications for comfort management in buildings .................................................. 73 5.3 Additional considerations for building design and control ....................................... 77 5.4 Future research suggestion .................................................................................... 78
6 Conclusions ........................................................................................................ 80 Reference .................................................................................................................. 81 Appendix A: PCS hardware and software ................................................................. 94 Storm controller overview ................................................................................................... 94 Chair Control Circuitry ........................................................................................................ 95 Firmware ............................................................................................................................. 97 Software stack .................................................................................................................. 102
Appendix B: Background survey ............................................................................. 104 Appendix C: Daily (right-now) survey ...................................................................... 107
iv
LIST OF FIGURES
Figure 2-1. PCS chair designed and developed by the Center for the Built Environment and the Department of Electrical Engineering and Computer Sciences at the University of California, Berkeley. The images show hardware and heating and cooling elements of the chair, the new controller with wireless connectivity, and the newly designed user interface that allows separate control of seat and back heating/cooling. ......................................................................... 8
Figure 2-2. (a) San Mateo County office building, the southwest façade. (b) A field study subject in an open-plan office, seated in a PCS chair. ............................. 10
Figure 2-3. Timeline for PCS deployments at San Mateo County office building. ..... 10
Figure 2-4. Example of continuous PCS chair data of a subject between 7am and 7pm. Tair refers to indoor dry-bulb air temperature measured via the temperature sensor embedded in the PCS chair. The location of heating and cooling shown here refers to either the back or the seat. ........................................................... 12
Figure 2-5. (a) Distribution of indoor air temperature measured at each subject’s workstation during the field study period. The mean values are marked with a red dot. (b) Hourly distribution of indoor air temperature over the field study duration, shown in 25-75th (red line) and 5-95th (grey line) percentile ranges. (c) Density curves of the difference in temperature measurements by distributed sensors at the subjects’ workstations vs. zonal thermostats. There were 19 workstations in the Interior zone and 18 workstations in the perimeter zone. ............................. 14
Figure 2-6. Distribution of thermal acceptability (a) and thermal preference (b) votes from daily surveys by all 37 subjects during the field study period. The total survey counts were 4655. (c) The relative frequency of thermal preference votes for each of the thermal acceptability categories. ................................................ 16
Figure 2-7. (a) Boxplots of the aggregated thermal preference votes (i.e., ‘no change’, ‘want cooler’, ‘want warmer’) from all subjects over coincident indoor temperatures. (b) Multinomial logistic regression curves for thermal preference categories over indoor temperature. The dotted line represents Preferred Ta, which is the temperature at which the probability of voting for ‘no change’ is highest. The distribution of thermal preference votes over coincident indoor temperatures is shown at the top. ...................................................................... 17
Figure 2-8. Multinomial logistic regression curves for thermal preference votes over indoor temperatures for individual subjects. ....................................................... 18
Figure 2-9. (a) Boxplots of the aggregated thermal acceptability votes (i.e., ‘acceptable’, ‘slightly acceptable’, ‘slightly unacceptable’, ‘unacceptable’) from all

v
subjects over coincident indoor temperatures. (b) Multinomial logistic regression curves for thermal acceptability categories over indoor temperature. ................ 19
Figure 2-10. Distribution of PCS control modes (i.e., ‘heating’, ‘cooling’, ‘both’, ‘none’) showing relative chair usage by all and each subject during the field study period. ................................................................................................................ 20
Figure 2-11. (a) Boxplots of the aggregated PCS control usage (i.e., ‘none’, ‘cooling’, ‘heating’, ‘both’) from all subjects over coincident indoor temperatures. (b) Multinomial logistic regression curves for PCS control modes over indoor temperature. ....................................................................................................... 21
Figure 2-12. (a) Relative frequency of heating and cooling switch-on behavior by the subjects. Only the instances where the subjects intentionally turned on heating/cooling were plotted. I excluded the instances where the chair software automatically turned on heating/cooling based on the previously stored setting. (b) Relative frequency of heating and cooling switch-on behavior by hour of day and seasons (warm vs. cool). The warm season includes Jun-Aug, and the cool season includes Apr-May and Sep-Oct. ............................................................. 22
Figure 2-13. (a) Frequency of thermal preference votes from all subjects overlaid with coincident PCS control modes (i.e., ‘heating’, ‘cooling’, ‘both’, ‘none’). (b) Frequency of thermal acceptability votes from all subjects overlaid with coincident PCS control modes. .......................................................................... 23
Figure 2-14. Mean control intensity (recorded in 0-100%) of PCS heaters and fans across all subjects used at the time of survey for each of thermal preference categories (i.e., ‘want warmer’, ‘want cooler’, ‘no change’). ............................... 24
Figure 2-15. Distribution of (a) satisfaction rating with PCS heating or cooling, (b) reasons for PCS cooling use, and (c) reasons for PCS heating use. The data is based on the subjects’ responses to the questions asked only when they were using their PCS chair at the time of daily survey. The subjects were allowed to select more than one in multiple choices for (b) and (c). .................................... 25
Figure 3-1. Modeling process of personal comfort models ........................................ 37
Figure 3-2. Examples of thermal comfort scales (Adopted from ISO 10551 (ISO, 1995)) ................................................................................................................. 40
Figure 3-3. Example of model convergence. RMSE refers to the root mean square error of predicted vs. observed thermal sensation votes. In the legend box, ‘Personal’ refers to the proposed personal comfort models in (Auffenberg et al., 2015); ‘Adaptive’ refers to the ASHRAE-55 adaptive model; and ‘PMV’ refers to the Predicted Mean Vote model. ........................................................................ 43

vi
Figure 3-4. System architecture for occupant-responsive environmental control ...... 46
Figure 4-1. Example of continuous PCS chair data of a subject between 7am and 7pm. Tair refers to indoor air temperature measured via the temperature sensor embedded in the PCS chair. The location of heating and cooling shown here refers to either the back or the seat. ................................................................... 56
Figure 4-2. Graphical definition of receiving operating characteristic curve. ............. 60
Figure 4-3 (a) Distribution of prediction accuracy across all subjects for each modeling method. The top boxplots six represent personal comfort models. The bottom two represents conventional comfort models. The boxplots are ordered by the decreasing order of mean AUC, marked as a red circle. The dashed line indicates a reference line for random guessing. (b) Distribution of prediction accuracy across all subjects grouped into personal comfort models and conventional comfort models (labeled as “Personal models” and “Conventional models” respectively). ........................................................................................ 64
Figure 4-4. Learning curve of individual subjects’ personal comfort models expressed as the derivative of mean AUC with respect training data size (shown in dashed lines). The solid line is the local polynomial regression (LOESS) fit to aggregated mean AUC of all subjects’ models over training data size. The boxplot shows the distribution of the training data size at which the individuals’ model first converged. ......................................................................................................... 65
Figure 4-5. Learning curve of each subject’s personal comfort model expressed as a function of mean prediction accuracy over training data size. The shadow indicates the confidence interval of cross-validated AUC. ................................. 67
Figure 4-6 (a) Prediction accuracy of model runs with different variable combinations. The variable combinations are constructed by accumulatively adding features from each variable groups until all features in the database are included in the model. (b) Prediction accuracy of separately evaluated variable groups (PCS control behavior, date/time, HVAC system, outdoor environment, and indoor environment). Clothing insulation is not included since a fixed value (0.6) was used in all model runs. Bar plots and error bars indicate the average and standard deviation of AUC across all subjects respectively. .............................. 69
Figure 5-1. Example scenarios of the control integration of PCS and personal comfort models in a shared thermal zone. Individually, PCS and personal comfort models can each improve this situation. ............................................... 74
Figure 5-2. Example of data-driven temperature controls in a VAV zone shared by two PCS users (b), based on preferred and acceptable comfort temperatures predicted from their personal comfort models (a). The scenario is based on the

vii
field data collected during summer months and illustrates the adjustments that can be applied to the cooling temperature setpoint in the shared VAV zone. .... 76

viii
LIST OF TABLES
Table 2-1. Statistical summary of the field conditions (indoor and outdoor) during occupied hours excluding weekends and holidays. ........................................... 13
Table 2-2. One-way ANOVA test results for 3 thermal preference categories (dependent variable: Indoor temperature). ......................................................... 16
Table 2-3. One-way ANOVA test results for 4 thermal acceptability categories (dependent variable: Indoor temperature). ......................................................... 19
Table 2-4. One-way ANOVA test results for 4 PCS control modes (dependent variable: Indoor temperature). ............................................................................ 21
Table 3-1. Summary of major studies of personal comfort models. .......................... 34
Table 3-2. Examples of data types and collection methods* for personal comfort models ................................................................................................................ 37
Table 4-1. Statistical summary of field conditions (indoor and outdoor) across all subjects during occupied hours excluding weekends and holidays. .................. 56
Table 4-2. Description of features used for personal comfort models. ...................... 57
Table 4-3. Performance criteria and measures used for model evaluation ............... 60
Table 4-4. Predictive performance of personal comfort models and conventional comfort models across all subjects. Prediction accuracy and variability are expressed as the mean and standard deviation (shown in brackets) of all cross-validated AUC respectively. ............................................................................... 61

1
1. INTRODUCTION
Buildings consume over one-third of final energy consumption in the world, and nearly 60% of global energy consumption in buildings is used for space heating and cooling to provide occupant comfort (IEA, 2013). Despite this, a large portion of occupants are dissatisfied with the buildings’ thermal environment. According to a survey of 144 buildings across the United States, Canada, Europe and Australia (Altomonte and Schiavon, 2013; Karmann et al., 2017), only 44% of surveyed buildings manage to achieve the modest goal of 80% thermal satisfaction set by standards (ANSI/ASHRAE, 2013).
There are many reasons for thermal dissatisfaction in buildings (e.g., overcooling, overheating), but a fundamental cause is the current practice of delivering uniform thermal conditions based on universal rules, without accounting for individual differences in comfort requirements. Thermal comfort is a subjective phenomenon influenced by a range of factors, and it can differ widely between individuals. Hence, it is unreasonable to expect everyone to be satisfied in a uniformly conditioned space even if the conditions meet current standards (van Hoof, 2008). Yet, most buildings lack a systematic approach to incorporate occupant feedback into thermal controls, nor do they provide means for individuals to modify their own thermal environment.
To address these issues, a growing body of research has emerged to better reflect individual’ comfort requirements in everyday comfort management. In particular, this research leverages recent developments in the Internet of Things (IoT) and machine learning to personalize comfort experience in occupied spaces. This dissertation contributes to this research by providing the following primary innovations and contribution to knowledge:
1) Internet-connected Personal Comfort Systems (PCS) – a comfort technology, which decentralizes heating and cooling control for individual occupants, with new capabilities to report individual-specific comfort data and interact with central systems to provide coordinated thermal controls.
2) Personal Comfort Models – a new modeling approach for thermal comfort that learns individuals’ comfort requirements directly from data collected in their everyday environment, and produces accurate comfort predictions to inform control decisions of thermal conditioning systems.
Through these, I attempt to move the building industry towards occupant-centric comfort management and empower occupants to have a voice and take control of their own thermal comfort in the built environment.

2
1.1 BACKGROUND – COMFORT PREDICTION AND CONTROL
UNIVERSAL APPROACH TO COMFORT PREDICTIONS
There are two main models that underpin the current practice of comfort management in buildings: predicted mean vote (PMV) and adaptive models. The PMV model treats thermal comfort as a physical-physiological phenomenon and expresses human thermal sensation as an outcome of the heat transfer between a human body and its surrounding environment. It is the most widely accepted model, developed from extensive laboratory experimental data analyzed by Fanger (1970). In contrast, adaptive models account for people’s inherent ability to adapt to variable environment conditions in naturally-conditioned buildings by drawing a linear relationship between comfortable indoor temperature and prevailing outdoor temperature based on global field study data (de Dear and Brager, 1998; Nicol and Humphreys, 2002). Both models are adopted into the international standards (ANSI/ASHRAE, 2013; CEN, 2007; ISO, 2005), shaping thermal conditions of buildings around the world.
The underlying assumption of both PMV and adaptive models is that they can determine a ‘comfortable” thermal environment to satisfy thermal comfort of the majority of occupants (i.e., 80%). The problem is that both models define ‘comfort’ based on the average response of large populations; as such, their accuracy decreases when individuals’ thermal comfort responses differ from the population mean. Moreover, they rely on a single model to predict comfort for all situations, failing to account for other factors and relationships that may influence occupants’ thermal comfort. For over half a century, comfort research and provisions have focused on “the search for a universally applicable set of optimum comfort conditions” (Cole et al., 2008). Human thermal comfort is highly individual-specific and context-sensitive; hence, it is impossible to predict everyone’s comfort with a one-size-fits-all approach.
PERSONALIZED APPROACH TO COMFORT PREDICTIONS
The building industry would benefit from different approaches to modeling comfort for everyday comfort management. With the advent of IoT and data opportunities, efforts are underway to investigate the possibility of learning about individuals’ thermal comfort requirements, and predicting their comfort needs, directly from data collected in their everyday environment. I term the output of these efforts as personal comfort models (defined in more detail in Chapter 3). This new modeling approach can fundamentally change today’s generic, ‘one-size-fits-all’ comfort management by making individual-specific and context-relevant comfort predictions available for occupant-centric environmental control.
In recent years, there have been an increasing number of publications on the topic of personal comfort models (summarized in Chapter 3). Interestingly, many of these efforts did not originate from the traditional thermal comfort research, but rather

3
consist of independent work across various academic disciplines as well as industry organizations. However, the efforts to date have been quite fragmented across a wide range of disciplines and display significant variations in their approach from each other, as well as from traditional thermal comfort research. Therefore, it is necessary to establish a unified framework for personal comfort models to understand the variety of activities on this topic and provide guidance for future efforts in this emerging research area.
PERSONAL HEATING AND COOLING CONTROLS
A paradigm shift is taking place in the building industry which will ultimately move our focus from centralized to personal control (Brager et al., 2015). Various types of PCS will be at the heart of this paradigm shift by providing individual occupants means to control heating and cooling within their own workstation to meet their comfort needs. PCS comes in many different forms including desktop fans, heated and cooled chairs, heated and cooled desktop surfaces, and foot and leg warmers. These devices specifically target sensitive body parts to leverage their influence on the whole-body thermal comfort (Arens et al., 2006).
PCS has proven to have substantial power to correct an individual’s temperature from a too-warm or too-cool condition toward a comfortable (thermally neutral) condition (Zhang et al., 2015b). This is supported by a substantial number of laboratory studies so far, and a limited number of long-term field studies. The field study results have been very positive from a comfort perspective. Moreover, PCS presents an opportunity to reduce energy consumption in buildings. Well-designed PCS uses very low energy to provide heating and cooling – almost negligible compared to the energy use of conventional space-based HVAC (heating, ventilation, and air conditioning) systems; hence, its impact on the overall building energy is small. Because local cooling and heating via PCS can improve thermal satisfaction and lead to higher tolerance of temperature excursions (Melikov and Knudsen, 2007; Watanabe et al., 2009; Zhang et al., 2010c, 2010b; Zhai et al., 2013), an extended range of acceptable ambient temperatures can allow building operators to widen thermostat temperature setpoints of the central HVAC systems to save significant amounts of energy (Hoyt et al., 2015a; Schiavon and Melikov, 2008). However, this range varies among PCS device types and individuals. In addition, not everyone in the building may have PCS or use it at the same time. Therefore, a uniform adjustment to the acceptable temperature range due to PCS across the building space may face some practical challenges. In order to operationalize PCS’s potential energy savings, we need to first understand the impact of PCS on individuals’ thermal comfort, and then develop control strategies that leverage the extended individual’s comfort range afforded by PCS.

4
CONNECTING PCS TO THE INTERNET OF THINGS
To unlock the full potential of PCS, I undertook extensive hardware and software upgrades of the existing PCS devices (Arens et al., 2015; Pasut et al., 2015) along with a group of researchers at University of California, Berkeley and added new capabilities including data logging and wireless connectivity (Andersen et al., 2016b). As a result, these PCS devices can now share information and interact with other building systems. With these changes, PCS does not need to operate in isolation but can work with other building systems to deliver coordinated comfort solutions in the built environment to improve both occupant comfort and energy performance.
The first PCS device that received these new capabilities is the heated and cooled chair (referred to as PCS chairs from here on) (Bauman et al., 2017). The PCS chairs have fans and heating strips embedded into the chair back and seat, consume extremely small energy (14 W at max), and operate on a chargeable battery. The newly updated PCS chairs can record continuous streams of data, such as heating and cooling usage, chair occupancy, and environmental conditions. The advantage of PCS data is that it can be traced to specific individuals; hence, one can learn about individuals’ thermal control behavior and preferences from the data. Such knowledge can enable intelligent comfort management in both new and existing buildings to provide ‘just the right’ amount of conditioning to meet occupant needs, in contrast to the over-conditioning that results from tight setpoint ranges. Moreover, the software stack developed for the PCS chairs allows interaction between PCS and BAS (building automation system) on the same communication platform via the Internet. Hence, the intelligence built on PCS data can turn into actionable feedback for HVAC controls to improve occupant comfort and energy performance in buildings.
1.2 STATEMENT OF THE PROBLEM
Both Internet-connected PCS and personal comfort models present innovative paths to personalized comfort in the built environment. Together, they can create a synergistic effect by generating person-specific comfort data and intelligence respectively to enable occupant-centric comfort management. However, additional research is needed to address the following problems.
1) Internet-connected PCS: There is a need to test and evaluate the new capabilities of PCS in real-world settings with real users. Also, there is a need to assess the value of PCS use data – how it can improve our understanding of occupant comfort and make informed control decisions to employ PCS as effectively as possible.
2) Personal comfort models: There is a need for a unified framework for personal comfort models to understand the various modeling approaches on this topic and provide a systematic approach to model development and guidance for real-world applications. Moreover, there is a need to demonstrate the use of such a framework through modeling examples using real-world data.

5
1.3 OBJECTIVES
The objectives of this dissertation are to:
• Test Internet-connected PCS chairs through a field study with human subjects. • Evaluate the importance of PCS data by assessing its ability to describe
occupant thermal comfort and behavior in everyday environments. • Develop a unified framework for personal comfort models, which includes:
o a review of the current state of research on personal comfort models o definitions, concepts, and methods for modeling and evaluation o system architecture for thermal control integration o a discussion of model applications in building design, control, and
standards • Demonstrate the use of the proposed framework by developing personal
comfort models using PCS data.
1.4 DISSERTATION OVERVIEW
• Chapter 2 describes the new PCS technologies and field study methods, and present findings from the analysis of PCS data collected from the field study.
• Chapter 3 introduces the proposed framework for personal comfort models. • Chapter 4 provides an example of personal comfort models developed with
PCS data using the methods described in the proposed framework. • Chapter 5 provides a final discussion of the two innovations presented in this
dissertation – Internet-connected PCS and personal comfort models, and suggests directions for future research.

6
2 A FIELD STUDY WITH INTERNET-CONNECTED PCS
2.1 BACKGROUND
Technological advances are accelerating innovations in buildings, helping us to reimagine how we provide thermal comfort in the built environment. Personalized yet customizable user-experience is no longer a requirement of just the online world. Buildings are also expected to provide smart comfort solutions that take occupant feedback and deliver a customized environment to meet the unique requirements of individual occupants. However, there is a limit to how much a centralized system can do to satisfy everyone with the traditional approach of providing uniformly conditioned air to shared spaces in a building with a single controlled set-point.
Personal Comfort Systems (PCS) offer an alternative or complementary solution to centralized systems by allowing a highly customizable microclimate zone in an occupant’s workstation without affecting others in the same space. With PCS, individuals can use personal control to provide local heating and cooling to meet their comfort needs and desires. Hence, it can also be used to provide individualized comfort solutions in naturally-conditioned buildings. PCS comes in many different forms including fans (Arens et al., 1998; Schiavon et al., 2017), heated and/or cooled chairs (Watanabe et al., 2009; Melikov and Knudsen, 2007; Pasut et al., 2015), and foot warmers (Zhang et al., 2010b; Oi et al., 2011; Zhang et al., 2015a). These devices specifically target sensitive body parts (e.g., head, feet) to leverage their influence over whole-body thermal comfort (Arens et al., 2006). Applying local heating and cooling to sensitive body parts can not only restore comfort but also elicit pleasant sensations, a process termed “alliesthesia”, (Zhang et al., 2015b; Brager et al., 2015; Parkinson and de Dear, 2015, 2016). This shifts the focus of comfort provision from minimizing discomfort to providing delightful experiences (Heschong, 1979; Erwine, 2016). Another benefit of PCS is the extended range of acceptable ambient temperatures, which allows central HVAC systems to operate in wider temperature setpoints, leading to significant energy savings (Sekhar, 1995; Hoyt et al., 2015b; Veselỳ and Zeiler, 2014; Zhang et al., 2015b).
PCS provides a wealth of data that can be traced to specific individuals. With the introduction of Internet-connected PCS chairs by the Center for Built Environment (CBE), University of California, Berkeley (Andersen et al., 2016b), we now have access to a continuous stream of heating and cooling usage data, along with occupancy status and environmental measurements (e.g., air temperature, relative humidity) via embedded sensors. This presents a unique opportunity to learn individuals’ thermal control behavior and comfort preferences. Such knowledge can enable intelligent comfort management in both new and existing buildings to provide ‘just the right’ amount of conditioning to meet occupant needs, in contrast to over-conditioning that results from tight setpoint management. The PCS chairs can communicate and interact with building automation systems (BAS) via Internet.

7
Therefore, the intelligence built on PCS chairs can turn into actionable feedback for HVAC (heating, ventilating, and air conditioning) operations to optimize occupant comfort and energy use in buildings.
In summer 2016, I carried out the first field study with Internet-connected PCS chairs involving 37 occupants in an office building located in northern California (Bauman et al., 2017). To our knowledge, it is the largest field study ever conducted with PCS. The objective of this field study was to (1) evaluate the new capabilities of PCS chairs via human subject testing in a typical office environment; and (2) improve our understanding of occupant comfort and behavior through the analysis of PCS data. In this chapter, I describe the field study methods and a novel dataset that measures continuous PCS usage and local environmental conditions. I then report the results of my field data analysis that examine the relationship between occupant behavior, comfort, and environment of PCS users. Lastly, I summarize key insights drawn from the analysis that would benefit comfort analytics and building controls, as well as areas for improvement for PCS chairs.
2.2 METHODS
INTERNET-CONNECTED PCS CHAIRS
The Internet-connected PCS chairs have the following technological components:
Chair hardware: At the base, we used the same physical chair previously developed by CBE (Arens et al., 2015; Pasut et al., 2015) – a mesh-type office chair with three fans and two heating strips integrated into the seat and back (Figure 2-1). The heating strips use a maximum of 14 W. The fans use a maximum of 3.6 W. A 168 Wh battery powers the chair, which lasts for several days with average use. The chair has a contact switch underneath the seat which closes when the user sits down, providing chair occupancy information. This switch is also used to conserve battery power by automatically turning off heating strips and fans when the chair is unoccupied. The previous heating and cooling settings are restored when the user returns to the seat. The maximum surface temperature of the heating strips is 40 °C, which is lower than the body’s heat pain thermoreceptor threshold (43 °C), and the fans use ambient air, not cooled air, to create cooling effects. These features help to avoid potential discomfort that could result from overheating or overcooling.
Digital controller: Previous designs used an analog controller to enable local control of heating and cooling. I replaced this with a digital controller with new capabilities including: (1) supporting wireless telemetry and remote actuation via IEEE 802.15.4 radio and Bluetooth (an external antenna is added to the controller to improve signal range); (2) logging data locally when wireless connectivity is lost and uploading it when connectivity is restored; (3) measuring air temperature and relative humidity at the chair location as well as chair occupancy status via embedded sensors; (4)

8
allowing separate control of the back and seat heating/cooling via individual PWM knobs on a physical user interface (Figure 2-1); (5) indicating battery charge status via a LED light on the user interface; and (6) enabling a pulse width modulation signal to dissipate excess energy into the heating strips. Appendix A provides more details about the newly developed digital controller for PCS chairs.
Figure 2-1. PCS chair designed and developed by the Center for the Built Environment and the Department of Electrical Engineering and Computer Sciences at the University of California, Berkeley. The images show hardware and heating and cooling elements of the chair, the new controller with wireless connectivity, and the newly designed user interface that allows separate control of seat and back heating/cooling.
Network connectivity: The digital controller transmits data to a cloud server via a gateway device. There are two types of gateway devices that can be used for the chair connectivity: (1) a Bluetooth-enabled mobile phone, and (2) an 802.15.4 router. The use of mobile phones reduces deployment effort by avoiding the installation of local network infrastructure, and allowing flexible chair location through the wide coverage of a mobile phone’s cellular networks. However, it requires the development of mobile applications to enable telemetry reporting via Bluetooth across various operating systems and devices. Also, real-time telemetry may not be guaranteed if the chair communication depends on the availability and network coverage of the chair user’s mobile phone. An 802.15.4 router provides reliable real-time telemetry because its physical location and network configuration can be fixed. Once installed, the router can talk to multiple chairs allowing scalable field deployment. But it requires more upfront deployment effort due to the installation of local network infrastructure. For this field study, I used 802.15.4 routers for the chair communication to have control over wireless connectivity and data reporting during the field study. I installed a total of five border routers to cover 37 chairs.
Software suite: The following online tools were developed to support the chair deployment: (1) plotter, and (2) status dashboard (shown in Appendix A). The plotter allows query, visualization, and download of time-series data. The status dashboard provides real-time status monitoring of chair data streams. Both tools are built on the sMAP (simple Measurement and Actuation Profile) – an open-source software that

9
enables accessing and storing time-series data and actuating connected devices, developed by UC Berkeley’s Electrical Engineering and Computer Sciences Department (Dawson-Haggerty et al., 2010).
FIELD STUDY
The field study with Internet-connected PCS chairs took place in the San Mateo County (SMC) office building in Redwood City, CA, between April and October 2016. The site offers real-world settings with typical office workers to conduct field experiments, which is quite a rare opportunity in academic research that often resort to university buildings and student subjects. This location has a Köppen Csb climate zone (California climate zone 3, ASHRAE climate zone 3C) characterized by dry, warm summers and mild winters.
Building description: The SMC office building is a 5-‐story, 13,200 m2 (142,000 ft2) building, shown in Figure 2-2 (a). Constructed in 1999, the building houses the county government and administrative offices for approximately 400 county employees. It is predominately open plan with some enclosed offices and conference rooms along the perimeter. The perimeter zones have a window-to-wall-ratio of approximately 0.6 on the first floor and 0.45 on all other floors. The windows are not operable or externally shaded, but do have interior blinds.
HVAC system: The building has a conventional single-duct variable air volume (VAV) reheat with overhead air distribution system, served by two rooftop units with direct expansion coils and evaporatively cooled condensers. A gas-fired hot water boiler serves these units and supplies hot water to the terminal reheat coils distributed throughout the building. The HVAC system in the building underwent a complete controls retrofit 18 months before the study period, which has brought it up to current industry best practice. The building has a Distech and Tridium/Niagara based BAS and two Internet-based building management software tools: Comfy and Trendr (https://www.comfyapp.com/product/). Comfy provides an online solution for thermostat control that adjusts the zone temperature setpoints based on occupant votes via mobile devices/computers and generates immediate hot/cold responses from the building’s HVAC system. Trendr facilitates web-based archiving and remote access to BAS trend data. The building’s HVAC system is in operation only during the occupied hours (6 am-6 pm) and is turned off otherwise.
Subject description: 37 occupants on the first and fifth floors of the building participated in the field study (17 male and 20 female). The majority (30 subjects) were in open-plan offices while 7 subjects had enclosed offices. Figure 2-2 (b) shows a participant in his office with a PCS chair. The study entailed having a PCS chair for a 12-week period and taking a series of surveys. I compensated the subjects $1 per survey, up to $15 per week. Due to limited chair availability, I staged the chair deployment in three phases to maximize the total number of subjects. The first phase was April – July with 10 subjects; the second phase was June – September with 17
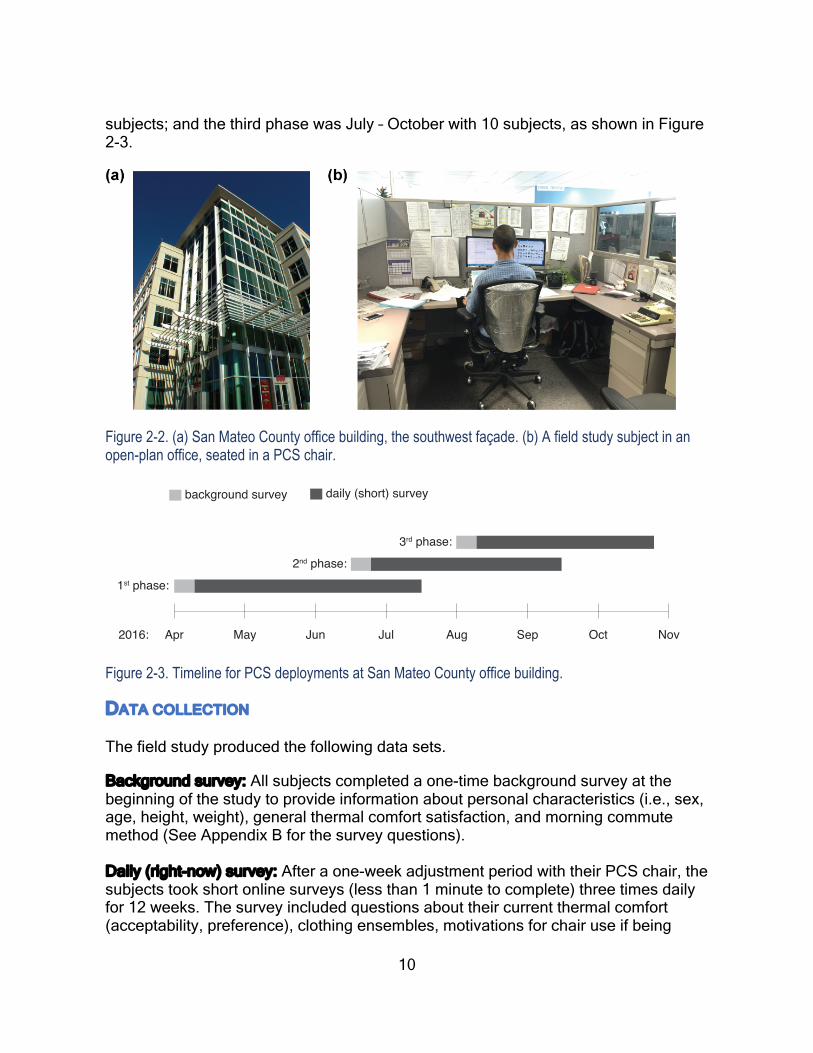
10
subjects; and the third phase was July – October with 10 subjects, as shown in Figure 2-3.
Figure 2-2. (a) San Mateo County office building, the southwest façade. (b) A field study subject in an open-plan office, seated in a PCS chair.
Figure 2-3. Timeline for PCS deployments at San Mateo County office building.
DATA COLLECTION
The field study produced the following data sets.
Background survey: All subjects completed a one-time background survey at the beginning of the study to provide information about personal characteristics (i.e., sex, age, height, weight), general thermal comfort satisfaction, and morning commute method (See Appendix B for the survey questions). Daily (right-now) survey: After a one-week adjustment period with their PCS chair, the subjects took short online surveys (less than 1 minute to complete) three times daily for 12 weeks. The survey included questions about their current thermal comfort (acceptability, preference), clothing ensembles, motivations for chair use if being
Apr May Jun Jul Aug Sep Oct Nov
1st phase:2nd phase:
3rd phase:
background survey daily (short) survey
2016:

11
used at the time of survey, and resulting satisfaction (See Appendix C for the survey questions). I asked the subjects to primarily follow email reminders to take surveys, but allowed some flexibility in survey timing to accommodate their office schedules and responsibilities. I provided a web link to the survey in the email to ensure that they were easy to access. Depending on the participation rate, I extended the survey period for some subjects by a few more weeks to increase the total survey count per person. In total, I collected 4655 survey responses (averaging 125 surveys per subject with the 25th to 75th percentile range of 110-141).
PCS control behavior: I gave all subjects a PCS chair to use according to their comfort needs and desires during the study period. Each PCS chair recorded heating/cooling intensity (in a scale from 0 to 100%), heating/cooling intensity and location (seat, back), and chair occupancy at 20-s intervals. Figure 2-4 shows an example of this data for a single PCS chair. Note that the chair allows separate control of the back and seat heaters/fans; hence, simultaneous heating and cooling can be recorded (e.g., back heater and seat fan). In total, I obtained 5.1 million chair data points from 37 participants after aggregating the raw data into one-minute intervals.
Indoor environment: I measured the subject’s local thermal environment continuously via environmental sensors using both the PCS chairs and independent data loggers. The chair’s environmental sensor, located underneath the seat pane (about 0.5 m from the ground), recorded air temperature (±0.25°C accuracy) and relative humidity (±2.0% accuracy) at 20-s intervals. I provided redundancy by installing a HOBO data logger (Model U12-012, Onset, USA) in each subject’s workstation near the breathing zone in a sitting position (about 1.0 m from the ground). The data logger recorded air temperature (±0.37°C accuracy), relative humidity (±2.5% accuracy), and globe temperature (±0.37°C accuracy) (only for perimeter offices) at 5-min intervals.
Outdoor environment: I obtained outside weather data from a nearby weather station via the National Centers for Environmental Information, National Oceanic and Atmospheric Administration website (https://www7.ncdc.noaa.gov/CDO/cdo). This dataset includes outdoor temperature, precipitation, and sky coverage measured at San Carlos weather station (WBAN 93231).
HVAC system: I also obtained VAV control settings from Trendr, which included the following data at 5-min intervals: room temperature (measured at the thermostat on the wall), supply airflow, damper position, heating output, and discharge air temperature in the 10 HVAC zones where the subjects were located.

12
Figure 2-4. Example of continuous PCS chair data of a subject between 7am and 7pm. Tair refers to indoor dry-bulb air temperature measured via the temperature sensor embedded in the PCS chair. The location of heating and cooling shown here refers to either the back or the seat.
The UC Berkeley’s Committee for the Protection of Human Subjects (IRB-2011-04-3163) reviewed and approved these methods.
2.3 RESULTS
The following sections report key findings from the field data analysis. I conducted all statistical analyses described in this chapter in R (version 3.4) and RStudio (version 1.0.143).
EXPOSED ENVIRONMENTAL CONDITIONS
Table 2-1 summarizes the overall environmental conditions (indoor and outdoor) during the study period, excluding non-operating hours and weekends.

13
Table 2-1. Statistical summary of the field conditions (indoor and outdoor) during occupied hours excluding weekends and holidays.
Variable Mean Median Lower and upper percentiles (5 / 25 / 75 / 95) Indoora
Air temperature (°C) 23.5 23.4 21.8 / 22.8 / 24.1 / 25.3 Globe temperatureb (°C) 23.2 23.1 21.4 / 22.4 / 24.0 / 25.6 Relative humidity (%) 48.4 48.3 41.8 / 46.0 / 50.6 / 54.9
Outdoor Temperature (°C)
Cool season (Apr – May) 13.8 13.9 10.0 / 12.8 / 15.0 / 17.8 Warm season (Jun – Aug) 15.1 15.0 12.8 / 13.9 / 16.1 / 18.9 Cool season (Sep – Oct) 13.9 13.9 11.1 / 12.8 / 15.0 / 17.8
a Indoor conditions refer to the measurements taken at the subjects’ workstations by data loggers located at approximately 1.0m from the ground (breathing zone in sitting position), not by the chair sensors located at 0.5m from the ground (underneath the chair seat pane). b globe temperature is only measured in perimeter workstations.
The weather in Redwood City, CA during the field study period was mostly dry and sunny with mild to warm daytime temperatures. A comparison to the average long-term climate data confirmed that the measured temperatures were representative of this region’s climate. The subjects were exposed to slightly different weather conditions because the study consisted of three phases with different start and finish dates. The first phase (Apr-Jul) included a cool season and the beginning of a warm season. The second (Jun-Sept) and third (Jul-Oct) phases included a more consistent warm season with some cool weather towards the end. The indoor air temperature remained mostly within a relatively narrow range of 22-25 °C during the occupied hours, largely unaffected by the outdoor conditions. The difference between air and globe temperatures along the perimeter offices was small (mean = 0.3 °C, standard deviation = 0.6 °C). Relative humidity was relatively uniform with little variations across different workstations (mean = 48%, standard deviation = 3.4%).

14
Figure 2-5. (a) Distribution of indoor air temperature measured at each subject’s workstation during the field study period. The mean values are marked with a red dot. (b) Hourly distribution of indoor air temperature over the field study duration, shown in 25-75th (red line) and 5-95th (grey line) percentile ranges. (c) Density curves of the difference in temperature measurements by distributed sensors at the subjects’ workstations vs. zonal thermostats. There were 19 workstations in the Interior zone and 18 workstations in the perimeter zone.
With distributed environmental sensing via PCS chairs and data loggers, I had high visibility into the subjects’ local thermal conditions. Figure 2-5 (a) shows the distribution of air temperature at each chair location during the study period. The majority of the subjects experienced conditions that were within the ‘comfortable’ range according to the current standards (i.e., ASHRAE 55, ISO 7730, EN 15251); however, some were exposed to a wider temperature variation than others during the study period. Figure 2-5 (b) shows the distribution of indoor temperatures across different workstations occupied by the subjects. On average, the difference in air temperature exposures by different subjects during the same hour was as much as 1.1 °C based on 25-75th percentile range and 2.9 °C based on 5-95th percentile range. This indicates that individuals may experience different thermal conditions even in the same moment depending on their location within the building. To understand how well the building’s HVAC sensors capture temperature variations across different building spaces, I compared local temperature measurements to the zonal thermostat readings in Figure 2-5 (b). The discrepancy between the two readings across all chair locations was 0.5 °C on average with standard deviation of 0.8 °C. The measured temperatures in interior offices were often warmer than

15
thermostat readings (possibly due to equipment heat gain). Exterior offices were both cooler and warmer than the thermostat readings as they were exposed to solar heat gains or losses through the building envelope that are not always captured by thermostat sensors (since they are typically installed on interior walls). This shows that local temperatures and thermostat readings are not always in agreement, and depending on where the thermostats are located, temperature readings may not be representative of the conditions experienced by individuals in their local areas.
THERMAL COMFORT ASSESSMENT OF PCS USERS
The daily thermal comfort assessment via online surveys consisted of two questions: thermal acceptability (4-point discrete scale) and thermal preference (3-point discrete scale) of the overall thermal environment considering both the surrounding ambient and chair conditions. I did not include the traditional thermal sensation question in the questionnaire because it could be confusing or misunderstood by PCS chair users. I discovered this from interviews with the subjects during the beta-testing of PCS chairs (Bauman et al., 2017). Because PCS provided heating and cooling directly onto portions of their body, the subjects tended to report the sensation they felt from the chair’s heating or cooling rather than assessing whole body sensation from the overall environment. As such, they often voted ‘warm’ or ‘cool’ sensation when the chair’s heating or cooling was on, and they did not associate those votes with discomfort; in fact, they were usually perceived them positively. Also, they considered ‘neutral’ as a void of warm or cool sensation and tended to not vote ‘neutral’ when they were using the chair’s heating or cooling. To eliminate the source of confusion and misinterpretation, I removed this question from the survey for this field study.
Figure 2-6 summarizes the results of the subjects’ thermal comfort responses collected from daily surveys. PCS chair users had high comfort satisfaction during the study period. Based on thermal acceptability, 96% of the votes found their thermal environment either ‘acceptable’ or ‘slightly acceptable’ over a range of air temperatures (21.9-25.3 °C based on 5-95th percentile range), far exceeding the 80% goal of the ASHRAE thermal standard (ANSI/ASHRAE, 2013). Furthermore, recent research showed that even this relatively low temperature satisfaction goal was only met in 10% of 144 surveyed buildings, indicating that actual temperature satisfaction is far lower than 80% in most buildings (Karmann et al., 2017). Only 3.6% voted slightly unacceptable, and less than 1% voted unacceptable. This is similar to the result observed in an earlier laboratory study with PCS chairs (Pasut et al., 2015) that achieved over 90% comfort satisfaction over a temperature range of 18-29°C. Based on thermal preference, 70% of the votes indicated that subjects found their thermal environment sufficiently good – matching their preferred state and wanting ‘no change’ to the current conditions. 17% and 13% of the votes expressed subjects’ desire to be cooler and warmer, respectively. Interestingly, the ‘warmer/cooler’ votes were mostly associated with the ‘slightly acceptable’ and ‘unacceptable’ votes in thermal acceptability as shown in Figure 2-6 (c). This indicates that a preferred thermal environment may be different from what is perceived as ‘acceptable’, and
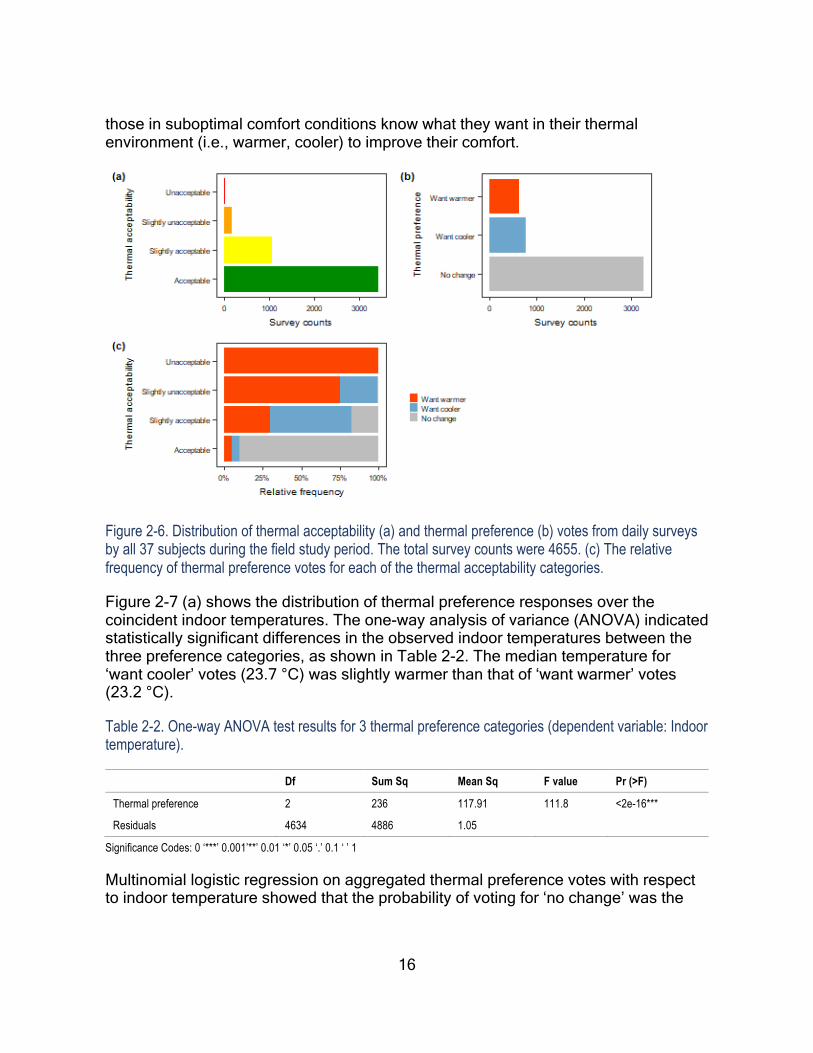
16
those in suboptimal comfort conditions know what they want in their thermal environment (i.e., warmer, cooler) to improve their comfort.
Figure 2-6. Distribution of thermal acceptability (a) and thermal preference (b) votes from daily surveys by all 37 subjects during the field study period. The total survey counts were 4655. (c) The relative frequency of thermal preference votes for each of the thermal acceptability categories.
Figure 2-7 (a) shows the distribution of thermal preference responses over the coincident indoor temperatures. The one-way analysis of variance (ANOVA) indicated statistically significant differences in the observed indoor temperatures between the three preference categories, as shown in Table 2-2. The median temperature for ‘want cooler’ votes (23.7 °C) was slightly warmer than that of ‘want warmer’ votes (23.2 °C).
Table 2-2. One-way ANOVA test results for 3 thermal preference categories (dependent variable: Indoor temperature).
Df Sum Sq Mean Sq F value Pr (>F)
Thermal preference 2 236 117.91 111.8 <2e-16***
Residuals 4634 4886 1.05
Significance Codes: 0 ‘***’ 0.001’**’ 0.01 ‘*’ 0.05 ‘.’ 0.1 ‘ ’ 1
Multinomial logistic regression on aggregated thermal preference votes with respect to indoor temperature showed that the probability of voting for ‘no change’ was the

17
highest at 23.1 °C. The subjects were more likely to vote for ‘want cooler’ when temperature were warmer. The opposite was true for ‘want cooler’ votes.
Figure 2-7. (a) Boxplots of the aggregated thermal preference votes (i.e., ‘no change’, ‘want cooler’, ‘want warmer’) from all subjects over coincident indoor temperatures. (b) Multinomial logistic regression curves for thermal preference categories over indoor temperature. The dotted line represents Preferred Ta, which is the temperature at which the probability of voting for ‘no change’ is highest. The distribution of thermal preference votes over coincident indoor temperatures is shown at the top.
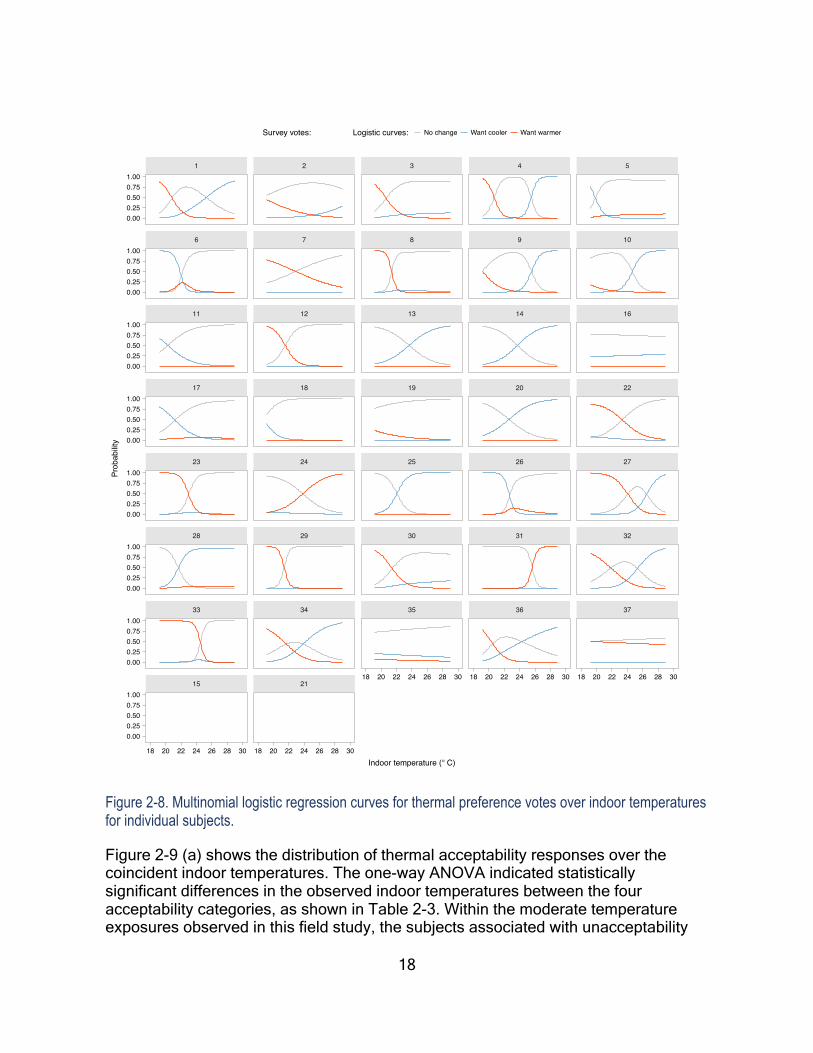
However, such trends were not always observed when logistic regression was performed at individual levels, as shown in Figure 2-8. Within moderate temperature exposures, many did not follow changes in temperatures when voting for ‘want cooler/warmer’. In fact, some subjects showed only certain preferences within the exposed temperatures that logistic regression only produced binary results (e.g., no ‘want cooler’ trends for User 7, 19) or did not converge at all (e.g., only ‘no change’ votes for User 15, 21). Also, the likelihood for voting for ‘want cooler/warmer’ varied quite a lot between individuals even under the same temperatures; therefore, temperature alone – even when measured local to the occupant – cannot explain individuals’ thermal preferences. Note that the reliability of logistic regression will decrease as the sample size decreases, particularly towards the extremes of individuals’ temperature exposures (marked as ‘tick’ marks at the bottom of each plot in Figure 2-8).
18
Figure 2-8. Multinomial logistic regression curves for thermal preference votes over indoor temperatures for individual subjects.
Figure 2-9 (a) shows the distribution of thermal acceptability responses over the coincident indoor temperatures. The one-way ANOVA indicated statistically significant differences in the observed indoor temperatures between the four acceptability categories, as shown in Table 2-3. Within the moderate temperature exposures observed in this field study, the subjects associated with unacceptability
15 21
33 34 35 36 37
28 29 30 31 32
23 24 25 26 27
17 18 19 20 22
11 12 13 14 16
6 7 8 9 10
1 2 3 4 5
18 20 22 24 26 28 30 18 20 22 24 26 28 30
18 20 22 24 26 28 30 18 20 22 24 26 28 30 18 20 22 24 26 28 30
0.000.250.500.751.00
0.000.250.500.751.00
0.000.250.500.751.00
0.000.250.500.751.00
0.000.250.500.751.00
0.000.250.500.751.00
0.000.250.500.751.00
0.000.250.500.751.00
Indoor temperature (° C)
Prob
abilit
y
Survey votes: Logistic curves: No change Want cooler Want warmer

19
mostly with cooler temperatures. This is also shown in the logistic regression curves for thermal acceptability vs. indoor temperature in Figure 2-9 (b). However, there were too few votes for ‘unacceptable’ and ‘slightly unacceptable’ (12 and 170 votes respectively out of the total 4655 votes) to make any meaningful conclusions about this trend. Most of the logistic regression at individual levels did not converge due to heavy imbalance between the acceptability categories; hence, the results were not reported.
Figure 2-9. (a) Boxplots of the aggregated thermal acceptability votes (i.e., ‘acceptable’, ‘slightly acceptable’, ‘slightly unacceptable’, ‘unacceptable’) from all subjects over coincident indoor temperatures. (b) Multinomial logistic regression curves for thermal acceptability categories over indoor temperature.
Table 2-3. One-way ANOVA test results for 4 thermal acceptability categories (dependent variable: Indoor temperature).
Df Sum Sq Mean Sq F value Pr (>F)
Thermal acceptability 3 38 12.687 11.56 1.51e-07***
Residuals 4633 5084 1.097
Significance Codes: 0 ‘***’ 0.001’**’ 0.01 ‘*’ 0.05 ‘.’ 0.1 ‘ ’ 1
PCS CONTROL BEHAVIOR
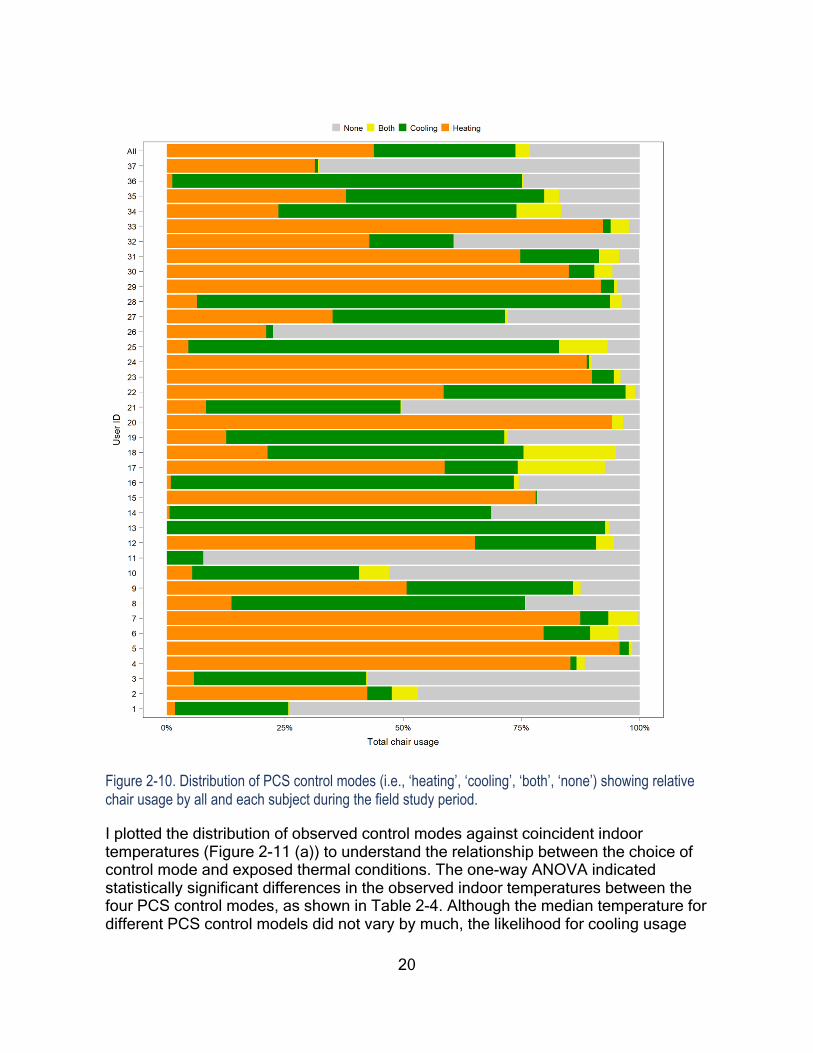
Figure 2-10 shows the overall chair usage of each subject during the field study period. On average, chair heating and/or cooling were on 76% of the time during which the chair was occupied, indicating active chair usage by the subjects. However, individuals’ chair usage pattern varied widely. For example, some used the chair’s heating/cooling function more frequently than others while seated. Some subjects primarily used heating over cooling, or vice versa.
20
Figure 2-10. Distribution of PCS control modes (i.e., ‘heating’, ‘cooling’, ‘both’, ‘none’) showing relative chair usage by all and each subject during the field study period.
I plotted the distribution of observed control modes against coincident indoor temperatures (Figure 2-11 (a)) to understand the relationship between the choice of control mode and exposed thermal conditions. The one-way ANOVA indicated statistically significant differences in the observed indoor temperatures between the four PCS control modes, as shown in Table 2-4. Although the median temperature for different PCS control models did not vary by much, the likelihood for cooling usage

21
increased at warmer temperature and heating usage increased at cooler temperatures, as shown in logistic regression curves (Figure 2-10 (b)).
Figure 2-11. (a) Boxplots of the aggregated PCS control usage (i.e., ‘none’, ‘cooling’, ‘heating’, ‘both’) from all subjects over coincident indoor temperatures. (b) Multinomial logistic regression curves for PCS control modes over indoor temperature.
Table 2-4. One-way ANOVA test results for 4 PCS control modes (dependent variable: Indoor temperature).
Df Sum Sq Mean Sq F value Pr (>F)
PCS control mode 3 61022 20341 14207 <2e-16***
Residuals 3326400 4762403 1
Significance Codes: 0 ‘***’ 0.001’**’ 0.01 ‘*’ 0.05 ‘.’ 0.1 ‘ ’ 1
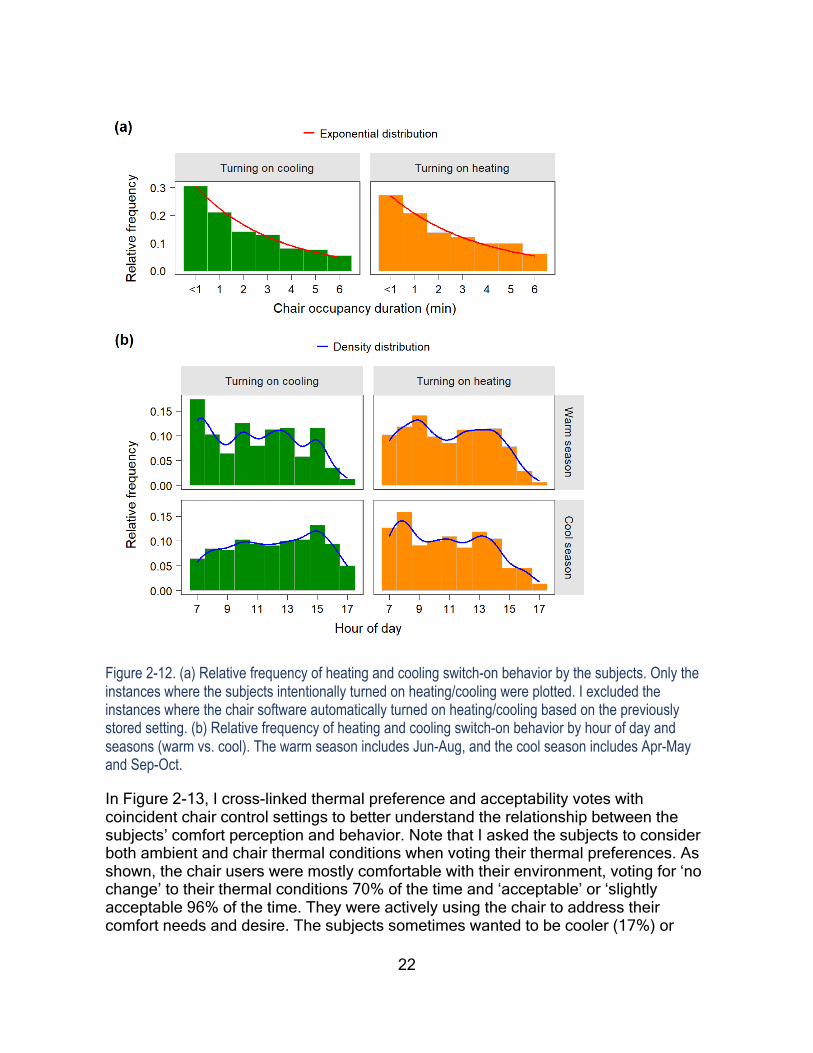
To understand what may trigger people to switch the chair’s heating/cooling ‘on’ from ‘off’ mode, I examined the subjects’ chair occupancy patterns, time of day, and seasons (Figure 2-12). I only looked at the instances where the subjects intentionally activated heating/cooling, and excluded the instances where the chair automatically activated heating/cooling based on the previous setting remembered by the chair software. The distribution of the switching-on behavior is expressed in relative frequency as a proportion of the total occurrences. The data show that intentional heating or cooling occurred shortly after sitting in the chair (within 6 min of being seated), indicating that people’s desire for heating/cooling may arise mostly during transitional periods. This is particularly prominent at the beginning of the office hours during the warm season (Jun-Aug), where the occupants often selected cooling mode. This could be to offset people’s heightened metabolic rate during a short period after arriving from their morning commute.
22
Figure 2-12. (a) Relative frequency of heating and cooling switch-on behavior by the subjects. Only the instances where the subjects intentionally turned on heating/cooling were plotted. I excluded the instances where the chair software automatically turned on heating/cooling based on the previously stored setting. (b) Relative frequency of heating and cooling switch-on behavior by hour of day and seasons (warm vs. cool). The warm season includes Jun-Aug, and the cool season includes Apr-May and Sep-Oct.
In Figure 2-13, I cross-linked thermal preference and acceptability votes with coincident chair control settings to better understand the relationship between the subjects’ comfort perception and behavior. Note that I asked the subjects to consider both ambient and chair thermal conditions when voting their thermal preferences. As shown, the chair users were mostly comfortable with their environment, voting for ‘no change’ to their thermal conditions 70% of the time and ‘acceptable’ or ‘slightly acceptable 96% of the time. They were actively using the chair to address their comfort needs and desire. The subjects sometimes wanted to be cooler (17%) or
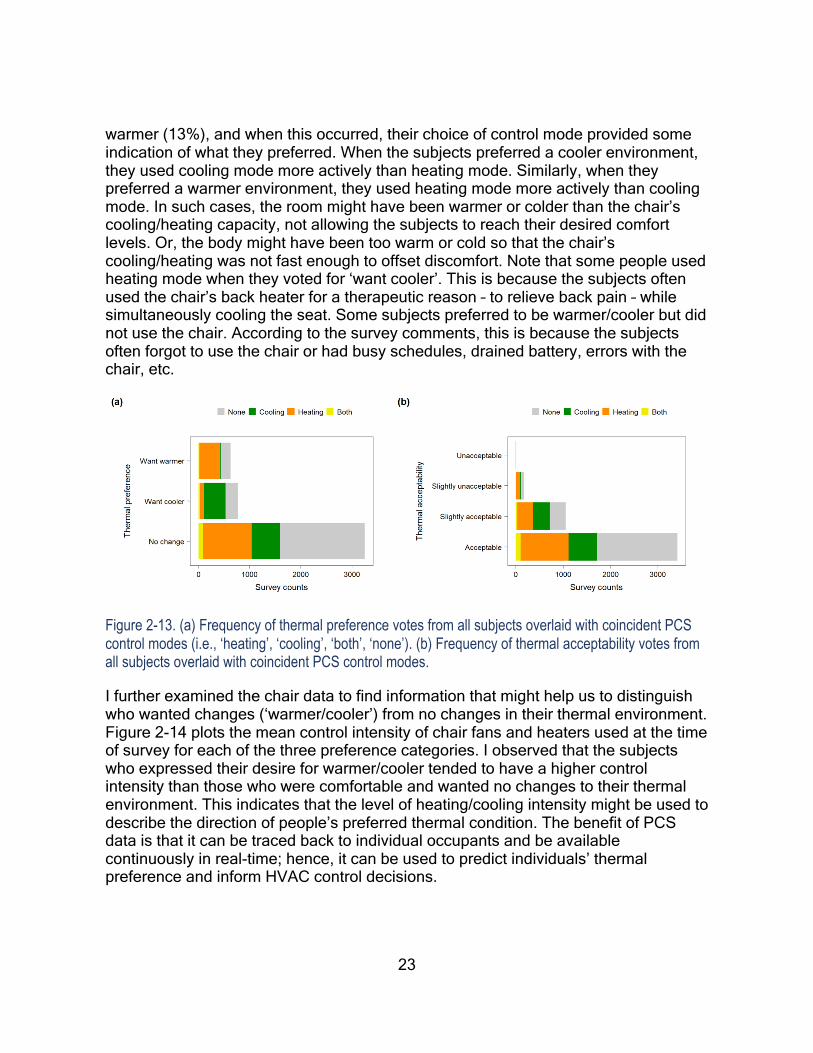
23
warmer (13%), and when this occurred, their choice of control mode provided some indication of what they preferred. When the subjects preferred a cooler environment, they used cooling mode more actively than heating mode. Similarly, when they preferred a warmer environment, they used heating mode more actively than cooling mode. In such cases, the room might have been warmer or colder than the chair’s cooling/heating capacity, not allowing the subjects to reach their desired comfort levels. Or, the body might have been too warm or cold so that the chair’s cooling/heating was not fast enough to offset discomfort. Note that some people used heating mode when they voted for ‘want cooler’. This is because the subjects often used the chair’s back heater for a therapeutic reason – to relieve back pain – while simultaneously cooling the seat. Some subjects preferred to be warmer/cooler but did not use the chair. According to the survey comments, this is because the subjects often forgot to use the chair or had busy schedules, drained battery, errors with the chair, etc.
Figure 2-13. (a) Frequency of thermal preference votes from all subjects overlaid with coincident PCS control modes (i.e., ‘heating’, ‘cooling’, ‘both’, ‘none’). (b) Frequency of thermal acceptability votes from all subjects overlaid with coincident PCS control modes.
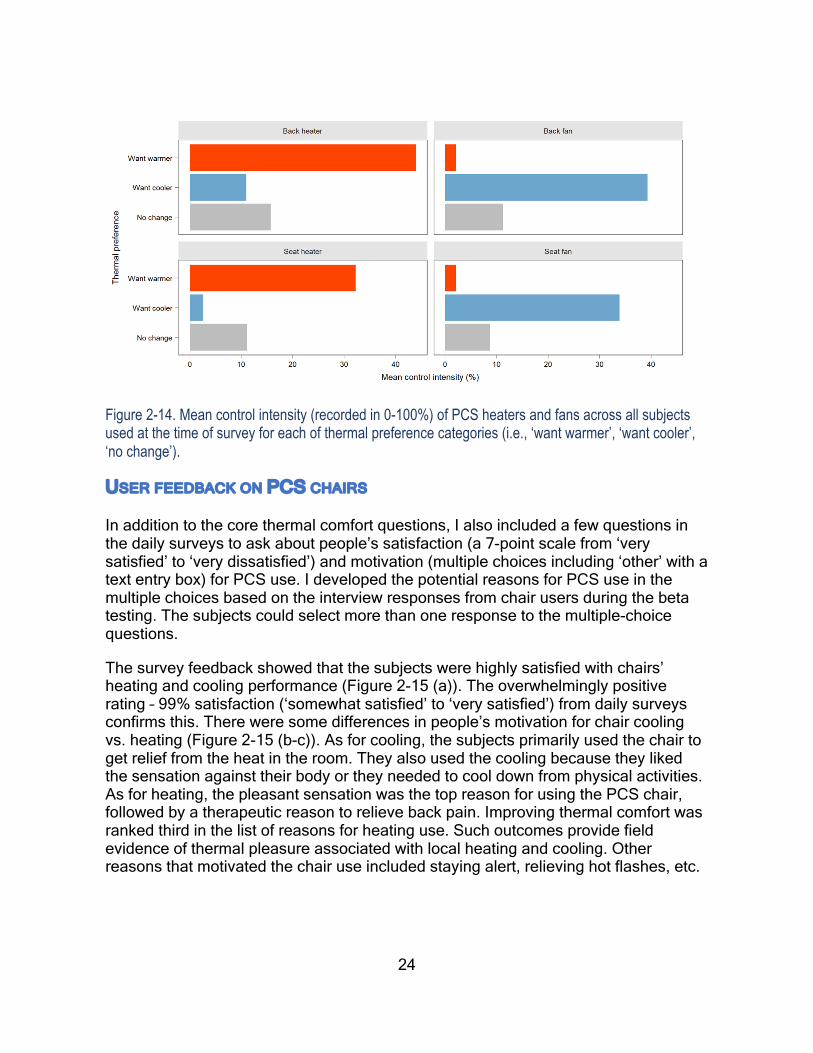
I further examined the chair data to find information that might help us to distinguish who wanted changes (‘warmer/cooler’) from no changes in their thermal environment. Figure 2-14 plots the mean control intensity of chair fans and heaters used at the time of survey for each of the three preference categories. I observed that the subjects who expressed their desire for warmer/cooler tended to have a higher control intensity than those who were comfortable and wanted no changes to their thermal environment. This indicates that the level of heating/cooling intensity might be used to describe the direction of people’s preferred thermal condition. The benefit of PCS data is that it can be traced back to individual occupants and be available continuously in real-time; hence, it can be used to predict individuals’ thermal preference and inform HVAC control decisions.
24
Figure 2-14. Mean control intensity (recorded in 0-100%) of PCS heaters and fans across all subjects used at the time of survey for each of thermal preference categories (i.e., ‘want warmer’, ‘want cooler’, ‘no change’).
USER FEEDBACK ON PCS CHAIRS
In addition to the core thermal comfort questions, I also included a few questions in the daily surveys to ask about people’s satisfaction (a 7-point scale from ‘very satisfied’ to ‘very dissatisfied’) and motivation (multiple choices including ‘other’ with a text entry box) for PCS use. I developed the potential reasons for PCS use in the multiple choices based on the interview responses from chair users during the beta testing. The subjects could select more than one response to the multiple-choice questions.
The survey feedback showed that the subjects were highly satisfied with chairs’ heating and cooling performance (Figure 2-15 (a)). The overwhelmingly positive rating – 99% satisfaction (‘somewhat satisfied’ to ‘very satisfied’) from daily surveys confirms this. There were some differences in people’s motivation for chair cooling vs. heating (Figure 2-15 (b-c)). As for cooling, the subjects primarily used the chair to get relief from the heat in the room. They also used the cooling because they liked the sensation against their body or they needed to cool down from physical activities. As for heating, the pleasant sensation was the top reason for using the PCS chair, followed by a therapeutic reason to relieve back pain. Improving thermal comfort was ranked third in the list of reasons for heating use. Such outcomes provide field evidence of thermal pleasure associated with local heating and cooling. Other reasons that motivated the chair use included staying alert, relieving hot flashes, etc.

25
Figure 2-15. Distribution of (a) satisfaction rating with PCS heating or cooling, (b) reasons for PCS cooling use, and (c) reasons for PCS heating use. The data is based on the subjects’ responses to the questions asked only when they were using their PCS chair at the time of daily survey. The subjects were allowed to select more than one in multiple choices for (b) and (c).
2.4 DISCUSSION
Below I summarize key insights drawn from the data analysis, as well as areas for improvement for PCS chairs.
Variability in temperature conditions across different building spaces
Individual occupants are exposed to different temperature conditions across different building spaces, even within the same VAV zone (as much as 1.1 °C based on 25-75th percentile range and 2.9 °C based on 5-95th percentile range). This could be caused by the building’s physical design (e.g., interior/perimeter zone), HVAC design (e.g., supply diffuser type and location), or other factors. Such variations in temperature exposure are difficult to capture in conventional HVAC systems as there is typically one temperature measurement (i.e., the thermostat) per zone covering a large area, and sometimes even several separate enclosed rooms. Depending on where the thermostat is located, temperature readings may not be representative of

26
what is experienced by individuals in their local areas (on average, 0.5±0.8 °C differences observed) and temperature control may not be optimized for the majority’s comfort. This is why relying on a single measurement for temperature control of the entire zone can potentially lead to discomfort. Modern buildings are becoming more extensible, capable of integrating various sensors via the Internet. Distributed sensing via connected sensors, such as the ones embedded in PCS chairs, can complement the building’s existing sensing network and would allow more representative and robust temperature control due to increased visibility into local thermal conditions and redundancies in case any of the existing sensors go out of service.
Individual differences in thermal preference
Occupants often have different thermal preferences even when they are all exposed to the same temperature, as shown in Figure 2-7 (b). This could be simply because of the differences in opinions, or other factors beyond temperatures. Regardless, differences in comfort preferences can lead to conflicts among occupants over thermostat setpoints in shared spaces and ultimately cause dissatisfaction with their environment. The challenge with conventional VAV systems is that there is only one thermostat serving multiple occupants and individuals may not get to set the temperature according to their desire. Providing PCS in the areas with conflicts in temperature preferences or unmet comfort needs can provide individuals with personal control over their immediate thermal environment and improve the overall satisfaction of building occupants. This field study showed very high thermal acceptability (96%) among PCS users in a mechanically-conditioned building with moderate temperature exposures (21.9-25.3 °C based on 5-95th percentile range). If the use of PCS would be able to maintain comfort at greater temperature ranges, central HVAC systems can maintain ambient conditions within a range in which the PCS can correct for each individual’s thermal comfort needs, instead of a much narrower range that is a compromise for all occupants in that space. The extended range of temperature setpoints can also lead to significant energy savings in buildings . Moreover, PCS provide fast-acting heating or cooling that can help to address immediate comfort needs of building occupants (e.g., cooling after walking up the stairs, warming after entering from a cold outdoor) with very little energy use (Pasut et al., 2013). Such responsiveness is not only impossible to achieve with conventional HVAC systems, as they condition the entire thermal zone, but also impractical due to substantial energy consequences and the needs of others occupying the same zone. As such, PCS can be used to provide complementary comfort solutions to traditional systems for greater satisfaction and reduced energy use.
Behavior as a predictor of thermal preference
When thermal control is provided, people use it to address their comfort needs; hence, the resulting behavior can be regarded as an expression of one’s thermal preference. This is confirmed through my analysis of PCS control usage data. The
27
choice of heating vs. cooling revealed adaptive actions taken by occupants to address their comfort (or other physiological) needs. On the other hand, the heating and cooling intensity indicated whether occupants wanted additional heating or cooling in their thermal environment. The benefit of PCS data is that it can be traced back to individuals and it is available continuously in real-time; hence, the data can be used to predict individuals’ thermal preference dynamically. Such predictions can act as an individualized comfort feedback for HVAC controls to provide ‘just the right’ amount of conditioning to meet occupant needs, in contrast to over-conditioning that results from tight setpoint management. One caveat is that not all chair use is motivated by thermal comfort, such as subjects using the chair’s heating to relieve back pain. Hence, the predictive algorithm needs to be able to filter out such situations and correctly identify those related to thermal comfort.
Applicability of comfort scales for PCS users
Different comfort scales inform different aspects about thermal comfort of PCS users. Thermal acceptability describes the level of ‘acceptability’ of a given environment by the users while thermal preference describes what preferred condition would be if they can make changes to their environment. It is possible that even when people are not in their ideal state of comfort, they may still report their thermal condition as ‘acceptable’ – meaning it is tolerable or not bad enough to complain. I observed this in the survey results when the subjects in suboptimal comfort state (‘slightly unacceptable’ or ‘slightly acceptable’) expressed their desire to be warmer or cooler. From a building control perspective, both scales are useful as thermal acceptability informs about who is on the verge of discomfort while thermal preference informs about how to improve their condition. Such information can help HVAC systems to provide preventive or corrective control strategies to improve comfort satisfaction of building occupants.
Thermal pleasure could be another comfort scale relevant to PCS users as it is a frequent reason for PCS heating/cooling use. This scale would address the concept of alliesthesia in thermal comfort assessment, shifting our focus from minimizing discomfort to creating delightful experience for occupants.
Lastly, I think that the conventional version of the thermal sensation scale (7-point scale from ‘hot’ to ‘cold’) is not appropriate for PCS users as the local heating or cooling can cause confusion and misinterpretation of the scale. Further research is needed to design a sensation scale applicable to PCS users along with the appropriate survey question and understand its implications in building controls.
Implications for temporal and spatial alliesthesia
This study, through the rich data collected from PCS users in a typical office building over a six-month period, suggests that PCS offers the possibility of bringing alliesthesial experience into everyday environment. There are two types of

28
alliesthesia – temporal and spatial. The temporal form can be enhanced by the fast-responding heating and cooling afforded by PCS in non-steady state environments (e.g., during spatial or metabolic transitions). The fact that the activation of PCS heating and cooling consistently occurred within the first few minutes of sitting, especially right after morning commute, as shown in Figure 2-12. This suggests potential opportunity to experience temporal alliesthesia by PCS users – 24.6% of the PCS cooling use was attributed to cooling down from physical activity, as shown in Figure 2-15 (b). Even greater potential impact may be in the spatial form of alliesthesia, since PCS applies thermal stimulus to specific parts of the body. Studies have shown that applying local heating or cooling onto certain body parts can significantly influence the overall comfort and can also elicit pleasurable experience (Zhang et al., 2010a; Parkinson and de Dear, 2016). In fact, the survey results confirmed that one of the main motivation for PCS heating and cooling was the pleasurable sensation against their body – 26.5% of the PCS cooling use and 35.1% of the PCS cooling use, as shown in Figure 2-15 (b-c). The chair heating or cooling could potentially be pulsed through a cycle assuring that both forms of alliesthesia operate continuously in steady state. This can not only be implemented with the remote actuation capability of the Internet-connected PCS chairs but also can be fine-tuned to individuals’ comfort needs and desires with the insights gained from the PCS data. As PCS becomes more diversified in its forms (wearables) and equipped with advanced technologies, opportunities await to map the effects of different combinations of heating and cooling across different body parts and develop alliesthesial models that can have practical significance for individuals’ comfort experience in everyday environment.
Areas to improve Internet-connected PCS chairs
Overall, the field testing of Internet-connected PCS chairs was successful. The subjects were highly satisfied with the chair’s heating and cooling performance, particularly when compared against thermal satisfaction typically reported in buildings. The communication system of the chairs mostly functioned well during the six-month study. Nonetheless, there are some areas for improvement, as listed below, that I identified from field inspections and user feedback.
• Battery charging: I noticed that our prototypes’ LiFePO 4 battery life decreased over time requiring more frequent charging. Because of this, many chair users left the charging cable connected to the battery all the time, presenting potential tripping hazards and frequent damages to the charger (e.g., broken plug). A larger capacity battery, or a battery with a longer life, or low power continuous wireless charging (currently under development by CBE) would improve this situation.
• Data privacy: Despite the strict data policy – removal of personal identifiers from the database and restricted access to core research personnel, a few subjects still expressed concerns about their organization potentially accessing sensitive personal data (e.g., chair occupancy). For PCS to be

29
adopted as part of a building system, I think it is critical for organizations to develop rigorous data privacy measures to protect sensitive data and build trust with PCS users.
• Control automation: Survey responses indicated that occupants often forgot to use the chair’s heating or cooling because of their busy schedules. This is particularly a problem when they first arrive at work in the morning. Software solutions such as pre-programming heating and cooling sequences or enabling a smart algorithm that learns and automates repetitive control behavior can help to address this problem.
• Ergonomic diversity: Modern offices encourage diverse furniture design to meet individuals’ ergonomic needs and preference. The current PCS chair design with standard dimensions and adjustability has limitations to accommodate different workstation configurations and postures required by occupants (e.g., standing desk, high chair). Allowing greater adjustability and customizability beyond the standard design would be beneficial for mass market adoption of PCS chairs.
• Combined PCS solutions: Some subjects brought their own desktop fan and used it in combination with PCS chairs. Such combination is not only intuitive but also has scientific grounding, in that past research has shown that cooling is most effective when applied in the breathing zone and heating is effective when applied to feet (Zhang et al., 2010a). Hence, offering a combination of complementary PCS devices, as demonstrated in (Pasut et al., 2015) via the offering of PCS chairs and desktop fans together, can provide more effective heating or cooling than offering a single device alone.
2.5 SUMMARY
The purpose of this chapter is to report findings of the field study with new PCS chairs equipped with data logging and wireless communication capabilities. I conducted the field study in an office building located in northern California by recruiting 37 occupants to use PCS chairs according to their comfort needs and desire during the summer of 2016. The methods included the installation of PCS chairs and a communication network, as well as continuous measurement of each subject’s PCS usage, workstation microclimate and HVAC system settings, plus a web-based survey that the subjects took several times a day. I collected over 5 million chair data points and over 4500 survey responses during the study period. The key findings of data analysis include the following:
• PCS chairs produced high comfort satisfaction, resulting in 96% acceptability in typical office environments (21.9-25.3 °C) and 70% wanting no changes to given thermal conditions. This was much higher than the minimum 80% satisfied requirement of ASHRAE Standard 55, which recent evidence suggest is only met in less than half of buildings in practice.
30
• The preferred temperature with PCS chairs was 23.1 °C based on the survey analysis of all subjects. However, individuals often displayed different thermal preferences even under the same temperature conditions, indicating that indoor temperature alone is not a good predictor of thermal preference.
• The use of PCS chairs was often motivated by pleasurable sensation and short-term comfort needs (such as on first arrival), offering field evidence of both spatial and temporal alliesthesia via fast-responding local heating and cooling.
• Local temperatures experienced by individual occupants vary across different parts of the building, even within the same VAV zone (as much as 1.1 °C based on 25-75th percentile range and 2.9 °C based on 5-95th percentile range). Such variations are often not captured in conventional HVAC systems as most buildings only have one temperature measurement (i.e., the thermostat) per zone. Distributed sensing via connected sensors, such as the ones embedded in PCS chairs, can complement the building’s existing sensing network and allow more robust and representative temperature control.
• Individuals’ PCS control behavior can be an indicator of their thermal preference. I found that the control modes indicate the type of thermal needs (i.e., heating, cooling) that occupants have while the control intensity indicates whether they want additional heating or cooling beyond what PCS is providing. Hence, PCS control behavior can potentially be used as an individualized comfort feedback for HVAC controls.
Our present findings demonstrate that PCS can not only provide comfort satisfaction far exceeding the 80% goal of the ASHRAE thermal comfort standard (ASHRAE Standard 55) but also produce highly individualized data that can improve our understanding of occupant comfort and behavior. Since the software stack developed for the PCS chairs allows interaction between PCS and BAS on the same communication platform, the intelligence built on PCS data can turn into actionable feedback for HVAC controls. For future research, it would be useful to apply the findings from this study to comfort predictions and environmental controls to improve occupant satisfaction and energy performance in buildings.
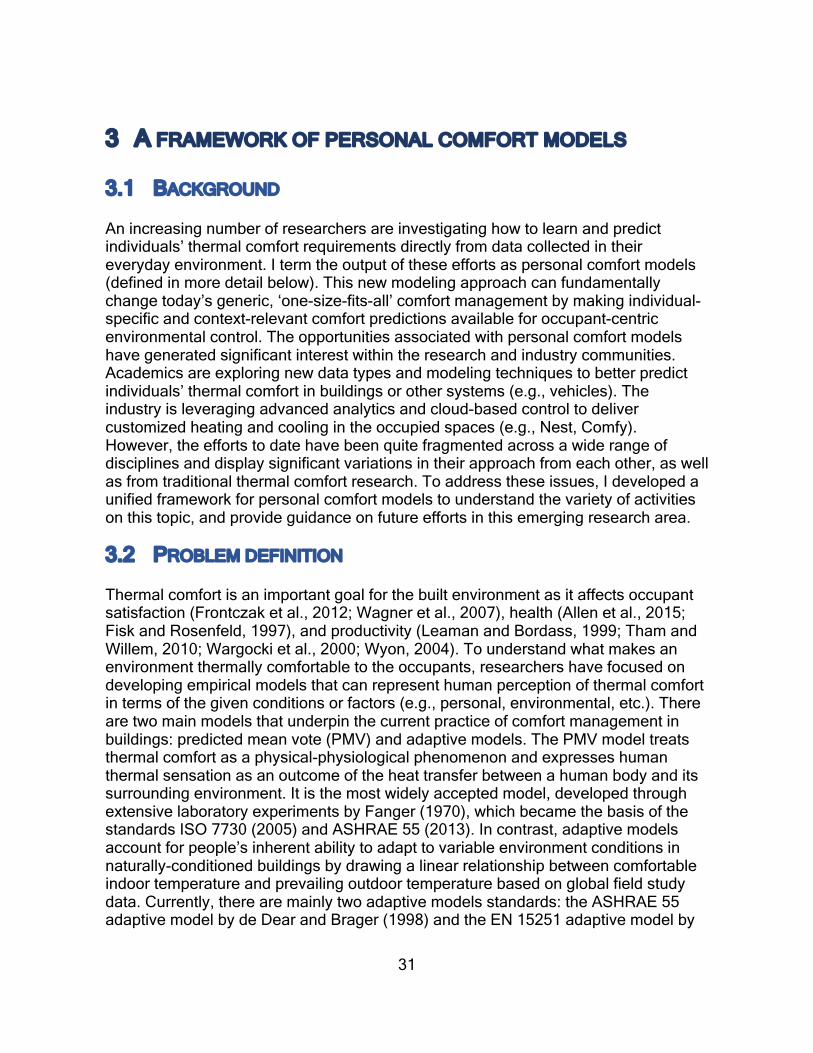
31
3 A FRAMEWORK OF PERSONAL COMFORT MODELS
3.1 BACKGROUND
An increasing number of researchers are investigating how to learn and predict individuals’ thermal comfort requirements directly from data collected in their everyday environment. I term the output of these efforts as personal comfort models (defined in more detail below). This new modeling approach can fundamentally change today’s generic, ‘one-size-fits-all’ comfort management by making individual-specific and context-relevant comfort predictions available for occupant-centric environmental control. The opportunities associated with personal comfort models have generated significant interest within the research and industry communities. Academics are exploring new data types and modeling techniques to better predict individuals’ thermal comfort in buildings or other systems (e.g., vehicles). The industry is leveraging advanced analytics and cloud-based control to deliver customized heating and cooling in the occupied spaces (e.g., Nest, Comfy). However, the efforts to date have been quite fragmented across a wide range of disciplines and display significant variations in their approach from each other, as well as from traditional thermal comfort research. To address these issues, I developed a unified framework for personal comfort models to understand the variety of activities on this topic, and provide guidance on future efforts in this emerging research area.
3.2 PROBLEM DEFINITION
Thermal comfort is an important goal for the built environment as it affects occupant satisfaction (Frontczak et al., 2012; Wagner et al., 2007), health (Allen et al., 2015; Fisk and Rosenfeld, 1997), and productivity (Leaman and Bordass, 1999; Tham and Willem, 2010; Wargocki et al., 2000; Wyon, 2004). To understand what makes an environment thermally comfortable to the occupants, researchers have focused on developing empirical models that can represent human perception of thermal comfort in terms of the given conditions or factors (e.g., personal, environmental, etc.). There are two main models that underpin the current practice of comfort management in buildings: predicted mean vote (PMV) and adaptive models. The PMV model treats thermal comfort as a physical-physiological phenomenon and expresses human thermal sensation as an outcome of the heat transfer between a human body and its surrounding environment. It is the most widely accepted model, developed through extensive laboratory experiments by Fanger (1970), which became the basis of the standards ISO 7730 (2005) and ASHRAE 55 (2013). In contrast, adaptive models account for people’s inherent ability to adapt to variable environment conditions in naturally-conditioned buildings by drawing a linear relationship between comfortable indoor temperature and prevailing outdoor temperature based on global field study data. Currently, there are mainly two adaptive models standards: the ASHRAE 55 adaptive model by de Dear and Brager (1998) and the EN 15251 adaptive model by

32
Nicol and Humphreys (2002). Despite their successful adoption into international standards, both types of models (PMV and adaptive) have several inherent limitations when applied to comfort management in buildings.
First, a full implementation of the PMV model requires very specific input variables that are costly and difficult to obtain in buildings. Two of the environmental variables – mean radiant temperature and air velocity – are not typically monitored in existing buildings and require expensive instruments to accurately measure (in particular, air velocity). Two personal variables – clothing insulation and metabolic rates – are impossible to collect in an automated fashion, and their values are often assumed or simplified, which undermines the predictive accuracy of the model (Alfano et al., 2011).
Second, even if all of the input variables are accurately obtained, both existing models show poor predictive performance when applied to individuals (Auffenberg et al., 2015; van Hoof, 2008). This is because the models are aggregate models, designed to predict the average comfort of large populations; hence, their accuracy decreases when predicting individuals’ thermal comfort responses due to large variations in thermal comfort between people. The irony is that this is exactly the situation in practice where the models are used – groups of occupants in a building with varying degrees of comfort perception sharing the same thermal zone.
Third, both models do not adapt or re-learn. They are based on a fixed set of data collected from either laboratory (PMV) or the field (adaptive) measurements. Hence, model properties and coefficients may not accurately describe the comfort characteristics of individual occupants in a particular field setting. Unfortunately, there is no provision that allows for the update of either of these existing models based on occupant feedback and field-collected data in new circumstances. Therefore, they cannot be calibrated to better match the relationships in a particular setting.
Lastly, these models do not allow modifications to their respective set of input variables. Only pre-defined variables are entered into the models regardless of the existence of other factors that may affect the actual outcome. New variables (e.g., sex, body mass index, time of day, age, health status, etc.) that may potentially be relevant to the occupants’ thermal comfort in a particular setting cannot be incorporated into the model, thus reducing the potential to improve predictive accuracy and enhance our understanding of contextual impacts on human thermal comfort.
To overcome the drawbacks listed above, both academia and industry have been looking for ways to improve the practical relevance of thermal comfort models for building operations. With the emergence of the Internet of Things allowing us to generate highly granular and personal data, efforts have begun to analyze such data for the prediction of individuals’ thermal comfort. This chapter provides a synthesis of this new research area called personal comfort models.

33
3.3 PERSONAL COMFORT MODELS
DEFINITION
A personal comfort model predicts an individual’s thermal comfort response, instead of the average response of a large population. The key characteristics of personal comfort models are that they: (1) take an individual person as the unit of analysis rather than populations or groups of people; (2) use direct feedback from individuals (e.g., thermal sensation, preference, acceptability, pleasure) and additional relevant data (e.g., personal, environmental, technological), to train a model; (3) prioritize cost-effective and easily-obtainable data; (4) employ a data-driven approach, which allows flexible testing of different modeling methods and potential explanatory variables; and (5) have the capacity to adapt as new data is introduced to the model.
Personal comfort models can be used to better understand specific comfort needs and desires of individual occupants and characterize a set of conditions that would satisfy their thermal comfort in a given space. Such information can inform the design and control decisions of a building or other systems (e.g., vehicle, aircraft, personal comfort systems) to provide optimal conditioning for improved comfort satisfaction and energy efficiency. These qualities are in line with the current trend of intelligent comfort management (Talon and Goldstein, 2015).
REVIEW OF CURRENT STATE OF RESEARCH
In recent years, there have been an increasing number of publications on the topic of personal comfort models. Interestingly, many of these efforts did not originate from the traditional thermal comfort research, but rather consist of independent work across various academic disciplines as well as industry organizations. As such, this research often shows a significant departure from the conventional approach to thermal comfort modeling, and therefore represents a unique perspective and contribution to our field.
To better understand the current state of research and development on personal comfort models, I provide a review of relevant literature published in the past ten years. To address the first two characteristics of personal comfort models noted above, the review only includes studies that focus on individual occupants as a unit of analysis, and use human feedback in the model development. This effectively excludes 1) studies that adopt a data-driven approach to modeling, but predict thermal comfort of general populations rather than individual occupants (Chen et al., 2015; Choi and Yeom, 2017; Dai et al., 2017; Farhan et al., 2015; Ghahramani et al., 2016a; Vissers, 2012), and 2) studies that use synthetic data instead of real-world data to model individuals’ thermal comfort (Ari et al., 2008; Bermejo et al., 2012; Peng and Hsieh, 2017).

34
Table 3-1 summarizes the findings from this literature review. It is organized by data sources, input and output variables, modeling methods, model evaluation, and continuous learning methods, and ordered by the year of publication.
Table 3-1. Summary of major studies of personal comfort models.
Source Data Input variables* Output variables
Modeling methods
Model evaluation Continuous learning methods
Occupant feedback
Physical measurement
Accuracy Convergence
(Li et al., 2017)
Field data from 7 subjects
3-point thermal preference (warmer / no change / cooler), clo, heart rate, skin temperature, activity
Ta, RH, CO2, window state (open/close), Tout, outdoor humidity
3-point thermal preference (warmer / no change / cooler)
Random Forest
Overall accuracy = 80%
80% classification accuracy achieved after 50 samples (60% of the total data)
N/A
(Cheung et al., 2017)
Field data from 15 subjects
Continuous thermal acceptability scale with 4 labels (clearly acceptable / just acceptable / just unacceptable / clearly unacceptable), activity, air-conditioning status, location
Ta, RH, CO2 Continuous thermal acceptability scale with 4 labels (clearly acceptable / just acceptable / just unacceptable / clearly unacceptable)
Gaussian Process
R2 between predicted and actual votes = 0.18 and 0.26 for 2 subjects respectively
N/A N/A
(Lee et al., 2017)
Field data from ASHRAE RP-884 database
3-point thermal preference (warmer / no change / cooler), clo, MET
Ta, MRT, RH, Va
3-point thermal preference (warmer / no change / cooler)
Bayesian inference, clustering
Logloss maximized with optimal number of clusters
N/A N/A
(Jiang and Yao, 2016)
Lab data from 20 subjects
ASHRAE 7-point thermal sensation scale, clo, MET
Ta, MRT, RH, Va
ASHRAE 7-point sensation scale
C-Support Vector, Classification
Mean accuracy: proposed model = 89.8% PMV model = 49.7%
N/A N/A
(Auffenberg et al., 2015)
Field data from ASHRAE RP-884 database
ASHRAE 7-point thermal sensation scale, clo, MET
Top, RH, Tout, seasons
ASHRAE 7-point sensation scale
Bayesian network
17.5 – 23.5% accuracy gains compared to PMV and ASHRAE-55 adaptive models
Root mean square error converged after 10 votes
Full relearning with new votes

35
(Ghahramani et al., 2015)
Field data from 33 subjects
11-point thermal preference scale with 3 labels (cooler /no change / warmer)
Ta 3 comfort conditions (uncomfortably warm / comfortable / uncomfortably cool)
Bayesian network, online learning
Mean accuracy: proposed model = 70.1% PMV model = 56.1%
N/A Kolmogorov-Smirnov test to remove statistically irrelevant data points as new votes are added
(Jazizadeh et al., 2014a)
Field data from 4 subjects
Continuous thermal preference scale with 2 labels (cooler / warmer) at both ends
Ta 5-level thermal sensation index (very cold / cold / neutral / warm / very warm), associated air temperatures
Fuzzy rules Mean error in predicted associated air temperatures = 1.17 °C
N/A N/A
(Zhao et al., 2014b)
Field data from 9 subjects
Continuous thermal sensation scale with 5 labels (hot / warm / neutral / cold / extremely freezing)
Ta, MRT, RH, Va
ASHRAE 7-point thermal sensation scale
Least square estimation
Mean square error: proposed model = 0.53 PMV model = 1.16
N/A Weighted forgetting factor to place more emphasis on recent data and gradually remove historical data
(Zhao et al., 2014a)
Lab data from 11 subjects
2 complaint conditions (too hot / too cold)
Ta, RH 2 complaint conditions (hot / cold)
Classification False positive rate ≤ 0.3
N/A N/A
(Gao and Keshav, 2013)
Field data from 1 subject
ASHRAE 7-point thermal sensation scale
Ta, RH, Va, infrared intensity of clothing
ASHRAE 7-point thermal sensation scale
Least square linear regression
Root mean square error = 0.54, Pearson correlation coefficient = 0.89 between predicted and actual votes
N/A N/A
(Rana et al., 2013)
Field data from 6 subjects
ASHRAE 7-point thermal sensation scale
Ta, RH ASHRAE 7-point thermal sensation scale
Support vector machine, humidex
Overall accuracy = 80%
N/A N/A
(Daum et al., 2011)
Field data from 6 subjects
ASHRAE 7-point thermal sensation scale
Ta Probability of 3 comfort conditions (too hot / comfortable / too cold)
Logistic regression
N/A Model congruency increased from 0.66 to 0.87 after 90 votes based on one subject
Removal of votes older than 30 days in the vicinity of Ta ± 0.25 °C with new data entry
(Feldmeier and Paradiso, 2010)
Field data from 10 subjects
3 comfort states (hot / cold / neutral)
Ta, RH comfort distance from the decision boundary between ‘hot’ and ‘cold’ data points
Linear discriminant
Except for a few points, the predicted comfort states match with the reported comfort state during the study period
N/A Recalculation of the comfort distance with new data entry

36
(Liu et al., 2007)
Field data from 113 subjects
ASHRAE 7-point thermal sensation scale
Ta, MRT, RH, Va
3 comfort conditions (cool / warm / comfort)
Neural network
80% accuracy achieved with 20 samples based on 2 subjects
Neural network converged after 3000 iterations
N/A
*Note: Ta = indoor air temperature, Top = operative temperature, MRT = mean radiant temperature, RH = relative humidity, Va = air velocity, clo = clothing insulation, MET = metabolic rate, CO2 = carbon dioxide level, Tout = outdoor air temperatureKey advances made in this collective research about personal comfort models include (1) improved predictive power with 20-40% accuracy gains compared to conventional comfort models by employing machine learning algorithms, and (2) diversities in types of data and occupant feedback obtained from various sensors and connected devices, well beyond the traditional thermal comfort variables.
Current research gaps include:
• Lack of a unified modeling framework. Research primarily focuses on predictive accuracy of the model rather than developing a systematic approach to build and evaluate the model for general benefits.
• Lack of connection to thermal comfort fundamentals. Previous researchers often apply their own interpretations or assumptions in their proposed models that are not necessarily grounded in existing thermal comfort research.
• Lack of vision for real-world integration. Past research is typically missing efforts to describe how the proposed models can be integrated into real-world systems to enable intelligent comfort management.
• Lack of industry standards. There have been no standardization efforts to guide the development and evaluation of personal comfort models and ensure their performance in building design and control.
3.4 A MODELING FRAMEWORK
Developing a personal comfort model involves the following processes (see Figure 3-1), including:
• Data collection – determine what data will be the basis for the learning algorithms and how to collect it
• Data preparation – process and prepare raw data into the format ready for modeling
• Model selection – select learning algorithms appropriate for the given data and application goals
• Model evaluation – validate predictive performance of the model and readiness for its use in applications
• Continuous learning – update the model based on new data to ensure accuracy and relevance over time
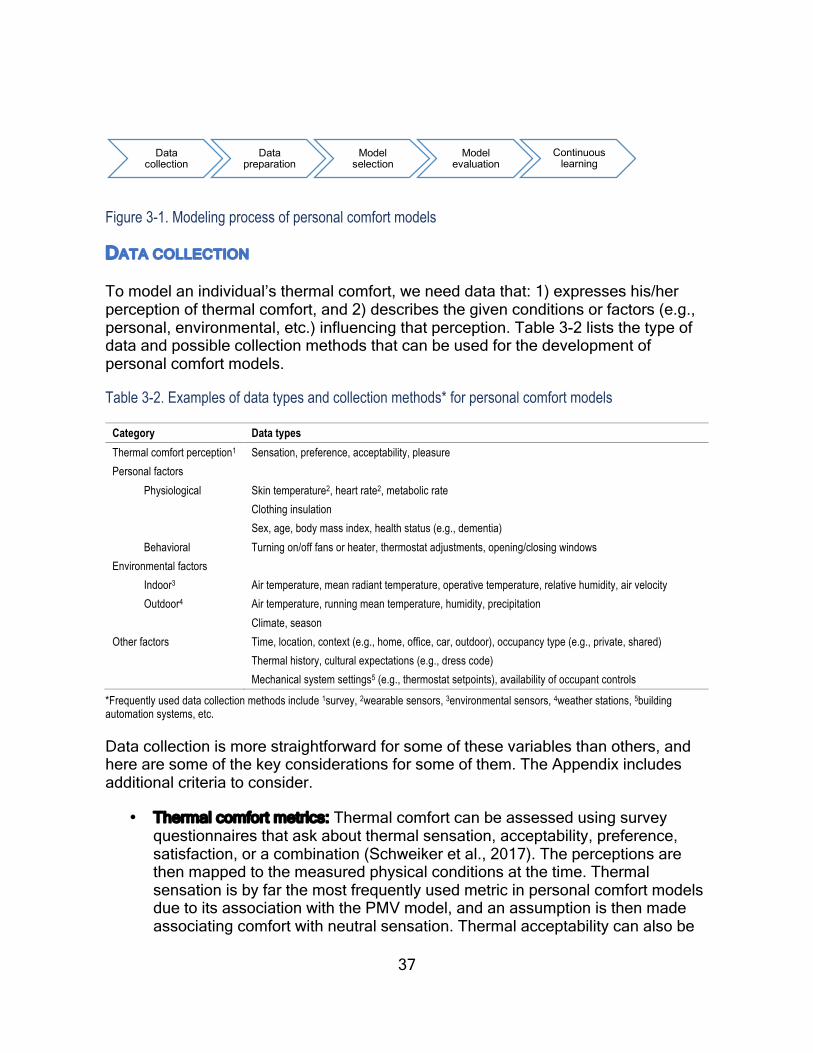
37
Figure 3-1. Modeling process of personal comfort models
DATA COLLECTION
To model an individual’s thermal comfort, we need data that: 1) expresses his/her perception of thermal comfort, and 2) describes the given conditions or factors (e.g., personal, environmental, etc.) influencing that perception. Table 3-2 lists the type of data and possible collection methods that can be used for the development of personal comfort models.
Table 3-2. Examples of data types and collection methods* for personal comfort models
Category Data types Thermal comfort perception1 Sensation, preference, acceptability, pleasure Personal factors
Physiological Skin temperature2, heart rate2, metabolic rate Clothing insulation Sex, age, body mass index, health status (e.g., dementia)
Behavioral Turning on/off fans or heater, thermostat adjustments, opening/closing windows Environmental factors
Indoor3 Air temperature, mean radiant temperature, operative temperature, relative humidity, air velocity Outdoor4 Air temperature, running mean temperature, humidity, precipitation
Climate, season Other factors Time, location, context (e.g., home, office, car, outdoor), occupancy type (e.g., private, shared) Thermal history, cultural expectations (e.g., dress code) Mechanical system settings5 (e.g., thermostat setpoints), availability of occupant controls
*Frequently used data collection methods include 1survey, 2wearable sensors, 3environmental sensors, 4weather stations, 5building automation systems, etc.
Data collection is more straightforward for some of these variables than others, and here are some of the key considerations for some of them. The Appendix includes additional criteria to consider.
• Thermal comfort metrics: Thermal comfort can be assessed using survey questionnaires that ask about thermal sensation, acceptability, preference, satisfaction, or a combination (Schweiker et al., 2017). The perceptions are then mapped to the measured physical conditions at the time. Thermal sensation is by far the most frequently used metric in personal comfort models due to its association with the PMV model, and an assumption is then made associating comfort with neutral sensation. Thermal acceptability can also be
Data collection
Data preparation
Model selection
Model evaluation
Continuous learning
38
used with the assumption that “acceptability” is equated with “comfort”. It is possible that even when people are not in their ideal state of comfort, they may still find it “acceptable”, meaning that it is tolerable or not bad enough to complain. Thermal preference is a closer measure of what ideal conditions would be, and can be effective if the objective is to use it for the control of HVAC (Heating, Ventilation, and Air Conditioning) systems because it suggests a direction of change. Thermal satisfaction is often used in the assessment of buildings during post occupancy evaluations. It is important to understand that different metrics can lead to different assessment of comfort requirements, which can have different energy consequences (Berglund, 1979; Brager et al., 1993). Hence, one can consider the impact of different metrics on both comfort and energy outcome when selecting specific metrics to model individuals’ thermal comfort.
• Variations in scale construction: The standards suggest the use of a 7-point ordered or continuous scale for thermal sensation (‘hot’ to ‘cold’), a 3-point categorical scale for thermal preference (‘warmer’/’no change’/’colder’), and a continuous or 7-point categorical scale for thermal acceptability (‘acceptable’ to ‘unacceptable’) (see Figure 3-2). Although it would be ideal if researchers used standardized scales for consistency and easy comparisons between different models, that is not always the case. Some modelers (Ghahramani et al., 2015; Zhao et al., 2014b) have opted to modify or create new scales to satisfy their own modeling purposes (e.g., 11-point thermal preference scale, 5-point thermal sensation scale). The effects of varying scale points are not yet well understood in thermal comfort research and the existing ones have been challenged (Schweiker et al., 2017). A classic psychology experiment (Miller, 1956) recommends limiting the response options to 5-7 because our ability to make judgments significantly decreases when we are presented with more than 7 alternatives simultaneously.
• Determining survey frequency: Surveying too often can burden occupants, while not surveying enough can lead to insufficient data collection. The reviewed studies applied different survey frequencies. Jiang and Yao (Jiang and Yao, 2016) surveyed subjects every 10 min during the chamber experiments; however, such frequency is not realistic in practice as it can significantly interfere with occupants’ daily tasks. Most field studies limit survey requests to a few times a day (Rana et al., 2013), or to every hour (Zhao et al., 2014b), or allow occupants to freely submit surveys with certain rules in place (e.g., minimum intervals between consecutive surveys) (Ghahramani et al., 2015). Determining the right level of survey frequency can, in part, be best informed by the number of data points required to produce reliable predictions – this is further discussed in 4.4 Model Evaluation.
• Measuring clothing insulation: Most personal comfort models do not include clothing insulation as their input variable. This may be a deliberate choice to reduce the burden of monitoring variables that are difficult to track in real-world settings. The only exception is the study by Gao and Keshav (2013), in which the occupant’s clothing insulation was estimated based on the infrared

39
intensity of clothing measured by an infrared camera installed in the room. However, tracking occupants’ clothing insulation via an infrared camera is not only expensive but can also be perceived as invading one’s privacy. An alternative method is to use the ASHRAE-55 dynamic predictive clothing model (Schiavon and Lee, 2013) to approximate daily clothing pattern based on the early morning outdoor temperature. Although this model would only predict the average clothing of a group of people and does not distinguish between individual differences in clothing choice, it can at least provide an estimated input that follows climate variations.
• Physiological and behavioral data: Personal data about either comfort-related physiological states of the body or behavioral coping strategies are most commonly obtained via surveys. As such, the data collection is often stochastic and the data accuracy is difficult to validate due to the self-reported and self-measured nature of survey responses. Hence, one might supplement surveys with objective methods of collecting individual-specific data to ensure consistency and quality of the data that can be integrated into personal comfort models. As examples, research shows that wearable sensors or connected devices can provide continuous data tracking of occupants’ physiological conditions (e.g., skin temperature, heart rate) (Choi et al., 2012; Vissers, 2012; Hamatani et al., 2015; Ghahramani et al., 2016a; Cheng et al., 2017; Choi and Yeom, 2017; Li et al., 2017) or behavioral actions (e.g., personal fan use, thermostat adjustments) (Bermejo et al., 2012; Li et al., 2017).
• Challenging environmental measurement: Radiant temperature and air velocity are often omitted or simplified in the development of personal comfort models, largely because modelers intentionally target easily obtainable data and the instrumentation to collect these variables is costly. However, several studies (Alfano et al., 2011) have shown that these variables significantly affect thermal comfort predictions. Efforts are underway to reduce the cost and increase the capabilities (e.g., wireless data transfer, longer battery life, reduced equipment size) of these instruments for scalable and automated data collection in practice (e.g., Hamilton wireless sensor (Andersen, 2017)).
• Other influencing factors: Other factors that may influence individuals’ thermal comfort include, but are not limited to, time factors (e.g., hour, day, season) (Auffenberg et al., 2015; Chun et al., 2008); thermal conditioning systems and settings (e.g., active or passive systems, heating/cooling setpoints, availability of occupant control) (Brager et al., 2004; de Dear and Brager, 1998); building types (e.g., home vs. office) (Karjalainen, 2009; Oseland, 1995); culture (e.g., socio-economic status, dress code) (Brager and de Dear, 1998; Shove, 2004; Shove et al., 2008); health, mood, demographic attributes (e.g., sex, age) (Indraganti and Rao, 2010; Karjalainen, 2007; van Hoof et al., 2017); and thermal history (e.g., living/working in air-conditioned vs. naturally ventilated buildings, temperature cycles and ramps, short and long term thermal exposure) (Brager and de Dear, 1998; Chun et al., 2008; Kolarik et al., 2009; Zhang and de Dear, 2017). Many of these factors can be easily obtained

40
without instrumentation to record. Hence, efforts are needed to evaluate their importance in predicting individuals’ thermal comfort.
• Prioritizing data collection: In practice, it may not be possible to capture all the relevant information one needs to develop a personal comfort model. The degree to which a certain data type is relevant for a particular individual or physical setting may not be apparent. I recommend an iterative approach by first targeting the most relevant data for human thermal comfort, and the most easily obtainable data for a particular setting, to build the initial model; subsequent steps could then expand the datasets as needed to improve the model. Note that certain variables may not contribute much to the predictive power of the model initially or continuously; however, their relative contributions can change over time. For example, humidity may have more of an effect in warmer seasons than others, or mean radiant temperature may have an effect only during times when there is direct solar gain into the space. Hence, it is useful to create a repository of relevant data and periodically update the model to reflect changing relationships in the data.
Figure 3-2. Examples of thermal comfort scales (Adopted from ISO 10551 (ISO, 1995))
DATA PREPARATION
Personal comfort models integrate highly heterogeneous data sets that are often presented in different structures, granularity, and volume. Therefore, it is important to prepare the raw data into a format ready for modeling. This involves (1) cleaning missing values, outliers, and measurement errors that can misrepresent the general trends in observed data; (2) feature scaling to normalize numerical data into a consistent range and mean when different scales can skew the model outcome (e.g., distance-based clustering) or affect computational speed (e.g., gradient descent); (3) aggregating to reduce the volume and granularity of the data by summarizing raw values into statistically representative values (e.g., mean) or grouping into discrete categories (e.g., Yes/No); (4) feature creation to explore new variables (e.g., rate of temperature change) drawn from the raw data that may influence individuals’ thermal comfort; (5) merging to combine time-series data from heterogeneous sources with

41
different logging intervals and frequencies; and (6) partitioning to split the data set into training and test sets in order to evaluate and fine-tune the trained model based on new data.
MODEL SELECTION
Personal comfort models often explore non-traditional data types and relationships in order to better predict individuals’ thermal comfort. Because of this, there is a strong interest in adopting machine learning to make predictions directly from the patterns learned from the data. This is a significant departure from the traditional modeling approach which was predominantly based on statistical modeling (e.g., linear regression) to discover generalizable findings. There are many algorithms available in machine learning, and so it is easy to get overwhelmed when trying to select one for personal comfort models.
One way to help navigate the different algorithms is to identify the type of predictions expected from the model. The predictions of personal comfort models can be numerical (e.g., comfortable temperatures), or categorical (e.g., thermal preference classification – ‘warmer’/ ‘no change’/ ‘cooler’). Moreover, one can evaluate whether the underlying assumptions and rules adopted by these algorithms are appropriate for the given dataset (e.g., data size, quality) and application goals (e.g., real-time thermostat control). To guide the selection of appropriate algorithms for personal comfort models in particular, I first briefly describe the functional distinctions of popular machine learning algorithms in a general way (Witten et al., 2016).
• Regression algorithms predict response variables by establishing mathematical relationships between different variables. Examples include ordinary least squares, linear, and logistic regressions. Since regression algorithms require specific mathematical equations to express the relationships between variables, their predictive performance depends on how accurately these equations represent the true relationships in the real-world. The predicted outcomes are usually numerical as the regression is drawn from continuous data. However, one can use logistic regression to transform linear predictions into probability outcomes between 0 and 1 in order to generate categorical predictions.
• Decision tree algorithms construct a tree-like model that predicts the target response by learning decision rules inferred from the data. Examples include Classification and Regression Tree (CART) and conditional decision trees. They can be used for both numerical and categorical predictions. Although these algorithms perform fast with large datasets, they are prone to overfitting. One can use more advanced tree algorithms such as Random Forests or Gradient Boosted Trees to reduce the risk of overfitting by aggregating predictions of many decision trees.

42
• Bayesian algorithms apply Bayes’ Theorem to make predictions based on the probability of prior events. Examples include Naïve Bayes and Bayesian Network. Bayes’ Theorem assumes all input features are independent from one another despite the fact that such independence rarely occurs in reality. However, Bayesian algorithms tend to perform fairly accurately and can efficiently handle large datasets (Bishop, 2006). They can be used for both numerical and categorical predictions.
• Kernel algorithms map input data into a higher dimensional vector space to model non-linear relationships or patterns. Examples include Support Vector Machines, Radial Basis Function, Gaussian Process, and Linear Discriminant Analysis. They can be effective at modeling complex problems such as human thermal comfort and are fairly robust against overfitting (Hofmann et al., 2008). However, kernel algorithms can become computationally expensive with high dimensional datasets. They can be used for both numerical and categorical predictions.
MODEL EVALUATION
The goal of model evaluation is to assess how good the model is in predicting individuals’ thermal comfort, identify aspects of the model in need of improvement, and provide the basis for comparing different models. I list the following criteria that can help the evaluation process.
• Prediction accuracy assesses how correctly the model predicts. This is typically measured based on the differences between the predicted outcome and true outcome. For numerical predictions (e.g., acceptable temperature), frequently used metrics include the square of the Pearson correlation coefficient (R2) and root mean square error (RMSE). For classifications (e.g., thermal preference), common metrics include classification accuracy (i.e., the fraction of all instances that are correctly classified) and Receiving Operating Characteristics (ROC) (Hanley and McNeil, 1982). Note that when the model produces probability estimates, calculating prediction accuracy requires a threshold to separate one class from another. Also, evaluating the model accuracy of different classes require an understanding of their respective misclassification costs as predicting a particular class wrong may have bigger consequences than others. See the Appendix for a further discussion of the optimal thresholds and misclassification costs.
• Prediction consistency assesses how much the model predictions vary from one sample to another. This helps to evaluate the generalizability of a model outside of the training samples. I can measure prediction consistency as the degree of spread in predicted values within or across different test sets for numerical estimations, and as the degree of spread in prediction accuracy across different test sets for classifications. Prediction consistency can be expressed using metrics such as variance, standard deviation, or confidence interval.
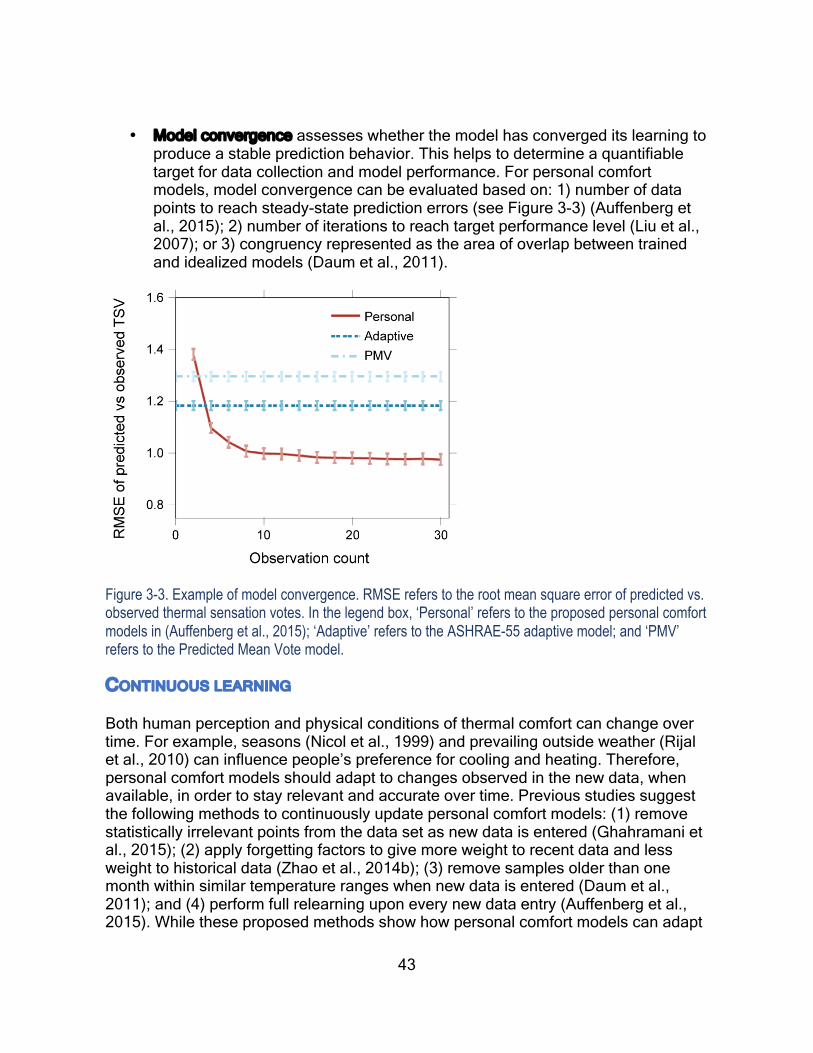
43
• Model convergence assesses whether the model has converged its learning to produce a stable prediction behavior. This helps to determine a quantifiable target for data collection and model performance. For personal comfort models, model convergence can be evaluated based on: 1) number of data points to reach steady-state prediction errors (see Figure 3-3) (Auffenberg et al., 2015); 2) number of iterations to reach target performance level (Liu et al., 2007); or 3) congruency represented as the area of overlap between trained and idealized models (Daum et al., 2011).
Figure 3-3. Example of model convergence. RMSE refers to the root mean square error of predicted vs. observed thermal sensation votes. In the legend box, ‘Personal’ refers to the proposed personal comfort models in (Auffenberg et al., 2015); ‘Adaptive’ refers to the ASHRAE-55 adaptive model; and ‘PMV’ refers to the Predicted Mean Vote model.
CONTINUOUS LEARNING
Both human perception and physical conditions of thermal comfort can change over time. For example, seasons (Nicol et al., 1999) and prevailing outside weather (Rijal et al., 2010) can influence people’s preference for cooling and heating. Therefore, personal comfort models should adapt to changes observed in the new data, when available, in order to stay relevant and accurate over time. Previous studies suggest the following methods to continuously update personal comfort models: (1) remove statistically irrelevant points from the data set as new data is entered (Ghahramani et al., 2015); (2) apply forgetting factors to give more weight to recent data and less weight to historical data (Zhao et al., 2014b); (3) remove samples older than one month within similar temperature ranges when new data is entered (Daum et al., 2011); and (4) perform full relearning upon every new data entry (Auffenberg et al., 2015). While these proposed methods show how personal comfort models can adapt

44
to changes over time, only Ghahramani et al. (Ghahramani et al., 2015) tested their proposed method against an actual dataset. Hence, more efforts are needed to evaluate these methods as well as other promising methods against real data. Lastly, techniques for continuous learning should be performed efficiently in a scalable fashion to handle the growing volume of data collected from various connected sensors and devices.
3.5 INTEGRATION INTO THERMAL CONTROLS
Integrating personal comfort models into indoor environmental control of buildings or other systems (e.g., vehicle) offers an opportunity to respond to individuals’ comfort needs and desires in everyday comfort management. Such integration requires the following major technological components, as shown in Figure 3-4.
Connected sensors and devices enable collection of input data for the development of personal comfort models (e.g., thermal comfort perception, personal and environmental measurements). For occupants’ thermal comfort, personal computers or mobile devices are an effective way to collect survey feedback on current thermal perception. For physiological data, wearable devices or infrared cameras with communication capabilities can help to monitor occupants’ heart rate, skin temperature, metabolic activity, etc. For behavioral data, one can leverage various connected devices or mobile applications available in the market (e.g., occupancy sensor, pedometer, GPS tracker, smart thermostat) to track individuals’ occupancy status, location, movements, and heating and cooling behavior. HVAC systems typically monitor air temperature and sometimes carbon dioxide levels via environmental sensors installed in thermal zones. They also track control settings (e.g., heating and cooling setpoints, airflow rate) that drive the thermal condition in each zone. Additional environmental sensors with wireless connections can be installed to monitor individuals’ local environmental conditions and provide additional coverages in the building’s environmental sensor network. For outdoor environmental conditions, one can set up a local weather station or access a public record of weather information available online.
Network and connectivity enables data transfer from various sensors and devices to a central server. The sensors or devices can transmit data directly to the server or through a local network hub or gateway via various wireless and wired communication channels (e.g., Wi-Fi, RFID, Bluetooth, Cellular, Ethernet). The HVAC sensors and control settings can be obtained from the building’s BAS (Building Automation System) trend logs. Sending the BAS data to the server may require a communication driver to interface the BAS software. The frequency of data reporting can range from several minutes to a few seconds depending on the time resolution required by the controller to make control decisions.
A central server hosts the function of data warehousing, analytics, optimization, and actuation commands. 1) Data warehousing refers to the electronic storage of historic

45
data collected from different sources. It supports archives and queries of historic thermal comfort data. 2) Analytics includes the function of developing and updating personal comfort models as well as synthesis of real-time information and model predictions to determine which control actions needed to improve thermal satisfaction in the occupied spaces. 3) Optimization processes recommendations from the analytics and determines the best course of actions that would support the organization’s comfort goals and other interacting or competing goals (e.g., energy efficiency, cost savings). Dounis and Caraiscos (2009) provide a comprehensive review of advanced control algorithms for optimization that can be used to manage occupants’ thermal and illuminance comfort, indoor air quality and energy conservation. 4) Actuation commands involves sending specific instructions to controllers including the type of systems (e.g., HVAC systems, ceiling fans), control settings (e.g., thermostat setpoints, terminal air flow rate), spatial scales (e.g., whole building, single thermal zone), time factors (e.g., duration, schedules), etc.
The controllers receive actuation commands from the server to drive the operation of thermal conditioning systems. In commercial buildings, the controller is typically a BAS which controls the building’s HVAC systems. But, it can also be other systems that provide thermal conditioning with the capability to electronically receive actuation commands (e.g., Nest, ecobee). The server can use the system’s communication protocols (e.g., BACnet) or Application Programming Interface (API), if available, to send actuation commands to the controller. The challenge of working with these communication protocols or APIs includes the lack of public access and standardization – without these it is difficult to develop new applications that leverage existing systems and scale them across different systems. sMAP (Simple Measuring and Actuation Profile) is an open source information exchange and actuation platform that can greatly simplify the interaction between the server and different control systems due to its vendor-agnostic approach that unifies control access points (Dawson-Haggerty et al., 2010).
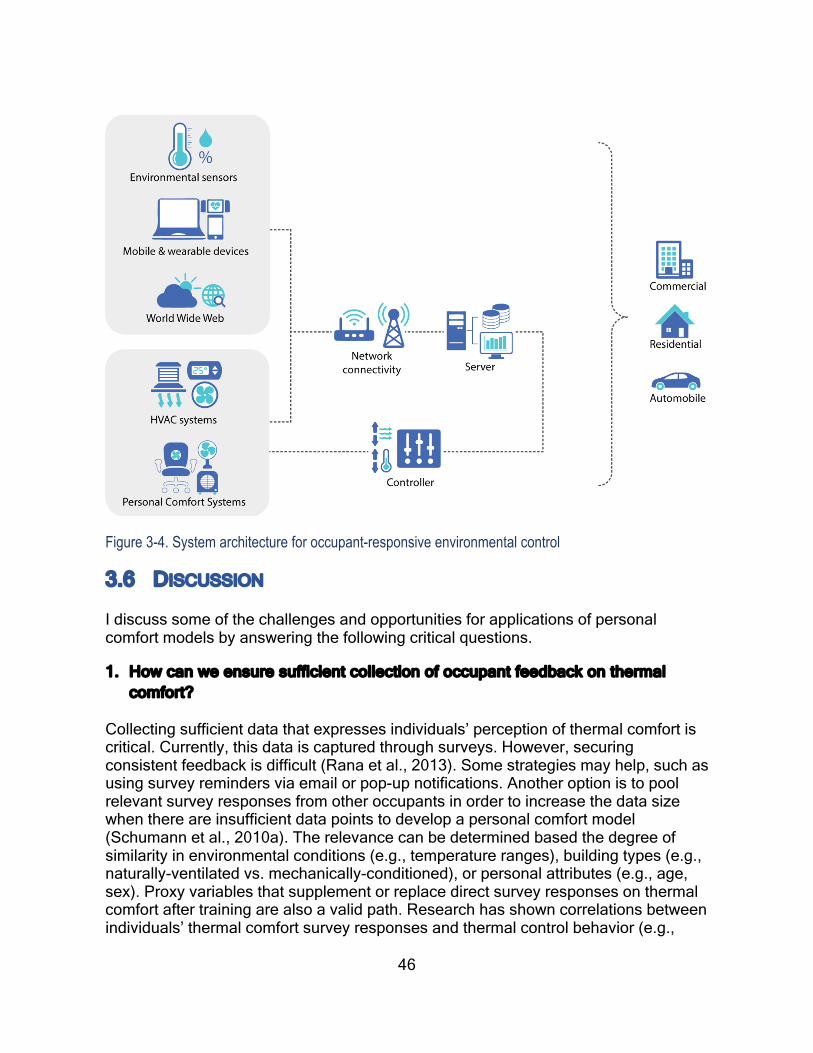
46
Figure 3-4. System architecture for occupant-responsive environmental control
3.6 DISCUSSION
I discuss some of the challenges and opportunities for applications of personal comfort models by answering the following critical questions.
1. How can we ensure sufficient collection of occupant feedback on thermal comfort?
Collecting sufficient data that expresses individuals’ perception of thermal comfort is critical. Currently, this data is captured through surveys. However, securing consistent feedback is difficult (Rana et al., 2013). Some strategies may help, such as using survey reminders via email or pop-up notifications. Another option is to pool relevant survey responses from other occupants in order to increase the data size when there are insufficient data points to develop a personal comfort model (Schumann et al., 2010a). The relevance can be determined based the degree of similarity in environmental conditions (e.g., temperature ranges), building types (e.g., naturally-ventilated vs. mechanically-conditioned), or personal attributes (e.g., age, sex). Proxy variables that supplement or replace direct survey responses on thermal comfort after training are also a valid path. Research has shown correlations between individuals’ thermal comfort survey responses and thermal control behavior (e.g.,

47
thermostat adjustments) (Bermejo et al., 2012) and physiological conditions (e.g., heart rate, skin temperature) (Choi et al., 2012; Ghahramani et al., 2016a; Choi and Yeom, 2017; Dai et al., 2017; Nkurikiyeyezu et al., 2017), both of which can be measured continuously via non-intrusive monitoring technologies (e.g., smart thermostats, wearable sensors). Hence, they could potentially be used in personal comfort models as proxy variables to infer individuals’ thermal comfort.
2. How can personal comfort models be generalizable to a larger population?
Personal comfort models are designed to predict thermal comfort for a single person; hence, they are not necessarily directly applicable to other occupants. However, as the size and diversity of data increases, repeatable patterns may surface that can be generalized to a larger population. For example, grouping of models may form to provide general descriptions about thermal comfort that can be attributed to certain population segments (e.g., gender, age) or space types (e.g., office, home, car). These repeatable patterns can serve as the foundation for creating generalizable thermal comfort profiles. The profiles can provide several benefits to the building industry at large, including serving as: 1) reasonable baseline models that can be readily applied to a new person who does not yet have a personal comfort model or whose personal comfort model is still under development; 2) a set of thermal comfort profiles that can be used for building/system design and operation to better characterize specific thermal comfort requirements across different segmentations of the building population; and 3) a more realistic building energy estimation that reflects the differences in individuals’ thermal comfort requirements in HVAC control settings
3. How can we resolve the differences in thermal preferences among the occupants in shared spaces?
This is not a new problem. It exists whether personal comfort models are available or not. With personal comfort models, such differences are revealed and quantified so that they can be addressed. The existing studies have explored two approaches regarding this issue: 1) consensus-based solutions, and 2) technological solutions (for either individuals or groups), often with overlaps between them.
For consensus-based solutions, Jazizadeh et al. (2014a) selected a temperature setpoint that minimized the error between everyone’s preferred and actual room temperatures. In the case that acceptable comfort levels could not be achieved for all occupants in a zone, Ghahramani et al. (2014) incrementally increased the acceptable temperature range of individuals within a pre-defined discomfort threshold. Murakami et al. (2007) determined the temperature setpoint by a majority vote. Lee et al. (2008) assigned varying priorities to different occupant groups (e.g., more emphasis on employees over visitors) in order to determine optimal temperature in public zones. Although these strategies needed a system to ultimately adjust the setpoint, the underlying decision making was consensus-based.
48
For technological solutions, Erickson and Cerpa (2012) enabled real-time thermostat setpoint adjustments based on occupants’ requests to address the comfort issues in shared spaces as they occur. However, this scheme can introduce potential gaming of the system and biases toward more vocal occupants. To reduce these effects, they limited the vote per person to one in every 10 min and averaged the votes to determine the new temperature setpoint at the end of the voting period. Another example of a technological solution used personal comfort systems (PCS) to provide local heating and cooling without affecting others in the same space (Zhang et al., 2015b). With PCS, individuals can address their own comfort needs or desires in shared spaces, and therefore be less vulnerable to the thermal conditions set by the centralized systems. In shared spaces, increasing the granularity of the control (e.g., lowered number of occupants per variable air volume box) is also a technological solution that could help.
4. What is the impact on energy when using personal comfort models to make control decisions?
The ultimate goal for improved building operation is to simultaneously improve both energy and comfort performance, but many people still view this as a tradeoff where you can only improve one at the expense of the other. Conceptually, personal comfort models can help improve performance in both comfort and energy by providing information about individuals’ thermal comfort requirements, such as acceptable temperature limits for a given space. If the acceptable temperature limits are greater than the default temperature setpoint ranges, one can expect HVAC energy savings (i.e., fans, reheat) by widening the temperature setpoints (Ghahramani et al., 2016b; Hoyt et al., 2015b; Schiavon and Melikov, 2008; Sekhar, 1995). Examples of demonstrated energy savings include: 10% energy savings by implementing real-time setpoint control using individuals’ online requests (2012); more than 20% savings using the consensus-based temperature control strategy (2007); up to 24% by adjusting temperature setpoints based on hot or cold complaints by the occupants (2010); 39% reduction in daily average airflow by resetting temperature setpoints according to occupants’ preferred temperatures (2014a); and 51% reduction in daily average air flow by allowing occupants’ comfort level to slightly deviate from their preferred temperatures (2014). These savings are based on the volume of energy consumption (i.e., kWh). The buildings can also save on the utility cost (i.e., $) under variable rates and demand charges by dynamically adjusting HVAC loads during peak hours.
Whether such savings are transferable to another zone or another building depends on the thermal comfort requirements of individuals in a given space. It also depends on how acceptable temperature limits are defined, such as which thermal comfort metric (i.e., thermal sensation, acceptability, preference) is used to determine comfort conditions in the personal comfort model. For example, anchoring the model on thermal acceptability can lead to wide temperature ranges that are tolerable but not ideal. On the other hand, thermal preference, which can be considered the most

49
idealistic metric, can lead to very narrow temperature ranges that are energy-intensive to maintain. Instead of relying on a single metric, we can develop an integrated model that takes into account multiple metrics. This can lead to a more holistic representation of individuals’ thermal comfort (Langevin et al., 2013) and allow greater flexibility to make control decisions to support various organizational goals (e.g., comfort, energy, cost).
5. What is the role of standards with respect to personalized thermal comfort models?
Existing standards take prescriptive approaches to thermal comfort provision by specifying detailed criteria of an acceptable thermal environment that would satisfy the majority of occupants (i.e., 80%). However, a very small percentage of buildings fulfil this objective. Data-driven occupant-centric comfort management is gaining attention among progressive and forward-thinking building professionals (Talon and Goldstein, 2015). Personal comfort models can play an essential role in this new paradigm by generating accurate predictions of individuals’ comfort requirements and closing the loop between occupants and HVAC systems. However, the existing personal comfort models have been independently developed by both academics and corporations and are not always in agreement with the standards’ approach to thermal comfort assessment. Hence, these research efforts need to be guided in order to assure accurate and reliable performance of the model, and to create a more standard protocol for different applications.
Standards can play an important role by allowing a performance-based approach to thermal comfort provision, thus allowing more flexibility in buildings to accommodate context- and occupant-specific comfort requirements that cannot currently be satisfied by the traditional prescriptive approach. Towards this end, standards should provide guidelines for this performance-based approach, addressing data collection, privacy and security requirements for data storage and access, and the development, testing, validation, and implementation of the custom models in buildings.
3.7 SUMMARY
A personal comfort model is a new approach to thermal comfort modeling that predicts individual’s thermal comfort responses, instead of the average response of a large population. In particular, it leverages Internet of Things and machine learning to learn individuals’ comfort requirements directly from the real-world data. The review of the existing personal comfort models shows improved predictive power compared to conventional comfort models (PMV, Adaptive). However, they lack in the following areas: systematic modeling processes, thermal comfort fundamentals, vision for real-world integration, and standardization efforts. To address these gaps, I developed a definition of personal comfort models and proposed a unified modeling framework by establishing important concepts and methodologies based on prior thermal comfort

50
research and machine learning best practice. The modeling framework focused on data collection and preparation, model selection and evaluation, and continuous learning. I provided system architecture for the integration of personal comfort models in thermal controls, and described the potential role of standards in providing guidance to assure accurate and reliable performance of personal comfort models in real-world applications.
Personal comfort models can benefit the building industry by providing necessary data to improve the level of thermal comfort among occupants and optimize energy use in buildings. With advances in comfort technologies penetrating the built environment, the demand for personalized thermal experience will increase. To meet this demand, more research is needed to turn the insights generated from personal comfort models into actionable control strategies in order to yield a tangible impact on people’s comfort satisfaction in buildings. I hope that my work has provided a foundation for that to occur.
The next chapter provides a practical example of how the proposed framework in this chapter can be implemented by developing personal comfort models using the PCS field study data presented in Chapter 2.

51
4 DEVELOPING PERSONAL COMFORT MODELS USING
OCCUPANT HEATING AND COOLING BEHAVIOR
4.1 BACKGROUND
Providing an acceptable indoor environment is one of the primary functions of buildings as it affects occupant satisfaction (Frontczak et al., 2012; Wagner et al., 2007), health (Allen et al., 2015; Fisk and Rosenfeld, 1997), and productivity (Leaman and Bordass, 1999; Tham and Willem, 2010; Wargocki et al., 2000; Wyon, 2004). Thermal comfort, in particular, is of great importance because it drives the operation of HVAC (heating, ventilating, and air conditioning) systems which consume 50% of building energy use in developed countries (Pérez-Lombard et al., 2008). To establish criteria for thermal comfort in building design and operation, the standards (ANSI/ASHRAE, 2013; CEN, 2007; ISO, 2005) use two main models – Predictive Mean Vote (PMV) and adaptive comfort models, and specify a set of thermal conditions that would satisfy a majority (80%) of the occupants. The PMV model (Fanger, 1970) provides a mathematical expression of occupants’ thermal sensation in terms of environmental (air temperature, radiant temperature, air speed, humidity) and personal (metabolic rate, clothing insulation) factors. Fanger derived the model from chamber experiment data based on heat balance principles, which is now the default thermal comfort model for building design and operation. The adaptive models (de Dear and Brager, 1998; Nicol and Humphreys, 2002) provide a linear regression of acceptable indoor operative temperatures, derived from field study data, as a function of outdoor temperature, and are an alternate thermal comfort model for naturally-conditioned spaces.
However, both PMV and adaptive models have inherent limitations when used to predict occupants’ comfort in real buildings. First, both PMV and adaptive models show poor predictive accuracy when applied to a small group of people or individuals because they are designed to predict the average comfort of a large population (Auffenberg et al., 2015; van Hoof, 2008). Second, a full implementation of the PMV model requires very specific input variables (e.g., air speed, metabolic rate, clothing insulation) that are costly and difficult to obtain in the real-world settings and therefore, they are often assumed or simplified. Third, the models do not allow additions to their respective set of input variables; hence new variables that show relevance to the occupants’ thermal comfort in the real-world settings cannot be incorporated in their predictions (e.g., sex, body mass index, time of day, etc.). Lastly, the model properties (e.g., function, coefficients) are fixed by the original data set (i.e., laboratory data for the PMV model, and field data for the adaptive models), and cannot be updated to reflect the actual comfort conditions of individuals in a particular setting.

52
To overcome the drawbacks listed above, I propose a new modeling approach called a personal comfort model. A personal comfort model predicts individuals’ thermal comfort responses instead of the average response of a large population. The key characteristics of personal comfort models are that they: (1) take an individual person as the unit of analysis rather than populations or groups of people; (2) use direct feedback from individuals and relevant data to train a model; (3) prioritize cost-effective and easily-obtainable data; (4) employ a data-driven approach, which allows flexible testing of different modeling methods and potential explanatory variables; and (5) has the capacity to adapt as new data is introduced to the model. Personal comfort models can be used to better understand specific comfort needs and desires of individual occupants and characterize a set of conditions that would satisfy their thermal comfort in a given space. Such information can inform the design and control decisions of a building or a system to provide optimal conditioning for improved comfort satisfaction and energy efficiency. These qualities are in line with the current trend of intelligent comfort management (Talon and Goldstein, 2015).
In recent years, an increasing number of studies (Auffenberg et al., 2015; Cheung et al., 2017; Daum et al., 2011; Ghahramani et al., 2015; Jazizadeh et al., 2014b; Jiang and Yao, 2016; Liu et al., 2007; Rana et al., 2013) have attempted to develop different forms of personal comfort models in order to describe unique comfort characteristics of individual occupants based on the data collected from the actual spaces. These models predict individuals’ thermal comfort by correlating environmental measurements with occupant feedback obtained via survey. The machine learning algorithms employed for their model development include support vector machine, neural networks, fuzzy rules, logistic regression, Gaussian process, and Bayesian network. The results showed significantly improved predictive accuracy (17-40% gain) compared to conventional comfort models (PMV, adaptive), reinforcing the need for an individualized approach to predict thermal comfort. One study (Ghahramani et al., 2014) showed the integration of personal comfort models in thermostat control to determine optimal temperature setpoints for select zones. The results showed a 12% reduction in average airflow rate in tested zones while maintaining or improving comfort. While these studies suggest a promising role of personal comfort models in comfort prediction and building control, they share a common drawback – using surveys as the sole mechanism to obtain occupant feedback about thermal comfort as an ongoing part of building operations. In practice, securing sufficient data collection through surveys for training the model is difficult due to the potential fatigue and eventual decay in participation (Rana et al., 2013). Without sufficient comfort feedback, a personal comfort model cannot describe individual-specific comfort needs and desire. Hence, an alternative and/or supplementary feedback source that informs about individuals’ thermal comfort is needed for the development of personal comfort models.
Research shows that tracking occupant behavior with thermal control devices (e.g., thermostats, fans) can be non-intrusive yet provide additional data points that can be used to infer individuals’ thermal comfort (Bermejo et al., 2012). Individuals interact

53
with thermal control devices available in the space to meet their cooling and heating needs; hence, the resulting behavior can be regarded as an expression of one’s thermal preference. The difference is that we can record behavior in a far less intrusive way than surveys. Personal Comfort System (PCS) such as a heated and cooled chair (hereinafter referred to as a PCS chair) provides local heating and/or cooling via embedded heating strips and fans (Figure 2-1) (Watanabe et al., 2009; Pasut et al., 2015; Arens et al., 2015). With personally-owned thermal control devices such as PCS, we can trace the associated behavior back to individual occupants, creating a direct link to personal comfort. However, no studies have used records of occupant behavior with personally-owned thermal control devices for individuals’ comfort predictions.
In this chapter, I present a novel approach for developing personal comfort models that use occupant behavior with PCS chairs to predict individuals’ thermal preference. In addition, I offer the following contributions to the field of thermal comfort modeling: (1) evaluating new variables (i.e., behavior, time factors, system control settings) that may affect thermal comfort; (2) comparing the performance of six machine learning algorithms (i.e., Classification Tree, Gaussian Process Classification, Gradient Boosting Method, Kernel Support Vector Machine, Random Forest, Regularized Logistic Regression) for the development of personal comfort models; and (3) developing evaluation criteria that account for prediction accuracy, variability, and convergence of personal comfort models.
LINKING BEHAVIOR TO THERMAL COMFORT
Occupants interact with a variety of building elements (e.g., thermostats, fans, local heaters, shades, operable windows, etc.) that impact their comfort. Starting with the premise that, when experiencing discomfort, “people react in ways which tend to restore their comfort”– such reaction is described as adaptive behavior (Humphreys and Nicol, 1998). Field studies show ample evidence of adaptive behavior displayed through the use of various thermal control devices available in buildings (Brager et al., 2004; Inkarojrit, 2005; Karjalainen, 2009; Raja et al., 2001; Warren and Parkins, 1984; Zhang and Barrett, 2012). Opening windows for a cool breeze and turning up the thermostat to heat the room are examples of adaptive behavior. With the lowered cost of sensors and ubiquitous wireless connectivity in buildings, tracking occupants’ interaction with thermal control devices has become more affordable over the years. Once the initial infrastructure is installed, continuous data acquisition can be automated, requiring no additional work by the occupants other than their normal behavior. Hence, thermal control devices provide an excellent platform to learn about occupants’ thermal preferences.
Most existing literature to date has studied thermal control behavior and thermal comfort in isolated manners without quantitatively linking the two. Behavior literature (Andersen et al., 2013; Fritsch et al., 1990; Haldi and Robinson, 2009; Herkel et al., 2008; Yun et al., 2009) tends to focus on predicting the state of thermal control

54
devices to estimate their effects on the indoor environment, without analyzing the impact on comfort. Conversely, comfort literature (Brager et al., 2004; de Dear and Brager, 1998; Nicol and Humphreys, 2002) generally focuses on assessing the thermal comfort of occupants who have access to those devices without explicitly accounting for their actual control actions. Understanding the link between the two can provide insights into the underlying comfort drivers behind the control actions. A few studies (Haldi and Robinson, 2010; Langevin et al., 2015; Liu et al., 2013) map thermal control actions to occupants’ comfort to quantitatively describe the relationship between the two. However, their unit of analysis is individual devices that are typically shared in buildings (e.g., windows). As such, their findings cannot be personalized (with the exception of private offices). Despite the substantial use of personally-owned thermal control devices (e.g., desk fans, space heaters) when available, only two studies (Langevin et al., 2015; Nicol, 2001) addressed them, but their analysis is based on aggregated users instead of following individuals. Characterizing individuals’ thermal control behavior is important since occupants often have different thermal preferences. This research gap represents an excellent opportunity to learn individuals’ thermal preferences based on their behavior with personally-owned thermal control devices.
CONNECTED PCS CHAIR AND CONTINUOUS DATA
Personal comfort system (PCS) refers to heating and cooling devices that allow individuals to control their local thermal environment to meet their comfort needs or desires (Veselỳ and Zeiler, 2014; Zhang et al., 2015b). The current practice of delivering uniform thermal conditions does not account for individual differences in comfort requirements. Grivel and Candas (Grivel and Candas, 1991) show that the standard deviation in individual differences in preferred temperature is 2.6°C, all other things being equal. But given the natural variations in people’s clothing and activity levels, differences in people’s preferred temperature in the same building are likely to be even greater. Hence, it is impossible to satisfy everyone sharing the same space with a single thermostat. PCS offers a complementary solution to centralized systems by creating a highly customizable microclimate zone in an occupant’s workstation without affecting others in the same space. In this case, the centralized system is then responsible for maintaining ambient conditions within a range in which the PCS can correct for each individual’s thermal comfort needs, instead of a much narrower range that is a compromise for all occupants in that space. The wider range of acceptable ambient temperature conditions will allow HVAC systems to operate under a wider temperature setpoints, leading to significant energy savings (Sekhar, 1995; Schiavon and Melikov, 2008; Hoyt et al., 2015b; Ghahramani et al., 2016b).
PCS comes in many different forms including personal fans (desk, tower, standing), personal heaters (convective, radiant, or conductive), and systems such as heated and/or cooled chairs. These devices target sensitive body parts that can have a significant influence on the whole-body thermal comfort. Studies have shown that local cooling and heating via PCS can improve thermal satisfaction (Bauman et al.,
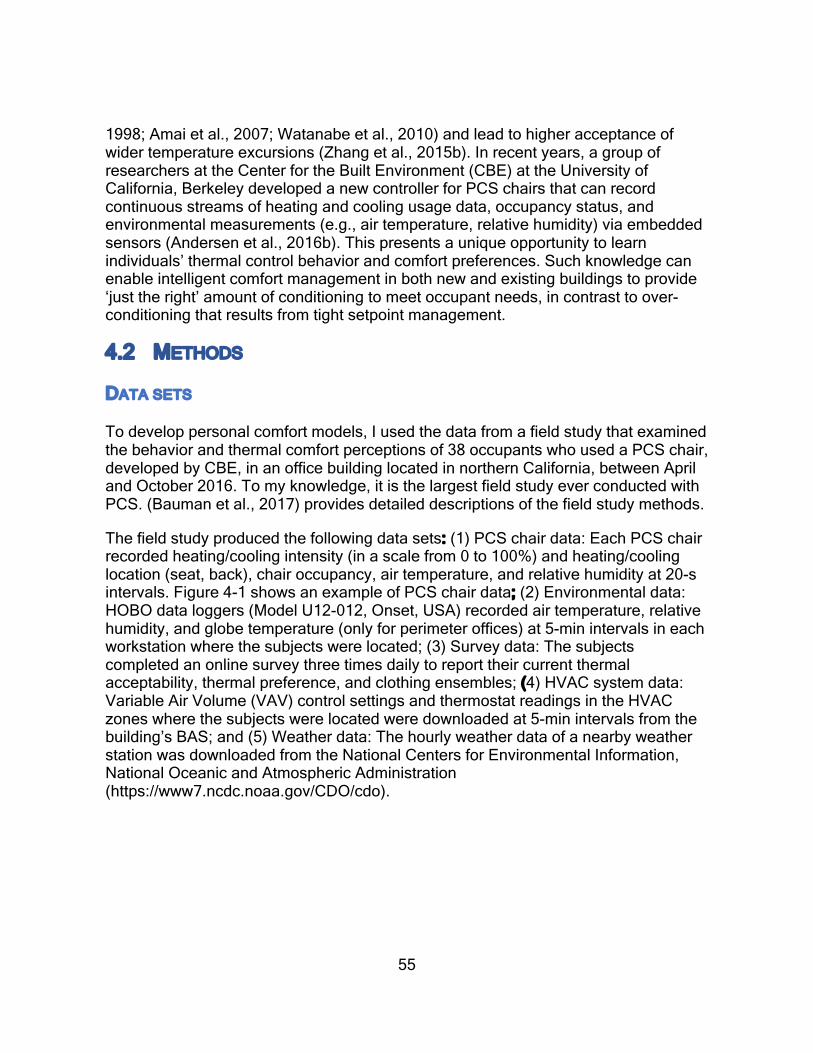
55
1998; Amai et al., 2007; Watanabe et al., 2010) and lead to higher acceptance of wider temperature excursions (Zhang et al., 2015b). In recent years, a group of researchers at the Center for the Built Environment (CBE) at the University of California, Berkeley developed a new controller for PCS chairs that can record continuous streams of heating and cooling usage data, occupancy status, and environmental measurements (e.g., air temperature, relative humidity) via embedded sensors (Andersen et al., 2016b). This presents a unique opportunity to learn individuals’ thermal control behavior and comfort preferences. Such knowledge can enable intelligent comfort management in both new and existing buildings to provide ‘just the right’ amount of conditioning to meet occupant needs, in contrast to over-conditioning that results from tight setpoint management.
4.2 METHODS
DATA SETS
To develop personal comfort models, I used the data from a field study that examined the behavior and thermal comfort perceptions of 38 occupants who used a PCS chair, developed by CBE, in an office building located in northern California, between April and October 2016. To my knowledge, it is the largest field study ever conducted with PCS. (Bauman et al., 2017) provides detailed descriptions of the field study methods.
The field study produced the following data sets: (1) PCS chair data: Each PCS chair recorded heating/cooling intensity (in a scale from 0 to 100%) and heating/cooling location (seat, back), chair occupancy, air temperature, and relative humidity at 20-s intervals. Figure 4-1 shows an example of PCS chair data; (2) Environmental data: HOBO data loggers (Model U12-012, Onset, USA) recorded air temperature, relative humidity, and globe temperature (only for perimeter offices) at 5-min intervals in each workstation where the subjects were located; (3) Survey data: The subjects completed an online survey three times daily to report their current thermal acceptability, thermal preference, and clothing ensembles; (4) HVAC system data: Variable Air Volume (VAV) control settings and thermostat readings in the HVAC zones where the subjects were located were downloaded at 5-min intervals from the building’s BAS; and (5) Weather data: The hourly weather data of a nearby weather station was downloaded from the National Centers for Environmental Information, National Oceanic and Atmospheric Administration (https://www7.ncdc.noaa.gov/CDO/cdo).
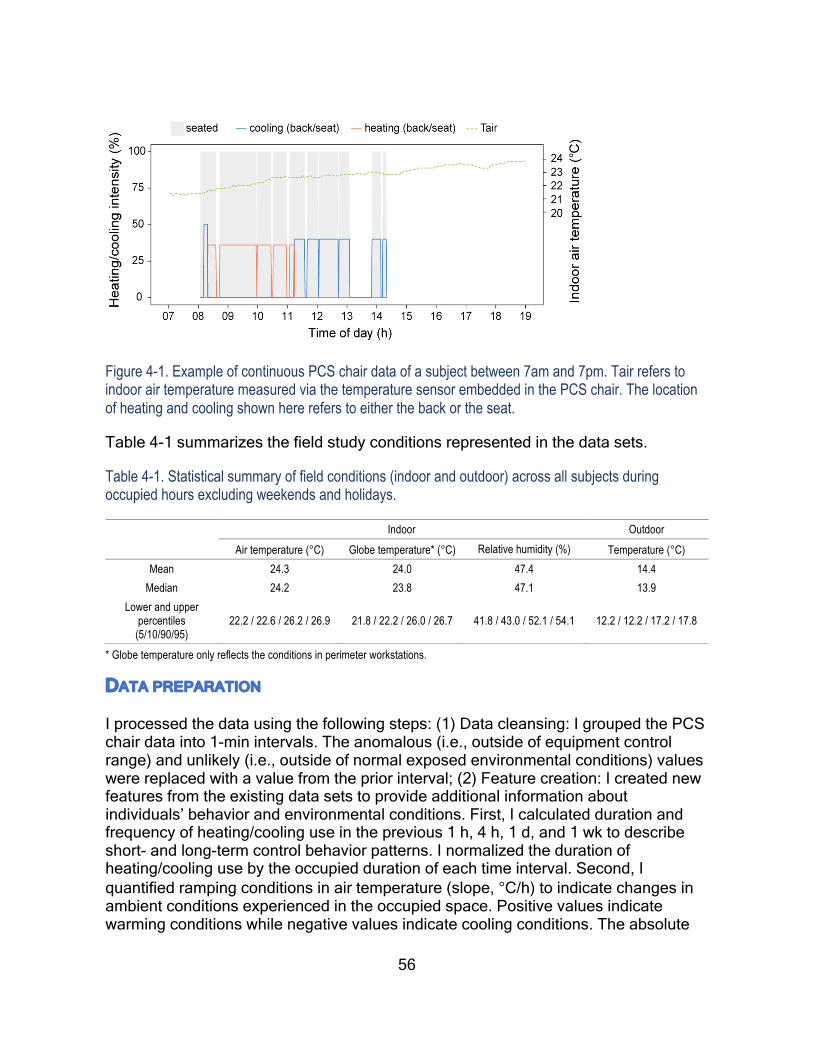
56
Figure 4-1. Example of continuous PCS chair data of a subject between 7am and 7pm. Tair refers to indoor air temperature measured via the temperature sensor embedded in the PCS chair. The location of heating and cooling shown here refers to either the back or the seat.
Table 4-1 summarizes the field study conditions represented in the data sets.
Table 4-1. Statistical summary of field conditions (indoor and outdoor) across all subjects during occupied hours excluding weekends and holidays.
Indoor Outdoor Air temperature (°C) Globe temperature* (°C) Relative humidity (%) Temperature (°C)
Mean 24.3 24.0 47.4 14.4 Median 24.2 23.8 47.1 13.9
Lower and upper percentiles
(5/10/90/95) 22.2 / 22.6 / 26.2 / 26.9 21.8 / 22.2 / 26.0 / 26.7 41.8 / 43.0 / 52.1 / 54.1 12.2 / 12.2 / 17.2 / 17.8
* Globe temperature only reflects the conditions in perimeter workstations.
DATA PREPARATION
I processed the data using the following steps: (1) Data cleansing: I grouped the PCS chair data into 1-min intervals. The anomalous (i.e., outside of equipment control range) and unlikely (i.e., outside of normal exposed environmental conditions) values were replaced with a value from the prior interval; (2) Feature creation: I created new features from the existing data sets to provide additional information about individuals’ behavior and environmental conditions. First, I calculated duration and frequency of heating/cooling use in the previous 1 h, 4 h, 1 d, and 1 wk to describe short- and long-term control behavior patterns. I normalized the duration of heating/cooling use by the occupied duration of each time interval. Second, I quantified ramping conditions in air temperature (slope, °C/h) to indicate changes in ambient conditions experienced in the occupied space. Positive values indicate warming conditions while negative values indicate cooling conditions. The absolute

57
value indicates the magnitude of changes. Lastly, I computed weighted running mean outside air temperature over the previous 30 days as per the calculation methods in ASHRAE 55, Informative Appendix I (ANSI/ASHRAE, 2013) to measure the impact of prevailing outdoor conditions; (3) Data merging: I merged the survey data with chair, HVAC, and weather data based on the nearest date/time for each subject. The final set consists of 4743 entries with 67 features.
Table 4-2 shows the list of features used for model development. Note that the term “feature” is the same as “variable” in this chapter; and (4) Pre-processing: I standardized all numerical features to have zero mean and unit variance. All levels of categorical features were converted into dummy features encoded in a series of zero and one. I removed constant features (with zero variance) and missing values from the data set.
Table 4-2. Description of features used for personal comfort models.
Category Feature Unit Type* Survey
Thermal preference warmer/no change/cooler C Clothing insulation level clo N
PCS control behavior
Control location seat/back/both/none C Control intensity % N Control frequency in the past x (x = 1h, 4h, 1d, 1wk) number of use N Occupancy status seated/unseated/unknown C Occupancy frequency in the past x (x = 1h, 4h, 1d, 1wk) number of occupancy N Ratio of control duration over occupancy duration in the past x (x = 1h, 4h, 1d, 1wk) % N
Date/Time
Hour of day h (0-23) N Day of week d (0-6) N
Indoor environment
Air temperature °C N Operative temperature °C N Relative humidity % N Slope in air temperature °C/h N
Outdoor environment
Outdoor air temperature °C N Sky cover clear/scattered C Weighted mean monthly temperature °C N Precipitation Yes/No C
HVAC system
Room temperature °C N Room airflow ft3/min N Room damper position % N Room heating output % N Room discharge air temperature °C N
* Type includes categorical (C) and numerical (N) features.

58
MACHINE LEARNING ALGORITHMS
In this chapter, I used machine learning to solve multiclass classification problems of an occupant’s thermal preference (‘warmer’/’no change’/’cooler’). I used thermal preference as the dependent variable because it informs about how to improve current comfort conditions by describing the occupant’s preferred comfort state; hence, thermal preference can be used to make actionable recommendations for HVAC control to improve the occupant’s comfort satisfaction. I use survey responses of thermal preference as the ground truth to verify the predicted thermal preference of individual occupants. As such, the data size for each model is limited by the total survey responses per occupant. Although a wide variety of algorithms exist in machine learning, the given dataset precludes some algorithms (e.g., deep neural network) due to its high dimensional and small size data. Considering this, I selected six machine learning algorithms that do not require strong data assumptions, and describe each algorithm and its hyper-parameter settings below. I used an exhaustive grid search to identify the best performing parameter settings for each machine learning algorithm.
Classification Tree (CTree): CTree creates a tree-like model that predicts the value of a target variable by learning simple decision rules inferred from the data features. I adopted the non-parametric conditional inference tree algorithm implemented in the Party package (version 1.2-3), which used multiple significance tests to grow the tree. I varied the maximum tree depth from 10 to 50 by factors of ten. The splitting threshold was varied from 0.1 to 0.9 with 0.1 intervals.
Gaussian Process Classification (GPC): GPC solves a latent function for classification with a generic Gaussian process, which is then squashed through a logistic function to produce probabilistic classification. I implemented GPC with the kernlab package (version 0.9-25), which included several approximation algorithms for acceleration. I used the radial basis kernel and varied the kernel width from 2-5 to 23 with an incremental factor of 2.
Gradient Boosting Method (GBM): GBM generates a prediction model based on an ensemble of many weak classifiers to build a stronger classification committee. I used the AdaBoost procedure (Freund and Schapire, 1996) implemented in the gbm package (version 2.1.3) to combine basic tree classifiers for ensemble learning. I varied the maximum depth of feature interaction from 1 to 5 by a step size of one, and the number of boosting iterations from 100 to 500 by a step size of 100.
Kernel Support Vector Machine (kSVM): kSVM uses optimal separating hyperplane that maximizes the separation margin of two data groups (classes) to build a prediction model. Its dual form allows the use of kernels to efficiently operate in high dimensional spaces. I used the kernlab package (version 0.9-25) which implemented the sequential minimal optimization algorithm to train SVM classifiers with the
59
Gaussian radial basis function kernel. I varied the kernel width from 2-5 to 23 with a factor of 2. I varied the penalty parameter from 0.1 to 5 by 0.5.
Random Forest (RF): RF is an ensemble classifier that produces mean predictions of many decision trees constructed from random subsets of the dataset. I implemented RF using the randomForest package (version 4.6-12). I grew 500 trees and fixed the size of the feature set considered at each split to 15.
Regularized Logistic Regression (regLR): LR models a posterior distribution for classification as a sigmoidal function of linear combinations of features. I combine LR with elastic net regularization to penalize inefficient logistic regression coefficients (Zou and Hastie, 2005). I use the glmnet package (version 2.0-10) to train LR models with elastic net regularization. I varied the penalty parameter from 100 to 101 by 0.02. The mixing parameter was varied from 0 (Ridge) to 1 (Lasso) by a step size of 0.2.
I used k-fold cross validation to randomly split the data into training and test sets to estimate the predictive performance of a model. The cross validation was split in two folds to avoid small sample size in each class and repeated 150 times to reduce bias that may be introduced by certain data splits. I applied the same data splits across all tested algorithms to allow direct comparison of their performance. Note that the current data set exhibits unequal distribution in thermal preference classes. To address this imbalance, I resampled the training data to match the size of minority classes to that of the majority class. The final model was tuned based on the parameters that produced the best predictive performance on the cross validation set. I used R (version 3.4) and RStudio (version 1.0.143) to run all of the models described in this chapter. I used the caret package (version 6.0-76) as a wrapper to interface different machine learning algorithms and conduct pre-processing, resampling, and cross validation.
PERFORMANCE EVALUATION
To evaluate the performance of personal comfort models, I used the following criteria:
• Prediction accuracy: does the model correctly predict? • Prediction variability: how consistent is the model prediction? • Model convergence: has the model converged its learning?
These criteria help to assess how good a model is in predicting individuals’ thermal preference, identify aspects of a model in need of improvement, and provide the basis for comparing different modeling methods.
I use the Area Under the Receiver Operating Characteristic (ROC) Curve as the base metric to quantitatively assess the above criteria. ROC curves provide a standard way of describing the predictive behavior of a binary classifier (Hanley and McNeil, 1982; Majnik and Bosnić, 2013). The curve plots the probability of true positive rate
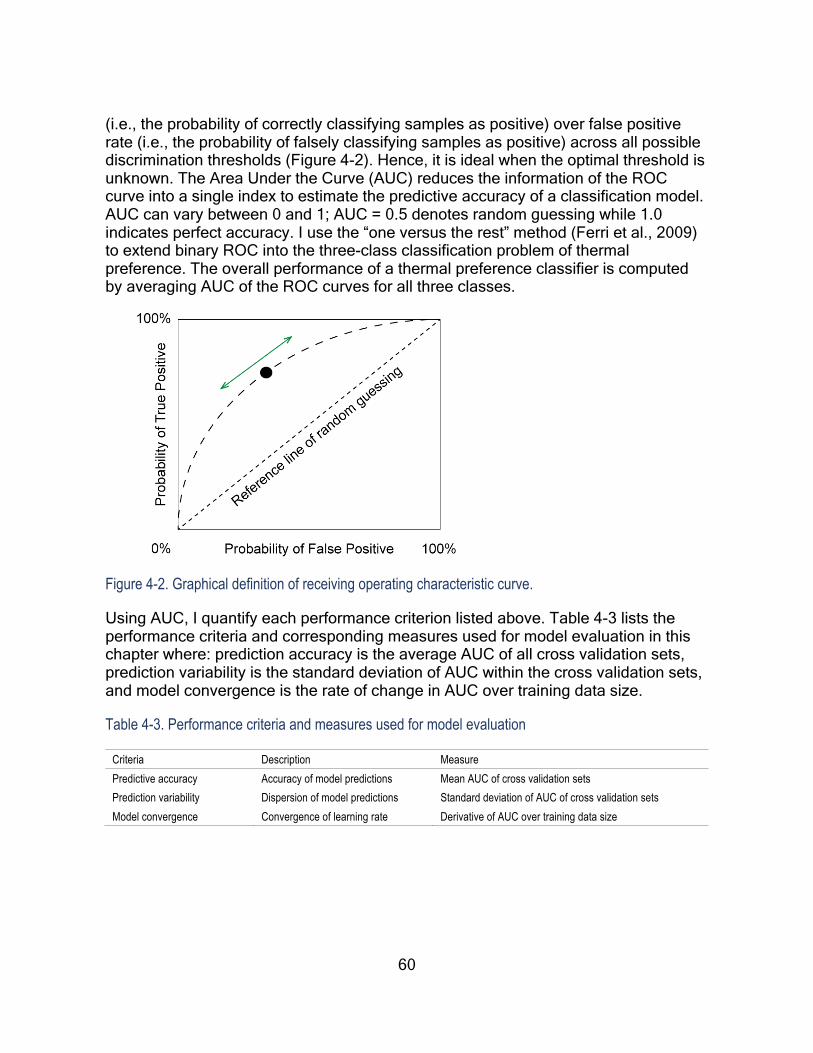
60
(i.e., the probability of correctly classifying samples as positive) over false positive rate (i.e., the probability of falsely classifying samples as positive) across all possible discrimination thresholds (Figure 4-2). Hence, it is ideal when the optimal threshold is unknown. The Area Under the Curve (AUC) reduces the information of the ROC curve into a single index to estimate the predictive accuracy of a classification model. AUC can vary between 0 and 1; AUC = 0.5 denotes random guessing while 1.0 indicates perfect accuracy. I use the “one versus the rest” method (Ferri et al., 2009) to extend binary ROC into the three-class classification problem of thermal preference. The overall performance of a thermal preference classifier is computed by averaging AUC of the ROC curves for all three classes.
Figure 4-2. Graphical definition of receiving operating characteristic curve.
Using AUC, I quantify each performance criterion listed above. Table 4-3 lists the performance criteria and corresponding measures used for model evaluation in this chapter where: prediction accuracy is the average AUC of all cross validation sets, prediction variability is the standard deviation of AUC within the cross validation sets, and model convergence is the rate of change in AUC over training data size.
Table 4-3. Performance criteria and measures used for model evaluation
Criteria Description Measure Predictive accuracy Accuracy of model predictions Mean AUC of cross validation sets Prediction variability Dispersion of model predictions Standard deviation of AUC of cross validation sets Model convergence Convergence of learning rate Derivative of AUC over training data size

61
4.3 RESULTS AND DISCUSSION
PREDICTION ACCURACY AND VARIABILITY
Table 4-4 summarizes the prediction accuracy and variability of the six algorithms (CTree, GPC, GBM, kSVM, RF, and regLR) used to develop personal comfort models for 34 out of the 38 subjects who participated in the field study. There were 4 subjects who only voted for ‘no change’ as a result of mild indoor temperatures during the study period. The table does not include these subjects since models cannot be trained on a single class. I report the results in mean and standard deviation of cross-validated AUC. The last row in the table shows the average performance of each algorithm across all subjects. The last column shows the average and the highest AUC of the six algorithms used for personal comfort models for each subject. I also provide the prediction results of the PMV and adaptive models to compare the personal and conventional comfort models. I used the comf package (version 0.1.4) to compute the PMV and adaptive models as per the calculation methods in ISO 7730 (2005) and ASHRAE 55 (2013), respectively. I used the field data (i.e., air temperature, operative temperature, humidity) and the static values (i.e., air velocity = 0.1 m/s, metabolic rate = 1.2 met, clothing insulation = 0.6) for the PMV calculation. To compare the results on the same scale, I convert PMV into thermal preference classes based on the following assumptions: |PMV| ≤ 0.5 is ‘no change’; PMV > 0.5 is ‘want cooler’; and PMV < -0.5 is ‘want warmer’, as used in (Ghahramani et al., 2015). These assumptions reflect 80% thermal satisfaction with 10% dissatisfaction from whole-body discomfort and 10% dissatisfaction from local discomfort. To convert the output of the adaptive model into thermal preference classes, I assume acceptable operative temperature within 80% acceptability limits to be ‘no change’; and greater/less than the upper/lower 80% acceptability limits to be ‘want cooler/warmer’, respectively.
Table 4-4. Predictive performance of personal comfort models and conventional comfort models across all subjects. Prediction accuracy and variability are expressed as the mean and standard deviation (shown in brackets) of all cross-validated AUC respectively.
User ID
Data size
Conventional comfort Personal comfort models*
models
PMV Adaptive CTree GBM GPC kSVM RF regLR Median / Best
1 172 0.55 (0.04)
0.50 (0.00)
0.76 (0.05)
0.80 (0.06)
0.84 (0.04)
0.83 (0.03)
0.86 (0.05)
0.83 (0.05) 0.83 / 0.86
2 132 0.52 (0.04)
0.52 (0.04)
0.52 (0.06)
0.53 (0.06)
0.48 (0.07)
0.48 (0.08)
0.58 (0.06)
0.53 (0.05) 0.52 / 0.58
3 167 0.52 (0.04)
0.50 (0.00)
0.61 (0.06)
0.64 (0.06)
0.75 (0.04)
0.73 (0.05)
0.73 (0.05)
0.69 (0.06) 0.71 / 0.75
4 138 0.60 (0.02)
0.54 (0.03)
0.76 (0.07)
0.85 (0.05)
0.81 (0.06)
0.82 (0.05)
0.87 (0.04)
0.86 (0.05) 0.83 / 0.87

62
5 147 0.50 (0.00)
0.50 (0.00)
0.60 (0.13)
0.62 (0.13)
0.73 (0.07)
0.70 (0.09)
0.65 (0.11)
0.61 (0.13) 0.64 / 0.73
6 135 0.50 (0.00)
0.50 (0.00)
0.60 (0.11)
0.67 (0.11)
0.62 (0.14)
0.63 (0.12)
0.66 (0.11)
0.65 (0.13) 0.64 / 0.67
7 82 0.53 (0.04)
0.50 (0.00)
0.51 (0.06)
0.59 (0.08)
0.58 (0.07)
0.57 (0.08)
0.61 (0.08)
0.63 (0.08) 0.58 / 0.63
8 132 0.72 (0.03)
0.50 (0.00)
0.54 (0.08)
0.61 (0.10)
0.58 (0.07)
0.59 (0.08)
0.64 (0.10)
0.60 (0.10) 0.59 / 0.64
9 110 0.67 (0.13)
0.50 (0.00)
0.50 (0.10)
0.51 (0.20)
0.74 (0.08)
0.74 (0.09)
0.56 (0.17)
0.48 (0.13) 0.53 / 0.74
10 118 0.50 (0.00)
0.50 (0.00)
0.49 (0.09)
0.55 (0.14)
0.68 (0.09)
0.68 (0.09)
0.59 (0.11)
0.52 (0.13) 0.57 / 0.68
11 110 0.47 (0.01)
0.50 (0.00)
0.52 (0.11)
0.58 (0.11)
0.54 (0.07)
0.53 (0.09)
0.55 (0.12)
0.59 (0.11) 0.55 / 0.59
12 124 0.40 (0.12)
0.50 (0.00)
0.51 (0.11)
0.68 (0.15)
0.67 (0.17)
0.71 (0.15)
0.81 (0.10)
0.75 (0.13) 0.70 / 0.81
13 147 0.50 (0.00)
0.50 (0.00)
0.64 (0.06)
0.70 (0.05)
0.67 (0.05)
0.66 (0.05)
0.71 (0.05)
0.71 (0.05) 0.69 / 0.71
14 33 0.46 (0.08)
0.50 (0.00)
0.67 (0.20)
0.60 (0.11)
0.51 (0.07)
0.59 (0.12)
0.73 (0.16)
0.68 (0.11) 0.63 / 0.73
15 110 0.54 (0.04)
0.50 (0.00)
0.62 (0.09)
0.73 (0.07)
0.72 (0.07)
0.71 (0.07)
0.74 (0.06)
0.70 (0.07) 0.72 / 0.74
16 141 0.50 (0.00)
0.50 (0.00)
0.60 (0.08)
0.66 (0.07)
0.68 (0.07)
0.66 (0.06)
0.68 (0.07)
0.66 (0.07) 0.66 / 0.68
17 103 0.57 (0.10)
0.50 (0.00)
0.57 (0.12)
0.69 (0.17)
0.66 (0.18)
0.70 (0.20)
0.69 (0.17)
0.64 (0.25) 0.67 / 0.70
18 140 0.50 (0.00)
0.50 (0.00)
0.77 (0.06)
0.83 (0.04)
0.79 (0.06)
0.82 (0.05)
0.85 (0.04)
0.83 (0.04) 0.82 / 0.85
19 148 0.53 (0.02)
0.50 (0.00)
0.57 (0.06)
0.62 (0.06)
0.60 (0.05)
0.60 (0.05)
0.65 (0.06)
0.63 (0.06) 0.61 / 0.65
20 132 0.50 (0.00)
0.50 (0.00)
0.74 (0.07)
0.85 (0.05)
0.82 (0.03)
0.81 (0.04)
0.85 (0.04)
0.83 (0.06) 0.83 / 0.85
21 65 0.50 (0.00)
0.50 (0.00)
0.55 (0.07)
0.58 (0.09)
0.68 (0.08)
0.66 (0.12)
0.66 (0.08)
0.59 (0.09) 0.62 / 0.68
22 121 0.50 (0.00)
0.50 (0.00)
0.66 (0.09)
0.70 (0.06)
0.77 (0.06)
0.76 (0.06)
0.72 (0.06)
0.72 (0.06) 0.72 / 0.77
23 134 0.54 (0.04)
0.50 (0.00)
0.67 (0.08)
0.76 (0.07)
0.77 (0.05)
0.76 (0.05)
0.80 (0.05)
0.77 (0.05) 0.76 / 0.80
24 116 0.62 (0.03)
0.60 (0.03)
0.75 (0.05)
0.83 (0.03)
0.84 (0.03)
0.83 (0.03)
0.87 (0.03)
0.87 (0.03) 0.84 / 0.87
25 109 0.50 (0.00)
0.50 (0.00)
0.85 (0.08)
0.94 (0.04)
0.94 (0.03)
0.94 (0.02)
0.96 (0.02)
0.93 (0.05) 0.94 / 0.96
26 49 0.72 (0.12)
0.50 (0.00)
0.53 (0.13)
0.58 (0.14)
0.52 (0.14)
0.61 (0.16)
0.62 (0.13)
0.71 (0.13) 0.59 / 0.71
27 138 0.54 (0.03)
0.50 (0.00)
0.61 (0.06)
0.62 (0.06)
0.65 (0.05)
0.64 (0.06)
0.67 (0.05)
0.61 (0.06) 0.63 / 0.67
28 218 0.52 (0.02)
0.50 (0.00)
0.86 (0.04)
0.92 (0.02)
0.90 (0.02)
0.90 (0.02)
0.93 (0.02)
0.90 (0.02) 0.90 / 0.93
29 185 0.50 (0.00)
0.50 (0.00)
0.77 (0.22)
0.95 (0.04)
0.78 (0.20)
0.87 (0.11)
0.93 (0.07)
0.94 (0.07) 0.90 / 0.95
30 86 0.52 (0.02)
0.50 (0.00)
0.59 (0.07)
0.60 (0.06)
0.62 (0.05)
0.64 (0.05)
0.62 (0.05)
0.65 (0.05) 0.62 / 0.65
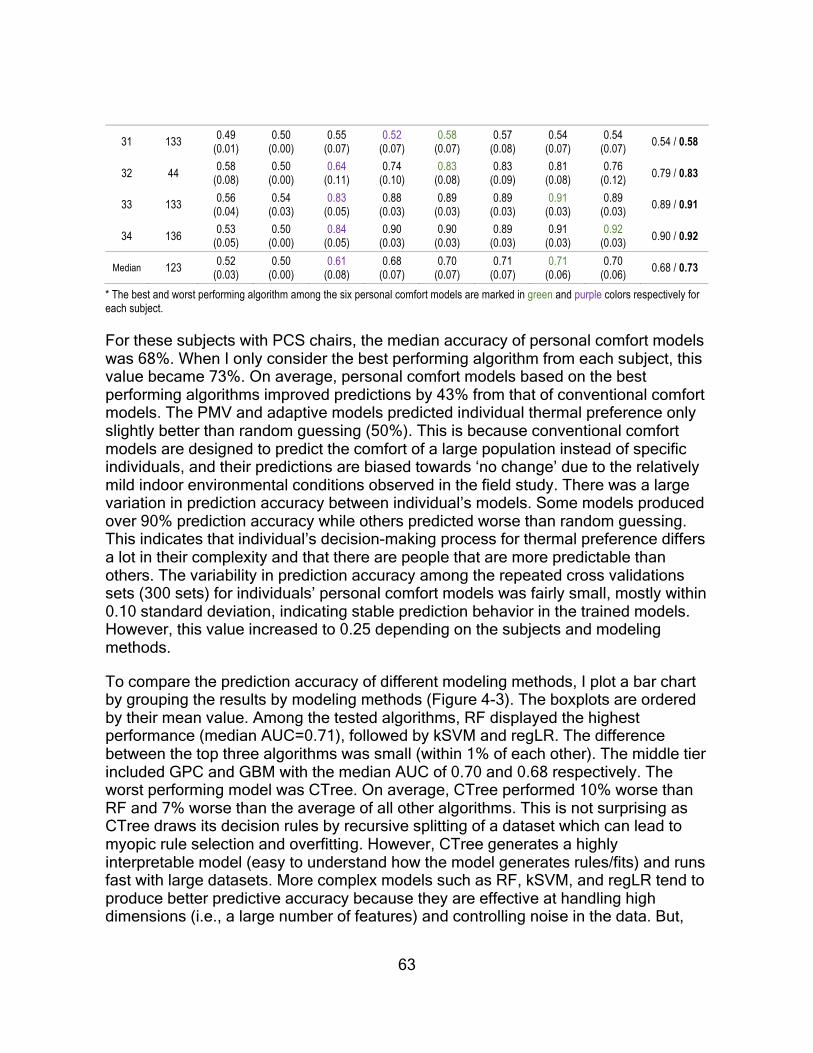
63
31 133 0.49 (0.01)
0.50 (0.00)
0.55 (0.07)
0.52 (0.07)
0.58 (0.07)
0.57 (0.08)
0.54 (0.07)
0.54 (0.07) 0.54 / 0.58
32 44 0.58 (0.08)
0.50 (0.00)
0.64 (0.11)
0.74 (0.10)
0.83 (0.08)
0.83 (0.09)
0.81 (0.08)
0.76 (0.12) 0.79 / 0.83
33 133 0.56 (0.04)
0.54 (0.03)
0.83 (0.05)
0.88 (0.03)
0.89 (0.03)
0.89 (0.03)
0.91 (0.03)
0.89 (0.03) 0.89 / 0.91
34 136 0.53 (0.05)
0.50 (0.00)
0.84 (0.05)
0.90 (0.03)
0.90 (0.03)
0.89 (0.03)
0.91 (0.03)
0.92 (0.03) 0.90 / 0.92
Median 123 0.52 (0.03)
0.50 (0.00)
0.61 (0.08)
0.68 (0.07)
0.70 (0.07)
0.71 (0.07)
0.71 (0.06)
0.70 (0.06) 0.68 / 0.73
* The best and worst performing algorithm among the six personal comfort models are marked in green and purple colors respectively for each subject.
For these subjects with PCS chairs, the median accuracy of personal comfort models was 68%. When I only consider the best performing algorithm from each subject, this value became 73%. On average, personal comfort models based on the best performing algorithms improved predictions by 43% from that of conventional comfort models. The PMV and adaptive models predicted individual thermal preference only slightly better than random guessing (50%). This is because conventional comfort models are designed to predict the comfort of a large population instead of specific individuals, and their predictions are biased towards ‘no change’ due to the relatively mild indoor environmental conditions observed in the field study. There was a large variation in prediction accuracy between individual’s models. Some models produced over 90% prediction accuracy while others predicted worse than random guessing. This indicates that individual’s decision-making process for thermal preference differs a lot in their complexity and that there are people that are more predictable than others. The variability in prediction accuracy among the repeated cross validations sets (300 sets) for individuals’ personal comfort models was fairly small, mostly within 0.10 standard deviation, indicating stable prediction behavior in the trained models. However, this value increased to 0.25 depending on the subjects and modeling methods.
To compare the prediction accuracy of different modeling methods, I plot a bar chart by grouping the results by modeling methods (Figure 4-3). The boxplots are ordered by their mean value. Among the tested algorithms, RF displayed the highest performance (median AUC=0.71), followed by kSVM and regLR. The difference between the top three algorithms was small (within 1% of each other). The middle tier included GPC and GBM with the median AUC of 0.70 and 0.68 respectively. The worst performing model was CTree. On average, CTree performed 10% worse than RF and 7% worse than the average of all other algorithms. This is not surprising as CTree draws its decision rules by recursive splitting of a dataset which can lead to myopic rule selection and overfitting. However, CTree generates a highly interpretable model (easy to understand how the model generates rules/fits) and runs fast with large datasets. More complex models such as RF, kSVM, and regLR tend to produce better predictive accuracy because they are effective at handling high dimensions (i.e., a large number of features) and controlling noise in the data. But,

64
they are often difficult to interpret and computationally expensive (e.g., kSVM required three more CPU times on average to complete the same task as CTree for this dataset).
Figure 4-3 (a) Distribution of prediction accuracy across all subjects for each modeling method. The top boxplots six represent personal comfort models. The bottom two represents conventional comfort models. The boxplots are ordered by the decreasing order of mean AUC, marked as a red circle. The dashed line indicates a reference line for random guessing. (b) Distribution of prediction accuracy across all subjects grouped into personal comfort models and conventional comfort models (labeled as “Personal models” and “Conventional models” respectively).
While I focus on predictive accuracy to compare different modeling methods here, note that there are other factors such as computational speed, interpretability, robustness, scalability, etc. that impact the quality of a model. Depending on the application of the model (e.g., real-time HVAC control), some of these factors may have a greater influence on model selection than others.
MODEL CONVERGENCE
Model convergence indicates whether the current model has converged its learning to produce stable predictions or not. Figure 4-4 shows the learning curve of the individuals’ personal comfort models as a function of prediction accuracy over training data size. To plot this curve, I repeatedly ran each subject’s model by adding five data points at a time in the sequential order of data collection until the model exhausts the full data set. The x-axis represents the number of data points increased from left to right. The y-axis represents the mean AUC of cross validation sets (two folds repeated 150 times). I applied the same tuning parameters across all subset models in this figure. To determine whether a model has converged or not, I calculated the rate of learning by taking the derivative of the curve with respect to data size. I considered a model to have converged when the derivative plateaus

65
(within ±0.001) for two successive runs. Based on this rule, I determined the training data size at which the individuals’ model first converged and showed this as a boxplot in this figure as well. Note that the boxplot does not include the data from the four individuals (User 10, 14, 26, and 32) whose model did not converge within the given data set. The Appendix includes separate plots of the individuals’ learning curve to show their unique convergence pattern more clearly. I also show the overall learning trend across all subjects in this figure by fitting a local polynomial regression line to the aggregated prediction accuracy of everyone’s personal comfort models.
Figure 4-4. Learning curve of individual subjects’ personal comfort models expressed as the derivative of mean AUC with respect training data size (shown in dashed lines). The solid line is the local polynomial regression (LOESS) fit to aggregated mean AUC of all subjects’ models over training data size. The boxplot shows the distribution of the training data size at which the individuals’ model first converged.
66
The aggregated trend shows that prediction accuracy generally improves as the number of samples increases. However, the individual subjects display different learning trends from one another. For some, the learning converged quickly while for others it is still ongoing (as shown in Figure 4-5). This indicates that the amount of data needed to achieve a stable prediction behavior varies between individuals. I observe that convergence occurs when sample size reaches 64 on average. This means that individual subjects need to supply over 60 survey responses in order to produce a model with stable predictions. However, depending on the occupants’ survey participation, obtaining sufficient training data can be challenging if the survey participation rate is low (e.g., User 14, 26, and 32 submitted less than 50 survey responses over the three-month period). Note that some models go through more than one convergence (See Figure 4-5). This is because the model has to relearn new patterns in the data with the addition of new data points. And, each time the model relearns, it needs enough sample size to reach stable predictions. For future studies, I suggest the use of online machine learning to automatically update models as new samples of data arrive. Convergence does not guarantee good predictive performance. Converged models can suffer from poor accuracy and large variability in predictions. Hence, the evaluation of a personal comfort model should consider all three criteria – prediction accuracy, variability, and convergence.

67
Figure 4-5. Learning curve of each subject’s personal comfort model expressed as a function of mean prediction accuracy over training data size. The shadow indicates the confidence interval of cross-validated AUC.
VARIABLE IMPORTANCE
Understanding which variables contribute the most to the predictive power of a model can help to eliminate ineffective variables and reduce the cost of data collection.

68
However, testing significance of all variables and their possible combinations in a high dimensional dataset is computationally impossible (>~1010 years). I simplified this process by grouping variables that come from a single data source and measuring their predictive performance to understand how little data one might need to collect to have a model with strong predictive power. I took a stepwise approach to run models for all subjects by adding the variables from each variable group until the model included all variable groups. The intent was to quantify the additional improvement that each variable group contributed to the prediction accuracy. I fixed the modeling method to RF and applied two-fold cross validation repeated 150 times. The order of the variable groups is determined based on the effort involved in data collection during the field study so that most easily obtainable data is introduced to the model first. The order was: 1) PCS control behavior, because the data was automatically reported via PCS chairs; 2) date/time, because they were extracted from the time stamp of the PCS chair data: 3) HVAC system and 4) outdoor environment, because they required interfacing with a third-party online software to access the data; 5) indoor environment, because the data collection required additional sensor installation for globe temperature measurements; 6) clothing insulation, because it required occupant’s survey participation to collect the data. Note that this order is applicable to this particular field study and it may change in different settings. Since the variables in each group come from a single data source, there is no difference in the cost of data collection within each variable group.
Figure 4-6 (a) summarizes the results from the model runs. The results show that PCS control behavior alone (Comb. 1) could produce 69% prediction accuracy on average, which is a notable increase over the prediction accuracy of conventional comfort models (PMV and adaptive) for this dataset (0.52 and 0.50 respectively). Adding other variable groups only improved the mean prediction accuracy by 4% compared to the model with PCS control behavior alone. This means that, on average, the models based on PCS control behavior alone could attain the majority of prediction accuracy produced by the models that include all field data (0.73). To give a sense of how different variable groups independently perform from one another, I plot the prediction results of individual variable groups in Figure 4-6 (b). The main takeaway from this analysis is that the variable group with PCS control behavior (69%) still produced the best results among all. The prediction accuracy of all other variable groups ranged between 60-63%. As an interesting side note, even the lowest group (outdoor environment), with a prediction accuracy of 0.60, achieves a significant improvement over conventional comfort models. Thus, in general, it is clear that machine learning helps to improve prediction accuracy. However, unlike conventional models, applying these machine learning methods to predict individual’s thermal comfort requires training data (i.e. approximately 60 surveys per occupant in this case), which the conventional comfort models do not. Note also that these results are based on the comfort conditions that the subjects were exposed to during the field study – a relatively narrow range of indoor environmental conditions that are typical in mechanically-conditioned office buildings. Outside these narrow conditions, the

69
indoor environment will become a more important factor to individuals’ thermal preference.
Figure 4-6 (a) Prediction accuracy of model runs with different variable combinations. The variable combinations are constructed by accumulatively adding features from each variable groups until all features in the database are included in the model. (b) Prediction accuracy of separately evaluated variable groups (PCS control behavior, date/time, HVAC system, outdoor environment, and indoor environment). Clothing insulation is not included since a fixed value (0.6) was used in all model runs. Bar plots and error bars indicate the average and standard deviation of AUC across all subjects respectively.
Practically speaking, the choice of model parameters is not always based on accuracy but rather on the cost of collecting the data. For this study, PCS chairs provided a convenient platform to collect continuous data that can be individually identifiable. The strong predictive power of PCS control behavior signals that it can potentially replace survey feedback as the “ground truth” when you have these kinds of systems. This means that one can use the continuous PCS data to directly model individuals’ thermal preference and dynamically control thermostat setpoints to match their preferences. Such is the case for many commercial “smart” thermostats (e.g., Nest) that learn occupants’ thermal preference based on their thermostat control behavior and automatically create a temperature schedule according to their desired settings. However, the learning based on thermostats may represent more than one

70
person since they are typically shared in many spaces; hence, it can be biased toward a few individuals who drive the thermostat settings. The PCS chairs are usually individually owned and operated; therefore, the temperature schedule can be determined based on the learning of individuals’ thermal control behavior rather than group behavior.
4.4 LIMITATIONS
There are several limitations in my current modeling approach. First, the size of the dataset, which is determined by the number of survey responses received from each person, limits the performance of the model. This limitation also applies to all previous thermal comfort studies that rely on survey feedback. One way to overcome this limitation is to use continuous PCS control behavior to directly model individuals’ comfort requirements. Another solution is to increase the data size by pooling relevant survey responses from other occupants (Schumann et al., 2010b). Second, I based the models on one-time batch learning. However, batch learning can be computationally challenging over time as the data size grows. Hence, I suggest online machine learning to dynamically adapt new patterns in the data and automatically update the model as needed. Third, I treat misclassification costs among different thermal comfort classes the same in the present analysis. I acknowledge that the cost of misclassifying certain classes (e.g., ‘cooler’, ‘warmer’) can differ from others (e.g., ‘no change’). However, current literature at the time of this work did not offer information that could help to specify the exact consequences/cost of misclassifying thermal preference. This void represents an area for future research.
4.5 SUMMARY
Thermal comfort is a subjective phenomenon which can display large differences among individual occupants. Therefore, providing a satisfactory thermal environment requires an understanding of the unique comfort requirements of individuals. In this chapter, I present a new modeling approach, personal comfort models to predict individuals’ thermal preference based on learning from a novel type of occupant feedback – thermal control behavior with PCS chairs and six different machine learning algorithms to improve consistent data collection and prediction accuracy. From the results, I draw the following conclusions.
• Personal comfort models produced the median accuracy of 0.73 based on the best performing algorithm, improving the predictions of conventional comfort models (PMV and adaptive) which produced a median accuracy of 0.51. The PMV and adaptive models predicted individual thermal preference only slightly better than random guessing for the relatively mild indoor environmental conditions observed in the field study. Such outcome confirms that an individual approach can significantly improve comfort predictions of the actual occupants in building space.

71
• Among the six machine learning algorithms used for model development, the algorithms with capabilities to control high dimensions and noise in the data (e.g., RF, kSVM, regLR) produced higher accuracy than the algorithms without them, but they were more computationally expensive. Hence, depending on the application of the model, one may need to assess the value of accuracy against the computational cost when selecting algorithms.
• The personal comfort models generally converged when the data size reached 64 survey inputs. This means that occupants need to supply over 60 survey responses to produce a stable prediction of their thermal preference. This is a limiting factor for models that require survey feedback for training purposes.
• Personal comfort models based on PCS control behavior produced the best prediction accuracy when individually assessing all categories of field data acquired in the the study (i.e., date/time, HVAC system, outdoor environment, indoor environment, and clothing insulation). This shows that individuals’ heating and cooling behavior with PCS is a strong comfort predictor and can potentially replace survey feedback as the ground truth for personal comfort models.
Personal comfort models can provide more accurate representations of occupants’ comfort needs and desires. Moreover, they can produce continuous predictions that can inform temperature settings in day-to-day building operations. The next logical step is to demonstrate the integration of personal comfort models into thermostat control to close the feedback loop between occupants and HVAC systems – this is a topic well worth pursing to make a tangible impact on occupant satisfaction and energy use in buildings.

72
5 OVERALL DISCUSSION
This chapter presents a final discussion that connects key findings drawn from the research tasks covered in the previous chapters. It is organized into four broad sections: 1) lessons learned from this research, 2) implications for comfort management in practice, 3) additional considerations for building design and controls, and 4) future research areas that can build upon this research.
5.1 LESSONS LEARNED
Personalizing comfort experience in the built environment requires understanding, and responding to, individuals’ comfort needs and preferences. This dissertation has presented innovative personal comfort technology and personal comfort analytics that can help achieve this goal.
For personal comfort technology, along with a multi-disciplinary team of researchers, I transformed a PCS chair into an IoT device to unlock its big data and smart control potentials. The data analysis of the PCS field study (Chapter 2) showed that occupants frequently used local heating and cooling when PCS chairs were available, and PCS users displayed high comfort satisfaction, far exceeding what is typically achieved in buildings. These results not only confirm the conclusions of other studies (Veselỳ and Zeiler, 2014; Zhang et al., 2015b) on the effectiveness of PCS in providing thermal satisfaction but also provide a quantitative link between related adaptive behavior and thermal comfort. The occupants found PCS chairs particularly useful in addressing transient comfort needs, eliciting pleasurable experiences (alliesthesia), as well as providing therapeutic effects (back pain relief) – all these are beyond the capabilities or responsibilities of conventional HVAC systems. Such findings offer compelling evidence that PCS is a highly effective comfort technology, and it can be a “game changer” in today’s building management, shifting the comfort goal from merely reducing discomfort to creating delightful thermal experiences (Heschong, 1979; Erwine, 2016). The analysis also showed that PCS control behavior was able to dynamically describe individuals’ thermal preference, indicating that the data generated from Internet-connected PCS could potentially act as individualized comfort feedback for HVAC controls.
For personal comfort analytics, I proposed a new framework (Chapter 3) for thermal comfort modeling called personal comfort models that can predict individuals’ thermal comfort instead of simply for a large population. In particular, this framework incorporates IoT and machine learning to leverage highly personalized data available from buildings in use and advanced modeling techniques with strong predictive performance. Such a framework can benefit the building industry by providing a new path for thermal comfort modeling that can support occupant-centric control paradigms. The proposed framework also establishes concepts and definitions based on decades of thermal comfort research; hence, it can be a useful guideline for

73
current and future activities on personal comfort analytics in both academia and industry. While the framework is primarily developed for environmental controls in buildings, its applications can be extended to other types of human occupancy such as vehicles or aircraft. The extended applications would need to consider specific comfort characteristics and challenges that are unique to other environments (e.g., transient conditions, temporary occupancy, thermal expectation, system constraints).
As a practical use case, I developed a set of personal comfort models using the PCS field study data (Chapter 4) to demonstrate how the proposed framework can be implemented. The results showed that personal comfort models produced superior accuracy over conventional comfort models (PMV, adaptive), and that heating/cooling control behavior was a strong predictor of individuals’ thermal preference – which is one of the findings in Chapter 2 and the underlying assumption behind learning algorithms for many smart thermostats (e.g., Nest). This work also demonstrated the usefulness of PCS data for the development of personal comfort models, showing a great synergy between personal comfort technology and personal comfort analytics. The successful development of personal comfort models invites many promising applications. The most immediate one would be the integration of the models into thermostat controls to close the feedback loop between occupants and HVAC systems.
5.2 IMPLICATIONS FOR COMFORT MANAGEMENT IN BUILDINGS
Both PCS and personal comfort models can have significant implications for occupant comfort and can greatly influence building design and control. Figure 5-1 illustrates how they can be integrated into building controls.
The default scenario (Figure 5-1(a)) describes the conventional approach to comfort provision that uses centralized HVAC systems with standards-based temperature controls. In this scenario, space heating and cooling is provided based on pre-defined temperature setpoints as recommended by the comfort requirements from ASHRAE Standard 55 or equivalent. Occupants usually do not have much control over the setpoints due to limited or no access to thermostats. Even if a thermostat is available, occupants in shared spaces may need to reconcile differences in comfort needs among them before making an adjustment. Hence, individuals severely lack control over their thermal environment, and HVAC systems operate without feedback from their occupants.

74
Figure 5-1. Example scenarios of the control integration of PCS and personal comfort models in a shared thermal zone. Individually, PCS and personal comfort models can each improve this situation.

75
Individually, PCS and personal comfort models can each improve this situation.
• PCS can provide personal control of local heating/cooling by creating highly customizable environments within individuals’ workstations (Figure 5-1(b)). PCS can also elevate the overall comfort experience by quickly fulfilling individual-specific or time-sensitive comfort needs that cannot be met by centralized HVAC systems.
• Personal comfort models can provide individualized comfort feedback back to HVAC systems that can lead to more representative, data-driven temperature controls in buildings (Figure 5-1(c)). Personal comfort models can also be used for continuous comfort assessment and support other advanced control strategies that require occupants’ comfort feedback to set boundary decisions for their energy or cost optimization engines (e.g., time-averaged ventilation control strategy (Kaam et al., 2017), cost-responsive supply air temperature reset strategy (Raftery et al., 2018)).
However, in both of these scenarios, the full potential of PCS and personal comfort models cannot be realized due to the constraints in the existing system.
• For PCS, acting alone, the energy savings potentials (i.e., low energy consumption for the same comfort effects) cannot be fully exploited as we do not know to what extent individuals’ temperature acceptance can be corrected due to PCS use.
• For personal comfort models, again acting alone, there is a limit to how much centralized systems can respond to individuals’ comfort feedback as the information still has to be translated into a single temperature setpoint for the control of a single VAV terminal in shared thermal zone (One-person thermal zones would be an exception to this case).
Such limitations can be overcome when these two innovations work together (Figure 5-1(d)). Personal comfort models can help to achieve the PCS energy savings potential by quantifying the corrected comfort temperatures from PCS use so that HVAC systems can adjust temperature setpoints accordingly. PCS can address individual differences in comfort needs via decentralized conditioning while offloading some of the HVAC responsibilities in thermally challenging areas. Moreover, PCS can supply continuous streams of individualized data that can support the development of personal comfort models and interact with other systems to provide coordinated comfort solutions that can lead to greater satisfaction and efficiency. Hence, their combined effect is greater than the sum of their individual effects.

76
Figure 5-2. Example of data-driven temperature controls in a VAV zone shared by two PCS users (b), based on preferred and acceptable comfort temperatures predicted from their personal comfort models (a). The scenario is based on the field data collected during summer months and illustrates the adjustments that can be applied to the cooling temperature setpoint in the shared VAV zone.
Figure 5-2 provides a hypothetical example of how the integration of PCS and personal comfort models can inform HVAC temperature controls over the course of a day. Assuming two occupants with a PCS chair in a shared VAV zone, I calculated preferred and acceptable temperature ranges of these individuals based on their personal comfort models developed from PCS data and survey responses. Although they displayed different temperature requirements, both occupants were comfortable at temperatures above the zone’s default cooling setpoint – offering an opportunity to increase the cooling setpoint by as much as 1 °C. Since the information is available as a time-series, it can help centralized HVAC systems to dynamically adjust temperature setpoints and optimize energy use in buildings. Note that this scenario is based on the field data collected during summer months; as such, I only showed the adjustment to the cooling temperature setpoint. A similar adjustment can be made to the heating temperature setpoint as the updates are made to models with winter data.
The setpoint adjustments shown in Figure 5-2 (b) are based on the models that were developed in a tightly controlled environment (21.1-23.3 °C deadband). Studies have shown that PCS can correct comfort temperatures as much as 6 °C on the cooling

77
side and 10 °C on the heating side (Zhang et al., 2015b); hence, the opportunity to expand HVAC temperature setpoints may be greater if the occupants were exposed to greater temperature swings and the predictions were made based on that.
5.3 ADDITIONAL CONSIDERATIONS FOR BUILDING DESIGN AND
CONTROL
A full integration of PCS and personal comfort models will invite discussion that is likely to challenge the way we design and control buildings. Below I list some important topics that would require further discussion within the building industry.
Interaction between centralized and decentralized systems: Although the benefit of PCS is evident, conventional design processes have not caught up with this new approach and likely view it as a supplementary system working independently from the rest of the building systems. This may change with the new generation PCS that are capable of interacting with other systems on the same communication platform. Buildings can leverage this new capability to facilitate a more integrated approach between centralized and decentralized systems in order to improve both the overall comfort satisfaction and energy performance. For this to happen, it is important for designers to recognize PCS as an essential part of building systems and incorporate it into environmental control strategies.
The benefit of IoT and predictive analytics to the building industry: The integration of IoT and predictive analytics in comfort management is increasing in both residential (e.g., Nest) and commercial buildings (e.g., Comfy). The data and insights generated from the predictive analytics will not only benefit individual buildings but also the building industry and research communities at large by improving our understanding of human comfort in various contexts, and facilitating the discovery of repeatable patterns that can be generalized to larger populations. Hence, efforts are needed to share these resources – both data and insights in order to expand the existing knowledge about human comfort and support further innovations in comfort management.
Human perception of automation and controllability: IoT and predictive analytics are likely to accelerate automation of building controls. While automation can be positively viewed from the system perspectives, its impact on building occupants and operators is not well understood in the building industry. To a certain extent, too much automation can be perceived as a loss of control and may result in dissatisfaction and distrust of the system. As the building industry moves forward with IoT-based control automation, we need to better understand the relationship between automation and human variables and determine the ‘right mix’ between automation and personal controllability in comfort management.

78
The role of humans in data-driven building controls: There seems to be a lot of hope in the future of predictive modeling in many industries that data can represent and replace humans in the control loop. While models can get better over time with more data and training, they are only an approximation of reality and cannot fully describe a person’s needs and desires. Making room for human judgments and interventions in the system design can not only provide a point of stability in the system operation but also offer an opportunity to correct and refine existing models. As such, it is important to reassess and redefine the role of humans in everyday comfort management as the building industry moves towards more data-driven building controls.
5.4 FUTURE RESEARCH SUGGESTION
This study revealed many areas for future research, which are outlined below:
Coordinated comfort controls between HVAC and PCS: Given that PCS can communicate with BAS on the same communication platform (i.e., sMAP), the logical next step is to integrate PCS into buildings’ comfort management to complement existing systems in the physical areas where centralized heating and cooling is not effective. This can allow the optimization of HVAC settings at both supply and discharge levels, which can lead to significant energy savings and comfort improvement. Additional research is needed to implement different integrated strategies in practice, and monitor both comfort responses and energy use.
Integration of distributed environmental sensing in HVAC controls: The field study showed that thermostat sensors poorly represent temperature conditions experienced by individual occupants across different building spaces. Hence, making control decisions based on zone-based thermostat readings alone can lead to discomfort and poor satisfaction. There is a need to develop control logics that integrate distributed environmental sensing in temperature control decisions for HVAC systems, and conduct field testing to assess their feasibility in building operations.
Personal comfort models in the HVAC feedback loop: Personal comfort models provide individualized comfort feedback that can be incorporated into temperature controls. The next step is to develop methods to identify the patterns of different comfort needs and preferences among individuals in shared spaces and determine optimal temperature settings that can maximize comfort satisfaction. There is a need for more research where one can use simulations to test control logics and energy impacts, and then lab or field studies to assess the impact on occupants and building operations.
Continuous learning in personal comfort models: Personal comfort models are intended for real-world applications; hence, their predictions need to stay relevant and accurate over time. In Chapter 3, I listed several methods that can be used for ongoing updates of personal comfort models; however, most of them are conceptual, not tested with real data. Hence, future research is needed to validate the proposed

79
methods with real data. When evaluating continuous learning methods, one should consider not only predictive accuracy but also other criteria that are important in real-world applications such as computational speed, interpretability, robustness, scalability, etc.
Building a public database for personal comfort models: To develop personal comfort models, some of the previous studies have used publicly available data (e.g., ASHRAE Thermal Comfort Database I, from RP-884). However, the data in ASHRAE Database I are not always individually-identifiable, giving not enough data to develop a reliable model per person. To overcome this challenge, other studies collected their own data that are large in size and rich in personal information. Combining these separate data together can create a powerful database for more robust modeling and generalizations that can benefit a wider audience. Hence, cross-institutional efforts are needed to build a public database that contains individually-identifiable data to encourage further innovations in personal comfort models.
Standardization of algorithm-based comfort management: The industry is rapidly adopting algorithm-based comfort management for both residential and commercial thermostat controls (e.g., Nest, Comfy). These algorithms are mostly proprietary, independently developed, and not always in agreement with the comfort standards’ approach (i.e., ASHRAE 55, ISO 7730, EN 15251). Hence, there is a need to develop a set of guidelines that can be adopted by these standards to ensure accurate and reliable performance of these algorithms in real-world applications. Such guidelines should address data collection, privacy and security requirements for data storage and access, and the development, testing, validation, and implementation of the custom models in buildings.
80
6 CONCLUSIONS
This dissertation presented the following innovations: 1) Internet-connected PCS and 2) personal comfort models that can help to deliver personalized comfort experiences in occupied spaces. In this dissertation, I demonstrated how they could create a synergistic effect by generating person-specific comfort data and intelligence respectively, and enable occupant-centric comfort management in buildings.
I developed and field-tested the new capabilities of PCS (i.e., data reporting, wireless connectivity) that could support individualized learning and coordinated controls with other connected systems in buildings. The field data analysis confirmed the value of PCS data as valuable feedback about individuals’ comfort and behavior in localized environmental conditions that can inform building control decisions. The study also confirmed the effectiveness of PCS in producing high comfort satisfaction – 96% thermal acceptability in 21-26 °C temperature range. It provided field evidence of other PCS benefits, such as thermal pleasure and pain relief, that could enhance experiences of building occupants beyond meeting thermal satisfaction.
I also proposed a new framework called personal comfort models to establish the foundation for personalized comfort intelligence in the field of thermal comfort. The goal of this framework is to predict specific comfort requirements of individual occupants for the purpose of occupant-responsive environmental control. Specifically, this framework established modeling methodologies to improve predictive accuracy and real-world relevance of individuals’ comfort predictions using IoT data and machine learning.
To demonstrate the feasibility of the proposed framework, I developed and evaluated personal comfort models using the individualized comfort data collected from 37 office workers, who used PCS chairs during a 6-month field study. The modeling results confirmed that an individualized approach to thermal comfort modeling significantly improved the accuracy of individuals’ thermal preference compared to conventional comfort models (i.e., PMV, Adaptive). They also showed that individuals’ thermal control behavior was a strong comfort predictor and could be used as an individualized comfort feedback for HVAC controls.
The findings of this research can be applied to building design and control to better reflect individuals’ comfort requirements in everyday comfort management. For this to take place, more research and collaboration across different disciplines and organizations are needed to increase analytic capabilities, demonstrate system integrations, and standardize control practices in the building industry. I hope that the contributions of this work have provided necessary tools to move thermal comfort research and practice in that direction.
81
REFERENCE
Alfano, F.R. d’Ambrosio, Palella, B.I., Riccio, G., 2011. The role of measurement accuracy on the thermal environment assessment by means of PMV index. Building and Environment 46, 1361–1369. https://doi.org/10.1016/j.buildenv.2011.01.001
Allen, J.G., MacNaughton, P., Laurent, J.G.C., Flanigan, S.S., Eitland, E.S., Spengler, J.D., 2015. Green buildings and health. Current Environmental Health Reports 2, 250–258. https://doi.org/10.1007/s40572-015-0063-y
Altomonte, S., Schiavon, S., 2013. Occupant satisfaction in LEED and non-LEED certified buildings. Building and Environment 68, 66–76. https://doi.org/10.1016/j.buildenv.2013.06.008
Amai, H., Tanabe, S., Akimoto, T., Genma, T., 2007. Thermal sensation and comfort with different task conditioning systems. Building and Environment 42, 3955–3964.
Andersen, M., 2017. Hamilton open-source hardware.
Andersen, M.P., Fierro, G., Culler, D.E., 2016a. System Design for a Synergistic, Low Power Mote/BLE Embedded Platform. IEEE, pp. 1–12. https://doi.org/10.1109/IPSN.2016.7460722
Andersen, M.P., Fierro, G., Kumar, S., Kim, J., Arens, E.A., Zhang, H., Raftery, P., Culler, D.E., 2016b. Well-connected microzones for increased building efficiency and occupant comfort, in: Proceedings of ACEEE Summer Study on Energy Efficiency in Buildings. Pacific Grove, CA.
Andersen, R., Fabi, V., Toftum, J., Corgnati, S.P., Olesen, B.W., 2013. Window opening behaviour modelled from measurements in Danish dwellings. Building and environment 69, 101–113. https://doi.org/10.1016/j.buildenv.2013.07.005
ANSI/ASHRAE, 2013. ANSI/ASHRAE 55-2013: Thermal environmental conditions for human occupancy. American Society of Heating, Refrigerating and Air-Conditioning Engineers. Atlanta, GA, US.
Arens, E., Xu, T., Miura, K., Hui, Z., Fountain, M., Bauman, F., 1998. A study of occupant cooling by personally controlled air movement. Energy and buildings 27, 45–59.
Arens, E., Zhang, H., Huizenga, C., 2006. Partial- and whole-body thermal sensation and comfort— Part I: Uniform environmental conditions. Journal of Thermal Biology, Second International Meeting on Physiology and Pharmacology of

82
Temperature RegulationSecond International Meeting on Physiology and Pharmacology of Temperature Regulation 31, 53–59. https://doi.org/10.1016/j.jtherbio.2005.11.028
Arens, E.A., Zhang, H., Pasut, W., 2015. Heated and cooled chair apparatus. US9155398 B2.
Ari, S., Wilcoxen, P., Khalifa, H.E., Dannenhoffer, J.F., Isik, C., 2008. A practical approach to individual thermal comfort and energy optimization problem, in: Fuzzy Information Processing Society, 2008. NAFIPS 2008. Annual Meeting of the North American. IEEE, pp. 1–6. https://doi.org/10.1109/NAFIPS.2008.4531261
Auffenberg, F., Stein, S., Rogers, A., 2015. A personalised thermal comfort model using a Bayesian Network, in: Proceedings of the Twenty-Fourth International Joint Conference on Artificial Intelligence (IJCAI 2015). pp. 2547–2553.
Bauman, F., Carter, T.G., Baughman, A.V., Arens, E.A., 1998. Field study of the impact of a desktop task/ambient conditioning system in office buildings. ASHRAE Transactions 104, 1153–1171.
Bauman, F., Raftery, P., Kim, J., Kaam, S., Schiavon, S., Zhang, H., Arens, E., Brown, K., Peffer, T., Blumstein, C., Culler, D., Andersen, M., Fierro, G., Paliaga, G., Pande, A., Cheng, H., Stein, J., 2017. Changing the Rules: Innovative low-energy occupant-responsive HVAC controls and systems. Final report to the California Energy Commission. CEC Contract PIR-12-026. Center for the Built Environment, Berkeley, CA.
Berglund, L.G., 1979. Thermal acceptability. ASHRAE Transactions 85, 825–834.
Bermejo, P., Redondo, L., de la Ossa, L., Rodríguez, D., Flores, J., Urea, C., Gámez, J.A., Puerta, J.M., 2012. Design and simulation of a thermal comfort adaptive system based on fuzzy logic and on-line learning. Energy and Buildings 49, 367–379. https://doi.org/10.1016/j.enbuild.2012.02.032
Bishop, C.M., 2006. Pattern recognition and machine learning. Springer.
Brager, G., Fountain, M., Benton, C., Arens, E.A., Bauman, F., 1993. A Comparison of Methods for Assessing Thermal Sensation and Acceptability in the Field, in: Oseland, N. (Ed.), Proceedings of Thermal Comfort: Past, Present and Future. British Research Establishment, Watford, United Kingdom.
Brager, G., Paliaga, G., De Dear, R., 2004. Operable windows, personal control and occupant comfort. ASHRAE Transactions 110, 17–35.

83
Brager, G., Zhang, H., Arens, E., 2015. Evolving opportunities for providing thermal comfort. Building Research & Information 43, 274–287. https://doi.org/10.1080/09613218.2015.993536
Brager, G.S., de Dear, R.J., 1998. Thermal adaptation in the built environment: a literature review. Energy and Buildings 27, 83–96. https://doi.org/10.1016/S0378-7788(97)00053-4
CEN, 2007. EN 15251-2007, Criteria for the indoor environment including thermal, indoor air quality, light and noise. European Committee for Standardization, Brussels, BE.
Chen, X., Wang, Q., Srebric, J., 2015. A data-driven state-space model of indoor thermal sensation using occupant feedback for low-energy buildings. Energy and Buildings 91, 187–198. https://doi.org/10.1016/j.enbuild.2015.01.038
Cheng, X., Yang, B., Olofsson, T., Liu, G., Li, H., 2017. A pilot study of online non-invasive measuring technology based on video magnification to determine skin temperature. Building and Environment 121, 1–10. https://doi.org/10.1016/j.buildenv.2017.05.021
Cheung, T.C., Schiavon, S., Gall, E.T., Jin, M., Nazaroff, W.W., 2017. Longitudinal assessment of thermal and perceived air quality acceptability in relation to temperature, humidity, and CO2 exposure in Singapore. Building and Environment 115, 80–90. https://doi.org/10.1016/j.buildenv.2017.01.014
Choi, J.-H., Loftness, V., Lee, D.-W., 2012. Investigation of the possibility of the use of heart rate as a human factor for thermal sensation models. Building and Environment 50, 165–175. https://doi.org/10.1016/j.buildenv.2011.10.009
Choi, J.-H., Yeom, D., 2017. Study of data-driven thermal sensation prediction model as a function of local body skin temperatures in a built environment. Building and Environment 121, 130–147. https://doi.org/10.1016/j.buildenv.2017.05.004
Chun, C., Kwok, A., Mitamura, T., Miwa, N., Tamura, A., 2008. Thermal diary: Connecting temperature history to indoor comfort. Building and Environment 43, 877–885. https://doi.org/10.1016/j.buildenv.2007.01.031
Cole, R.J., Robinson, J., Brown, Z., O’shea, M., 2008. Re-contextualizing the notion of comfort. Building Research & Information 36, 323–336. https://doi.org/10.1080/09613210802076328
Dai, C., Zhang, H., Arens, E., Lian, Z., 2017. Machine learning approaches to predict thermal demands using skin temperatures: Steady-state conditions. Building and Environment 114, 1–10. https://doi.org/10.1016/j.buildenv.2016.12.005

84
Daum, D., Haldi, F., Morel, N., 2011. A personalized measure of thermal comfort for building controls. Building and Environment 46, 3–11. https://doi.org/10.1016/j.buildenv.2010.06.011
Dawson-Haggerty, S., Jiang, X., Tolle, G., Ortiz, J., Culler, D., 2010. sMAP: a simple measurement and actuation profile for physical information, in: Proceedings of the 8th ACM Conference on Embedded Networked Sensor Systems. ACM, pp. 197–210.
de Dear, R.J., Brager, G.S., 1998. Developing an adaptive model of thermal comfort and preference. ASHRAE Transactions 104, 145–167.
Dounis, A.I., Caraiscos, C., 2009. Advanced control systems engineering for energy and comfort management in a building environment-A review. Renewable and Sustainable Energy Reviews 13, 1246–1261. https://doi.org/10.1016/j.rser.2008.09.015
Erickson, V.L., Cerpa, A.E., 2012. Thermovote: participatory sensing for efficient building HVAC conditioning, in: Proceedings of 4th ACM Workshop on Embedded Sensing Systems for Energy-Efficiency in Buildings (BuildSys). pp. 9–16. https://doi.org/10.1145/2422531.2422534
Erwine, B., 2016. Creating sensory spaces: the architecture of the invisible. Taylor & Francis.
Fanger, P., 1970. Thermal comfort. Analysis and applications in environmental engineering. Danish Technical Press, Copenhagen.
Farhan, A.A., Pattipati, K., Wang, B., Luh, P., 2015. Predicting individual thermal comfort using machine learning algorithms, in: 2015 IEEE International Conference on Automation Science and Engineering (CASE). Presented at the 2015 IEEE International Conference on Automation Science and Engineering (CASE), pp. 708–713. https://doi.org/10.1109/CoASE.2015.7294164
Feldmeier, M., Paradiso, J.A., 2010. Personalized HVAC control system, in: Internet of Things (IOT), 2010. Presented at the Internet of Things (IOT), 2010, pp. 1–8. https://doi.org/10.1109/IOT.2010.5678444
Ferri, C., Hernández-Orallo, J., Modroiu, R., 2009. An experimental comparison of performance measures for classification. Pattern Recognition Letters 30, 27–38. https://doi.org/10.1016/j.patrec.2008.08.010
Fisk, W.J., Rosenfeld, A.H., 1997. Estimates of improved productivity and health from better indoor environments. Indoor air 7, 158–172. https://doi.org/10.1111/j.1600-0668.1997.t01-1-00002.x

85
Freund, Y., Schapire, R.E., 1996. Experiments with a new boosting algorithm. International Conference on Machine Learning 96, 148–156.
Fritsch, R., Kohler, A., Nygard-Ferguson, M., Scartezzini, J.L., 1990. A stochastic model of user behaviour regarding ventilation. Building and Environment 25, 173–181. https://doi.org/10.1016/0360-1323(90)90030-U
Frontczak, M., Schiavon, S., Goins, J., Arens, E., Zhang, H., Wargocki, P., 2012. Quantitative relationships between occupant satisfaction and satisfaction aspects of indoor environmental quality and building design. Indoor Air 22, 119–131. https://doi.org/10.1111/j.1600-0668.2011.00745.x
Gao, P.X., Keshav, S., 2013. SPOT: a smart personalized office thermal control system, in: Proceedings of the Fourth International Conference on Future Energy Systems. ACM, pp. 237–246. https://doi.org/10.1145/2487166.2487193
Ghahramani, A., Castro, G., Becerik-Gerber, B., Yu, X., 2016a. Infrared thermography of human face for monitoring thermoregulation performance and estimating personal thermal comfort. Building and Environment 109, 1–11. https://doi.org/10.1016/j.buildenv.2016.09.005
Ghahramani, A., Jazizadeh, F., Becerik-Gerber, B., 2014. A knowledge based approach for selecting energy-aware and comfort-driven HVAC temperature set points. Energy and Buildings 85, 536–548. https://doi.org/10.1016/j.enbuild.2014.09.055
Ghahramani, A., Tang, C., Becerik-Gerber, B., 2015. An online learning approach for quantifying personalized thermal comfort via adaptive stochastic modeling. Building and Environment 92, 86–96. https://doi.org/10.1016/j.buildenv.2015.04.017
Ghahramani, A., Zhang, K., Dutta, K., Yang, Z., Becerik-Gerber, B., 2016b. Energy savings from temperature setpoints and deadband: Quantifying the influence of building and system properties on savings. Applied Energy 165, 930–942. https://doi.org/10.1016/j.apenergy.2015.12.115
Grivel, F., Candas, V., 1991. Ambient temperatures preferred by young European males and females at rest. Ergonomics 34, 365–378. https://doi.org/10.1080/00140139108967320
Haldi, F., Robinson, D., 2010. On the unification of thermal perception and adaptive actions. Building and Environment 45, 2440–2457. https://doi.org/10.1016/j.buildenv.2010.05.010

86
Haldi, F., Robinson, D., 2009. Interactions with window openings by office occupants. Building and Environment 44, 2378–2395. https://doi.org/10.1016/j.buildenv.2009.03.025
Hamatani, T., Uchiyama, A., Higashino, T., 2015. Real-Time Calibration of a Human Thermal Model with Solar Radiation Using Wearable Sensors, in: Proceedings of the 2015 Workshop on Wearable Systems and Applications. ACM, pp. 45–50.
Hanley, J.A., McNeil, B.J., 1982. The meaning and use of the area under a receiver operating characteristic (ROC) curve. Radiology 143, 29–36.
Herkel, S., Knapp, U., Pfafferott, J., 2008. Towards a model of user behaviour regarding the manual control of windows in office buildings. Building and environment 43, 588–600. https://doi.org/10.1016/j.buildenv.2006.06.031
Heschong, L., 1979. Thermal delight in architecture. MIT Press, Cambridge, MA.
Hofmann, T., Schölkopf, B., Smola, A.J., 2008. Kernel methods in machine learning. The Annals of Statistics 36, 1171–1220.
Hoyt, T., Arens, E., Zhang, H., 2015a. Extending air temperature setpoints: Simulated energy savings and design considerations for new and retrofit buildings. Building and Environment 88, 89–96.
Hoyt, T., Arens, E., Zhang, H., 2015b. Extending air temperature setpoints: Simulated energy savings and design considerations for new and retrofit buildings. Building and Environment 88, 89–96. https://doi.org/10.1016/j.buildenv.2014.09.010
Humphreys, M.A., Nicol, J.F., 1998. Understanding the adaptive approach to thermal comfort. ASHRAE transactions 104, 991–1004.
IEA, 2013. Transition to sustainable buildings - strategies and opportunities to 2050, executive summary. International Energy Agency, Paris, France.
Indraganti, M., Rao, K.D., 2010. Effect of age, gender, economic group and tenure on thermal comfort: A field study in residential buildings in hot and dry climate with seasonal variations. Energy and Buildings 42, 273–281. https://doi.org/10.1016/j.enbuild.2009.09.003
Inkarojrit, V., 2005. Balancing comfort: occupants’ control of window blinds in private offices (PhD thesis). University of California, Berkeley.
ISO, 2005. ISO 7730:2005, Ergonomics of the thermal environment - Analytical determination and interpretation of thermal comfort using calculation of the

87
PMV and PPD indices and local thermal comfort criteria. International Standard Organization. Geneva, CH.
ISO, 1995. ISO 10551:1995, Ergonomics of the thermal environment - Assessment of the influence of the thermal environment using subjective judgment scales. International Standard Organization. Geneva.
Jazizadeh, F., Ghahramani, A., Becerik-Gerber, B., Kichkaylo, T., Orosz, M., 2014a. Human-Building Interaction Framework for Personalized Thermal Comfort-Driven Systems in Office Buildings. Journal of Computing in Civil Engineering 28, 2–16. https://doi.org/10.1061/(ASCE)CP.1943-5487.0000300
Jazizadeh, F., Ghahramani, A., Becerik-Gerber, B., Kichkaylo, T., Orosz, M., 2014b. User-led decentralized thermal comfort driven HVAC operations for improved efficiency in office buildings. Energy and Buildings 70, 398–410. https://doi.org/10.1016/j.enbuild.2013.11.066
Jiang, L., Yao, R., 2016. Modelling personal thermal sensations using C-Support Vector Classification (C-SVC) algorithm. Building and Environment 99, 98–106. https://doi.org/10.1016/j.buildenv.2016.01.022
Kaam, S., Raftery, P., Cheng, H., Paliaga, G., 2017. Time-averaged ventilation for optimized control of variable-air-volume systems. Energy and Buildings 139, 465–475. https://doi.org/10.1016/j.enbuild.2016.11.059
Karjalainen, S., 2009. Thermal comfort and use of thermostats in Finnish homes and offices. Building and Environment 44, 1237–1245. https://doi.org/10.1016/j.buildenv.2008.09.002
Karjalainen, S., 2007. Gender differences in thermal comfort and use of thermostats in everyday thermal environments. Building and environment 42, 1594–1603. https://doi.org/10.1016/j.buildenv.2006.01.009
Karmann, C., Schiavon, S., Graham, L.T., Raftery, P., Bauman, F., 2017. Comparing temperature and acoustic satisfaction in 60 radiant and all-air buildings. Building and Environment 126, 431–441. https://doi.org/10.1016/j.buildenv.2017.10.024
Kolarik, J., Toftum, J., Olesen, B.W., Shitzer, A., 2009. Occupant responses and office work performance in environments with moderately drifting operative temperatures (RP-1269). HVAC&R Research 15, 931–960.
Langevin, J., Wen, J., Gurian, P.L., 2015. Simulating the human-building interaction: Development and validation of an agent-based model of office occupant behaviors. Building and Environment 88, 27–45. https://doi.org/10.1016/j.buildenv.2014.11.037
88
Langevin, J., Wen, J., Gurian, P.L., 2013. Modeling thermal comfort holistically: Bayesian estimation of thermal sensation, acceptability, and preference distributions for office building occupants. Building and Environment 69, 206–226. https://doi.org/10.1016/j.buildenv.2013.07.017
Leaman, A., Bordass, B., 1999. Productivity in buildings: the ‘killer’ variables. Building Research & Information 27, 4–19. https://doi.org/10.1080/096132199369615
Lee, H., Choi, J.S., Elmasri, R., 2008. A conflict resolution architecture for the comfort of occupants in intelligent office, in: Intelligent Environments, 2008 IET 4th International Conference On. IET, pp. 1–8. https://doi.org/10.1049/cp:20081135
Lee, S., Bilionis, I., Karava, P., Tzempelikos, A., 2017. A Bayesian approach for probabilistic classification and inference of occupant thermal preferences in office buildings. Building and Environment 118, 323–343. https://doi.org/10.1016/j.buildenv.2017.03.009
Li, D., Menassa, C.C., Kamat, V.R., 2017. Personalized human comfort in indoor building environments under diverse conditioning modes. Building and Environment 126, 304–317. https://doi.org/10.1016/j.buildenv.2017.10.004
Liu, W., Deng, Q., Ma, W., Huangfu, H., Zhao, J., 2013. Feedback from human adaptive behavior to neutral temperature in naturally ventilated buildings: physical and psychological paths. Building and Environment 67, 240–249. https://doi.org/10.1016/j.buildenv.2013.05.024
Liu, W., Lian, Z., Zhao, B., 2007. A neural network evaluation model for individual thermal comfort. Energy and Buildings 39, 1115–1122. https://doi.org/10.1016/j.enbuild.2006.12.005
Majnik, M., Bosnić, Z., 2013. ROC analysis of classifiers in machine learning: A survey. Intelligent Data Analysis 17, 531–558. https://doi.org/10.3233/IDA-130592
Melikov, A.K., Knudsen, G.L., 2007. Human response to an individually controlled microenvironment. HVAC&R Research 13, 645–660. https://doi.org/10.1080/10789669.2007.10390977
Miller, G.A., 1956. The magical number seven, plus or minus two: some limits on our capacity for processing information. Psychological review 63, 81.
Murakami, Y., Terano, M., Mizutani, K., Harada, M., Kuno, S., 2007. Field experiments on energy consumption and thermal comfort in the office environment controlled by occupants’ requirements from PC terminal. Building

89
and Environment 42, 4022–4027. https://doi.org/10.1016/j.buildenv.2006.05.012
Nicol, J.F., 2001. Characterising occupant behaviour in buildings: towards a stochastic model of occupant use of windows, lights, blinds, heaters and fans, in: Proceedings of the Seventh International IBPSA Conference. Rio, pp. 1073–1078.
Nicol, J.F., Humphreys, M.A., 2002. Adaptive thermal comfort and sustainable thermal standards for buildings. Energy and buildings 34, 563–572. https://doi.org/10.1016/S0378-7788(02)00006-3
Nicol, J.F., Raja, I.A., Allaudin, A., Jamy, G.N., 1999. Climatic variations in comfortable temperatures: the Pakistan projects. Energy and Buildings 30, 261–279. https://doi.org/10.1016/S0378-7788(99)00011-0
Nkurikiyeyezu, K.N., Suzuki, Y., Lopez, G.F., 2017. Heart rate variability as a predictive biomarker of thermal comfort. Journal of Ambient Intelligence and Humanized Computing 1–13. https://doi.org/10.1007/s12652-017-0567-4
Oi, H., Yanagi, K., Tabata, K., Tochihara, Y., 2011. Effects of heated seat and foot heater on thermal comfort and heater energy consumption in vehicle. Ergonomics 54, 690–699. https://doi.org/10.1080/00140139.2011.595513
Oseland, N.A., 1995. Predicted and reported thermal sensation in climate chambers, offices and homes. Energy and Buildings 23, 105–115. https://doi.org/10.1016/0378-7788(95)00934-5
Parkinson, T., de Dear, R., 2016. Thermal pleasure in built environments: spatial alliesthesia from contact heating. Building Research & Information 44, 248–262. https://doi.org/10.1080/09613218.2015.1082334
Parkinson, T., de Dear, R., 2015. Thermal pleasure in built environments: physiology of alliesthesia. Building Research & Information 43, 288–301. https://doi.org/10.1080/09613218.2015.989662
Pasut, W., Zhang, H., Arens, E., Kaam, S., Zhai, Y., 2013. Effect of a heated and cooled office chair on thermal comfort. HVAC&R Research 19, 574–583. https://doi.org/10.1080/10789669.2013.781371
Pasut, W., Zhang, H., Arens, E., Zhai, Y., 2015. Energy-efficient comfort with a heated/cooled chair: Results from human subject tests. Building and Environment 84, 10–21. https://doi.org/10.1016/j.buildenv.2014.10.026
Peng, B., Hsieh, S.-J., 2017. Data-driven thermal comfort prediction with support vector machine, in: ASME 2017 12th International Manufacturing Science and

90
Engineering Conference Collocated with the JSME/ASME 2017 6th International Conference on Materials and Processing. Presented at the ASME 2017 12th International Manufacturing Science and Engineering Conference collocated with the JSME/ASME 2017 6th International Conference on Materials and Processing, American Society of Mechanical Engineers. https://doi.org/10.1115/MSEC2017-3003
Pérez-Lombard, L., Ortiz, J., Pout, C., 2008. A review on buildings energy consumption information. Energy and buildings 40, 394–398. https://doi.org/10.1016/j.enbuild.2007.03.007
Raftery, P., Li, S., Jin, B., Ting, M., Paliaga, G., Cheng, H., 2018. Evaluation of a cost-responsive supply air temperature reset strategy in an office building. Energy and Buildings 158, 356–370. https://doi.org/10.1016/j.enbuild.2017.10.017
Raja, I.A., Nicol, J.F., McCartney, K.J., Humphreys, M.A., 2001. Thermal comfort: use of controls in naturally ventilated buildings. Energy and Buildings 33, 235–244. https://doi.org/10.1016/S0378-7788(00)00087-6
Rana, R., Kusy, B., Jurdak, R., Wall, J., Hu, W., 2013. Feasibility analysis of using humidex as an indoor thermal comfort predictor. Energy and Buildings 64, 17–25. https://doi.org/10.1016/j.enbuild.2013.04.019
Rijal, H.B., Yoshida, H., Umemiya, N., 2010. Seasonal and regional differences in neutral temperatures in Nepalese traditional vernacular houses. Building and Environment 45, 2743–2753. https://doi.org/10.1016/j.buildenv.2010.06.002
Schiavon, S., Lee, K.H., 2013. Dynamic predictive clothing insulation models based on outdoor air and indoor operative temperatures. Building and Environment 59, 250–260. https://doi.org/10.1016/j.buildenv.2012.08.024
Schiavon, S., Melikov, A.K., 2008. Energy saving and improved comfort by increased air movement. Energy and buildings 40, 1954–1960. https://doi.org/10.1016/j.enbuild.2008.05.001
Schiavon, S., Yang, B., Donner, Y., Chang, V.W.-C., Nazaroff, W.W., 2017. Thermal comfort, perceived air quality, and cognitive performance when personally controlled air movement is used by tropically acclimatized persons. Indoor Air 27, 690–702. https://doi.org/10.1111/ina.12352
Schumann, A., Wilson, N., Burillo, M., 2010a. Learning User Preferences to Maximise Occupant Comfort in Office Buildings, in: García-Pedrajas, N., Herrera, F., Fyfe, C., Benítez, J.M., Ali, M. (Eds.), Trends in Applied Intelligent Systems, Lecture Notes in Computer Science. Springer Berlin Heidelberg, pp. 681–690. https://doi.org/10.1007/978-3-642-13022-9_68
91
Schumann, A., Wilson, N., Burillo, M., 2010b. Learning user preferences to maximise occupant comfort in office buildings, in: García-Pedrajas, N., Herrera, F., Fyfe, C., Benítez, J.M., Ali, M. (Eds.), Trends in Applied Intelligent Systems. IEA/AIE 2010. Lecture Notes in Computer Science. Springer, Berlin, Heidelberg, pp. 681–690.
Schweiker, M., Fuchs, X., Becker, S., Shukuya, M., Dovjak, M., Hawighorst, M., Kolarik, J., 2017. Challenging the assumptions for thermal sensation scales. Building Research & Information 45, 572–589. https://doi.org/10.1080/09613218.2016.1183185
Sekhar, S.C., 1995. Higher space temperatures and better thermal comfort - a tropical analysis. Energy and Buildings 23, 63–70. https://doi.org/10.1016/0378-7788(95)00932-N
Shove, E., 2004. Comfort, Cleanliness and Convenience: the Social Organization of Normality. Berg Publishers.
Shove, E., Chappells, H., Lutzenhiser, L., Hackett, B., 2008. Comfort in a lower carbon society. Building Research & Information 36, 307–311. https://doi.org/10.1080/09613210802079322
Talon, C., Goldstein, N., 2015. Smart offices: how intelligent building solutions are changing the occupant experience, Intel-sponsored white paper. Navigant Consulting, Inc.
Tham, K.W., Willem, H.C., 2010. Room air temperature affects occupants’ physiology, perceptions and mental alertness. Building and Environment 45, 40–44. https://doi.org/10.1016/j.buildenv.2009.04.002
van Hoof, J., 2008. Forty years of Fanger’s model of thermal comfort: comfort for all? Indoor Air 18, 182–201. https://doi.org/10.1111/j.1600-0668.2007.00516.x
van Hoof, J., Schellen, L., Soebarto, V., Wong, J.K.W., Kazak, J.K., 2017. Ten questions concerning thermal comfort and ageing. Building and Environment 120, 123–133. https://doi.org/10.1016/j.buildenv.2017.05.008
Veselỳ, M., Zeiler, W., 2014. Personalized conditioning and its impact on thermal comfort and energy performance – A review. Renewable and Sustainable Energy Reviews 34, 401–408. https://doi.org/10.1016/j.rser.2014.03.024
Vissers, D.R., 2012. The human body as sensor for thermal comfort control (Master thesis). Eindhoven University of Technology.
Wagner, A., Gossauer, E., Moosmann, C., Gropp, T., Leonhart, R., 2007. Thermal comfort and workplace occupant satisfaction - Results of field studies in

92
German low energy office buildings. Energy and Buildings 39, 758–769. https://doi.org/10.1016/j.enbuild.2007.02.013
Wargocki, P., Wyon, D.P., Sundell, J., Clausen, G., Fanger, P., 2000. The effects of outdoor air supply rate in an office on perceived air quality, sick building syndrome (SBS) symptoms and productivity. Indoor air 10, 222–236. https://doi.org/10.1034/j.1600-0668.2000.010004222.x
Warren, P.R., Parkins, L.M., 1984. Window-opening behaviour in office buildings. Building Services Engineering Research and Technology 5, 89–101.
Watanabe, S., Melikov, A.K., Knudsen, G.L., 2010. Design of an individually controlled system for an optimal thermal microenvironment. Building and Environment 45, 549–558.
Watanabe, S., Shimomura, T., Miyazaki, H., 2009. Thermal evaluation of a chair with fans as an individually controlled system. Building and Environment 44, 1392–1398. https://doi.org/10.1016/j.buildenv.2008.05.016
Witten, I.H., Frank, E., Hall, M.A., Pal, C.J., 2016. Data mining: practical machine learning tools and techniques, 4th ed. Morgan Kaufmann.
Wyon, D.P., 2004. The effects of indoor air quality on performance and productivity. Indoor air 14, 92–101. https://doi.org/10.1111/j.1600-0668.2004.00278.x
Yun, G.Y., Tuohy, P., Steemers, K., 2009. Thermal performance of a naturally ventilated building using a combined algorithm of probabilistic occupant behaviour and deterministic heat and mass balance models. Energy and Buildings 41, 489–499. https://doi.org/10.1016/j.enbuild.2008.11.013
Zhai, Y., Zhang, H., Zhang, Y., Pasut, W., Arens, E., Meng, Q., 2013. Comfort under personally controlled air movement in warm and humid environments. Building and Environment 65, 109–117. https://doi.org/10.1016/j.buildenv.2013.03.022
Zhang, F., de Dear, R., 2017. University students’ cognitive performance under temperature cycles induced by direct load control events. Indoor Air 27, 78–93. https://doi.org/10.1111/ina.12296
Zhang, H., Arens, E., Huizenga, C., Han, T., 2010a. Thermal sensation and comfort models for non-uniform and transient environments, part II: local comfort of individual body parts. Building and Environment 45, 389–398. https://doi.org/10.1016/j.buildenv.2009.06.015
Zhang, H., Arens, E., Kim, D., Buchberger, E., Bauman, F., Huizenga, C., 2010b. Comfort, perceived air quality, and work performance in a low-power task–

93
ambient conditioning system. Building and Environment 45, 29–39. https://doi.org/10.1016/j.buildenv.2009.02.016
Zhang, H., Arens, E., Taub, M., Dickerhoff, D., Bauman, F., Fountain, M., Pasut, W., Fannon, D., Zhai, Y., Pigman, M., 2015a. Using footwarmers in offices for thermal comfort and energy savings. Energy and Buildings 104, 233–243. https://doi.org/10.1016/j.enbuild.2015.06.086
Zhang, H., Arens, E., Zhai, Y., 2015b. A review of the corrective power of personal comfort systems in non-neutral ambient environments. Building and Environment 91, 15–41. https://doi.org/10.1016/j.buildenv.2015.03.013
Zhang, H., Arens, E.A., Pasut, W., 2010c. Thresholds for indoor thermal comfort and perceived air quality. Center for the Built Environment.
Zhang, Y., Barrett, P., 2012. Factors influencing the occupants’ window opening behaviour in a naturally ventilated office building. Building and Environment 50, 125–134. https://doi.org/10.1016/j.buildenv.2011.10.018
Zhao, Q., Zhao, Y., Wang, F., Jiang, Y., Jiang, Y., Zhang, F., 2014a. Preliminary study of learning individual thermal complaint behavior using one-class classifier for indoor environment control. Building and Environment 72, 201–211. https://doi.org/10.1016/j.buildenv.2013.11.009
Zhao, Q., Zhao, Y., Wang, F., Wang, J., Jiang, Y., Zhang, F., 2014b. A data-driven method to describe the personalized dynamic thermal comfort in ordinary office environment: From model to application. Building and Environment 72, 309–318. https://doi.org/10.1016/j.buildenv.2013.11.008
Zou, H., Hastie, T., 2005. Regularization and variable selection via the elastic net. Journal of the Royal Statistical Society: Series B (Statistical Methodology) 67, 301–320. https://doi.org/10.1111/j.1467-9868.2005.00503.x

94
APPENDIX A: PCS HARDWARE AND SOFTWARE
STORM CONTROLLER OVERVIEW
The final generation of the PCS controller and user interface for this project included the Storm hardware platform communicating via IEEE802.15.4 to border routers to the server via the Internet. The user interface was redesigned to include two knobs (seat and chair) that provided both heating (rotated right) and cooling (rotated left). The integration architecture for the PCS chair is composed of three tiers, as shown in Figure A-1. The user interface is an Android application running on the user’s smart phone.
Figure A-1. Personal Comfort System chair integration architecture.
At the core of this controller is a Storm – a reusable Cortex-M4 module running a TinyOS based software stack. The Storm module provides an IEEE 802.15.4 radio so that chairs can send telemetry to the control suite described in the next section, as well as have their settings changed remotely. The carrier board provides application specific functionality – a monitoring power supply, interface circuitry and Bluetooth connectivity.
The Storm module is used due to its ultra-low operating current. Although the power requirements of the fans and heating strips dominate, they are used only periodically. The rest of the controller is continuously on and sending telemetry so it is

95
advantageous to minimize its quiescent current. By using the Storm, a chair that is unoccupied or occupied by a person comfortable with his/her environment consumes less than 1mA on average while sending telemetry packets once per second. With the equipped battery, this allows the chair to continue sending telemetry for years between charges. Although the use of a more powerful core module such as a Raspberry Pi or other Linux machine is possible given the large battery pack, these devices consume hundreds of mA at a minimum and would reduce the maximum time between charges by two to three orders of magnitude. A power monitoring circuit monitors the battery to alert the operator when the chair needs recharging.
The interface circuitry connects to the heating strips and fans to provide fine-grained setting of the fan and heat intensity independently on the seat and back of the chair. The heating strips use an energy efficient pulse width modulated (PWM) open drain circuit so that all the energy is dissipated in the heating strip, irrespective of intensity setting. This is an improvement over the analog rheostat control, which wasted energy in the control circuitry. Unfortunately, as we were retrofitting existing chairs, the fans were not compatible with PWM control – they did not have a dedicated PWM control line and attempting to PWM the power line resulted in audible buzzing and motor stalls. We therefore use voltage mode control to modulate the fan intensity. As the fans use only 3.6W (and substantially less as the voltage drops off) this is acceptable, although future revisions of the chair will use PWM-compatible fans such as those from personal computers.
A temperature and relative humidity sensor was added to the controller to enable accurate distributed environmental monitoring. This information enables direct comparison between the settings that the user chooses, and the environment that he/she is in. In actual deployments, the temperature at the location of individual chairs in a room can differ significantly from the temperature reported by the thermostat. The temperature sensors in the chairs can be used to compensate for this in HVAC control loops. The sensor is thermally isolated to minimize heat gain from the rest of the controller, a design choice we found lacking in the majority of smart thermostats available off the shelf.
CHAIR CONTROL CIRCUITRY
The chair contains circuitry in two locations. The “brain” resides underneath the chair near the battery and runs the main control logic for the chair, along with radio communication. It is composed of two parts, a Firestorm and the Chair Shield. These plug into each other to form one board. The other piece of circuitry is the UI board on the end of a tether which is used as a control interface by the user. Figure A-2 shows all three boards:

96
Figure A-2. Hardware for the PCS deployment in the San Mateo County Building.
The Firestorm platform is discussed in detail in Andersen et al. (2016a), and the design is open source. The chair shield was purpose built for this application, and contains:
• High efficiency switched-mode power supply from 14V to 5V • A plug for interfacing with the chair heating strips and fans • A plug for interfacing with the UI board • A real time clock for storing time • Switching circuitry for the fans and heating strips
The UI board is also purpose built for this application and contains
• A secondary microprocessor to handle IO • Two rotary dials for the user to indicate their control preference • Two rings of LEDs to indicate the current setting of the board • A plug that uses a standard networking cable to speak to the chair shield
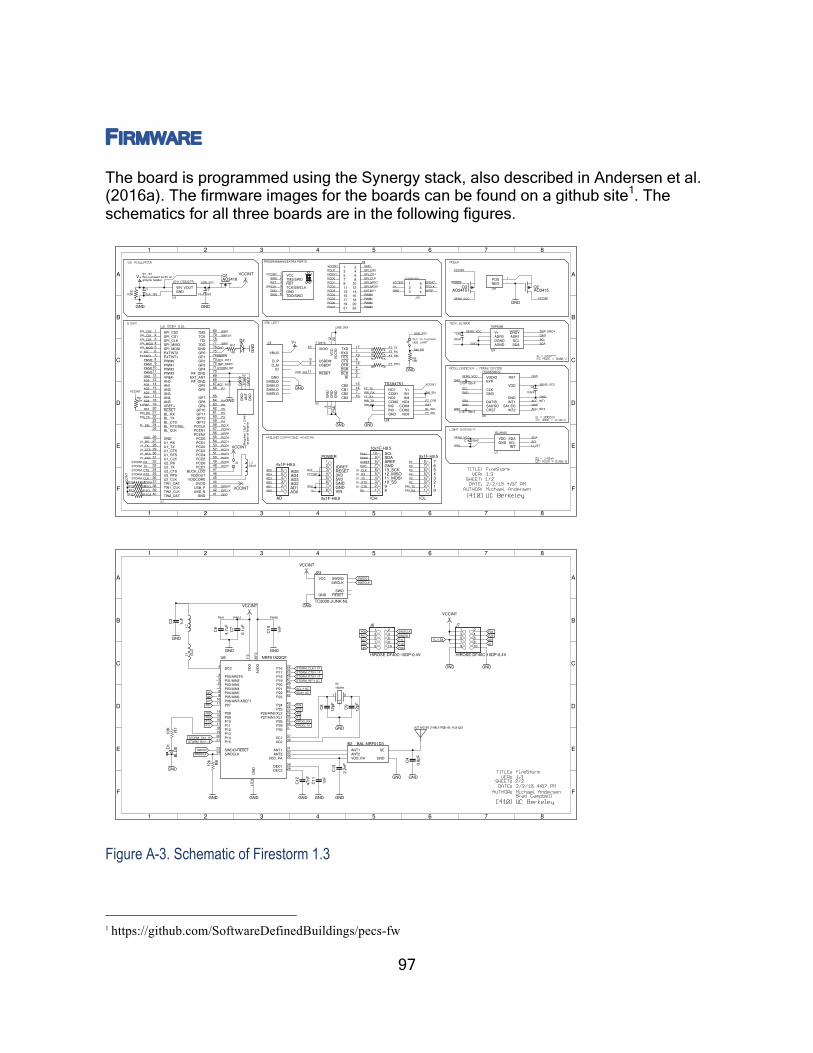
97
FIRMWARE
The board is programmed using the Synergy stack, also described in Andersen et al. (2016a). The firmware images for the boards can be found on a github site1. The schematics for all three boards are in the following figures.
Figure A-3. Schematic of Firestorm 1.3
1 https://github.com/SoftwareDefinedBuildings/pecs-fw
5V-9V
Butispresentas5Von
arduinoheader
PROGRAMMING/EXTRAPORTS
8x1F-H8.5
10x1F-H8.5
6x1F-H8.5
8x1F-H8.5
GND
GND
AO3418
10uF,16V
GND
V+
10uF,6V3
GND
100K
VCCINT
V+
1K
1K
1K
1K
GND
47K
100nF
100nF
100nF
22uH
VCCINT
VCCINT
100nF
100nF
10K
GND
AO3415
10K GND
AO3415
GND
1k8
1k8
1k8
1k8
GND
IOL
1
2
3
4
5
6
7
8
1
2
3
4
5
6
7
8
9
10
IOHAD
1
2
3
4
5
6
POWER
1
2
3
4
5
6
7
8
SPI_CS21
SPI_CS12
SPI_CLK3
SPI_MISO4
SPI_MOSI5
EXTINT26
EXTINT17
PWM08
PWM19
PWM210
PWM311
VREF-12
AN013
AN114
AN215
AN316
AN417
AN518
VREF+19
RESET20
BL_RX21
BL_TX22
BL_CTS23
BL_RTS/SEL24
BL_CLK25
GND26
U1_RX27
U1_TX28
U1_CTS29
U1_RTS30
U1_CLK31
U2_RX32
U2_TX33
U2_CTS34
U2_RTS35
U2_CLK36
TW1_DAT37
TW1_CLK38
TW2_CLK39
TW2_DAT40
GND41
USB_N42
USB_P43
DVDD44
VDDCORE45
VDDOUT46
BUCK_LDO47
PCD748
PCD649
PCD550
PCD451
PCD352
PCD253
PCD154
PCD055
PCEN256
PCEN157
PCCLK58
GP1359
GP1260
GP1161
GP1062
GP963
GP864
GP765
GP666
GP567
RF_GND68
EXT_ANT69
RF_GND70
GP471
GP372
GP273
GP174
GP075
GND76
TDO77
TDI78
TCK79
TMS80
D_P
D_M
VBUS
ID
GND
SHIELD
SHIELD
SHIELD
SHIELD
J1
3V3O10
USBDM9
USBDP8
RESET11
VCC
12
VCCIO
20
TXD17
RXD1
RTS19
CTS6
DTR18
DSR4
DCD5
RI2
CB015
CB114
CB27
CB316G
ND
PAD
GND
13
GND
3
U2
Q1
VIN VOUT
GNDC1 C2
R1
R2
R3
R4
R5
NO1
COM1
NO2
COM2
IN2
IN3
GND NO3
COM3
COM4
NO4
IN4
IN1
V+
J2
R6
VDDIO
BYP
CLK
GND
DAT/SI
SA0/SO
CRST INT2
SA1/CS
INT1
GND
VDD
RST
C5
C15
C16
J4
VCC1
TMS/SWD2
RST3
TCK/SWCLK4
GND5
TDO/SWO6
VDD
GND
INT
SCL
SDA
U7
C14
V+
ADR0
DGND
AGND SDA
SCL
ADR1
DRDY
U8
C18
R9
Q3
D2
R10
Q2
POS+
NEG-
R11
R12
R13
R14
1
2
3 4
5
6
J10
FCI95290-303ALF
1
3
5
7
9
11
13
15
17
19 20
18
16
14
12
10
8
6
4
2
21 22
J3
GND
GND1
ANT
TRACE
GND
GND2GND
GND
GND
GND
GND GND
GND
GND
GND
GND
GND
GND
GND
GND
GND
GND
GND
GND
GND
V+
V+
USB_3V3
USB_3V3
USB_3V3
USB_3V3
VCCINT
VCCINT
VCCINT
VCCINT
VCCINT
VCCINT
VCCINT
VCCINT
VCCINT
PRI_RX
PRI_RX
PRI_RX
PRI_TX
PRI_TX
PRI_TX
P4
P4
P7
P7
BL_SEL
BL_SELRST
RST
RST
RST
FT_TX
FT_TX
FT_RX
FT_RX
SW_EN
SW_EN
SW_EN
FT_DTR
FT_DTR
FT_SEL
FT_SEL
AD0
AD0
AD1
AD1
AD2
AD2
AD3
AD3
AD4
AD4
AD5
AD5
AVREF
AVREF
P2
P2
P3
P3
P5
P5
P6
P6
P8
P8
U1_RTS
U1_RTS
U1_CTS
U1_CTS
U1_TX
U1_TX
U1_RX
U1_RX
U1_CLK
U1_CLK
SCL
SCL
SCL
SCL
SDA
SDA
SDA
SDA
ESCL
ESCL
ESDA
ESDA
ACC_INT1
ACC_INT1
ACC_INT2
ACC_INT2
STORM_RX
STORM_TX
STORM_CTS
STORM_RTS
STORM_CLK
STORM_INT
SWD
SWD
SWCLK
SWCLK
SWO
SWO
PCLK
PCLK
PCEN1
PCEN1
PCD0
PCD0
PCD1
PCD1
PCD2
PCD2
PCD3
PCD3
PCD4
PCD4
PCD5
PCD5
PCD6
PCD6
PCD7
PCD7
SPI_CS1
SPI_CS1
SPI_CLK
SPI_CLK
SPI_MISO
SPI_MISO
SPI_MOSI
SPI_MOSI
PWM0
PWM0
PWM1
PWM1
PWM2
PWM2
PWM3
PWM3
SPI_CS2
SPI_CS2
EXTINT1
EXTINT1
LI_INT
LI_INT
SENS_VCC
SENS_VCC
SENS_VCC
SENS_VCC
SENS_VCC
TMP_DRDY
TMP_DRDY
ENSEN
ENSEN
EPDAT
EPDAT
EPGP
EPGP
EPCLK
EPCLK
A
B
C
D
E
F
1 2 3 4 5 6 7 8
A
B
C
D
E
F
1 2 3 4 5 6 7 8
FT231X
INT
TS3A4751
FXOS8700CQ
INT
INT
1 2
6
ISL29035
TMP006B
Requires1.5pF+3.9nH
aspartoffootprint
01234567
8910_SS11_MOSI12_MISO13_SCKGNDAREFSDASCL
AD0AD1AD2AD3AD4AD5
VINGNDGND
3V3RESET
5V0
IOREF
U3
LD1117S33CTR
U4
U5
PIN12PIN1 PIN36
0.1uF
GND
1nF
4.7uF
GND
GND
NRF51822QF
GND
BAL-NRF01D3
1uF
16MHz
12pF
12pF
GND
1nF
47nF
GND GND
GND
2.2nF
GND
12k
GND
BLUE
10K
GND
HIROSE-DF40C-10DP-0.4V HIROSE-DF40C-10DP-0.4V10uH
GND GND
0.8pF
GND
TC2030-JLINK-NL
GNDVCCINT
VCCINT
VCCINT
C7
C10
C6
VDD
1*2
GND
13*4
P00/AREF04
P01/AIN25
DCC2
P02/AIN36
P03/AIN47
P04/AIN58
P05/AIN69
P06/AIN7/AREF110
P0711
XC137
XC238
P0814
P0915
P1016
P1117
P1218
P1319
P1420
P1521
P1622
P1725
P1826
P1927
P2028
P2140
P2241
P2342
P2443
P2544
P26/AIN0/XL245
P27/AIN1/XL146
P2847
P2948
SWDIO/RESET23
SWDCLK24
DEC139
DEC229
ANT131
ANT232
VDD_PA30
AVDD
35*2
U6
P303
ANT1
ANT2
VDD_PA
SE
GND
B2
L2
C3
1 3
X2
GND
C8
C9
C11
C12
C13R8
D1
R7
J6
1 2
3 4
5 6
7 8
9 10
J7
1 2
3 4
5 6
7 8
9 10
L3
C4
SWDIO
SWCLK
SWO
RESET
VCC
GND
J23
SWDCLK
SWDCLK
SWDCLK
SWDIO
SWDIO
SWDIO
V+/1.5A
A7
A7
A6
A6
A5
A5
P08
P08
P09
P09
P10
P10
P11
P11
PROG_RX
PROG_TX
P25
P25
P24
P24
A1
A1
A0
A0
P07
P07
STORM_TX/1.1F
STORM_RX/1.1E
STORM_CLK/1.1F
STORM_CTS/1.1F
STORM_RTS/1.1F
STORM_INT/1.2C
SCL/1.8C
SDA/1.8C
A
B
C
D
E
F
1 2 3 4 5 6 7 8
A
B
C
D
E
F
1 2 3 4 5 6 7 8
INT
INT
INT

98
Figure A-4. Firestorm layout.

99
Figure A-5. Schematic of Storm B.01--Main and IO.
FLASHMakesurepartoperatesover1.7-3.6
RADIOCRYSTAL
Mayrequireextraloadcaps
STORMB.01-MAIN
SB.01
POWER
U3PWR
680R2.2pF
1.5kR@100Mhz
2K2
2K2
22pF 22pF
GND
GND
GND
GND
10uF
GND
100nF
100nF
GND
20pF 20pF
BAL3
BAL4
UN1
GND5
GND2
DIG31
DIG42
AVSS3
RF_P4
RF_N5
AVSS6
DVSS7
RST8
DIG19
DIG210
SLP_TR11
DVSS12
DVDD13
DVDD14
DEVDD15
DVSS16
CLKM17
DVSS18
SCLK19
MISO20
DVSS21
MOSI22
CS23
IRQ24
XTAL225
XTAL126
AVSS27
EVDD28
AVDD29
AVSS30
AVSS31
AVSS32
U2
AVSSPAD
1
2
3
4
R7
C2
GNDA3
VDDINA4
VDDOUTA5
VDDCOREA6
VDDIOA8
GNDA9
GNDB10
VDDIOC10
ADVREFND1
GNDANAD2
VDDANAE1
ADVREFPE2
VDDIOE6
VDDIOF10
CAPLJ1
CAPHK1
VLCDK2
VLCDINK5
BIASLJ4
BIASHK3
GNDK4
VC16
IN5
VC24
OUT23
OUT11
GND2
R8
R9
C9 C10
C3
C4
SI1
SCK2
RST3
CS4
WP5
VCC6
GND7
SO8
U1
C1
C11C12
C5
C6
C7
C14 C13
GND
GND
GND
GND
GND
GND
GND
GND GND
GND
GND GND
GND
GND
GND
GND
GND
GND
RRST
RSLP
DVDD
DVDD
DVDD
DVDDDVDD
DVDD
DVDD
DVDD
RDVDD
RDVDD
RADIO_CS
RIRQ
RCLKOUT
XT2
XT2
XT1
XT1
AVDD
AVDD
RAVDD
ADVREFP
VDDOUT
VDDCORE
ADVREFN
EXT_ANT
SPI_MOSI
SPI_MOSI
SPI_CLK
SPI_CLK
FL_CS
SPI_MISO
SPI_MISO
WUERTH748421245
AT86RF233
GND
ATSAM4L
SKY13323-378LF
ATDB641E
ATDB081E
Errata:C11+C12shouldbe100nF
L1
U4
STORMB.01-IO
SB.01
PGM
U3MISC
PIOA
U3PIOA
PIOB
U3PIOB
PIOC
U3PIOC
39R
39R
P11
P22
P33
P44
P55
P66
P77
P88
P99
P1010
P1111
P1212
P1313
P1414
P1515
P1616
P1717
P1818
P1919
P2020
P2121
P2222
P2323
P2424
P2525
P2626
P2727
P2828
P2929
P3030
P3131
P3232
P3333
P3434
P3535
P3636
P3737
P3838
P3939
P4040
P4141
P4242
P4343
P4444
P4545
P4646
P4747
P4848
P4949
P5050
P5151
P5252
P5353
P5454
P5555
P5656
P5757
P5858
P5959
P6060
P6161
P6262
P6363
P6464
P6565
P6666
P6767
P6868
P6969
P7070
P7171
P7272
P7373
P7474
P7575
P7676
P7777
P7878
P7979
P8080
RESETB5
TCKB4
XIN32B2
XOUT32C2
XIN0/PA00B9
XOUT0/PA01B8
PA02/BUCK_LDOA7
TMS/PA03B3
PA04A2
PA05A1
PA06C3
PA07D3
PA08G2
PA09F5
PA10H2
PA11H3
PA12J2
PA13H5
PA14K7
PA15G5
PA16J7
PA17H6
PA18K10
PA19J10
PA20H10
PA21E9
PA22E10
TDO/PA23D6
TDI/PA24D10
PA25/USB_MD9
PA26/USB_PC9
PB00J3
PB01D5
PB02E5
PB03C4
PB04C1
PB05B1
PB06G3
PB07H1
PB08G6
PB09G7
PB10G8
PB11K9
PB12E7
PB13E8
PB14D7
PB15D8
PC00A10
PC01C8
PC02C7
PC03B7
PC04C5
PC05C6
PC06B6
PC07F2
PC08E3
PC09F1
PC10D4
PC11E4
PC12F3
PC13F4
PC14G1
PC15J5
PC16J6
PC17H4
PC18K6
PC19G4
PC20H7
PC21K8
PC22J8
PC23H8
PC24J9
PC25H9
PC26G9
PC27F6
PC28G10
PC29F7
PC30F8
PC31F9
R1
R2
RCLKOUT
BUCK_LDO
BUCK_LDO
TMS
TMS
TDO
TDO
TDI
TDI TCK
TCK RESET
RESET
USB_N
USB_N
USB_P
USB_P
UPR_P
UPR_N
SPI_MOSI
SPI_MOSI
SPI_MISO
SPI_MISO
SPI_CLK
SPI_CLK
FL_CS
SPI_CS1
SPI_CS1
SPI_CS2
SPI_CS2
GND
GND
GND
GND
GND
INT0
INT0
PWM0
PWM0
PWM1
PWM1
PWM2
PWM2
AD0
AD0
AD1
AD1
AD2
AD2
AD3
AD3
AD4
AD4
AD5
AD5
ADVREFP
ADVREFN
PWM3
PWM3
INT1
INT1
BL_RX
BL_RX
BL_TX
BL_TX
BL_CTS
BL_CTS
BL_SEL
BL_SEL
BL_CLK
BL_CLK
U1_RX
U1_RX
U1_TX
U1_TX
U1_CTS
U1_CTS
U1_RTS
U1_RTS
U1_CLK
U1_CLK
U2_RX
U2_RX
U2_TX
U2_TX
U2_CTS
U2_CTS
U2_RTS
U2_RTS
U2_CLK
U2_CLK
TW1_DAT
TW1_DAT
TW1_CLK
TW1_CLK
TW2_CLK
TW2_CLK
TW2_DAT
TW2_DAT
DVDD
EXT_ANT
VDDCORE
VDDOUT
RADIO_CS
RRST
RSLP
GP5
GP5
GP6
GP6
GP7
GP7
GP8
GP8
GP9
GP9
GP10
GP10
GP11
GP11GP12
GP12
GP13
GP13
PCD7
PCD7
PCD6
PCD6
PCD5
PCD5
PCD4
PCD4
PCD3
PCD3
PCD2
PCD2
PCD1
PCD1
PCD0
PCD0
PCEN2
PCEN2
PCEN1
PCEN1
PCCLK
PCCLK
RIRQ
GP0
GP0
GP1
GP1
GP2
GP2
GP3
GP3
GP4
GP4
1.25mmcastellated ATSAM4L
ATSAM4L
ATSAM4L
ATSAM4L
RF_GND
RF_GND
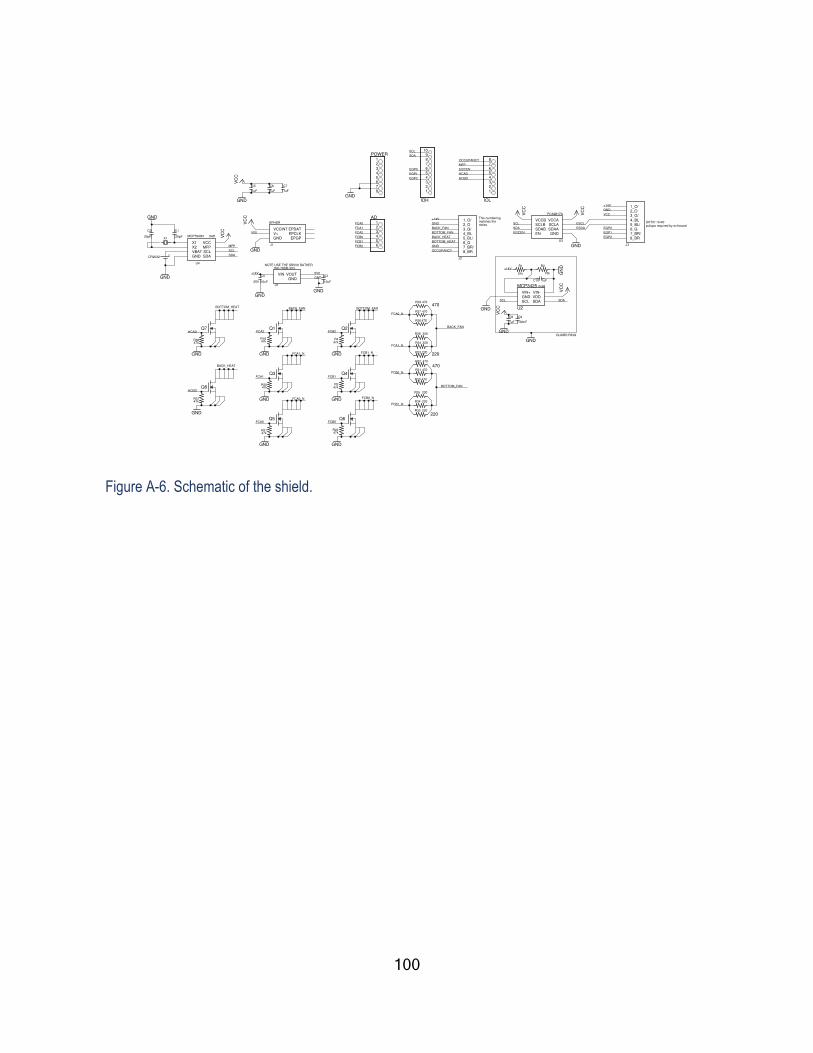
100
Figure A-6. Schematic of the shield.
47k
47k47k
47k
47k 47k
GND
GND
GND GND
GND
GND220
220
470
470
220
470
470
470
470
220
220
220
OKI-78SR-3V3
47k
GND
47k
GND
20pF20pF
GND
GND
GND
10uF10uF
GNDGND
51k 10k GND
GND
VCC
VCC
VCC
GND
GND
VCC
VCC
GND
VCC
GND
1uF 1uF 1uF
VCC
GND
1uF 100nF
1uF
X1
25V
VCCINT
V+
GND EPGP
EPCLK
EPDAT
J1
1
2
3
4
5
6
7
8
IOL
1
2
3
4
5
6
AD
1
2
3
4
5
6
7
8
9
10
IOH
1
2
3
4
5
6
7
8
POWER
Q1
Q3
Q5
Q2
Q4
Q6
R3
R4R18
R20
R21 R22
R23
R24
R26
R27
R28
R29
R30
R31
R32
R33
R34
R35
VIN
GND
VOUT
U1
Q7
R36
Q8
R37
1_O/
2_O
3_G/
4_BL
5_BL/
6_G
7_BR/
8_BR
J2
VIN+
GND
SCL SDA
VDD
VIN-
X1
X2
VBAT
GND SDA
SCL
MFP
VCC
U4
MCP7940N
C1C2
C3C4
R1 R2
1_O/
2_O
3_G/
4_BL
5_BL/
6_G
7_BR/
8_BR
J3
VCCA
SCLA
SDAA
GNDEN
SDAB
SCLB
VCCB
U3
C5 C6 C7
C8 C9
C10GND
GND
GND
GND
BOTTOM_FAN
BOTTOM_FAN
BOTTOM_FAN
BACK_FAN
BACK_FAN
BACK_FAN
FCA2
FCA2
FCA1
FCA1
FCA0
FCA0
FCB2
FCB2
FCB1
FCB1
FCB0
FCB0
FCA1_N
FCA1_N
FCA0_N
FCA0_N
FCB0_N
FCB0_N
FCB1_N
FCB1_N
5V0
5V0
BOTTOM_HEAT
BOTTOM_HEAT
BACK_HEAT
BACK_HEAT
HCAD
HCAD
HCBD
HCBD
+14V
+14V
+14V
+14V
OCCUPANCY
OCCUPANCY
SCL
SCL
SCL
SCL
SDA
SDA
SDA
SDA
VCC
MFP
MFP
EI2CEN
EI2CEN
ESCL
ESDA
EGP1
EGP1
EGP2
EGP2
EGP0
EGP0
EPHDR
MCP3425
+
PCA9617A
470
220
220
470
Thisnumbering
matchesthe
molex
NOTEUSETHESR5V0RATHER
GUARDRING
CR2032
0x6f
0x68
SHT21:0x40
pullupsrequiredbyextboard
U2

101
Figure A-7. Schematic of the physical user interface control knobs.
Figure A-8. User interface board layout.
130R
47R
47R
130R
47R
47R
130R
47R
47R
130R
47R
47R
130R
47R
47R
130R
47R
47R
130R
47R
47R
130R
47R
47R
130R
47R
47R
130R
47R
47R
130R
47R
47R
130R
47R
47R
130R
47R
47R
130R
47R
47R
130R
47R
47R
130R
47R
47R
130R
47R
47R
130R
47R
47R
130R
47R
47R
10k
10k
10k
10k
GND10nF
10nF
10k
10k
GND
10nF
130R
47R
47R
10k
10k
10k
10k
GND10nF
10nF
10k
10k
GND
10nF
GND
GND47k 47k
130R 130R
GND
130R
47R
47R
D1
R1
R2
R3
D2
R4
R5
R6
D3
R7
R8
R9
D4
R10
R11
R12
D5
R13
R14
R15
D6
R16
R17
R18
D7
R19
R20
R21
D8
R22
R23
R24
D9
R25
R26
R27
D10
R28
R29
R30
D11
R31
R32
R33
D12
R34
R35
R36
D13
R37
R38
R39
D14
R40
R41
R42
D15
R43
R44
R45
D16
R46
R47
R48
D17
R49
R50
R51
D18
R52
R53
R54
R55
R56
R57
R58
R59
R60
R61
C1
C2
R62
R63
C3
R64
R65
R66
R67
R68
R69
R70
C4
C5
R71
R72
C6
Q1 Q2
R73 R74
R76 R77
D19
R80
R81
R82
RA1
GA1
BA1
RA2
GA2
BA2
RA3
GA3
BA3
RA4
GA4
BA4
RA5
GA5
BA5
RA6
GA6
BA6
RA7
GA7
BA7
RA8
GA8
BA8
RA9
GA9
BA9
RB1
GB1
BB1
RB2
GB2
BB2
RB3
GB3
BB3
RB4
GB4
BB4
RB5
GB5
BB5
RB6
GB6
BB6
RB7
GB7
BB7
RB8
GB8
BB8
RB9
GB9
BB9
KAQA
KAQB
KAS
KAR
KAG
KAB KBS
KBR
KBG
KBB
KBQA
KBQB
DRAINBDRAINA
PB
PG
PR
knobs
12/16/1611:03AM
1/2Sheet:
A
B
C
D
1 2 3 4 5 6
A
B
C
D
1 2 3 4 5 6
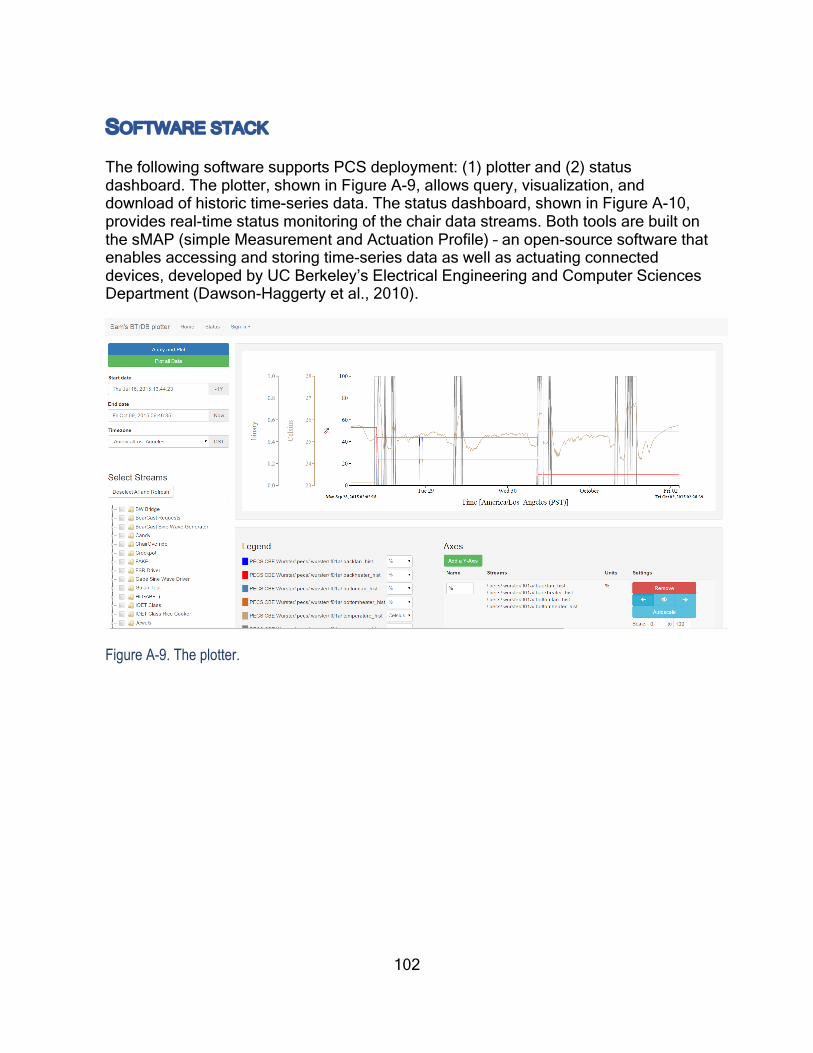
102
SOFTWARE STACK
The following software supports PCS deployment: (1) plotter and (2) status dashboard. The plotter, shown in Figure A-9, allows query, visualization, and download of historic time-series data. The status dashboard, shown in Figure A-10, provides real-time status monitoring of the chair data streams. Both tools are built on the sMAP (simple Measurement and Actuation Profile) – an open-source software that enables accessing and storing time-series data as well as actuating connected devices, developed by UC Berkeley’s Electrical Engineering and Computer Sciences Department (Dawson-Haggerty et al., 2010).
Figure A-9. The plotter.

103
Figure A-10. The status dashboard.

104
APPENDIX B: BACKGROUND SURVEY
Please start by entering your unique ID.
Please tell us a little about yourself.
What is your age?
m 30 or under m 31 - 50 m Over 50
What is your gender?
m Female m Male
What is your height?
What is your weight?
In a typical week, which of the following commute methods do you spend the most time utilizing? (you can select more than one if applicable)
q Car q Bike q Walk q Public transportation q Other: ____________________
Thermal comfort
Overall, how sensitive are you to the warm/hot temperature?
Very Insensitive Insensitive Slightly
Insensitive Neutral Slightly Sensitive Sensitive Very
Sensitive
. m m m m m m m

105
Overall, how sensitive are you to the cool/cold temperature?
Very Insensitive Insensitive Slightly
Insensitive Neutral Slightly Sensitive Sensitive Very
Sensitive
. m m m m m m m
Overall, how satisfied are you with the temperature in your workspace?
Very Dissatisfied Dissatisfied Somewhat
Dissatisfied Neutral Somewhat Satisfied Satisfied Very
Satisfied
. m m m m m m m
How would you best describe the source of your dissatisfaction? (check all that apply)
q humidity too high (damp) q humidity too low (dry) q air movement too high q air movement too low q incoming sun q hot/cold window surfaces q heat from office equipment q drafts from windows q drafts from vents q drafts falling from the ceiling q my area is hotter than other areas q my area is colder than other areas q thermostat is inaccessible q thermostat is adjusted by other people q heating/cooling system does not respond quickly enough to the thermostat q clothing policy is not flexible q other: ____________________
Which of the following do you personally adjust or control in your workspace? (check all that apply)
q Window blinds or shades q Operable window q Thermostat q Portable heater q Portable fan q Door to interior space q Other: ____________________

106
The End. Thank you!

107
APPENDIX C: DAILY (RIGHT-NOW) SURVEY
How do you feel right now?
Start by entering your unique ID.
Right now, how acceptable is the thermal environment at your workspace (consider both room and chair)?
Unacceptable Slightly unacceptable
Slightly acceptable Acceptable
m m m m
You would prefer to be:
m Cooler m No change m Warmer
Please select your clothing ensemble:

108
Are you using the chair's cooling or heating mode right now?
m Yes m No
Please enter any comments you have about your comfort chair.
Please identify your primary reasons for using the chair's COOLING mode. [Check all that apply]
q To get relief from the heat of the room q I like the cooling sensation of the chair against my body q I want to increase the air movement around me q To cool down from physical activity (walking to my office, climbing stairs, running,
biking, etc.) q Other: ____________________ q I'm not using the chair's cooling mode right now
Please identify your primary reasons for using the chair's HEATING mode. [Check all that apply]
q To get relief from the coolness of the room q I like the warming sensation of the chair against my body q To relieve my back pain q To warm myself from sitting still for long periods of time q Other: ____________________ q I'm not using the chair's heating mode right now
How satisfied are you with the comfort chair in achieving the desired result?
Very Dissatisfied Dissatisfied Somewhat
Dissatisfied Neutral Somewhat Satisfied Satisfied Very
Satisfied
m m m m m m m
You answered that you are not using the chair but prefer to be warmer or cooler. Is there a reason why you are not using the chair?
Thank you!