ADVANCES IN THE APPLICATION OF PASSIVE DOWN-DRAFT ...
186
ADVANCES IN THE APPLICATION OF PASSIVE DOWN-DRAFT EVAPORATIVE COOLING TECHNOLOGY IN THE COOLING OF BUILDINGS BY DAEHO KANG DISSERTATION Submitted in partial fulfillment of the requirements for the degree of Doctor of Philosophy in Architecture in the Graduate College of the University of Illinois at Urbana-Champaign, 2011 Urbana, Illinois Doctoral Committee: Associate Professor Richard K. Strand, Chair Associate Professor Ralph E. Hammann Professor Emeritus Ty A. Newell Professor S. Pratap Vanka
Transcript of ADVANCES IN THE APPLICATION OF PASSIVE DOWN-DRAFT ...

ADVANCES IN THE APPLICATION OF PASSIVE DOWN-DRAFT EVAPORATIVE
COOLING TECHNOLOGY IN THE COOLING OF BUILDINGS
BY
DAEHO KANG
DISSERTATION
Submitted in partial fulfillment of the requirements
for the degree of Doctor of Philosophy in Architecture
in the Graduate College of the
University of Illinois at Urbana-Champaign, 2011
Urbana, Illinois
Doctoral Committee:
Associate Professor Richard K. Strand, Chair
Associate Professor Ralph E. Hammann
Professor Emeritus Ty A. Newell
Professor S. Pratap Vanka

ii
ABSTRACT
A passive down-draft evaporative cooling (PDEC) tower is a component that is designed
to capture the wind at the top of a tower and cool the outdoor air using water evaporation. While
several different types of this particular system exist, PDEC tower with spray was studied in that
it is flexible, efficient, and prevalent. Sustainable feasibility has been known as the main benefit
of PDEC towers, leading to significant energy savings, improvement of indoor environmental
quality, and reduction of environmental cost. In contrast, PDEC towers have not been considered
in some circumstances as an alternative to conventional air conditioning systems due to strong
climatic dependency, insufficient cooling capacity, and huge water consumption when they
could be successfully integrated. In addition, suitable methods that can resolve problems
associated with PDEC towers and improve the performance of this particular system have not
been presented in the literature. This study was thus designed to present the solutions that
overcome these problems with PDEC towers so that they can be widely used in many types of
buildings and climatic regions.
Computational process modeling was carried out to understand fundamentals of down-
draft evaporative cooling processes. This study developed a computational model using a
commercial CFD code FLUENT, and this model was validated against experimental data. The
model then explained physical phenomena occurring within the effective area of PDEC towers,
so that conditions of the air were accurately predicted in different weather conditions as well as
PDEC tower conditions. In addition, parametric study with this computational model defined
critical factors that significantly impact the cooling performance of PDEC towers, and the
importance of various factors. As a result, a practical design guide to droplet size and tower
height was presented, which is applicable to most circumstances where PDEC towers could be
integrated.
Regression analysis using general-purpose statistical software Minitab was then followed
to formulate mathematical models that provide accurate conditions of PDEC air flows. Two
dependent variables, temperature and velocity, were considered. An individual sample was
created by the computational model developed in this study. Correlation analysis determined
independent variables that have significant relations with each dependent variable. A preliminary
iii
sampling process collected reasonable numbers of samples dealing with wide ranges of weather
conditions and PDEC tower conditions. Additional samples were added using forward sampling
methods so that minimum number of samples, which explain certain relations between
dependent and independent variables at the lowest cost, can be appropriately determined. As a
result, linear relations between dependent and independent variables were found and
mathematical forms of regression equations obtained was presented.
Dynamic simulations, using a whole building energy simulation program EnergyPlus,
employing new mathematical models developed in this study were performed to investigate
actual impacts of PDEC towers in various situations. A short-term simulation analysis
demonstrated problems with current PDEC towers operation, as well as impacts to indoor
thermal environment. Various alternatives to typical PDEC towers operation were analyzed, so
that water flow control in conjunction with primary cooling system was determined as a reliable
solution that overcomes those problems defined in this study. In addition, energy performance
and various impacts to indoor thermal environment were analyzed in a long-term simulation.
Consequently, PDEC towers are considered as a feasible component in various types of buildings
and climates.
The findings using the methods in this study demonstrate that typical PDEC towers are
inefficient in energy performance and indoor thermal environment. The cooling performance of
PDEC towers should thus be properly controlled to be an energy-efficient system. In addition,
PDEC towers can be considered as a secondary cooling system that meets a portion of cooling
loads in a space in order to accomplish low-energy goals as well as a comfortable indoor thermal
environment. Furthermore, the performance of PDEC towers is strongly dependent on each
critical parameter described in this study. Efforts should thus be made to find the most efficient
design conditions for main parameters corresponding to the local environment. Moreover, PDEC
towers are viable in various climates rather than a hot-dry climate, achieving almost the same
level of energy savings with lower water consumption.

iv
ACKNOWLEDGEMENTS
I am pleased to acknowledge people who have helped to make this dissertation possible.
I am deeply indebted to my advisor Dr. Richard K. Strand, who is one of the best
professors I have ever met. He is always patient, supportive, thoughtful, and encouraging when I
have been lacking in what I should have done. I sincerely appreciate his assistance in writing this
dissertation, applications for grant proposals and all his other help. Without his dedication to
shaping, writing, and reviewing this study, it would not have been successful.
I would also like to express my sincere gratitude to the other committee members: Dr. Ty
A. Newell, Dr. S. Pratap Vanka, and Dr. Ralph E. Hammann. I have been fortunate enough to
have the keen insight, vast knowledge, and profound intelligence of the incredible committee.
Their great contributions to my doctoral research have really polished my basic idea and helped
to shape it into the dissertation it is today.
I would like to thank Professor Brian Ford at the University of Nottingham in the UK for
the provision of experimental data. It has been a great help for validating the model presented in
this study, which is one of the most important parts of the study. I could not have moved forward
without the proper validation process.
Finally, I would like to express my deep respect for the sacrifices and love of my family.
I must especially acknowledge my wife, MinJung, for her dedicated support, patience, and
understanding. My special thanks must also be given to my lovely son, Junu, who is sweet,
considerate, and energetic. I appreciate the sincere encouragement, patience, and support of the
other family members who have taken much off my shoulders. I am sincerely grateful for all my
wonderful family.

v
TABLE OF CONTENTS
CHAPTER 1: INTRODUCTION .............................................................................. 1
1.1 Background and Purpose ............................................................................ 1
1.2 Scope and Method ...................................................................................... 3
CHAPTER 2: LITERATURE REVIEW .................................................................. 8
2.1 PDEC Towers with Pad ............................................................................... 8
2.1.1 Applications of PDEC towers with pad................................................... 8
2.1.2 Modeling of PDEC towers with pad ..................................................... 10
2.2 PDEC Towers with Spray .......................................................................... 11
2.2.1 Applications of PDEC tower with spray ................................................ 11
2.2.2 Modeling of spray PDEC towers .......................................................... 18
2.3 Summary ................................................................................................... 22
CHAPTER 3: THEORETICAL BACKGROUND .................................................. 28
3.1 Evaporative Cooling .................................................................................. 28
3.2 Overview of PDEC System ........................................................................ 30
3.2.1 Wind tower ........................................................................................... 31
3.2.2 PDEC tower with evaporative devices ................................................. 34
3.3 Simultaneous Heat and Mass Transfer...................................................... 36
3.3.1 Evaporation of a water droplet ............................................................. 37
3.4 Summary ................................................................................................... 41
CHAPTER 4: COMPUTATIONAL MODELING ................................................... 44
4.1 Model Description ...................................................................................... 44
4.2 Governing Equations ................................................................................. 46

vi
4.2.1 Continuous phase model ..................................................................... 46
4.2.2 Discrete phase model .......................................................................... 47
4.2.3 Coupling between the dispersed and continuous phases .................... 49
4.3 Physical Models ......................................................................................... 50
4.3.1 Computational domain ......................................................................... 51
4.3.2. Convergence ...................................................................................... 52
4.3.3 Discrete phase modeling ..................................................................... 53
4.3.4 Turbulence modeling ........................................................................... 54
4.4 Boundary Conditions ................................................................................. 57
4.5 Validation ................................................................................................... 58
CHAPTER 5: EFFECT OF VARIABLES ON PDEC COOLING PERFORMANCE
...................................................................................................................................... 61
5.1 Air Distribution Characteristics ................................................................... 61
5.1.1 Velocity profile ..................................................................................... 61
5.1.2 Temperature and relative humidity ...................................................... 66
5.2 Physical Tower Dimension ........................................................................ 74
5.2.1 Air mass flow rate with tower configuration .......................................... 74
5.2.2 Tower height ........................................................................................ 77
5.2.3 Shape of tower cross-section .............................................................. 81
5.3 Droplet Size ............................................................................................... 83
5.4 Water Flow Rate ........................................................................................ 87
5.5 Summary ................................................................................................... 91
CHAPTER 6: REGRESSION ANALYSIS FOR MATHEMATICAL MODELS ..... 93
6.1 Overview .................................................................................................... 93

vii
6.2 Methods and Sampling .............................................................................. 94
6.3 Multiple Linear Regression ........................................................................ 98
6.3.1 Correlation analysis ............................................................................. 98
6.3.2 Regression analysis for temperature ................................................. 100
6.3.3 Regression analysis for velocity ........................................................ 102
6.4 Summary ................................................................................................. 103
CHAPTER 7: DYNAMIC BUILDING ENERGY SIMULATION .......................... 104
7.1 Simulation Algorithm ................................................................................ 104
7.1.1 Typical operation of PDEC systems .................................................. 104
7.1.2 Performance control .......................................................................... 108
7.2 Case Study .............................................................................................. 112
7.2.1 PDEC without primary cooling system ............................................... 115
7.2.2 PDEC with primary cooling system .................................................... 134
7.3 Summary ................................................................................................. 149
CHAPTER 8: ENERGY SAVING POTENTIAL IN BUILDINGS ........................ 152
8.1 Simulation Description ............................................................................. 152
8.2 Primary School ........................................................................................ 158
8.2.1 Energy performance .......................................................................... 159
8.2.2 Indoor environment ............................................................................ 161
8.3 Medium Office ......................................................................................... 163
8.3.1 Energy performance .......................................................................... 164
8.3.2 Indoor environment ............................................................................ 165
8.4 Strip Mall .................................................................................................. 166
8.4.1 Energy performance .......................................................................... 167

viii
8.4.2 Indoor environment ............................................................................ 169
8.5 Summary ................................................................................................. 170
CHAPTER 9: CONCLUSION............................................................................ 173

1
CHAPTER 1: INTRODUCTION
1.1 Background and Purpose
Almost all world energy outlooks present a significant increase in energy consumption
over the coming decades. U.S. Energy Information Administration (EIA) highlighted that
"World marketed energy consumption increases by 49 percent from 2007 to 2035 in the
reference case. Total energy demand in non-OECD countries increases by 84 percent, compared
with an increase of 14% in OECD countries.” The first global-scale outlook on energy end-use
technologies published by the World Energy Council (WEC, 2004) represents that the world's
energy consumption is expected to double by 2030, and the reliance on fossil fuels such as coal,
oil, and natural gas is also expected to significantly increase. It also represents concerns on
global warming as well as renewable energy use by 2030, despite the introduction of energy-
efficient technologies in both areas.
Building sector including both residential and commercial buildings is the greatest source
in energy consumption. Buildings consume more than 30% of the total energy end-use in the
world (WEC, 2004). According to the Buildings Energy Data Book 2009, building sector
consumed 39% of U.S. primary energy in 2006. In addition, electricity is the fastest growing
energy source of the primary energy used in this sector, representing 72% of the total. The share
of renewable energy of the total primary energy consumption in US buildings in 2006 was 0.58%;
moreover, the growth of renewable energy is expected to be proportional to the overall growth in
energy demand, leaving renewable energy production at 0.61% of the total by 2030. It is thus
necessary to expand use of renewable technologies that contributes to overall energy
consumption as well as electricity reduction.
Alternatives that achieve low energy and high performance building are needed in order
to address the world energy problems. The demand for air conditioning in buildings has been
radically increased all around the world, causing an increase of energy consumption as well as a
greater environmental impact such as global warming (Santamouris, 2005), even though
substantial improvements have been made in the efficiency of air conditioning systems.
Accordingly, rising energy costs and a mandatory rising desire to reduce carbon dioxide
emissions has led to a focus on renewable energy sources as well as technologies. Furthermore,

2
many developing countries are distributed in lower latitudes where the demand for cooling is
high, and their economic growth will greatly increase this demand (WEC, 2004). Therefore, the
demand for energy-efficient, alternative technologies for space cooling has been growing as a
solution for the environmental cost of air conditioning is sought.
Passive cooling technologies in buildings are a critical issue in that they enhance the
sustainability of buildings, achieving economic and environmental benefits while still providing
the necessary conditioning. Conventional air conditioning systems are typically associated with
concerns of indoor air quality due to re-circulated air, production of pollution by the use of
refrigerants and power plant, and high electricity demand especially in the summer peak hours
(Santamouris, 2005; Gert et al, 1999.) As a result, alternatives to air conditioning systems are
strongly needed so as to resolve these disadvantages. On the other hand, low energy technologies
have been widely developed, and many studies have proven substantial improvements of these
passive cooling technologies in economical competiveness as well as environmental
effectiveness in the cooling of buildings (Bom et al., 1999; Givoni, 1991; Santamouris, 2005,
Giabaklou and Ballinger, 1996).
Evaporative cooling is expected to achieve significant energy saving among various low
energy technologies while limited to hot arid areas. This technology is commonly used for
cooling buildings in hot arid regions as it requires less energy and costs than many other cooling
applications (Givoni, 1991; Santamouris, 2005; Nahar et al., 2003). It is one of the oldest means
for comfort cooling and has been used to cool spaces since the ancient Egyptians around 2500
B.C. in hot arid climates (Watt and Brown, 1997). There are several types of commercial
applications employing evaporative cooling technology such as evaporative cooler and cooling
tower, and their efficiencies have been greatly improved, reaching close to 90% in industrial
products (Santamouris, 2005). As a result, an improved form of evaporative cooling such as
passive down draft evaporative cooling (PDEC) technology, and its applications have been
emerged as a viable alternative to traditional mechanical cooling, which have led to the
achievement of the low energy goal and an improved indoor environment.
The performance of passive cooling systems needs to be improved and shown to be valid
for other climates. The main drawback of PDEC systems is that they have not been proven in
climates other than hot arid climates. The application of PDEC technology is economical,

3
sustainable, and multi-functional. To date, however, PDEC applications have been limited to hot
arid climates, are difficult to control, and have been found to have insufficient cooling capacity.
The relevant studies and experimental data found in the literature do not provide enough
information to support improvements in this technology. To develop this application as a
relevant cooling system in buildings, expand its usage in building, and thus reduce the
environmental cost of cooling buildings, improvements in the performance and control of PDEC
systems are critical. This study is thus intended to understand fundamentals of evaporative
cooling processes within PDEC systems, identify main parameters affecting cooling performance
of these systems, provide the way to evaluate for decision-making process at the design stage,
and verify capability in various climates.
1.2 Scope and Method
A PDEC tower with spray will be investigated in this study since this type of PDEC
tower is the most efficient and capable as a cooling application in buildings. While a wind tower
is a fully passive application, it is insufficient in cooling capacity that a space requires. A PDEC
tower with pad is also less efficient in control, wind catching, and cooling output than a PDEC
tower with spray. A wind tower and a PDEC tower pad are thus unlikely to be integrated with
buildings without significant improvements in their performance as well as configurations. In
contrast, the efficiency of catching wind and controlling the thermal performance of a PDEC
tower with spray is much better in that various types of wind catchers as well as water drops are
applicable. This application can thus promptly respond to variable weather conditions. In
addition, experimental data and performance evaluation that have previously been conducted are
mainly available to this type. With these benefits, this study will focus on PDEC tower with
spray system.
Computational analysis using a commercial code is more feasible in this study than an
experiment. An experiment is suitable to understanding complex phenomena and to validation of
a numerical analysis. It, however, is difficult to control the conditions of variable parameters
such as outdoor weather conditions, water droplet sizes, and the tower configurations, and also
expensive to be performed. A number of cases are expected to be conducted in order to verify

4
critical correlations between relatively larger number of dependent parameters than many other
components and the cooling performance of PDEC systems. The investigation of influences of
each parameter under the same conditions in an experiment is thus a very difficult task, which is
required for understanding physical phenomena of this type of system. On the other hand, a
computational approach allows extensive analyses on influences of dependent parameters
without economical and seasonal limitations. A few computational models for a PDEC provide
basic approaches to the solutions. These models can be utilized as a simple model using
FLUENT that is valid to treat the main physical phenomenon simultaneous heat and mass
transfer and fluid analysis based on the finite volume method. This simple computational model
then will be developed as a complete model after appropriate validation and verification of
convergence.
Correlations between dependent variables and the thermal performance of the system will
be identified so that it expands capability and provides possibility in performance control. In fact,
evaporative cooling is one of popular alternatives to mechanical air conditioning systems, and
enough background information and theories are available in the literature. However, almost no
study adequately accounts for physical phenomena within this component. Most importantly,
extensive efforts to understand physics of this type of direct evaporative cooling have not been
made, while many studies have proven the significance of dependent parameters. They are
critical to improve and control the performance of the system as it is able to provide quicker
response along outdoor air and wind conditions, which always varies. Since the performance of
this application substantially changes with many dependent parameters such as tower
configuration, weather conditions, and water droplet size, identification of correlations between
these parameters and the performance will maximize the benefits, thus minimize the deficiencies
such as water consumption and performance control.
A mathematical model is necessary in order to provide overall design capability and
means of further analysis in dynamic energy simulation. A few mathematical models are
available in the literature, leaving the accuracy and uncertainties are in question. Among these
models, a semi-empirical model developed by Givoni (1993) is the only model valid for PDEC
tower with spray. It is critical for the model to account for all critical parameters affecting the
cooling performance of the system. This model, however, does not include both the effects of the

5
diameter as well as the temperature of water drops and of wind catchers while including
influences of the wet bulb depression, tower height, and water flow rate while. In addition,
dynamic energy simulation can only be valid when a mathematical model is available, which can
adequately reflect all critical influences from the PDEC tower with spray system. Therefore,
mathematical models will be developed once computational analysis verifies such relationships
among various parameters. This model includes all critical effects of dependent parameters
especially the size of water droplet and air flow rates, which have never been captured in the
literature. It will thus predict air conditions at the exit of the tower such as dry bulb temperature,
relative humidity, and velocity thus air flow rates, so that indoor thermal environment can be
estimated.
The actual impact of the component as a low energy solution will be analyzed. The
overall performance and possibilities as a cooling application of buildings are to be investigated
in detail as it supports significant improvements in not only cooling performance but the other
aspects. To figure out overall benefits of a cooling system, dynamic simulations using a whole
building energy simulation software EnergyPlus will investigate energy performance and
environmental benefits that these applications can accomplish. Comparisons between PDEC
systems and mechanical air conditioning systems in indoor thermal environment, energy
consumption, and pollution prevention will be presented. These dynamic energy simulations
should be able to account for the impact of the PDEC applications in terms of energy savings,
environmental benefits, improvements of indoor environment over equivalent air conditioning
systems or other renewable technologies. Mathematical models developed based on
computational analysis will be implemented to EnergyPlus so that results of these dynamic
simulations can demonstrate overall performance of PDEC tower with spray systems.
This dissertation is intended to advance a passive down-draft evaporative cooling (PDEC)
system and to extend their applicability, which is currently limited in a specific climatic
condition such as hot-dry. In this chapter, the review of the needs of low-energy system and
overall scope and methodologies of this study are presented. Chapter 2 describes findings in the
literature review such as the status of these systems as well as their characteristics, and defined
key barriers to be resolved so that they can be used in the cooling of buildings. Chapter 3 reviews
theoretical backgrounds to understand evaporative cooling process and classification of various

6
types of PDEC towers. Chapter 4 presents a computational modeling process such as governing
equations to be solved, description of physical models, and validation against an experimental
data. Chapter 5 describes a parametric study using the computational model developed to
demonstrate critical parameters impacting the performance of these systems and their
significance to the performance. Chapter 6 gives an overview of regression analysis to determine
independent variables among a number of parameters defined in the previous chapter, and to
formulate mathematical models that provide accurate predictions of PDEC air conditions.
Chapter 7 investigates problems with current PDEC systems and their impacts to building
performance, and offers one of the possible solutions that could resolve the problems. Chapter 8
explains that how PDEC systems play a role to achieve low-energy goals in different types of
buildings as well as climates. Finally, chapter 9 gives findings in this study and future study that
would be useful to advance these systems further.

7
List of references
Bom, G. J., Foster, R., Dijkstra, E., and Tummers, M. “Evaporative air-conditioning:
applications for environmentally friendly cooling.” World Bank Technical paper 421, 1999.
Energy Information Administration (EIA). “International energy outlook 2008.” U.S.
Department of Energy, Washington, DC, 2008.
European Commission. “World energy, technology and climate policy outlook.” Belgium, 2003.
Givoni, B. "Performance and applicability of passive and low-energy cooling systems." Energy
and buildings 17.3 (1991):177-199.
Giabaklou, Zahra and Ballinger, John A. “A passive evaporative cooling system by natural
ventilation.” Building and environment 31.6(1996):503-507.
International Energy Agency (IEA). “Key world energy statistics.” Paris, 2008.
Nahar, N. M, Sharma, P., and Purohit, M. M. "Performance of different passive techniques for
cooling of buildings in arid regions." Building and environment 38.1 (2003):109-116.
Renewable Energy Policy Network for the 21st Century (REN21). “Renewables 2007 Global
Status Report.” Paris: REN21 Secretariat and Washington, DC: Worldwatch Institute, 2008.
Santamouris, M. “Passive cooling of building.” Advances of solar energy series 16, American
Society of Solar Energy, 2005.
U.S. Department of Energy. “2009 Buildings Energy Data Book.” D&R International, Ltd.
September 2009.
Watt, John R., and Brown, Will K. “Evaporative air conditioning handbook.” 2nd ed., New
York : Chapman and Hall, 1986.
World Energy Council (WEC). “Energy end-use technologies for the 21st century.” London, UK,
July 2004.

8
CHAPTER 2: LITERATURE REVIEW
A simple type of PDEC (passive downdraught evaporative cooler) technology, wind
towers, has been widely used since ancient Egypt. These components have been advanced in
order to improve the cooling performance of traditional wind towers by installing evaporative
cooling devices such as pads or sprays (Baradhori, 1985; Cunningham and Thompson, 1985.)
Different studies have investigated these advanced types of PDEC technology and shown that
they accomplish better cooling performance and response to the cooling demands in a space than
wind towers. Due to the complexity of the physical processes, studies have focused on field
measurements and computational analysis as there are not any available exact analytical
solutions to solve the complex phenomena involved.
2.1 PDEC Towers with Pad
2.1.1 Applications of PDEC towers with pad
A new design for wind towers, a PDEC tower with pad, has been developed and tested in
order to enhance the performance of conventional wind towers. Cunningham and Thompson’s
test building (1985) in Tucson, Arizona (Figure 2.1) is likely the first modern application of a
PDEC tower with pad while Bahadori (1985) introduced the early concept design of the system
at nearly similar time. The PDEC tower had vertical wetted cellulose pads (CELdek) and a
plywood X-shaped baffle at the top. The results of the field measurements demonstrated that the
air flow rate at the exit was determined by the pad area and thickness but that further analysis
was necessary. This study showed the great potential of these modified wind towers as a cooling
alternative in hot-dry climates. The data, however, was taken under calm wind and hot-dry
conditions which is arguably the best conditions to show the improved cooling performance over
a simple window tower. It also did not include influences of the other important variables such as
water flow rate and tower configuration.
This system has been implemented in actual buildings and simulated to investigate
energy performance of the system during the design stage. Chalfoun (1997) designed two
applications of the PDEC tower with pad system and integrated it into an office building. The

9
thermal performance of both applications were estimated using a thermal simulation program for
modeling a PDEC tower with pad system called CoolT that developed by the University of
Arizona’s Environmental Research Laboratory in Tucson Arizona. One application at the
Botswana Technology Center (BTC) in Gabarone in Southern Africa, classified as semi-desert,
was expected to achieve a 24% reduction in cooling load. The other application at the Ministry
of Municipal and Rural Affairs (MOMRA) in Riyadh, Saudi Arabia, classified as a hot dry area,
was expected to perform better on hot dry days.
It is interesting to note that the early design approach of integrating PDEC towers
included the use of energy simulation for this type of system. The model that was used for these
cases, however, did not account for the overall performance of the system. It has made some
optimistic assumptions such as no wind blowing condition and a wet-bulb depression of 70%,
which is the difference between dry- and wet-bulb temperatures. As a result, the same cooling
performance of PDEC towers was approximated at different water flow rates at the time step,
leading to inaccuracy in the results. In addition, the model was not capable of modeling air mass
flow rate that the tower should treat since it varied with pad area and its resistance. The model
should represent variable conditions of these parameters since they substantially affect the
performance of the system.
In addition, another successful application of this type of PDEC tower has been installed
at Zion National Park’s Visitor Center in Utah. Torcellini et al. (2005) evaluated the passive
cooling strategies of this building such as the PDEC tower with an evaporative pad and natural
ventilation through clerestory windows as shown in Figure 2.2. Dynamic energy building
simulations using a whole building energy simulation software DOE-2 estimated that the PDEC
tower with pad system and natural ventilation achieved 93% of the cooling energy of the base
cooling system during a two year period, and the estimated annual water consumption was
approximately 420,000 liters. This study also indicated that solar shading at the top to prevent
water consumption by solar radiation, relief dampers to control the air flow, and sizing an
appropriate water storage tank to minimize waste of water would improve the performance of the
system. This study made efforts to minimize uncertainty such as calibration of weather data and
real time measurements during the specific period of the study. The actual overall performance

10
of the system, however, is likely to be different since the predictions were based on a specified
air condition at the outlet of the PDEC system due to the lack of relevant mathematical models.
Figure 2.1 ERL’s test house Figure 2.2 Zion National Park’s Visitor Center
(Source: Cook et al., 2000) (Source: Torcellini et al., 2006)
2.1.2 Modeling of PDEC towers with pad
Givoni (1993) developed a semi-empirical model that predicts outlet air conditions such
as temperature, flow rate, and velocity. The author formulated a simple equation, which assumed
a wet bulb depression of 0.87 in the prediction of the air temperature at the exit. This equation
was then expanded to include the effect of wind speed in the prediction of the temperature and
volumetric flow rate of the air leaving the tower. The model was validated against experimental
data for a 48 hour period in the Cunningham & Thompson’s tower described in the previous
section. The data collected was confined to particular conditions such as low mass flow rate,
small tower size, and hot-dry air inlet conditions. This was necessary for the model to include
important variables such as water flow rate, characteristics of the pads, and the physical tower
configuration and predict accurate outlet conditions. The model was also able to predict the
moisture content of the air leaving the tower.

11
Thompson et al. (1994) developed a mathematical model for evaluating the performance
of a PDEC tower with an evaporative pad. This model was based on density differences
throughout the shaft for the system. A summation of the density and wind forces provided a
basic relation for obtaining the air flow rate. The model corrected densities as a function of
incoming air temperature and tower air temperature. It also included a pressure loss through the
evaporative pads by employing pressure loss coefficients given in the literature. With the
inclusion of all these parameters, the study approximated the outlet air conditions such as the
efficiency of the pads, the velocity, and the temperature drop using four different thicknesses for
the pad. This model was employed in a simulation program, CoolT, which is intended to design a
PDEC tower with an evaporative pad. Its applicability, however, was confined to the case where
no wind was present and assumed that the air velocity through the pads was 1/3 of the outdoor
air velocity in the calculation of the density correction. In addition, it was unable to predict the
humidity level of the air leaving the PDEC tower, so water consumption could not be accurately
determined.
2.2 PDEC Towers with Spray
2.2.1 Applications of PDEC tower with spray
Different types of early designs for PDEC towers with spray systems have also been
introduced as an advanced form of wind towers. Bahadori (1985) presented a new design of wind
tower as illustrated in Figure 2.3 in order to improve the cooling capacity of wind towers. This
new design included clay conduits throughout the tower shaft and a water spraying system at the
top of the tower. In addition, the first modern application of a PDEC tower with a spray system
was introduced at EXPO’92 in Seville, Spain as shown in Figure 2.4. It was intended to cool
outdoor rest areas at the site. The height of the spray PDEC towers reached 30 m high, and fine
water droplets up to 14 ㎛ were injected at the top of the tower. The largest temperature drop of
12°C appeared within the first or second meter from the top when the smaller particles were
sprayed, whereas temperature gradually decreased with bigger drops (Rodriguez et al., 1991.)
These applications showed the possibility of the system as a means of low energy cooling, and
were successful in drawing attention to passive cooling strategies. They, however, were

12
inefficient in the cooling of buildings due to a lack of studies that can support advancing the best
cooling performance of this particular system.
Figure 2.3 An early design of PDEC tower with spray (Source: Bahadori, 1985)
Initial studies have focused on field measurements in an attempt to advance the overall
performance of these systems beyond the early system designs. Pearlmutter et al. (1996)
demonstrated the importance of wind catchers and the size of water droplets. The scale model
test illustrated that fine water drops accomplished better cooling performance. The study also
revealed that the type of wind catcher significantly affected cooling performance (up to 35%).
Etzion et al (1997) integrated a large spray PDEC tower, 4m × 4m × 12m, to the top of the
atrium in Blaustein International Center for Desert Studies building located in a desert area near
Beersheba, Israel. A small fan assisted the flow of air at the top of the PDEC tower. The
maximum cooling output was 120kW, and a temperature drop of 14°C were observed. Ford et al.

13
(1998) monitored the performance at the Torrent Research Center in Ahmedabad, India as shown
in Figure 2.5. The PDEC systems achieved temperature drops between 10 and 14°C at the
maximum outdoor air temperatures. Electrical energy savings reached 64% in comparison to an
equivalent mechanically conditioned building. In addition, almost no occupants felt discomfort
in the summer, and overall comfort levels were better than the equivalent air conditioning
building. The authors also noted that improvements are necessary to control inconsistent airflow
rates and overall performance. In summary, these applications have been shown to have
economical environmental benefits and also identified that the main variables such as the type of
wind catcher and the size of water drops have a substantial impact on the cooling performance of
the spray PDEC tower. It was also shown that they are insufficient in the cooling capacity,
inefficient in the use of water, and in need of adequate control algorithms. These studies,
however, were limited to a specific condition such as temperature, tower configuration including
wind catcher, and water flow rate, leading to a lack of a full understanding of the physical
phenomena present in these systems.
Figure 2.4 PDEC towers at Seville EXPO’92 Figure 2.5 Torrenet Research Center
(Source: Website, http://wikipedia.org) (Source: Website, http://archnet.org)
Building applications of spray PDEC towers that have appeared as initial studies have
proven the potential for these systems. The Interactive Learning Center (ILC) at Charles Sturt
University in Australia in 2001 adopted a system as shown in Figure 2.6 (CADDET, 2002.)

14
Webster-Mannison (2005) reported that the performance was poor at the beginning due to the
ineffective design of the wind catcher, so wind deflectors and baffles were installed at the top to
correct these problems. This also provided convective night cooling and treated rainfall was
utilized as a water source. A maximum temperature reduction of 16.42°C was observed at an
ambient air temperature of 42.28°C. This system, however, was unable to meet the cooling
requirements for the space, so it was replaced with another cooling system.
Another example of a spray PDEC system is the Malta Stock Exchange (2001) that
introduced a PDEC tower in conjunction with convective night ventilation to the central atrium
space of this building as shown in Figure 2.7. The system met approximately 25% of the total
cooling loads, and an operating costs reduction and low carbon dioxide emissions were observed.
The Center for Global Ecology in Stanford, California adopted a spray PDEC tower in
2004 as shown in Figure 2.8, which is called a Katabatic Cooling Tower, in order to cool the
lobby area. While no data regarding the performance of the system has been reported, the
website of the center states that the katabatic cooling tower produces temperature drop of 14.4°C
at an outdoor temperature of 29.4°C. Figure 2.9 shows another example of the application is a
PDEC tower incorporated by Prajapati to the Inspector General of Police Complex in Gulbarga,
Karnataka in 2005. Preliminary data indicate that temperature drops during a period of March
through May were 12 to 13°C, and the simple payback period in comparison with an equivalent
air-conditioned building was estimated to be approximately 5 years.
In short, a number of building applications of spray PDEC towers have been
implemented during the early 2000s. The performance, however, as an alternative cooling system
to a mechanical air conditioning system was insufficient even though overall the concept has
improved. No application fully met the cooling demands of the space being conditioned by the
PDEC system, and careful control of the PDEC system was needed to produce better cooling
capacity. It is thus necessary to improve the understanding of the major phenomena within the
tower and to investigate what additional parameters can significantly improve the cooling
performance in detail.

15
Figure 2.6 ILC building in Australia Figure 2.7 Malta stock exchange building
(Source: http://www.architecture.com.au) (Source: http://www.ap.com.mt)
Figure 2.8 A PDEC tower in Stanford Figure 2.9 Inspector General of Police
(Source: web site http://www.aiatopten.org) (Source: JitenPrajapati, 2006)
Recent studies have utilized dynamic simulation in an attempt to evaluate the overall
energy performance of the spray PDEC tower over longer time periods. Robinson et al. (2004)
conducted a dynamic thermal analysis using the whole building energy simulation tool ESP-r.
The ESP-r model included several simplifying assumption including a wet bulb depression of 70%
and a maximum relative humidity of 70%. Annual simulations for conditions of coupled heat and
mass transfer estimated an annual delivered supplementary cooling energy of 508.7 kWh, a total
annual water usage of 5170 liters, and a maximum core zone air change rate of 91.5 ACH. Total

16
energy savings of 50% to 83% were observed depending on the internal heat gains and the set-
point temperatures. Silva (2005) developed a model that predicts the flow rates and the air
temperature as well as the relative humidity, assuming 70% of the wet-bulb depression, which is
the difference between dry- and wet-bulb temperatures. The study showed that the ventilation
rate is independent of the wind speed. Another finding was that these systems are viable in
various regions with low wind speeds. Overall, it did result in low energy consumption and good
thermal comfort levels within the space. Melo and Guedes (2006) performed a thermal analysis
employing Givoni’s mathematical model for the calculation of temperature and air volumetric
flow rate. The annual cost savings and reductions of carbon dioxide emissions were predicted to
be approximately 600€ (over US$800) and 3120kg, respectively. The daily water consumption
was estimated to be between 20 to 40 liters. In summary, these studies have evaluated the energy
performance of spray PDEC towers over a longer time period and shown that PDEC towers are
capable of reducing operational costs and pollutants emission. On the other hand, the studies
have made overly optimistic assumptions regarding the efficiency of the wet bulb depression,
which should vary with outdoor conditions. No studies have properly modeled the conditions of
the air delivered to the space from the towers. They also were unable to determine the relative
humidity of the air, so the impact on energy performance of actual buildings was inaccurate. As
will be seen in this dissertation, more sophisticated mathematical models for PDEC towers are
necessary to provide the accuracy necessary to truly evaluate the performance of these systems.
In addition to the energy performance monitoring, various aspects of the system
regarding indoor environmental quality have also been evaluated using post occupancy
evaluations (POE). Thomas and Baird (2004) conducted a post occupancy evaluation for the
Torrenet Research Center buildings in India. They obtained 164 responses from occupants in
both the PDEC conditioned and conventional mechanically conditioned (AC) buildings.
Generally, occupants in the AC buildings expressed better satisfaction with the indoor thermal
environment than occupants in the PDEC buildings, but all occupants in the PDEC buildings
gave higher satisfaction scores than the average score from another study of 260 buildings from
another study. On the other hand, the comfort level based on temperature and relative humidity
of the PDEC buildings were very close to neutral while the AC buildings left occupants feeling
cold year round and a bit dry in the summer. In addition, Schiano-Phan and Ford (2008)
evaluated the satisfaction of occupants in four different commercial buildings that used PDEC

17
towers. The two buildings that had PDEC towers with pads were the Kenilworth Junior High
School, Petaluma, CA and Zion National Park Visitor Center, UT, and the other two buildings
with spray PDEC towers were the Sandra Day O’Connor Federal Courthouse, Phoenix, AZ and
the Global Ecology Research Center, Stanford, CA. It was observed that the satisfaction of the
occupants in spray PDEC tower equipped buildings was very poor in the last two buildings.
Conversely, the occupants in the other PDEC tower with pad buildings reported very good levels
of comfort. The authors thus concluded that the successful implementation of PDEC towers
depended on various aspects such as the overall building strategy, the robustness of control
system, the occupants’ awareness of the building strategy, and on-site maintenance. In brief,
these POE studies proved that these systems help to improve the indoor environmental quality. It
was also shown that the implementation of these PDEC towers required a careful design of the
building systems and ventilation due to the dependency of the surrounding environment. PDEC
towers should thus be integrated as a secondary cooling system and considered as a potential
source of significant energy savings and real improvement in the built environment.
Some efforts have been made to advance the performance of the spray PDEC towers.
Bahadori et al. (2002, 2008) compared three different passive cooling designs including a wind
tower, a PDEC with pad, and a spray PDEC that includes plastic curtains throughout the vertical
tower. The temperature drops at the peak outside temperature of 37.2°C were 16°C in the wind
tower with spray, 13.1°C in the wind tower with pad, and 3.7°C in the wind tower. The air flow
rates measured were 1.1m3/s in the spray system, 0.78m
3/s in the pad system, and 1.25m
3/s in the
wind tower. The overall performance of the new tower designs that included evaporative devices
was much better than the conventional wind tower, and the spray PDEC tower with plastic
curtain performed best. In addition, Pearlmutter et al. (2008) developed and tested a multi-stage
spray PDEC tower that has a secondary air inlet in the middle of the shaft as an improvement
over the typical spray PDEC tower application. This study performed a wind tunnel experiment,
scale model tests, and airflow analysis using FLUENT. The airflow through the secondary inlet
in both the scale model experiment and the full-scale experiment was predicted to be
approximately 40% of the total airflow rate. The exiting airflow rate with the aid of a fan was
approximately 5.5m3/s, and the spraying water operation increased the airflow rates up to 8.5m
3/s.
They, however, were reduced to 4.5m3/s without the aid of the fan and to 2 to 2.5m
3/s when no
water was used (no evaporative cooling). The authors thus concluded that the water sprayers

18
amplified the air volumetric flow up to 50%. In summary, spray PDEC tower system has become
the prevalent system design option because it produces better cooling output than the other types
of PDEC systems. These studies, however, were unable to accomplish considerable enhancement
in the performance of the spray PDEC tower system. Developing a different type of PDEC tower
might not be adequate given the current status of this technology as a fuller understanding of the
performance of these devices is needed. It is thus necessary that efforts be made to optimizing
the performance by first gaining this understanding using more comprehensive analysis of these
devices.
2.2.2 Modeling of spray PDEC towers
Due to the complexity of the physical phenomena involved, only a few analytic models
have been developed. Bahadori (1985) provided the theoretical analysis to investigate the
performance of PDEC systems against conventional wind towers. The fluid flow through the
systems was analyzed using a pressure-based iterative calculation at a number of vertical nodes
along the tower height, assuming constant air density. The author then employed generic
equations regarding the convective heat transfer coefficients for the case of a fluid flowing in a
tube, as well as the total heat transfer rates. The author defines the mass transfer at each specified
node along the tower height using the Lewis relation for the mass transfer coefficient and a mass
balance equation, assuming an effectiveness of evaporation of 60%. With this analytical model,
the performance of the evaporative based designs was analyzed. This study, however, made
assumptions such as constant density through the tower and a wet bulb depression of 60% rather
than solve for the variation of these parameters. The conditions, therefore, of the air at the exit
including such parameters as temperature, relative humidity, and velocity were inaccurate.
Different studies have formulated empirical models based on the performance
measurements of the earlier studies. Givoni (1994) developed the only mathematical model for a
spray PDEC tower, which included the effects of water flow rates. In fact, almost all the other
mathematical models include only a wet bulb depression for the prediction of temperature. In
this study, the air temperature leaving the tower was expressed as a function of the outdoor dry-
bulb temperature, the outdoor wet-bulb temperature, the effective tower height, and the water

19
flow rate injected into the tower. The author also formulated equations for modeling volumetric
air flow rate and the air velocity at the exit. The considerable contribution of this model is
determining the effect of the water flow rate on the temperature and the flow rate of the air
exiting the system. Kang and Strand (2009) implemented this model in a whole building energy
simulation program, EnergyPlus, so that overall cooling performance of the spray PDEC tower
can be determined. The highlight of this study was that it used psychrometric relationships to
determine the humidity level of the exit air by assuming an ideal direct evaporation process. It
was also capable of modeling the performance when the water flow rate was unknown. This
study showed that the effective use of water was one of the key factors in that water flow rate has
a strong influence on the cooling performance of spray PDEC tower systems. While careful
design process is required, this system could be extended to be useful in climates other than hot-
dry areas since its sustainable features were viable in almost all climates.
In summary, Givoni’s model was considerable as it was able to account for the impact of
the water flow rate. Some limitations, however, were observed in this model. The equations were
formulated from data measured for 4 days in October at a particular condition such as low height
of the tower (from 1m to 3m) and high water flow rates (up to 14.4 l/min). The model was also
unable to accurately predict the moisture content of the air and needed to include other important
parameters such as droplet size and air mass flow rate. Due to these limitations, the predictions
of the Givoni model and thus the EnergyPlus model that was based in part on Givoni’s work
could also be inaccurate. Consequently, a sophisticated mathematical model that is able to
accurately assess all the benefits of the system under various conditions is necessary.
Computational modeling has become popular since it is possible to vary the conditions of
the air and water as well as physical tower configuration. Bowman et al. (1997) investigated the
applicability of PDEC technology in Europe and provided some design guidance. This study
described the physical modeling techniques for predicting building performance with spray
PDEC tower systems. The authors then developed a simple numerical model that was validated
against a CFD model. This model, however, assumed a fully developed flow, so that only half of
the effective tower area was included. The computational domain should include at least whole
area of the tower since the turbulent fluid flow through the wind catcher is unlikely fully
developed within the domain. In addition, the model treated the water injected as a volume

20
fraction. In fact, this method is typically used in high-mass flow where the physical amount of
the smaller mass fluid is greater than 10% in almost all computational analyses.
In addition, Cook et al. (2000) presented a study performing computational modeling of
the air flow in a hypothetical office building with spray PDEC towers. A commercial CFD code
CFX was utilized. The continuous phase of the air flow was modeled by conservation equations
in mass, momentum, enthalpy and water vapor. The standard k-ε model was chosen for turbulent
flows. The dispersed phase of the water was modeled using Lagrangian particle tracking so that
each particle’s trajectories can be determined by calculating the mass, momentum, and heat
transfer from the particle to the continuous phase. This study presented a computational
technique for modeling the down-draft evaporative cooling process. The model can be used in a
computational analysis using a CFD code in that the solutions of both phases and their coupling
were adequately treated. The validation of the computational model, however, was not given.
Conditions of the air leaving the PDEC system must be validated to provide some assurance that
the method proposed is accurate.
In addition, Elmualim (2006) utilized the commercial code CFX to evaluate the
performance of wind catcher. The CFX model estimated pressure coefficients as well as air flow
around wind catcher. Pressure coefficients predicted by this computational model were then
validated against data obtained from a wind tunnel test. Air flow rates were also predicted using
simple explicit and implicit calculations. The characteristics of air flow around catcher with the
variation of the wind direction were investigated. It was seen that the performance of wind
catcher was strongly dependent on the direction and speed of the wind. This study presented
appropriate processes for modeling validation and computational technique. The conditions,
however, between the computational domain and wind tunnel test were expected to be different.
The airflow passed through the square straight duct considered to be the wind catcher. The
airflow in an actual tower is typically induced in a perpendicular direction as a result of the wind
catchers, so that the wind pressure at the opening may vary with wind direction. The inclusion of
different types of wind catcher would also be necessary to investigate the impacts of wind
direction and speed on the capturing efficiency of the air.
While numerous studies have published numerical models for evaporative cooling, few
attempts have been made to model the down-draft evaporative cooling process. Belarbi et al.

21
(2006) proposed a cellular approach for estimating evaporation time and thus sizing spraying
system in PDEC towers. Figure 2.10 illustrates a diagram of the calculation process of this
approach. This approach assumed that the water spray was formed by bubbles in multiple layers,
and considered the spray as a pile of rigid spheres. The evaporation then occurred from the
outermost half sphere toward to innermost layers as shown in Figure 2.10. The model indicated
that the evaporation time was not a function of droplet size when the distance between droplets
was over 600 ㎛. The authors thus concluded that an appropriate model was necessary when the
distance was less than 600 ㎛. This approach, however, required an input specifying the bubble
size enclosing the water drops despite the fact that an accurate definition of the bubble size is
extremely difficult to determine. It also included vapor concentrations of the air within the
bubble without consideration of its interaction with the majority of the air mass outside the
bubble. This approach could be used for quasi-steady evaporation if all the inputs are clearly
identified though the computational domain should include unsteady particle evaporation.
Another limitation of the model was that the results were likely different when different droplet
sizes were applied. The model, therefore, is not generic enough to estimate the performance of
PDEC towers under other conditions.
Figure 2.10 Schematic of cellular approach (Source: Belarbi et al., 2006)

22
2.3 Summary
This chapter describes a brief summary of studies involving PDEC technology. The
status of PDEC technology and its applications integrated into buildings have been reviewed in
the literature. Different studies have contributed to advancing the science of PDEC towers while,
in general, the applicability of a PDEC tower as a cooling application in buildings has been
proven. The main parameters affecting the thermal performance of this application were also
identified. A number of models that can predict the performance of PDEC systems have been
developed. Previous studies on PDEC technology, however, do not fully support further
improvements of this technology as a cooling application to buildings. A thorough analysis of
this technology in various aspects is thus necessary to comprehensively understand the physical
phenomena of the down-draft evaporative cooling processes and to detail the potential
environmental benefits from a PDEC tower. The problems and lessons have been defined in the
literature and are summarized below.
The cooling capacity of PDEC towers is insufficient to meet all of the cooling needs of
many buildings and difficult to control. Careful design of these systems is critical since the
conditions of the air from PDEC towers vary with a number of parameters. None of these studies,
however, provides an extensive analysis of the correlation between these main parameters and
the performance though studies have identified what parameters have an influence on the
performance. This gap leads to difficulty in appropriately designing PDEC towers. As a result,
only a few building applications have successfully applied this technology. This is because the
influence of the critical variables such as droplet size, tower configuration, and incoming air flow
rate has not been properly treated in the previous studies. In addition, attempts at developing
different types of PDEC technology have not been successful. Detailed analysis of the physical
phenomena and the performance are thus important because it will help identify additional
problems and solutions to the performance control issues.
Efficient use of water is critical to successful implementation of the PDEC systems. A
tendency that appears in the literature is that these systems use a large amount of water with no
careful consideration of saturation of the air as well as loss of the water. This tendency could also
cause microbiological contamination. The demand for a large amount of water could also
significantly confine the consideration of the system in areas of water scarcity. In fact, the

23
influence of water flow rate has been investigated in the literature. These studies, however, have
been performed under very specific conditions of the other main parameters, so that the general
adaption of those results to the beyond the conditions studied is inappropriate. It is thus
important to understand how water flow rate affects the performance under a variety of
conditions. Efforts should thus be made to identify a correlation between water flow rate and
different droplet sizes, tower dimensions, and air conditions, so that problems such as excess use
of water and possibilities of microbiological contamination can be minimized.
Spray PDEC towers have more potential than the other types of PDEC technology. The
traditional wind tower has been improved by adding evaporative devices at the very top of it. As
a result, significant improvements in the cooling performance of advanced types of wind towers
have been accomplished. The majority of PDEC studies and building applications are on spray
PDEC towers since they produce better cooling output and respond faster than the other systems.
Many efforts have thus been made to integrate this particular system into buildings while few
attempts have been made to integrate the other types. In fact, the PDEC tower with pad has two
different possibilities to control the performance: water flow rate and thickness of the pad.
Thicker pads, however, increase the resistance against the incoming air, causing lower cooling
outputs. On the other hand, spray PDEC towers are more responsive to the variable ambient
conditions by adjusting air flow rate, water flow rate, and also possibly droplet sizes. Priority
thus needs to be given to spray PDEC towers in that it is able to produce constant cooling
capacity when the performance is optimized.
There currently is no existing mathematical model that accurately predicts the conditions
of the air at the outlet of PDEC systems. Almost all the mathematical models are only capable of
predicting temperature, relying on the wet bulb depression while only Givoni’s model includes
main parameters such as water flow rate, ambient wind speed, and the height of a tower. These
models, however, are unable to deal with the other important variables such as the air mass flow
rate and the humidity level of leaving air. In addition, a sophisticated dynamic simulation model
is needed so that the impact of spray PDEC towers can be analyzed under various circumstances.
Various aspects of this particular system such as improving indoor environmental quality and
energy performance should also be analyzed. It is thus critical for the model to include the
effects of water droplets and the ratio between tower area and air flow rate, which allows

24
accurate predictions for temperature, humidity, and air flow rates, as well as the control of the
performance of the system.
Computational domains should include the entire area of the PDEC towers from the
spraying system at the top to the bottom opening. Almost all studies shown in the literature do
not account for turbulent flows due to the presence of wind catcher as well as wall-bounded
turbulent flows, assuming fully developed flows throughout the entire computational domains.
Air flow of the incoming air as a result of the wind catcher dominates the overall air flow profile
within the tower. Due to turbulent characteristics of the air across the wind catcher, fluid flow
through the tower is unlikely fully developed within the range of typical tower heights. No study
presents the air flow characteristics in the tower though it is difficult to include all possibilities
due to the presence of different types of wind catchers and outlets. The fluid flows in PDEC
towers within the domain are to be reviewed as a solution of performance improvement and
control.
Advancement of the modeling of these systems is critical since PDEC applications have
been limited to hot arid climates, are difficult to control, and have been found to have insufficient
cooling capacity. This study is thus to develop this application as a relevant cooling system in
buildings, expand its usage in building, and thus reduce the environmental cost of cooling
buildings. To achieve these goals, this study will perform a computational process modeling that
helps understand the fundamental physics of the down-draft evaporative cooling processes and
examine the relationships between various parameters and the performance, which will allow the
significant improvement of the performance of these systems and provide appropriate control
strategies. Once the correlations are identified, a mathematical model that includes the influence
of the main parameters affecting the performance will be developed. This developed model will
be able to determine the accurate conditions of the air at the outlet of the spray PDEC tower so
that it can be used in the decision-making process during the design stage and implemented into
a whole building simulation software. In this study, the model will be added to the whole
building energy simulation software EnergyPlus so that the actual impact of the PDEC systems
from both economic and environmental aspects as well as its applicability to different climates
can be analyzed. This study will therefore improve the applicability of the PDEC systems in

25
various climates and allow the evaluation of the overall effects from these systems on building
energy consumption and environmental impact.

26
List of References
Al-musaed A. “Evaporative cooling process adaptive for Baghdad city climate.” Proceedings of
the 28th AIVC Conference (2007):35-39.
Bahadori, M. N. "An improved design of wind towers for natural ventilation and passive
cooling." Solar energy 35.2 (1985):119-129.
Bahadori, M. N. "Performance evaluation of new designs of wind towers." American Society of
Mechanical Engineers, Fluids Engineering Division (Publication) FED 257.2 (2002):1015-1022.
Bahadori, M. N., M. Mazidi, and A.R. Dehghani. "Experimental investigation of new designs of
wind towers." Renewable energy 33.10 (2008):2273-2281.
Belarbi, Rafik, Ghiaus, Cristian, and Allard Francis. “Modeling of water spray evaporation:
Application to passive cooling of buildings.” Solar Energy 80 (2006):1540-1552.
Bowman, N. "Application of Passive Downdraught Evaporative Cooling (PDEC) to non-
domestic buildings." Ren-ewable energy 10.2 (1997):191-196.
Cook, M. J., Robinson, D., Lomas, K. J., Bowman, N. T., and Eppel. H. "Passive Downdraught
Evaporative Cooling: II. Airflow Modelling." Indoor + built environment 9.6 (2000):325-334.
Chalfoun, Nader V. “Design and application of natural down-draft evaporative cooling devices.”
Proceedings of the 26th
American Solar Energy Society, 1997.
Elmualim, Abbas A. "Dynamic modeling of a wind catcher/tower turret for natural ventilation."
Building Services Engineering Research and Technology 27.3 (2006):165-182.
Erell, E., Pearlmutter, D., and Etzion, Y. "A multi-stage down-draft evaporative cool tower for
semi-enclosed spaces: Aerodynamic performance." Solar energy 82.5 (2008):420-429.
Etzion, Y., Pearlmutter, D., Erell, E., and Meir, I. A. "Adaptive architecture: Integrating low-
energy technologies for climate control in the desert." Automation in construction 6.5
(1997):417-425.
Ford, Brian., Patel, N., Zaveri, P. and Hewitt, M. "Cooling without air conditioning." Renewable
energy 15.1 (1998):177-182.
Givoni, B. "Performance and applicability of passive and low-energy cooling systems." Energy
and buildings 17.3 (1991):177-199.
Givoni, B. "Semiempirical model of a building with a passive evaporative cool tower." Solar
Energy 50.5 (1993):425-434.
Givoni, B. “Passive and low energy cooling of buildings.” Van Nostrand Reinhold, New York,
USA, 1994.
Givoni, B. “Performance of the Shower Cooling Tower in Different Climates.” Renewable
Energy, 10, 2/3 (1997):173-178.
Kang, Daeho, Strand, Richard K. “Simulation of passive down-draught evaporative cooling
(PDEC) systems in EnergyPlus.” Conference Proceedings of Building Simulation 2009, Glasgow,
Scotland, 2009.

27
Malta Stock Exchange. “Passive downdraught evaporative cooling (PDEC) applied to the central
atrium space within the new stock exchange in Malta.” WSP Environmental Ltd, United
Kingdom, 2001.
Melo, C. and Manuel Correia Guedes. “Passive downdraught evaporative cooling applied on
existing fabric: using traditional chimney and new dwelling as case study in Portugal.” PLEA
2006 – 23th Conference on Passive and Low Energy Architecture, September 6-8, Geneva,
Switzerland, 2006.
Pearlmutter, D., Erell, E., Etzion, Y., Meir, I. A., and Di, H. "Refining the use of evaporation in
an experimental down-draft cool tower." Energy and buildings 23.3 (1996):191-197.
Pearlmutter, D., Erell, Etzion, Yair., and Erell, Evyatar. “A multi-stage down-dfaft evaporative
cool tower for semi-enclosed spaces. Part Ⅱ: Water spraying system.” PLEA 2006 – 23th
Conference on Passive and Low Energy Architecture, September 6-8, Geneva, Switzerland, 2006.
Pearlmutter, David., Erell, Evyatar, and Etzion, Yair. "A multi-stage down-draft evaporative cool
tower for semi-enclosed spaces: Experiments with a water spraying system." Solar energy 82.5
(2008):430-440.
Prajapati J.. “Design of passive downdraft evaporative cooling towers for proposed I.G.P.
Complex at Gulbarga - Architects and Designers, Monarch.” Draft report, 2005.
Robinson, D., Lomas, K. J., Cook, M. J., and Eppel, H. "Passive down-draught evaporative
cooling: Thermal modelling of an office building." Indoor + built environment 13.3 (2004):205-
221.
Schiano-Phan, Rosa and Ford, Brian. “Post occupancy evaluation of non-domestic buildings
using downdraught cooling: case studies in the US.” PLEA 2008 – 25th Conference on Passive
and Low Energy Architecture, October 22-24, Dublin, 2008.
Silva, Correia. “Passive downdraught evaporative cooling applied to an auditorium.”
International Conference “Passive and Low Energy Cooling for the Built Environment, May
2005, Santorini, Greece, (2005): 555-560.
Webster-Mannison, Marci. “Cooling rural Australia: Passive downdraught evaporative cooling,
Dubbo campus, Charles Sturt University.” The official journal of AIRAH (2003): 22-26.
Torcellini, P., Long, N., Pless, S., and Judkoff, R. “Evaluation of the Low-Energy Design and
Energy Performance of the Zion National Park Visitors Center.” Technical Report, NREL/TP-
550-34607, 2005.

28
CHAPTER 3: THEORETICAL BACKGROUND
3.1 Evaporative Cooling
According to the Evaporative Air Conditioning Handbook (Watt and Brown, 1997),
simultaneous heat and mass transfer occurs between substances when the temperatures and vapor
pressures are different in direct evaporative cooling. In the case of mixtures of air and water,
which is the most common evaporative cooling process, these phenomena occur when the
gaseous phase of water, i.e., water vapor, and non-saturated air come in contact with each other
at a thermally isolated boundary. Heat is transferred from the warmer to the cooler substance.
Mass is transferred from the higher to the lower water vapor pressure by evaporation near the
water surface, mixing the water vapor into the air. The temperatures and vapor pressures reach
equilibrium since heat equalizes the temperatures, and evaporation increases or decreases the
vapor pressures in each substance. These phenomena, simultaneous heat and mass transfer, take
place until temperatures and vapor pressures are equalized. The cooling efficiency of direct
evaporative cooling components thus becomes 100% when the air is saturated at the equilibrium
temperature in the adiabatic cooling processes.
Both sensible and latent heat transfer is involved in a direct evaporative cooling process.
Sensible heat affects only the temperature while latent heat only affects the moisture level of the
mixture. In the case of a mixture of air and water, sensible heat flow raises or lowers the
temperatures of both, and latent heat transfers water vapor into the air by evaporation, so that
both the temperature and moisture content of the air-water mixture are altered. If no external heat
is involved in the processes, the sensible heat of the air is delivered to the water and the amount
of sensible heat becomes latent heat by evaporating the water. This net heat conversion from
sensible heat to latent heat is adiabatic saturation, and it governs almost all direct evaporative air
cooling processes.
The water, however, gains some external sensible heat while being re-circulated or mixed
with makeup water which is typically at a different temperature than the air. Adiabatic saturation
is thus only a close approximation of most direct evaporative cooling cases. The ideal direct
evaporative cooling process takes place when the water temperature and the wet bulb
temperature of the air are both the same, and no heat addition or loss occurs during the process.

29
The air temperature in the ideal direct evaporative cooling thus varies along a line of constant
enthalpy on the psychrometric chart, while the most typical direct evaporative cooling processes
follow the dashed line, where the temperature of the mixture is slightly higher than that
experienced in an ideal adiabatic cooling process as shown in Figure 3.1.
Figure 3.1 Enthalpy variation of the evaporative cooling
Evaporative cooling can be generally divided into two different types: direct and indirect.
Direct evaporative cooling is a simple, established, and popular cooling technology. In this type
of evaporative cooling, both fluids are in direct contact with each other during the evaporative
cooling processes. The water evaporates and humidifies the air, causing a decrease in
temperature and an increase in humidity. The wet bulb temperature of the air is the lowest
possible temperature of the air leaving the evaporative cooling system. It is thus suitable in hot
dry climates due to the large differences between the dry- and wet-bulb temperatures.
Applications of this type of cooling system include evaporative coolers, air washers, and
humidifiers.
Indirect evaporative cooling is not as extensively used as direct evaporative cooling. It
requires an additional heat exchanger to prevent the addition of humidity to the air stream that is
being conditioned. An indirect evaporative cooler uses evaporation in a secondary stream (either

30
outside or return air) and then exchanges heat between the primary and secondary air stream to
achieve cooling without moisture addition to the primary air stream. In addition, it can cool the
air below the wet-bulb temperature as it alters the wet-bulb temperature along a line of constant
humidity ratio on the Psychrometric Chart. The applications of indirect evaporative cooling
include water ponds, and roof spray cooling systems. It can be an alternative to direct
evaporative cooling in hot, humid climates.
3.2 Overview of PDEC System
Passive down draft evaporative cooling (PDEC) is a representative term that is defined as
a passive and low energy technique for cooling and ventilating spaces in hot, dry climates
(Bowman et al., 1998), and it is often described as a reverse thermal chimney (Thompson et al.,
1994) as the air flows downward through chimney rather than upward as in a thermal chimney.
They are designed to capture the wind at the top of a tower and cool the outside air using water
evaporation before delivering it to a space. The air flow in these systems is natural as the
evaporation process increases the density of the air causing it to fall through the tower and into
the space without the aid of a fan. The principle of PDEC is water evaporation for cooling
ambient air, gravity difference for establishing air flow, and momentum transfer from water
drops and air (Bowman et al., 1998; Pearlmutter et al., 2008). The main physical phenomenon is
thus simultaneous heat and mass transfer.
No specialized terminology on this PDEC technology is currently available. The term
“PDEC tower” is a representative term that accounts for this particular type of components. The
applications of this technology can be variously named according to their structure, evaporative
devices and geographical locations: passive and hybrid downdraft cooling (PHDC) systems,
natural draft cooling towers (Cunningham and Thompson, 1986), shower cooling tower (Carew
and Joubert, 2006; Givoni, 1994; Mannison, 2003), down-draft evaporative cool tower (DECT;
Pearlmutter et al. 1996), and cool tower or natural draft evaporative cooler (Chalfoun, 1997;
Givoni, 1993; Thomson et al., 1994.)
Applications incorporating PDEC technology can be categorized into three different
types according to evaporative devices: wind tower, a PDEC tower with pad, and a PDEC tower
31
with spray. The cooling performance of these applications is dependent on various factors such
as climatic conditions, tower configuration such as the height and cross-sectional area, volume of
the water and air, and types of evaporative devices. Physical tower configurations of these
systems are similar to each other. However, the cooling capacities of these systems are different,
and PDEC towers with evaporative devices are known to be better than conventional wind tower.
PDEC towers are thus classified into these three different types in that the cooling capacity and
system response to cooling demand substantially change due to the presence of evaporative
devices and their types such as wetted pads and sprays.
3.2.1 Wind tower
Bahadori (1978) defines wind towers or wind catchers as tall structures employed for
natural ventilation and passive cooling of buildings. Wind towers are used as a means of comfort
cooling especially in hot, arid regions (Ghammaghami and Mahmoudi, 2005; Givoni, 1994;
Santamouris, 2005.) The first known instance of wind towers was found back in the fourth
millennium BC (Ghaemmaghami and Mahmoudi, 2005.) The wind tower originated in ancient
Egypt and as early as 1300 BC (Wind Towers, 1999) spread eastwards through the Middle East
to northern India as well as westwards across northern Africa to southern Spain (Ford, 2002). It
is named Malqaf in Egypt, Badinge in Syria, Baud-Geer or badgir in Iran, dessert coolers in
India, wind scoops in Pakistan, and wind catcher in Saudi Arabia and the Gulf States (A’zami,
2005; Badran, 2003; Bahadori, 1994; Bom et al., 1999; Ford, 2002; Ghammaghami and
Mahmoudi, 2005; Wind Towers, 1999.)
A wind tower is the simplest form of PDEC technology without evaporative devices and
typically consists of a shaft in the form of quadrilateral and polygons, a wind catcher at the top of
the shaft, a vertical baffle wall in the middle of shaft, and an opening at the bottom as shown in
Figure 3.2. Previous studies show that the shape of cross-sectional area is mostly square (four-
sided towers), whereas one- or two-sided towers, which with one or two openings at the top, are
rectangular, or a few are hexahedral or octagonal in shape, six-sided or eight-sided towers
(A’zami, 2005; Ghammaghami and Mahmoudi, 2005.) In addition, the survey conducted by Roaf
(1988) shows that wind towers are less than 3 meters tall in over 60% of cases, and only 15% of

32
the total exceeds a height of 5 meters while some towers are higher than 20 meters (Bahadori,
1994; Ghammaghami and Mahmoudi, 2005.)
Wind towers can be classified into two types (Mazidi et al., 2006; A’zami, 2005). One is
the type utilizing pressure differences without additional air passages at the opposite side. A
positive pressure is formed at the side of the wind direction while the other side is at negative
pressure as shown in Figure 3.3a. Wind catching and suction of the air from the inside of the
space occurs at the same time in this type of wind towers. The other type forms airflows based
on density differences due to temperature drops. Airflows in this type of wind tower are different
from the first type and depend on temperature differences between the space and the surrounding
air as shown in Figure 3.3b. Air moves down from the wind-directional side while the other side
is heated by the sun thus pulling inside air up.
The potential advantage of wind towers is that it is a fully passive system with no energy
requirements for operation (Bahadori, 1994). It is also comfortable, multi-functional, and
economical, maintaining almost constant temperatures of the air (A’zami, 2005; Bahadori, 1994;
Mazidi et al., 2006.) On the other hand, shortcomings identified by Bahadori (1978) are as
follows: (1) possibility of introduction of pollutants or insects, (2) possibility of airflow loss
through the other openings in a tower with more than two openings, (3) insufficient cooling
capacity, (4) need of evaporative devices, and (5) dependency on the weather.
Many traditional wind towers introduced evaporative cooling strategies. Wetted materials
such as mats or thorns are sometimes placed at the exit of a tower for an additional cooling effect
though occupants must supply the water to these materials (Mahmoudi et al., 2005.) Air also
moves through foundations and earth coupled tubes in order to achieve larger temperature drops
and humidity for comfort cooling than those wind towers on the ground can achieve (Bahadori,
1994; Mazidi et al., 2006.) Ancient Egyptian, Persian, and Middle Eastern wind towers
sometimes extended the air passages to foundations or earth coupled pipes to drop the
temperature of the air before it was delivered to the spaces as shown in Figure 3.4 (Badran 2003;
Bahadori, 1994; Mahmoudi et al., 2005; Yaghoubi et al., 1991.)

33
Figure 3.2 Examples of wind tower in the Middle East
(Source: Wikipedia, web site http://en.wikipedia.org)
a) Air movements in the first type b) Different air movements in the second type
Figure 3.3 Types of wind towers (Source: A’zami, 2005)
Figure 3.4 Examples of active use of evaporative cooling of ancient wind towers
(Source: Yaghoubi et al., 1991)

34
Modern applications of wind towers are typically used as a means of heat dissipation
using natural ventilation in moderate climates. To date, many studies have reported insufficient
cooling capacity (Santamouris, 2005; Yaghoubi et al., 1991) of wind towers without evaporative
cooling devices. As a result, they have not been extensively considered as a design solution in
the cooling of buildings. Many studies, however, have also proven that they are effective in
promoting air circulation in naturally ventilated buildings, improving indoor environmental
quality, providing night ventilation (Santamouris, 2005; Yaghoubi et al., 1991), and substantially
decreasing the cooling demand. The applicability of these components is thus feasible in
moderate areas where natural ventilation is one of major means of cooling such as in the United
Kingdom.
3.2.2 PDEC tower with evaporative devices
Passive down draft evaporative cooling (PDEC) systems, which have a certain type of
evaporative devices such as porous medium and spray, have been developed and integrated with
buildings in an attempt to improve the cooling capacity of wind towers. These components are a
modified form of wind towers. Overall, PDEC systems are almost the same as traditional wind
towers. PDEC towers include an additional evaporative device to accomplish as large of a
temperature drop as possible. They typically consist of an evaporative device such as wetted
pads or sprays at the top, a shaft, a wind catcher, openings at the bottom, and a water tank or
reservoir as shown in Figure 3.5. While the height is an important parameter in cooling power
from PDEC systems, most designs tend to achieve most of the temperature drop at the top of the
tower (Pearlmutter et al., 1996) due to direct contact between the air and water at the very top.
Water is typically transported to the evaporative device by a pump which is the only component
that consumes power in these systems. Water flow rate and the size of the water droplets plays a
key role in the cooling output of these components, and finer water droplets have been reported
to achieve better performance (Cook et al., 2000; Pearlmutter et al., 1996; Santamouris, 2005.)

35
Figure 3.5 Typical configuration of PDEC tower with evaporative devices
Significant energy savings is the main benefit of these applications (Givoni, 1994; Lomas,
1999; Cook et al., 2000; Ford, 2002; Santamouris, 2005; Melo et al., 2006). The introduction of
outside air and the movement of this air within the space greatly improve thermal comfort and
quality of the air in a space (Bowman et al., 2000; Ford, 2002; Givoni, 1994; Melo et al., 2006;
Santamouris, 2005). In addition, night ventilation through PDEC towers is feasible, which leads
to reduced cooling demand and operating time of the primary cooling systems the following day
(Bowman et al., 2000). The air is also cleaned by the water used for the evaporative cooling
process (Etzion et al., 1997). Another important advantage is that these systems are able to
accomplish greater cooling outputs during afternoon hours that indicate the highest cooling
requirements of the day during cooling period since the web-bulb depression increase thus
potential cooling outputs ambient temperatures increased rather than the other occupied hours,
leading to significant reduction of peak electricity demand. They are also applicable in regions
without wind, creating airflow by density difference and momentum transfer from water drops to
the air (Bowman et al., 2000; Pearlmutter et al., 2006). In addition, these towers can be
incorporated in new or existing buildings with simple construction elements at a relatively low
cost (Santamouis, 2005; Melo and Guedes, 2006.)

36
Climatic dependency is the main disadvantages of PDEC towers with evaporative devices
(Bowman et al., 2000; Givoni, 1997; Santamouris, 2005) as it is for many other sustainable
building systems. The insufficient cooling capacity of the PDEC systems under certain ambient
conditions requires the need for a conventional cooling system (Bowman et al., 2000;
Santamouris, 2005). Another deficiency is the lack of studies and models, which allow a more
extensive understanding of physical processes involved in PDEC systems and better control of
the performance of these systems (Bowman et al., 2000; Lomas et al., 2004.) Studies also noted
that the hardness of the water and microbiological contamination could also be a problem (Al-
musaed, 2007; Ford, 2002). Noise from the top and water consumption are also a problem in
areas with high wind speeds, and the potential for a large volume of water consumption is
another main drawback (Ford, 2002; Givoni, 1997; Santamouris, 2005). In a PDEC tower with
pad, a high pressure drop and a short life span of the pads were other potential weaknesses
(Thompson et al., 1994). Additional issues include: the requirement of a shading device to avoid
water loss by solar radiation and the inability to position the pads ideally to capture all prevailing
wind directions.
3.3 Simultaneous Heat and Mass Transfer
Heat and mass transfer occur simultaneous in many situations such as evaporative
cooling, combustion of fuel, and natural convection flow. These applications are characterized
by low mass flow rate theory, where the mass fraction of the evaporating fluid’s vapor is
relatively small. The analysis of the performance of these physical processes should thus include
simultaneous heat and mass transfer processes. The major physical phenomenon of the
evaporative cooling process in PDEC towers is simultaneous heat and mass transfer. In general,
the solutions are fully coupled in that both fluids affect each other, altering thermal properties of
the fluids. That is, the governing equations must be solved simultaneously. Situations that
involve evaporative cooling processes need to be numerically solved in that the exact solution for
the cooling processes of evaporative cooling is not available in the literature due to the
complexity the physical phenomenon.

37
Various solutions involving the evaporation process of a water droplet have been
extensively developed. There have been a number of applications that utilize evaporation in
many fields. Due to the complexity of the physical processes, major efforts have been made to
develop numerical solutions. Computational modeling has also become a trend in solving this
process. Analytical solutions are only available for the evaporation of a single water droplet, but
these solutions do provide a source of understanding of the physical processes of water
evaporation.
3.3.1 Evaporation of a water droplet
The steady-flow surface energy balances in the process of simultaneous heat and mass
transfer within the control volume in Figure 3.6 can be written as
Qhm (3.1)
)()( ,1,1 radconvcondus qqqAhhm
(3.2)
where [kg/s] is the mass flow rate of water vapor, h [J/kg] is the specific enthalpy, [W] is
the rate of heat transfer, h1,s [J/kg] is the specific enthalpy of species 1 at the surface s , h1,u [J/kg]
is the specific enthalpy of species 1 at the surface u, A [m2] is the area of the surface, qcond [w/m
2]
is the conductive heat flux, qconv [w/m2] is the convective heat flux, and qrad [w/m
2] is the radiant
heat flux. Substituting Fourier’s law for conduction for qcond [W], and the enthalpy of
vaporization for the vapor, hfg [J/kg], in equation 3.2 and rearranging gives:
radfgesmesc
u
qhmmgTThy
Tk
)()( ,1,11 (3.3)
where k [W/mK] is the thermal conductivity, T [K] is the temperature, y [m] is the rectangular
coordinate, hc [W/m2K] is the convective heat transfer coefficient, gm1 [kg/m
2s] is the mass
m Q

38
transfer conductance of species 1, m1,s is the mass fraction of species 1, and m1,e is the mass
fraction of free stream air. While the calculations of m1,e and m1,s varies with the situation, in the
purely diffusive situation, m1,e it can be expressed as:
)1( .1.1
.1,1
ee
ee
xMa
Mwx
xm
(3.4)
where x1,e [%] is the vapor quality of the free stream flow, Ma [kg/kmol] is the molecular weight
of air, and Mw [kg/kmol] is the molecular weight of water. As for the calculation of the m1,s, if
the surface temperature is known, it can be obtained from the steam table or from the following
equation:
)(13.1
,
,1,1 se
fg
airp
es TTh
cmm (3.5)
where Ts [K] is the temperature of the surface s, P [Pa] is the total pressure, cp,air [J/kgK] is the
specific heat of air, and Te [K] is the temperature of the free stream flow. Otherwise, if the
surface temperature is unknown, it can be obtained by iteration using equation 3.5 and the
following expression:
),(.1.1 PTmm sss (3.6)

39
Figure 3.6 Surface energy balance in evaporation of water into air
A number of assumptions are made to the solution of the evaporation process of a single
water droplet. The basic assumptions are as follows:
1. The water particles are assumed to be spherical.
2. Radiant heat exchange is negligible.
3. The droplet temperature maintains a constant value in a short transient period.
4. The droplet is entrained into the air stream.
With these assumptions, the evaporation rate of the droplet, , is expressed as:
AmmgAj esms )( ,1,11,1 (3.7)
where j1,s [kg/m2s] is the diffusion mass flux of species 1, and A [m
2] is the surface area of the
droplet. With the assumption of 4, the Reynolds number for the droplets becomes zero in the
following equation:
Aj s,1

40
4.03/22/1 Pr)Re06.0Re4.0(2 DDuDN (3.8)
The Sherwood number, Sh, in a purely diffusive situation, is thus approximated as:
212
1 D
DgSh m
(3.9)
where ρ [kg/s] is the density of the air, Re is the Reynolds number, and Pr is the Prandtl number.
The mass transfer conductance and the evaporation rate of the droplet are characterized by:
D
Dgm
121
2 (3.10)
)(2
,1,112
.1 ess mmD
ADAj
(3.11)
where D12 [m2/s] is the binary diffusion coefficient and D [㎛] is the diameter of the water
droplet. Since the mass loss of the droplet indicates the evaporation rate, the mass balance on a
droplet is:
AjDdt
dsl ,1
3 )6
1( (3.12)
where ρl [kg/s] is the density of the water. Substituting equation 3.11 for j1,s, and differentiating:
l
es
D
mmD
dt
dD
)(4 ,1,112 (3.13)

41
Integrating with Ts yields:
0
,1,1120 )(4
0
dtmmD
DdDl
es
D
l
es mmDD
)(4
2
,1,1122
0
)(8 ,1,112
2
0
es
l
mmD
D
(3.14)
where D0 [㎛] is the initial diameter, and τ [s] is the droplet lifetime.
3.4 Summary
This chapter reviewed basic theoretical backgrounds regarding evaporative cooling and
simultaneous evaporative cooling process that is the main physical phenomena occurring in
PDEC towers were reviewed. In addition, definitions of these cooling devices and different types
of PDEC towers were presented since no specialized terms or definitions are available in the
literature. Furthermore, their potential benefits and limitations were reviewed so that the
solutions for further improvements can be sought. With this basic knowledge, a computational
modeling will be performed in the following chapter so that further understanding of
fundamentals of main physical phenomena of the passive down-draft evaporative cooling
processes can be made.

42
List of References
A’sami, A. “Badgir in traditional Iranian architecture.” International Conference “Passive and
Low Energy Cooling for the Built Environment, May 2005, Santorini, Greece, (2005): 1021-
1026. .
Bahadori, M. N. "Passive Cooling Systems in Iranian Architecture.” Scientific American,
Vol.238, No. 2 (1978): 144-154.
Bahadori, M. N. "Viability of wind towers in achieving summer comfort in the hot arid regions
of the Middle East." Renewable energy 5.5 (1994):879-892.
Bom, G. J., Foster, R., Dijkstra, E., and Tummers, M. “Evaporative air-conditioning:
applications for environmentally friendly cooling.” World Bank Technical paper 421, 1999.
Bowman, N. T., et al. "The application of Passive Downdraught Evaporative Cooling (PDEC) to
non-domestic buildings.” Institute of Energy and Sustainable Development De Montfort
University, UK. Final Publishable Report. 1996-1998.
Bowman, N. T., Eppel, H., Lomas, K. J., Robinson, D., and Cook, M. J. "Passive Downdraught
Evaporative Cooling I. Concept and Precedents." Indoor + built environment 9.5 (2000):284-
290.
Carew1P. and Joubert, G. “Shower Tower, Miele Showroom, Johannesburg.” PLEA2006 - The
23rd Conference on Passive and Low Energy Architecture, Geneva, Switzerland, 6-8 September
2006.
Chalfoun, Nader V. “Design and application of natural down-draft evaporative cooling devices.”
Proceedings of the 26th
American Solar Energy Society, 1997.
Cunningham, W. A. and Thompson, T. L. “Passive Cooling with natural draft cooling towers in
combination with solar chimneys.” PLEA Conference Proceedings, Pecs, Hungary, The
Hungarian Society of Sciences, 1986.
Etzion, Y., Pearlmutter, D., Erell, E., and Meir, I. A. "Adaptive architecture: Integrating low-
energy technologies for climate control in the desert." Automation in construction 6.5
(1997):417-425.Ford, B. “Passive downdraught evaporative cooling: principles and practice.”
Environmental Design. Architectural Research Quarterly 5, Cambridge University Press (2001) :
271-280.
Ghaemmaghami, P. S., and Mahmoudi, M. “Wind tower a natural cooling system in Iranian
traditional architecture.” International Conference “Passive and Low Energy Cooling for the
Built Environment, May 2005, Santorini, Greece, (2005): 71-76.
Givoni, B. "Semiempirical model of a building with a passive evaporative cool tower." Solar
Energy 50.5 (1993):425-434.
Givoni, B. “Passive and Low Energy Cooling of Buildings.” Van Nostrand Reinhold, New York,
USA, 1994.
Givoni, B. “Performance of the Shower Cooling Tower in Different Climates.” Renewable
Energy, 10, 2/3 (1997):173-178.

43
Lomas, K. J. J., and K. J. Lomas. "Building bioclimatic charts for non-domestic buildings and
passive downdraught evaporative cooling." Building and environment 39.6 (2004):661-679.
Incropera, F. P., and DeWitt, D. P. “Fundamental of Heat and Mass Transfer, fourth ed.” John
Wiley & Sons, New York, 2002.
Mazidi, M., Dehghani, Alireza, and Aghanajafi, Cyrus. "Wind towers' role in natural air
conditioning and passive cooling of buildings in hot arid regions." WSEAS Transactions on
Fluid Mechanics 1.11 (2006):959-66.
Mills, Anthony F. “Mass Transfer.” Prentice Hall, Upper Saddle River, New Jersey, 2001.
Mills, Anthony F. “Heat Transfer: second edition.” Prentice Hall, Upper Saddle River, New
Jersey, 1998.
Pearlmutter, D., Erell, E., Etzion, Y., Meir, I. A., and Di, H. "Refining the use of evaporation in
an experimental down-draft cool tower." Energy and buildings 23.3 (1996):191-197.
Pearlmutter, D., Erell, Etzion, Yair., and Erell, Evyatar. “A multi-stage down-dfaft evaporative
cool tower for semi-enclosed spaces. Part Ⅱ: Water spraying system.” PLEA 2006 – 23th
Conference on Passive and Low Energy Architecture, September 6-8, Geneva, Switzerland, 2006.
Pearlmutter, David., Erell, Evyatar, and Etzion, Yair. "A multi-stage down-draft evaporative cool
tower for semi-enclosed spaces: Experiments with a water spraying system." Solar energy 82.5
(2008):430-440.
Santamouris, M. “Passive cooling of building.” Advances of solar energy series 16, American
Society of Solar Energy, 2005.
Thompson, T., Chalfoun, N., and Yoklic, M., “Estimating the Thermal Performance of Natural
Down-draft evaporative coolers.” Energy Conversion and Management. Vol. 35, No.11 (1994):
909-915.
Watt, John R., and Brown, Will K. “Evaporative air conditioning handbook.” 2nd ed., New
York : Chapman and Hall, 1986.
Webster-Mannison, Marci. “Cooling rural Australia: Passive downdraught evaporative cooling,
Dubbo campus, Charles Sturt University.” The official journal of AIRAH (2003): 22-26.
Yaghoubi, M. A., Sabzevari, A., and Golneshan, A. A. "Wind towers: Measurement and
performance." Solar energy 47.2 (1991):97-106.

44
CHAPTER 4: COMPUTATIONAL MODELING
4.1 Model Description
This chapter focuses on the modeling of two-dimensional steady state heat and mass
transfer under turbulent flow conditions with constant properties within the effective area of a
PDEC tower. The main physical phenomenon, simultaneous heat and mass transfer, was
considered in the modeling of the down-draft evaporative cooling process. A general-purpose
commercial CFD code (FLUENT) was adapted to solve this situation. The thermodynamic
properties used in this computational modeling were obtained from the Engineering Equation
Solver (EES.) A pressure-based implicit solver was chosen since it is suited to low-speed
incompressible flows. Default material properties for the fluids in FLUENT were used.
The solutions are fully coupled since both the continuous phase, i.e., fluid flows of the
air, and the discrete phase, i.e., water droplets, affect each other. According to the FLUENT 6.3
User’s Guide, FLUENT solves the differential equations in the following manner:
1. Solve the continuous phase flow field;
2. Introduce the discrete phase by calculating the particle trajectories for each discrete
phase injection;
3. Recalculate the continuous phase flow, using the interphase exchange of momentum,
heat, and mass determined during the previous particle calculation;
4. Recalculate the discrete phase trajectories in the modified continuous phase flow field;
5. Repeat the previous two steps until a converged solution is achieved in which both
the continuous phase flow field and the discrete phase particle trajectories have no
variations with each additional calculation.
In addition, the following assumptions, which are typically adapted to most droplet models, are
employed to compute the trajectory of a discrete phase droplet:
1. The vaporization process is quasi-steady;

45
2. The conservation equations for chemical species and enthalpy consist of a balance
between convection and diffusion;
3. The droplet is composed of a single chemical species, while the gas in the continuous
phase consists of air and vapor from the droplet;
4. Pressures and temperatures are below the critical thermodynamic state of the droplet
so that its surface is impermeable to air;
5. The droplet is assumed to be spherical;
6. The spray is assumed to be dilute. Under this assumption, droplet collisions are
ignored, and the effect of adjacent droplets on droplet transport rates is neglected;
7. The flow around the droplet is assumed to be quasi-steady i.e., the flow immediately
adjusts to the local boundary conditions and droplet size at each instant of time;
8. The radial velocity of the liquid surface due to the evaporation of liquid is neglected;
9. Effects of drag and forced convection are represented by empirical correlations;
10. Gas phase transport is based on mean ambient properties and the effect of turbulent
fluctuation is ignored;
11. The liquid surface is assumed to be in thermodynamic equilibrium with negligible
temperature jumps due to finite rates of evaporation;
12. The effect of surface tension is neglected when determining phase equilibrium at the
liquid surface;
13. The pressure is assumed to be constant and equal to the local mean ambient pressure;
14. Only concentration diffusion is considered, neglecting thermal diffusion;
15. Radiation between the droplets and their surroundings is neglected;
16. The gas phase Lewis number (Le) is not assumed to be unity in the droplet model;
17. The properties of the gas flow field are assumed to be constant at each instant of time;
18. The transport process within the droplet is neglected and its properties are assumed to
be constant at each instant of time;
19. The spray is assumed to be monodispersed.

46
4.2 Governing Equations
The main physical phenomena of down-draft evaporative cooling involve turbulent fluid
flow, heat and mass transfer, and species mixing. The differential equations for conservation for
mass and momentum, energy, and species must be solved to account for this complex
environment. In addition, the transport equations for turbulence modeling should also be solved.
Thus, three sets of equations are considered. This set of equations for the continuous phase
calculates the fluid flow and species transport, and the set of equations for the dispersed phase
calculates the trajectory of the water droplets. Due to a strong interdependence between both
phases, the solutions are coupled and must be solved as such. The general equations for the
solution are shown in the following subsections.
4.2.1 Continuous phase model
As described in the previous section, FLUENT solves continuous phase flows as it solves
the differential equations for conservation for mass and momentum, energy, and species in the
following manner. At the beginning of the processes, the model solves continuous phase without
inclusion of interchange between two phases. Once the disperse particle trajectories were solved,
and the source terms were obtained such as Sm, Sh, and Fi, it solves continuous phase with
inclusion of these source terms in the following equations. The equation for the conservation of
mass is:
mi
i
Sux
)(
(4.1)
where ui is air velocity component in the continuous phase [m/s] and Sm is the addition of the
mass to the continuous phase from the discrete phase [kg/m3s], defined in the following
subsection 4.2.3. The momentum transfer from the exchange can be written as:

47
i
i
iij
j
j
i
j
j
i
jj
ii F
x
pg
x
u
x
u
x
u
xx
uu
3
2 (4.2)
, and the energy equation with the inclusion of species diffusion and interchange energy source
between two phases, defined in the following subsection 4.2.3, i.e., volumetric heat source Sh,
calculates the heat transfer using:
h
n
i
ii
iii
v
i
i
i
i SJhxx
Tk
xx
up
x
eu
1'
'
(4.3)
where μ is the molecular viscosity [kg/m.s2], p is the static pressure [Pa], gi is gravity [m/s
2], Fi is
the momentum source [kg/m2s
2], e is the internal energy [J/kg], v is the Rayleigh dissipation
function [kg/s3m], k is the thermal conductivity [W/mK], T is the air temperature [K], hi is the
enthalpy of species i, Ji is the diffusion flux of species i [kg/m2s], and Sh is the volumetric heat
source [kg/s3m]. The conservation equations for species to predict the local mass fraction of each
species, i.e., gas phase of water and air, are:
m
i
i
i
ii S
x
Jp
x
mu
(4.4)
i
imii
x
mDJ
,'
(4.5)
where mi is the local mass fraction of species i and Di,m is the diffusion coefficient for species i in
the mixture.
4.2.2 Discrete phase model
The discrete droplets in the continuous phase are assumed to be spherical. At the
beginning of the solutions, the model calculates the trajectory of a discrete phase droplet using

48
the Lagrangian approach by integrating the force balance. Once the continuous phase is
recalculated and altered, it solves the discrete phase in the following equation:
i
p
pp
px
pD
p
x
uu
guuF
dt
du
)()( (4.6)
24
Re182
D
pp
D
C
dF
(4.7)
uud pp Re
(4.9)
2
321
ReRe
aaaCD
(4.10)
where up is the velocity of the droplets [m/s], FD(u-up) is the drag force per unit particle mass
[m/s2], the second term in the right-hand side is the gravitational force on the particle, the third
term in the right-hand side is an additional force caused by the pressure gradient in the fluid, the
term dp/dt in the left-hand side is the evaporation rate of the particle, gx is gravity [m/s2], CD is
the drag coefficient , dp is the droplet diameter [m], and a1, a2, and a3 are constants given by
Morsi and Alexander (Morsi and Alexander, 1972.) The heat balance for computing the heat
transfer between the discrete and continuous phases with no consideration of radiant heat transfer
is defined as:
f
p
pp
p
pp hdt
dmTThA
dt
dTcm )(
(4.11)
where cp is the droplet heat capacity [J/kgK], Tp is the droplet temperature [K], h is the
convective heat transfer coefficient [W/m2K], Ap is the droplet surface area [m
2], T∞ and Tp are
the temperatures of continuous phase and droplet [K], respectively, dmp/dt is the rate of
evaporation [kg/s], and hfg is the latent heat [J/kg].

49
4.2.3 Coupling between the dispersed and continuous phases
In order to solve the two coupled phases, an iterative method is utilized. Once a
calculation of a particle trajectory is made, the heat, mass, and momentum gained or lost by the
particle stream is calculated, and then these values are incorporated into the continuous phase
calculations. The mass exchange, Sm, from the discrete phase to the continuous phase is
determined as the mass differences between control volumes using:
0,
0,
p
pp
mm
mmS
(4.12)
where pm is the particle mass change in each control volume, pm is the mass flow rate of the
particles, and 0,pm is the initial mass flow rate of the particles. This mass exchange is then
included into the continuity equation of the continuous phase as well as the species equation as a
source of mass. The momentum transfer from the continuous phase to the discrete phase can be
written as the change in momentum of a particle between control volumes using:
tm
x
uu
guu
C
DF p
i
p
pp
px
pD
pp
i
)()(
24
Re182
(4.13)
The rate of vaporization is governed by the gradient of the vapor concentration between the
droplet surface and the gas phase:
)( ,, isici CCKN
(4.14)
p
mi
p
mi
cd
DSc
d
ShDK
,
3/12/1
, )Re6.02(
(4.15)
)(
)(,
p
psat
siTR
TPC
(4.16)
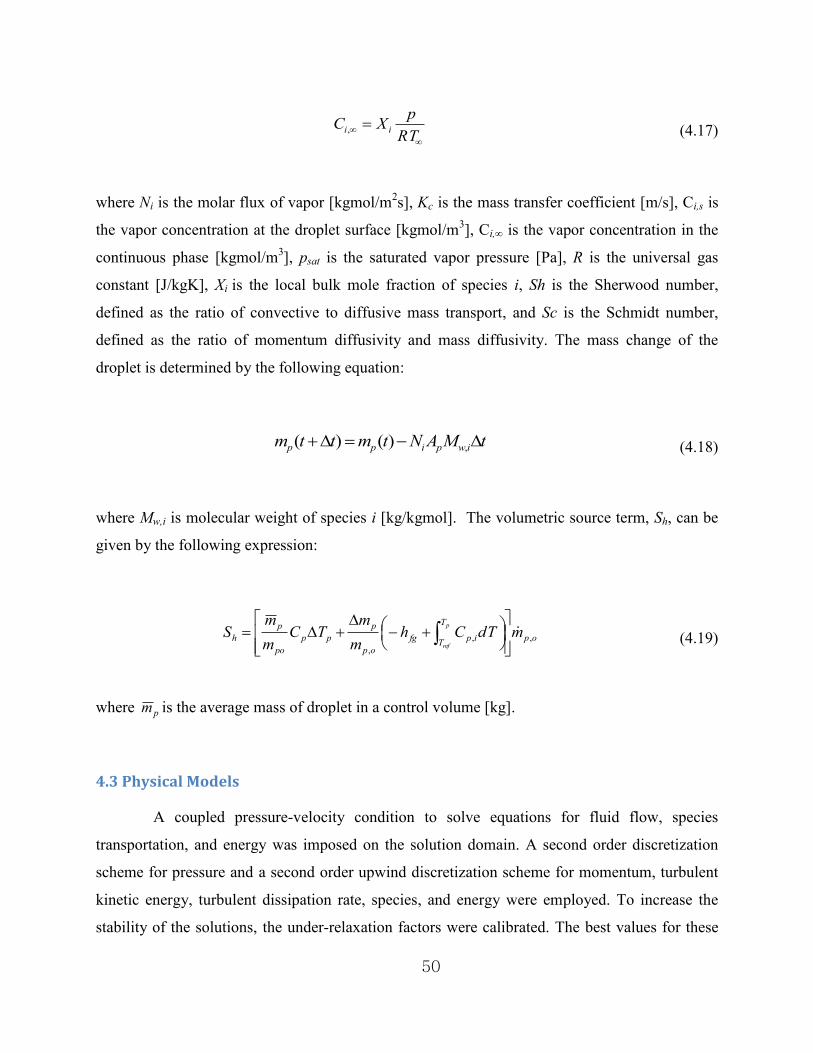
50
RT
pXC ii,
(4.17)
where Ni is the molar flux of vapor [kgmol/m2s], Kc is the mass transfer coefficient [m/s], Ci,s is
the vapor concentration at the droplet surface [kgmol/m3], Ci,∞ is the vapor concentration in the
continuous phase [kgmol/m3], psat is the saturated vapor pressure [Pa], R is the universal gas
constant [J/kgK], Xi is the local bulk mole fraction of species i, Sh is the Sherwood number,
defined as the ratio of convective to diffusive mass transport, and Sc is the Schmidt number,
defined as the ratio of momentum diffusivity and mass diffusivity. The mass change of the
droplet is determined by the following equation:
tMANtmttm iwpipp ,)()(
(4.18)
where Mw,i is molecular weight of species i [kg/kgmol]. The volumetric source term, Sh, can be
given by the following expression:
op
T
Tipfg
op
p
pp
po
p
h mdTChm
mTC
m
mS
p
ref,,
,
(4.19)
where pm is the average mass of droplet in a control volume [kg].
4.3 Physical Models
A coupled pressure-velocity condition to solve equations for fluid flow, species
transportation, and energy was imposed on the solution domain. A second order discretization
scheme for pressure and a second order upwind discretization scheme for momentum, turbulent
kinetic energy, turbulent dissipation rate, species, and energy were employed. To increase the
stability of the solutions, the under-relaxation factors were calibrated. The best values for these

51
parameters were determined to be: 0.3 for turbulent kinetic energy, 0.7 for turbulent dissipation
rate, and 0.5 for turbulent viscosity, respectively. The other values were set to the defaults in
FLUENT.
4.3.1 Computational domain
The computational domain for the physical modeling of down-draft evaporative cooling
includes an effective area over the vertical tower from the sprays at the upper end to the outlets at
the lower portion of the tower as illustrated by the dashed box in Figure 4.1. This is where the
main phenomenon, simultaneous heat and mass transfer, takes place. In fact, numerous cases
need to be considered to appropriately model the fluid flow through the wind catchers and outlets
at the bottom of the tower. It, however, is difficult to include hundreds of possibilities for
modeling various types of wind catchers as well as bottom outlets. While turbulent flow is
strongly dependent on the initial conditions, all initial conditions such as air conditions and the
area of wind catchers are known for this system. Thus, it is reasonable to simplify the mass flow
rate of air across the wind catcher area by assuming that it is uniformly distributed over the
surface area over which water droplets are injected by the system. This simplification, however,
does not properly model turbulent flow at the inlet as well as wall-bounded flows. To remedy
this gap and minimize computational demands, the outdoor air is assumed to be diagonally
distributed over the inlet surface with a 45-degree angle.
Other assumptions that have been employed to simplify the computational domain are as
follows:
1. The air entering through the wind catcher is distributed evenly over the inlet surface
area of the tower without loss;
2. Both fluids are uniformly distributed over the surface area and completely mixed with
each other throughout the domain;
3. The temperature of inside wall reaches an equilibrium and is maintained at a constant
and uniform temperature throughout all the walls;
4. The walls are well insulated, so that heat flux through the walls is negligible;

52
5. Changes in kinetic and potential energy are neglected;
6. Radiation heat transfer, viscous heat dissipation and other secondary effects are
negligible;
7. No heat generation within the computational domain takes place;
8. The pressure in the domain maintains positive pressure.
Figure 4.1 Schematic of main phenomena in a PDEC tower
4.3.2. Convergence
A number of criteria can be considered to judge the convergence of the solutions. The
very first step is to monitor scaled residuals. The convergence criterion for continuity was 10-2
.
This was chosen because the solutions are very stable after approximately 150 iterations, and a
stricter criterion for continuity required too much computational effort. The criteria for k and ε
were 10-3
and that for the velocity components and species were 10-5
. The criterion for energy
was set to be 10-6
.
In addition, the stability of the solutions was considered. A solution can be considered
stable when the truncation errors are stable and consistent. The truncation errors should not grow

53
with integration. Furthermore, the y+ values were observed to determine the proper treatment of
the wall-bounded flows. They are defined as:
pyuy (4.19)
where is density of the fluid [kg/m3], uτ is the friction velocity [m/s], yp is distance from wall
[m], and is dynamic viscosity [kg/m.s]. This y+ value should not be between 5 and 30 in a
buffer layer, but in between 30 and 300, or below 5 for a low Re flows. It is desirable to be close
to the lower bound of 30. The value of mass imbalance was also monitored, and this value was
compared to the mass flow rate of the discrete phase droplet to insure that continuity was
satisfied.
Grid independency was investigated to verify that variations in the size of grid generated
did not influence the results. All criteria described above were considered to judge the
independence of the mesh. As an example, a PDEC tower in the literature was modeled to test
grid independence and to validate the results against the experimental data obtained. The
effective area of the computational domain for the tower in this study was 3.9m × 7.15m. To
properly model wall-bounded flows and turbulence at the inlet and outlet, a bi-exponent mesh
type was adopted, varying different interval size as well as the grading ratio. As for the
turbulence modeling, the standard k-ε model was employed for the initial iterations. Almost no
variations in the results of temperature and relative humidity at the outlet were observed when
the horizontal interval size was 4cm and the vertical distance was 3cm with a gradient ratio of
0.6. The total number of cells was 23324. The average y+ along the wall of 40 and mass
imbalance of below 0.2% were observed.
4.3.3 Discrete phase modeling
Different models and parameters, which are required to track the discrete phase, were
tested. Two-way coupling was necessary as a strong interdependency between species appeared.
The discrete phase was set to interact with the continuous phase, updating the discrete phase

54
sources every 10 continuous phase iteration to increase the stability of the solution. Unsteady
water particle treatment was also considered. With variation of particle time step ranging from
1.0E-04s to 1.0s, temperature and relative humidity have been monitored to find proper time step
at the lowest cost. As a result, a time step of 0.1s was used since it reduces the computational
expense while still providing the same level of accuracy. The trajectory of the particle is thus
calculated each 10th
particle time step. The integration time steps for tracking particles was set to
be controlled by the length scale determined as the ratio of the inlet velocity of the air and the
turbulent length scale. Two-Way turbulent coupling was chosen so that the variation of turbulent
quantities due to the interaction between the two phases could be considered. Default numerical
schemes to calculate equations for particle heat and mass transfer and particle tracking were
chosen.
The surface injection type was chosen for the discrete phase droplet injection so that the
mass of water can be uniformly distributed over the inlet surface area. The diameter of the
droplet was set to be uniformly distributed with no consideration of particle breakdown. The
temperature of the particles was assumed to be equal to the wet-bulb temperature of the outdoor
air. The discrete phase droplets were set to be continuously injected during calculations at a
constant mass flow rate, and the inlet surface area scaled the mass flow rate. A stochastic
tracking approach was considered to model particle turbulent dispersion with the option of Time
Scale Constant of 0.15.
4.3.4 Turbulence modeling
It is generally known that the standard k-ε model is overly diffusive and inaccurate for
treating near wall situations. Two viscous models in FLUENT were considered as they are
appropriate to model turbulence and wall-bounded flows with reasonable accuracy and speed.
Two different viscous flow models such as the k-ε and k-ω models were also available. The k-ε
model has three different models including the Standard, the RNG, and the Realizable models,
and the k-ω model has two different models including the Standard and the SST models. All five
of these viscous models were considered. While no significant variations in the results appeared,
the RNG k-ε model with the options of enhanced wall treatment (EWT) showed the best

55
agreement with the experimental data though it required approximately 1.5 times more
computational effort in comparison to the standard k-ε model.
Turbulence modeling requires various parameters, and these parameters are different
depending on the turbulent model and modeling method used. The RNG k-ε model with the
Intensity and Length Scale method was chosen to adequately model turbulence and wall-
bounded flow in the computational domain. The turbulence quantities used as input values were
determined as shown in the following equations.
The mass flow rate of the air [kg/s], m , through the wind catcher can be obtained from
the continuity equation:
VAm wc
(4.22)
where ρ is the density of air [kg/m3], Awc is the area of wind catcher [m
2], and V is the velocity of
air [m/s]. The inlet velocity [m/s] for the computational domain, Vi, is thus expressed as:
t
iA
mV
(4.22)
where At is the cross-sectional area of the PDEC tower [m2]. The hydraulic diameter [m], Dh, to
determine the Reynolds number, is:
P
AD t
h
4
(4.22)
where P is the perimeter of the tower [m]. The Reynolds number, Re, is given by:

56
hUDRe
(4.23)
where U is the average air velocity [m/s] and is the kinematic viscosity [m2/s]. The
turbulence intensity, I, is thus:
81
Re16.0
I
(4.24)
The turbulent kinetic energy, k, is given by:
3
)(2 2UIk
(4.25)
As for wall-bounded flows, the turbulence length scale, l, can be calculated as:
994.0 l
(4.26)
where the boundary-layer thickness [m] is:
U
x 0.599
(4.27)
The dissipation rate is therefore:
l
kC
23
43
(4.28)

57
where C is an empirical constant.
4.4 Boundary Conditions
Three sets of boundary conditions for the inlet, the outlet, and the wall conditions were
input based on the FLUENT documentation (FLUENT 6.3 User’s Guide.) The wet-bulb
temperature and humidity ratio were obtained from the Engineering Equation Solver (Klein,
2006) as described in the previous section. A velocity-inlet type was chosen for the inlet. The
velocity of the air calculated at the inlet surface was input as the velocity magnitude. Each X and
Y component of flow direction was set to 1 so that the direction of the incoming air was
maintained at a 45-degree angle with respect to the outlet. The Intensity and Length Scale
methods for modeling turbulence were chosen to properly model turbulence, and the calculated
values of turbulent intensity and turbulent length scale were input into FLUENT. An accurate
relative humidity at the inlet was obtained when the species mass fractions were set to be 98% of
the humidity ratio. The discrete phase droplets were set to be trapped at the inlet surface so that
they were entrained into the continuous phase field.
Stationary, non-slip wall properties were considered. The inside surface temperature of
the walls was set to be 3C higher than the wet-bulb temperature of the outdoor air. While the
temperature and relative humidity with surface temperature variations has almost no change, a
3C difference between the wet-bulb temperature and the wall temperature were imposed. Zero
diffusive flux of the species boundary condition was chosen. The discrete phase model
conditions were set to be reflected from the wall surfaces after any collisions, and the discrete
phase reflection polynomial coefficients for both the normal and tangent components were
selected. In addition, the outflow type for the outlet boundary condition was considered, and the
mass flow of both phases over the domain was set to be exhausted without loss through the outlet
opening.

58
4.5 Validation
A PDEC experimental test facility1 was modeled and the results of the computational
model were validated against the experimental data provided by Prof. Ford at University of
Nottingham, UK. The dimensions of the PDEC tower were 4.1m × 4.4m × 10.7m, and the air
flow was in one direction toward a room that was being served by the tower. The 1.7m × 3.7m
wind catchers were placed on the east and west sides of the tower. The size of the droplets
injected into the air stream was approximated 30 ㎛. Data was obtained every minute. The data
sets taken by various data acquisition systems included the outdoor air conditions such as
temperature and relative humidity, wind direction and velocity and temperatures at five different
points at the exit of the tower. The temperatures at the exit of the tower were measured at three
points at the level of roof of the room, a point at the center of the outlet, and a point near the
floor level. Since the effective tower height was defined from the top of spray to the top of the
PDEC outlet, the temperatures taken at the middle point of the outlet and the floor level
temperature were averaged. The experimental data shown in Table 4.1 were collected on three
different days in August, 1997.
Table 4.1 shows the differences between the measured and predicted temperature and
relative humidity at the exit of the tower. It includes the outdoor air temperature, To, the outdoor
relative humidity RHo, and the outdoor wind speed, Vo. The average values of these variables
over 10 minute time periods were used to minimize any uncertainties that could be involved due
to the experimental set-up. In the full data set, the outdoor air temperatures ranged from 29.7C
to 37.9C, and the relative humidity ranged from 27.7% to 76.4%. However, outdoor relative
humidity in most of hours during the period was very high even afternoon hours, and wind
direction in some of those hours significantly varied. In addition, the most desirable range for
PDEC operation is a dry climate. Thus, a few relatively dry conditions were chosen as shown in
Table 4.1.
Very good agreement between the measured outlet temperature and humidity levels and
those predicted by the computational model described in this chapter is observed as shown in
Table 4.1. The maximum difference in temperature was 0.7C at the outdoor temperature of
1 The data set were measured in the experimental PDEC tower at the Conphoebus Institute,
Catania, Sicily, and this work was partly funded by the European Commission.

59
36.9C and relative humidity of 29% while the maximum difference in relative humidity was 3.3%
at outdoor air conditions of 32.5C and 50.7%RH. The root mean square (RMS) value calculated
were 0.48C for temperature and 2.3% for relative humidity.
Table 4.1 Comparison between measured and predicted air conditions
To (℃) RHo (%) Vo (m/s) TM (℃) TP (℃) Diff. RHM (%) RHP (%) Diff.
31.0 55.7 3.3 26.0 26.35 -0.35 79.4 82.3 -2.9
32.5 50.7 3.2 26.56 27.25 -0.69 76.2 79.5 -3.3
33.0 45.4 3.2 26.9 26.6 0.3 77.4 79 -1.6
36.9 29.0 3.2 25.9 26.6 -0.7 72.7 71.2 1.5
37.4 27.7 4.0 28.78 29.05 -0.27 59.9 57.2 2.7
37.9 28.0 3.6 28.26 28.64 -0.38 62.5 61.9 0.6
* O: outdoor, M: measured, P: predicted

60
List of References
Barron, R.M., Ali, A., Neyshabouri, Salehi. “Effects of under-relaxation factors on turbulent
flow simulations.” International Journal for Numerical Methods in Fluids 42 (2003):923-928.
Chilka, Amarvir, Kulkarni, Ashish. “Modeling turbulent flows in Fluent.”
Cook, M. J., Robinson, D., Lomas, K. J., Bowman, N. T., and Eppel. H. "Passive Downdraught
Evaporative Cooling: II. Airflow Modelling." Indoor + built environment 9.6 (2000):325-334.
Elmualim, Abbas Ali. “Dynamic modeling of a wind catcher/tower turret for natural ventilation.”
Building Service and Engineering Research & Technology 27, 3 (2006):165-182.
Faeth, G.M. “Current status of droplet and liquid combustion.” Proceedings of Energy and
Combustion Science 3(1977):191-224.
Feddaoui, M., Meftah, H., Mir, A.. “The numerical computation of the evaporative cooling of
falling water film in turbulent mixed convection inside a vertical tube.” International
Communications in Heat and Mass Transfer 33 (2006):917-927
Fisenko, S.P., Petruchik, A.I., Solodukhin, A.D.. “Evaporative cooling of water in a natural
cooling tower.” International Journal of Heat and Mass Transfer 45 (2002):41-59.
FLUENT, User’s Guide 6.3, Fluent Inc., USA
Galata, Alfio, Sciuto, Salvo. “Passive evaporative cooling: the PDEC project.” International
Thermal Energy and Environment Congress (ITEEC), Marrakesh, June 1997.
Hawlader, M.N.A., Liu, B.M.. “Numerical study of the thermal-hydraulic performance of
evaporative natural draft cooling towers.” Applied Thermal Engineering 22 (2002):41-59.
Hermann Schlichting and Klaus Gersten, Boundary-layer Theory, 8th edition Chap6, Section 6.5
Plate boundary layer. eq. 6.60.
Incropera, Frank P. and DeWitt, David P. “Fundamentals of Heat and Mass Transfer (3rd ed.)”
John Wiley & Sons, 1990.
Kaiser, A.S., Lucas, M., Viedma, A., Zamora, B.. “Numerical model of evaporative cooling
processes in a new type of cooling tower.” International Journal of Heat and Mass Transfer 48
(2005):986-999.
Krause, Egon, Oertel, Herbert. “Boundary-Layer Theory.” Springer, 2000.
Morsi, S. A. and Alexander, A. J.. “An Investigation of Particle Trajectories in Two-Phase Flow
Systems.” The Journal of Fluid Mechanics, 55(1972):193-208.
Salim, Salim M. and Cheah, S. C. “Wall y+ strategy for dealing with wall-bounded turbulent
flows.” Proceedings of the International Conference of Engineers and Computer Scientists 2009
Vol 2, Hong Kong, March 18-20, 2009.
Tishkoff, Julian M. “A model for the effect of droplet interactions on vaporization.” International
Journal of Heat and Mass Transfer 22 (1979):1407-1415.
61
CHAPTER 5: EFFECT OF VARIABLES ON PDEC COOLING PERFORMANCE
In the previous chapter, a computational model was developed to study the fundamentals
of the passive down-draft evaporative cooling (PDEC) process. Previous studies have
investigated what parameters affect the cooling performance of PDEC systems. These studies,
however, did not include the influence of the droplet size, which is one of the most important
variables and has a strong impact on the cooling performance of PDEC towers. It is also
necessary to investigate which parameters, including ones defined in the previous studies, can
potentially affect the performance of the PDEC system and how significant the impact of each
individual parameter is. In fact, this characterization of the impact of different parameters on the
PDEC system is very important because many of these parameters play a key role in determining
the cooling capacity of PDEC tower, and a better understanding of the role of these parameters
would led to substantially improved performance of PDEC systems. In addition, this may also
lead to an extension of the applicability of these particular systems to other situations and
climates. This chapter will thus present a computational analysis of the fundamental physics of
PDEC systems and the significance of the different variables that impact the performance of
these systems.
5.1 Air Distribution Characteristics
5.1.1 Velocity profile
A computational analysis on the characteristics of air distribution within the effective
tower area was performed. It is important to investigate how the air flows through the tower and
is influenced by various effects such as turbulence at the inlet and wall-bounded flows along the
walls. In fact, some studies have attempted to model the physical processes occurring within the
tower. These studies, however, assumed that fluid flows straight from the top to the bottom of
the tower in a manner that is consistent with a fully-developed flow. As a result, the air flow
profiles in the tower have never been properly studied. A computational analysis was thus
performed in order to appropriately handle the unique flow features in the down-draft towers
such as turbulence at the inlet and wall-bounded flows. Note that many variables used in this
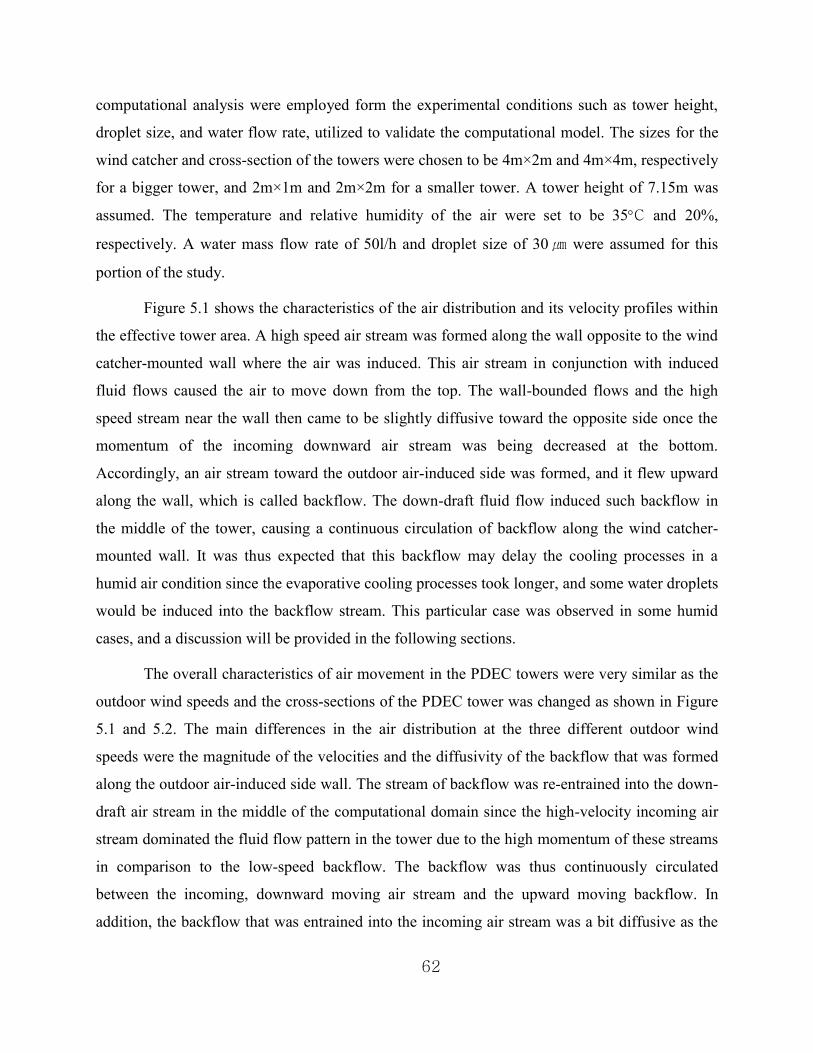
62
computational analysis were employed form the experimental conditions such as tower height,
droplet size, and water flow rate, utilized to validate the computational model. The sizes for the
wind catcher and cross-section of the towers were chosen to be 4m×2m and 4m×4m, respectively
for a bigger tower, and 2m×1m and 2m×2m for a smaller tower. A tower height of 7.15m was
assumed. The temperature and relative humidity of the air were set to be 35C and 20%,
respectively. A water mass flow rate of 50l/h and droplet size of 30 ㎛ were assumed for this
portion of the study.
Figure 5.1 shows the characteristics of the air distribution and its velocity profiles within
the effective tower area. A high speed air stream was formed along the wall opposite to the wind
catcher-mounted wall where the air was induced. This air stream in conjunction with induced
fluid flows caused the air to move down from the top. The wall-bounded flows and the high
speed stream near the wall then came to be slightly diffusive toward the opposite side once the
momentum of the incoming downward air stream was being decreased at the bottom.
Accordingly, an air stream toward the outdoor air-induced side was formed, and it flew upward
along the wall, which is called backflow. The down-draft fluid flow induced such backflow in
the middle of the tower, causing a continuous circulation of backflow along the wind catcher-
mounted wall. It was thus expected that this backflow may delay the cooling processes in a
humid air condition since the evaporative cooling processes took longer, and some water droplets
would be induced into the backflow stream. This particular case was observed in some humid
cases, and a discussion will be provided in the following sections.
The overall characteristics of air movement in the PDEC towers were very similar as the
outdoor wind speeds and the cross-sections of the PDEC tower was changed as shown in Figure
5.1 and 5.2. The main differences in the air distribution at the three different outdoor wind
speeds were the magnitude of the velocities and the diffusivity of the backflow that was formed
along the outdoor air-induced side wall. The stream of backflow was re-entrained into the down-
draft air stream in the middle of the computational domain since the high-velocity incoming air
stream dominated the fluid flow pattern in the tower due to the high momentum of these streams
in comparison to the low-speed backflow. The backflow was thus continuously circulated
between the incoming, downward moving air stream and the upward moving backflow. In
addition, the backflow that was entrained into the incoming air stream was a bit diffusive as the

63
wind speed decreased. These characteristics of the air distribution were also seen in the other
narrower cross-section tower as shown in Figure 5.2, forming a vertically longer backflow
section than in the wider cross-section tower.
a) Outdoor wind speed of 5.5m/s
b) Outdoor wind speed of 3.5m/s
Figure 5.1 Air flow profile in a wider cross-section along the variations of wind speed

64
c) Outdoor wind speed of 1.5m/s
Figure 5.1 Air flow profile in a wider cross-section (con’t)
a) Outdoor wind speed of 5.5m/s
Figure 5.2 Air flow profile in a narrower cross-section along the variations of wind speed

65
b) Outdoor wind speed of 3.5m/s
c) Outdoor wind speed of 1.5m/s
Figure 5.2 Air flow profile in a narrower cross-section (con’t)

66
5.1.2 Temperature and relative humidity
The conditions of the air and water including temperature, relative humidity, and water
droplet residence time were compared to verify how the down-draft evaporative cooling
processes was impacted by different situations. Two different relative humidity conditions were
considered: 20% to represent dry conditions and 40% to represent humid conditions. As the
humidity conditions were varied, the tower configuration including the sizes of the wind catcher,
the tower cross-sectional area, and the tower height were kept constant at 2.64m×2.64m, 4m×4m,
and 7.15m, respectively. An outdoor temperature of 35C and wind speeds of 4m/s for the high
speed case and 2m/s for the low speed case were selected. The water mass flow rate and droplet
size were chosen to be 50l/h and 30 ㎛, respectively. Detailed investigations on the main physical
processes will be provided in the following sections since they significantly vary with different
situations.
Most of the temperature drop within the PDEC system occurred at the very top of the
tower. Direct temperature drop of the air appeared as soon as water droplets were entrained into
the air, and its temperature, once lowered by the evaporative cooling process, was maintained at
an almost constant value with no considerable changes throughout the rest of the tower.
Temperature drops achieved under dry humidity conditions were 6.0C at a wind speed of 4m/s
and 11.84C at wind speed of 2m/s as shown in Figure 5.3 a) and 5.4 a), respectively. Similarly,
the relative humidity reached its maximum level very near the top of the tower, and the
distribution of relative humidity at the lower wind speed 2m/s was more constant throughout the
tower than the higher velocity condition of 4m/s, as shown in Figure 5.3 b) and 5.4 b). Higher
relative humidity zones were formed along the opposite sidewall from the wind induced side
since the water injected was mostly entrained into the high-velocity air stream. This phenomenon
was also seen on the backflow-formed side while differences in relative humidity between these
zones and the main down-draft flow were less than approximately 3%. In addition, it appeared
that the evaporative cooling process, under dry conditions where the relative humidity was 20%,
was completed within a very short time: within 0.3 second at a wind speed of 4m/s and within
0.4 second at a wind speed of 2m/s as illustrated in Figure 5.3 c) and 5.4 c).

67
a) Temperature [C]
b) Relative humidity [%]
Figure 5.3 Distributions of temperature, RH, and droplet remaining time at the high
speed, dry condition

68
c) Droplets residence time [s]
Figure 5.3 Distributions of temperature, RH, and droplet remaining (con’t)
a) Temperature [C]
Figure 5.4 Distributions of temperature, RH, and droplet remaining time at the low
speed, dry condition

69
b) Relative humidity [%]
c) Droplet residence time [s]
Figure 5.4 Distributions of temperature, RH, and droplet remaining time (con’t)

70
An increased level of humidity in the outside air delayed the evaporative cooling process
as shown in Figure 5.5 and 5.6. In the humid cases, gradual temperature drops occurred at the
very top and continued over the tower area since the increased humidity in the air (relative
humidity of 40%) hindered the physical cooling process throughout the tower. Average
temperature drops at the outlet in the humid case were predicted to be 5.77C at the high wind
speed and 11.24C at the low wind speed. The average temperature drops under dry conditions
(relative humidity of 20%) were 6C at the high wind speed (4m/s) and 11.84C at the low wind
speed (2m/s). The similarity of the temperature drops achieved under both the dry and humid
conditions were due to the low water flow rate of 50l/h in the dry air condition. The theoretical
maximum achievable temperature drop in a dry condition would have been 16.13C, which is the
difference between the dry- and wet-bulb temperatures of the air. Thus the temperature drops
could be up to 16.13C when the water flow rate in the dry air condition increased. On the other
hand, a portion of air in the down-draft flow at the bottom and in the backflow section of the
tower was saturated in the low wind speed case. Likewise, the average relative humidity at the
outlet was predicted to be 61.8% for the high wind speed case and 92% for the low wind speed
case. A continuous gradient in relative humidity appeared at the high wind speed while the
backflow zone and the central area at the bottom at the low wind speed reached maximum
relative humidity achievable, i.e. saturated at 100%. In addition, the maximum particle residence
time, defined as the time that the particle has spent inside a domain since its entry (Ghirelli,
2004), over the area was observed to be 4.2 seconds at the high wind speed and 14.6 seconds at
the low wind speed. Note that a noticeable portion shown in black in Figure 5.6 a) and b)
indicated that the air in this portion was saturated. The temperature and relative humidity in this
portion was the wet-bulb temperature and 100%RH, respectively.

71
a) Temperature gradient [C ]
b) Relative humidity gradient [%]
Figure 5.5 Distributions of temperature, RH, and droplet remaining time at the high
speed, humid condition

72
c) Droplet residence time [s]
Figure 5.5 Distributions of temperature, RH, and droplet remaining time at the high speed,
humid condition (con’t)
a) Temperature [C ]
Figure 5.6 Distributions of temperature, RH, and droplet remaining time at the low
speed, humid condition

73
b) Relative humidity [%]
c) Particle residence time [s]
Figure 5.6 Distributions of temperature, RH, and droplet remaining time at the low speed,
humid condition (con’t)
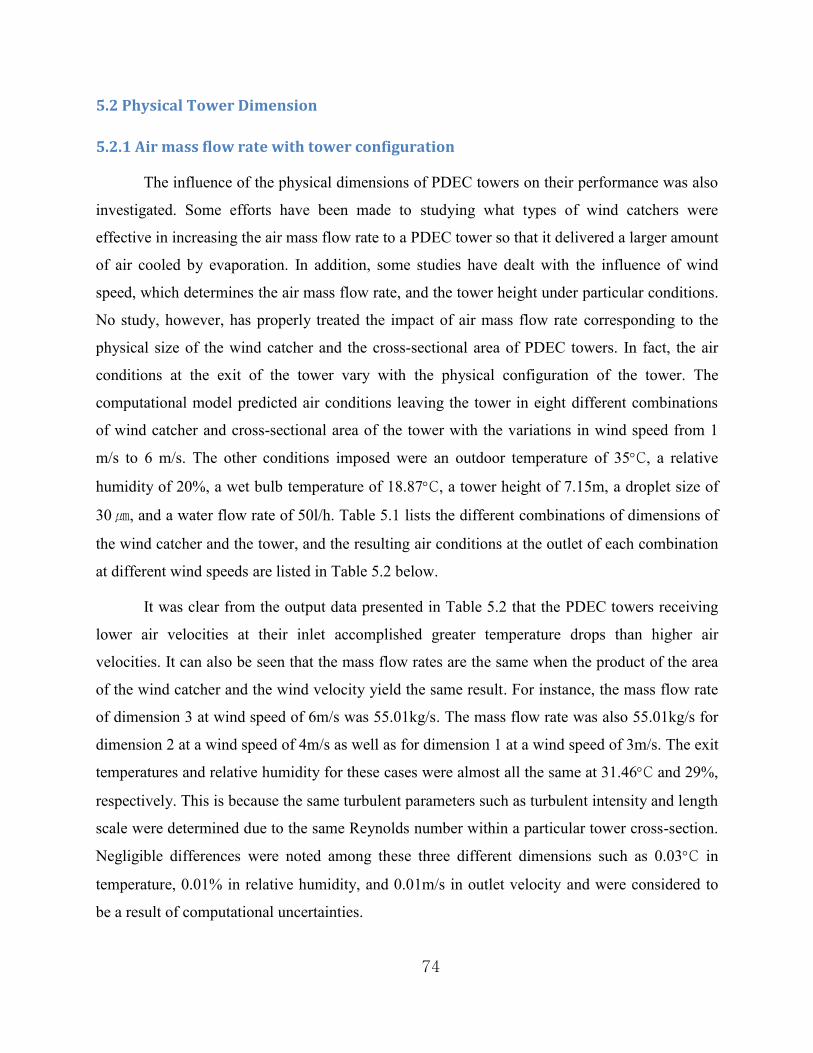
74
5.2 Physical Tower Dimension
5.2.1 Air mass flow rate with tower configuration
The influence of the physical dimensions of PDEC towers on their performance was also
investigated. Some efforts have been made to studying what types of wind catchers were
effective in increasing the air mass flow rate to a PDEC tower so that it delivered a larger amount
of air cooled by evaporation. In addition, some studies have dealt with the influence of wind
speed, which determines the air mass flow rate, and the tower height under particular conditions.
No study, however, has properly treated the impact of air mass flow rate corresponding to the
physical size of the wind catcher and the cross-sectional area of PDEC towers. In fact, the air
conditions at the exit of the tower vary with the physical configuration of the tower. The
computational model predicted air conditions leaving the tower in eight different combinations
of wind catcher and cross-sectional area of the tower with the variations in wind speed from 1
m/s to 6 m/s. The other conditions imposed were an outdoor temperature of 35C, a relative
humidity of 20%, a wet bulb temperature of 18.87C, a tower height of 7.15m, a droplet size of
30 ㎛, and a water flow rate of 50l/h. Table 5.1 lists the different combinations of dimensions of
the wind catcher and the tower, and the resulting air conditions at the outlet of each combination
at different wind speeds are listed in Table 5.2 below.
It was clear from the output data presented in Table 5.2 that the PDEC towers receiving
lower air velocities at their inlet accomplished greater temperature drops than higher air
velocities. It can also be seen that the mass flow rates are the same when the product of the area
of the wind catcher and the wind velocity yield the same result. For instance, the mass flow rate
of dimension 3 at wind speed of 6m/s was 55.01kg/s. The mass flow rate was also 55.01kg/s for
dimension 2 at a wind speed of 4m/s as well as for dimension 1 at a wind speed of 3m/s. The exit
temperatures and relative humidity for these cases were almost all the same at 31.46C and 29%,
respectively. This is because the same turbulent parameters such as turbulent intensity and length
scale were determined due to the same Reynolds number within a particular tower cross-section.
Negligible differences were noted among these three different dimensions such as 0.03C in
temperature, 0.01% in relative humidity, and 0.01m/s in outlet velocity and were considered to
be a result of computational uncertainties.

75
Air mass flow rate should be considered as a critical parameter. The performance of
PDEC towers varied significantly with air mass flow rate. Temperature drops achieved was
greater as the ambient wind speed decreased. Similarly, it was seen that a smaller wind catcher
thus a lower air mass flow rate produced greater temperature drops and relative humidity
increases within the same cross-sectional area of the tower. Differences in temperature and
relative humidity in tower configurations 1 through 4, which have four different sizes of wind
catcher at a particular tower cross-sectional area of 4m×4m, increased as ambient air speed
decreased.
The ratio of the wind catcher area to the tower cross-sectional area was seen to be an
important factor in the cooling performance of the PDEC tower. The air leaving the tower was
saturated in a number of cases. Saturation was observed in the cases where the air mass flow rate
was below approximately 10kg/s and the inlet velocity at the top of the PDEC tower was
generally below 1m/s. However, it appeared that lower values of the wind catcher to tower cross-
sectional area ratio caused saturation at high wind speeds.
For example, the area ratio between the wind catcher and the tower cross-sectional area
was 0.25 in configurations 4 and 8. The air in the configuration 8 was saturated at an ambient
wind speed of 5m/s with a corresponding inlet air velocity at the very top of PDEC tower of
1.25m/s. Saturation at a relatively high wind speed 2m/s and thus an inlet air velocity of 0.5m/s
was seen in configuration 4. To avoid saturation of air, it was necessary that, in general, the ratio
between wind catcher area and tower cross-sectional area maintained a certain value such as 0.5
and that the tower inlet velocity was between 1.25m/s and 0.75m/s for wider towers and between
1.5m/s and 1m/s for narrower towers.
Table 5.1 Combinations of sizes of wind catcher and tower
Configuration 1 2 3 4 5 6 7 8
Wind catcher size (m) 4×4 4×3 4×2 4×1 3×3 3×1.5 2×1 2×0.5
PDEC tower size (m) 4×4 4×4 4×4 4×4 3×3 3×3 2×2 2×2

76
Table 5.2 Air conditions at the exit under various combinations of wind catcher and tower
Configuration Vi (m/s) Vo (m/s) (kg/s) Te (C) RHe (%) Ve (m/s)
1 6 6 110.02 33.22 24.05 4.77
2 4.5 6 82.51 32.63 25.63 3.57
3 3 6 55.01 31.46 29.0 2.36
4 1.5 6 27.50 27.99 39.4 1.16
5 6 6 61.88 32.63 25.63 4.58
6 3 6 30.94 30.3 32.64 2.27
7 3 6 13.75 27.99 41.33 2.11
8 1.5 6 6.88 21.25 76.55 1.03
1 5 5 91.68 32.87 25.0 3.96
2 3.75 5 68.76 32.16 26.95 2.96
3 2.5 5 45.84 30.76 31.2 1.97
4 1.25 5 22.92 26.65 47.4 0.97
5 5 5 51.57 32.16 26.96 3.8
6 2.5 5 25.79 29.38 36.05 1.89
7 2.5 5 11.46 26.62 47.54 1.75
8 1.25 5 5.73 18.87 Saturated 0.97
1 4 4 73.34 32.34 26.4 3.16
2 3 4 55.01 31.46 29.03 2.35
3 2 4 36.67 29.75 34.8 1.55
4 1 4 18.34 24.65 57.6 0.76
5 4 4 41.26 31.46 29.04 3.04
6 2 4 20.63 28.0 41.4 1.55
7 2 4 9.17 24.6 57.75 1.39
8 1 4 4.58 18.87 Saturated 0.68
1 3 3 55.01 31.45 29.0 2.37
2 2.25 3 41.26 30.3 32.7 1.77
3 1.5 3 27.50 28.0 41.3 1.16
4 0.75 3 13.75 21.35 79.14 0.57
5 3 3 30.94 30.3 32.77 2.27
6 1.5 3 15.47 25.74 50.28 1.11
7 1.5 3 6.88 21.25 79.84 1.03
8 0.75 3 3.44 18.87 Saturated 0.5
m

77
Table 5.2 Air conditions at the exit under various combinations of wind catcher and tower
(con’t)
1 2 2 36.67 29.73 34.78 1.55
2 1.5 2 27.50 28.0 41.3 1.17
3 1 2 18.34 24.65 57.75 0.76
4 0.5 2 9.17 18.87 Saturated 0.38
5 2 2 20.63 28.0 41.42 1.49
6 1 2 10.31 21.3 79.4 0.73
7 1 2 4.58 18.87 Saturated 0.67
8 0.5 2 2.29 18.87 Saturated 0.32
1 1 1 18.34 24.64 57.73 0.77
2 0.75 1 13.75 21.35 79 0.57
3 0.5 1 9.17 18.87 Saturated 0.38
4 0.25 1 4.58 18.87 Saturated 0.18
5 1 1 10.31 21.3 79.47 0.73
6 0.5 1 5.16 18.87 Saturated 0.35
7 0.5 1 2.29 18.87 Saturated 0.32
8 0.25 1 1.15 18.87 Saturated 0.18
* i: tower inlet; o: outdoor; and e: tower exit
5.2.2 Tower height
The height of PDEC tower is known to be an important factor affecting the cooling
performance of a PDEC system. While some studies presented that this parameter did not have a
linear relationship with the cooling capacity (Kang and Strand, 2009; Pearlmutter et al., 1996),
previous studies did not provide enough guidance to assist in the proper design of the tower
height to achieve the best cooling output. It is thus necessary to investigate how this parameter
plays a role in the performance of the system. Different input conditions such as hot-humid and
hot-dry climates, various tower cross-sectional areas, and a range of wind speeds were employed.
Conditions imposed in this case study are given in Table 5.3 below. Tower heights were varied
between 3m to 14m with an interval of 1m. Table 5.4 shows the air conditions predicted at the
exit of the tower in four different situations.
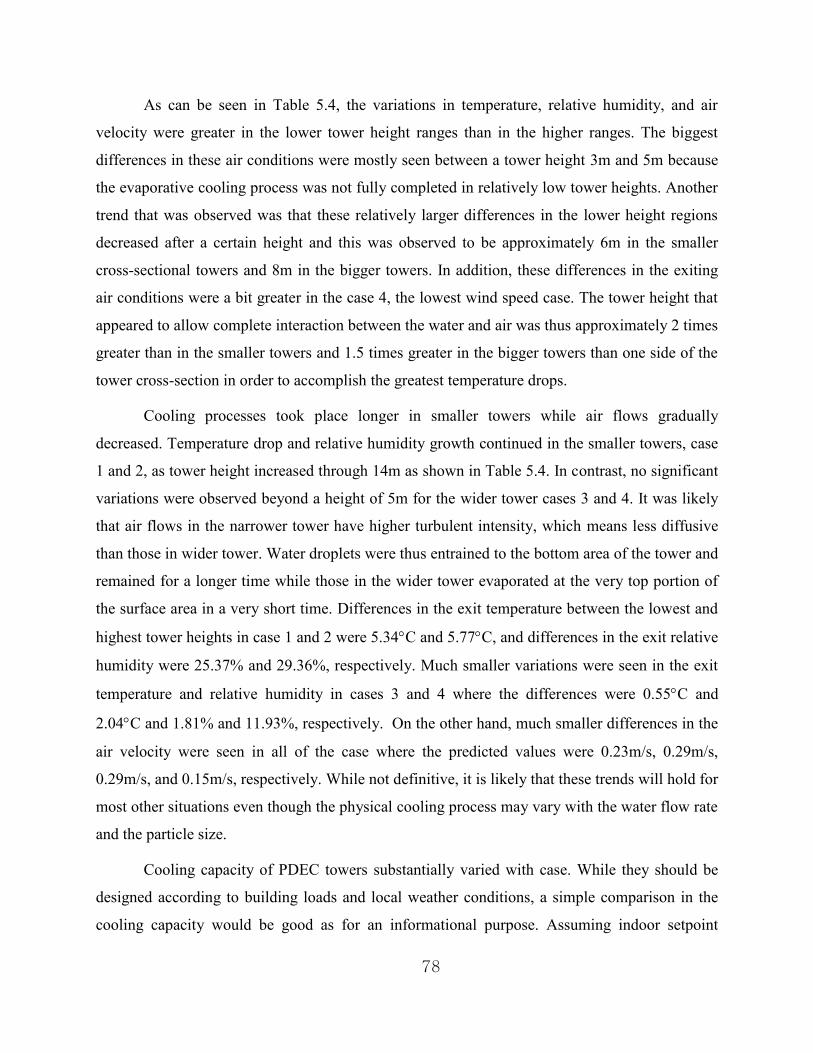
78
As can be seen in Table 5.4, the variations in temperature, relative humidity, and air
velocity were greater in the lower tower height ranges than in the higher ranges. The biggest
differences in these air conditions were mostly seen between a tower height 3m and 5m because
the evaporative cooling process was not fully completed in relatively low tower heights. Another
trend that was observed was that these relatively larger differences in the lower height regions
decreased after a certain height and this was observed to be approximately 6m in the smaller
cross-sectional towers and 8m in the bigger towers. In addition, these differences in the exiting
air conditions were a bit greater in the case 4, the lowest wind speed case. The tower height that
appeared to allow complete interaction between the water and air was thus approximately 2 times
greater than in the smaller towers and 1.5 times greater in the bigger towers than one side of the
tower cross-section in order to accomplish the greatest temperature drops.
Cooling processes took place longer in smaller towers while air flows gradually
decreased. Temperature drop and relative humidity growth continued in the smaller towers, case
1 and 2, as tower height increased through 14m as shown in Table 5.4. In contrast, no significant
variations were observed beyond a height of 5m for the wider tower cases 3 and 4. It was likely
that air flows in the narrower tower have higher turbulent intensity, which means less diffusive
than those in wider tower. Water droplets were thus entrained to the bottom area of the tower and
remained for a longer time while those in the wider tower evaporated at the very top portion of
the surface area in a very short time. Differences in the exit temperature between the lowest and
highest tower heights in case 1 and 2 were 5.34C and 5.77C, and differences in the exit relative
humidity were 25.37% and 29.36%, respectively. Much smaller variations were seen in the exit
temperature and relative humidity in cases 3 and 4 where the differences were 0.55C and
2.04C and 1.81% and 11.93%, respectively. On the other hand, much smaller differences in the
air velocity were seen in all of the case where the predicted values were 0.23m/s, 0.29m/s,
0.29m/s, and 0.15m/s, respectively. While not definitive, it is likely that these trends will hold for
most other situations even though the physical cooling process may vary with the water flow rate
and the particle size.
Cooling capacity of PDEC towers substantially varied with case. While they should be
designed according to building loads and local weather conditions, a simple comparison in the
cooling capacity would be good as for an informational purpose. Assuming indoor setpoint

79
temperature of 25C, both case 1 and 4 at the lowest temperatures were predicted to produce
approximately -61.8kW and -127kW, respectively, causing heating loads. In contrast, both case 3
and 5 at the lowest temperature were approximated to produce 40.4kW and 29.7kW, respectively.

80
Table 5.3 Conditions of variables for the analysis of tower height
Case Awc (m) At (m) Tdb (C) RHo (%) Vi (m/s) Vo (m/s) (kg/s) WF(l/h) D (㎛)
1 2.5 × 1.25 2.5 × 2.5 41.5 30 1.4 2.8 9.82 50 60
2 2.5 × 1.50 2.5 × 2.5 32.5 20 1.8 3.0 13.0 60 80
3 2.64 × 2.64 4.0 × 4.0 35.0 20 1.75 4.0 32.0 50 30
4 2.64 × 2.64 4.0 × 4.0 35.0 20 0.87 2.0 16.0 50 30
* t: tower; wc: wind catcher; db: dry bulb; i: tower inlet; o:outdoor air
Table 5.4 Air conditions at the tower outlets with variation of tower height in different
situations
H (m) Case 1 Case 2
Te (C) RHe (%) Ve (m/s) Te (C) RHe (%) Ve (m/s)
3 36.6 44.87 1.17 27.68 34.86 1.49
4 35.63 48.85 1.11 26.51 39.61 1.43
5 34.43 54.27 1.07 25.64 43.5 1.38
6 34.33 53.92 1.04 24.88 47.19 1.35
7 34.03 55.37 1.02 24.08 51.38 1.31
8 33.47 57.45 1.0 23.61 53.38 1.28
9 33.3 56.66 0.97 23.2 56.27 1.26
10 32.79 61.27 0.96 22.82 58.3 1.24
11 32.22 64.35 0.95 22.52 60.22 1.22
12 31.61 68.89 0.94 22.16 62.54 1.21
13 31.39 69.76 0.94 22.14 62.73 1.21
14 31.26 70.24 0.94 21.91 64.22 1.20
Case 3 Case 4
3 29.5 35.62 1.52 25.27 54.53 0.75
4 29.09 37.18 1.49 24.63 58.01 0.74
5 29.07 37.2 1.45 23.3 65.73 0.71
6 29.03 37.34 1.4 23.22 66.2 0.69
7 28.99 37.37 1.37 23.17 66.56 0.67
8 28.98 37.47 1.35 23.15 66.5 0.65
9 28.97 37.38 1.32 23.15 66.51 0.64
10 28.96 37.29 1.31 23.15 66.53 0.64
11 28.96 37.53 1.26 23.15 66.25 0.63
12 28.95 37.46 1.25 23.16 65.97 0.62
13 28.95 37.48 1.25 23.17 66.29 0.60
14 28.95 37.43 1.23 23.16 66.46 0.60
m
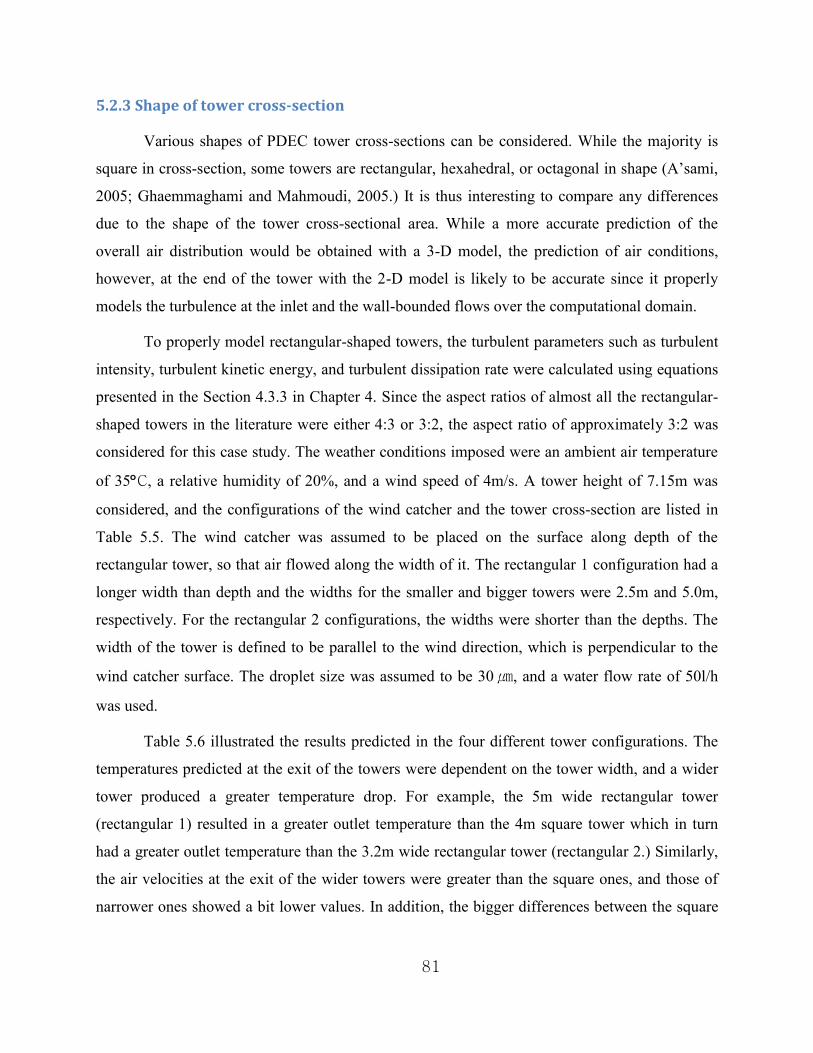
81
5.2.3 Shape of tower cross-section
Various shapes of PDEC tower cross-sections can be considered. While the majority is
square in cross-section, some towers are rectangular, hexahedral, or octagonal in shape (A’sami,
2005; Ghaemmaghami and Mahmoudi, 2005.) It is thus interesting to compare any differences
due to the shape of the tower cross-sectional area. While a more accurate prediction of the
overall air distribution would be obtained with a 3-D model, the prediction of air conditions,
however, at the end of the tower with the 2-D model is likely to be accurate since it properly
models the turbulence at the inlet and the wall-bounded flows over the computational domain.
To properly model rectangular-shaped towers, the turbulent parameters such as turbulent
intensity, turbulent kinetic energy, and turbulent dissipation rate were calculated using equations
presented in the Section 4.3.3 in Chapter 4. Since the aspect ratios of almost all the rectangular-
shaped towers in the literature were either 4:3 or 3:2, the aspect ratio of approximately 3:2 was
considered for this case study. The weather conditions imposed were an ambient air temperature
of 35C, a relative humidity of 20%, and a wind speed of 4m/s. A tower height of 7.15m was
considered, and the configurations of the wind catcher and the tower cross-section are listed in
Table 5.5. The wind catcher was assumed to be placed on the surface along depth of the
rectangular tower, so that air flowed along the width of it. The rectangular 1 configuration had a
longer width than depth and the widths for the smaller and bigger towers were 2.5m and 5.0m,
respectively. For the rectangular 2 configurations, the widths were shorter than the depths. The
width of the tower is defined to be parallel to the wind direction, which is perpendicular to the
wind catcher surface. The droplet size was assumed to be 30 ㎛, and a water flow rate of 50l/h
was used.
Table 5.6 illustrated the results predicted in the four different tower configurations. The
temperatures predicted at the exit of the towers were dependent on the tower width, and a wider
tower produced a greater temperature drop. For example, the 5m wide rectangular tower
(rectangular 1) resulted in a greater outlet temperature than the 4m square tower which in turn
had a greater outlet temperature than the 3.2m wide rectangular tower (rectangular 2.) Similarly,
the air velocities at the exit of the wider towers were greater than the square ones, and those of
narrower ones showed a bit lower values. In addition, the bigger differences between the square

82
and rectangular towers were observed in the lower mass cases, where the tower inlet velocity, Vi,
was 1m/s.
It was likely that the air conditions at the exit of rectangular towers were determined
along the length of the widths since fluid flows were characterized within the projected area on
the surface. While turbulent quantities differed from those of square towers, the characteristics of
the fluid flows, wall-bounded flows, and backflows were formed as similar to square towers
whose length of a side was equal to the width of rectangular tower. It can be said that rectangular
towers could be considered as a square tower with the same length as the side of rectangular one
in the same direction of incoming air flows.
Table 5.5 Configurations of PDEC tower for the analysis of tower cross-section shape
Square Rectangular 1 Rectangular 2 Vi
(m/s) Vo
(m/s) (kg/s)
At (m) Awc (m) At (m)* Awc (m) At (m)* Awc (m)
A 4 × 4 4 × 2 5 × 3.2 4 × 2 3.2 × 5 4 × 2 2 4 36.67
B 4 × 4 4 × 1 5 × 3.2 4 × 1 3.2 × 5 4 × 1 1 4 18.34
C 2 × 2 2 × 1 2.5 × 1.6 2 × 1 1.6 × 2.5 2 × 1 2 4 9.17
D 2 × 2 2 × 0.5 2.5 × 1.6 2 × 0.5 1.6 × 2.5 2 × 0.5 1 4 4.58
* Note that dimensions are listed as width by depth.
Table 5.6 Air conditions predicted in different tower configurations and shapes
Square Rectangular 1 Rectangular 2
Te (C) RHe (%) Ve (m/s) Te (C) RHe (%) Ve (m/s) Te (C) RHe (%) Ve (m/s)
A 29.75 34.8 1.55 30.76 31.23 1.62 28.42 37.71 1.51
B 24.65 57.6 0.76 26.67 47.23 0.8 22.13 72.14 0.74
C 24.6 57.75 1.39 26.63 45.21 1.45 22.06 69.56 1.34
D 18.87 Sat. 0.68 18.87 Sat. 0.71 18.87 Sat. 0.64
* sat.: saturated
m
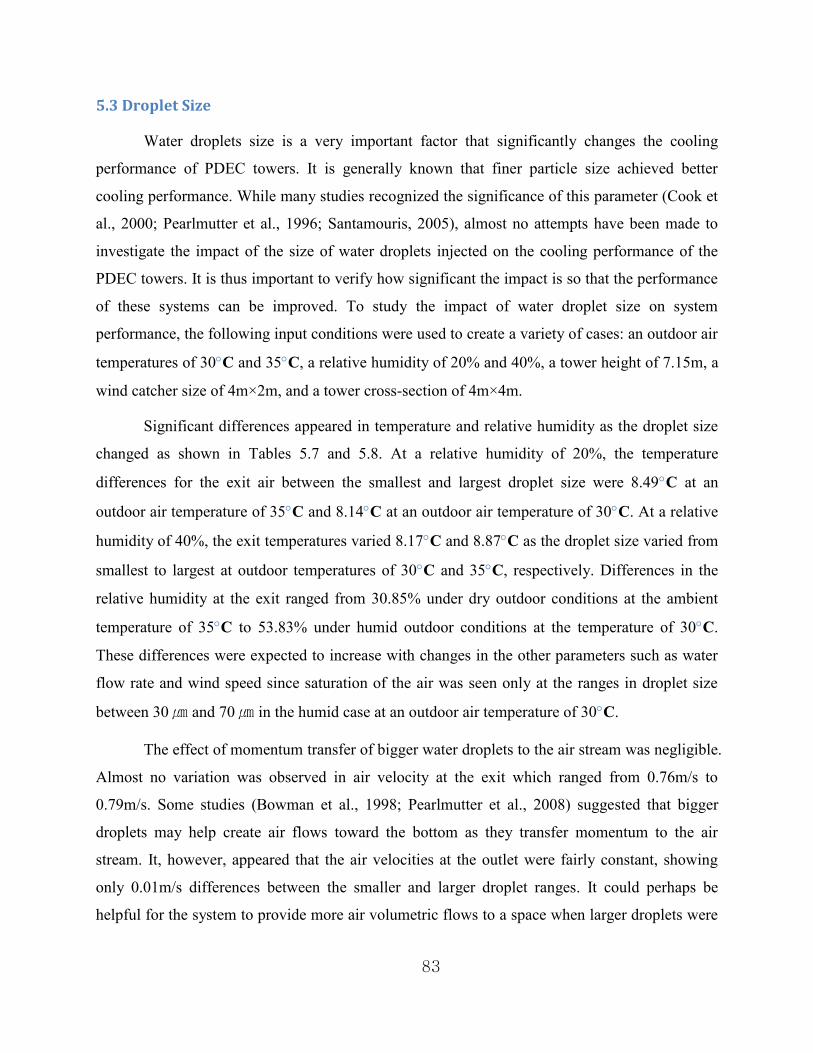
83
5.3 Droplet Size
Water droplets size is a very important factor that significantly changes the cooling
performance of PDEC towers. It is generally known that finer particle size achieved better
cooling performance. While many studies recognized the significance of this parameter (Cook et
al., 2000; Pearlmutter et al., 1996; Santamouris, 2005), almost no attempts have been made to
investigate the impact of the size of water droplets injected on the cooling performance of the
PDEC towers. It is thus important to verify how significant the impact is so that the performance
of these systems can be improved. To study the impact of water droplet size on system
performance, the following input conditions were used to create a variety of cases: an outdoor air
temperatures of 30C and 35C, a relative humidity of 20% and 40%, a tower height of 7.15m, a
wind catcher size of 4m×2m, and a tower cross-section of 4m×4m.
Significant differences appeared in temperature and relative humidity as the droplet size
changed as shown in Tables 5.7 and 5.8. At a relative humidity of 20%, the temperature
differences for the exit air between the smallest and largest droplet size were 8.49C at an
outdoor air temperature of 35C and 8.14C at an outdoor air temperature of 30C. At a relative
humidity of 40%, the exit temperatures varied 8.17C and 8.87C as the droplet size varied from
smallest to largest at outdoor temperatures of 30C and 35C, respectively. Differences in the
relative humidity at the exit ranged from 30.85% under dry outdoor conditions at the ambient
temperature of 35C to 53.83% under humid outdoor conditions at the temperature of 30C.
These differences were expected to increase with changes in the other parameters such as water
flow rate and wind speed since saturation of the air was seen only at the ranges in droplet size
between 30 ㎛ and 70 ㎛ in the humid case at an outdoor air temperature of 30C.
The effect of momentum transfer of bigger water droplets to the air stream was negligible.
Almost no variation was observed in air velocity at the exit which ranged from 0.76m/s to
0.79m/s. Some studies (Bowman et al., 1998; Pearlmutter et al., 2008) suggested that bigger
droplets may help create air flows toward the bottom as they transfer momentum to the air
stream. It, however, appeared that the air velocities at the outlet were fairly constant, showing
only 0.01m/s differences between the smaller and larger droplet ranges. It could perhaps be
helpful for the system to provide more air volumetric flows to a space when larger droplets were

84
injected with a large water flow rate. The sizes of droplets, however, did not have a considerable
effect on the air flow rates within a range of general use of PDEC systems represented in these
case studies.
It can be seen from the data that smaller droplets generally produced larger temperature
drops and increased relative humidity. One tendency in the data was that the performance of the
system began to drop off (an increase in the exit temperature was noted) when the droplet size
was increased beyond approximately 100 ㎛. In addition, it was noted that finer droplets below
approximately 30 ㎛ were inefficient since the cooling process was completed at the very top of
the tower and no further interaction took place over the remaining height of the tower. As a result,
it is recommended that the droplet size be between 30 ㎛ and 100 ㎛ in order to minimize the use
of water while achieving the best performance.

85
Table 5.7 Air conditions along the variation of water droplet sizes at ambient air
temperature of 35C
D (㎛) RHo 20% RHo 40%
Te (C) RHe (%) Ve (m/s) Te (C) RHe (%) Ve (m/s)
10 25.1 55.18 0.77 27.28 76.27 0.76
20 24.72 57.3 0.77 26.45 83.98 0.78
30 24.65 57.75 0.76 26.13 86.86 0.77
50 24.63 57.78 0.77 26.15 86.43 0.77
70 24.6 58 0.77 27.06 79.94 0.78
80 24.61 57.88 0.77 27.48 76.88 0.78
90 24.59 58 0.77 28.2 72 0.78
100 24.61 57.95 0.77 28.7 69.4 0.78
110 24.67 57.68 0.77 29.18 66.56 0.78
125 24.95 56.18 0.77 29.84 62.85 0.78
150 25.67 52.45 0.77 31.02 56.83 0.78
175 26.77 46.97 0.77 32.17 50.77 0.78
200 27.86 42.33 0.78 32.6 49 0.78
225 28.68 39.08 0.78 32.94 47.6 0.78
250 29.49 35.8 0.78 33.24 46.4 0.78
275 30.16 33.36 0.78 33.43 45.79 0.78
300 30.75 31.26 0.78 33.64 44.78 0.78
325 31.21 29.84 0.78 33.79 44.24 0.79
350 31.65 28.41 0.78 33.89 43.8 0.79
375 31.99 27.44 0.78 34.02 43.37 0.78
400 32.25 26.6 0.78 34.1 43.1 0.78
450 32.75 25.2 0.79 34.22 42.66 0.78
500 33.08 24.33 0.78 34.3 42.3 0.78

86
Table 5.8 Air conditions along the variation of water droplet sizes at ambient air
temperature of 30C
D (㎛) RHo 20% RHo 40%
Te (C) RHe (%) Ve (m/s) Te (C) RHe (%) Ve (m/s)
10 20.37 61.38 0.77 20.24 98.14 0.77
20 19.91 64.53 0.77 20.07 Saturated 0.77
30 19.82 65.18 0.77 20.07 Saturated 0.77
50 19.79 65.38 0.77 20.07 Saturated 0.77
70 19.81 65 0.77 20.07 Saturated 0.77
80 19.79 65.4 0.77 20.08 99.59 0.77
90 19.76 65.57 0.77 20.32 97.47 0.77
100 19.8 65.37 0.77 20.7 94.28 0.77
110 19.78 65.26 0.77 21.28 89.36 0.78
125 19.78 65.64 0.77 22.02 83.64 0.78
150 20.15 63.03 0.77 23.2 74.98 0.78
175 21.1 57.5 0.78 24.2 68.62 0.78
200 22.04 51.68 0.77 25 63.72 0.78
225 23.03 46.27 0.78 25.8 59.05 0.78
250 23.74 42.88 0.77 26.3 56.39 0.78
275 24.53 39.19 0.78 26.8 53.7 0.78
300 25.2 36.22 0.77 27.27 51.43 0.78
325 25.66 34.23 0.78 27.58 49.9 0.78
350 26.21 31.79 0.77 27.85 48.62 0.78
375 26.6 30.64 0.78 28.09 47.48 0.78
400 26.97 29.16 0.78 28.3 46.53 0.78
450 27.49 27.39 0.78 28.59 45.28 0.79
500 27.9 26 0.77 28.82 44.31 0.78

87
5.4 Water Flow Rate
The water flow rate injected into a PDEC tower is a key variable, and it has been utilized
to control the performance of the system. It is also important in that it determines the level of
humidity of the air to be delivered to a space. A tendency for PDEC systems to use a large
amount of water has been mentioned in the literature in order to achieve the best cooling
performance. To date, there have not been enough studies on the efficient use of water, and many
studies have mentioned that a large amount of water usage is a potential disadvantage of this
particular system. It is thus necessary to present how this parameter works, so that a method for
the effective use of water to accomplish the best performance can be demonstrated.
A significant variation in the exit air conditions as the water flow rates were changed
appeared in the results. Table 5.9 shows the conditions for the three different cases, and the
results of predictions in these three cases are shown in Table 5.10. In case 1 with an outdoor
wind speed of 4m/s, the average variation of exit temperatures as the water flow rate increased
was nearly constant at approximately 0.58C per 5l/h increase in water flow rate. It increased at
approximately double that rate in case 2 where the ambient wind speed was 2m/s, while the case
3 with the highest wind speed of 6m/s and a smaller wind catcher attached to a large tower
showed an approximately 0.89C per 5l/h increase in water flow rate. The relative humidity with
each 5l/h increase in water flow rate showed a rise of 3.16% at the first interval of water flow
rate between 5l/h and 10l/h and gradually increased up to 3.55% at the very last interval between
95l/h and 100l/h. These increases in case 2 were 3.18% through 9.66%. The lowest and greatest
increases in case 3, where the inlet air velocity was similar to the case 1, were 2.29% and 7.88%.
On the other hand, the air velocity at the exit showed very little reduction with the rise in water
flow rate.
Table 5.9 Conditions of variables for the analysis of water flow rate
Case Awc (m) At (m) Tdb (C) RHo (%) Vi
(m/s) Vo
(m/s) (kg/s)
D
(㎛) H (m)
1 2.64 × 2.64 4.0 × 4.0 35.0 20 1.75 4.0 32.0 30 7.15
2 2.64 × 2.64 4.0 × 4.0 35.0 20 0.87 2.0 16.0 30 7.15
3 4.0 × 1.0 4.0 × 4.0 35.0 20 1.5 6.0 27.5 30 7.15
m

88
Table 5.10 Air conditions at the tower exit in three different situations
WF (l/h)
Case 1 Case 2 Case 3
Te (C) RHe (%) Ve (m/s) Te (C) RHe (%) Ve (m/s) Te (C) RHe (%) Ve (m/s)
5 34.27 21.23 1.38 33.59 22.83 0.68 33.91 22.14 1.5
10 34.74 22.72 1.38 32.42 26.01 0.68 33.0 24.43 1.5
15 33.1 24.25 1.38 31.25 29.47 0.68 32.08 26.99 1.5
20 32.52 25.88 1.38 30.08 33.18 0.68 31.17 29.75 1.5
25 31.92 27.53 1.37 28.94 37.48 0.68 30.26 32.85 1.5
30 31.33 29.19 1.37 27.77 41.55 0.68 29.35 36.0 1.5
35 30.74 31.12 1.36 26.62 47.44 0.68 28.44 39.47 1.5
40 30.15 33.21 1.37 25.46 53.27 0.68 27.54 43.04 1.5
45 29.57 35.24 1.37 24.31 59.25 0.67 26.64 47.47 1.5
50 29.0 37.49 1.37 23.16 66.57 0.67 25.72 51.79 1.5
55 28.41 39.76 1.37 22.03 74.22 0.67 24.84 56.63 1.5
60 27.83 42.18 1.37 20.87 82.81 0.67 23.94 61.61 1.5
65 27.24 44.71 1.36 19.72 92.27 0.67 23.04 67.31 1.5
70 26.66 47.38 1.36 18.6 Saturated 0.66 22.14 73.3 1.5
Water flow rate is a key parameter for determining the PDEC system performance in a
hot-dry climate. Various conditions such as different tower size and conditions of the air as well
as water were employed to investigate the impact of water flow rate on the overall performance
of the system. The conditions imposed are shown in Table 5.11, and the air conditions predicted
are shown in Table 5.12. In hot dry conditions, case 2 and 3, larger temperature drops through
the PDEC system were noted in comparison with the moderate weather conditions in the other
cases. Average temperature drops of 1.06C and 2.76C were observed in cases 2 and 3,
respectively, as the water flow rate increased by 10l/h while the average temperature drops were
0.69C and 1.69C for cases 1 and 4, respectively. The increase in water flow rate in hot-dry
climate was thus more effective than for the moderate air conditions at the relative humidity of
30% under different tower and water conditions. In addition, the variations of the exit air
velocity were a bit larger for the smaller tower configurations in cases 3 and 4 than the bigger
ones due to larger air resistance and thus smaller diffusivity in the smaller towers. These
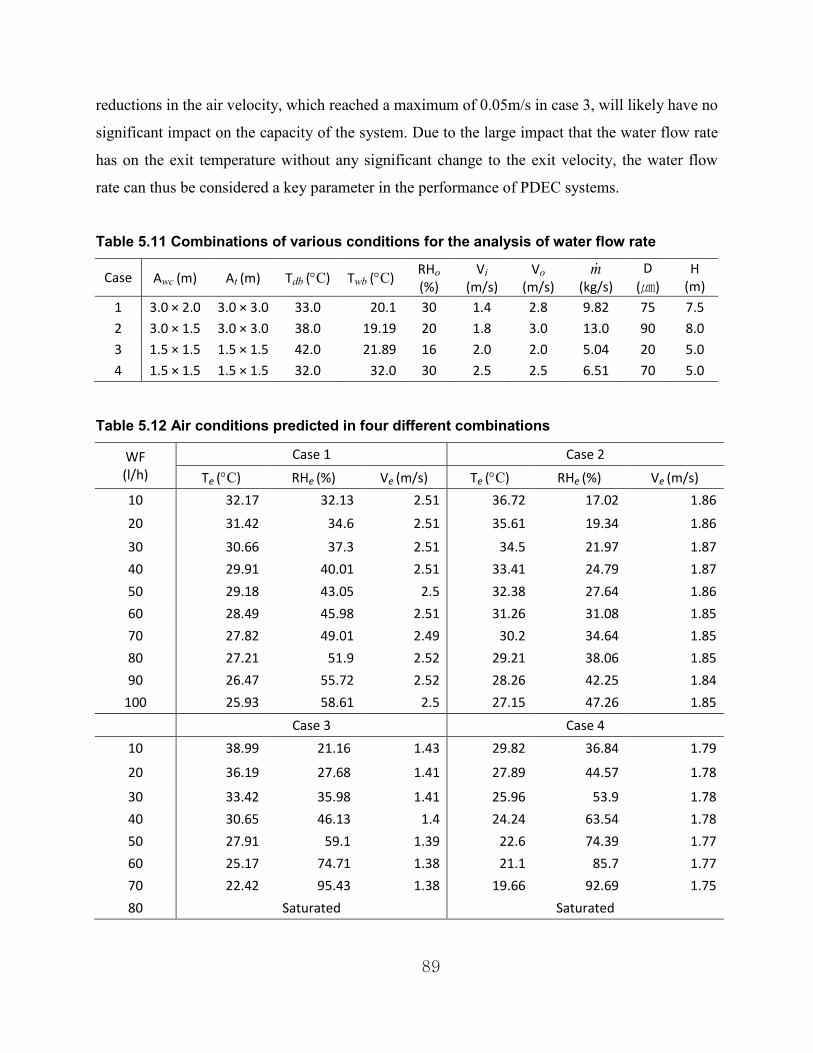
89
reductions in the air velocity, which reached a maximum of 0.05m/s in case 3, will likely have no
significant impact on the capacity of the system. Due to the large impact that the water flow rate
has on the exit temperature without any significant change to the exit velocity, the water flow
rate can thus be considered a key parameter in the performance of PDEC systems.
Table 5.11 Combinations of various conditions for the analysis of water flow rate
Case Awc (m) At (m) Tdb (C) Twb (C) RHo (%)
Vi
(m/s) Vo
(m/s) (kg/s)
D
(㎛) H
(m)
1 3.0 × 2.0 3.0 × 3.0 33.0 20.1 30 1.4 2.8 9.82 75 7.5
2 3.0 × 1.5 3.0 × 3.0 38.0 19.19 20 1.8 3.0 13.0 90 8.0
3 1.5 × 1.5 1.5 × 1.5 42.0 21.89 16 2.0 2.0 5.04 20 5.0
4 1.5 × 1.5 1.5 × 1.5 32.0 32.0 30 2.5 2.5 6.51 70 5.0
Table 5.12 Air conditions predicted in four different combinations
WF (l/h)
Case 1 Case 2
Te (C) RHe (%) Ve (m/s) Te (C) RHe (%) Ve (m/s)
10 32.17 32.13 2.51 36.72 17.02 1.86
20 31.42 34.6 2.51 35.61 19.34 1.86
30 30.66 37.3 2.51 34.5 21.97 1.87
40 29.91 40.01 2.51 33.41 24.79 1.87
50 29.18 43.05 2.5 32.38 27.64 1.86
60 28.49 45.98 2.51 31.26 31.08 1.85
70 27.82 49.01 2.49 30.2 34.64 1.85
80 27.21 51.9 2.52 29.21 38.06 1.85
90 26.47 55.72 2.52 28.26 42.25 1.84
100 25.93 58.61 2.5 27.15 47.26 1.85
Case 3 Case 4
10 38.99 21.16 1.43 29.82 36.84 1.79
20 36.19 27.68 1.41 27.89 44.57 1.78
30 33.42 35.98 1.41 25.96 53.9 1.78
40 30.65 46.13 1.4 24.24 63.54 1.78
50 27.91 59.1 1.39 22.6 74.39 1.77
60 25.17 74.71 1.38 21.1 85.7 1.77
70 22.42 95.43 1.38 19.66 92.69 1.75
80 Saturated Saturated
m

90
Careful design of PDEC systems and control of the water flow rate is necessary for the
effective use of water. This means that the water flow rate must be controlled to maximum the
output of the system while not wasting water. Water would be wasted in a situation where more
water was introduced into the system than was required to achieve saturated conditions at the
exit. The water flow rates that led to the saturation of the exiting air in various situations are
given in Table 5.13. Various tower configurations and air conditions in a range of droplet sizes
between 30 and 90 were applied to investigate what water flow rate caused the air to be saturated
in these various situations. The air at the exit was either saturated or about to be saturated at the
water flow rate of 50l/h in case 1 and 6 and 70l/h in case 4, where the tower inlet velocities were
set to be below 1m/s and hot-dry conditions with the smaller ratio of wind catcher area to tower
area were imposed. On the other hand, medium sized towers with a high wind speed condition,
namely cases 2, 3, and 5, required a high water flow rate such as 175l/h, 120l/h, and 200l/h,
respectively, to achieve saturated conditions at the exit due to the high wind speed is these cases.
In addition, the air through smaller towers at moderate wind speed such as 1.5m/s and 2.5m/s
were saturated at the condition of the water flow rate of 75l/h in case 7 and 55l/h in case 8. The
design of water flow rate, therefore, must consider other parameters such as tower configuration
in conjunction with air mass flow rate at a specific range of droplet sizes to avoid saturation and
thus minimize inefficient water use.
Table 5.13 Demand for water flow rate in various situations
Case
At (m) Awc (m) H
(m) Tdb
(C) RHo (%)
Vi
(m/s) Vo
(m/s) (kg/s) WF (l/h)
D
(㎛) Te
(C)
RHe
(%)
1 4.0 × 4.0 4.0 × 1.0 7.15 35 20 0.63 2.5 11.46 50 30 18.9 99.73
2 3.0 × 3.0 3.0 × 1.5 6.5 30.4 14 3.0 6.0 31.21 175 60 14.5 Sat
3 3.0 × 3.0 3.0 × 1.0 6.5 30.4 14 2.0 6.0 20.81 120 80 14.5 Sat
4 3.6 × 3.6 3.6 × 1.0 8.0 36.6 18 0.92 3.3 13.54 70 90 19.1 Sat
5 3.0 × 3.0 3.0 × 1.5 8.0 38 15 2.5 5.0 25.54 200 90 19.23 99.03
6 2.5 × 1.6 2.0 × 0.5 7.15 35 20 1.0 4.0 4.58 50 30 18.87 Sat
7 1.5 × 1.5 1.5 × 1.5 4.0 37 27 2.5 2.5 6.40 75 50 22.14 Sat
8 1.5 × 1.5 1.5 × 1.5 6.0 38.6 12 1.5 1.5 3.82 55 80 18.61 99.65
m

91
5.5 Summary
A number of case studies have been performed to understand the physical phenomena
that occur in the effective area of PDEC towers as well as the impact of various parameters on
the cooling performance of these devices. While some parameters such as wind speed, tower
height, water flow rate, and droplet size significantly alter the exit air conditions of the system,
thus indicating a strong impact on the performance of PDEC towers, the ratio of wind catcher
area to tower cross-sectional area was an important factor that should be included in PDEC tower
modeling. In addition, the effective tower height that could complete evaporative cooling
performance within the tower area would be approximately 2 times greater than the length of the
tower cross-sectional area. Furthermore, droplet sizes between 30 and 100 would be the one that
could be used in most of PDEC design conditions. Likewise, water flow rate is a very strong
impact to the performance of PDEC towers, and must be properly designed with consideration of
other parameters to overcome one of the disadvantages of these systems, i.e., large quantity of
water use.
In summary, the cooling performance of PDEC systems are determined not by a single
strong factor, but by various factors such as tower configurations, water flow rates, and droplet
sizes. A vigilant design process is therefore required for a successful integration of this particular
system in the cooling of buildings. Based on these findings, a regression analysis to find
appropriate relation between the performance of PDEC towers and all critical parameters defined
in this chapter will be performed in the following chapter. As a result, mathematical models that
accounts for PDEC air conditions will be developed.

92
List of References
A’sami, A. “Badgir in traditional Iranian architecture.” International Conference “Passive and
Low Energy Cooling for the Built Environment, May 2005, Santorini, Greece, (2005): 1021-
1026.
Bowman, N. T. et al. "The application of Passive Downdraught Evaporative Cooling (PDEC) to
non-domestic buildings.” Institute of Energy and Sustainable Development De Montfort
University, UK. Final Publishable Report. 1996-1998.
Cook, M. J., Robinson, D., Lomas, K. J., Bowman, N. T., and Eppel. H. "Passive Downdraught
Evaporative Cooling: II. Airflow Modelling." Indoor + built environment 9.6 (2000):325-334.
FLUENT, User’s Guide 6.3, Fluent Inc., USA
Ghaemmaghami, P. S., and Mahmoudi, M. “Wind tower a natural cooling system in Iranian
traditional architecture.” International Conference “Passive and Low Energy Cooling for the
Built Environment, May 2005, Santorini, Greece, (2005): 71-76.
Ghirelli, Federico, and Leckner, Bo. “Transport equation for the local residence time of a fluid.”
Chemical Engineering Science 59 (2004): 513 – 523.
Kang, Daeho, and Strand, Richard K. “Simulation of passive down-draught evaporative cooling
(PDEC) systems in EnergyPlus.” Conference Proceedings of Building Simulation 2009, Glasgow,
Scotland, 2009.
Krause, Egon, Oertel, Herbert. “Boundary-Layer Theory.” Springer, 2000.
Pearlmutter, D., Erell, E., Etzion, Y., Meir, I. A., and Di, H. "Refining the use of evaporation in
an experimental down-draft cool tower." Energy and buildings 23.3 (1996):191-197.
Pearlmutter, David., Erell, Evyatar, and Etzion, Yair. "A multi-stage down-draft evaporative cool
tower for semi-enclosed spaces: Experiments with a water spraying system." Solar energy 82.5
(2008):430-440.
Santamouris, M. “Passive cooling of building.” Advances of solar energy series 16, American
Society of Solar Energy, 2005.

93
CHAPTER 6: REGRESSION ANALYSIS FOR MATHEMATICAL MODELS
6.1 Overview
Regression analysis, in general, is widely used to explain the relationship between
dependent variables and independent variables, creating mathematical forms of equations. These
mathematical models are then used to determine the applicability as well as the performance of
various types of environmental control systems in buildings during the decision-making process.
In addition, these mathematical models are critical when a detail analysis is needed on impacts of
a technology or system to energy performance, indoor environment, cost-effectiveness, and
environmental factors such as pollution production. They are often implemented in energy
simulation software so that overall performance of those systems and their impact on the built
environment in many situations can be accurately modeled within a reasonable computational
cost while some other methodologies such as CFD analysis cannot achieve due to time
constraints. To date, there have been a number of mathematical models that have the ability to
predict the performance of PDEC towers. However, they are mostly limited to models that are
based on the efficiency of the wet-bulb depression. In reality, the cooling output of PDEC towers
can vary substantially with a number of parameters such as the weather conditions, physical
tower size and dimensions, and the water conditions, as shown in the previous chapter. A new
mathematical model that includes relationships between such parameters and the performance of
PDEC towers is thus critical to accurately model the impact of these parameters on the output of
these systems.
The mathematical model should also include the impact of a PDEC tower on the interior
environment as well. PDEC towers alter the indoor environment depending on their capacity,
affecting both the humidity level and the overall ventilation strategy. They thus improve the
indoor environmental quality in a space by raising the thermal comfort of the occupants and
positively impacting indoor air quality via increased outdoor air quantities. To date, almost all
mathematical models in the literature are only capable of predicting the exit temperature of the
air, assuming a certain value of the efficiency of the wet-bulb depression. As a result, the actual
impact of PDEC systems on the built environment cannot be properly or fully evaluated. The one
exception is Givoni’s mathematical model that includes the influence of water flow rate and

94
predicts the temperature and humidity level of the exit air based on an adiabatic cooling process,
which satisfies the law of conservation of energy. This model, however, is limited to a very
narrow range of weather conditions and small-sized towers with no consideration of the effect of
the tower configuration and the droplet sizes. Thus, in order to accurately model PDEC towers
and considering the strong dependence of the performance of PDEC towers on all of these
variables, a model should include the influence of these main factors for the accurate predictions
of the cooling performance of PDEC towers. A mathematical model is critical so that
correlations between main parameters and air conditions at the exit of PDEC towers can be
adequately described and is also necessary to properly evaluate the potential impact of PDEC
towers on building performance.
6.2 Methods and Sampling
Figure 6.1 shows the overall approach of the regression analysis. Since one of main goals
of this study is to extend the applicability PDEC systems, wide range of weather conditions were
considered as shown in Figure 6.2. In addition, five main parameters, which were defined as a
critical factor significantly affecting the performance of PDEC towers, were included, and
intervals for each parameter were determined based on the computational analysis. In the
preliminary sampling process, CFD simulations were run for every single sample, which means
that the total number of CFD runs was the same as the number of samples. A correlation analysis
was then followed to determine independent variables, which will be included in the
mathematical models. Once these processes were completed, efforts were made to find
appropriate relation between individual variables and dependent variables, which can explain the
relation the best. Intervals and numbers of samples were then added as needed in the calibration
process depending on differences between individual sample and predictions of the regression
model. These processes were then repeated until the calibration process has no impact to the
regression model, which will be considered as the final mathematical models.
Two dependent variables, temperature and air velocity, were considered while remainder
of the main parameters defined in this study were included as independent variables. The
sensible cooling capacity of any PDEC system can be determined when the mass flow rate of air
and temperature difference between the air exiting the PDEC tower and the space being

95
conditioned are known. The humidity level of the air should also be known since it affects the
thermal environment of the space. These air conditions such as temperature, relative humidity,
and velocity must be known in order to determine the cooling output of the systems. The relative
humidity, however, can be found from the air temperature since the evaporative cooling process
in PDEC towers is generally considered an adiabatic process. Multiple regression analyses for
temperature and velocity were thus necessary, so that two different regression equations for
predicting these two dependent variables were obtained.
Wide ranges of samples in ambient air conditions, tower configurations, and water
conditions were collected using CFD simulations. While PDEC systems have a strong
dependency on the outdoor weather conditions and seem to be best suited for hot-arid climates,
other climate regions were included in this study in order to extend the applicability of this
particular type of systems to more buildings. Six different climates were thus considered as
illustrated in Table 6.1 below, and the influence of the five main parameters under all of these
climatic conditions were included as shown in Figure 6.2.
The ranges of the five main variables were:
Droplet size was varied from 20 ㎛ to 500 ㎛, with intervals of 20 ㎛ from the
minimum size through 200 ㎛ and intervals of 50 ㎛ between 200 ㎛ and 500 ㎛
Water flow rate was varied from 5l/h to 200l/h, with intervals of l0 l/h between 10l/h
and 100l/h and intervals of 20l/h between 100l/h and 200l/h
Ambient wind speed was varied from 0.5m/s to 8m/s with intervals of 0.5m/s
Tower height was varied from 3m to 14m with intervals of 1m
Various sized tower configurations were also investigated. Two different tower
cross-sections and the ratios of wind catcher area to tower cross-sectional area were
employed in each-sized tower. The ratios of wind catcher to tower cross-section
were 0.75 to 0.25 for the large tower, 1.0 to 0.5 for the medium tower, and 1.0 to
0.75 for the small tower.
Based on the variation of parameters described above, the minimum number of samples
collected in the preliminary sampling process was thus 426. In addition to these samples, 412
samples created during the parametric analysis described in the previous chapter were also

96
utilized. Thus, the total number of samples used during this preliminary sampling process was
838.
A systematic approach was necessary to minimize computational time since the
computational model predicts dependent variables of individual sample. In fact, a CFD
simulation needed its own computational time as well as pre- and post-processing of data, which
costs a lot of time. A careful approach to minimize time constraints was thus necessary. Once the
preliminary data sets were produced, a correlation analysis using general purpose statistical
software Minitab 16 was performed in order to determine the impact of the independent variables
on the dependent variable, i.e. temperature and velocity. With these samples and independent
variables, efforts were made to find an appropriate relationship between the dependent and the
independent variables. Once a relationship was found to be effective, a simple model was
obtained. A calibration process using a forward selection method, which adds samples to the
basic samples until no significant variations were found, was used. The impact of each
independent variable was determined by monitoring the differences in each dependent variable
between the preliminary CFD samples and regression model predictions. In this process, the
sampling process was continued over the ranges or intervals for the different independent
variables, and differences were monitored until additional of samples did not improve the
coefficient of determination, R2, value as well as the significance probability of the regression
coefficient, P-value. The regression equations obtained were then considered as the final
mathematical models when the calibration process showed no impact on these statistical values.
The significance probability of each regression coefficient for the independent variables obtained
from the regression analysis was then reviewed to verify the decisions made regarding the
independent variables.
Table 6.1 Climatic classification for the purpose of regression analysis
Climates Temperature (C) Relative Humidity (%)
Max Min Max Min
Hot-dry 42 36
30 10 Hot-humid 50 30
Warm-dry 36 32
30 15
Warm-humid 50 30
Moderate-dry 32 28
30 15
Moderate-Humid 60 30

97
Figure 6.1 Schematic of the overall approach to regression analysis
Figure 6.2 Diagram of preliminary sampling method

98
6.3 Multiple Linear Regression
6.3.1 Correlation analysis
A correlation analysis determined the independent variables for regression analyses. It
was expected that the correlation between each dependent variable and independent variables
would be considerably different. This was because a number of independent variables were
involved, and each individual independent variable has a different relationship to the dependent
variables, i.e. temperature and velocity. For instance, ambient wind speed has a strong second-
order polynomial relationship to both the temperature and the relative humidity while the water
flow rate has a robust inverse relationship to temperature and a linear relationship to relative
humidity. In addition, the tower height has a weak inverse relationship to temperature, and the
droplet size has a weak linear relation to temperature. The Pearson correlation coefficients,
which typically are used to explain correlations between variables, were thus only considered as
reference values in this study. Instead, the main parameters defined as key parameters shown in
Table 6.2 below were considered as the independent variables when they have a significance
probability at the level of 5%, determined by P-value of less than 0.05. Those independent
variables were then included in the regression analysis for the dependent variables.
All variables considered were included in the multiple regression analysis for exit
temperature. The correlations of each independent variable with temperature were different as
shown in Table 6.2. A statistical index that explains the significance between two variables
called Pearson Correlation Coefficient (PCC) was employed to determine individual independent
variable. This index distributed from -1.0 to 1.0, and indicates -1.0 as perfect negative correlation,
1.0 as perfect positive correlation, and zero as no correlation. The highest PCC corresponding to
temperature were displayed by the outdoor wet-bulb temperature at 0.531 and the outdoor dry-
bulb temperature at 0.568. It was also found that the droplet size and the water flow rate also
showed considerable correlation with the dependent variable temperature. Based on the PCC
values for the other independent variables, mass flow rate, wind speed, tower inlet velocity, and
tower height were found to have fairly low correlation with temperature. On the other hand, the
P-values for all variables considered were found to be zero, which statistically means no
probability of saying both variables have no relation. The multiple regression analysis for
temperature will thus include all eight independent variables.

99
Three variables will be excluded in the regression analysis for velocity. A robust
correlation and significance between outlet velocity predicted and incoming air velocities was
observed. The Pearson correlation coefficient of tower inlet velocity was given as 0.996, which
showed an excellent correlation with outlet velocity at the exit. A high value of the coefficient
0.732 was also seen for the outdoor wind speed. The coefficients for mass flow rate and tower
height were 0.398 and -0.421, respectively. These values show the importance of these two
parameters on exit velocity and were greater than those determined for temperature. On the other
hand, very low correlations with velocity for the other variables such as droplet sizes and wet-
and dry-bulb temperatures were found. The significance probability of these three variables was
also higher than the others. These three independent variables were thus excluded in the
regression analysis for velocity even though the P-value for wet-bulb temperature was within the
significance probability (less than 5%). In fact, the regression model that included wet-bulb
temperature had almost no impact to the two dependent variables. Minimum number of
independent variable is likely to improve useability. This field was thus not considered as an
independent variable. Consequently, five independent variables (tower inlet velocity, wind speed,
air mass flow rate, water flow rate, and tower height) were included in the regression analysis for
velocity as independent variables.
Table 6.2 Correlation indexes between each independent variable and dependent
variables
Independent variables
Temperature Velocity
PCC P-value PCC P-value
Vi 0.208 0.0 0.996 0.0
Vo 0.118 0.0 0.732 0.0
0.096 0.0 0.398 0.0
WF -0.286 0.0 0.293 0.0
D 0.338 0.0 0.018 0.704
H -0.107 0.0 -0.421 0.0
Tdb 0.531 0.0 -0.041 0.386
Twb 0.568 0.0 -0.104 0.026
* i: tower inlet; o: outdoor; db: dry bulb; wb: wet bulb, and PCC: Pearson Correlation Coefficient
m

100
6.3.2 Regression analysis for temperature
A weak linear relation with temperature was displayed in the preliminary samples. As
described in the previous section, 838 samples were considered to find the appropriate
relationship between the dependent variables exit temperature and velocity and the independent
variables obtained during the correlation analysis. Various regression types, provided by the
statistical software Minitab 16, were considered, and no acceptable correlations except a linear
type were found. An regression analysis for polynomial, exponential, and logarithmic required
tremendous relationships expended a considerable amount of computing resources in an attempt
to find a correlation (up to 48 hours in some cases) since individual independent variable have
different relationships with the dependent variable, resulting of no relevant correlations in these
regression types. Only the linear regression type showed a reasonable relationship, resulting
coefficient of determination R2 of 0.62 and a significance probability P-value of zero for the
constant and the other regression coefficients regarding independent variables. While the
independent variables included were considered appropriate, further numerical samples were
necessary to demonstrate whether the relationships were truly appropriate.
Additional samples using forward selection were performed so that a reasonable numbers
of data sets can be determined. The forward selection method is to add samples to the model, and
then to see how it works with the model, which does not need a perfect set of data for the
analysis. This approach was necessary to reduce computational efforts since each sample
required a separate run of the computational model. A certain level of accuracy, however, should
be maintained. To satisfy these goals, the two dependent variables, temperature and velocity as
well as relative humidity, of the basic samples were compared with the predictions from the
linear regression equation obtained by the preliminary samples. Initially, considerable
differences between the two calculation methods appeared in certain situations such as high wind
speed, humid climatic conditions, bigger droplet sizes, lower water flow rates, and cases where
the exit conditions were saturated. Samples were thus randomly added in these particular ranges
to decrease such differences and thus improve statistical performance of the mathematical model.
For instance, such differences were fairly large in the range of larger droplet sizes since the
interval in this region was 50 ㎛. Thus, additional samples with smaller intervals were produced.
In addition, it was noted that some of these conditions that showed larger differences such as

101
larger droplet sizes, very high of low water flow rates, and high wind speed were not necessarily
desirable design conditions for PDEC towers, so that many samples collected in this process
were within a certain range such as droplet sizes between 30 ㎛ and 150 ㎛, water flow rate
between 10l/h and 200l/h, tower height from 4m to 10m, the ratio of wind catcher area to tower
cross-section between 0.75 and 0.25, and ambient wind speed as high as 6m/s and as low as 1m/s.
The preliminary linear equation weakly explained the linear relationship between the
response variable, temperature, and the regressors, or independent variables, which means that
approximately 38% of the samples for temperature were considered as they have no relation with
the dependent variables. Forward selection sampling continued until these additional sampling
did not affect the value of coefficient of determination, R2, or the P-value. As a result, these
values maintained constant values after approximately 809 additional samples were added to
explain the variability in temperature. The total number of samples collected in addition to the
preliminary samples of 838 thus reached 1647. The P-values of the regression coefficients for the
independent variables including the constant term in the linear regression equation appeared as
zero. The following multiple linear regression equation obtained was thus considered as the final
mathematical model:
DWFmVVT aote 0222.0071.00958.0386.035.16.13
wbdb TTH 709.0686.00865.0
(6.1)
where a standard deviation of 2.732 and a coefficient of determination R2of 77.1% were
observed.
It should be noted that the linear regression equation in the practical range showed a
higher value for the coefficient of determination. The linear regression equation given above
explained that 77.1% of the population was known as they have a relation. The standard
deviation of 2.732 in temperature is fairly high. This is because the model dealt with a very wide
range of conditions, so that the variability of the population in certain ranges such as high mass
flow, hot-humid conditions, low water flow rate, and big droplet size were likely bigger than in

102
the practical ranges described in the previous section. The statistical values in the practical range,
that are important for typical designs of PDEC towers and where the more extreme conditions
were eliminated, improved. The value of R2
reached 82.3%, and the standard deviation decreased
to 1.956 in the regression analysis with samples in the practical ranges. It can thus be concluded
that the prediction of temperature by the linear regression equation can respond properly to a
wide range of fluid conditions and tower configurations while some ranges may cause
inaccuracy in the predictions.
6.3.3 Regression analysis for velocity
An excellent linear relationship was found between the exit velocity and the five
independent variables. As described in the subsection 6.1, five independent variables (ambient
wind speed, tower inlet velocity, air mass flow rate, water flow rate, and tower height) were
included in the regression analysis for velocity at the exit of PDEC tower using the 838
preliminary samples. It was found during the correlation analysis that the tower inlet velocity had
a robust correlation with exit velocity, showing a Pearson correlation coefficient of 0.996 and P-
value of zero. The ambient wind speed had also a strong correlation with velocity. On the other
hand, the other main parameters such as droplet sizes, water flow rate, and temperature had a
statistically very weak correlation. Efforts were made to find a relevant regression type, and the
linear regression type was considered. In the regression analysis for velocity, adding more data
samples had no effect on the statistical indexes, and the P-values of the regression coefficients
for the independent variables were zero. As a result, the multiple linear regression equation given
with the preliminary samples was considered to be sufficient as the final mathematical model.
The value of the coefficient determination R2 was 99.7% with a standard deviation of 0.052, and
the linear equation obtained was:
HWFmVVV aote 0245.00001671.000413.0217.0706.0107.0 (6.2)

103
6.4 Summary
The overall impact of PDEC towers can be investigated when their ability to save energy
and to improve indoor environment is analyzed in detail. To date, no study can accomplish this
task since mathematical models that allow accurate predictions of PDEC air conditions were
unavailable. It is thus critical to develop such models. In this study, a statistical methodology
such as regression analysis was employed to develop mathematical models to characterize the
physical cooling processes in the effective area of spray PDEC towers. A correlation analysis
was performed to find the independent variables in the regression analyses for temperature and
velocity, and different independent variables were found for each regression analysis. A fairly
linear relation was found by the forward selection sampling method for temperature while a
robust linear relation was found for the prediction of velocity.
This chapter has shown that the linear regression equations were capable of predicting
both temperature and velocity with reasonable accuracy, and the temperature in the practical
range was more accurately predicted. In the following chapter, various dynamic simulations that
employ these mathematical models will be performed so that some problems with PDEC towers
and the solutions to resolve these problems will be presented.

104
CHAPTER 7: DYNAMIC BUILDING ENERGY SIMULATION
The mathematical models that predict temperature and velocity at the exit of PDEC
systems were developed as shown in the previous chapter. As a result, the air conditions such as
temperature, relative humidity, and flow rate at the outlet of these systems can be accurately
predicted. To date, predictions of such conditions were inaccurate because no models that
included all variables that significantly change the performance were in existence. On the other
hand, new models developed in the previous chapter have the capability of modeling the exit air
conditions of a spray PDEC tower since they include all the critical variables such as droplet size,
mass flow rate, and physical tower dimensions. The overall impact of the PDEC systems in
many situations can now be adequately analyzed. To examine the performance and capability in
various weather conditions, these models were implemented into a whole building energy
simulation program, EnergyPlus. The influence of the indoor environment and various strategies
to achieve a certain level of consistency and cooling capacity will be investigated on a typical
summer day in this chapter. The energy performance in different buildings and climates for
longer periods of time will be studied in the next chapter.
7.1 Simulation Algorithm
7.1.1 Typical operation of PDEC systems
The mathematical models developed and discussed in the previous chapter were
employed in an energy simulation tool, EnergyPlus, to predict temperature, relative humidity,
and velocity at the outlet of PDEC systems. In fact, a model employing Givoni’s mathematical
models for determining cooling capacity of PDEC towers is available in EnergyPlus (Kang and
Strand, 2009). The model, however, is only as accurate and reliable as Givoni’s model, which is
only under particular climatic conditions and for specific physical tower configurations.
Predictions of outlet air conditions of PDEC towers in different situations can thus be inaccurate.
It is thus necessary to implement a reliable mathematical model that covers a wide range of
weather conditions and physical tower configurations in a program such as EnergyPlus.

105
According to EnergyPlus Documentation (Getting Started with EnergyPlus, 2010),
EnergyPlus is an energy analysis and thermal load simulation program. Based on a user’s
description of a building from the perspective of the building’s physical make-up, associated
mechanical systems, etc., EnergyPlus will calculate the heating and cooling loads necessary to
maintain thermal control setpoints, conditions throughout an secondary HVAC system and coil
loads, and the energy consumption of primary plant equipment as well as many other simulation
details that are necessary to verify that the simulation is performing as the actual building would.
Some of the strong points of EnergyPlus include:
integrated, simultaneous solution where the building response and the primary and
secondary systems are tightly coupled;
sub-hourly, user-definable time steps for the interaction between the thermal zones and
the environment;
heat balance based solution technique for building thermal loads that allows for
simultaneous calculation of radiant and convective effects at both in the interior and
exterior surface during each time step;
Atmospheric pollution calculations that predict CO2, SOx, NOx, CO, particulate
matter, and hydrocarbon production for both on site and remote energy conversion.
To utilize these capabilities in EnergyPlus, mathematical models presented in the
previous chapter were implemented into EnergyPlus as below. In addition to these models,
control algorithms, which will be proposed in the following subsection, were also added to the
Fortran code. It is important to note that all zones are modeled as a well-mixed in EnergyPlus,
which indicates uniform conditions over the zones. Therefore, the air flows from PDEC systems
in conjunction with other natural air flows such as ventilation and infiltration were designed to
be immediately mixed with the air in the space, so that the cooling loads that the primary cooling
system should meet were determined.

106
The modeling algorithm starts by checking to see if the outdoor air conditions are
appropriate for providing cooling and that cooling is in fact needed by the zone. In other words,
the model assumes that any PDEC towers defined in the user input are turned on when the
outdoor temperature, the relative humidity, and the wind speed are within an operable range. The
model then determines various thermal properties of ambient air, using the following EnergyPlus
built-in functions:
P) ,T ,(T wbPbPsyWFnTdbT wbdbi (7.1)
),(TPsyHFnTdbW idb ih (7.2)
P),,nPbTdbW(TPsyRhoAirF idb i (7.3)
where ωi is humidity ratio of outdoor air [kg/kg-dry-air], hi is enthalpy of outdoor air [J/kg], and
ρi is density of outdoor air [kg/m3]. The incoming air mass flow rate and the inlet velocity at the
top of effective tower area are:
o
t
wct V
A
AV
(7.5)
owcia VAm (7.6)
where Vt is velocity at the top of tower [m/s] and am is mass flow rate through wind catcher
[kg/s], Awc is wind catcher area [m2], At is tower cross-sectional area [m
2], and Vo is wind speed
[m/s]. The temperature and velocity at the end of effective tower area can calculated as shown in
the previous chapter using:
HDWFmVVT aote 0865.00222.0071.00958.0386.035.16.13
wbdb TT 709.0686.0
(7.7)

107
HWFmVVV aoie 0245.0000167.000413.00217.0706.0107.0
(7.8)
where Te is PDEC outlet temperature [C], WF is water flow rate [kg/s], D is water droplet size
[㎛], H is tower height [m], Tdb is outdoor dry-bulb temperature [C], and Twb is wet-bulb
temperature [C], and Ve is PDEC outlet velocity [m/s]. Once the air exit temperature is
calculated and the enthalpy of the exit air is defined by assuming an isentropic process, the
humidity ratio of the air, the relative humidity, and the air density at the exit of the PDEC tower
are obtained from the following EnergyPlus built-in functions:
),( iee hTPsyWFnTdbH (7.9)
),,( PTWPbPsyRhFnTdbRH eee (7.10)
),,( PTnPbTdbWPsyRhoAirF eee (7.11)
where ωe is humidity ratio at the PDEC outlet [kg/kg-dry-air], RHe is relative humidity at the
PDEC outlet [%], and ρe is density at the PDEC outlet [kg/m3]. The air mass flow rate and
volumetric air flow rate as well as the velocity at the outlet surface are thus:
e
e
toutlet V
A
AV (7.12)
outleteee VAm (7.13)
)1( a
e
ee F
mQ
(7.14)

108
where Voutlet is velocity at the outlet surface [m/s], em is air mass flow rate at the PDEC outlet
[kg/s], Ae is area of the PDEC outlet surface [m2], Qe is air volumetric flow rates [m
3/s]tower,
and Fa is fraction of air loss. The evaporation rate can be expressed as:
w
ieew
mQ
)(
(7.15)
where Qw is water consumption rate [m3/s]. The total water and power consumption of water
pump are then expressed as:
)1( wwT FQQ (7.16)
LPP ratedp (7.17)
where QT is total water consumption rate [m3/s], Fw is fraction of water loss, Pp is pump power
consumption [W], and Prated is rated pump power [W].
7.1.2 Performance control
Accurate predictions of the air conditions that are delivered to the space by the PDEC
tower are critical. PDEC systems have been incorporated in the cooling of buildings but it is
important to know with some accuracy how much energy saving can be accomplished before a
building is constructed. The cooling capacity of these systems can be inconsistent due to their
strong dependence on variable outdoor weather conditions. While it is difficult to immediately
respond to outdoor weather conditions such as wind speed, temperature, and relative humidity,
PDEC systems need to properly deal with such variable conditions so that indoor thermal loads
can be properly treated. From this perspective, the cooling performance of PDEC towers must be
relatively constant and controllable. In addition, almost all PDEC towers uses as a large amount

109
of water to achieve the best possible performance with no consideration for the variable weather
conditions. Excessive water consumption should be avoided, particularly when the air is
saturated or in a situation where the evaporative cooling process cannot take place.
Two key factors for the performance control of PDEC towers can be considered. As
described in the previous chapter, the performance of PDEC systems varies with a number of
parameters such as air mass flow rate, droplet sizes injected, and water flow rate. These three
parameters can thus be potential factors that help successfully control the performance based on
maintaining consistent conditions within a space. While both the water flow rate and the air mass
flow rate are relatively easy to control, adjusting the droplet size as outdoor weather conditions
change is difficult. In addition, differences in the cooling performance between droplet sizes of
30 ㎛ and 100 ㎛ were fairly small. Two different control strategies, water flow rate control and
air mass flow rate control, are thus considered.
In reality, many algorithms dealing with the optimal performance of the PDEC systems
could be considered. The goal of this case study, however, is to verify that PDEC towers are
applicable as a cooling component in buildings, providing significant energy savings and also
improving indoor environmental quality. An analysis of optimal control algorithms was thus not
included in this study.
A simple control algorithm for determining the water flow rate and the air mass flow rate
were employed as shown in Figure 7.1. The model calculates the exit temperature and velocity
from Equations 7.7 and 7.8, if ambient air conditions are in the ranges defined by user inputs. In
the case of typical operation of PDEC systems, the model calculates the air mass flow rate and
volumetric flow rate as well as the relative humidity at the outlet based on the temperature and
the velocity calculated by Equations 7.7 and 7.8. The control algorithm that was implemented
compares the outlet temperature of the PDEC system with the mean air temperature in the space.
If the system exit temperature is larger, the model checked again to see if the temperature
difference between the calculated exit and the indoor air temperature is within the user-defined
range. If this temperature difference is within the user-defined range, the model checks to see if
the air temperature in the space was 1.5C bigger than outdoor wet-bulb temperature to avoid
saturation of the air while this low temperature limit should vary with weather conditions. This
temperature limit, 1.5C bigger than the wet-bulb temperature, was imposed when the

110
calculated temperature is bigger than the zone air temperature so that load calculation as well as
indoor environment cannot be impacted in this particular situation. Once all these conditions are
met at a particular point during the simulation called a time step, the model then set the outlet
temperature to 1.5C higher than outdoor wet-bulb temperature. The requirements of either water
flow rate or air mass flow rate can then be determined from Equation 7.7 in the process “A” in
the flow chart in Figure 7.1.

111
Figure 7.1 Flow chart of simple algorithm for water flow rate control

112
In contrast, the temperature was set to the minimum temperature defined by the user, if
the outlet temperature calculated was less than the user-defined minimum indoor temperature to
avoid having the PDEC system overcool the space thus cause heating loads. The water flow rate
demand or air mass flow rate demand at the time step can then be calculated from Equation 7.7
as shown by process “B” in Figure 7.1. Finally, the model determines the air mass flow rate, the
air volumetric flow rate, and the velocity of the air at the tower outlet.
7.2 Case Study
Using the algorithm described in the previous subsection, various case studies were
performed to analyze the cooling performance of PDEC towers in different climates and to verify
its potential capability as a building cooling system. Two different locations were chosen for a
short-term simulation study. These include a hot-dry climate represented by Yuma, Arizona and
the warm-moderate climate represented by Sacramento, California. A typical summer day that
reflects the characteristics of each weather condition was chosen from the days during run period.
It should be noted that the classification of climate in this study was not a typical climate
classification provided by weather statistics, but rather a definition based on the different air
condition for this specific study. The city of Yuma is classified as a dessert climate, and
Sacramento has a hot dry summer with a large variation in relative humidity. The building
energy system and envelope of the building were designed based on the climate of Arizona.
While overall design components of the building such as building envelope and mechanical
systems should vary with climatic regions, these features remained the same over the simulations
in this study.
Figure 7.2 depicts the climatic conditions of the two locations that were considered. In
contrast, the peak temperatures on the day were approximately 42C between 3PM and 7PM in
Yuma, and approximately 36.4C between 3PM and 5PM in Sacramento. The wet-bulb
temperatures in Yuma peaked at approximately 24.2C between 5PM and 6PM, and peak wet-
bulb temperatures of approximately 25.2C appeared between 3PM and 5PM in Sacramento. The
relative humidity in Sacramento increased up to 73.8% at 6AM and dropped to 37.6% at 12PM
while a constant variation was seen between 12PM and 7PM. The relative humidity in Yuma in

113
the morning was higher than the other hours of the day, and it dropped as low as 18% at 3PM.
The ambient wind speeds in Yuma in the early morning was approximately 2.5m/s lower than
those in Sacramento, and they were fairly similar to each other the other hours of the day.
a) Temperatures (C) and relative humidity (%RH)
b) Wind speed
Figure 7.2 Ambient air conditions in the two climatic regions investigate
(HD=hot-dry, WM=warm-moderate)
10
20
30
40
50
60
70
80
1 3 5 7 9 11 13 15 17 19 21 23Time [h]
HD Tdb HD TwbHD RH WM TdbWM Twb WM RH
0
1
2
3
4
5
6
7
8
1 3 5 7 9 11 13 15 17 19 21 23
Win
d S
pe
ed
[m
/s]
Time [h]
HD
WM

114
The building that was used for these case studies was a primary school reference building
provided by the U.S. Department of Energy (DOE). This building was chosen because its design
contains various types of rooms and a high number of occupants. The one story E-shaped school
has an area of 6,871m2 and consists of one main corridor with three wings in which classrooms
were placed. The types of spaces include classrooms, an office, corridors, an auditorium, a
gymnasium, a cafeteria, a kitchen, and a library. These spaces were divided into 23 individual
zones. The primary building HVAC system includes a multi-zone single duct VAV system with
reheat for all of the classrooms, the office, the corridors, the auditorium, and the library, and
packaged single zone air conditioning (PSZ-AC) units for the gymnasium, kitchen, and cafeteria.
The minimum flow rate of the VAV system was set to 30% of the total design air flow to
satisfy the requirement of minimum air flow for indoor air quality standards. This minimum air
flow was adjusted to 5% when the PDEC systems were added as a cooling component. Internal
heat gains such as occupants, lights, electric equipment, and gas equipment varied according to
purpose of spaces. The primary HVAC system and PDEC towers were set to operate 6AM
through 9PM. The setpoint temperatures were set to 24C during occupied hours and 27C
during setback hours. Environmental factors were also defined and included a total carbon
equivalent emission factor from carbon dioxide of 0.2727 kg/kg and a carbon dioxide emission
factor from fuel of 341.7 g/MJ.
Four different control strategies were considered. Almost all existing PDEC towers have
no control options so one control strategy was termed “Normal” to consider typical PDEC
operation. A second control strategy that monitored temperature was named “Temp Ctrl.” This
algorithm checked only if the outlet air temperature was greater than the minimum zone
temperature input to avoid introduction of warm air higher than indoor set point temperature,
since this could end up heating the space. This essentially follows the “A” process in Figure 7.1
that looks at whether or not the outlet air temperature calculated was less than the zone air
temperature at a specific point in time. The third control option monitored the water flow rate
and was named “WF Ctrl.” This option added an additional check to the second control option
“Temp Ctrl” to protect overcooling a space when the PDEC outlet temperature was less than the
user-defined minimum zone air temperature at each time step. This algorithm follows either “A”
or “B” in the flow chart depending on the situation. The fourth control option was named “Mass

115
Ctrl” and was set to adjust the air mass flow rate by varying the wind catcher area at a fixed
water flow rate. Analysis of results using the “WF Ctrl” control option prompted a series of runs
labeled “Smaller”. These cases reduced the areas of wind catcher and tower cross-section by 50%
from the original sizes, and two small towers were placed in each space rather than a single
tower per space.
In addition to monitoring standard measures of space conditions like temperature and
humidity, the EnergyPlus simulation also allowed the report of the values of the predicted mean
vote (PMV) within a space using the Fanger thermal comfort model (Fanger, 1970.) These
results were compared to verify how PDEC towers affect thermal comfort of occupants in a
space. The Fanger PMV value is determined from six major variables such as activity, clothing,
and four environmental variables: air speed, air temperature, mean radiant temperature, and
humidity. PDEC towers affect all the environmental variables in the calculation of PMV value.
In fact, air speed in the space should be altered for accurate predictions since PDEC towers
typically provided large amount of air flows with a space. However, no attempt was made to
adjust air speed of the air in a space in this study because of the complexity of the accurate
prediction of these values and the time required to properly account for such variations on an
hourly or sub-hourly basis. Thus, the air speed in each space remained at 0.2m/s in all
simulations.
7.2.1 PDEC without primary cooling system
In one series of runs, the school building was modeled with the PDEC systems as the
only cooling system for the building. A number of attempts made to design reasonable input
fields that defined the performance of the system, and the resulting inputs for the PDEC towers
are listed in Table 7.1. It should be noted that the PDEC towers were not optimized according to
climatic conditions, but rather oversized in order to clearly reflect the characteristics of these
systems. Different tower heights, water pump power consumption rates, and areas of the wind
catcher and the tower cross-section were employed. A water flow rate of 200l/h and water
droplet size of 30 ㎛ were used. 5% of the air and water flow rates were assumed to be lost. The
minimum zone temperature limit and minimum ambient temperature were set to 20C and 28C,

116
respectively. That is, the model assumed that the PDEC systems were turned off when the zone
air temperature at a given time step was below the minimum zone temperature, as well as the
ambient air temperature was lower than the minimum ambient temperature. These values were
used as control setpoints during the PDEC control simulations as well. As for simulations in the
warm-moderate climate Sacramento, the two input fields for the maximum relative humidity and
the minimum ambient temperature were adjusted to 50% and 26C. PDEC towers for the
“normal” PDEC operation case was set to always be turned on in all climatic ranges.
Table 7.1 Main input parameters for PDEC objects in the short-term simulation
Type of rooms Class room Office Cafeteria
Water flow rate [l/h] 200 200 200
Effective tower height [m] 5 10 8
Minimum indoor temperature [C] 20 20 20
Water loss [%] 5 5 5
Air flow loss [%] 5 5 5
Rated pump power consumption [W] 150 250 250
Area of wind catcher [m2] 6.25 9 9
Tower cross-sectional area [m2] 16 25 25
Diameter of water droplet [㎛] 30 30 30
Maximum relative humidity [%] 40 40 40
Minimum ambient temperature [C] 28 28 28
7.2.1.1 Energy performance
A tremendous reduction in the electricity consumption for cooling was shown in all of the
PDEC controlled cases. The energy performance of the different control strategies on a typical
summer day was compared to verify how much energy each case could save. Table 7.2 below
illustrates the electricity consumed by the cooling systems and facilities, the water consumption,
and the carbon dioxide production by the building in the two different climates. The cooling
electricity in the PDEC cases was the total energy use of the water pump, which is the only
component consuming energy in the PDEC systems. The electricity for cooling was 7100.78MJ

117
in the base case that was served by the conventional forced air systems only in the hot-dry
climate and 3994.59MJ in the warm-moderate climate. This value decreased to 258.72MJ in the
hot-dry climate and 179.34MJ in the warm-moderate climate, which is a maximum reduction of
96.3% in Yuma and 95.5% in Sacramento. Since no electricity was consumed by fans in any of
the PDEC cases, more energy savings was achieved. Percentage reductions in electricity by
building facilities were estimated as 57.3% in Yuma and 44.9% in Sacramento. The production
of carbon dioxide in the use of building facilities was 2716.45kg in the base case in Yuma and
1174.56kg in PDEC cases, and these values were reduced by 56.7% using the PDEC system. The
PDEC systems did consume a large volume of water, up to 437.38m3 in Yuma and 356.11m
3 in
Sacramento in the smaller case, which is a sharp increase over the base case which only used
1.5m3 in both climates. In Yuma, the water consumption in the Temp Ctrl case was greater than
in the Normal case. It was likely that water In addition, a considerable difference in water
consumption between each control case was observed, and the water flow rate control
significantly decreased water consumption in both climates.
Table 7.2 Comparisons of energy performance along control algorithms in different climates
Hot-Dry Climate
Meters Normal Temp Ctrl WF Ctrl Mass Ctrl Smaller Base
Cooling:Electricity [MJ] 258.72 258.72 258.72 258.72 261.36 7100.78
Electricity:Facility [MJ] 5774.86 5774.86 5774.86 5774.86 5777.50 13529.43
Fans:Electricity [MJ] 0 0 0 0 0 683.77
Cooling:MainsWater [m3] 223.50 237.73 191.13 218.30 437.38 1.50
CO2:Facility [kg] 1174.58 1174.58 1174.58 1174.58 1175.10 2716.45
Warm-Moderate Climate
Meters Normal Temp Ctrl WF Ctrl Mass Ctrl Smaller Base
Cooling:Electricity [MJ] 264.60 179.34 179.34 179.34 187.11 3994.59
Electricity:Facility [MJ] 5774.86 5685.19 5685.19 5685.19 5692.96 10324.15
Fans:Electricity [MJ] 0 0 0 0 0 614.02
Cooling:MainsWater [m3] 175.08 139.93 103.52 176.69 356.11 1.50
CO2:Facility [kg] 1173.71 1156.90 1156.90 1156.90 1158.43 2084.69

118
7.2.1.2 Cooling performance
The indoor environment in three representative spaces (the cafeteria, a classroom, and the
office) was also compared. The office, which was a relatively large-scale space, has a volume of
1764 m3. The volumes of a medium-scale space, cafeteria, and the smallest space, classroom,
were 1260m3 and 396 m
3, respectively. The number of occupants and internal heat gains from
lights and electric equipment differed for each space. The minimum indoor temperature was set
to 24C in all the PDEC controls cases, and this was considered the setpoint temperature for the
PDEC systems. No attempt, however, was made to strictly meet the indoor temperature setpoint
in these control types. The model thus adjusted either water flow rate in “Temp Ctrl” and “WF
Ctrl” cases, or mass flow rate in “Mass Ctrl” case if the outlet temperatures calculated fell into
processes A or B as shown in the flow chart in Figure 7.1.
PDEC outlet air conditions
Low temperature with high relative humidity at the exit of the PDEC system was noted in
both the normal PDEC operation case and the temperature control case during most of
operational hours of the PDEC system. Note that PDEC control cases in Sacramento covered a
certain portion of the day since PDEC towers began to run at 11AM. The relative humidity at the
outlet of the temperature control case significantly increased and remained fairly constant until
2PM as it started to run in all spaces and climates. In the hot-dry climate, the ambient wet-bulb
temperatures were fairly low during the early morning and resulted in a sharp rise in the relative
humidity and sudden temperature drop of the outlet air. It was also seen that a large amount of
water, maximum water flow rate of 200l/h, was unnecessary if such a low temperature,
approximately 20C, was not required. These two cases, however, maintained a bit lower level of
relative humidity between 88.6% and 82% once the ambient air conditions changed under very
hot and dry inlet conditions. Similar tendencies were also observed in Sacramento in these cases.
In addition, the normal PDEC operation showed a severe increase in relative humidity as it
reached the maximum at 7PM in Yuma, and all running hours in Sacramento due to relatively
low ambient wet-bulb temperature and high volume of water injected. The temperature of the air
in the normal condition then gradually increased as the ambient wet-bulb temperature increased.

119
The other three control cases achieved almost the same performance in all cases in both
climates. A gradual increase in relative humidity appeared in the other three control types by
2PM in Yuma. They then maintained a relatively constant variation of relative humidity in the
range between 80% and 94% in Yuma. A sudden rise in relative humidity, however, was seen in
Sacramento as soon as it started to operate from 11AM through 2PM due to a higher ambient
relative humidity of approximately 40% and thus higher wet-bulb temperature than early
morning hours. Relative humidity in these control types then suddenly dropped starting at 6PM
in Sacramento along with the variation of ambient wet-bulb temperature from 23.9C to 20.9C.
On the other hand, a constant outlet temperature of 24C, which was the set point temperature of
PDEC towers, was shown through 2PM in Yuma and 1PM in Sacramento. Outlet temperatures in
these control types then slightly increased since the ambient wet-bulb temperatures was floating
around 24C.

120
a) Cafeteria – Hot-dry
b) Classroom – Hot-dry
c) Office – Hot-dry
Figure 7.3 Variations of temperature at PDEC towers outlet
15
20
25
30
35
40
45
6 8 10 12 14 16 18 20Time [h]
Tdb
T-Normal
T-Temp
T-WF
15
20
25
30
35
40
45
6 8 10 12 14 16 18 20Time [h]
Tdb
T-Normal
T-Temp
T-WF
15
20
25
30
35
40
45
6 8 10 12 14 16 18 20Time [h]
Tdb
T-Normal
T-Temp
T-WF

121
d) Cafeteria – Warm-moderate
e) Classroom – Warm-moderate
f) Office – Warm-moderate
Figure 7.3 Variations of temperature at PDEC towers outlet (con’t)
10
15
20
25
30
35
40
6 8 10 12 14 16 18 20Time [h]
TdbT-NormalT-TempT-WFT-Smaller
10
15
20
25
30
35
40
6 8 10 12 14 16 18 20Time [h]
TdbT-NormalT-TempT-WFT-Smaller
10
15
20
25
30
35
40
6 8 10 12 14 16 18 20Time [h]
Tdb
T-Normal
T-Temp
T-WF

122
a) Cafeteria – Hot-dry
b) Classroom – Hot-dry
c) Office – Hot-dry
Figure 7.4 Variations of relative humidity at PDEC towers outlet
10
20
30
40
50
60
70
80
90
100
6 8 10 12 14 16 18 20Time [h]
RHoRH-NormalRH-TempRH-WFRH-Smaller
10
20
30
40
50
60
70
80
90
100
6 8 10 12 14 16 18 20Time [h]
RHoRH-NormalRH-TempRH-WFRH-Smaller
10
20
30
40
50
60
70
80
90
100
6 8 10 12 14 16 18 20Time [h]
RHoRH-NormalRH-TempRH-WFRH-Smaller

123
d) Cafeteria – Warm-moderate
e) Classroom – Warm-moderate
f) Office – Warm-moderate
Figure 7.4 Variations of relative humidity at PDEC towers outlet (con’t)
30
40
50
60
70
80
90
100
6 8 10 12 14 16 18 20Time [h]
RHoRH-NormalRH-TempRH-WFRH-Smaller
30
40
50
60
70
80
90
100
6 8 10 12 14 16 18 20
Time [h]
RHoRH-NormalRH-TempRH-WFRH-Smaller
30
40
50
60
70
80
90
100
6 8 10 12 14 16 18 20Time [h]
RHoRH-NormalRH-TempRH-WFRH-Smaller
124
Mean air temperature
Variation in indoor air temperature throughout the day showed large differences for each
of the cases. The normal PDEC operation significantly overcooled the spaces in the morning
hours in both climates. The temperatures at 7AM dropped to 20.2C in the classroom in Yuma
and 16.7C in classroom in Sacramento. Temperature differences between the base case and the
normal case at 7AM, when the lowest indoor air temperature was predicted, were approximately
4.1C in the cafeteria in Yuma and 5.26C in the office in Sacramento. Similarly, the
temperature control in Yuma, which only checks if the outlet temperature calculated was greater
than the space air temperature at each time step, maintained low temperatures until 3PM. This
temperature control in Sacramento also performed worse than the other three control strategies,
overcooling the spaces from 11AM when the PDEC systems began operating, but it showed
better performance than the normal case. In Sacramento, due to low outdoor temperatures and
relatively high humidity, the PDEC systems were turned off by 11AM in the controlled PDEC
cases, increasing indoor air temperatures up to 27.6C in cafeteria.
The temperatures in PDEC control cases were more consistent than the base case.
However, both the normal PDEC operation and the temperature control cases were unlikely to
maintain a constant environment in all spaces and climates. The original cooling system in the
base case could not meet the set point temperature between 6PM and 8PM in both cases due to
very high outdoor dry-bulb temperatures (up to 42C in Yuma and 36.5C in Sacramento.)
Conversely, three of the controlled PDEC cases (water flow control, mass flow control, and
smaller PDEC tower) showed almost the same variation between 8AM and 8PM in all spaces
and climates. This was because the PDEC systems continued to operate during all scheduled
hours, providing almost the same cooling capacity between the different control algorithms since
the ambient air conditions were within the range of operation. Indoor air temperatures in
Sacramento in these three PDEC control cases, however, were variable since the outdoor wet-
bulb temperature increased up to 25.6C at 6PM. They, however, maintained a constant indoor
temperature between 5PM and 8PM, which the base case and the other cases could not achieve.
In summary, PDEC systems with appropriate performance control may handle all the cooling
demands in a space in a hot-dry climate while the PDEC towers will have some difficulty

125
maintaining acceptable indoor conditions in a warm-moderate climate when the outdoor wet-
bulb temperature increases above the upper limit of indoor air temperature acceptability.

126
a) Cafeteria – Hot-dry
b) Classroom – Hot-dry
c) Office – Hot-dry
Figure 7.5 Variations of indoor mean air temperature
15
20
25
30
35
40
45
1 3 5 7 9 11 13 15 17 19 21 23
Tem
pe
ratu
re [℃
]
Time [h]
TdbTwbBaseNormal
15
20
25
30
35
40
45
1 3 5 7 9 11 13 15 17 19 21 23
Tem
pe
ratu
re [℃
]
Time [h]
TdbTwbBaseNormal
15
20
25
30
35
40
45
1 3 5 7 9 11 13 15 17 19 21 23
Tem
pe
ratu
re [℃
]
Time [h]
Tdb TwbBase NormalTemp Ctrl WF CtrlMass Ctrl Smaller

127
d) Cafeteria – Warm-moderate
e) Classroom – Warm-moderate
f) Office – Warm-moderate
Figure 7.5 Variations of indoor mean air temperature (con’t)
10
15
20
25
30
35
40
1 3 5 7 9 11 13 15 17 19 21 23
Tem
pe
ratu
re [℃
]
Time [h]
Tdb TwbBase NormalTemp Ctrl WF CtrlMass Ctrl Smaller
10
15
20
25
30
35
40
1 3 5 7 9 11 13 15 17 19 21 23
Tem
pe
ratu
re [℃
]
Time [h]
Tdb TwbBase NormalTemp Ctrl WF CtrlMass Ctrl Smaller
10
15
20
25
30
35
40
1 3 5 7 9 11 13 15 17 19 21 23
Tem
pe
ratu
re [℃
]
Time [h]
Tdb TwbBase NormalTemp Ctrl WF CtrlMass Ctrl Smaller
128
Relative humidity
Relative humidity significantly varied in all cases including the base cases. In the
cafeteria, which was controlled by a unitary air conditioning system, PSZ-AC, the relative
humidity in all cases and climates varied during all operational hours. In addition, both the
normal operation and temperature control cases significantly increased indoor relative humidity
level at the beginning of the day with cyclical increases and decreases throughout the day in all
cases both in Yuma and Sacramento. The maximum relative humidity was shown to be roughly
65% even in the normal PDEC operation case, and the differences between the maximum and
minimum relative humidity were less than 20% in all cases in Yuma. The variations in relative
humidity in Sacramento were much greater than in Yuma, which was mainly because of the
warm-humid outdoor air conditions.
In contrast, relative humidity in the other three PDEC control cases in Yuma was
relatively constant within approximately a 7% difference by 3PM as the water flow rates
determined to achieve the setpoint temperature did not reach the maximum water flow rate of
200l/h. Relative humidity in these control cases, also including the other cases, sharply increased
as the cooling demands of the spaces increased, and the ambient wind speeds also increased,
resulting in a large amount of water consumption to treat the large amount of outdoor air flow at
a high temperature. In addition, the variation in relative humidity in Sacramento was larger than
in Yuma due to the humid weather conditions. The indoor relative humidity increased up to
nearly 80% at 4PM in all spaces in Sacramento due to increase of water requirements to meet
cooling loads that significantly increased. Thus, it turned out that inappropriately designed PDEC
towers can significantly increase indoor humidity level, resulting in excessive water consumption.

129
a) Cafeteria – Hot-dry
b) Classroom – Hot-dry
c) Office – Hot-dry
Figure 7.6 Variations of indoor relative humidity
15
25
35
45
55
65
75
1 3 5 7 9 11 13 15 17 19 21 23
Re
lati
ve H
um
idit
y [%
]
Time [h]
RHo Base NormalTemp Ctrl WF Ctrl Mass Ctrl
15
25
35
45
55
65
75
1 3 5 7 9 11 13 15 17 19 21 23
Re
lati
ve H
um
idit
y [%
]
Time [h]
RHo Base Normal Temp Ctrl
15
25
35
45
55
65
75
1 3 5 7 9 11 13 15 17 19 21 23
[ R
ela
tive
Hu
mid
ity
[%]
Time [h]
RHo Base Normal Temp Ctrl

130
d) Cafeteria – Warm-moderate
e) Classroom – Warm-moderate
f) Office – Warm-moderate
Figure 7.6 Variations of indoor relative humidity (con’t)
30
40
50
60
70
80
90
1 3 5 7 9 11 13 15 17 19 21 23
Re
lati
ve H
um
idit
y [%
]
Time [h]
RHo Base Normal Temp CtrlWF Ctrl Mass Ctrl Smaller
30
40
50
60
70
80
90
1 3 5 7 9 11 13 15 17 19 21 23
Re
lati
ve H
um
idit
y [%
]
Time [h]
RHo Base Normal Temp CtrlWF Ctrl Mass Ctrl Smaller
30
40
50
60
70
80
90
1 3 5 7 9 11 13 15 17 19 21 23
Re
lati
ve H
um
idit
y [%
]
Time [h]
RHo Base Normal Temp CtrlWF Ctrl Mass Ctrl Smaller

131
Thermal comfort
The trends in the thermal comfort levels showed similar tendencies to the variations in
the indoor temperature and relative humidity. Since temperature and relative humidity are key
factors in determining the thermal comfort indexes, it was expected that variations in these
parameters will affect the predicted Fanger PMV values. As described in the simulation
description section, no adjustments were made to indoor air speed for the PDEC cases. The
Fanger PMV values in classroom at 7AM in the normal case were reported as -1.08 in Yuma,
which is classified as slightly cold, and nearly -2.0 in Sacramento, which is classified as cold.
These values were because large volume of cold air is flowing from the PDEC towers and this
dropped the indoor air temperatures while increasing the relative humidity at this particular time.
These values then fall in between neutral (PMV=0) and slightly warm (PMV=1) reaching values
up to 0.7 in cafeteria between 3PM and 8PM due to significant variations in the indoor
environment. A similar tendency was seen for the temperature control type. The temperature
control case, however, improved thermal comfort in the spaces, showing better PMV values than
the normal case. In contrast, the Fanger PMV values in the other control cases were very close to
neutral with a very small variation in Yuma, and these values were maintained for a longer time
than the base case. While these values in Sacramento were more variable than in Yuma, the
PDEC towers with these three controls maintained the indoor thermal comfort level within a
reasonable range between neutral and slightly warm at the maximum of 0.87 during PDEC
operational hours.
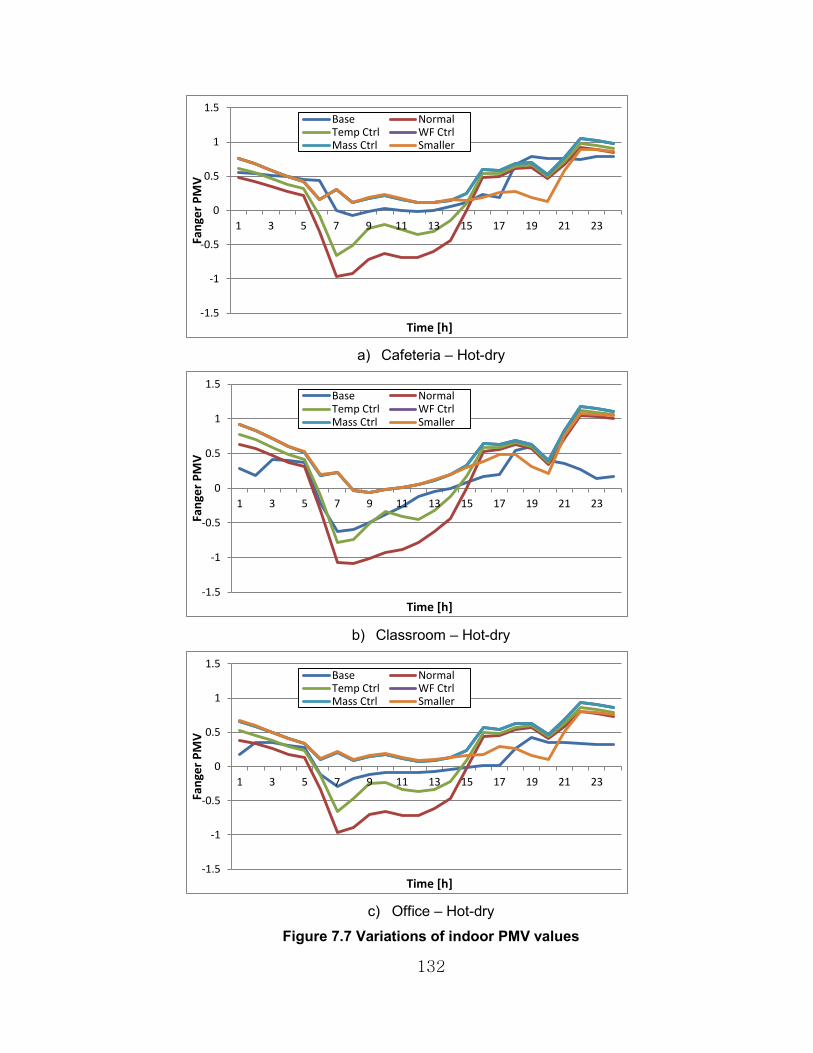
132
a) Cafeteria – Hot-dry
b) Classroom – Hot-dry
c) Office – Hot-dry
Figure 7.7 Variations of indoor PMV values
-1.5
-1
-0.5
0
0.5
1
1.5
1 3 5 7 9 11 13 15 17 19 21 23
Fan
ger
PM
V
Time [h]
Base NormalTemp Ctrl WF CtrlMass Ctrl Smaller
-1.5
-1
-0.5
0
0.5
1
1.5
1 3 5 7 9 11 13 15 17 19 21 23
Fan
ger
PM
V
Time [h]
Base NormalTemp Ctrl WF CtrlMass Ctrl Smaller
-1.5
-1
-0.5
0
0.5
1
1.5
1 3 5 7 9 11 13 15 17 19 21 23
Fan
ger
PM
V
Time [h]
Base NormalTemp Ctrl WF CtrlMass Ctrl Smaller

133
d) Cafeteria – Warm-moderate
e) Classroom – Warm-moderate
f) Office – Warm-moderate
Figure 7.7 Variations of indoor PMV values (con’t)
-2
-1.5
-1
-0.5
0
0.5
1
1.5
1 3 5 7 9 11 13 15 17 19 21 23Fa
nge
r P
MV
Time [h]
Base Normal Temp CtrlWF Ctrl Mass Ctrl Smaller
-2
-1.5
-1
-0.5
0
0.5
1
1.5
1 3 5 7 9 11 13 15 17 19 21 23
Fan
ger
PM
V
Time [h]
Base Normal Temp CtrlWF Ctrl Mass Ctrl Smaller
-2
-1.5
-1
-0.5
0
0.5
1
1.5
1 3 5 7 9 11 13 15 17 19 21 23
Fan
ger
PM
V
Time [h]
Base Normal Temp CtrlWF Ctrl Mass Ctrl Smaller

134
7.2.2 PDEC with primary cooling system
PDEC systems are typically a stand-alone cooling system. They, however, may not be
capable of meeting all cooling requirements in a space, especially in a humid area, due to their
strong dependency on variable weather conditions. To remedy this gap, they could be
successfully integrated as a secondary cooling system in conjunction with a primary air
conditioning system. They then would meet some of cooling loads while improving the indoor
environmental quality. This case study was thus designed to analyze how PDEC towers
effectively handle cooling loads in conjunction with a conventional system and achieve their
ultimate goal, i.e., energy savings.
An attempt was made to adjust the constant minimum air flow rate of the primary HVAC
system, a single duct VAV with reheat, from 30% to 5%. In fact, this minimum air flow rate
could be zero in all PDEC running hours. However, PDEC towers could be turned off in some of
days during the entire run period occupied hours, which the case where minimum air flow cannot
be met by any of these. To avoid such situations, 5% of minimum air flow rate was employed.
The other inputs remained the same as the original reference building except for the inclusion of
the PDEC towers. In addition, the use of temperature control was excluded in this case study
because the purpose of the PDEC system in this series of runs was not to control temperature but
rather to provide for outside air. Instead, two different simple comparisons with setpoint
temperatures of PDEC towers were included. It was observed in the preliminary studies that the
setpoint temperature significantly impacted building load calculations when it differed from
indoor cooling setpoint for the primary cooling system. Two different setpoints for PDEC towers
(23.5 and 24.5) were thus employed. As a result, the cases considered were “Base”, “Normal”,
“WF-23.5”, “WF-24.5”, and “Mass Ctrl.”
7.2.2.1 Energy performance
All of the PDEC integrated cases achieved significant energy savings as illustrated in
Table 7.3 below. The electricity for cooling in the base case in Yuma was estimated to be
7100.78MJ. This decreased to 5651.06MJ in the normal PDEC operation case. The normal case
achieved an 11.2% reduction in the electricity used by the entire building, a 19.5% reduction in
the HVAC electricity use, a 10% reduction in the fan electricity use, and a 33.9% reduction in

135
the carbon dioxide production for the building. In Sacramento, the reductions in electricity
consumption in the normal case reached 15.7% for cooling, 6.6% for the building, 14.8% for the
HVAC systems, and 8.9% for the fans. The carbon dioxide production in the normal case,
however, increased 63.7% in Sacramento, which meant that some amount of energy was
consumed for space heating as heating loads appeared during morning hours due to cold PDEC
air flows. Similar reductions were seen for both Yuma and Sacramento in the mass flow control
case and the water flow rate control at 24.5C, which is 0.5C higher than the cooling setpoint
temperature. Conversely, carbon dioxide productions by the building in all PDEC cases in
Sacramento were greater than those in the base case. This was because the PDEC system tended
to overcool as it began to operate in the early morning, resulting in heating needs for the building
when the PDEC system was running during those hours. Water consumption in the base cases
was estimated less than 0.5% of the total PDEC water consumptions in Yuma and 1.4% in
Sacramento.
Water flow rate control at 23.5C, which was 0.5C lower than the indoor setpoint
temperature of 24C, achieved the best energy performance as more energy savings were
observed in this control case than the other cases. It was interesting that reductions in energy use
for cooling and HVAC in Sacramento were greater than in Yuma. This was because the PDEC
towers in Sacramento treated relatively large portion of cooling loads in Sacramento since the
loads themselves were relatively speaking smaller than those in Yuma. This control case in
Yuma achieved a 47.9% reduction in cooling electricity and a 45.6% reduction in HVAC
electricity. These percentage reductions in Sacramento increased to 62.1% for cooling and 57.0%
for HVAC. On the other hand, carbon dioxide production increased 31% in Sacramento while
they decreased 45% in Yuma. This was because, as described previous subsection, an over-sized
PDEC tower may cause a heating load if it overcools a space. The 31% increase of carbon
dioxide production in the water flow rate control case in comparison with the base case at 23.5C
case, however, was 50% less than that in the other PDEC tower cases.

136
7.3 Comparisons of energy performance along control algorithms in different climates
Hot-Dry Climate
Meters Base Normal WF-23.5 WF-24.5 Mass Ctrl
Cooling:Electricity [MJ] 7100.78 5651.06 3697.97 5692.44 5628.48
Electricity:Facility [MJ] 13529.43 12011.13 9975.70 12056.94 11984.98
Electricity:HVAC [MJ] 7784.55 6266.28 4230.92 6312.19 6240.18
Fans:Electricity [MJ] 683.77 615.23 532.95 619.75 611.70
Cooling:MainsWater [m3] 1.50 188.31 197.44 109.11 322.75
CO2:Facility [kg] 2716.45 1795.59 1494.15 1802.37 1791.72
Warm-Moderate Climate
Cooling:Electricity [MJ] 3994.59 3366.99 1514.20 3302.37 3363.35
Electricity:Facility [MJ] 10324.15 9641.72 7695.64 9577.98 9637.26
Electricity:HVAC [MJ] 4608.62 3926.37 1980.11 3862.55 3921.98
Fans:Electricity [MJ] 614.02 559.38 465.91 560.18 558.63
Cooling:MainsWater [m3] 1.50 92.69 107.47 38.94 185.85
CO2:Facility [kg] 882.60 1444.69 1156.47 1435.24 1444.03
Water consumption in the PDEC towers was directly related to the setpoint temperature.
As seen in the previous PDEC-only operated buildings, the water flow rate control at 23.5C
case predicted the lowest water consumption as it adjusted the water flow rate to meet a specific
setpoint temperature at a specific time step. While this particular control type achieved the best
energy performance, the volume of water consumption was approximately 81% greater than
water flow rate control at 24.5C in Yuma and even 5% greater than normal case, where the
indoor setpoint temperature was set to 24C. In Sacramento, these values increased to 15.9% in
the normal case and 176% in the water flow rate control at 24.5C case. It thus turned out that a
1C difference in setpoint temperature for the PDEC towers can significantly increase water
consumption of these systems while at the same time significantly decreasing their energy

137
consumption. The setpoint temperature for the control of PDEC towers should thus be carefully
designed to respond to variable load conditions in a space.
7.2.2.2 Cooling performance
Mean air temperature
As shown in Figure 7.8, the water flow rate control at 23.5C maintained the most
consistent temperature throughout all of the cases. The base cases without PDEC integration in
both climates generally maintained a constant indoor temperature during occupied hours.
Conversely, indoor air temperatures in base case between 6PM and 8PM were variable due to
changes in the setpoint temperature from the occupied to the setback condition. The temperature
in the normal case displayed the most variation as a result of large amounts of cold air from the
PDEC towers during the morning hours. The indoor air temperature in the normal case then
gradually increased along the outdoor wet-bulb temperature line. This normal PDEC operation
provided the coldest temperatures at 19.3C at 7AM in the classroom in Yuma. This sudden
temperature drop also appeared in Sacramento where the temperature dropped to 13.3C at 7AM
in the classroom, causing substantial overcooling of the space for most of the occupied hours.
The indoor temperatures in the water flow rate control case maintained a fairly constant value
with a little fluctuation between 5PM and 8PM in all spaces in Yuma. These characteristics of
temperature variation in the water flow control type were also seen in all spaces in Sacramento,
and this case performed better than base case.
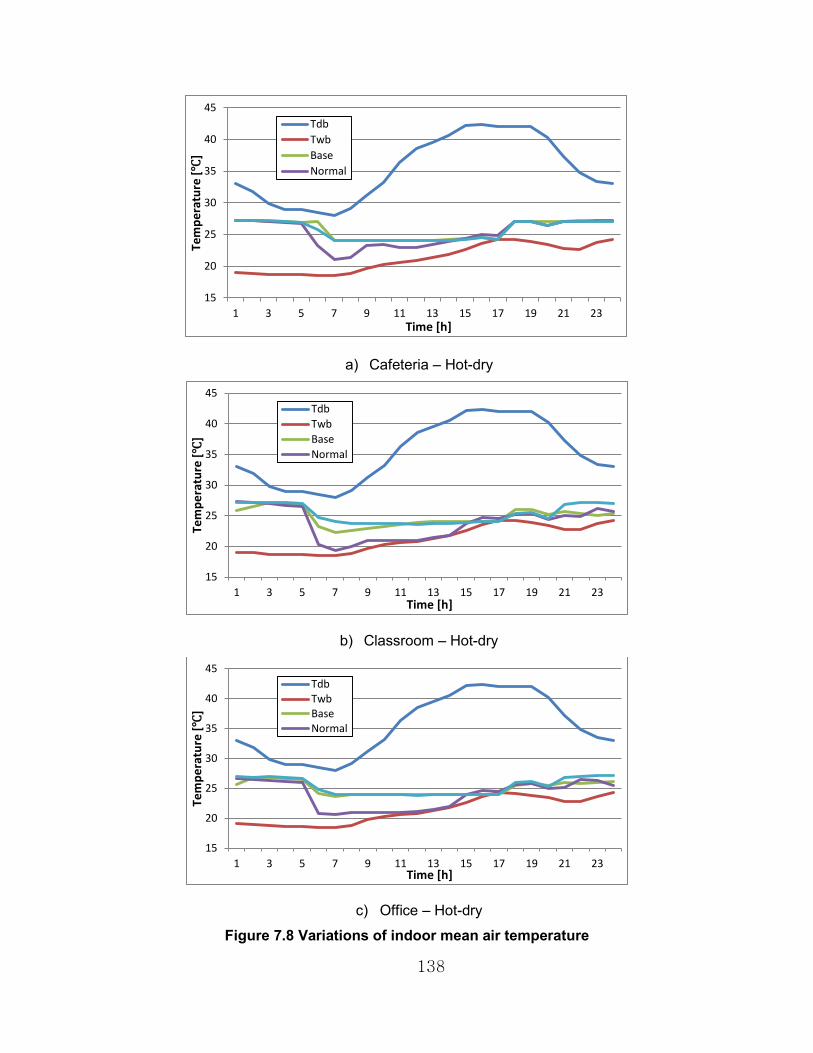
138
a) Cafeteria – Hot-dry
b) Classroom – Hot-dry
c) Office – Hot-dry
Figure 7.8 Variations of indoor mean air temperature
15
20
25
30
35
40
45
1 3 5 7 9 11 13 15 17 19 21 23
Tem
pe
ratu
re [℃
]
Time [h]
Tdb
Twb
Base
Normal
15
20
25
30
35
40
45
1 3 5 7 9 11 13 15 17 19 21 23
Tem
pe
ratu
re [℃
]
Time [h]
Tdb
Twb
Base
Normal
15
20
25
30
35
40
45
1 3 5 7 9 11 13 15 17 19 21 23
Tem
pe
ratu
re [℃
]
Time [h]
TdbTwbBaseNormal

139
d) Cafeteria – Warm-moderate
e) Classroom – Warm-moderate
f) Office – Warm-moderate
Figure 7.8 Variations of indoor mean air temperature (con’t)
10
15
20
25
30
35
40
1 3 5 7 9 11 13 15 17 19 21 23
Tem
pe
ratu
re [℃
]
Time [h]
Tdb
Twb
Base
Normal
10
15
20
25
30
35
40
1 3 5 7 9 11 13 15 17 19 21 23
Tem
pe
ratu
re [℃
]
Time [h]
TdbTwbBaseNormalWF Ctrl
10
15
20
25
30
35
40
1 3 5 7 9 11 13 15 17 19 21 23
Tem
pe
ratu
re [℃
]
Time [h]
Tdb
Twb
Base
Normal
140
Relative humidity
Indoor relative humidity varied significantly in both climates. The normal case, which
was a typical operation of PDEC towers, showed a sharp increase up to 66.8% in Yuma and 84.9%
in Sacramento when the PDEC system began to operate. The maximum relative humidity of the
normal case in Sacramento was greater than that of the PDEC only cases without any other
cooling systems. This tendency seemed to be related to the fact that the air flow rate of PSZ-AC
unitary system increased thus humid outdoor air, which was 73.5%RH, increased while that in
Yuma was almost the same due to dry outdoor air condition. The indoor relative humidity in
Yuma then dropped to 47% in the cafeteria, 50.5% in the classroom, and 49.6% in the office by
3PM while the PDEC only cases gradually increased indoor humidity level. Since the PDEC air
flows were mixed with air flows from the primary cooling system in these runs, the relative
humidity was lower than that of PDEC air flows. The same tendency was also observed in
Sacramento.
The water flow rate control case showed reasonable variation in the relative humidity. No
sharp increase in the indoor humidity level was observed in this particular case since it adjusted
the water flow rates according to the outdoor air conditions to achieve the setpoint temperature.
This control type increased the indoor humidity level during the afternoon hours when the water
flow rate increased. The indoor relative humidity, however, during the afternoon hours in Yuma
was within an acceptable range at 59.3% in the classroom, 55.6% in the office, and 62.7% in the
cafeteria. It was also seen that this case significantly increased the indoor relative humidity up to
78% in the classroom in Sacramento. The PDEC system in Sacramento showed a tendency to
reach saturation due to the humid outdoor air, so that a very high level of indoor relative
humidity between 12PM and 7PM was observed in this case. Thus it was necessary to maintain
the humidity level of the PDEC air flow below a certain value when faced with a humid climate.

141
a) Cafeteria – Hot-dry
b) Classroom – Hot-dry
c) Office – Hot-dry
Figure 7.9 Variations of indoor relative humidity
15
25
35
45
55
65
75
1 3 5 7 9 11 13 15 17 19 21 23
Re
lati
ve H
um
idit
y [%
]
Time [h]
RHo Base Normal WF Ctrl
15
25
35
45
55
65
75
1 3 5 7 9 11 13 15 17 19 21 23
Re
lati
ve H
um
idit
y [%
]
Time [h]
RHo Base Normal WF Ctrl
15
25
35
45
55
65
75
1 3 5 7 9 11 13 15 17 19 21 23
Re
lati
ve H
um
idit
y [%
]
Time [h]
RHo Base Normal WF Ctrl

142
d) Cafeteria – Warm-moderate
e) Classroom – Warm-moderate
f) Office – Warm-moderate
Figure 7.9 Variations of indoor relative humidity (con’t)
30
40
50
60
70
80
90
1 3 5 7 9 11 13 15 17 19 21 23
Re
lati
ve H
um
idit
y [%
]
Time [h]
RHo Base Normal WF Ctrl
30
40
50
60
70
80
90
1 3 5 7 9 11 13 15 17 19 21 23
Re
lati
ve H
um
idit
y [%
]
Time [h]
RHo Base Normal WF Ctrl
30
40
50
60
70
80
90
1 3 5 7 9 11 13 15 17 19 21 23
Re
lati
ve H
um
idit
y [%
]
Time [h]
RHo Base Normal WF Ctrl

143
Sensible cooling load to setpoint
The water flow rate control case substantially decreased the sensible cooling load
required to meet the indoor setpoint temperature. The normal case caused a significant increase
in the heating loads of the spaces as shown in Figure 7.9. The heating loads for the normal case
in Yuma peaked at 7AM at 126.9kW in the cafeteria, 92kW in the classroom, and 124.5kW in
the office. It was also observed that the PDEC towers in the normal case resulted in significantly
higher space loads between 3PM and 6PM since the water requirements to achieve the maximum
temperature drop at these particular hours were greater than the maximum water flow rate of
200l/h in this case, and also the wet-bulb temperatures were floating the setpoint temperature. In
Sacramento, the normal case required significantly more heating for the summer cooling day.
These heating needs peaked at 8PM at 344.4kW in the cafeteria, 235.8kW in the classroom, and
338.8kW in the office. The normal case also significantly increased the heating loads during the
morning hours. The water flow rate control case, however, reduced a large portion of the zonal
loads that the primary cooling system should meet. Sensible cooling loads to the indoor set point
temperature in this case were the lowest with no significant rises or drops between 7AM and
5PM in Yuma and between 7AM and 2PM in Sacramento. This control type then increased the
heating loads late afternoon. Since the wet-bulb temperatures in these hours were greater than the
setpoint temperature of 24℃, and the mass flow rate of PDEC towers increased as wind speeds
increased. It was thus concluded that PDEC towers with a more responsive control algorithm can
achieve more reduction in cooling demands for the primary cooling system.

144
a) Cafeteria – Hot-dry
b) Classroom – Hot-dry
c) Office – Hot-dry
Figure 7.10 Variations of sensible load to indoor setpoint temperature
-15
-10
-5
0
5
10
15
1 3 5 7 9 11 13 15 17 19 21 23
Sen
sib
le L
oad
to
Se
tpo
int
[W]
x 1
00
00
Time [h]
Base Normal WF Ctrl
-15
-10
-5
0
5
10
15
1 3 5 7 9 11 13 15 17 19 21 23
Sen
sib
le L
oad
to
Se
tpo
int
[W]
x 1
00
00
Time [h]
Base Normal WF Ctrl
-15
-10
-5
0
5
10
15
1 3 5 7 9 11 13 15 17 19 21 23
Sen
sib
le L
oad
to
Se
tpo
int
[W]
x 1
00
00
Time [h]
Base Normal WF Ctrl

145
d) Cafeteria – Warm-moderate
e) Classroom – Warm-moderate
f) Office – Warm-moderate
Figure 7.10 Variations of sensible load to indoor setpoint temperature (con’t)
-10
-5
0
5
10
15
20
25
30
35
1 3 5 7 9 11 13 15 17 19 21 23
Sen
sib
le L
oad
to
Se
tpo
int
[W]
x 1
00
00
Time [h]
Base Normal WF Ctrl
-10
-5
0
5
10
15
20
25
30
35
1 3 5 7 9 11 13 15 17 19 21 23
Sen
sib
le L
oad
to
Se
tpo
int
[W]
x 1
00
00
Time [h]
Base Normal WF Ctrl
-10
-5
0
5
10
15
20
25
30
35
1 3 5 7 9 11 13 15 17 19 21 23
Sen
sib
le L
oad
to
Se
tpo
int
[W]
x 1
00
00
Time [h]
Base Normal WF Ctrl

146
Thermal comfort
PMVs in the water flow control case showed the best performance overall. When the
PDEC towers were controlled in the normal fashion in conjunction with primary cooling system,
this combined system could not improve thermal comfort of occupants in the spaces. In
Sacramento, the Fanger PMV values dropped to the very cold region (which is classified as -3.0)
in the classroom which had a PMV of -2.7 and the office which had a PMV of -2.4. These values
were worse than the PDEC only cases described in the previous subsection. Since the primary
cooling system also tended to overcool the spaces during the early morning hours, the thermal
environment in these spaces was predicted to be very cold. In Yuma, the Fanger PMV values in
the normal case showed lower values than in the PDEC only cases. The water flow control case,
however, resulted in relatively constant PMVs during most of occupied hours in both Yuma and
Sacramento. The PMVs in Sacramento tended to be variable during the afternoon hours due to
the very high indoor relative humidity and the larger PDEC air flow than during the morning
hours. No considerable difference in the Fanger PMV was observed between base case and water
flow rate control case, and these values were maintained at levels that ranged between neutral
and slightly warm.

147
a) Cafeteria – Hot-dry
b) Classroom – Hot-dry
c) Office – Hot-dry
Figure 7.11 Variations of thermal comfort of occupants
-1.5
-1
-0.5
0
0.5
1
1 3 5 7 9 11 13 15 17 19 21 23Fa
nge
r P
MV
Time [h]
BaseNormalWF Ctrl
-1.5
-1
-0.5
0
0.5
1
1 3 5 7 9 11 13 15 17 19 21 23
Fan
ger
PM
V
Time [h]
BaseNormalWF Ctrl
-1.5
-1
-0.5
0
0.5
1
1 3 5 7 9 11 13 15 17 19 21 23
Fan
ger
PM
V
Time [h]
BaseNormalWF Ctrl

148
d) Cafeteria – Warm-moderate
e) Classroom – Warm-moderate
f) Office – Warm-moderate
Figure 7.11 Variations of thermal comfort of occupants (con’t)
-3
-2.5
-2
-1.5
-1
-0.5
0
0.5
1
1 3 5 7 9 11 13 15 17 19 21 23
Fan
ger
PM
V
Time [h]
Base
Normal
WF Ctrl
-3
-2.5
-2
-1.5
-1
-0.5
0
0.5
1
1 3 5 7 9 11 13 15 17 19 21 23
Fan
ger
PM
V
Time [h]
Base
Normal
WF Ctrl
-3
-2.5
-2
-1.5
-1
-0.5
0
0.5
1
1 3 5 7 9 11 13 15 17 19 21 23
Fan
ger
PM
V
Time [h]
Base
Normal
WF Ctrl

149
7.3 Summary
PDEC towers have been reported to achieve significant energy savings. Many attempts
have thus been made to integrate these systems into buildings to improve the efficiency of their
cooling systems. Some of the PDEC applications have been successfully integrated into
buildings, but there have been also some applications that failed to achieve ultimate goals of
energy savings. In addition, the large amount of water consumption of these systems has been
reported to be one of the main barriers to the integration of these systems in a more widespread
fashion. To investigate solutions that could resolve these problems, the actual condition of the air
flow leaving a PDEC system must be determined. Since no models exist in the literature which
accurately portrays the conditions of the air leaving a PDEC system, a mathematical model was
developed in the previous chapter that is capable of predicting accurate air conditions at the
PDEC towers outlet. The equations were then implemented into the whole building energy
simulation program EnergyPlus so that various potential solutions can be investigated.
Various case studies on a typical summer day in two different climates were performed to
investigate how the PDEC systems affect the indoor environment and energy performance, and
to find out what kinds of solutions could be successful to accomplish energy savings in buildings.
Meanwhile, a simple control algorithm to enhance the efficiency of PDEC systems was
presented, and several control options such as air mass control, water flow control, and
temperature control, as well as utilization of a secondary cooling system were considered.
Comparisons among a number of alternatives were made to see how each alternative affect the
energy performance and indoor environment.
In summary, the typical controls being used for PDEC systems are not as energy efficient
as they could be, waste water, lead to heating loads in the summer, and have a high degree of
PMV variability. In contrast, the water flow control system presented in this chapter is a definite
improvement in that it improves the energy consumption, water consumption and PMV over the
typical controls. In fact, it improves everything except water consumption in comparison to a
conventional forced air system. Therefore, the performance of PDEC towers should be
adequately controlled and carefully designed to immediately respond to the variable cooling
demands of a space.

150
This chapter presents a potential solution that could resolve problems with PDEC towers
defined. However, the solution needs to be verified if it could accomplish such improvements in
other building types and different climates. Thus, further case studies for a longer period of time
will be performed to analyze the overall impact of PDEC towers on energy performance in a
number of climatic regions as well as in a number of types of buildings in the following chapter.
151
List of References
ANSI/ASHRAE Standard 55, Thermal Environmental Conditions for Human Occupancy.
EnergyPlus Engineering Reference: The Reference to EnergyPlus Calculations. ENERGYPLUS,
2010.
EnergyPlus Input Output Reference: The Encyclopedic Reference to EnergyPlus Input and
Output. ENERGYPLUS, 2010.
Kang, Daeho, Strand, Richard K. “Simulation of passive down-draught evaporative cooling
(PDEC) systems in EnergyPlus.” Conference Proceedings of Building Simulation 2009, Glasgow,
Scotland, 2009.
P. O. Fanger. “Thermal Comfort.” McGraw-Hill, New York, 1970.
P. Torcellini et. al.. “U.S. Department of Energy Commercial Reference Building Models of the
National Building Stock.” Technical Report, NREL/TP-5500-46861, February 2011.
S. Wilcox, W. Marion. “Users Manual for TMY3 Data Sets.” Technical Report, NREL/TP-581-
43156, May 2008.
The U.S. Department of Energy (DOE). “Commercial Reference Buildings.” March 2011 < http://www1.eere.energy.gov/buildings/commercial_initiative/reference_buildings.html>.

152
CHAPTER 8: ENERGY SAVING POTENTIAL IN BUILDINGS
In chapter 7, case studies on a typical summer day in two different climatic regions were
performed to investigate how typical PDEC systems affect the indoor environment as well as the
energy performance in buildings and to examine some potential solutions that might overcome
the limitations of PDEC towers. A number of problems with PDEC towers were defined in the
previous chapters such as inconsistent cooling performance, high humidity of the air leaving the
PDEC tower, and excessive water consumption, and various strategies for controlling the
performance were tested. Among those alternatives, the one that utilized water flow rate as a key
parameter was shown to be reliable, efficient, and economical.
While the results of the previous chapter are encouraging, the overall impact of these
systems could be different from depending on numerous conditions such as climates, building
envelope, and building energy systems design. The impact of PDEC systems in these different
scenarios on building performance should be analyzed so that they can be successfully integrated
into buildings. In this chapter, the energy performance of PDEC systems employing the water
flow rate control algorithm for longer time periods will be investigated to verify the applicability
of PDEC systems as a cooling system in buildings.
8.1 Simulation Description
In the previous chapter, three control algorithms, temperature control, water flow control,
and mass flow control, were proposed and tested in an effort to improve the performance of
PDEC towers as well as indoor thermal environment. Based on these results, the water flow rate
control was shown to be the most effective in that it performed the best at reducing a large
portion of cooling loads and improving thermal comfort of occupants in the spaces. In a very
hot-dry region, the PDEC towers were able to maintain a very comfortable indoor environment,
achieving tremendous energy savings and minimizing water consumption. In contrast, the PDEC
towers could not guarantee a comfortable thermal environment in a humid climate without the
aid of conventional HVAC system. Many of the occupied hours in the humid climate were
uncomfortable when the PDEC towers attempted to meet the entire cooling loads in a building
153
since the performance of PDEC towers consistently varied with the outdoor weather conditions.
Thus, under certain conditions, PDEC towers were more appropriate for reducing a portion of the
cooling loads while a conventional cooling system meets the rest of the cooling demands. The
impact of PDEC systems on the indoor environment and energy performance on a typical
summer day were compared in two different climates such as Yuma in Arizona and Sacramento
in California in the previous chapter. The focus of this chapter is to extend the summer single
day simulations of the previous chapter to longer-term simulations for different climates and
building types to show the applicability and energy savings potential of PDEC systems.
Four different climates within the US were studied. In addition to Yuma and Sacramento,
two more climatic regions, Phoenix Deer Valley, Arizona and El Paso, Texas, were also
considered. According to the ASHRAE climatic zone descriptions, these climates are classified
as very Hot-Dry (Yuma, AZ), Hot-Dry (Phoenix Deer Valley, AZ), Warm-Dry (El Paso, TX),
and Warm-Marine (Sacramento, CA). The energy performance of the PDEC system as well as
indoor environment that it created in these four different climates was compared to determine
how effective PDEC systems were in each particular climate. Table 8.1 and 8.2 list the maximum,
minimum, and daily average values for the dry bulb temperature and the relative humidity for an
average annual period in each of these locations.
Three different types of buildings were also considered. PDEC towers typically treat a
large amount of air, and the air mass flow rate from these systems can be highly variable. Those
buildings with high occupancy, high movement frequency, high internal heat gains, large
volumes, and adequate water resources can thus be potential candidates for the implementation
of this technology because they tend to require high-capacity energy systems to handle their
variable load characteristics. The primary school building, which was considered for the short-
term simulations in the previous chapter, was included as it exhibits these characteristics. An
office building was also included since these buildings have a high occupancy level, high
movement frequency, and high internal heat gains. Finally, a strip mall building was also
considered because this type has a high frequently of people movement and has a large volume.
While PDEC towers can be integrated into many of commercial buildings, these three types of
buildings were considered in this long-term energy performance analysis.

154
The input files used for this study were again based on the US Department of Energy
EnergyPlus benchmark files. This study was intended to compare the overall impact of PDEC
towers on building performance for particular building types in specific climates. While the
performance of PDEC towers can significantly vary with a number of variables, especially
outdoor air conditions, this study was intended to be an initial look at the impact of using PDEC
towers in buildings rather than an exhaustive, definitive study of implementing PDEC systems in
every building type and climate. The modeling of the building envelope, the internal heat gains,
and the building energy systems in each individual building was thus set to be almost same
between the base cases and the PDEC cases. The most significant change to the input files was
the reduction of the minimum air flow fraction for the primary HVAC systems from 0.3 to 0.05
when the PDEC system was used since PDEC towers provided a large amount of fresh air to the
spaces. Naturally, weather conditions were a key parameter in the building load calculations in
this case study.
Two modifications of the PDEC systems were made to address particular climates. The
weather conditions during the morning and evening hours on a typical summer day in Yuma and
Sacramento were not favorable to PDEC operations. The running hours of PDEC towers were
thus set as 7AM to 8PM in order to reduce the potentially negative impact on indoor
environment and building load calculations that the PDEC might have in these climates. In
addition, the maximum relative humidity and the minimum ambient temperature were set to be
different. These fields were set to be 40% and 28C in the hot-dry climates, i.e., Yuma and
Phoenix Deer Valley, and 50% and 26C in the warm climates, i.e., El Paso and Sacramento,
respectively. In addition, the simulation run period was set to the 6-month period from May 1
through October 31, and all standard holidays or special day rules were applied. The total carbon
equivalent emission factor from carbon dioxide was set to 0.2727 kg/kg, and the carbon dioxide
emission factor from electricity and natural gas were set to 341.7 g/MJ and 52.1 g/MJ,
respectively, for the simulations.
Three parameters were tracked to illustrate the effectiveness of the PDEC towers in
maintaining an acceptable indoor environment: the amount of time when the setpoint
temperature was not met during occupied hours, the amount of time during which the space
conditions were not comfortable during occupied hours, and the amount of time when the

155
relative humidity was below 60% for the entire hours of the run period in a representative space
in each type of building. These three parameters were monitored for the entire run period and
compared to see how the PDEC systems impacted the overall thermal environment of a space
According to conventional wisdom, PDEC towers are known to improve indoor environmental
quality in that they deliver a large amount of fresh air into a space and improve thermal comfort
levels by increasing air movement within a space. However, PDEC towers can also lower the
indoor thermal comfort level since they can significantly increase the humidity level within a
space. The focus of this chapter is to determine when the PDEC tower system is beneficial and
when it is detrimental to the energy cost of a building.

156
Table 8.1 Monthly statistics for dry bulb temperature (C) in four different climates
(Adapted from TMY3 weather statistics)
Jan Feb Mar Apr May Jun Jul Aug Sep Oct Nov Dec
Very Hot-Dry: Yuma AZ
Maximum 28 27 33.3 34 41.7 42.8 50.6 46 43 38.9 33 22.8
Day:Hour 18:16 17:15 20:15 16:16 6:16 18:14 4:17 10:17 7:17 1:14 13:16 1:14
Minimum 4 5 8.3 11 15 20 21.7 24 18 12.2 8 3.3
Day:Hour 8:07 14:06 12:07 5:06 17:06 1:04 4:06 21:07 22:06 2:07 2:05 11:06
Daily Avg 15.8 14.7 20 22.3 26.5 30.4 34.5 34.2 31.2 24.3 20.2 13
Hot-Dry: Deer Valley, Phoenix AZ
Maximum 24 24 26.1 37 38 44 45 43 43 36 27.3 23
Day:Hour 2:16 4:15 5:17 2:16 7:16 5:15 2:14 9:17 14:15 1:16 15:14 1:13
Minimum 2 2 4.4 8 16 19 22 23 19 11.6 6 3
Day:Hour 8:07 9:06 17:07 1:05 13:04 14:05 6:02 23:05 0:05 6:07 10:05 12:07
Daily Avg 12.9 12.4 13.5 23.3 27.7 32.3 33.4 33.3 31.5 23.7 16.1 12.5
Warm-Dry: El Paso TX
Maximum 20.6 23.3 25 32.2 35 38.9 38.3 37.2 33.9 32.8 23.9 18.3
Day:Hour 3:15 20:15 21:16 21:14 19:14 2:16 1:17 7:16 19:14 1:15 3:16 10:15
Minimum -4.4 -5.6 -3.9 3.3 9.4 15 17.8 16.7 8.3 6.7 -0.6 -4.4
Day:Hour 3:07 3:07 2:05 12:06 2:06 13:05 5:06 7:06 6:06 11:06 17:04 3:07
Daily Avg 8.1 10.3 12.5 19.2 23.8 27.9 27.5 26.3 23.4 18.3 11.2 6.8
Warm-Marine: Sacramento CA
Maximum 19.4 21.7 25 29.4 34.4 38.9 40 38.3 39.4 31 19.4 15
Day:Hour 21:14 2:16 7:14 13:16 4:15 22:16 1:16 3:16 2:15 16:15 13:16 1:14
Minimum -1.7 0 1.1 3.3 6.1 10.6 11.1 11.7 10.6 6 1.1 -2
Day:Hour 1:04 5:10 19:06 18:05 0:05 13:05 16:22 23:05 17:06 2:07 21:04 2:06
Daily Avg 8.5 10.3 12 14.2 18.4 21.1 23.5 22.5 21 16.8 10.5 7.5

157
Table 8.2 Monthly statistics for relative humidity (%) in four different climates (Adapted
from TMY3 weather statistics)
Jan Feb Mar Apr May Jun Jul Aug Sep Oct Nov Dec
Very Hot-Dry: Yuma AZ
Maximum 81 94 89 100 68 66 82 94 89 89 82 100
Day:Hour 2:05 22:23 15:02 23:17 0:18 14:07 16:05 21:07 4:04 19:05 9:06 5:04
Minimum 12 8 8 8 8 9 7 11 9 11 7 21
Day:Hour 8:14 13:18 19:17 5:18 6:19 23:21 21:13 10:18 3:22 16:16 22:15 15:16
Daily Avg 36 37 33 31 25 22 30 45 35 39 35 60
Hot-Dry: Deer Valley, Phoenix AZ
Maximum 100 100 96 87 48 83 100 74 61 94 94 54
Day:Hour 11:06 13:23 1:19 1:02 23:06 2:01 6:02 5:21 18:06 18:03 4:23 8:05
Minimum 13 17 11 5 4 8 10 6 9 9 8 5
Day:Hour 2:16 1:13 12:16 2:15 14:18 8:15 2:17 1:15 14:16 9:21 20:16 15:14
Daily Avg 53 55 49 25 17 21 35 27 27 37 38 26
Warm-Dry: El Paso TX
Maximum 100 93 96 71 83 93 100 97 100 97 97 96
Day:Hour 15:21 13:11 11:01 18:08 1:05 5:01 16:24 14:03 4:05 9:07 3:06 4:02
Minimum 9 9 9 7 11 6 14 14 14 10 12 7
Day:Hour 3:17 21:15 22:13 16:17 14:16 1:16 2:19 3:17 18:18 7:15 18:12 18:13
Daily Avg 49 38 32 25 28 29 50 45 51 53 45 47
Warm-Marine: Sacramento CA
Maximum 100 100 100 100 100 100 100 97 100 100 96 100
Day:Hour 1:07 13:07 5:17 1:05 1:04 4:06 16:22 9:04 0:24 20:06 1:07 1:03
Minimum 30 28 21 22 12 8 18 11 13 12 34 27
Day:Hour 21:14 10:16 3:16 22:15 7:16 1:18 10:16 19:17 18:17 5:15 20:15 0:14
Daily Avg 83 73 70 72 59 57 53 58 57 62 77 80

158
8.2 Primary School
The primary school reference building is a one-story 6,871m2
area building and is divided
into 23 zones. The indoor setpoint temperature is defined as 24C between 6AM and 9PM with 9
hours of set back at 27C for all week days and 27C for the entire hours of the weekends and on
holidays. The over-sized PDEC towers as defined in the previous chapter cause a significant
increase in the building cooling loads and uncomfortable thermal conditions when a large
volume of air warmer than the indoor setpoint temperature was delivered to the space by the
PDEC towers. The areas of the wind catcher and the tower cross-section were thus set to be
smaller than the previous ones to reduce the occurrences of this particular situation as illustrated
in Table 8.3 which summarizes the input data for these cases. The minimum indoor temperature,
which acts as a set point temperature of PDEC towers, was set to be 23.5C based on the success
with this value in the previous chapter. The PDEC towers were set to operate from 7AM to 8PM
for all six months of the simulations. The maximum relative humidity and the minimum ambient
temperature were different depending on climates while the other main input fields remained
same for all cases.
Table 8.3 Main input parameters for PDEC towers in three representative spaces
Type of rooms Classroom Office Cafeteria
Water flow rate [l/h] 200 200 200
Effective tower height [m] 5 10 8
Minimum indoor temperature [C] 23.5 23.5 23.5
Water loss [%] 5 5 5
Air flow loss [%] 5 5 5
Rated pump power consumption [W] 150 250 250
Area of wind catcher [m2] 4 6.25 6.25
Tower cross-sectional area [m2] 12.25 16 16
Diameter of water droplet [㎛] 30 30 30
Maximum relative humidity [%] 40 (50) 40 (50) 40 (50)
Minimum ambient temperature [C] 28 (26) 28 (26) 28 (26)

159
8.2.1 Energy performance
A significant reduction in electricity for cooling was achieved in all climates when the
PDEC system was used. As seen in Table 8.4, the percentage reductions in cooling electricity are
33.44% in Yuma, 45.41% in Deer Valley, and 40.76% in El Paso. It is very interesting to note
that the greatest energy saving in cooling electricity for 6-month period on a percentage basis
was actually achieved in the warm-marine climate of Sacramento where the percentage reduction
was 48.27%. It was likely that the PDEC towers in the warm-marine climate were able to meet a
larger portion of cooling loads since the cooling requirements in Sacramento were smallest due
to the lower temperature differences between the indoor and the outdoor air. In addition, it is also
interesting that the lowest reduction of 33.44% was given in the very hot-dry climate. This is
because that the weather conditions on many of the days during July and August in Yuma were
not appropriate for PDEC tower operation due to the relatively high ambient wet-bulb
temperature. Considerable reductions in fans electricity were also seen in all climatic regions
since cooling loads in the spaces in PDEC cases decreased.
The savings in HVAC and fan energy also translate into a considerable reduction in the
energy end use. Energy savings in the total site energy in the four climates are 12.49% in Yuma,
16.78% in Deer Valley, 11.11% in El Paso, and 10.15% in Sacramento. The greatest reduction in
total site energy was achieved in the hot-dry climate of Deer Valley where the use of the PDEC
system reduced total site energy consumption by 396.81GJ. Since the proportion of cooling to
total site energy in Deer Valley was bigger than the other climates, the greatest reduction in total
site energy was given in Deer Valley rather than Sacramento. Similarly, the greatest reduction in
the electricity intensities per space floor area was seen in Deer Valley as decrease 43.67%. In
addition, similar trend is seen in the percentage reductions in the peak electrical demand where
the largest reduction in the peak electrical demand is observed in Deer Valley. Since many
commercial buildings have a contract with electric companies at a certain rate, building end use
in electricity was necessary to be maintained at least below the rate to avoid over-rated additional
cost when it exceeds the contracted rate, which could be seen during summer days due to rise of
space cooling demands.
In contrast, the carbon dioxide production and water consumption significantly increase
in all of the climates. As seen in the previous chapter, PDEC towers could cause heating loads

160
due to a large mass flow rate and a bigger temperature differences between PDEC flows and the
spaces, causing to run heating facilities in this particular case. In fact, reduction of the carbon
dioxide production and various by-products from fuels used in buildings is known to be one of
the main advantages of PDEC integration.
In addition, PDEC towers can also increase buildings loads when they are inappropriately
designed by either overcooling a space or heating a space because the exit conditions are warmer
than the space conditions as shown in the previous chapter. The primary school building consists
of 23 zones, and a PDEC tower was integrated into almost all of the individual zones. The
impact of these tendencies in a building with a large number of zones will likely be greater than
with a smaller number. As a result, the carbon dioxide production with the PDEC system
increases in all of the climates. The maximum increase in the carbon dioxide production is 52.74%
in Sacramento, and the minimum increase is 40.77% in Deer Valley.
Table 8.4 Comparisons of the energy performance of a primary school with a conventional HVAC system and PDEC integrated system under different weather conditions
Base PDEC Reduction
(%) Base PDEC
Reduction (%)
Climates Very Hot-dry Hot-dry
Electricity: Cooling [GJ] 837.58 557.52 33.44 793.8 433.3 45.41
Electricity: Fans [GJ] 105.69 90.01 14.84 110.93 76.29 31.23
Total Site Energy [GJ] 2403.36 2103.15 12.49 2364.54 1967.73 16.78
Intensity: HVAC [MJ/m2] 137.28 94.24 31.35 131.67 74.17 43.67
Peak Electrical Demand [GJ] 2210.35 1914.6 13.38 2171.64 1776.49 18.20
Water Supplied by Utility [m3] 436.9 8890.64 -95.09 436.9 10127.56 -95.69
CO2: Facility [kg] 445937.1 664186 -48.94 438297.4 616991.7 -40.77
Climates Warm-dry Warm-marine
Electricity: Cooling [GJ] 458.94 271.87 40.76 342.84 177.36 48.27
Electricity: Fans [GJ] 103.05 68.39 33.63 77.72 64.77 16.66
Total Site Energy [GJ] 2029.21 1803.73 11.11 1914.78 1720.45 10.15
Intensity: HVAC [MJ/m2] 81.79 49.52 39.45 61.21 35.24 42.43
Peak Electrical Demand [GJ] 1827.7 1605.98 12.13 1683.28 1504.86 10.60
Water Supplied by Utility [m3] 436.9 5001.19 -91.26 436.9 4513.43 -90.32
CO2: Facility [kg] 370921.7 559065 -50.72 344004.4 525442.1 -52.74

161
A huge increase in the water consumption in the PDEC cases appeared in all of the
climates as expected. A large amount of water use is one of main limitations of PDEC towers, so
a control algorithm must be employed to achieve the maximum cooling output with the
minimum water use. While the performance control did save a large quantity of water, all of the
PDEC cases still increased water consumption. The water consumption in base cases was
436.9m3, and this value is approximately 5% of the total water consumption of the PDEC towers
in the Deer Valley, 8.74% of the water consumption in El Paso, and 9.68% of the water
consumption in Sacramento. Since the PDEC towers in a hot-dry area must meet large cooling
requirements for the spaces, the water consumption in this particular climate increases
significantly. It was note that the water consumption in Deer Valley was greater than in Yuma
because overall running hours in Yuma were considerably smaller than in Deer Valley due to
higher ambient wet-bulb temperatures in the afternoons. The water consumption in El Paso was
approximately 50% of that in Deer Valley and 56% of that in Yuma. The PDEC towers in the
warm climate are able to achieve significant energy savings with less water consumption than the
dry climates. Thus, the PDEC systems can be used in various climates and are not limited to hot-
dry regions.
8.2.2 Indoor environment
In general, it can be said that the base cases maintained a better indoor environment. The
number of hours that the indoor setpoint temperature cannot be achieved during occupied hours
decreased 76.1% in El Paso and 17.19% in Yuma when the PDEC system was used. It was
because PDEC flow did not have a significant impact to the variation of building loads, so that
variable building loads were likely within capacities of the primary cooling system. However, it
substantially increased the number of hours during occupied hours where the setpoint was not
achieved by 462.3% in Sacramento and 47.05% in Deer Valley. It was because that, in Deer
Valley, most of occupied hours were within the PDEC operational range, which PDEC towers
continually supplied flows at 0.5C lower temperature than indoor setpoint temperature, so that
they increased cooling loads during some of morning hours, which cooling loads were relatively
smaller. The percentage increase in the number of hours that setpoint was not met significantly
increased in Sacramento. It was because since outdoor wet-bulb temperature during many of

162
occupied hours was in between slightly lower and slightly higher than the PDEC setpoint, they
tended to be turned on and off during afternoon hours, causing large variation in the indoor
temperature. In addition, the number of hours not in a comfortable range during occupied hours
based on ASHRAE 55-2004 increased in all climates with the highest percentage increase being
78.27% in Sacramento. On the other hand, the total hours for the entire hours of the run period
that the indoor relative humidity in a classroom was less than 60% decreased 5.04% in Yuma,
3.15% in Deer Valley, 1.61% in El Paso, and 1.78% in Sacramento when the PDEC system was
used. It is interesting to find that these values tended to increase in hot-dry areas rather than the
warm-dry and the warm-marine humid areas. This is because the dry areas required much more
water to meet the setpoint temperature of 23.5C, which increased the relative humidity of the
air exiting the PDEC system. The PDEC system also operates longer in the dry areas than in the
other climates. The biggest difference between the base case and PDEC case was found in
Sacramento since relative humidity of PDEC flows during most of PDEC operation hours was
greater than 90%.
Table 8.5 Comparisons of the indoor environment between a typical primary school and a
PDEC integrated primary school in different weather conditions
Base PDEC Reduction
(%) Base PDEC
Reduction (%)
Very Hot-dry Hot-dry
Time Setpoint Not Met [Hours] 226.83 187.83 17.19 115.83 170.33 -47.05
Time Not Comfortable [Hours] 1222.83 1333.33 -9.04 1206.67 1303.67 -8.04
RH < 60% in a classroom [Hours] 4298.51 4081.91 5.04 4377.93 4239.86 3.15
Warm-dry Warm-Marine
Time Setpoint Not Met [Hours] 228.33 54.67 76.06 60.17 338.33 -462.29
Time Not Comfortable [Hours] 1113.33 1340.17 -20.37 565.33 1007.83 -78.27
RH < 60% in a classroom [Hours] 4345.93 4275.98 1.61 4401.15 4322.78 1.78
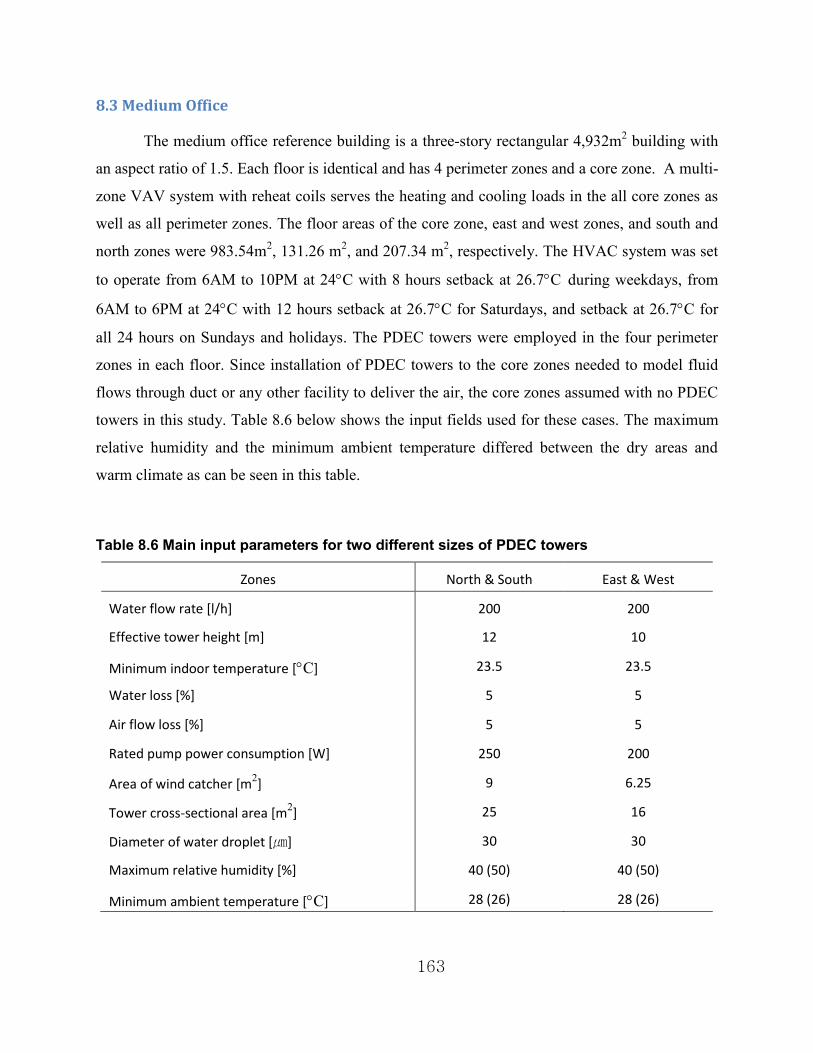
163
8.3 Medium Office
The medium office reference building is a three-story rectangular 4,932m2 building with
an aspect ratio of 1.5. Each floor is identical and has 4 perimeter zones and a core zone. A multi-
zone VAV system with reheat coils serves the heating and cooling loads in the all core zones as
well as all perimeter zones. The floor areas of the core zone, east and west zones, and south and
north zones were 983.54m2, 131.26 m
2, and 207.34 m
2, respectively. The HVAC system was set
to operate from 6AM to 10PM at 24C with 8 hours setback at 26.7C during weekdays, from
6AM to 6PM at 24C with 12 hours setback at 26.7C for Saturdays, and setback at 26.7C for
all 24 hours on Sundays and holidays. The PDEC towers were employed in the four perimeter
zones in each floor. Since installation of PDEC towers to the core zones needed to model fluid
flows through duct or any other facility to deliver the air, the core zones assumed with no PDEC
towers in this study. Table 8.6 below shows the input fields used for these cases. The maximum
relative humidity and the minimum ambient temperature differed between the dry areas and
warm climate as can be seen in this table.
Table 8.6 Main input parameters for two different sizes of PDEC towers
Zones North & South East & West
Water flow rate [l/h] 200 200
Effective tower height [m] 12 10
Minimum indoor temperature [C] 23.5 23.5
Water loss [%] 5 5
Air flow loss [%] 5 5
Rated pump power consumption [W] 250 200
Area of wind catcher [m2] 9 6.25
Tower cross-sectional area [m2] 25 16
Diameter of water droplet [㎛] 30 30
Maximum relative humidity [%] 40 (50) 40 (50)
Minimum ambient temperature [C] 28 (26) 28 (26)

164
8.3.1 Energy performance
The biggest energy saving is achieved in the hot-dry climate (Deer Valley) where the
percentage reduction in the cooling electricity is 27.72% and fans electricity is 33.1%. Since
most of occupied hours were within the range of PDEC operation, the portions of cooling loads
that PDEC towers could reduce increased. A similar percentage reduction of 22.75% in cooling
electricity and 31.34% in electricity for fans is achieved in the warm-dry climate of El Paso.
Similar to the previous case, outdoor weather conditions in El Paso were suited to run PDEC
towers during most of occupied hours. These total cooling energy reductions are 153.5GJ in Deer
Valley, 102.89GJ in Yuma, 83.11GJ in El Paso, and 59.57GJ in Sacramento. In conjunction with
the reductions in fan electricity, the reductions in the total site energy are 171.77GJ in Deer
Valley, 113.43GJ in Yuma, 99.22GJ in El Paso, and 66.15GJ in Sacramento. Since the portion of
cooling in Yuma was greater than that in El Paso, the percentage reduction in total site energy in
Yuma was the second largest one. Similarly, the electricity intensity for HVAC per floor area
and peak electrical demand also decreased.
A small reduction in carbon dioxide production in all climates is achieved while
significant increase in water consumption is noted. The PDEC cases achieve small reductions in
the carbon dioxide productions in all four climates and are predicted to produce 10.97% less
carbon dioxide in Deer Valley, which was the biggest percentage reduction This percentage
reduction in carbon dioxide productions is approximately 7.2% in both Yuma and El Paso and
5.26% in Sacramento. In fact, the predictions of carbon dioxide were directly related to the use
of electricity and natural gas. Thus, it can be said that PDEC cases increased either electricity use
or natural gas consumption. Considering reductions in electricity and much greater carbon
dioxide emission factor for electricity such as 341.7g/MJ than that for natural gas such as
52.1g/MJ, percentage reduction in carbon dioxide production should be close to that in electricity.
As a result, PDEC towers were likely significantly increased cooling loads. In addition, a large
increase in water consumption is observed in all of the climates as expected. The water
consumption in the base cases is only approximately 1% in Yuma, Deer Valley, and Sacramento
in comparison with that in the PDEC cases. In addition, the PDEC towers in El Paso achieve
significant energy saving with approximately 50% of the water consumption of the dry areas.

165
Similarly, the water consumption in Sacramento was the lowest, but the PDEC case in
Sacramento still achieves a considerable energy saving.
Table 8.7 Comparisons of energy performance between typical medium office building
and PDEC integrated medium office building in different weather conditions
Base PDEC Reduction
(%) Base PDEC
Reduction (%)
Climate Very Hot-dry Hot-dry
Electricity: Cooling [GJ] 571.04 468.15 18.02 553.82 400.32 27.72
Electricity: Fans [GJ] 52.67 42.14 19.99 55.22 36.94 33.10
Total Site Energy [GJ] 1594.94 1481.51 7.11 1579.93 1408.16 10.87
Intensity: HVAC [MJ/m2] 125.22 102.45 18.18 122.27 87.79 28.20
Peak Electrical Demand [GJ] 1578.47 1465.05 7.19 1563.47 1391.69 10.99
Water Supplied by Utility [m3] 88.52 8510.51 -99.0 88.52 9729.28 -99.1
CO2: Facility [kg] 540222.3 501464.4 7.17 535094.5 476399.5 10.97
Climate Warm-dry Warm-marine
Electricity: Cooling [GJ] 365.37 282.26 22.75 266.76 207.19 22.33
Electricity: Fans [GJ] 51.41 35.3 31.34 35.94 29.46 18.03
Total Site Energy [GJ] 1388.62 1289.4 7.15 1272.17 1206.02 5.20
Intensity: HVAC [MJ/m2] 83.68 63.77 23.79 60.81 47.54 21.82
Peak Electrical Demand [GJ] 1371.9 1272.68 7.23 1255.07 1188.94 5.27
Water Supplied by Utility [m3] 88.52 4952.43 -98.21 88.52 4350.74 -98.97
CO2: Facility [kg] 469648 435746.2 7.22 429747.4 407149.7 5.26
8.3.2 Indoor environment
PDEC cases appear to have a negative impact on the indoor environment in all of the
climates. As seen in Table 8.8, the number of hours where the setpoint temperature was not met
and when the conditions were considered uncomfortable significantly increases in all of the
climatic regions. The values of these first two fields in the base case in Sacramento, which has
the largest percentage increase, are only 11.67 hours and 2.67 hours as shown in Table 8.8.
These values in the PDEC case for Sacramento increase to 204.83 hours and 99.33 hours,
respectively. As described in the previous section, PDEC towers in Sacramento continued to be
turned on and off during afternoon hours since outdoor air conditions were floating the border of

166
PDEC operational conditions. In contrast, a relatively small difference is noted between the base
case and the PDEC case in El Paso where increases of 7.36% and 125.4% in the number of hours
where the setpoint is not met and the number of hours where conditions are uncomfortable,
respectively. Since cooling demands in El Paso are much smaller than the dry areas and the
relative humidity stays fairly dry during occupied hours at this location, both the sensible and
latent cooling capacity were relatively constant in comparison with the other climatic regions. In
addition, the percentage reductions in the total hours that the indoor relative humidity was less
than 60% were slightly greater in the dry areas than in the warm climates.
Table 8.8 Comparisons of indoor environment between typical medium office building
and PDEC integrated medium office building in different weather conditions
Base PDEC Reduction
(%) Base PDEC
Reduction (%)
Climate Very Hot-dry Hot-dry
Time Setpoint Not Met [Hours] 35.5 231.17 -551.18 33.17 143 -331.11
Time Not Comfortable [Hours] 120.33 336.17 -179.37 76.33 233.83 -206.34
RH < 60% in a classroom [Hours] 4144.1 3949.56 4.69 4361.34 4177.94 4.21
Climate Warm-dry Warm-marine
Time Setpoint Not Met [Hours] 54.33 58.33 -7.36 11.67 204.83 -1655.18
Time Not Comfortable [Hours] 72.17 162.67 -125.40 2.67 99.33 -3620.22
RH < 60% in a classroom [Hours] 4294.76 4215.07 1.86 4407.33 4284.68 2.78
8.4 Strip Mall
The single story strip mall reference building has a floor area of 2,090m2 and is divided
into 10 individual zones. The floor area of each of the two large stores is 348.39 m2, and that of
each of the other eight small stores is 174.19 m2. Each zone was controlled by a Packaged Single
Zone Air Conditioner (PSZ-AC) for space cooling and gas furnace for heating. These systems
are defined to operate from 6AM to 9AM at an indoor setpoint temperature of 24C with 9 hours
of setback at 30.0C during the weekdays. On Saturdays, the indoor setpoint temperatures are set
to 24C from 6AM to 10PM with 8 hours set back at 30.0C. For Sundays and holidays, the

167
setpoint temperature is set to 24C from 8AM to 7PM with 13hours set back at 30C. Larger
PDEC towers are employed in the two large stores, and the smaller PDEC towers are used in the
other spaces as listed in Table 8.9 below.
Table 8.9 Main input parameters for two different PDEC towers
Zones Larger Smaller
Water flow rate [l/h] 250 200
Effective tower height [m] 12 10
Minimum indoor temperature [C] 23.5 23.5
Water loss [%] 5 5
Air flow loss [%] 5 5
Rated pump power consumption [W] 250 250
Area of wind catcher [m2] 9 7.56
Tower cross-sectional area [m2] 25 20.25
Diameter of water droplet [㎛] 30 30
Maximum relative humidity [%] 40 (50) 40 (50)
Minimum ambient temperature [C] 28 (26) 28 (26)
8.4.1 Energy performance
The biggest energy savings appear in the hot-dry climate. As with the previous two types
of buildings, the PDEC integrated strip mall in Deer Valley achieve the biggest energy savings in
electricity since most of occupied hours were feasible for PDEC towers to run. The total
reductions in electricity for cooling and site energy in this particular case are 151.57GJ and
154.67GJ, respectively. On the other hand, the percentage reductions in fans electricity were
only 0.23% in Yuma, 1.18% in Deer Valley, and 1.25% in El Paso since the power consumption
of the unitary fans in the PSZ-AC units operated consistently when the cooling requirements in
the spaces were not met. The one exception to this trend is Sacramento where the percentage
reduction in fans electricity is 19.85%. This is likely because the PDEC towers in Sacramento
meet most of the cooling loads as the ambient air conditions are within the PDEC operational
range. The percentage reductions in cooling electricity and total site energy in the PDEC

168
integrated strip malls are much greater than the other two types of buildings. Those values reach
68.18% in Deer Valley, 59.23% in El Paso, 57.61% in Sacramento, and 47.66% in Yuma. It is
likely because that overall running hours of HVAC systems were greater than the other types of
building, so that possibility of energy saving become high. In addition, since set back
temperature was set to be 3024C, a negative impact, overcooling or heating spaces, of PDEC
towers either at the beginning or at the end of operation was smaller than the others. Both the
HVAC electricity intensity per floor area and peak electrical demand also significantly decreased
in all climates when the PDEC system was used.
Table 8.10 Comparisons of energy performance between typical strip mall building and
PDEC integrated strip mall building in different weather conditions
Base PDEC Reduction
(%) Base PDEC
Reduction (%)
Climate Very Hot-dry Hot-dry
Electricity: Cooling [GJ] 242.9 127.13 47.66 222.31 70.74 68.18
Electricity: Fans [GJ] 99.96 99.73 0.23 105.43 104.19 1.18
Total Site Energy [GJ] 746.13 628.44 15.77 730.23 575.56 21.18
Intensity: HVAC [MJ/m2] 164.02 108.53 33.83 156.79 83.69 46.62
Peak Electrical Demand [GJ] 743.22 627.22 15.61 727.84 575.04 20.99
Water Supplied by Utility [m3] 0 7029.1 -100.00 0 8363.21 -100.00
CO2: Facility [kg] 254110.1 214385 15.63 248829.2 196518.1 21.02
Climate Warm-dry Warm-marine
Electricity: Cooling [GJ] 129.6 52.84 59.23 97.4 41.29 57.61
Electricity: Fans [GJ] 84.2 83.15 1.25 86.48 69.58 19.54
Total Site Energy [GJ] 628.52 541.3 13.88 622.75 523.98 15.86
Intensity: HVAC [MJ/m2] 102.28 65.06 36.39 87.97 53.04 39.71
Peak Electrical Demand [GJ] 614.43 536.62 12.66 582.27 509.26 12.54
Water Supplied by Utility [m3] 0 4222.18 -100.00 0 3686.56 -100.00
CO2: Facility [kg] 210683.3 183606.9 12.85 201070.2 174780.2 13.08
Considerable reductions in carbon dioxide production are also found in all climates.
Carbon dioxide production increases in the primary school building and is slightly reduced in the

169
medium office building. Reductions in carbon dioxide production in the PDEC integrated strip
mall are much bigger than the other two types of buildings (21.02% in Deer Valley, 15.63% in
Yuma, 13.08% in Sacramento, and 12.85% in El Paso) due to longer running hours and greater
cooling demand between set back hours and occupied hours, as described before. In addition, the
total water consumption for the full six-month period is predicted to be 8363m3 in Deer Valley,
7029.1 m3 in Yuma, 4222.18 m
3 in El Paso, and 3686.56 m
3 in Sacramento. As with the previous
two building types, water use in El Paso is approximately 50% of the total in Deer Valley,
showing that the warm-dry climate can achieve significant energy savings with a relatively small
water consumption.
8.4.2 Indoor environment
As similar to the previous two buildings, the PDEC integrated cases have a negative
impact on the indoor thermal environment. The indoor setpoint temperature in base cases is
fairly well met by the conventional systems as shown in Table 8.11. The biggest percentage
increase in the number of hours where the setpoint is not met and the space comfort is
unacceptable is found in the PDEC case in Sacramento where the hours that the indoor setpoint
temperature is not met increases from 1.83hours to 11.67hours. In addition, the total hours not
within the comfortable range increase by 85.3 hours in El Paso, 43.83 hours in Sacramento, 52
hours in Deer Valley, and 13.66 hours in Yuma. These values are much smaller than for the other
building types. No considerable differences are found in the number of hours where the indoor
relative humidity level is below 60% between the base cases and the PDEC cases in all climates.
Overall, the impacts of the PDEC towers on the indoor environment in strip mall are
considerably smaller than the other two building types. It is likely because PDEC towers in this
particular building was well sized better than the other cases, so that problems with PDEC towers,
which impacts overall indoor environment, were considerably decreased.

170
Table 8.11 Comparisons of indoor environment between typical strip mall and PDEC
integrated strip mall in different weather conditions
Base PDEC Reduction
(%) Base PDEC
Reduction (%)
Climate Very Hot-dry Hot-dry
Time Set Point Not Met [Hours] 16.5 0.0 100.00 1.67 0.0 100.00
Time Not Comfortable [Hours] 367.17 380.83 -3.72 140.67 192.67 -36.97
RH < 60% in a classroom [Hours] 3526.53 3511.57 0.42 4185.74 4080.48 2.51
Climate Warm-dry Warm-marine
Time Set Point Not Met [Hours] 0.0 0.0 0.0 1.83 11.67 -537.70
Time Not Comfortable [Hours] 304 389.33 -28.07 85.17 129 -51.46
RH < 60% in a classroom [Hours] 3964.58 3966.82 -0.06 4229.97 4172.2 1.37
8.5 Summary
In this chapter, various case studies have been performed to compare the energy
performance and the cooling performance of PDEC towers in three different building types in
four different climatic regions for a six-month run period. Substantial energy savings are
accomplished in all building types and in all climates by integrating a PDEC system into the
building. While PDEC towers are known to be especially effective in a hot-dry climates, the
warm-dry and warm-marine climates also show a significant potential energy savings when
using PDEC towers. The warm-dry climate was particularly known to be a place where PDEC
towers can be successfully integrated since such energy savings are achieved with a lower water
consumption than a hot-dry climates. In short, the performance of PDEC towers should be
controlled depending on local weather conditions, and they should be considered as a low-energy
solution in warm climates.
While PDEC towers have a number of sustainable feasibilities, many barriers are still
remaining, so that there have been only a few cases that could be successfully integrated in the
cooling of buildings. Therefore, this study was designed to advance the performance of PDEC
towers so that they could be extensively used in many circumstances. To achieve this goal,
efforts have been made to define key barriers with PDEC towers and to find the potential

171
solutions. As a result, poor performance, inefficiency, and strong dependency on weather
conditions were found to be some of key barriers.
On the other hand, absence of methodologies that are able to examine various impacts of
PDEC towers was defined as one of the key barriers. To remedy this gap, a computational model
was developed, and critical parameters as well as their impacts to the performance were
investigated. Based on the findings in the computational analysis, mathematical models were
developed, which have an ability to provide accurate predictions of PDEC air conditions. Energy
performance as well as their definite impacts to the built environment was then analyzed in the
dynamic energy simulations. As a result, the performance control with water flow rate can be
considered as a main solution that could resolve problems with PDEC towers. Meanwhile, the
key findings of this study will be summarized in the following chapter.

172
List of References
ASHRAE, ASHRAE Standard 90.1-2001 - Energy Standard For Buildings Except Low-Rise
Residential Buildings, SI Edition.
Wilcox, S. and W. Marion. 2008. User's Manual for TMY3 Data Sets, NREL/TP-581-43156.
April 2008. Golden, Colorado: National Renewable Energy Laboratory.

173
CHAPTER 9: CONCLUSION
Passive down draft evaporative cooling (PDEC) is designed to capture the wind at the top
of a tower and cool the outdoor air using water evaporation. They have been known to achieve
significant energy savings, to improve the indoor environmental quality, and to reduce the
production of pollution such as carbon dioxide. Many efforts have thus been made to integrate
these cooling systems in buildings in recent decades. Some of these PDEC applications have
been successfully integrated while some of them have not accomplished their low-energy goals.
To date, the potential problems experienced with PDEC systems that have been presented in the
literature have not fully been overcome, and the actual impact of PDEC systems has never been
studied as no existing model is able to fully account for their performance.
This study was thus intended to define what problems PDEC systems currently have, to
understand the fundamentals of evaporative cooling, and to present viable solutions so that
PDEC towers can be more widely utilized as a cooling system in buildings. In the literature
review, the key barriers that must be overcome to advance these systems were defined. A
computational analysis was performed to understand the main physical phenomena that take
place in the passive down-draft cooling processes. With this computational model, the influence
of each critical parameter that significantly affects the cooling performance of PDEC towers was
studied. To support further study on the actual impact of these systems, a mathematical model
that allowed the accurate predictions of PDEC temperature and velocity exit conditions was
developed using regression analysis with the forward selection method. These models were then
implemented into the whole building energy simulation program EnergyPlus in order to
investigate the potential problems and the impact of a typical PDEC system on a typical summer
day. As a result of this study, an alternative control method that can resolve some of the
problems with PDEC towers was presented. The overall impact of PDEC systems in various
building types and climatic conditions was finally investigated for a 6-month period during
cooling season. The main findings obtained from the results of the computational analysis as
well as dynamic energy simulations are summarized below.
The air mass flow rate and the tower configurations were shown in this study to be
critical factors in determining the performance of a PDEC system. While almost all of the

174
models that have been presented in the literature do not account for the air mass flow rate or the
tower configuration, a model developed by Givoni does include the outdoor wind speed as a key
parameter. The Givoni model, however, was developed based on data obtained for a specific
tower configuration that held the tower height, the wind catcher area, and the tower cross-
sectional area fixed. Based on the computational analysis presented in this dissertation, the
cooling performance of PDEC towers significantly varies with both the air mass flow rate and
the ratio of wind catcher area and tower cross-sectional area. The performance of the PDEC
tower improved as the ratio of wind catcher to tower cross-sectional area decreased, which
means that a smaller air mass flow rate in a bigger tower achieved greater temperature drops.
Givoni’s model would thus be inaccurate for other tower configurations since the outdoor air
mass flow rate would be different depending on the wind catcher area. The air mass flow rate
and the ratio between wind catcher area and tower cross-sectional area should thus be included in
the design process as well as the models that predict the performance of PDEC towers.
This dissertation also showed that it is unnecessary for tower heights to be as high as
possible. A trend in initial PDEC tower designs was that their heights were relatively higher than
recent PDEC applications as it was expected that the longer residence time of water droplets
would result in better performance. However, to date, no study has fully dealt with the effects of
tower height. Some studies revealed that the evaporation process takes place mostly at the very
top of the tower, and this finding led to the conclusion that a reasonable tower height can be
defined. A parametric study regarding this parameter was thus performed in this dissertation, and
the findings show that differences in the performance along tower heights considerably
decreased after a certain point depending on the tower cross-sectional area. The ratio between the
tower height and the width of the tower in a square tower configuration that would result in little
variation in air conditions near the bottom of the tower was found to be approximately 2:1, and
this ratio could decrease to 1.5 in wider towers with a width greater than 3m.
This dissertation also determined that a reasonable range of water droplet size that should
be injected into PDEC towers is between 30 ㎛ and 100 ㎛. It is known that finer water droplets
improve overall cooling performance of evaporative cooling components. No previous study,
however, attempted to analyze how significant the impact of the size of the water droplets is to
the overall cooling performance of PDEC systems. A parametric study was thus performed using

175
the computational analysis, and it was found that the cooling performance of PDEC towers
varies significantly with the size of the water droplets. Based on the computational analysis at
two different temperature 30C and 35C and relative humidity levels of 20% and 40% at basic
tower configurations, considerable differences in PDEC air conditions were found when the
droplet size is greater than 100 ㎛ while the differences for droplet sizes finer than 100 ㎛ were
small. In contrast, droplet sizes finer than 30 ㎛ were found to achieve lower cooling outputs
than 30 ㎛. In addition, changing the droplet size during the operation of a PDEC system and
forming an exact droplet size are technically difficult. Thus, a reasonable size for of water
droplets, which can accomplish the best cooling performance in PDEC towers, is between 30 ㎛
and 100 ㎛.
Careful consideration of the water flow rate and its control is also necessary. Water flow
rate is one of the critical parameters that determine the overall cooling performance of PDEC
towers. A tendency shown in the literature was that most of previous studies considered it as a
way to significantly improve the performance of the system. Thus, these studies tended to
increase the water flow rate with no consideration for the other critical factors such as tower
configurations, air mass flow rate, droplet sizes, and local weather conditions, causing a
significant increase in water consumption and humidity level of the spaces due to the saturation
of the air. The effect of this parameter was analyzed in this work using computational analysis to
verify how the cooling capacity of PDEC systems varied and what amount of water would be
ideal in different situations. As a result, the air conditions at the exit of the PDEC tower were
found to vary significantly with an increase in the water flow rate, and the most desirable air
conditions, for example those as close to the wet-bulb depression as possible, can be achieved
with considerably less water than appeared in the literature. In addition, the water flow rate
required to achieve a certain cooling capacity in various situations also varied significantly with
the conditions of other critical parameters. While all of those critical parameters must be
considered in the overall design process of PDEC towers, a more careful design of the water
flow rate should be made in particular when huge water consumption is a key barrier to the
selection of a PDEC system.

176
While typical PDEC towers can reduce the energy consumption of a building
considerably, the control of the performance is critical to maximize the efficiency of these
systems while minimizing the problems with them. Some problems identified in the literature
included inconsistent cooling outputs due to a strong dependency on the ambient weather
conditions and high humidity levels within the space even though considerable energy savings
were accomplished. These problems with PDEC towers were verified in this study using
dynamic simulations. The findings in the simulations show that typical PDEC towers cannot
meet all of the cooling loads in a space since their cooling capacities consistently varied with
ambient weather conditions. They also significantly increased the indoor relative humidity. To
resolve these problems, a number of alternatives were proposed and tested, and the solution that
utilized water flow rate to control the overall cooling performance was shown to be effective in
providing a consistent cooling output for meeting space loads. As a result, the alternative water
flow rate control accomplished significant reductions in both the water consumption and
electricity and achieved almost the same level of thermal environment as a conventional HVAC
system. The cooling capacity of PDEC towers can thus be controlled appropriately to maintain
comfortable conditions while lowering energy consumption despite variations in the local
weather and building conditions.
Another conclusion of this study is that PDEC towers can be more widely used in other
climates beyond just hot-dry regions. PDEC systems have already been proven to be a good
solution to achieve low-energy goals in hot-dry areas. Case studies were thus performed using
the dynamic simulations to verify whether PDEC towers can meet the entire cooling demand in
buildings when the water flow rate control algorithm was employed. As was seen in the Chapter
7, while they could possibly be a reliable cooling system in hot-dry areas, they worsened indoor
environment and increased water consumption in a warm-marine climate. PDEC towers were
thus integrated as a secondary cooling system, and further case studies were performed in three
different types of buildings and four different climates. The results of the previous chapter
showed that PDEC towers with water flow rate control were able to achieve significant energy
savings in all types of buildings and all climates. They accomplished significant energy saving in
warm-dry and warm-marine climate while using approximately 50% of the total water used in
the hot-dry climate. It is thus concluded that PDEC towers can be seriously considered as a low-
energy solution in climates beyond the hot-dry climate.

177
In addition to the findings presented in this study, this study is not without its own
limitations and there is additional work that remains for the future. This study defined the current
status of PDEC technology and their problems, and the water flow rate control was given as a
good solution to overcome those problems. The solution is not definitive because PDEC towers
can still cause a negative impact on the indoor thermal environment when they are
inappropriately designed. The tendency to cause either overcooling or space heating are still seen
in some situations. Thus, more sensitive control algorithms are necessary so that these negative
impacts to cooling load and indoor environment can be resolved. As a result, additional energy
savings and improvements in the indoor environment may be possible if more responsive control
algorithms that factor in local weather conditions as well as building load characteristics are
applied.
In this study, the capability of PDEC towers was investigated in three different types of
building and four different climates. It is observed that they are viable in all these environments.
However, their performances could be different in many other situations such as different types
of buildings as well as many other climatic conditions that were not treated in this study. Further
studies in these different conditions are thus necessary so that some other possibilities to widely
extend their applicability and performance can be demonstrated.
In addition, control setpoint temperature for PDEC towers is directly related to the water
consumption and the energy savings. Lowering the setpoints increases the water consumption
while achieving more energy savings. The cooling setpoints for PDEC towers should thus be
carefully determined according to applicability of the water source and the indoor environment
of the space where PDEC air flows are delivered. It is thus necessary to investigate the potential
energy savings in an optimal condition in various situations so that PDEC towers completely
satisfy all the goals of minimum energy consumption, minimal water consumption, and
improved indoor thermal environment.
Comparison of the predictions of this study with actual buildings performance is
necessary. This study employed three different approaches to present solutions for advancing
PDEC towers’ cooling performance. Many uncertainties are typically involved with these
analyses since assumptions to simplify the solutions are made. As for the most reliable results,
gaps between these computational predictions and actual buildings performance should be

178
properly handled. While almost no data obtained from actual buildings with PDEC towers is
available in the literature, this process is necessary to minimize any uncertainties involved with
computational methodologies used in this study.
Furthermore, pressure characteristics between PDEC towers and a space should be
studied. Overall cooling capacity of PDEC towers may vary when considerable pressure
difference between PDEC towers and the space takes place. Pressurization from a space to
PDEC towers may affect the volume flow rate of PDEC towers as well as the air conditions
within PDEC towers, so that overall cooling capacity of PDEC towers are changed. In addition,
significant energy loss through PDEC towers is expected when they are in this particular
circumstance. A study describing these situations is also helpful to successfully accomplish the
goals of PDEC towers integration in the cooling of buildings.