Advances in AFM for Microbiological Research - Bruker · PDF fileAdvances in AFM for...
26
Bruker AFM Webinar Series 10/19/2011 1 Advances in AFM for Microbiological Research Andrea L. Slade, Ph. D. Life Science Applications Scientist, AFM Unit Nano Surfaces Business 500nm Real-time observation of the effects of antimicrobial peptides (CM15) on live E. coli cells. Data was obtained on a Bruker FastScan TM AFM system operated in TappingMode TM under fluid conditions. Consecutive images were acquired at a rate of 22 sec/frame (1024 x 256 pixels).
Transcript of Advances in AFM for Microbiological Research - Bruker · PDF fileAdvances in AFM for...

Bruker AFM Webinar Series10/19/2011 1
Advances in AFM for Microbiological ResearchAndrea L. Slade, Ph. D.Life Science Applications Scientist, AFM UnitNano Surfaces Business
500nm
Real-time observation of the effects ofantimicrobial peptides (CM15) on live E. colicells. Data was obtained on a BrukerFastScanTM AFM system operated inTappingModeTM under fluid conditions.Consecutive images were acquired at a rate of22 sec/frame (1024 x 256 pixels).
Bruker AFM Webinar Series10/19/2011 2
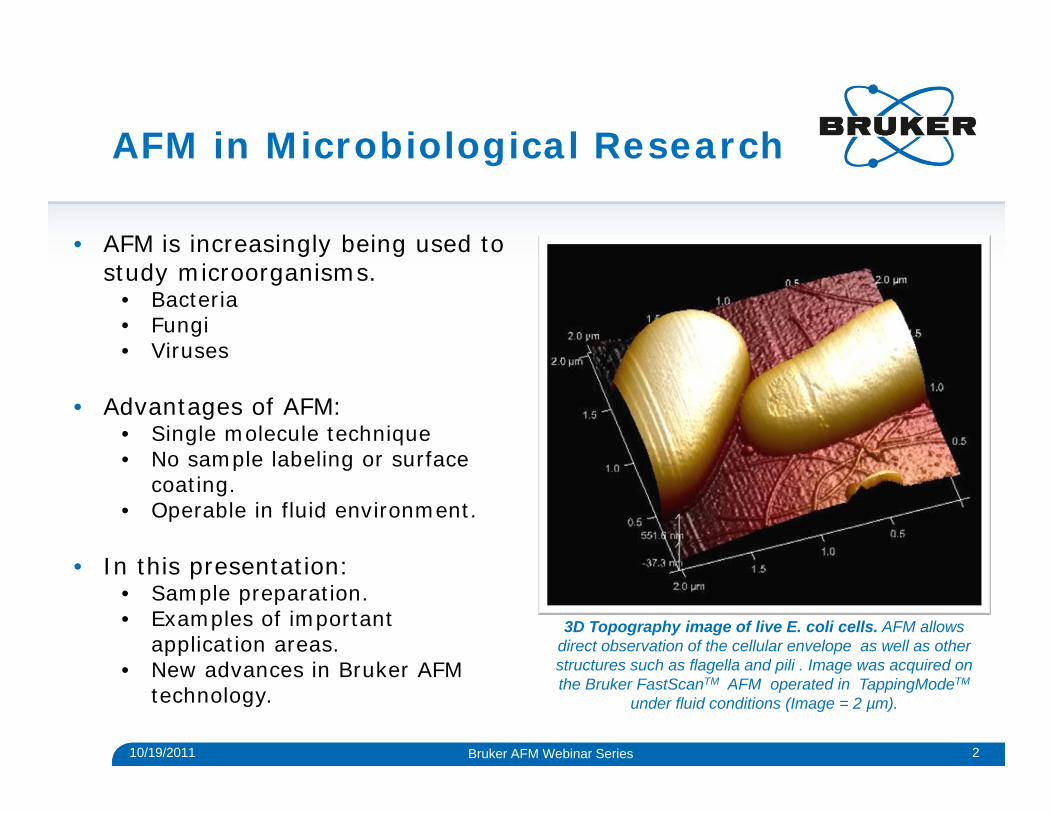
AFM in Microbiological Research
• AFM is increasingly being used to study microorganisms.
• Bacteria• Fungi• Viruses
• Advantages of AFM:• Single molecule technique• No sample labeling or surface
coating.• Operable in fluid environment.
• In this presentation:• Sample preparation.• Examples of important
application areas.• New advances in Bruker AFM
technology.
3D Topography image of live E. coli cells. AFM allows direct observation of the cellular envelope as well as other structures such as flagella and pili . Image was acquired on the Bruker FastScanTM AFM operated in TappingModeTM
under fluid conditions (Image = 2 µm).

Bruker AFM Webinar Series10/19/2011 3
Sample Preparation
• Membrane Proteins• Reconstituted 2D crystals in model membranes• Excised membranes (native)
• Live cells• Mechanically trapped in porous membrane (spherical cells)• Poly-lysine coated substrate• Gelatin-coated substrate
Substrate
Cell + + + + + + + +
Substrate
Cell
Substrate
+ + + + + + + +
Cell

Bruker AFM Webinar Series10/19/2011 4
Microbial Cell Wall Structure
Image obtained using the BioScopeCatalyst operated in TappingMode in
fluid. Sample courtesy of H. Oberleithner, Univ of Muenster.
200nm 20nm
S-Layers Aquaporin OmpF
Bacteriorhodopsin
Image obtained using the MultiModeoperated in Contact Mode in fluid. Image
courtesy of D. Mueller, ETH D-BSSE, Basel.
Image obtained using the MultiModeoperated in Contact Mode in fluid. Image courtesy of D. Mueller, ETH
D-BSSE, Basel.
10nm

Bruker AFM Webinar Series
• Hexagonally Packed Intermediate (HPI) Layer of Deinococcus rediodurans.
• Observed switching between open/closed state.
10/19/2011 5
In situ Observation of Single Molecule Conformational Changes
Images obtained on a MultiMode operated in Contact Mode in fluid. Image (b) was captured 5 min after image (a) showing switching of some pores between open and closed states. Images courtesy of A. Engel, Universitat Basel (J. Bacteriol. (1996) 178: 23025). Inset: Averaged image (35nm) of HPI Layer clearly showing hexamer subunits and central pore.
t = 5 min

Bruker AFM Webinar Series10/19/2011 6
Cellular Imaging
Branching Vegetative Hyphae of Streptomyces coelicolor
Encapsulation of Salmonella typhimurium in EPS.
2 µm 1 µm
Phase image. Data obtained using the MultiModeoperated in TappingModeTM in air. Image courtesy
of Z. Suo & R. Avci, Montana State Univ(Langmuir (2007) 23: 1365).
Phase image. Data obtained using the Dimension 3100 operated in TappingModeTM in fluid. Image courtesy of Z. Suo & R. Avci, Montana State Univ
(J. Bacteriol. (2007) 189: 2219).

Bruker AFM Webinar Series10/19/2011 7
Cell Surface Dynamics
LEFT: A single A. fumigatis conidium trapped in membrane pore. Swelling and ultrastructural changes are observed during germination (4µm image). RIGHT: High-resolution imaging of structural dynamics of conidium surface during germination. Within <3hr, the crystalline rodlet layer changes to a layer of amorphous material. Data obtained using
the MultiMode operated in Contact Mode in fluid (Dague et al. (2008) Biophys. J. 94: 656).
• In situ observation of changes in Aspergillus fumigatus conidia surface structure during germination @ 37°C.

Bruker AFM Webinar Series10/19/2011 8
Probing Microbial Cell Surface Chemistry
Chemical modification of AFM probe enables mapping of hydrophobic
properties of conidium surface (Dague et al. (2007) Nano Lett. 7: 3026).
• In situ observation of changes in Aspergillus fumigatus conidia surface chemistry during germination @ 37°C.
Series of adhesion maps obtained during germination exhibiting acontinuous decrease in surface hydrophobicity. This change in surface
chemistry reflects disruption of rodlets and exposure of underlying hydrophilic spore wall (Dague et al. (2008) Biophys. J. 94: 656).

Bruker AFM Webinar Series10/19/2011 9
Molecular Recognition Imaging
(Dupres et al. (2005) Nature Methods 2: 515)
Force Volume Image
• Interaction forces and 2D Mapping of Adhesins on the surface of Mycobacterium tuberculosis

Bruker AFM Webinar Series10/19/2011 10
Single Cell-Modified AFM Probes
• Single microbial cells attached to AFM probe using amino acid secreted from mussels: 3,4-dihydroxy-L-phenylalanine (DOPA).
• Cells remained viable as determined by fluorescence imaging
(Kang and Elimelech (2009) Langmuir 25: 9656)

Bruker AFM Webinar Series10/19/2011 11
New Advances in Bruker AFM Technology
• Facilitating new avenues of research in Microbiology.
• Improved Ease-of-Use and Quantitative NanomechanicalProperty Mapping with Peak Force TappingTM enabled ScanAsystTM and PeakForceTM
QNMTM.
• Integrated AFM and Optical Microscopy Datasets with The BioScopeTM Catalyst and MIROTM
Software.
• Increased productivity without compromising data quality with the high-speed imaging capabilities of FastScanTM.

Bruker AFM Webinar Series10/19/2011 12
Z position
Surf
ace
Time
approaching withdraw
Peak tapping force
How PeakForce Tapping Works:
The Z position is modulated at a small amplitude, we measure a series of very fast force curves, at least once per pixel.
The peak force of each of these curves is used as the feedback signal
This force can easily be <100 pN, about 10x lower than typical with TappingMode
PeakForce Tapping Standard Data Types:
Height, Peak Force Error, and Phase
PeakForce TappingControls and measures force as feedback signal
Bruker AFM Webinar Series10/19/2011 13
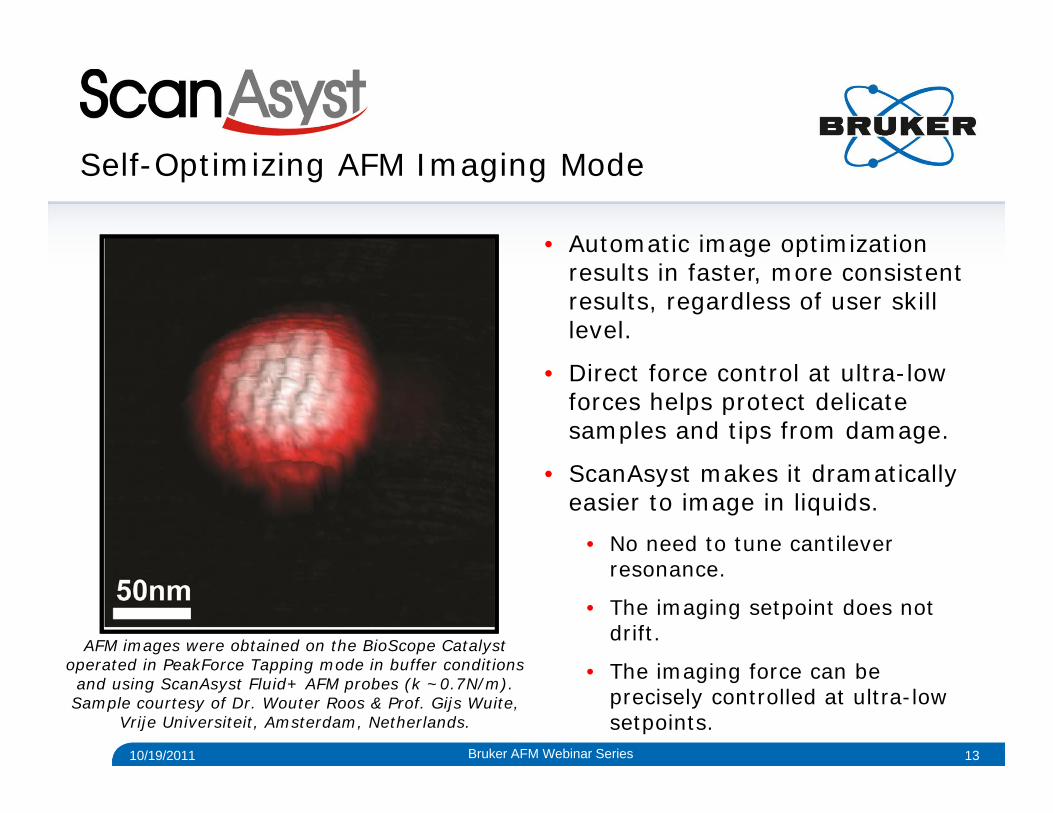
Self-Optimizing AFM Imaging Mode
• Automatic image optimization results in faster, more consistent results, regardless of user skill level.
• Direct force control at ultra-low forces helps protect delicate samples and tips from damage.
• ScanAsyst makes it dramatically easier to image in liquids.
• No need to tune cantilever resonance.
• The imaging setpoint does not drift.
• The imaging force can be precisely controlled at ultra-low setpoints.
AFM images were obtained on the BioScope Catalyst operated in PeakForce Tapping mode in buffer conditions and using ScanAsyst Fluid+ AFM probes (k ~0.7N/m). Sample courtesy of Dr. Wouter Roos & Prof. Gijs Wuite,
Vrije Universiteit, Amsterdam, Netherlands.

Bruker AFM Webinar Series10/19/2011 14
Quantitative Nanomechanical Property Mapping
• Simultaneously obtain quantitative modulus, adhesion, dissipation, and deformation data while imaging topography at high resolution
• Direct force control keeps the imaging force low, which limits indentation depths to deliver non-destructive, high-resolution imaging
• Material properties can be characterized over a very wide range to address samples in many different research areas (kPA –GPa)
Forc
e
Separation
Stiffness: DMT model
Peak Force Imaging
Adhesion Imaging
Dissipation
Stiffness Fit

Bruker AFM Webinar Series10/19/2011 15
Differences in the Mechanical Properties of Live & Dead Bacteria:Integrated AFM & Fluorescence Imaging• The BioScopeTM Catalyst and MIROTM Software allowed correlation of
live/dead fluorescence images with PeakForceTM QNM images of individual E. coli cells.
• Definitive identification of live & dead cells.
3 m 3 m
Peak Force Error Image Live/Dead Fluoresecence Image
Images were obtained on a BioScopeTM Catalyst integrated with a Zeiss Axiovert 200 IOM and operated in PeakForceTM Tapping Mode in fluid. E. coli cells were labeled with live /dead assay (green/red, respectively) and
immobilized on a gelatin-coated glass bottom Petri dish. Images courtesy J. Shaw, Bruker-Nano Inc.

Bruker AFM Webinar Series10/19/2011 16
• Fluorescence images can be used to navigate the AFM probe to specific points on a surface to conduct localized nanomechanical property measurements (eg. Membrane Elasticity).
Substrate > Live Cells > Dead Cells
Images were obtained on a BioScopeTM Catalyst integrated with a Zeiss Axiovert 200 IOM and operated in Force Spectroscopy Mode in fluid. Images courtesy J. Shaw, Bruker-Nano Inc.
Differences in the Mechanical Properties of Live & Dead Bacteria:Optically-Guided Point & Shoot Force Spectroscopy
Separation (nm)
Forc
e (n
N)
Black: Live Blue: DeadPink: Substrate
1nN
0 50 1003 m
Live/Dead Fluorescence Image
+
+
+++
+++
+++

Bruker AFM Webinar Series10/19/2011 17
• Live E. coli cells were fairly uniform in deformation (elasticity) while dead cells were more hetergeneous with areas of increased deformation (softer – less elastic).
• Live and dead cells showed no differences in adhesion.
Images were obtained on a BioScopeTM Catalyst integrated with a Zeiss Axiovert 200 IOM and operated in PeakForceTM Tapping Mode in fluid. Images courtesy J. Shaw, Bruker-Nano Inc.
Differences in the Mechanical Properties of Live & Dead Bacteria:PeakForceTM QNM Mechanical Property Mapping
3 m 3 m

Bruker AFM Webinar Series10/19/2011 18
Dimension FastScanTM
High-Speed AFM
Bruker FastScanTM Probes(f = 1.25-0.25 MHz)
Data acquired on the Dimension FastScanTM operated in PeakForceTM Tapping in fluid at 58sec/frame, 512 x 512 pixels. Image courtesy of S. Hu, (Bruker-Nano
Inc.) in collaboration with I. Medalsy, D. Mueller (ETH D-BSSE, Basel)
50nm

Bruker AFM Webinar Series10/19/2011 19
High-Speed Imaging of Microbial Cell Wall Structures
58 Seconds per Frame
50nm
5.493.17
r (nm)
The acquired BR data, after background subtraction. The 2D-FFT reflects the hexagonal symmetry of the protein crystal. The Spectrum shows good symmetry (low distortion). The inner maxima represent the unit cell, the outer ones the trimeric sub-structure, as expected from the XRAY crystallography data (zoom, PDB model). The central pore is well resolved. Data acquired on the Dimension FastScanTM operated in PeakForceTM Tapping in fluid at 58sec/frame, 512 x
512 pixels. Image courtesy of S. Hu, (Bruker-Nano Inc.) in collaboration with I. Medalsy, D. Mueller (ETH D-BSSE, Basel)

Bruker AFM Webinar Series10/19/2011 20
vHigh-Speed Imaging of Cell Dynamics:Real-time observation of AmP Activity on E. coli cells
• Antimicrobial Peptides (AmPs)• Naturally occuring• Small Mol Wt. (<50aa’s)• Part of innate immune response
• Potential therapeutic agents.
• Several mechanisms of activity proposed.
• Membrane Disruption• Intracellular Targets
• All must penetrate the cell membrane.
• Cecropin-melittin (CM15) previously examined by HS-AFM.
Fantner et al. (2009) Nat. Nanotech.
(http://www.bbcm.univ.trieste.it/~antimic/researchAlfa-HelicalPeptides.html)
Proposed mechanisms of AmP activity. Some models suggest that AmPs facilitate cell death by disruption of the cell membrane while
others suggest cytoplasmic targets and disruption of metabolic functions to bring about cell death. In all cases, the AmP must
transverse the outer cell membrane. Image from the Antimicrobial Peptides Laboratory, Univ. of Trieste, Italy

Bruker AFM Webinar Series10/19/2011 21
• Cells exposed to 10 µg/mL CM15.
• Dramatic changes to cell morphology with increase in roughness and corrugation of cell surface.
Andra et al. (2008) Biochem. J.Fantner et al. (2009) Nat. Nanotech.Hartmann et al. (2010) Antimicrob. Agents & Chemother.
• Changes due to incorporation of CM15 into LPS-rich outer membrane.
• Onset of changes to individual cells occurred at different times.
Fantner et al. (2009) Nat. Nanotech.
• Images obtained at 18 sec/frame with 1024 x 256 pixels.
Data acquired on the Dimension FastScanTM system operated in TappingModeTM in fluid, using 8um wide, 150kHz (fluid) EBD tipped CL (Nanotools). Phase data channel is shown. Images
courtesy of A. Slade & J. Kindt, Bruker–Nano Inc.
500nm
High-Speed Imaging of Cell Dynamics:Real-time observation of AmP Activity on E. coli cells

Bruker AFM Webinar Series
• Structures on surface of cells resembling S-layers.• S-layers previously imaged on live bacteria under growth conditions
that promoted their production.Dupres et al. (2009) Langmuir.
• Image obtained at 34 sec/frame with 1024 x 1024 pixels.
10/19/2011 22
(a) Topography image of E. coli cell surface showing structures resembling S-layers. (b) & (c) 2D FFT Data acquired on the Dimension FastScanTM system operated in TappingModeTM in fluid, using 8um wide, 150kHz (fluid) EBD tipped CL
(Nanotools). Images courtesy of A. Slade & J. Kindt, Bruker–Nano Inc.
High-Speed Imaging of Cell Dynamics:High-Resolution Imaging of Native Membrane Structures
1µm
50nm 50nm 50nm
ca b
Dupres et al.

Bruker AFM Webinar Series10/19/2011 23
Data acquired on the Dimension FastScanTM system operated in TappingModeTM in fluid, using 8um wide, 150kHz (fluid)
EBD tipped CL (Nanotools). Height Sensor data channel is shown. Images courtesy of A. Slade & J. Kindt, Bruker–Nano Inc.
High-Speed Imaging of Cell Dynamics:Real-time observation of AmP Activity on Membrane Structures
• Cells exposed to 20 µg/mL CM15.
• Onset of disruption of cell membrane surface observed within 30sec after exposure.
• Membrane rippling /corrugation.• Membrane protrusions consistent
blebbing/vesiculation.• Formation of ‘pore-like’ lesions
(<15nm width).
• Images obtained at 8 sec/frame with 1024 x 256 pixels.
• Total elapsed time = 358 sec.100nm
Bruker AFM Webinar Series10/19/2011 24
High-Speed Imaging of Cell Dynamics:Real-time observation of AmP Activity on Membrane Structures
10/19/2011
+CM15
1µm1µm
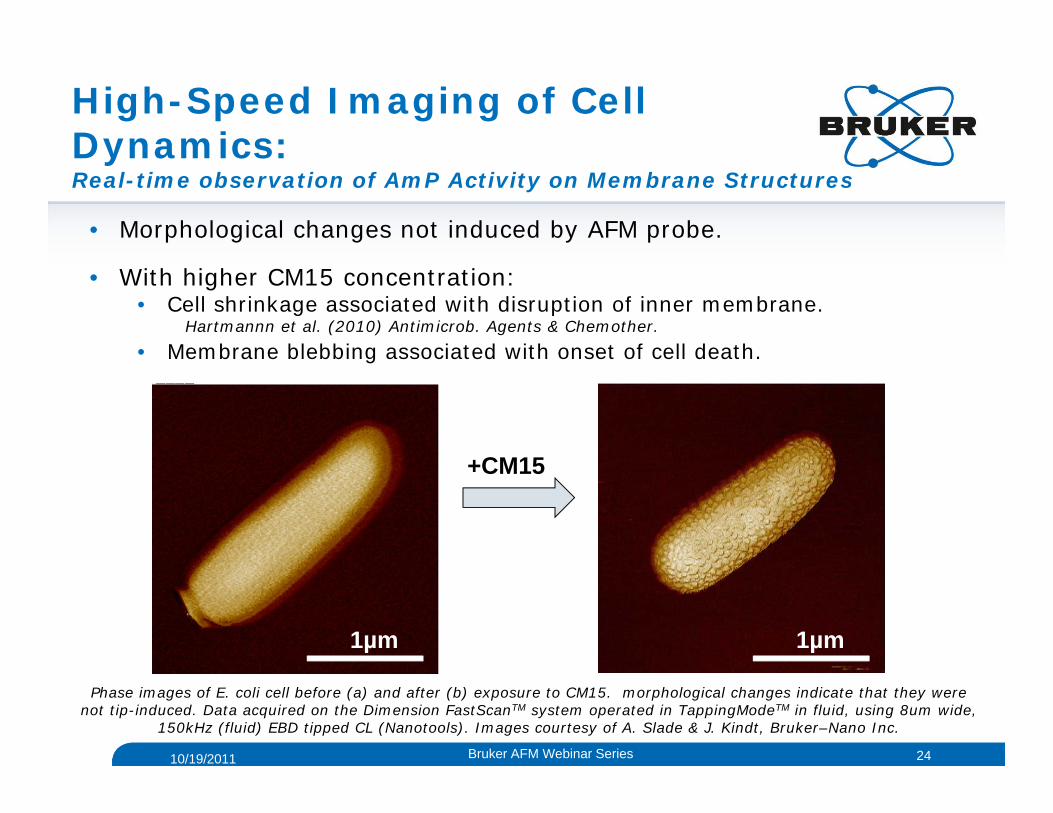
• Morphological changes not induced by AFM probe.
• With higher CM15 concentration:• Cell shrinkage associated with disruption of inner membrane.
Hartmannn et al. (2010) Antimicrob. Agents & Chemother.
• Membrane blebbing associated with onset of cell death.
Phase images of E. coli cell before (a) and after (b) exposure to CM15. morphological changes indicate that they were not tip-induced. Data acquired on the Dimension FastScanTM system operated in TappingModeTM in fluid, using 8um wide,
150kHz (fluid) EBD tipped CL (Nanotools). Images courtesy of A. Slade & J. Kindt, Bruker–Nano Inc.

Bruker AFM Webinar Series10/19/2011 25
Summary
• AFM is increasingly being used to study microorganisms.
• Bacteria• Fungi• Viruses
• AFM has provided unique insights into microbial cells.
• Structure• Physical Properties• Dynamic Processes
• New advances in Bruker’s AFM Technology are providing new avenues of research in microbiology
• BioScopeTM Catalyst with MIROTM
• ScanAsystTM and PeakForceTM QNMTM
• Dimension FastScanTM
Real-time observation of the dynamic effects of AmPs on bacterial cell membranes. Data
acquired on the Dimension FastScanTM system operated in TappingModeTM in fluid, using 8um
wide, 150kHz (fluid) EBD tipped CL (Nanotools). Height Sensor data channel is shown.
Images courtesy of A. Slade & J. Kindt, Bruker–Nano Inc.
100nm

Bruker AFM Webinar Series10/19/2011 26
contact me at:
Andrea Slade, [email protected] More Info: nanoscaleworld.bruker-axs.com
Thank-you for your attention!
www.bruker-axs.com/webinars_afm
www.bruker-axs.com/afm-archives