

Advancements in Implementing Operational Risk, Stress ...
63
Advancements in Implementing Operational Risk, Stress Testing and Risk Appetite for ORSA Institute of Actuaries of Japan Joshua Corrigan Principal, Milliman 5 March 2014
Transcript of Advancements in Implementing Operational Risk, Stress ...

Advancements in Implementing Operational Risk, Stress Testing and Risk Appetite for ORSAInstitute of Actuaries of Japan
Joshua CorriganPrincipal, Milliman
5 March 2014

2 © 2014 Milliman
Contents
1. The Evolution of ERM2. Technical Developments
a) What you knowb) What you seec) Relationships
3. Applications:a) Operational Riskb) Risk Appetitec) Stress Testingd) Interest Rate Risk

The Evolution of ERM
Section 1

4 © 2014 Milliman
The Evolution of ERM
Risk Management ERM 1.0 ERM 2.0
The Dawn of Risk Management
Basic analysis of individual risk types
Attempts to understand variation in key factors.
The Era of ALM and Financial Risk
Development of ALM to capture balance sheet
interactions.
Acceleration of financial risk techniques.
Results aggregated to the enterprise level.
The Era of Reward and Governance
Perspective of risk as related to reward.
ORSA
Concept of risk appetite.
Focus on management as well as measurement.
The Era of Culture and Resilience
Embedding of risk and understanding it through
culture.
Resilience concept emerges.
Focus on risk dynamics and interrelationships
ERM 3.0
Prediction Explanation

5 © 2014 Milliman
ORSA Becoming a Global Standard
What business decisions do we need to take given we are exposed to risk and uncertainty?
Risk
P&L and Balance Sheet Modelling
Uncertainty
Scenarios
BusinessDecisions
Embedding
6 © 2014 Milliman
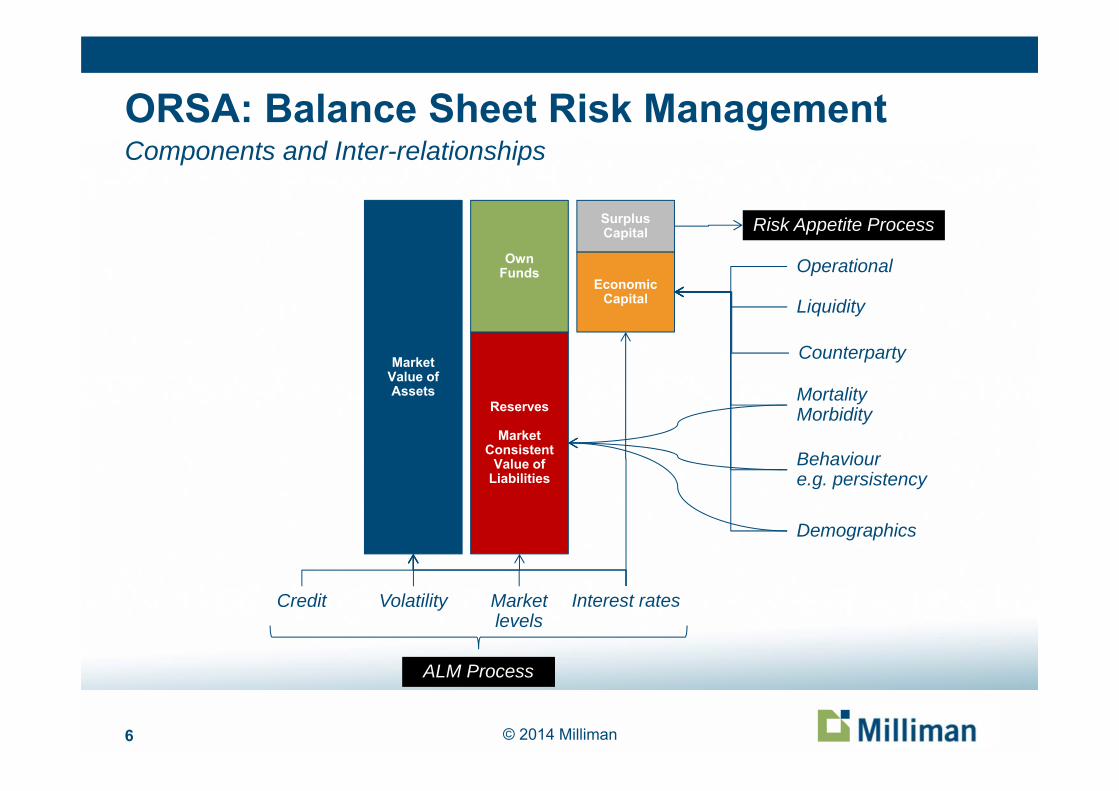
ORSA: Balance Sheet Risk ManagementComponents and Inter-relationships
MarketValue ofAssets
Reserves
MarketConsistent
Value ofLiabilities
OwnFunds
EconomicCapital
SurplusCapital
Interest ratesMarket levels
Volatility
Demographics
Behavioure.g. persistency
MortalityMorbidity
Credit
Operational
Liquidity
Risk Appetite Process
ALM Process
Counterparty

7 © 2014 Milliman
ORSA: P&L Risk ManagementUnderstanding the drivers of P&L uncertainty
Sales
ManufacturingCosts
ExpenseCosts
Operational RiskCosts
Operating ProfitMargins
Sustainability of growthQuality of business
Multiple interrelated drivers of demand (e.g. behaviour, economics)
DistributionCosts
Alignment of incentives b/w customer, distributor, manufacturer
Persistency risk, churn
Quality of u/w and pricing processExperience of demographic, market and behavioural risks
Operational capacity, availability, utilisation, productivity
Economic, market drivers
Direct hit to the bottom lineNeed to manage these risks (e.g.
fraud, mis-selling, mis-pricing)
Earnings and margin uncertainty driven by complex interaction
between above factors

8 © 2014 Milliman
Prediction ≠ ExplanationNeed to move from pure statistical to causal risk frameworks
Which different events could cause me to
lose this much?

9 © 2014 Milliman
Complexity / Connectivity / EmergenceWEF Global Risks Map 2013
Complex systems mean you can’t understand the whole by only studying the sum of the parts.
It is the inherent and dynamic relationships between risks, causal drivers and outcomes that is key.
Simple measures of dependency such as linear correlation are
typically misleading
Risks relating to complex adaptive systems exhibit emergent
properties

10 © 2014 Milliman
Current and Emerging Challenges
Risk governance Risk processes Operational risk ORSA pillar 2
– Strategic / holistic risk assessment– Operational risk– Risk appetite– Scenario / stress testing– Risk interdependencies– Risk reporting
Operational risk systems
Resilience Risk culture Behavioural risks Emerging risk Reverse stress testing Risk dynamics and inter-relationships
through systems science Causal light models focused on
explanation, not just prediction Risk engagement with business Integration of predictive analytics
ERM 2.0 ERM 3.0

Technical DevelopmentsWhat you know
Section 2a

12 © 2014 Milliman
Companies are Complex Adaptive SystemsRisk is an undesirable outcome of a complex system
Traditional Risk Management Frameworks
Statistical models, assuming constant driversRegisters assuming single characteristicsScenarios “imagined”Emerging risks by spotting events
Frameworks based on complex systems
Descriptions of risk profile taken holisticallyScenarios derived from risk profileModels integrate all types of informationEmerging risks spotted early from system
Risk management can be hard if looked at it through the wrong lens

13 © 2014 Milliman
Data is only part of the information set
What you know: judgment What you see: data
The System: information
OutcomesInputs
interactions

14 © 2014 Milliman
“If the data was lost by a partner there would be contractual issues to resolve which
would strain the relationship and there would be damages to claim. This could
cause a loss of confidence in the partner themselves..”
Describing the System

15 © 2014 Milliman
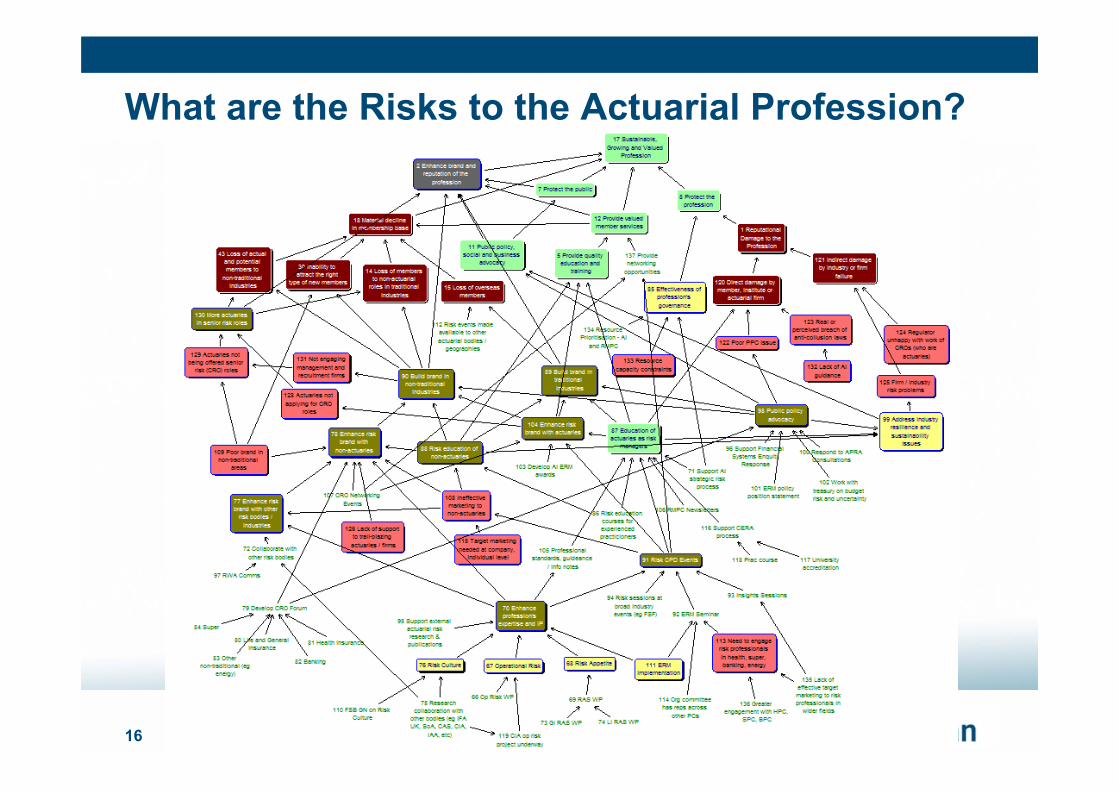
Produce a “minimally complex” summary
Find the most important elements of the “system”
Ultimately connected to many nodes
Immediately connected to many nodes
Identify unfinished explanations more clearly
Cognitive Analysis
Nodes which lead to multiple highly connected nodes
16 © 2014 Milliman
What are the Risks to the Actuarial Profession?
27 February 2014

17 © 2014 Milliman
Relative Importance of Risk Drivers

18 © 2014 Milliman
Deriving the Full Risk ProfileForced Outage Causal Drivers
Dominated by asset management drivers and other potent drivers Note multiple feedback loops: e.g. Quality of people, maintenance strategy

Technical DevelopmentsWhat you see
Section 2b

20 © 2014 Milliman
Using Data to Move Beyond Point EstimatesWhat do key risk indicators (KRIs) tell us about the likelihood of each type of risk outcome?
“There is a 5% chance of no occurrence”
“There is a 40% chance of impact size A”
“There is a 5% chance of impact size D”
“There is a 25% chance of impact size B and C”
KRI 1
KRI 2

21 © 2014 Milliman
Causal Modelling with Bayesian InferencePrediction with Explanation
Causal modelling techniques can be used to formally demonstrate how indicators flow through to the business outcomes being studied. Framework retains the dynamic links between causes and losses so risks are viewed in context and incorrect conclusions from silo-thinking are avoided.
Causal Model Enhanced AnalysisMinimally Complex View
Translate minimally
complex map into causal
model
Calibrate Bayesian
Network and carry out analysis

22 © 2014 Milliman
A Bayesian Approach
Bayesian networks are a method which can integrate dependencies directly between trigger events, risk drivers, and consequences
Simultaneously assess all levels of outcomes (profit, capital) Can think of the prior as the “theory”, and the evidence as “observation”
– All scientific fields use Bayesian statistics, so why don’t we!
)()()./()/(
)()./(),()()./(),(
BpApABpBAP
ApABpABPBpBApBAP
where
P(A) is the priorP(A/B) is the posteriorP(B/A)/P(B) is the evidence

23 © 2014 Milliman
What is a Causal Model?
A causal model is one which conditions outcomes directly upon a set of interrelated causal factors Causal factors are defined
directly in terms of business language It captures the complex
web of interrelationships and dependencies directly from the outset

24 © 2014 Milliman
Simple BN Case Study - Flood Model
Outcomes:– Prob(Flood)
Risk indicators– Rain (forecast)– Dam levels (avg)
Risk mitigants– Quality of flood
defenses (measurable but uncertain)
27 February 2014
Source: AgenaRisk

25 © 2014 Milliman
Risk Monitoring
Prior water = medium
Risk level changes as the states of causal drivers change
27 February 2014
Consistent states of other variables calculated using Bayesian inference

26 © 2014 Milliman
Reverse Stress Test
Flood = 100% What does the
system look like? Bayesian inference
used to resolve states of related drivers This is how we
resolve risk appetite statements into consistent risk driver limits
27 February 2014

Technical DevelopmentsRelationships
Section 2c

28 © 2014 Milliman
Unsupervised vs Supervised Techniques
Derivation of rules / algorithms to search data to uncover correlations
and patterns
Decision trees Random forests Neural nets Nearest neighbours Support vector machines Cluster modelling Mutual information
Human judgment required to either structure the analysis or as an
information source itself
Linear multifactor regression Conditional / Bayesian probability Non-linear copulas Cognitive mapping Bayesian networks Phylogenetics Network analysis
29 © 2014 Milliman
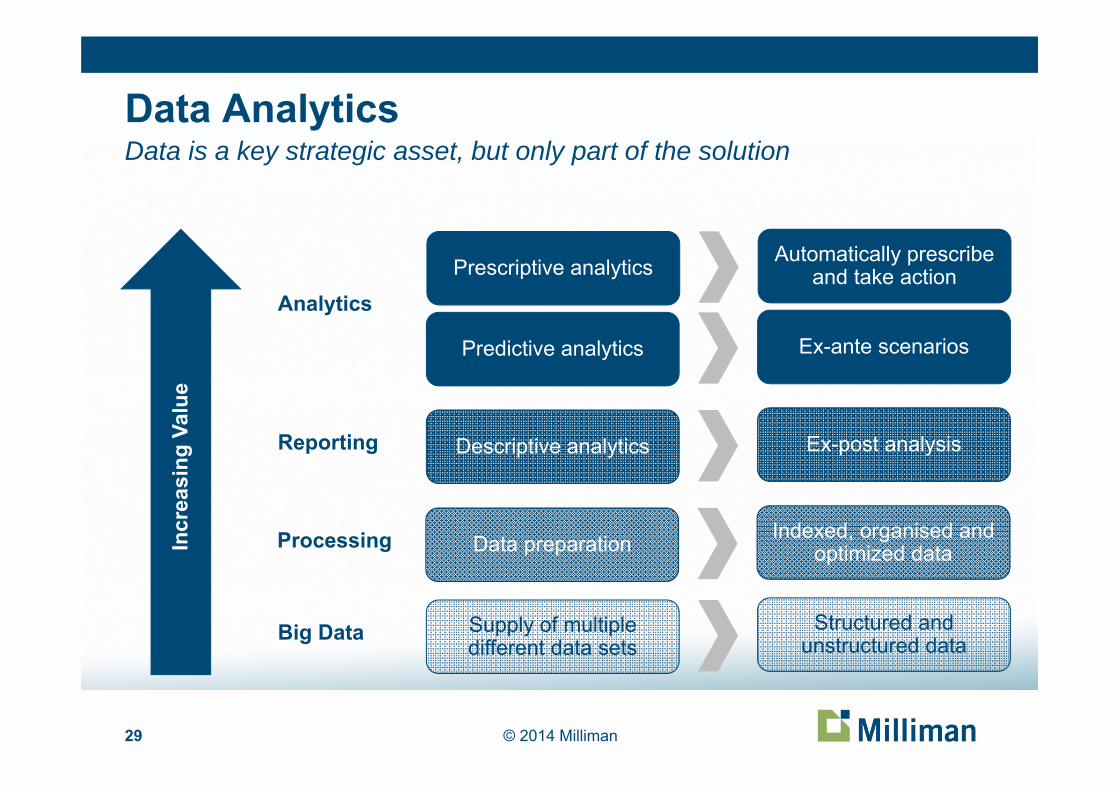
Data AnalyticsData is a key strategic asset, but only part of the solution
Incr
easi
ng V
alue
Supply of multiple different data sets
Big Data Structured and unstructured data
Data preparationProcessing Indexed, organised and optimized data
Descriptive analyticsReporting Ex-post analysis
Predictive analytics
Analytics
Ex-ante scenarios
Prescriptive analytics Automatically prescribe and take action

30 © 2014 Milliman
Information Theory Shows us the Way
Perhaps the most critical question in risk management:“Do I have any information upon which to condition an outcome / risk
driver etc. and what quality level do I place on it?”
Information theory concepts:– Entropy: quantifies the uncertainty involved in predicting the value of a
random variable– Mutual information: quantifies the amount of information in common
between two random variables
I(x) = -log p(x)
In light of no other information, the principle of maximum entropy applies: all outcomes are equally likely

31 © 2014 Milliman
Connectivity – Capturing Non-Linearity Typical correlation measures cannot spot
non-linear dependency Mutual information sharing can
Different levels of correlation
~ U[0,2]R ~ U[4, 5]X = R cos Y = R sin
Sample of 1000
Example
Correlation = 0.0Mutual Info = 1.0

32 © 2014 Milliman
Assessing Network Connectivity & ComplexityNon-linear measures of dependence are critical
2004 Peak of complexity
2003 2005
Complexity changes significantly over the year, with several of the key drivers changing between 2003 to 2005
Produced by Milliman using

33 © 2014 Milliman
Aggregate Loss – Dependency Structure A profoundly
different way of aggregating risks
Diversification at all parts of the loss distribution can now be explained by the states and interrelationships of business drivers
No need for abstract correlations, copulas

34 © 2014 Milliman
Correlation from CauseValidating Dependency Structures
Correlations measure a degree of co-variation. You can determine this co-variation for complex phenomena by using causal models of their dynamic relationships.
The models more naturally allow for an understanding of regime shifts in behaviours and allow you to meaningfully stress dependency parameters used in other models.
=

ApplicationsOperational Risk
Section 3a
Milliman Research Report 2013

36 © 2014 Milliman
Risk - Failure to recruit, retain and develop staffCognitive Map Analysis
Key concepts: – Impacts: customer service worsens, quality of work deteriorates– Drivers: failure to provide adequate staff training, unmanageable
work volume, failure to align staff with business needs– Controls: staff appraisal process, performance management
process
Map properties
Property CheckLinks: Nodes ≥ 2 : 1
Hyperconnectivity
Heads (% of Nodes) 3%
"Heads" all impacts?
"Tails" (% of Nodes) 21%
Free nodes?
Loops?

37 © 2014 Milliman
Risk - Failure to recruit, retain and develop staffRisk Quantification using a Bayesian Network
Aggregate Loss:– Mean: Xm– 99.5%: Ym
Sources of loss: Unbudgeted recruitment, training and resourcing costs
Business inputs: Resourcing , Training and Recruitment budgets
Sensitivity Analysis:

38 © 2014 Milliman
Operational Risk Capital
0
20
40
60
80
5.34 1.82 1.5614.26
1.28 1.16 4.83 4.30
36.52
1.83 1.53
29.29
45.13
010203040506070
5.512.731.5715.74
1.291.164.834.30
24.66
1.831.53
27.41
37.74
Uni
que
Com
mon

39 © 2014 Milliman
Assessing Extreme Risk EventsRogue Trader Scenario

ApplicationsRisk Appetite
Section 3b
Peter Clark award for best paper in 2012 in
UK Profession

41 © 2014 Milliman
Primary Risk Appetite Challenge:Aggregating / cascading RAS thresholds risk limits
Knowing how these ...to produce these...interact...
It is essentially a large, complex multi-objective optimisation and control challenge

42 © 2014 Milliman
Risk Appetite Components
Planned outcome Tolerated outcome Frequency Preferences
Sources of uncertainty
Objectives
Business drivers
Adaptation and emergence make this “hard”

43 © 2014 Milliman
Business Objectives Linked to Risk Sources
Risk Sources:– Market– Credit Counterparty Default– Liquidity– Underwriting– Operational
Contribution of risk source to overall risk set from:– Capital analysis– Profit analysis– Expert judgment

44 © 2014 Milliman
Identify Sources of Uncertainty for Each Risk
Credit:– Reinsurance counterparty– Distribution counterparty– Derivative counterparty (or
classified under market)
Market:– Equity– Credit spreads– Inflation– Foreign exchange– Interest rate

45 © 2014 Milliman
Model now links business objectives to sources of risk and indicators
Capture multiple influences: operational risk in particular links to more than one risk characteristic

46 © 2014 Milliman
Setting Risk Appetite
Use propagation properties of Bayesian Networks
Setting an outcome here…
…tells us what the states ought to be here

47 © 2014 Milliman
Setting desired appetite levels at the top, translates into information about underlying limits e.g. counterparty credit
Propagating Evidence Down

48 © 2014 Milliman
Monitoring Risk Levels Against Appetite
Use propagation properties of Bayesian Networks
…gives us an estimate of risk levels here
Entering observed values here…

49 © 2014 Milliman
Propagating Evidence Up
Entering actual observed indicator values gives information about risk levels versus appetite

ApplicationsStress Testing
Section 3c
Award for “Practical Risk Management Applications” at ERM Symposium 2013

51 © 2014 Milliman
Stress / Scenario Testing:Overload But Incomplete
They are actually specific examples contributing to the
aggregate loss of type X
These are lots of different variations we thought of for
how loss type X could happen
…but so are these that we didn’t think of!

52 © 2014 Milliman
Codifying Business IntelligenceCognitive Mapping & Analysis
3. Collapsed view provides a ‘minimally complex’ description of the system Retains the key features
necessary to understanding drivers of uncertainty
1. Detailed notes from each workshop used to translate the risk discussion into cognitive maps separate cognitive maps
merged together to give complete description of risk profile
2. Connectivity analysis identifies key features of risk system

53 © 2014 Milliman
Identifying Critical DriversHighly connected drivers across the various silos
Structure of the map broadly reflects the key areas discussed within the workshops– Financial, Agent Channel, Product,
Customer, Reputation, External, Bank Sales Channel
Visually represents the distinct risk profile of each sales channel
Cognitive analysis identified key
interactions between the risk profiles
External
Agent Channel
Bank Sales Channel
Financial
Reputation
Product
Customer

54 © 2014 Milliman
Qualitative Scenario CreationUnderstand full narrative of causes to consequences
1. Minimally complex view of the system studied to identify interesting pathways between concepts
“The life company does not deliver effective agent training with respect to current regulation, industry best practice, and product knowledge. This leads to
a gradual decline in the ability of sales agents to offer compliant advice and meet required sales
standards.
Out-of-date and incomplete sales advice leads to increased incidence of product mis-selling across
the business’s product offering.
A build up of customer complaints is picked up by industry press and the regulator decides to review
current sales practise.”
2. Pathways used as a framework for the scenarios, with additional context included from the full cognitive map
55 © 2014 Milliman
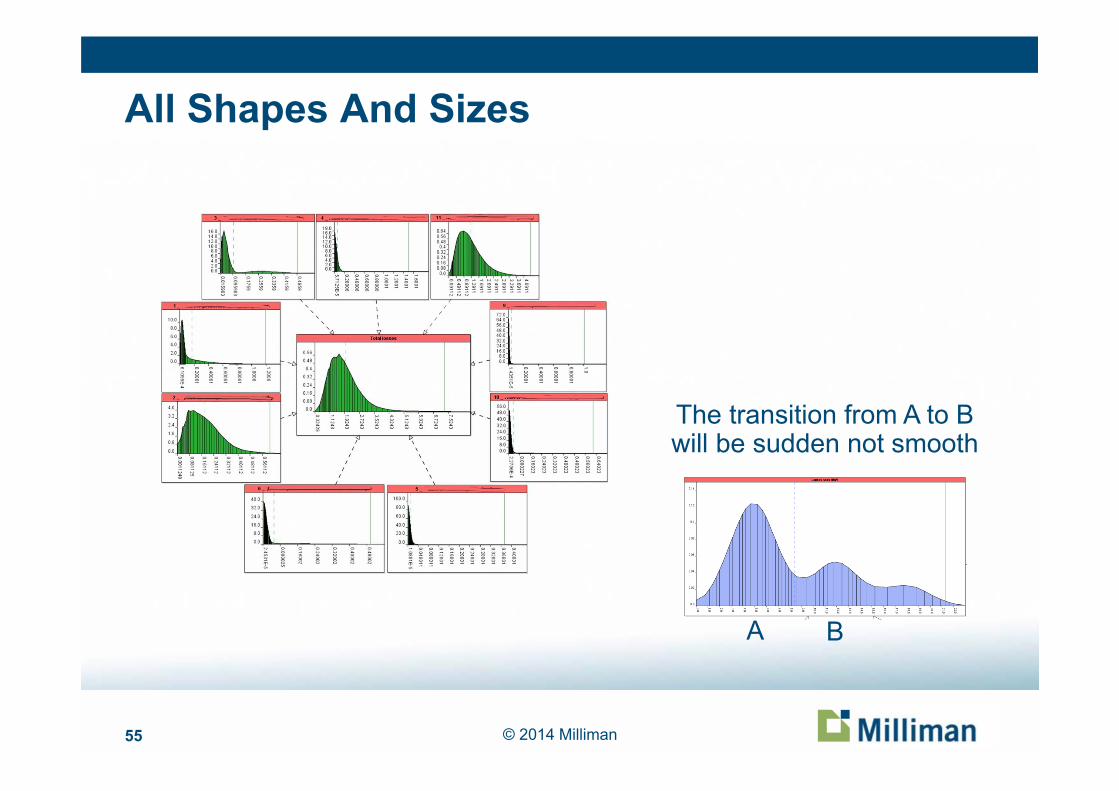
All Shapes And Sizes
The transition from A to B will be sudden not smooth
A B

56 © 2014 Milliman
Recovering ScenariosPandemic
Civil Unrest
Travel Disruption
Reverse Stress

ApplicationsInterest Rate Risk
Section 3d

58 © 2014 Milliman
Causal Factor Explanation of Corporate Bonds
‐10
‐5
0
5
10
15
20
25
2001 2002 2003 2004 2005 2006 2007 2008 2009 2010 2011 10 Years
Corporate Bond Total Return Decomposition by Year and 10 Year Annualised
Real Cash Rate Realised Inflation Cash Duration RP Nominal Duration RP Credit Spreads Total Return

59 © 2014 Milliman
Long Term US S&P Return Decomposition
Source: Priest et al (2007)
21.5
0.1
8.9
18.9
7.7
5.8
17.218
‐1.7
10.2
‐15
‐10
‐5
0
5
10
15
20
25
1927‐29 1930‐39 1940‐49 1950‐59 1960‐69 1970‐79 1980‐89 1990‐99 2000‐05 1927‐05
Dividends EPS Growth P/E Change Combined Effects Total Return

60 © 2014 Milliman
1 GDP
2 Expected Inflation
3 Real Cash Rate
4 Cash Duration RP
5 Nominal Cash Rate
6 Nominal CashReturn
7 Real Duration RP
8 Inflation IndexedBond Return
9 Real Govt Yields
10 Nominal Govt BondReturn
11 Nominal GovtYields
12 InflationDuration RP
13 BreakevenInflation
14 Nominal CorpYield
15 Nominal Corp BondReturn
16 Credit Spread RP
17 Default Losses
18 Consumption
19 Investment 20 Net Exports
21 Productivity 22 Employedworkforce
23 Market sentiment
24 Volatility
25 P/E Ratio
26 SustainableEarnings Growth
27 Cyclical EarningGrowth
28 CorporateProfitability
29 Dividend Yield
30 Equity Return
31 Property Return32 Rental Yields
33 Valuation Level
34 Demand / supplybalance
35 Derivative Pricesand Returns
36 Swap Rates
Eliciting the Causal System Structure to Understand Inter-relationships

61 © 2014 Milliman
Modelling Full Dynamic Risk Factor Distributions
Condition uncertainty in key capital market variables upon risk factors / drivers (subjective & objective)

62 © 2014 Milliman
This presentation has been prepared for illustrative purposes only. It should not be further distributed, disclosed, copied or otherwise furnished to any other party without Milliman’s prior consent.
No reliance should be placed on the results or graphs presented herein and no inference made about the appropriateness of the different bases presented. In particular, independent verification and professional advice should be sought when establishing company bases and assumptions for the purposes of pricing, valuation and transaction purposes etc.
Actual experience may be more or less favourable than the assumptions and illustrations presented in this presentation. To the extent actual experience differs from these, so will actual results differ from those presented.
Disclaimer