Advanced Video Activity Analytics (AVAA): Human ...
54
ARL-TR-8255 ● DEC 2017 US Army Research Laboratory Advanced Video Activity Analytics (AVAA): Human Performance Model Report by Beth M Plott, Patricia L McDermott, and Michael Barnes Approved for public release; distribution is unlimited.
Transcript of Advanced Video Activity Analytics (AVAA): Human ...

ARL-TR-8255 ● DEC 2017
US Army Research Laboratory
Advanced Video Activity Analytics (AVAA): Human Performance Model Report by Beth M Plott, Patricia L McDermott, and Michael Barnes Approved for public release; distribution is unlimited.

NOTICES
Disclaimers
The findings in this report are not to be construed as an official Department of the Army position unless so designated by other authorized documents. Citation of manufacturer’s or trade names does not constitute an official endorsement or approval of the use thereof. Destroy this report when it is no longer needed. Do not return it to the originator.

ARL-TR-8255 ● DEC 2017
US Army Research Laboratory
Advanced Video Activity Analytics (AVAA): Human Performance Model Report by Beth M Plott and Patricia L McDermott Alion Science and Technology, Boulder, CO Michael Barnes Human Research and Engineering Directorate, ARL
Approved for public release; distribution is unlimited.

ii
REPORT DOCUMENTATION PAGE Form Approved OMB No. 0704-0188
Public reporting burden for this collection of information is estimated to average 1 hour per response, including the time for reviewing instructions, searching existing data sources, gathering and maintaining the data needed, and completing and reviewing the collection information. Send comments regarding this burden estimate or any other aspect of this collection of information, including suggestions for reducing the burden, to Department of Defense, Washington Headquarters Services, Directorate for Information Operations and Reports (0704-0188), 1215 Jefferson Davis Highway, Suite 1204, Arlington, VA 22202-4302. Respondents should be aware that notwithstanding any other provision of law, no person shall be subject to any penalty for failing to comply with a collection of information if it does not display a currently valid OMB control number. PLEASE DO NOT RETURN YOUR FORM TO THE ABOVE ADDRESS.
1. REPORT DATE (DD-MM-YYYY)
December 2017 2. REPORT TYPE
Technical Report 3. DATES COVERED (From - To)
April 2015 – June 2016 4. TITLE AND SUBTITLE
Advanced Video Activity Analytics (AVAA): Human Performance Model Report
5a. CONTRACT NUMBER
W911NF-10-D-0002 5b. GRANT NUMBER
5c. PROGRAM ELEMENT NUMBER
TO 0016 6. AUTHOR(S)
Beth M Plott, Patricia L McDermott, and Michael Barnes 5d. PROJECT NUMBER
5e. TASK NUMBER
5f. WORK UNIT NUMBER
7. PERFORMING ORGANIZATION NAME(S) AND ADDRESS(ES)
Alion Science and Technology 4949 Pearl E. Circle, #100 Boulder, CO 80301
8. PERFORMING ORGANIZATION REPORT NUMBER
ARL-TR-8255
9. SPONSORING/MONITORING AGENCY NAME(S) AND ADDRESS(ES)
Army Research Laboratory ATTN: RDRL-HRM-A Aberdeen Proving Ground, MD 21005-5425
10. SPONSOR/MONITOR'S ACRONYM(S)
ARL-HRED 11. SPONSOR/MONITOR'S REPORT NUMBER(S)
12. DISTRIBUTION/AVAILABILITY STATEMENT
Approved for public release; distribution is unlimited.
13. SUPPLEMENTARY NOTES
14. ABSTRACT
This report describes the initial human performance modeling effort of the Advanced Video Activity Analytics (AVAA) system. AVAA was designed to help US Army Intelligence Analysts exploit full-motion video more efficiently and effectively. The goal of the modeling effort is to provide an understanding of the current state of the system with respect to the impact on human performance and workload and the predicted impact of enhanced computer vision algorithms on overall system performance (e.g., throughput, operator workload) in the context of realistic missions. Modelers used Command, Control, and Communications—Techniques for Reliable Assessment of Concept Execution (C3TRACE) to develop task network models for forensic and real-time intelligence gathering. Data from future field experiments can be incorporated into the basic modeling environment to validate and extend the preliminary results. This human performance modeling effort was conducted as part of a larger human systems integration effort to evaluate the usability and effectiveness of AVAA.
15. SUBJECT TERMS
video analytics, full-motion video, human systems integration, Advanced Video Activity Analytics, AVAA, cognitive workload, computational model, human factors, assessment, human performance
16. SECURITY CLASSIFICATION OF: 17. LIMITATION OF ABSTRACT
UU
18. NUMBER OF PAGES
54
19a. NAME OF RESPONSIBLE PERSON
Michael Barnes a. REPORT
Unclassified b. ABSTRACT
Unclassified
c. THIS PAGE
Unclassified
19b. TELEPHONE NUMBER (Include area code)
520-538-4702 Standard Form 298 (Rev. 8/98)
Prescribed by ANSI Std. Z39.18

Approved for public release; distribution is unlimited. iii
Contents
List of Figures v
List of Tables v
1. Introduction 1
1.1 Background 1
1.2 Human Performance Modeling 2
2. Method 2
2.1 Evaluations 3
2.2 Scenarios 4
2.2.1 Forensic Scenario 5
2.2.2 Real-Time Scenario 8
2.3 Discrete Event Simulation using C3TRACE 11
2.3.1 Step 1: Define the Personnel 12
2.3.2 Step 2: Define the Functions and Tasks 13
2.3.3 Step 3: Define the Communication Events 16
2.3.4 Step 4: Execute the Analysis 17
2.3.5 Step 5: Analyze Results 17
2.4 Workload 17
2.5 Model Initialization 20
3. Results 21
3.1 Mission Performance 21
3.1.1 Forensic Mission 21
3.1.2 Real-Time Mission 22
3.2 Workload 23
4. Conclusion 25
5. References 27

Approved for public release; distribution is unlimited. iv
Appendix A. Task List 29
Appendix B. Task Diagrams 39
List of Symbols, Abbreviations, and Acronyms 43
Distribution List 45

Approved for public release; distribution is unlimited. v
List of Figures
Fig. 1 Forensic mission overview ................................................................... 5
Fig. 2 Forensic mission timeline ..................................................................... 6
Fig. 3 AVAA screenshot with V-NIIRS rating graph ..................................... 8
Fig. 4 Real-time mission overview ............................................................... 10
Fig. 5 Convoy overwatch timeline ................................................................ 11
Fig. 6 AVAA operators modeled .................................................................. 13
Fig. 7 Top-level network in C3TRACE ........................................................ 14
Fig. 8 Forensics mission lower-level task network in C3TRACE ................ 15
Fig. 9 Real-time mission lower-level task network in C3TRACE ................ 16
Fig. 10 AVAA communication events ............................................................ 16
Fig. 11 Workload profile from real-time mission ........................................... 18
List of Tables
Table 1 V-NIIRS ................................................................................................ 7
Table 2 Auditory workload scale ..................................................................... 19
Table 3 Cognitive workload scale .................................................................... 19
Table 4 Psychomotor workload scale .............................................................. 20
Table 5 Visual workload scale ......................................................................... 20
Table 6 Forensic mission performance ............................................................ 22
Table 7 Real-time mission performance .......................................................... 23
Table 8 Forensics operator workload ............................................................... 24
Table 9 Real-time operator workload .............................................................. 25

Approved for public release; distribution is unlimited. vi
INTENTIONALLY LEFT BLANK.

Approved for public release; distribution is unlimited. 1
1. Introduction
1.1 Background
This report describes the initial human performance modeling effort that was performed in support of the Advanced Video Activity Analytics (AVAA) program. The modeling effort focused on task network modeling for the operations of the US Army intelligence analyst using the AVAA system for forensic (post-hoc) and real-time intelligence gathering. An example forensic mission and an example real-time mission were identified and modeled. This human performance modeling effort was a task performed as part of the human systems integration support provided to the AVAA project by the US Army Research Laboratory (ARL) field element at Fort Huachuca, Arizona, and Alion Science and Technology.
The AVAA system is slated to serve as the sole full-motion video (FMV) exploitation capability for the Distributed Common Ground Station-Army. AVAA’s objective is to dramatically reduce the analyst’s cognitive workload and enable faster and more accurate production of intelligence products (Swett 2013). It is envisioned that the completed version of AVAA will assist analysts by automatically analyzing, annotating, and organizing massive volumes of video. The AVAA architecture consists of a Video Processing and Exploitation Framework (VPEF), a Video Data Model (VDM), a VPEF Distributed Server and Client, and a VDM Annotated Web Service. The architecture is such that computer vision algorithms (CVAs) can be inserted as plug-ins to enable new and emerging capabilities to replace or supplement existing capabilities in the framework.
The goal of the modeling effort is to provide the AVAA team an understanding of the current state of the system with respect to the impact on performance and the predicted impact of enhanced CVAs on overall system performance (e.g., throughput and operator workload). The primary objective is to document the tasks performed and use simulation modeling to analyze how different capabilities might affect operator workload and task performance during use of the AVAA system in realistic missions. Data from future field experiments can be incorporated into the basic modeling environment to validate and extend these preliminary results.
A computer model was developed using Command, Control, and Communications—Techniques for Reliable Assessment of Concept Execution (C3TRACE) to simulate the tasks that the intelligence analyst performs when using AVAA under forensic or real-time situations. C3TRACE is a discrete simulation modeling tool that can represent organizations, people, tasks, and communication patterns as a function of information flow and information quality.

Approved for public release; distribution is unlimited. 2
1.2 Human Performance Modeling
Task network, or discrete event, modeling is a technology that has proven useful for predicting human-system performance. In a task network model, human performance of an individual performing a function is decomposed into a series of subfunctions, which are then decomposed into tasks. The sequence of tasks is defined by constructing a task network. Complex task network models can include thousands of unique tasks with many interdependencies and complex decision logic.
Task network modeling is an approach to modeling human performance in complex systems that has evolved for several reasons. Task analyses organized by task sequence are the basis for the task network model. Second, in addition to complex operator models, task network models can include sophisticated submodels of hardware and software to create a closed-loop representation of the human‒machine system. Third, task network modeling is relatively easy to use and understand. Lastly, it is more cost effective and can be done before, or in concert with, running human-in-the loop experiments.
Because models are run on computer systems, there are no practical limitations on the number of trials or simulation runs that can be made. Models can be programmed to include provisions for user-input values for parameters and rules (e.g., number of operators, type of interface, and environmental conditions), thereby allowing different performance conditions to be simulated. This permits the investigation of possible changes in operator or crew performance that can occur in response to changes in other aspects of the simulated context and objects. Changes include the timing of events, variation of performance shaping factors (e.g., stress, time available, quality of procedures, fatigue, and crew coordination quality), and the availability of crew members (i.e., whether normally staffed or minimally staffed). Because models allow users to vary parameters and run conditions for multiple iterations, simulations represent a resource for generating information about operator and crew performance and providing high statistical power.
2. Method
The computational analysis included 3 major steps. First, data were collected on system performance (number of videos required), human performance (time and accuracy), and workload during the data collection events (Section 2.1). Second, representative scenarios were developed to describe realistic tasks involved in a forensic mission and a real-time mission. Third, a discrete event simulation model was developed.

Approved for public release; distribution is unlimited. 3
2.1 Evaluations
Data for the models were collected at 5 different events and from one reference (STP 34-35G14SM-TG). The data sources are listed and described as follows:
1) A Pilot Test Experiment in April 2014: The pilot test was conducted at the Experimentation & Analysis Element (EAE) at Fort Huachuca from April 14, 2014 to April 17, 2014. Data collection was a joint effort among ARL, Alion Science and Technology, and AVAA contractors from Chenega and EOIR Corporation. There were a total of 6 participants. Participants used AVAA during realistic, scenario-based missions to search, select, view, and annotate FMV. Participants did one scenario set in the Baseline condition and one scenario set in the Video National Imagery Interpretability Rating Scale (V-NIIRS) condition that included videos with moderate to high V-NIIRS ratings V-NIIRS is a widely used scale to rate the interpretability of a given image. A scenario set included 5 tasks, each with a different time, date, V-NIIRS range (if applicable), and target to locate.
2) A Full Experiment in June 2014: The first full experiment was conducted from June 10, 2014 to June 12, 2014 in the EAE facility at Fort Huachuca. The objective was to empirically validate the filtering capabilities (time, location, and V-NIIRS ratings) of AVAA for performance improvement and for workload reduction. There were a total of 8 participants. Many of the techniques used in the pilot study were replicated in the June assessment. More specific operational context was given to the analyst during instructions and mission tasking for the June event compared with the April pilot test. In the June experiment, we collected data on how experienced analysts used AVAA to look for and annotate targets (McDermott et al. 2015). The analysts were given an operational context to read and were instructed to find a specific target in each scenario; they were also given a list of possible targets that were deemed of intelligence significance and told to report their attributes using the annotation tools.
3) Subject-matter expert (SME) interviews in December 2014: An SME was interviewed on December 4‒5, 2014 at Fort Huachuca. The SME was currently employed at EOIR Corporation and previously served in the US Army for 13 years as a Geospatial Intelligence Imagery Analyst (Military Occupational Specialty [MOS] 35G). The goal of the SME interview was to discuss and obtain data on realistic forensic and real-time scenarios as

Approved for public release; distribution is unlimited. 4
well as data on the functions and tasks that an intelligence analyst would perform in these scenarios.
4) Real-time demonstration event in January 2016: A demonstration event was held at the US Army Aviation and Missile Research, Development and Engineering Center Joint Systems Integration Lab (JSIL) at Redstone Arsenal in Huntsville, Alabama, from January 11‒15, 2016. Experienced analysts watched real-time simulated video using AVAA software. Data collection was a joint effort among ARL, Alion Science and Technology, AVAA contractors from Chenega and EOIR Corporation, and members of the JSIL Human Factors team.
5) A second full experiment with SME interviews in February 2016: A second full experiment was conducted from February 9, 2016 to February 11, 2016 in the EAE facility at Fort Huachuca. The data collection exercises were in 4-h segments, each with 3‒5 Soldiers or staff. There were a total of 27 participants. All subjects completed one scenario with automated person, vehicle, object (PVO) detections and one without PVO. Each scenario had eighteen 1-min videos that were grouped into a playlist. In addition to performing the tasks in the experiment, participants were questioned about the scenarios and tasks for the human performance model, described in more detail in Section 2.2.
Additional task data was obtained from the Soldier’s Manual and Trainer’s Guide for Imagery Analyst MOS 35G, Skill Level 1, 2, 3, and 4 (STP 34-35G14-SM-TG).
2.2 Scenarios
As documented in STP 34-35G14-SM-TG,
“Full motion video (FMV) data is received from manned and unmanned aircraft. The term FMV refers to motion imagery with a temporal resolution of 30+ frames per second. Other video sources may include human intelligence (HUMINT) sources, combat camera (COMCAM) operations, commercial news broadcasts (such as CNN or the Foreign Broadcast Information Service, FBIS), aircraft cockpit video (ACV), and weapon system video (WSV). FMV can provide information to analysts on the motion of objects being imaged, multiple perspectives of a fixed object, or a combination thereof. Exploitation of FMV can be either near real-time or post mission or follow-on exploitation. Near real-time reconnaissance, surveillance, and target acquisition can be used to view preselected targets and conduct open-ended searches, with the intent to extract and disseminate intelligence information in a timely fashion. Post-mission or follow-on

Approved for public release; distribution is unlimited. 5
exploitation involves the post-real time extraction of useful intelligence information from FMV, such as the battle damage assessment (BDA) from ACV or WSV imagery.”
Analysts from Alion Science and Technology worked with an SME with 13 years as a Geospatial Intelligence Imagery Analyst (MOS 35G) to develop forensic and real-time scenarios that were realistic yet challenging to be used in the human performance modeling effort. Function/task analyses were then conducted to document the tasks performed during each scenario.
2.2.1 Forensic Scenario The forensic mission starts with human intelligence reports of suspected weapons smuggling. The analysis is conducted in non-real time. The area of operations is new—there have been no previous assets in the area gathering intelligence. Figure 1 illustrates the hypothetical area of operations for the scenario. The border is approximately 100 miles long. There are 10 possible border crossings to monitor: 3 known border crossing checkpoints and 7 suspected crossing points. The airspace in the neighboring country is restricted.
Fig. 1 Forensic mission overview
The Army sends manned and unmanned aircraft to the area to gather intelligence about the area. Assets gather intelligence data for 2 weeks at a rate of 16 h/day of

Approved for public release; distribution is unlimited. 6
aerial coverage. Once the FMV gathering is complete the analyst begins forensic analysis of the data using AVAA. The FMV analysis and product development (e.g., briefing slides) cover approximately 72 h.
A high-level timeline is shown in Fig. 2.
Fig. 2 Forensic mission timeline
AVAA will also include filtering capabilities to help narrow down the total number of FMVs to be screened and focus on the FMVs that are most likely to contain scenes of interest. One such filter capability is the V-NIIRS filter. The V-NIIRS ratings are automatically generated by AVAA and the associated plug-in. The ratings and examples of targets that can be identified with each rating are shown in Table 1 (Federation of American Scientists 2014). Each frame in the video is given a rating; therefore, a single FMV will have a range of V-NIIRS ratings.

Approved for public release; distribution is unlimited. 7
Table 1 V-NIIRS
V-NIIRS rating Identifiable targets 0 Interpretability of the imagery is precluded by obscuration,
degradation, or very poor resolution. 1
[over 9.0 m ground resolved distance (GRD)]
Detect a medium-sized port facility and/or distinguish between taxi-ways and runways at a large airfield.
2 [4.5‒9.0 m GRD]
Detect large static radars. Detect large buildings (e.g., hospitals, factories).
3 [2.5‒4.5 m GRD]
Detect the presence / absence of support vehicles at a mobile missile base. Detect trains or strings of standard rolling stock on railroad tracks (not individual cars).
4 [1.2‒2.5 m GRD]
Detect the presence of large individual radar antennas. Identify individual tracks, rail pairs, control towers.
5 [0.75‒1.2 m GRD]
Identify radar as vehicle-mounted or trailer-mounted. Distinguish between SS-25 mobile missile TEL and Missile Support Vans in a known support base, when not covered by camouflage.
6 [0.40‒0.75 m GRD]
Distinguish between models of small/medium helicopters. Identify the spare tire on a medium-sized truck.
7 [0.20‒0.40 m GRD]
Identify ports, ladders, vents on electronics vans. Detect the mount for antitank guided missiles (e.g., SAGGER on BMP-1).
8 [0.10‒0.20 m GRD]
Identify a handheld small-arms munition (e.g., SA-7/14, REDEYE, STINGER). Identify windshield wipers on a vehicle.
9 [ less than 0.10 m GRD]
Identify vehicle registration numbers on trucks. Identify screws and bolts on missile components.
For the forensic mission the analyst can perform 2 different types of searches on the FMV. The first search is a basic date/time search which will return all 224 h of FMV collected in the previous 2 weeks. The second type would be to filter the FMV using the V-NIIRS rating. Using the filter causes AVAA to return the FMVs that have the requested V-NIIRS rating in at least one frame within the video—this allows users to filter out low-quality videos. In addition, the V-NIIRS feature displays a visualization of the changing V-NIIRS rating over the course of an FMV. Figure 3 shows the V-NIIRS rating graph below the video feed. The graph aligns with the timeline, and analysts can click on a point in the graph to view video of a specific rating. This can be useful in directing analysts to video sections with a higher zoom or focus, which may be due to an object of interest in the field of view.

Approved for public release; distribution is unlimited. 8
Fig. 3 AVAA screenshot with V-NIIRS rating graph
The 224 h of video would be broken into segments that can be filtered. The analyst would look at one segment at a time. Data collected at the June 2014 experimental event showed that 55% fewer FMVs were evaluated when using the V-NIIRS filter. The model was able to use this data to compare the baseline (unfiltered) with V-NIIRS data (see Table 1). The analyst chooses an FMV to view. While watching the FMV, the analyst looks for and annotates anything that cannot be readily explained (e.g., why is someone in this location? why is something moving?) and anything unofficial such as an unofficial checkpoint. The analyst repeats this process with additional videos. The analyst uses the information collected to build a product that shows suspicious activity and persistent inconsistencies.
2.2.2 Real-Time Scenario The real-time mission selected is a convoy overwatch scenario, in which a convoy of 20 vehicles carries supplies to a destination 35 miles away. The convoy is overwatched by 2 air assets (aircraft). This is a common scenario that analysts are involved in during real-time operations. To make the scenario more interesting, 2 off-nominal but realistic events have been inserted. The first event is small-arms fire occurring when the assets are flying to the forward operating base (FOB). The

Approved for public release; distribution is unlimited. 9
second event is the presence of improvised explosive device (IED) indicators detected during the convoy march.
The scenario assumptions are the following:
• 2 air assets assigned to the overwatch mission
• 20 vehicles in convoy—gunners out of hatch with a 50-cal gun
• Supply convoy for Army/Air Force exchange
• Moving to another province 35 miles away during the day
• Travel approximately 30 mph
• Day time vehicle spacing used: 100 m between vehicles
• There is a town 15 min into the route that the convoy will bypass
• Customer is Special Forces Task Force
• Assume mission, route, and 2‒3 alternate routes have been planned and a smaller convoy has driven the route previously
The scenario can be broken down into 4 phases:
1) Pre-Mission: During this phase the pre-mission brief is conducted, the mission preparation is conducted, and communications are verified. This phase ends when the assets take off approximately 1 h before the scheduled convoy start time.
2) En-Route to the FOB: This phase covers the movement of the assets to the convoy location. The analyst is watching the video to identify essential elements of information or anything suspicious. A small-arms fire event occurs 15 min into the flight, which causes the analyst to alert the shift manager and give a size, activity, location, unit identification, time, and equipment (SALUTE) report. The assets are then delayed to keep eyes on the situation and the analyst takes pictures until another asset can be re-tasked to the area. At that time, the assets continue to the planned FOB.
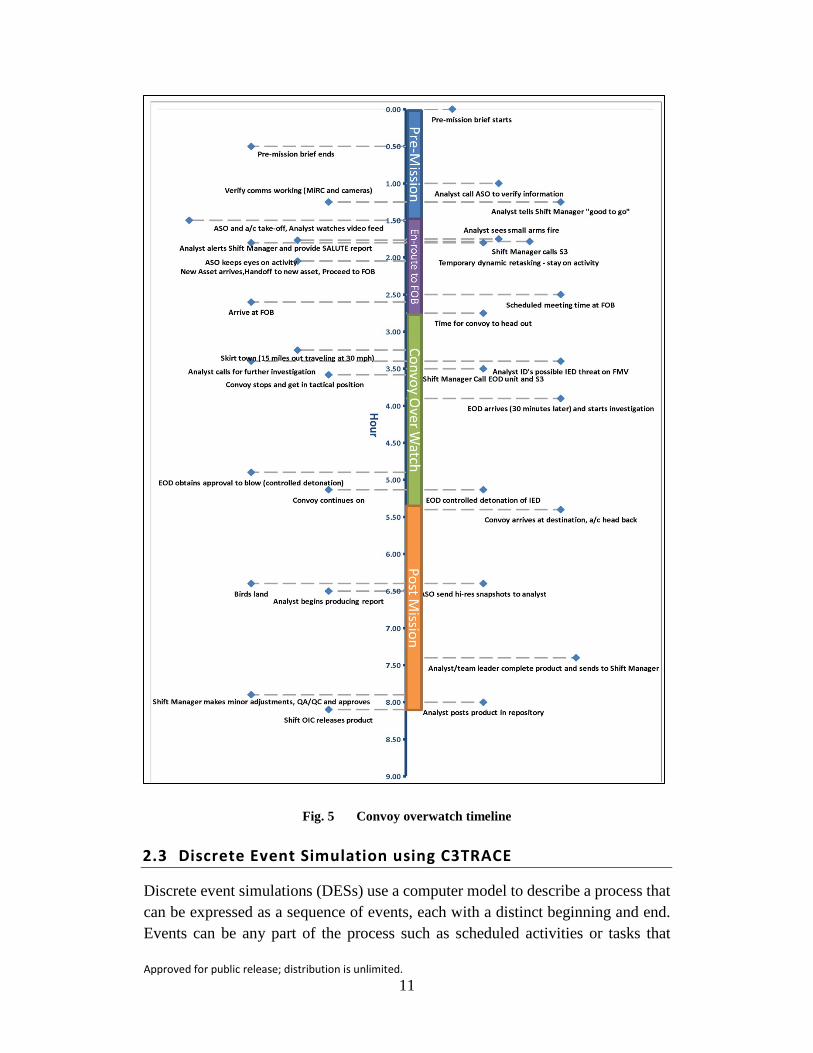
3) Convoy Overwatch: The aircraft (air assets) arrive at the FOB and the analyst reconnoiters the area. The convoy and air assets move from the FOB to a destination in another province approximately 35 miles away. About 15 min into the mission, the convoy makes a planned detour around a village. About 20 miles in, the analyst identifies likely indicators of IEDs. The convoy halts, and sets up in formation. An explosive ordnance disposal (EOD) team is called. While waiting for the EOD, further checks of the area

Approved for public release; distribution is unlimited. 10
are conducted to ensure that no secondary devices are emplaced on the road and no snipers are concealed nearby. Approximately 1 h later, the EOD team arrives and performs a controlled detonation. The convoy then continues on the route. Once the convoy has arrived safely, the air assets return to base.
4) Post-Mission: After the mission is complete, the intelligence product is produced and release.
The convoy overwatch overview is shown in Fig. 4 and the mission timeline is shown in Fig. 5. The dashed gray line indicates a border.
Fig. 4 Real-time mission overview
Approved for public release; distribution is unlimited. 11
Fig. 5 Convoy overwatch timeline
2.3 Discrete Event Simulation using C3TRACE
Discrete event simulations (DESs) use a computer model to describe a process that can be expressed as a sequence of events, each with a distinct beginning and end. Events can be any part of the process such as scheduled activities or tasks that

Approved for public release; distribution is unlimited. 12
represent the flow of the process. The tasks are displayed schematically on a diagram called the task network diagram, which is the basis of the model. DES tools allow users to perform risk analyses by building models that predict possible results by substituting a probability distribution for any factor that has inherent uncertainty. By using probability distributions, variables have different probabilities of different outcomes occurring. During the simulation execution, values are sampled at random from the input probability distributions. Each set of samples is called an iteration, and the resulting outcome from that sample is recorded. DES repeats this assessment hundreds or thousands of times (depending on user-specified settings), and the result is a probability distribution of possible outcomes. In this way, DES provides a comprehensive view of a variety of possible outcomes. It tells analysts not only what could happen, but how likely it is to happen.
C3TRACE is a DES tool that can be used to evaluate different organizational concepts of command and control and the impacts of information flow on the quality of decisions (Kilduff et al. 2005; Plott et al. 2006). This tool provides the capability to represent any organization, the people assigned to that organization, the tasks and functions they will perform, and a communications pattern within and outside the organization, all as a function of information flow and information quality. C3TRACE uses Micro Saint Sharp (Alion Science and Technology, McLean, VA) a commercially available embedded discrete event task network modeling language, as its engine. Task-level information is used to construct networks representing the task flow for processing tasks relevant to specific missions. C3TRACE is owned and distributed by ARL’s Human Research and Engineering Directorate.
C3TRACE was chosen because it is a versatile tool for modeling environments like AVAA, where operators are performing discrete tasks and information is constantly being updated.
The steps required performed to develop the AVAA model in C3TRACE are described in the following subsections.
2.3.1 Step 1: Define the Personnel The first step was to define the operators that make up the organization. In C3TRACE, this is accomplished by adding sections and operators into a hierarchical tree diagram. There is no set limit to the numbers of levels in the organizational hierarchy or the number of operators represented. The modeler can select personnel attributes for each operator. These attributes include military training level, military rank, length of service, battle command experience, and

Approved for public release; distribution is unlimited. 13
MOS. A modeler can also set various model constraints such as the number of simultaneous tasks an operator can perform, workload threshold, and the amount of time before a task is dropped permanently.
For the AVAA model, 5 operators were defined: the Imagery Analyst, Commander, Air Surveillance Officer (ASO), Shift Manager, and Operations Officer (S3) (Fig. 6).
Fig. 6 AVAA operators modeled
The Imagery Analyst was the only operator modeled in the forensic mission. The Imagery Analyst was also the focus of the real-time mission; however, the other operators were included for tasks that relate to the analyst’s tasks and impact timing.
2.3.2 Step 2: Define the Functions and Tasks The next step was to describe the functions and tasks performed in the scenario. Functions and tasks were placed in the workspace and sequenced using a graphical point and click interface. Each task has attributes including priority, situation awareness level (perception, comprehension, prediction), mode (manual, auto, both), decision flag, collaborative flag, timing information (distribution, mean, standard deviation), operator assignment (primary operator, alternate primary operator, supporting operator(s)), mental workload level, and decision task information element weighting.
Figures 7, 8, and 9 show an example of the top-level task network, the forensics mission lower-level task network, and the real-time mission lower level task network in C3TRACE. Appendix A contains the task listing and Appendix B contains the network diagrams from the AVAA model.

Approved for public release; distribution is unlimited.
14
Fig. 7 Top-level network in C3TRACE

Approved for public release; distribution is unlimited.
15
Fig. 8 Forensics mission lower-level task network in C3TRACE

Approved for public release; distribution is unlimited. 16
Fig. 9 Real-time mission lower-level task network in C3TRACE
2.3.3 Step 3: Define the Communication Events A key step in the C3TRACE analysis is the definition of the communications events. The following data were used to define each communication event:
• Type of communication
• Incoming communication frequency and information quality
• Tasks that are triggered as a result of a communication
• Communication priority by communication type
The communication event information provided the scenario “drivers” for the analysis. The generated computer simulation model works according to a basic "input-throughput-output" scheme. That is, the inputs to the model are communication events, which present an information event stream in a frequency-driven time sequence. As these communication events enter the model, tasks are triggered and performed in a pattern that reflects the logic for task branching and interrupt priorities. The types of communication events that can be defined are digital (email, whiteboard, maps, sensors), voice, face-to-face, written, haptic, radio, and intercom.
For the AVAA model, 2 communication events were defined (Fig. 10). There is one event to initialize the simulation variables and one event to start the small-arms fire in the real-time mission. The StartMission event occurs at time 0 and the SmallArmsFire starts when the En-Route to FOB phase begins.
Fig. 10 AVAA communication events

Approved for public release; distribution is unlimited. 17
2.3.4 Step 4: Execute the Analysis
Once the analysis had been defined, C3TRACE automatically generated and executed a DES model that represents the organization, tasks, and communications entered by the analyst. Each AVAA scenario was executed 100 times for each mission.
2.3.5 Step 5: Analyze Results The last step was to analyze the results. C3TRACE generated several categories of output that include the following:
• Human performance metrics
• Sensor-to-shooter data
• Information driven decision quality
Specifically, C3TRACE provides reports on efficiency measures of operator utilization, task drops and suspensions, operator task completions, sensor-to-shooter timelines, and probability of making a good decision. These measures together provide human performance analysts with a tool that can be used to examine the process of battle command.
2.4 Workload
For each task, workload values were assigned that reflected the amount of effort the operator will have to expend to perform the task. Workload values for each task in the model were obtained from observation of operators using the AVAA system during the pilot and data collection events and from SME interviews. During the simulation, C3TRACE calculates how much workload each operator was experiencing throughout the mission. This can be used to determine whether the operators were overloaded.
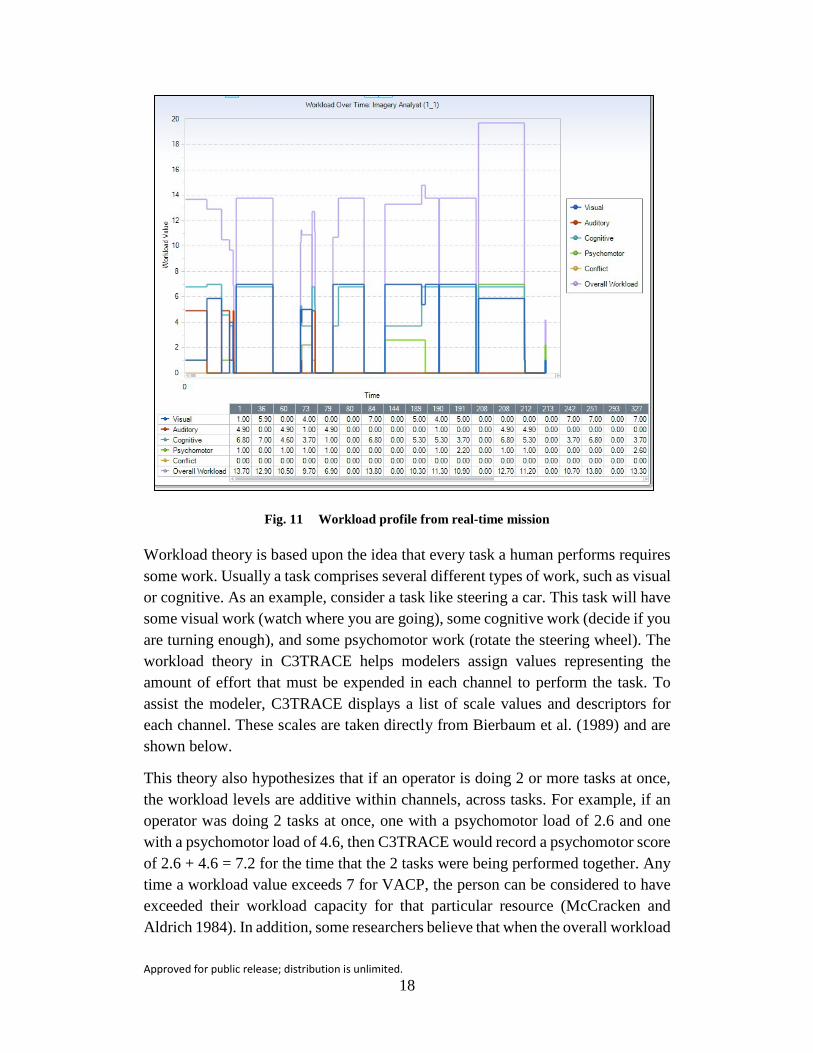
The workload in C3TRACE is tracked using the Visual, Auditory, Cognitive, and Psychomotor (VACP) demand vector and a task interference matrix. Workload is estimated by task for each of the 4 “channels” (i.e., visual, auditory, cognitive, and psychomotor) and then an additional score is added to account for interference between resources. As the model runs, workload is tracked across all 4 channels, the interference conflict, and an overall score is calculated and tracked for each operator. At the conclusion of the run, the built-in “Operator Workload” report displays the value of workload versus time (Fig. 11), which can be used to identify workload "peaks" during the operational mission.
Approved for public release; distribution is unlimited. 18
Fig. 11 Workload profile from real-time mission
Workload theory is based upon the idea that every task a human performs requires some work. Usually a task comprises several different types of work, such as visual or cognitive. As an example, consider a task like steering a car. This task will have some visual work (watch where you are going), some cognitive work (decide if you are turning enough), and some psychomotor work (rotate the steering wheel). The workload theory in C3TRACE helps modelers assign values representing the amount of effort that must be expended in each channel to perform the task. To assist the modeler, C3TRACE displays a list of scale values and descriptors for each channel. These scales are taken directly from Bierbaum et al. (1989) and are shown below.
This theory also hypothesizes that if an operator is doing 2 or more tasks at once, the workload levels are additive within channels, across tasks. For example, if an operator was doing 2 tasks at once, one with a psychomotor load of 2.6 and one with a psychomotor load of 4.6, then C3TRACE would record a psychomotor score of 2.6 + 4.6 = 7.2 for the time that the 2 tasks were being performed together. Any time a workload value exceeds 7 for VACP, the person can be considered to have exceeded their workload capacity for that particular resource (McCracken and Aldrich 1984). In addition, some researchers believe that when the overall workload

Approved for public release; distribution is unlimited. 19
value (V+A+C+P) exceeds 40, a person is considered to have exceeded their overall workload capacity (Reid and Colle 1988). The value of each workload channel throughout the mission is displayed in a graphical and tabular format in C3TRACE’s “Operator Workload” report. This graph can be used to pick out the times during the mission that the workload “peaked”. The analyst can then use the “Operator Details Report” to determine what the operator was doing during these peaks to pinpoint the task or combination of tasks that contributed to high workload for each operator.
VACP Scales
Auditory Workload Scale. The auditory workload scale embedded in the VACP missions in C3TRACE is shown in Table 2.
Table 2 Auditory workload scale
Scale value Auditory scale descriptor 0.0 No Auditory Activity 1.0 Detect/Register Sound (detect occurrence of sound) 2.0 Orient to Sound (general orientation/attention) 4.2 Orient to Sound (selective orientation/attention) 4.3 Verify Auditory Feedback (detect occurrence of anticipated sound) 4.9 Interpret Semantic Content (speech) 6.6 Discriminate Sound Characteristics (detect auditory differences) 7.0 Interpret Sound Patterns (pulse rates, etc.)
Cognitive Workload Scale. The cognitive workload scale embedded in the VACP missions in C3TRACE is shown in Table 3.
Table 3 Cognitive workload scale
Scale value Cognitive scale descriptor 0.0 No Cognitive Activity 1.0 Automatic (simple association) 1.2 Alternative Selection 3.7 Sign/Signal Recognition 4.6 Evaluation/Judgment (consider single aspect) 5.3 Encoding/Decoding, Recall 6.8 Evaluation/Judgment (consider several aspects) 7.0 Estimation, Calculation, Conversion
Psychomotor Workload Scale. The psychomotor workload scale embedded in the VACP missions in C3TRACE is shown in Table 4.

Approved for public release; distribution is unlimited. 20
Table 4 Psychomotor workload scale
Scale value Psychomotor scale descriptor 0.0 No Psychomotor Activity 1.0 Speech 2.2 Discrete Actuation (button, toggle, trigger) 2.6 Continuous Adjustive (flight control, sensor control) 4.6 Manipulative 5.8 Discrete Adjustive (rotary, vertical thumbwheel, lever position) 6.5 Symbolic Production (writing) 7.0 Serial Discrete Manipulation (keyboard entries)
Visual Workload Scale. The visual workload scale embedded in the VACP missions in C3TRACE is shown in Table 5.
Table 5 Visual workload scale
Scale value Visual scale descriptor 0.0 No Visual Activity 1.0 Visually Register/Detect (detect occurrence of image) 3.7 Visually Discriminate (detect visual differences) 4.0 Visually Inspect/Check (discrete inspection/static condition) 5.0 Visually Locate/Align (selective orientation) 5.4 Visually Track/Follow (maintain orientation) 5.9 Visually Read (symbol) 7.0 Visually Scan/Search/Monitor (continuous/serial inspection, multiple
conditions)
2.5 Model Initialization
Model input parameters were placed into a C3TRACE macro that allows users to easily set their values:
• Mission type: either “forensic” or “real time”
• Forensic mission parameters method: search method used and number of hours of FMVs returned
• Real-time mission parameter: Using AVAA to collect screenshots and produce product, true or false
For the forensic mission, if the analyst performs a basic date/time search the results will have all 224 h of FMV gathered in the area over the previous 2 weeks. The experimental data collected in June 2014 (McDermott et al. 2015) showed that if the imagery analyst uses the AVAA V-NIIRS quality filter, 55% less video was returned. However, C3TRACE/human performance analysts can change this parameter, run the model, and examine impacts on mission performance.

Approved for public release; distribution is unlimited. 21
For the real-time mission, if the analyst uses the AVAA interface it will take longer to capture that screen image than using the traditional screenshot. Using AVAA, the process to get a screenshot is 1) click the screenshot button, 2) draw a square around the portion of screen to capture, 3) release the mouse, 4) right click on the newly created file, and 5) rename the file. If AVAA is not used, the intelligence analyst hits the screenshot button and the whole screen is saved on the hard disk. When creating the product, it is predicted that using AVAA would be faster, since all of the screenshots would be available from the AVAA interface and the analyst would not have to search the hard disk for them. With AVAA, analysts make specific screenshots with meaningful names so they can be used easily to create reports and products compared with the non-AVAA interface where screenshots must be reviewed one by one. AVAA also allows for premade product templates to be used.
3. Results
3.1 Mission Performance
3.1.1 Forensic Mission For the forensic mission, the model was executed 100 times with the basic date/time search and 100 times with a V-NIIRS filtered search. The input probability distribution timing data for each individual task was obtained from the SME interviews and data collection exercises. Predicted performance data were collected for the following:
• Number of hours of FMV returned from the search
• Time required for the analyst to perform the FMV analysis
• Time required for the analyst to prepare the product
• Total mission time
Results are show in Table 6. The results predicted that if using the V-NIIRS filter reduced the amount of FMV to view by approximately 55% (McDermott et al. 2015), then the amount of time to analyze the video would be reduced by approximately 70%, the total mission time would be reduced by approximately 15%, and the time for the analyst to perform the forensic analysis would be reduced by 70%.

Approved for public release; distribution is unlimited. 22
Table 6 Forensic mission performance
Basic date/time search
(h)
Date/time/geographic location/V-NIIRS
search (h)
Difference
FMV to analyze
Average/standard deviation
223.62/10.89 101.11/4.47 54.7%
Maximum 245 111 134 h
Minimum 197 92 105 h
Analyst forensic analysis
Average/standard deviation
88.62/11.72 26.29/3.51 70.3%
Maximum 100.3 50.85 49.44 h
Minimum 71.57 24.13 47.4 h
Analyst prepares product
Average/standard deviation
0.39/0.088 0.38/0.086 3.8%
Maximum 0.63 0.58 0.043
Minimum 0.17 0.17 0
Total mission
Average/standard deviation
428.03/11.78 365.66/3/63 14.6%
Maximum 439.86 390.99 48.87
Minimum 411.49 362.82 48.67
3.1.2 Real-Time Mission The real-time mission was also executed 100 times for the case where AVAA was used to collect screenshots/make products and 100 times for the case where AVAA was not used. Using AVAA would save approximately 6 min in a 9- to 10-h mission (1.1%). Using AVAA taking screenshots takes longer, but producing the product is faster. For the real-time mission, predicted performance data were collected for each phase of the mission as show in Table 7.

Approved for public release; distribution is unlimited. 23
Table 7 Real-time mission performance
Phase
Using AVAA for screenshots/product
time required (h)
Not using AVAA time required
(h)
Difference (AVAA
advantage) (h)
Pre- mission
Average/standard deviation
1.49/0.06 1.48/0.06 ‒0.01
Maximum 1.62 1.64 0.02
Minimum 1.35 1.31 ‒0.04
En-route to FOB
Average/standard deviation
2.61/0.02 2.61/0.01 0.00
Maximum 2.65 2.63 ‒0.02
Minimum 2.59 2.57 ‒0.02
Convoy overwatch
Average/standard deviation
2.66/0.06 2.67/0.04 0.01
Maximum 2.8 2.78 ‒0.02
Minimum 2.54 2.58 0.04
Post- mission
Average/standard deviation
1.56/.21 1.67/0.19 0.11
Maximum 2.04 2.07 0.03
Minimum 1.09 1.23 0.12
Total mission
Average/standard deviation
9.48/.24 9.58/0.21 0.10
Maximum 10.08 10.07 ‒0.01
Minimum 8.84 9.08 0.24
3.2 Workload
Analysis of the workload data produced by the model for the forensic mission predicted that workload does not produce an overload situation—where workload exceeds 28 (7-point scale, 4 resources, 7×4=28) at any given point in the scenario. The data are shown in Table 8. The maximum predicted workload occurred when the imagery analyst was performing the task “Prepare any imagery derived products

Approved for public release; distribution is unlimited. 24
(IDP), geospatial intelligence (GEOINT) products”. The individual task workload estimates are based on metrics developed from previous estimates generated by operators of the Black Hawk helicopter and have been used successfully on multiple military systems (Bierbaum et al. 1989).
Table 8 Forensics operator workload
Visual Auditory Cognitive Psycho -motor
Overall workload
35G – Basic date/time search Average workload 2.52 0 1.79 1.87 6.19 Standard deviation 2.84 0 2.53 2.39 6.93 Maximum 7.0 0 6.8 7.0 19.7 35G – Date/time/geographic location/V-NIIRS search
Average workload 2.42 0 1.71 1.75 5.88 Standard deviation 2.75 0 2.48 2.34 6.75 Maximum 7.0 0 6.8 7.0 19.7
The workload data generated by the model were compared to the workload ratings from the Fort Huachuca evaluation study from June 2014 (McDermott et al. 2015). The Fort Huachuca study captured NASA-TLX ratings of perceived workload after each mission. Neither workload metric showed a large difference between workload with V-NIIRS and without V-NIIRS. The overall weighted NASA-TLX rating with the V-NIIRS was slightly higher than without V-NIIRS (9.33 workload rating with V-NIIRS compared to 8.42 workload rating without V-NIIRS) while the model derived workload was slightly lower with V-NIIRS. Because the scales of the model-derived workload and the NASA-TLX workload differ, the relative differences from the non-V-NIIRSs condition were calculated. In the model-predicted data, workload is 5% lower with V-NIIRS and in the NASA-TLX (empirical) data, workload is 10% higher with V-NIIRS.
In summary, the forensic workload data may differ slightly between the model and the experimental data but the overall story is that workload is not in an overload state and is not considerably different with or without V-NIIRS. The observed differences could be attributed to different measurement constructs of workload. However, none of the 3 metrics used (C-3TRACE, NASA-TLX, and physiological measures) showed significant overload for the 2 AVAA experimental conditions, suggesting that workload was not a serious issue for the forensic tasks.

Approved for public release; distribution is unlimited. 25
Workload data for the real-time mission is shown in Table 9. Analysis of the workload data produced by the model for the forensic mission predicted that workload does not produce an overload situation.
Table 9 Real-time operator workload
Visual Auditory Cognitive Psycho -motor
Overall workload
Imagery Analyst Average workload 1.99 0.63 2.56 0.71 5.89 Standard deviation 2.74 1.59 2.93 1.49 6.45 Maximum 7 4.9 7 7 19.7 ASO Average workload 1.97 0.60 2.51 0.64 5.72 Standard deviation 2.78 1.56 2.94 0.99 6.36 Maximum 7 4.9 6.8 2.6 14.8 Shift Manager Average workload 0.79 1.96 2.11 0.62 5.48 Standard deviation 1.75 2.4 2.8 0.71 5.97 Maximum 5.9 4.9 6.8 2.2 14.9 S3 Average workload 0 2.45 3.4 0.5 6.35 Standard deviation 0 2.45 3.4 0.5 6.35 Maximum 0 4.9 6.8 1 12.7
4. Conclusion
A baseline human performance model was developed under this effort that illustrates:
• A realistic forensic mission and real-time mission showing the tasks that would be performed by the Imagery Analyst (35G) using the AVAA system
• Predicted mission performance and workload from representative forensic and real-time operations
The preliminary conclusion from executing the model and observing operators using the AVAA system indicate that neither the forensic or real-time mission are expected to produce an overloaded workload situation for the imagery analyst. In the forensic mission, if the use of the V-NIIRS filter reduces the amount of FMV to view by approximately 55%, then the amount of time to analyze the video would be reduced by approximately 70.3% and the total mission time would be reduced

Approved for public release; distribution is unlimited. 26
by approximately 14.6%. In the real-time mission, using AVAA takes more time to collect screenshots, but saves time creating end-of-mission products.
The AVAA architecture is being developed to support the inclusion of complex CVAs such as object detection, classification, and tracking, face detection, license plate detection, change detection, precision georectification, video stabilization, and quality filters.
Since AVAA is a system in development, many of the capabilities that will eventually be required when the system is fielded have not yet been completed and fully integrated. For the simulation to be as realistic as possible, when data become available, these capabilities and associated tasks should be incorporated in the model.

Approved for public release; distribution is unlimited. 27
5. References
Bierbaum C, Szabo S, Aldrich T. Task analysis of the UH-60 mission and decision rules for developing a UH-60 workload prediction model. Fort Rucker (AL): Army Research Institute Aviation (US) R&D Activity; 1989.
Federation of American Scientists. National image interpretability rating scales. [accessed 2014]. http://fas.org/irp/imint/niirs.htm, 2014.
Kilduff P, Swoboda J, Barnette D. Command, control, and communications: techniques for the reliable assessment of concept execution (C3TRACE) modeling environment: the tool. Aberdeen Proving Ground (MD): Army Research Laboratory (US); 2005. Report No.: ARL-MR-0617.
McCracken JH, Aldrich TB. Analyses of selected LHX mission functions: Implications for operator workload and system automation goals. Fort Rucker (AL): Army Research Institute Aviation Research and Development Activity; 1984. Report No.: Technical Note ASI479-024-84.
McDermott P, Plott B, Reis A, Touryan J, Barnes M, Schweitzer K. Advanced Video Activity Analytics (AVAA): human factors evaluation. Aberdeen Proving Ground (MD): Army Research Laboratory (US); 2015. Report No.: ARL-TR-7286.
Plott B, Quesada S, Kilduff P, Swoboda J, Allender L. Using an information-driven decision making human performance tool to assess command, control, and communication issues. Proceedings of the Human Factors and Ergonomics Society Annual Meeting. 2006;48(2):2396–2400.
Reid GB, Colle HA. Critical SWAT values for predicting operator workload. Proceedings of the Human Factors and Ergonomics Society Annual Meeting. 1988;32(1):1414–1418.
Soldier’s manual and trainers guide for imagery analyst 35G skill level 1, 2, 3 and 4 (2008). Report No.: STP 34-35G14-SM-TG.
Swett B. Advanced Video Activity Analytics (AVAA) overview. AVAA preliminary design review presentations. Lorton, VA; 2013 Nov 6‒7.

Approved for public release; distribution is unlimited. 28
INTENTIONALLY LEFT BLANK.

Approved for public release; distribution is unlimited. 29
Appendix A. Task List1
This appendix appears in its original form, without editorial change.

Approved for public release; distribution is unlim
ited. 30
Forensic Task List
Mission Task Subtasks Performed By Mean Time (min)
Std Dev (min)
Visual Auditory Cognitive Psychomotor
Forensics
Forensics Mission: Suspected Weapons Smuggling in New Area
Forensics
Mission arrives - requirement to gather intel about unknown area, reports of suspected weapons trafficking 30 5 0 0 0 0
Forensics
Assets sent to area to gather FMV and other data 150 30 0 0 0 0
Forensics Assets gather data 960 0 0 0 0 0
Forensics Analyst begins forensic analysis
Imagery Analyst 10 1 5.4 0 1 0

Approved for public release; distribution is unlim
ited. 31
Mission Task Subtasks Performed By
Mean Time (min)
Std Dev (min)
Visual Auditory Cognitive Psychomotor
Forensics
Review Exploitation Requirements
Imagery Analyst
8 1.5 5.9 0 5.3 0
Forensics Obtain imagery and geospatial data
Imagery Analyst 5 2 3.7 0 5.3 4.6
Forensics
Conduct Analysis and Manipulation of FMV
Forensics Begin Search 0 0 0 4.9 0 0
Forensics Basic DateTime Search Method
Forensics Set Date and Time Parameters
Imagery Analyst 1 0.2 1 0 1 2.2
Forensics Query System Files
Imagery Analyst 2 0.5 1 0 0 2.2
Forensics Manually Review & Sort Files
Imagery Analyst 1 0.15 3.7 0 1 2.2
Forensics
Filter on Date,Time, and Geographic location

Approved for public release; distribution is unlim
ited. 32
Mission Task Subtasks Performed By Mean Time (min)
Std Dev (min)
Visual Auditory Cognitive Psychomotor
Forensics Set DateTime and Geo Parameters
Imagery Analyst 2 0.5 3.7 0 1.2 2.2
Forensics Query System Files
Imagery Analyst 2 0.5 1 0 0 2.2
Forensics Review Files Imagery Analyst 0.5 0.15 3.7 0 0 2.2
Forensics
Analyze Video (play, pause, fast forward)
Imagery Analyst 7 0 6.8 2.2
Forensics Make Annotations Imagery Analyst 30 5 5 0 4.6 4.6
Forensics
Write quick notes at the end of each video
Imagery Analyst 30 5 5.9 0 1 6.5
Forensics Analyst Off Shift 720 0 0 0 0 0 Forensics Review End 0 0 0 0 0 0
Forensics
Prepare any imagery derived products (IDP), geospatial intelligence (GEOINT) products (301-35G-1305), and reports in accordance with unit SOP. Imagery Analyst 20 5 5.9 0 6.8 7
Forensics Deliver Product Imagery Analyst 3 2 1 0 1 2.2

Approved for public release; distribution is unlim
ited. 33
Real-Time Task List
Mission Phase Task Performed By
Mean Time (min)
Std Dev (min)
Visual Audito ry
Cognit ive
Psycho motor
RealTime Real Time Mission: Convoy Overwatch
RealTime Pre-Mission RealTime ASO comes on shift
(1-2 hrs before a/c in air) ASO 1 0 1 0 1 0
RealTime Pre-mission brief (Customer, Task Force and ASO) 30 5 1 4.9 6.8 1
RealTime Analyst calls ASO to verify information and make sure on "the same page"
Imagery Analyst 15 3 0 4.9 4.6 1
RealTime Verify comms working (mIRC and cameras) 10 2.5 4 1 3.7 1
RealTime Analyst tells Shift Manager "Good to Go"
Imagery Analyst 1 0.25 0 4.9 1 1
RealTime ASO and a/c Take-Off ASO 3 1 5.4 0 6.8 2.6 RealTime Continue Preparation Imagery
Analyst 60 0 5.9 0 7 0 RealTime En-Route to FOB RealTime Analyst watches video feed while en-route Imagery
Analyst 60 0 7 0 6.8 0

Approved for public release; distribution is unlim
ited. 34
Mission Phase Task Performed By Mean Time (min)
Std Dev (min)
Visual Audito ry
Cognit ive
Psycho motor
RealTime Small Arms Fire Occurs 105 0 0 0 0 0
RealTime Analyst sees small arms fire (customer and ASO also sees) Imagery Analyst 0.5 0.2 5 0 5.3 0
RealTime Analyst alerts Shift Manager – Gives SALUTE report
Imagery Analyst 1 0.2 4 1 5.3 1
RealTime Shift Manager calls S3 Shift Manager 1 0.2 1 4.9 5.3 1 RealTime Analyst takes still snapshots Imagery Analyst 15 1 5 0 3.7 2.2 RealTime ASO keeps "eyes on" activity ASO 2 1 5.4 0 6.8 2.6
RealTime
S3 calls for temporary dynamic retasking - stay on activity until another asset arrives on scene S3 1 0.3 0 4.9 6.8 1
RealTime A/C circles area 15 0 0 0 0 0 RealTime New asset arrives 0 0 0 0 0 0 RealTime Handoff to new asset 3 0.5 0 4.9 6.8 1 RealTime A/C proceed to FOB (speed
up if necessary) 30 0 0 0 0 0

Approved for public release; distribution is unlim
ited. 35
Mission Phase Task Performed By Mean Time (min)
Std Dev (min)
Visual Audito ry
Cognit ive
Psycho motor
RealTime
Analyst asks the customer if they want the analysis of small arms fire right away or post mission Imagery Analyst 1 0.2 0 4.9 5.3 1
RealTime Customer wants analysis right away 0.5 0.05 0 1 5.3 0
RealTime
Shift Manager assigns product development to another analyst Shift Manager 2 0.5 0 4.9 1.2 1
RealTime Arrive at FOB 0 0 0 0 0 0 RealTime Convoy Overwatch Mission RealTime A/C on station 0 0 0 0 0 0 RealTime Recon area until departure
time 9 0.3 7 0 3.7 0
RealTime Maintain eyes on convoy at all times 39 2 7 0 6.8 0
RealTime Convoy heads out 30 0 0 0 0 0 RealTime Planned detour around town 9 0 0 0 0 0 RealTime Analyst ID's possible IED
threat on FMV Imagery Analyst 0 0 4 0 6.8 0
RealTime Analyst calls for further investigation and looks to match signatures
Imagery Analyst 0 0 4 0 3.7 1

Approved for public release; distribution is unlim
ited. 36
Mission Phase Task Performed By Mean Time (min)
Std Dev (min)
Visual Audito ry
Cognit ive
Psycho motor
(straight dirt line could mean command line explosive)
RealTime Shift Manager Call EOD unit and S3 Shift Manager 5 0.5 0 4.9 1 1
RealTime
Customer calls for the convoy to stop and get in tactical position (park vehicles in a formation) 2 0.5 0 4.9 4.6 1
RealTime Convoy moves into formation 10 0 0 0 0 0 RealTime Wait for EOD team 30 0 0 0 0 0 RealTime EOD Team Arrives 0 0 0 0 0 0
RealTime a/c circle area and look for activity in area, buildings 60 0 7 0 3.7 2.6
RealTime EOD Team investigates 55 0 0 0 0 0
RealTime
EOD asks and obtains permission to blw (controlled detonation) 5 0 0 0 0 0
RealTime blow potential IED 6 0 0 0 0 0
RealTime Zoom in for battle damage assessment (BDA), create video of
Imagery Analyst 6 0 5.4 0 6.8 2.6

Approved for public release; distribution is unlim
ited. 37
Mission Phase Task Performed By Mean Time (min)
Std Dev (min)
Visual Audito ry
Cognit ive
Psycho motor
EOD activity – make pre/post report
RealTime Convoy continues on mission 20 2 0 0 0 0 RealTime Maintain eyes on convoy at
all times 20 2 7 0 6.8 0 RealTime Convoy arrives at destination 0 0 0 0 0 0 RealTime a/c head back 60 0 0 0 0 0 RealTime a/c lands 3 0 0 0 0 0 RealTime Analyst watches video feed
while en-route Imagery Analyst 60 0 7 0 6.8 0
RealTime Post Mission RealTime ASO send hi-res snapshots to
analyst ASO 3 0.5 1 0 1 2.2
RealTime Analyst begins producing report
Imagery Analyst 12 2 5.9 0 6.8 7
RealTime analyst/team leader complete product
Imagery Analyst 45 10 5.9 0 6.8 7
RealTime Send product to Shift Manager
Imagery Analyst 1 0.5 1 0 1 2.2
RealTime Shift Manager makes minor adjustments, QA/QC and approves Shift Manager 30 5 5.9 0 6.8 2.2
Mission Phase Task Performed By Mean Time (min)
Std Dev (min)
Visual Audito ry
Cognit ive
Psycho motor
RealTime analyst posts product in GETS repository
Imagery Analyst 2 0.3 1 0 1 2.2
RealTime Shift OIC releases product in GETS 1 0.2 1 0 1 2.2

Approved for public release; distribution is unlimited.
38
INTENTIONALLY LEFT BLANK.

Approved for public release; distribution is unlimited.
39
Appendix B. Task Diagrams2
This appendix appears in its original form, without editorial change.

Approved for public release; distribution is unlimited.
40
Forensic Mission
Top Level Network
Start Function

Approved for public release; distribution is unlimited.
41
Conduct FMV Analysis
Pre-Mission
Real Time
En-Route to

Approved for public release; distribution is unlimited.
42
Convoy Overwatch
Post

Approved for public release; distribution is unlimited.
43
List of Symbols, Abbreviations, and Acronyms
ACV aircraft cockpit video
ASO Air Surveillance Officer
AVAA Advanced Video Activity Analytics
BDA battle damage assessment
C3TRACE Command, Control, and Communications—Techniques for Reliable Assessment of Concept Execution
CVA computer vision algorithm
DES discrete event simulation
EAE Experimentation & Analysis Element
EOD explosive ordnance disposal
FMV full-motion video
FOB forward operating base
GEOINT geospatial intelligence
GRD ground resolved distance
IDP imagery derived products
IED improvised explosive device
JSIL Joint Systems Integration Lab
MOS Military Occupational Specialty
PVO person, vehicle, object
S3 Shift Manager, and Operations Officer
SALUTE size, activity, location, unit identification, time, and equipment
SME subject-matter expert
VACP Visual, Auditory, Cognitive, and Psychomotor
VDM Video Data Model
V-NIIRS Video National Imagery Interpretability Rating Scale

Approved for public release; distribution is unlimited.
44
VPEF Video Processing and Exploitation Framework
WSV weapon system video

Approved for public release; distribution is unlimited.
45
1 DEFENSE TECHNICAL (PDF) INFORMATION CTR DTIC OCA 2 DIR ARL (PDF) IMAL HRA RECORDS MGMT RDRL DCL TECH LIB 1 GOVT PRINTG OFC (PDF) A MALHOTRA 1 DIR ARL (PDF) RDRL HRM A M BARNES

Approved for public release; distribution is unlimited.
46
INTENTIONALLY LEFT BLANK.