
ADVANCED SUBSIDIARY (AS) General Certi 2016 Physics
32
ADVANCED SUBSIDIARY (AS) General Certificate of Education 2016 Physics Assessment Unit AS 2 assessing Module 2: Waves, Photons and Medical Physics [AY121] TUESDAY 28 JUNE, MORNING Time 1 hour 30 minutes, plus your additional time allowance. Instructions to Candidates Write your Centre Number and Candidate Number in the spaces provided at the top of this page. Answer all ten questions. You must answer the questions in the spaces provided. Complete in blue or black ink only. Information for Candidates The total mark for this paper is 75. Quality of written communication will be assessed in Question 2. Figures in brackets printed at the end of each question indicate the marks awarded to each question. Your attention is drawn to the Data and Formulae Sheet which is inside this question paper. You may use an electronic calculator. MV18 9870.05 MV18 Centre Number Candidate Number
Transcript of ADVANCED SUBSIDIARY (AS) General Certi 2016 Physics
ADVANCED SUBSIDIARY (AS)General Certifi cate of Education
2016
PhysicsAssessment Unit AS 2
assessingModule 2: Waves, Photons
and Medical Physics
[AY121]TUESDAY 28 JUNE, MORNING
Time1 hour 30 minutes, plus your additional time allowance.
Instructions to CandidatesWrite your Centre Number and Candidate Number in the spaces provided at the top of this page.Answer all ten questions.You must answer the questions in the spaces provided. Complete in blue or black ink only.
Information for CandidatesThe total mark for this paper is 75.Quality of written communication will be assessed in Question 2.Figures in brackets printed at the end of each question indicate the marks awarded to each question.Your attention is drawn to the Data and Formulae Sheet which is inside this question paper.You may use an electronic calculator.
MV1
8
9870.05 MV18
Centre Number
Candidate Number

9870.05 MV18 2 [Turn over
BLANK PAGE

9870.05 MV18 3 [Turn over
1 Electromagnetic waves form a spectrum consisting of seven different frequency regions. A typical frequency for the region of lowest frequency is 103 Hz and that for the highest frequency is 1022 Hz.
(a) Complete Table 1.1 by naming these two regions and by stating a typical wavelength for each region.
[2 marks]
Table 1.1
Typical frequency/Hz Region Typical
wavelength/m103
1022
9870.05 MV18 4 [Turn over
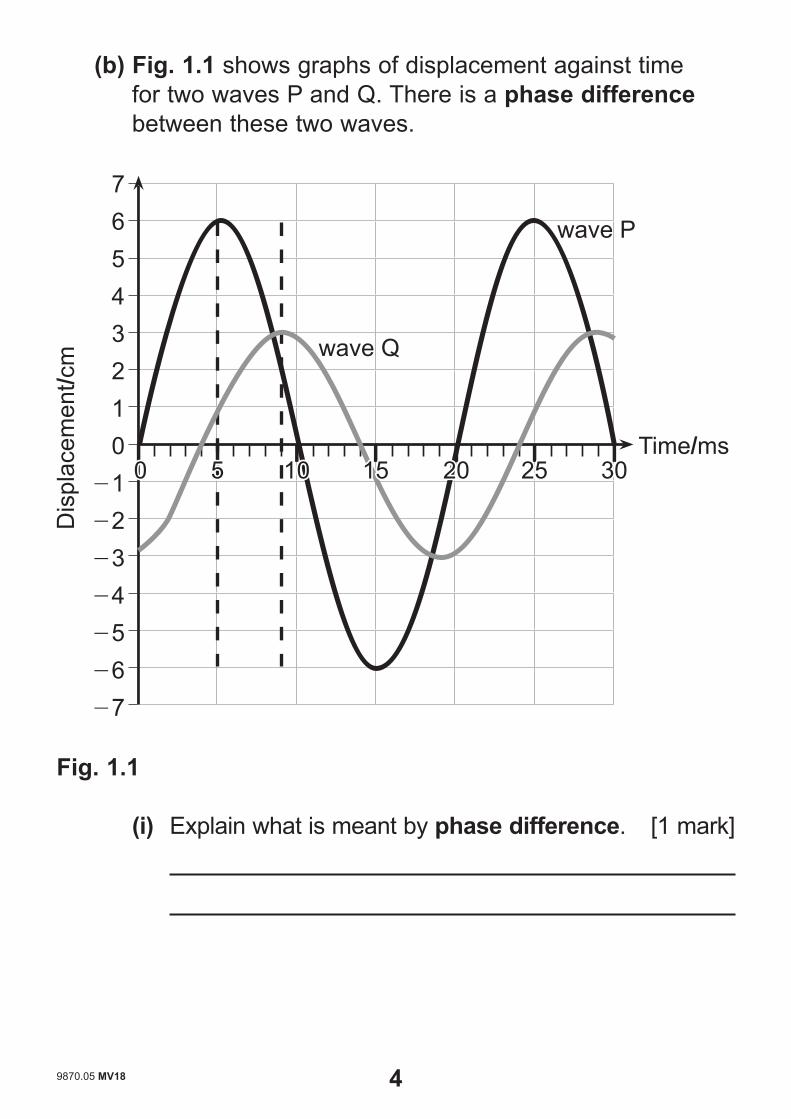
(b) Fig. 1.1 shows graphs of displacement against time for two waves P and Q. There is a phase difference between these two waves.
Time/ms
76543210
21222324252627
wave P
wave Q
Dis
plac
emen
t/cm
I I I I I I I0 5 10 15 20 25 300 5 10 15 20 25 30
Fig. 1.1
(i) Explain what is meant by phase difference. [1 mark]

9870.05 MV18 5 [Turn over
(ii) The dashed vertical lines on Fig. 1.1 indicate the time that a crest of each wave occurs. Use this information to calculate the phase difference between waves P and Q. [3 marks]
Phase difference = degrees
9870.05 MV18 6 [Turn over
Where appropriate in this question you should answer in continuous prose. You will be assessed on the quality of your written communication.
2 (a) Describe an experiment to obtain the refractive index of a material. Include in your description:
a labelled diagram of the apparatus used a description of the procedure the measurements taken and how they are used to
allow an accurate value of the refractive index to be calculated. [1 mark]
Diagram

9870.05 MV18 7 [Turn over
Procedure [2 marks]
Measurements [2 marks]
Quality of written communication [2 marks]

9870.05 MV18 8 [Turn over
(b) Monochromatic light is incident on a 60° prism made of impure crown glass (refractive index = 1.73). The situation is shown in Fig. 2.1. Calculate the angle of incidence at face AB if total internal reflection is to just occur at face AC. [4 marks]
60°
A
B C
Fig. 2.1
Angle = °
9870.05 MV18 9 [Turn over
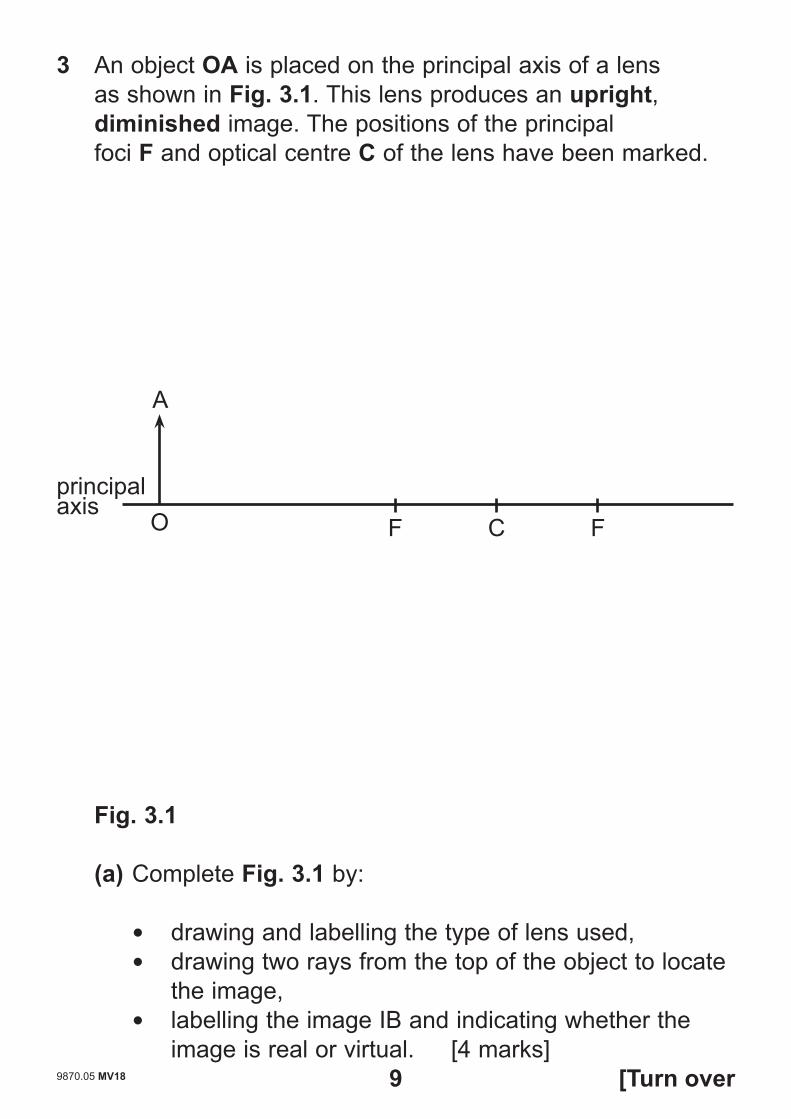
3 An object OA is placed on the principal axis of a lens as shown in Fig. 3.1. This lens produces an upright, diminished image. The positions of the principal foci F and optical centre C of the lens have been marked.
F FCO
A
principalaxis
Fig. 3.1
(a) Complete Fig. 3.1 by:
drawing and labelling the type of lens used, drawing two rays from the top of the object to locate the image, labelling the image IB and indicating whether the image is real or virtual. [4 marks]
9870.05 MV18 10 [Turn over
(b) A student carried out an experiment to determine the focal length of a converging lens.
She obtained a series of u and v values and recorded these in a table with headings as shown in Table 3.1.
Table 3.1
u/m v/m
(i) Draw a labelled diagram of the equipment that the student used to obtain this set of results. Clearly identify the measurements u and v on your
diagram. [3 marks]
Diagram
9870.05 MV18 11 [Turn over
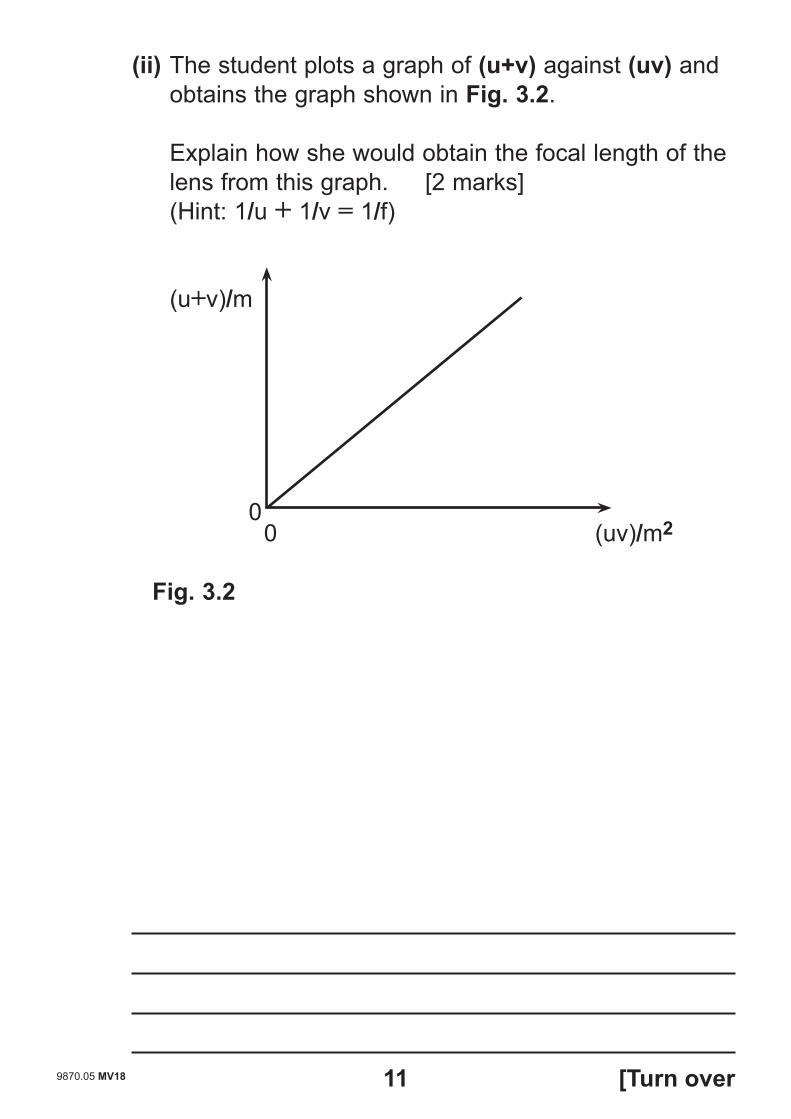
(ii) The student plots a graph of (u+v) against (uv) and obtains the graph shown in Fig. 3.2.
Explain how she would obtain the focal length of the lens from this graph. [2 marks]
(Hint: 1/u + 1/v = 1/f)
(u+v)/m
(uv)/m200
Fig. 3.2

9870.05 MV18 12 [Turn over
4 (a) State the principle of superposition. [2 marks]
(b) Fig. 4.1 shows the displacement of two waves, W1 and W2 which have different amplitudes and frequencies. Use the principle of superposition to draw the resultant of these two waves on Fig. 4.1. [2 marks]
Displacement/cm
Distance/cm0
W2
W1
W1W2
Fig. 4.1

9870.05 MV18 13 [Turn over
BLANK PAGE
(Questions continue overleaf)

9870.05 MV18 14 [Turn over
(c) The following experiment, known as Melde’s experiment, can be used to demonstrate standing waves on a string. The apparatus used is shown in Fig. 4.2.
Signal generator
Mechanicaloscillator
String undertension
Mass
Pulley
L
Fig. 4.2
A fixed mass is attached to a string. This mass keeps the string taut. A signal generator is connected to the mechanical oscillator which causes a progressive transverse wave to be sent along the string. This wave is reflected at the pulley end and a standing wave can be observed at certain frequencies.
9870.05 MV18 15 [Turn over
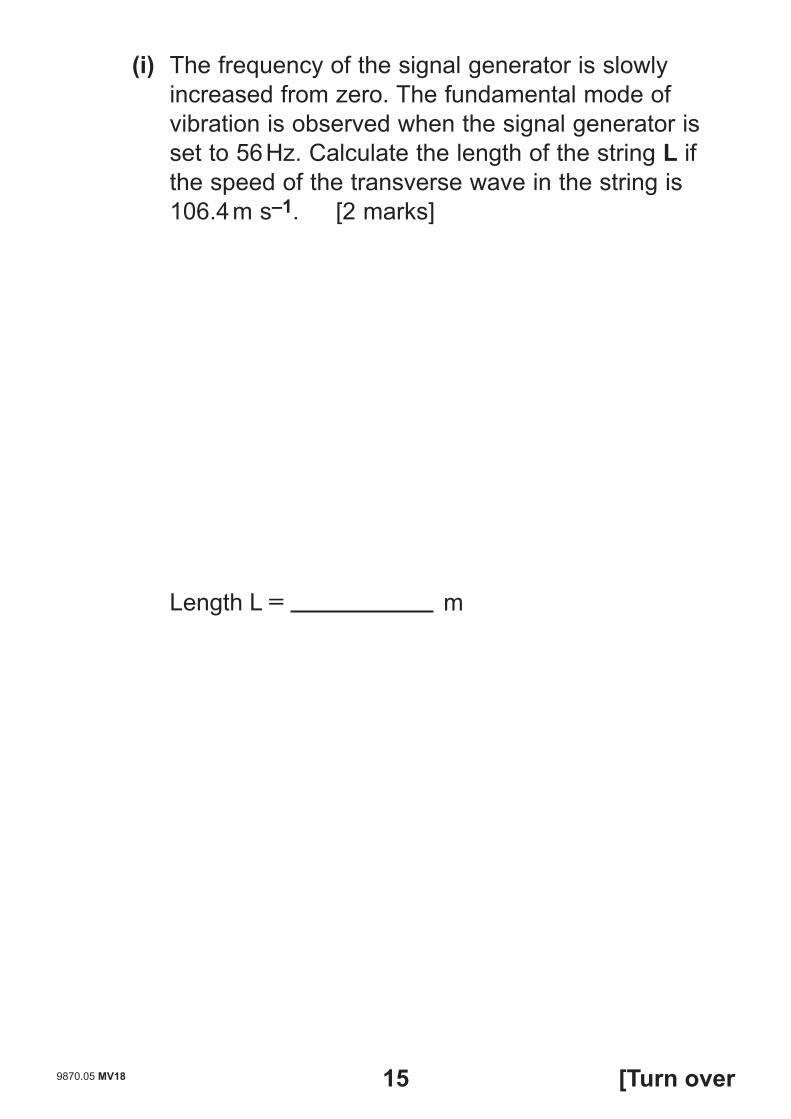
(i) The frequency of the signal generator is slowly increased from zero. The fundamental mode of vibration is observed when the signal generator is set to 56 Hz. Calculate the length of the string L if the speed of the transverse wave in the string is 106.4 m s–1. [2 marks]
Length L = m

9870.05 MV18 16 [Turn over
(ii) The frequency on the signal generator is increased until it reads 168 Hz and another standing wave is obtained. Determine the standing wave pattern obtained and sketch this on Fig. 4.3. [2 marks]
The section of string between the mechanical oscillator (M) and the pulley (P) is shown in Fig. 4.3.
M P
Fig. 4.3
(iii) On your sketch, mark the positions of a node N and an antinode A. [1 mark]

9870.05 MV18 17 [Turn over
BLANK PAGE
(Questions continue overleaf)

9870.05 MV18 18 [Turn over
5 A student positions a monochromatic light source X in front of a single slit S1 and a double slit S2S3, as shown in Fig. 5.1, in order to produce coherent sources. An interference pattern of bright and dark fringes is observed on the screen.
S1
S2
S3
X
screen
Q (3rd dark fringe)
P (bright fringe)
light source
Fig. 5.1
(a) (i) What is meant by coherent sources? [1 mark]
(ii) State 2 additional conditions that must exist for an observable interference pattern. [2 marks]
1.
2.

9870.05 MV18 19 [Turn over
(b) (i) A dark fringe indicates that destructive interference has occurred. In terms of path difference state the condition that must be met for complete destructive interference. [1 mark]
(ii) The centre of a bright fringe is formed at position P, located along the centre line, midway between S2 and S3 as shown in Fig. 5.1. The third dark fringe from P occurs at position Q, when the path difference between light coming from S2 and S3 is 1.38 ×10⁻⁶ m.
Calculate the wavelength of the light source. [3 marks]
Wavelength = m
9870.05 MV18 20 [Turn over
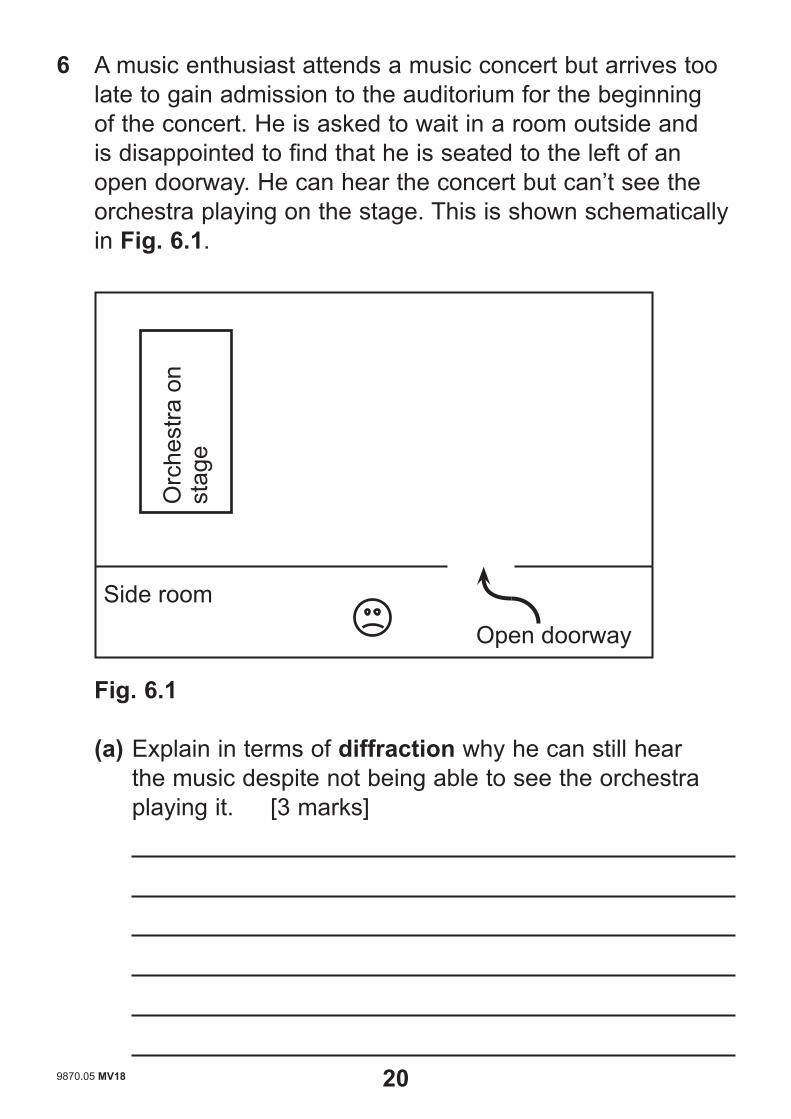
6 A music enthusiast attends a music concert but arrives too late to gain admission to the auditorium for the beginning of the concert. He is asked to wait in a room outside and is disappointed to find that he is seated to the left of an open doorway. He can hear the concert but can’t see the orchestra playing on the stage. This is shown schematically in Fig. 6.1.
Side room
Orc
hest
ra o
n st
age
Open doorway
Fig. 6.1
(a) Explain in terms of diffraction why he can still hear the music despite not being able to see the orchestra playing it. [3 marks]

9870.05 MV18 21 [Turn over
(b) A signal generator is linked to both a speaker and a cathode ray oscilloscope. The sound emitted from the speaker has a frequency of 5 kHz and the trace on the cathode ray oscilloscope is shown in Fig. 6.2. The grid on the screen is divided into centimetres.
1 cm
Fig. 6.2
Tick the correct box corresponding to the time base setting on the cathode ray oscilloscope. [3 marks]
Show your working clearly.
Time Base Setting5.0 μs cm–1
8.0 ms cm–1
0.20 μs cm–1
50 μs cm–1
20 ms cm–1

9870.05 MV18 22 [Turn over
7 X-rays are commonly used as an imaging technique in medicine. X-rays are produced by bombarding a metal target with electrons of suitable energy. There are two distinct methods of production.
(a) Describe the two methods of X-ray production. [3 marks]
9870.05 MV18 23 [Turn over
(b) CT scanning is a powerful diagnostic tool that uses X-rays.
(i) What does CT stand for? [1 mark]
(ii) Both the CT scanner and the conventional X-ray machine require the use of an X-ray beam and a detector. Outline the difference in the procedure employed with the beam and detector when each technique is used. [2 marks]
(iii) State one disadvantage of using a CT scanner instead of a conventional X-ray machine when used for producing images of patients. [1 mark]

9870.05 MV18 24 [Turn over
8 Photoelectric emission can occur when metal surfaces are illuminated by electromagnetic radiation. Under certain conditions photoelectrons are emitted from the metallic surface.
(a) State the conditions under which photoelectric emission occurs. [2 marks]
(b) The minimum frequency of radiation for which photoelectric emission occurs when a platinum surface is illuminated is 2.5 × 10¹⁵ Hz.
Calculate the work function of the platinum surface in eV. [3 marks]
Work function = eV

9870.05 MV18 25 [Turn over
(c) The frequency of the illuminating radiation is kept constant at 2.5 × 10¹⁵ Hz but the intensity of the radiation is increased.
(i) Explain the effect this would have on the kinetic energy of the emitted photoelectrons. [1 mark]
(ii) Explain the effect this would have on the number of photoelectrons emitted in 1 second. [1 mark]

9870.05 MV18 26 [Turn over
BLANK PAGE

9870.05 MV18 27 [Turn over
9 The acronym LASER stands for Light Amplification by the Stimulated Emission of Radiation.
(a) Light amplification will only occur for a particular electron arrangement of the atoms within the laser.
(i) Name and describe this arrangement of electrons. [2 marks]
(ii) An electron may fall between two energy levels due to either spontaneous or stimulated emission. What causes stimulated emission to occur? [1 mark]

9870.05 MV18 28 [Turn over
(b) Helium neon lasers were initially developed at Bell telephone laboratories in 1962. They operate at wavelengths of 632.8 nm in the red part of the visible spectrum and are widely used to read the optical disc in Compact Disc, DVD and Blu-ray Disc devices. Fig. 9.1 shows a simplified diagram of some of the electron energy levels for helium and neon atoms within the laser.
Energy
–3.900 eV –4.026 eV
–4.030 eV
–5.995 eV
–12.190 eV
–21.568 eV
Fig. 9.1
(i) Explain why the energy levels have negative values. [2 marks]

9870.05 MV18 29 [Turn over
(ii) Identify the energy levels between which an electron transition would result in the emission of red light with a wavelength of 632.8 nm and associated photon energy of 1.965 eV as in the helium neon laser. [1 mark]
Transition between eV and eV
(iii) Draw an arrow between these levels on Fig. 9.1 to represent this transition. [1 mark]
9870.05 MV18 30 [Turn over
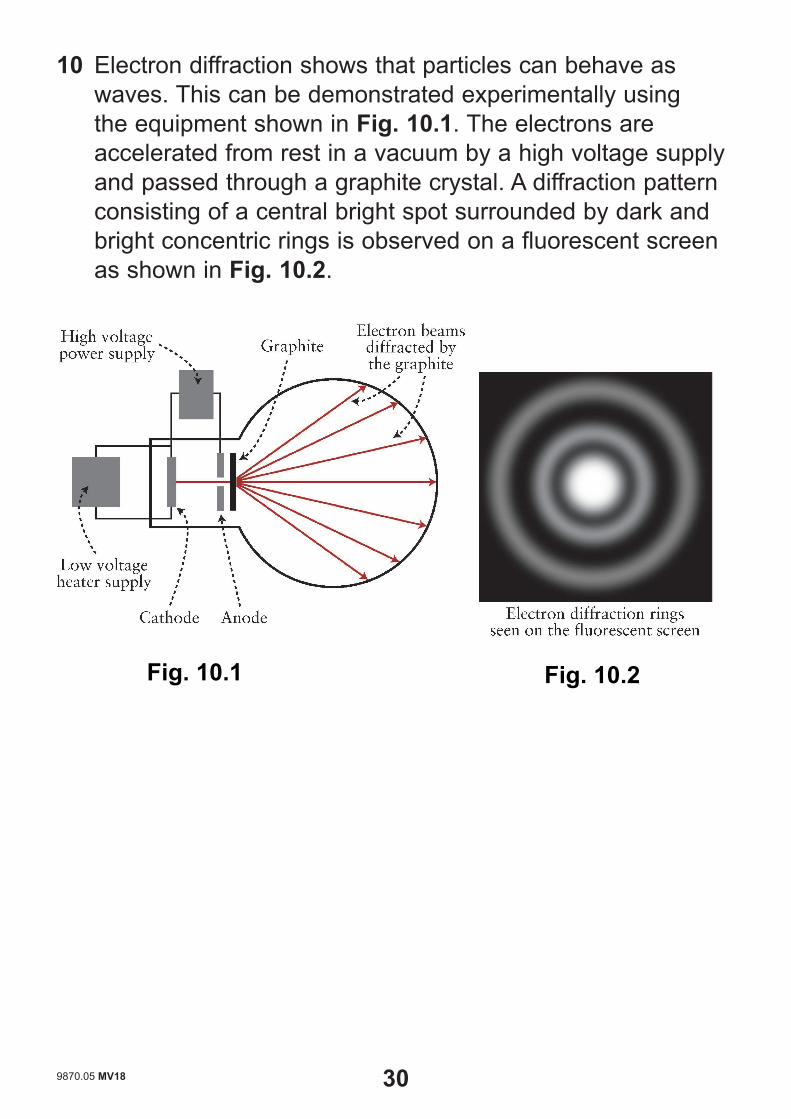
10 Electron diffraction shows that particles can behave as waves. This can be demonstrated experimentally using the equipment shown in Fig. 10.1. The electrons are accelerated from rest in a vacuum by a high voltage supply and passed through a graphite crystal. A diffraction pattern consisting of a central bright spot surrounded by dark and bright concentric rings is observed on a fluorescent screen as shown in Fig. 10.2.
Fig. 10.1 Fig. 10.2
9870.05 MV18 31
(a) The accelerating potential is 425 V. Calculate the de Broglie wavelength of the electrons when they reach their final speed of 1.22 × 10⁷ m s–1. [3 marks]
Wavelength = nm
(b) Describe and explain the effect on the diffraction pattern if the accelerating potential is increased to 495 V. [3 marks]
THIS IS THE END OF THE QUESTION PAPER

9870.05 MV18
Permission to reproduce all copyright material has been applied for.In some cases, efforts to contact copyright holders may have been unsuccessful and CCEAwill be happy to rectify any omissions of acknowledgement in future if notifi ed.
DO NOT WRITE ON THIS PAGE
Examiner Number
For Examiner’suse only
QuestionNumber Marks Remark
1 2 3 4 5 6 7 8 910
TotalMarks
Sources Q10.....© Physics for CCEA AS Level by Pat Carson and Roy White. Published by Colourpoint Educational, 2005. (ISBN: 9781904242437)