Catalytic Upgrading of Methane to Higher Hydrocarbon in a Non-oxidative Chemical Conversion.PDF

Advanced Studies of Catalytic
Upgrading of Heavy Oils
By
Abarasi Hart
A thesis submitted to
The University of Birmingham
for the degree of
DOCTOR OF PHILOSOPHY
School of Chemical Engineering
College of Engineering and Physical Science
University of Birmingham
April 2014

University of Birmingham Research Archive
e-theses repository This unpublished thesis/dissertation is copyright of the author and/or third parties. The intellectual property rights of the author or third parties in respect of this work are as defined by The Copyright Designs and Patents Act 1988 or as modified by any successor legislation. Any use made of information contained in this thesis/dissertation must be in accordance with that legislation and must be properly acknowledged. Further distribution or reproduction in any format is prohibited without the permission of the copyright holder.

ii
Abstract
As light crude oil production approaches peak, attention has been shifted to vast
deposits of heavy oil and bitumen to offset the rising fuels demand. However, heavy oil and
bitumen are known to constitute high-boiling molecules which gives them characteristic high
viscosity, high density/low API gravity, low yields of low-boiling fuel distillates, and high
heteroatom content compared to light oil. The main challenges are: low fluidity through the
reservoir and pipeline because of its high viscosity, high processing cost, and low market
value. Upgrading therefore refers to the breaking down of heavy oil into oil with similar
characteristics as light crude oil. The toe-to-heel air injection (THAI) and its catalytic add-on
CAPRI (i.e., CAtalytic upgrading PRocess In-situ) were developed to achieve this objective
down-hole. In this study, the CAPRI process was explored with the objective of controlling
catalyst deactivation due to coking while increasing the extent of upgrading. The CAPRI
section was replicated with a fixed-bed reactor using Co-Mo/γ-Al2O3, Ni-Mo/γ-Al2O3,
activated carbon, and Al2O3 support. The effects of reaction temperature and weight hourly
space velocity (WHSV) on the extent of upgrading were studied in the range of 350-425 oC
and 9.1-28 h-1
, respectively. Control experiments for thermal cracking upgrading were carried
out at the same temperature range (350-425 oC) and condition to evaluate the effectiveness of
the catalyst. In order to control premature deactivation of the catalysts due to coke and metal
deposition, the following were investigated activated carbon guard-bed on top of the catalyst
bed, hydrogen-addition, steam environment as a source of hydrogen-donor, and
nanoparticulate catalyst. It was found that high reaction temperature of 425 oC and lower
WHSV (9.1 h-1
) improved the cracking as well as increase API gravity (~3-7o), viscosity
reduction of (81.9 %), demetallisation (9.3-12.3 %), desulphurisation (5.3-6.6 %), and higher
yield of fuel distillates, respectively compared to upgrading at 350 and 400 oC. In spite of the

iii
improvement in produced oil at 425 oC, the carbon-rejection was high (51-56.6 wt.%)
compared to (42-47.8 wt.%) and (48-50.3 wt.%) when reaction was carried out at 350 and 400
oC for 25 hours time-on-stream operations. Reactions carried out under different
environments showed that after 6 hours time-on-stream, the spent catalyst contained 6 and 3
wt.% less coke under hydrogen and methane/THAI-gas reaction gases compared to 23.5 wt.%
coke content under nitrogen atmosphere. Additionally, the API gravity and viscosity
reduction increased further by ~2o and 6.2% under hydrogen-addition compared to nitrogen
environment. However, with steam-addition the viscosity reduction range from 88-92%
depending on the steam/oil ratio (0.02-0.1) compared to 85.5% (nitrogen). It was also
observed that the coke content of the spent catalyst reduced from 17.02 to 11.3 wt % as the
steam/oil ratio increased from 0.02 to 0.1 mL·mL−1
compared to 27.53 wt % (nitrogen) after
15 h time-on-stream. The API gravity and viscosity reduction achieved using dispersed
particulate Co-Mo/γ-Al2O3 catalyst was 3o points and 2 % above that obtained with pelleted
fixed-bed catalyst (5.6 oAPI and 97.1%). A significant reduction of sulphur and metals was
also noted. The synergistic effect of thermal-catalysis caused the cleavage of C-C, C-H, and
C-heteroatom bonds with large number of reactions occurring. This produces significant
upgrade and enhances oil production, benefits pipeline transportation through viscosity
reduction, and most of the impurities such as sulphur and metals are left behind in the
reservoir, lowering impact on downstream processes and the environment. The yield of fuel
distillates significantly improved compared to the original heavy oil.

iv
Dedication
In memoriam: My Father Mr Israel Joseph Abbey-Hart
And
King Edward Asimini William Dappa Pepple (Perekule XI), the Amayanabo of Grand Bonny
Kingdom, Rivers State, Nigeria

v
Acknowledgement
Thanks to God’s grace and mercy in my life. I would like to especially acknowledge
the Petroleum Technology Development Fund (PTDF), Nigeria, School of Chemical
Engineering, University of Birmingham, Ms Ama I. Pepple, and King Edward Asimini
William Dappa Pepple (Perekule XI), the Amayanabo of Grand Bonny Kingdom, Rivers
State, Nigeria for funding this project.
My deepest appreciation to: Prof. Joseph Wood for his leadership in supervising this
study with patience, constructive comments and support, Dr. Gary A. Leeke for his co-
supervision and encouraging comments, Emeritus Prof. Malcolm Greaves, University of Bath,
for valuable comments and discussion, Dr. Amjad A. Shah, and Dr. Jiawei Wang for their
contributions. Thanks to Mr Jacob Omajali who manufactured the bioPd catalyst used in this
study.
The Chemical Engineering and Biosciences Workshop teams Mr David Boylin and
Mr Andrew Tanner for their technical contribution towards the maintenance of the CAPRI
experimental rig, Mr John Wedderburn for his technical assistance with the nitrogen sorption
measurement, Petrobank, Canada for supplying the heavy oils used in this study, and Intertek
Laboratories for sulphur and metals analyses of oil samples.
My dearest family members, they invested in me and the Catalysis and Reaction
Engineering Research Group at School of Chemical Engineering, University of Birmingham
for their support in the successful completion of this study.

vi
Table of Contents
Chapter 1 Introduction ..................................................................................................... 1
1. Background and Motivation............................................................................................ 1
1.2 Aim and Objectives of the Study .................................................................................. 6
1.3 Thesis Organisation and Overview ............................................................................... 7
Chapter 2 Review of Heavy Oils Recovery and Upgrading Processes ................. 10
2. Introduction .................................................................................................................. 10
2.1 Composition of Heavy Oils ......................................................................................... 12
2.2 Enhanced Oil Recovery (EOR) Technologies ............................................................. 17
2.3 Chemical Flooding ..................................................................................................... 19
2.3.1 Polymer Flooding ................................................................................................. 19
2.3.2 Surfactant Flooding .............................................................................................. 20
2.3.3 Alkaline Flooding ................................................................................................ 21
2.3.4 Micellar Flooding ................................................................................................. 22
2.3.5 Alkaline-Surfactant-Polymer (ASP) Flooding....................................................... 22
2.4 Miscible Displacement ............................................................................................... 23
2.4.1 Carbon dioxide Miscible Displacement ................................................................ 24
2.4.2 Nitrogen Miscible Displacement .......................................................................... 26
2.4.3 Hydrocarbon Miscible Displacement .................................................................... 26
2.5 Microbial Enhanced Oil Recovery (MEOR)................................................................ 27
2.6 Thermal Methods........................................................................................................ 28
2.6.1 Steam Flooding .................................................................................................... 29
2.6.2 Cyclic Steam Stimulation (CSS) ........................................................................... 32
2.6.3 Steam Assisted Gravity Drainage (SAGD) ........................................................... 34
vii
2.6.4. In Situ Combustion (ISC) .................................................................................... 38
2.6.5 Toe-to-Heel Air Injection (THAI) ........................................................................ 41
2.7 Heavy Crude Oil Upgrading Technologies .................................................................. 45
2.8 Surface Upgrading Processes ...................................................................................... 47
2.8.1. Coking Processes ................................................................................................ 47
2.8.2. Hydroprocessing ................................................................................................. 49
2.8.3. HTL (Heavy-to-Light) Upgrading Technology .................................................... 50
2.8.4. Visbreaking ......................................................................................................... 51
2.8.5. Solvent Deasphalting ........................................................................................... 52
2.8.6. Aquaconversion (or aquathermolysis).................................................................. 53
2.9. In-situ Upgrading Processes ....................................................................................... 55
2.9.1 CAtalytic upgrading PRocess In-situ (CAPRI) ...................................................... 56
2.10 Chemistry of Heavy Oil Upgrading ........................................................................... 59
2.11 The Mechanism of Catalytic Upgrading .................................................................... 61
2.12. Conclusion ............................................................................................................... 64
Chapter 3 Material and Method .................................................................................... 65
3.1 Introduction ................................................................................................................ 65
3.2 Feedstock Properties ................................................................................................... 66
3.3 Experimental Set-Up and Procedure ........................................................................... 67
3.3.1 Characteristics of the Packed-Bed Reactor ........................................................... 72
3.3.2 Mass Balance ....................................................................................................... 74
3.4 Characteristics of Catalyst .......................................................................................... 75
3.4.1 Oxidative Regeneration of Spent Catalyst............................................................. 80
3.4.2 Preparation of Ni-based Zeolite Catalyst .............................................................. 80
3.4.3 Analysis of Surface Morphology using SEM ........................................................ 82
3.5 Analytical Instruments ................................................................................................ 82

viii
3.5.1 Density and API Gravity Measurement ................................................................ 82
3.5.2 Viscosity Measurement ........................................................................................ 83
3.5.3 Asphaltene Measurement ..................................................................................... 85
3.5.4 Sulphur and Metals Content ................................................................................. 86
3.5.5 True Boiling Point (TBP) Distribution .................................................................. 87
3.5.6 Thermogravimetric Analysis (TGA) ..................................................................... 88
3.5.7 Refinery Gas Analyser (RGA) .............................................................................. 90
3.6.1 Experimental Procedure for Dispersed Nano-particulate Catalysts ........................ 91
Chapter 4 Effects of Reaction Conditions, Catalyst and Feedstock on Upgrading
............................................................................................................................................ 94
4.1 Introduction ................................................................................................................ 94
4.2 Thermal Cracking Effect............................................................................................. 94
4.3 CAPRI Process ........................................................................................................... 97
4.3.1 Effect of Temperature: Thermal vs Catalytic Cracking ......................................... 98
4.3.2 Effect of Temperature on Mass Balance ............................................................... 99
4.3.3 Effect of Temperature on API gravity ................................................................. 100
4.3.4 Effect of Temperature on Viscosity .................................................................... 104
4.3.5 Effect of Temperature on TBP Distribution ........................................................ 108
4.3.6 Effect of Temperature on Asphaltenes, Sulphur and Metal content ..................... 112
4.3.7 Effect of Temperature on Produced Gas Composition ........................................ 113
4.4 Effect of WHSV ....................................................................................................... 118
4.4.1 Effect of WHSV on API gravity, viscosity, asphaltenes, and conversion ............ 118
4.4.2 Effect of WHSV on TBP distribution ................................................................. 120
4.4.3 Effect of Catalyst Type ....................................................................................... 122
4.5 Effect of Mono- Vs. Bi-metallic Catalysts ................................................................ 123
4.5.1 Effect of Mono- and Bi-metallic Catalyst on API gravity and Viscosity ............. 123

ix
4.6 Commercial Vs. Prepared Zeolite-based Catalyst ...................................................... 125
4.6.1 Effect on API Gravity and Viscosity................................................................... 126
4.7 Effect of Feedstock ................................................................................................... 128
4.7.1 Effect of Feedstock on API Gravity and Viscosity .............................................. 129
4.7.2 Effect of Feedstock on TBP Distribution ............................................................ 133
4.8 Conclusions .............................................................................................................. 135
Chapter 5 Effect of Reaction Gas Media on Upgrading ........................................ 136
5.1 Introduction .............................................................................................................. 136
5.2 Effect of Reaction Gas Environment ......................................................................... 137
5.2.1 Effect of Hydrogen and Methane on Mass Balance............................................. 138
5.2.2 Effect Reaction Media upon API Gravity, Viscosity and Distillable yield ........... 139
5.2.3 Effect on Produced Gas Composition ................................................................. 145
5.2.4 Effect on Asphaltenes, Metal and Sulphur Content ............................................. 147
5.2.5 Effect on Elemental Composition ....................................................................... 150
5.3 Hydrogen-Addition Route to Upgrading ................................................................... 152
5.3.1 Effect of Hydrogen Pressure on API Gravity and Viscosity ................................ 158
5.3.2 Effect of Hydrogen Pressure on TBP Distribution .............................................. 160
5.3.3 Effect of Hydrogen Pressure on Asphaltene Content........................................... 162
5.4 Fresh vs. Regenerated Catalyst ................................................................................. 163
5.4.1 Characterisation of Fresh and Regenerated Catalyst ........................................... 164
5.5 Hydrocracking of Poly-aromatic Model Compounds................................................. 166
5.6 Conclusions .............................................................................................................. 167
Chapter 6 Effect of Guard Bed on CAPRI Upgrading ........................................... 168
6.1 Introduction .............................................................................................................. 168
6.2 Effect of Guard-Bed ................................................................................................. 169
6.2.1 Effect of Guard Bed on API Gravity ................................................................... 169

x
6.2.2 Effect of Guard Bed on Viscosity ....................................................................... 172
6.2.3 Effect of Guard Bed on TBP Distribution ........................................................... 175
6.2.4 Effect of AC Guard Bed on Asphaltenes, Sulphur and Metals Contents .............. 177
6.2.5 The Role of AC and Alumina Guard Bed ........................................................... 179
6.3 Effect of Hydrogen-addition and AC Guard Bed ....................................................... 181
6.3.1 Effect on API gravity and Viscosity ................................................................... 181
6.3.2 Effect on TBP Distribution ................................................................................. 184
6.3.3 Effect on Produced Gas Composition ................................................................. 185
6.3.4 Effect on Asphaltenes content ............................................................................ 187
6.4 Conclusions .............................................................................................................. 188
Chapter 7 Coke and Metal Deposition Analysis ..................................................... 189
7.1 Introduction .............................................................................................................. 189
7.2 Effect of Reaction Temperature on Spent Catalyst Coke Content .............................. 190
7.3 Effect of WHSV on Spent Catalyst Coke content ...................................................... 194
7.4 Effect of Hydrogen-addition on Spent Catalyst Coke content .................................... 195
7.4.1 Effect of Hydrogen Pressure on Spent Catalyst Coke Content ............................ 197
7.4.2 Empirical Model of Catalyst Coke Content ........................................................ 198
7.4.3 Catalyst Deactivation Rate ................................................................................. 200
7.4.4 Nitrogen Adsorption-Desorption of Fresh and Spent Catalyst ............................. 201
7.4.5 Carbonaceous Deposits on Catalyst .................................................................... 206
7.4.6 Surface Morphology and Composition ............................................................... 207
7.5 Effect of Feedstock on Catalyst Coke Content .......................................................... 210
7.6 Effect of AC Guard-bed on Catalyst Coke Content ................................................... 212
7.7 Conclusions .............................................................................................................. 214
Chapter 8 Effect of Steam on Catalytic Upgrading and Coke Formation .......... 215
8.1 Introduction .............................................................................................................. 215

xi
8.2 Effect of Steam on Mass Balance .............................................................................. 216
8.3 Effect of Steam-to-Oil Ratio ..................................................................................... 217
8.3.1 Effect of Steam on API Gravity and Viscosity of Produced Oil .......................... 217
8.3.2 Effect of steam on TBP Distribution ................................................................... 222
8.3.3 Effect of Steam on Asphaltenes, Sulphur, and Metals Content ............................ 224
8.4 Spent Catalyst Coke Content .................................................................................... 227
8.5 Effect of Steam on Produced Gas Composition ......................................................... 230
8.6 Water-Gas-Shift Reaction ......................................................................................... 234
8.7 Conclusions .............................................................................................................. 235
Chapter 9 Comparative Study of Fixed-bed and Dispersed Catalysts ................ 236
9.1 Introduction .............................................................................................................. 236
9.2 Fixed-Bed vs. Dispersed Catalyst.............................................................................. 237
9.2.1 Produced oil API Gravity, Viscosity, Conversion and Products yield ................. 237
9.2.2 Produced oil TBP Distribution ........................................................................... 240
9.2.3 Micro Elemental Analysis .................................................................................. 242
9.2.4 Produced Gas Composition ................................................................................ 243
9.3 Effect of Agitation and Catalyst-to-Oil Ratio ............................................................ 245
9.3.1 Effect on API Gravity, Viscosity and Products Yield .......................................... 245
9.3.2 Effect on TBP Distribution ................................................................................. 247
9.4 Microparticulates of Bio-Pd vs. Co-Mo/Al2O3 Catalysts ........................................... 249
9.4.1 Mass Balance, API Gravity, Viscosity and Conversion ....................................... 249
9.4.2 TBP Distribution ................................................................................................ 252
9.4.3 Produced Gas ..................................................................................................... 255
9.5 Conclusions .............................................................................................................. 256
Chapter 10 Conclusions and Recommendations ..................................................... 257
10.1 Conclusions ............................................................................................................ 257

xii
10.2 Recommendations .................................................................................................. 264
Appendix A Characterisation of Catalyst and Guard bed Meterials ................... 266
Appendix B Effect of Feedstock on Impurities Removal ..................................... 273
Appendix C Effect of Reaction Gas Media on Spent Catalyst Coke Content ... 275
Appendix D Effect of Oxidative-Regeneration of Spent Catalyst on Upgrading
.......................................................................................................................................... 281
Appendix E Hydrocracking of Anthracene .............................................................. 286
Appendix F Fixed-Bed and Dispersed Catalyst ...................................................... 289
Appendix G Publications and Conferences .............................................................. 291
References .................................................................................................................... 2914

xiii
List of Figures
Figure 1.1 World heavy oil distribution (modified from Smalley, 2000) ................................ 2
Figure 2.1 Crude oil classification based on API gravity and viscosity (Smalley, 2000). ...... 11
Figure 2.2 Photograph of (a) heavy oil; (b) light oil and (c) oilsand. ................................... 11
Figure 2.3 Molecular structures illustrating SARA components of heavy oil (Strauz and
Lown, 2003). ....................................................................................................................... 12
Figure 2.4 Micro-emulsion of crude oil SARA components. ............................................... 13
Figure 2.5 Four asphaltenes molecular structures (a) i. Obtained from California crude oil by
Groenzin and Mullins (2000), ii. Obtained from Venezuela crude oil by Speight and
Moschopedis (1979) (b) i. Obtained from Mayan crude oil by Zajac et al. (1994) and ii.
Obtained from Venezuela crude oil by Murgich et al. (1996). .............................................. 14
Figure 2.6 Organo-metallic compounds in heavy oil as porphyrinic, non porphyrinic, and
other form of complex (Leyva, et al., 2007). ........................................................................ 16
Figure 2.7 Heavy oil recovery technologies. ........................................................................ 18
Figure 2.8 Steam flooding EOR method. ............................................................................. 30
Figure 2.9 Toe-to-heel steam flooding (THSF). ................................................................... 31
Figure 2.10 The 3 stages of cyclic steam stimulation (CSS). ................................................ 33
Figure 2.11 Steam Assisted Gravity Drainage (SAGD) process. .......................................... 35
Figure 2.12 Mechanism of VAPEX process (Swapan and Butler, 1997). ............................. 37
Figure 2.13 Schematics conventional In Situ Combustion (ISC). ......................................... 39
Figure 2.14 Schematic presentation of THAI process. ......................................................... 42
Figure 2.15 Illustration of the recovery and upgrading process in THAI. ............................. 43
Figure 2.16 Route to refinery for conventional and non-conventional oils. .......................... 45
Figure 2.17 Classification of heavy oil upgrading processes. ............................................... 46
Figure 2.18 Schematic diagram of delayed coking upgrading process. ................................. 48
Figure 2.19 HTL process flow diagram (Silverman, et al., 2011) ......................................... 51
Figure 2.20 Deasphalting scheme for heavy oil ................................................................... 53
Figure 2.21 Schematic of the THAI-CAPRI process ............................................................ 56
Figure 2.22 Reaction pathways for paraffins, naphthenes, and aromatics. ............................ 62
Figure 2.23 Aromatic cracking mechanisms (Lee, et al., 2011). ........................................... 63
Figure 3.1 Experimental method and analytical schemes of the study .................................. 66

xiv
Figure 3.2 Scaling the field CAPRI section to laboratory model representation with catalyst
bed volume of 12.86 cm3...................................................................................................... 68
Figure 3.3 Schematic diagram of the CAPRI experimental setup (Hart, et al., 2013)............ 69
Figure 3.4 Reactor packing for 6 g of catalyst microreactor loading with catalyst only (Actual
bed is vertical in orientation) ................................................................................................ 72
Figure 3.5 Reactor packing for 6 g of catalyst with activated carborn or alumina guard bed
(Actual bed is vertical in orientation) ................................................................................... 72
Figure 3.6 Quadra-lobe catalyst sample ............................................................................... 75
Figure 3.7 Flowchart of the zeolite Ni-based on alumina catalyst synthesis ......................... 81
Figure 3.8 Photograph of Anton Paar digital density and API gravity meter ........................ 83
Figure 3.9 Advanced rheometer AR 1000 ............................................................................ 84
Figure 3.10 Asphaltenes precipitation from feed and produced oils using n-heptane solvent 85
Figure 3.11 The working principle of the thermo-microbalance of the TGA ........................ 89
Figure 3.12 Photograph of the batch autoclave reactor 100 mL used in dispersed catalyst
experiments.......................................................................................................................... 92
Figure 4.1 API gravity of CAPRI produced oil at 350, 400 and 425 °C; Reaction Media N2,
Pressure 20 barg, Oil flow rate 1 mL.min-1
, Gas flow rate 500 mL.mL-1
and Catalysts (a) Co-
Mo (b) Ni-Mo and (c) Co-Mo on top Ni-Mo. ..................................................................... 102
Figure 4.2 Viscosity of CAPRI produced oil at 350, 400 and 425 °C; Reaction Media N2,
Pressure 20 barg, Oil flow rate 1 mL.min-1
, Gas flow rate 500 mL.mL-1
and Catalysts: (a) Co-
Mo (b) Ni-Mo and (c) Co-Mo on top Ni-Mo. ..................................................................... 106
Figure 4.3 Viscosity of CAPRI produced oil at 350, 400 and 425 °C; Reaction Media N2,
Pressure 20 barg, Oil flow rate 1mL.min-1
, Gas flow rate 500 mL.min-1
and Catalysts: (a) Co-
Mo at different temperatures (b) Ni-Mo at different temperatures and (c) different catalysts at
the optimum temperature of 425 oC TBP curves. ................................................................ 110
Figure 4.4 Amount of (a) hydrogen, (b) methane and (c) ethane in outlet gas stream as a
function of time-on-stream at 400 and 425 °C; Reaction Media N2, Pressure 20 barg, Oil flow
rate 1 mL.min-1
, Gas flow rate 500 mL.min-1
and Catalysts: Ni-Mo/Al2O3 and Co-Mo + Ni-
Mo. .................................................................................................................................... 117
Figure 4.5TBP distribution curves of feedstock and produced oil as a function of WHSV at
temperature 425 oC, pressure 20 barg, nitrogen-to-oil ratio 500 mL.mL
-1 and Catalyst: Co-Mo
and Ni-Mo. ........................................................................................................................ 121

xv
Figure 4.6 Effect of mono and bimetallic catalysts on produced oil (a) API gravity and (b)
viscosity at temperature 425 oC, pressure 20 barg, nitrogen-to-oil ratio 500 mL.mL
-1 and
Catalysts: Ni-Mo/Al2O3 and Ni/Al2O3. ............................................................................... 124
Figure 4.7 (a) API gravity and (b) viscosity of Produced oils as a function of time-on-stream
using prepared Ni/zeolite-alumina, commercial Ni-Mo/Al2O3 and Ni/Al2O3 catalysts, reaction
temperature 425 oC, pressure 20 barg, and N2/oil ratio 500 mL.mL
-1. ................................ 127
Figure 4.8 Effect of feedstock on produced oil API gravity at temperature 425 oC, pressure 20
barg, nitrogen-to-oil ratio 500 mL.mL-1
and Catalysts: (a) Co-Mo/Al2O3 and (b) Ni-Mo/Al2O3
(the legend indicate the feed oils start API gravity and viscosity values). ........................... 130
Figure 4.9 Effect of feedstock on produced oil API gravity at temperature 425 oC, pressure 20
barg, nitrogen-to-oil ratio 500 mL.mL-1
and Catalysts: (a) Co-Mo/Al2O3 and (b) Ni-
Mo/Al2O3. .......................................................................................................................... 132
Figure 4.10 TBP distribution curves for the feed and produced upgraded oils at 425 °C;
Catalysts: Co-Mo/Al2O3 and Ni-Mo/Al2O3, Reaction Media (N2), Pressure 20 barg, Oil flow
rate 1 mL.min-1
, Gas flow rate 500 mL.min-1
...................................................................... 134
Figure 5.1 Effect of hydrogen, methane, THAI gas and nitrogen reaction media upon (a) API
gravity, (b) viscosity of produced oil, and (c) the true boiling point distribution curves for the
feed oil and the produced oils at reaction temperature 425oC, pressure 10barg, and gas-to-oil
ratio 50 mL.mL-1
using Co-Mo/Al2O3 catalyst and feed oil-B ............................................ 141
Figure 5.2 Typical organosulphur compounds (where; R1 and R
2 are alkyl hydrocarbon)
found in heavy oil and their reaction pathway during upgrading reactions (Babich and
Moulijn, 2003) ................................................................................................................... 149
Figure 5.3 Effect of hydrogen-addition on API gravity of produced oil; reaction temperature
425°C, Reaction Media H2 or N2, Pressure 20 barg, Oil flow rate 1mL.min-1
, Gas flow rate
200 mL.min-1; Catalysts: (a) Co-Mo/Al2O3, and (b) Ni-Mo/Al2O3 as a function of time-on-
stream using feed oil-A ...................................................................................................... 153
Figure 5.4 Effect of hydrogen-addition on viscosity of produced oil; reaction temperature
425°C, Reaction Media H2 or N2, Pressure 20 barg, Oil flow rate 1mL.min-1
, Gas flow rate
200 mL.min-1
; Catalysts: (a) Co-Mo/Al2O3, and (b) Ni-Mo/Al2O3 as a function of time-on-
stream using feed oil-A ...................................................................................................... 154

xvi
Figure 5.5 Effect of hydrogen-addition on TBP distribution of produced oil; Reaction
Temperature 425°C, Reaction Media; H2 or N2, Pressure 20 barg, Oil flow rate 1mL.min-1
,
Gas flow rate 200 mL.min-1
; Catalysts: Co-Mo and Ni-Mo ................................................ 157
Figure 5.6 Effect of hydrogen pressure on API gravity of produced oil as a function of time-
on-stream at temperature 425oC, gas-to-oil ratio 200 mL.mL
-1, Catalyst: Co-Mo/Al2O3 ..... 159
Figure 5.7 Effect of hydrogen pressure on viscosity of produced oil as a function of time-on-
stream at temperature 425oC, gas-to-oil ratio 200 mL.mL
-1, Catalyst: Co-Mo/Al2O3 .......... 159
Figure 5.8 Effect of hydrogen pressure on TBP distribution at temperature 425oC, gas-to-oil
ratio 200 mL.mL-1
, Catalyst: Co-Mo/Al2O3 ........................................................................ 161
Figure 5.9 Nitrogen adsorption-desorption isotherm of fresh Co-Mo catalyst, spent Co-Mo
after reaction under nitrogen, and oxidative-regenerated spent Co-Mo catalyst at 600oC .... 164
Figure 5.10 SEM photomicrograph of Co-Mo/Al2O3 catalyst; (A) fresh and (B) oxidative-
regenerated spent catalyst after upgrading reaction under nitrogen atmosphere .................. 165
Figure 6.1 API gravity of produced oil as function of time-on-stream for Co-Mo/Al2O3 only,
AC only, alumina only, and Co-Mo/Al2O3 with (a) activated carbon (AC) and (b) Alumina;
Temperature 425°C, Reaction Media N2, Pressure 20 barg, Oil flow rate 1mL.min-1, Gas
flow rate 500mL.min-1
....................................................................................................... 170
Figure 6.2 Viscosity of produced oil samples as a function of time-on-stream for Co-
Mo/Al2O3 only, AC only, alumina only, and Co-Mo/Al2O3 with (a) AC and (b) alumina;
Temperature 425°C, Reaction Media N2, Pressure 20 barg, Oil flow rate 1mL.min-1, Gas
flow rate 500mL.min-1
....................................................................................................... 173
Figure 6.3 TBP distribution curves of feed and produced oils for guard bed integrated with
catalyst, Co-Mo/Al2O3 catalyst only, Alumina only; AC only, AC + Co-Mo/Al2O3, and
alumina + Co-Mo/Al2O3 catalysts; Temperature 425°C, Reaction Media (N2), Pressure 20
barg, Oil flow rate 1mL.min-1
, Gas flow rate 500mL.min-1
................................................. 177
Figure 6.4 TGA and DTG of (a) AC and separated asphaltenes (Asph.); (b) alumina, used as
guard bed placed on top of the Co-Mo/Al2O3 catalyst; Temperature 425°C, Reaction Media
(N2), Pressure 20 barg, Oil flow rate 1 mL.min-1
, Gas flow rate 500 mL.min-1
.................... 180
Figure 6.5 (a) Change in API gravity and (b) viscosity of produced oil using Ni-Mo/Al2O3
only, AC guard bed on top of the Ni-Mo/Al2O3 catalyst; Temperature 425°C, Reaction Media
H2 or N2, Pressure 20 barg, Oil flow rate 1mL.min-1, Gas flow rate 200mL.mL-1
.............. 182

xvii
Figure 6.6 TBP distribution curves of feed and produced oil using Ni-Mo/Al2O3 only, AC
used as guard bed placed on top of the Ni-Mo/Al2O3 catalyst; Temperature 425°C, Reaction
Media H2 or N2, Pressure 20 barg, Oil flow rate 1mL.min-1, Gas flow rate 200 mL.mL-1
... 185
Figure 7.1 TGA thermogram and DTG of asphaltenes precipitated with n-heptane ............ 191
Figure 7.2 TGA and DTG of spent Co-Mo/Al2O3 (a) and Ni-Mo/Al2O3 (b) catalysts under
reaction temperatures of 350, 400, and 425°C; Catalyst Co-Mo/Al2O3, Reaction Media N2,
Pressure 20 barg, Oil flow rate 1mL.min-1
, Gas flow rate 500mL.mL-1
............................... 192
Figure 7.3 Spent Co-Mo/Al2O3 catalyst coke content as a function WHSV at temperature
435oC, Reaction Media (N2), Pressure 20 barg, Oil flow rate 1mL.min
-1, Gas flow rate
500mL.mL-1
....................................................................................................................... 195
Figure 7.4 TGA and DTG of spent catalyst Co-Mo/Al2O3 obtained after reaction from
CAPRI reactor with and without hydrogen-addition; Temperature 425°C, Reaction Media H2
and N2, Pressure 20 barg, Oil flow rate 1mL.min-1
, Gas flow rate 200mL.mL-1
.................. 196
Figure 7.5 Co-Mo/Al2O3 catalyst coke content as a function of time-on-stream during
upgrading reaction in N2 or H2 reaction media at temperature 425oC, pressure 20 barg, oil
flow rate 1 mL.min-1
, gas flow rate 200 mL.mL-1
and feed oil-B; (A) in N2 model (i.e., Cc =
4.661t0.306
) and (B) in H2 Model (Cc = 4.097t0.296
) .............................................................. 199
Figure 7.6 Conversion vs. time-on-stream as a function of activity Co-Mo/Al2O3 catalyst at
temperatures 350, 400, and 425oC, constant pressure 20 barg and N2/oil ratio 500 mL.mL
-1
.......................................................................................................................................... 201
Figure 7.7 Fresh and spent (at 425°C reaction temperature) Co-Mo and Ni-Mo catalysts
adsorption-desorption isotherm (a) fresh and spent Co-Mo under nitrogen atmosphere, (b)
fresh and spent Ni-Mo under nitrogen atmosphere, and (c) fresh and spent Co-Mo under
hydrogen environment; Temperature 425oC, Reaction Media H2 or N2, Pressure 20 barg, Oil
flow rate 1mL.min-1
, Gas flow rate 200mL.mL-1
................................................................ 203
Figure 7.8 Co-Mo/Al2O3 catalyst pore size distribution before and after upgrading reaction at
425oC, 20 barg, and 200 mL.mL-1 in the presence of nitrogen or hydrogen atmosphere ..... 205
Figure 7.9 Photograph of coked Ni-Mo/Al2O3 catalyst of the CAPRI reactor cross-section
after upgrading at temperature 425oC, nitrogen-to-oil ratio 500 mL.mL-1, and pressure 20
barg ................................................................................................................................... 206

xviii
Figure 7.10 SEM photomicrographs of fresh Co-Mo/Al2O3 (A) and spent catalysts after
upgrading under different reaction media (B) Spent Co-Mo in N2 425oC, (C) Spent Co-Mo in
H2 425oC, and (D) Spent Co-Mo in steam 425
oC ................................................................ 208
Figure 7.11 EDX of (a) fresh and spent Co-Mo/Al2O3 after upgrading in H2 atmosphere at
425oC, 20bar, and 200mL.mL
-1; (b) fresh and spent Ni-Mo/Al2O3 catalyst after upgrading in
N2 atmosphere at 425oC, 20bar, and 500mL.mL
-1 ............................................................... 209
Figure 7.12 TGA and DTG of spent catalyst obtained from the CAPRI reactor after
upgrading reaction using feed oil-A & B with Co-Mo/Al2O3 and Ni-Mo/Al2O3; Temperature
425°C, Reaction Media (N2), Pressure 20 barg, Oil flow rate 1mL.min-1
, Gas flow rate
500mL.mL-1
....................................................................................................................... 211
Figure 7.13 TGA and DTG of spent Co-Mo/Al2O3 catalyst obtained from a guard-bed
reactor and without guard bed; Temperature 425°C, Reaction Media (N2), Pressure 20 barg,
Oil flow rate 1mL.min-1
, Gas flow rate 500mL.mL-1
.......................................................... 212
Figure 7.14 Chemistry of coke formation on catalyst surface during upgrading reaction (Gray,
et al. 2000) ......................................................................................................................... 213
Figure 8.1 Change in API gravity of Produced oils as a function of time-on-stream using Co-
Mo/γ-Al2O3 catalyst, reaction temperature 425oC, pressure 20 barg, N2-to-oil ratio 500
mL.mL-1
; steam-to-oil (SOR) ratios 0.02, 0.05, and 0.1 mL.mL-1
....................................... 218
Figure 8.2 Viscosity of Produced oils as a function of time-on-stream using Co-Mo/γ-Al2O3
catalyst, reaction temperature 425oC, pressure 20 barg, N2-to-oil ratio 500 mL.mL
-1; steam-to-
oil (SOR) ratios 0.02, 0.05, and 0.1 mL.mL-1
..................................................................... 220
Figure 8.3 TBP distribution curves for feed and produced oils using Co-Mo/γ-Al2O3 at
reaction temperature 425oC; pressure 20 barg; N2-to-oil ratio 500 mL.mL
-1; SORs: 0.02, 0.05,
and 0.1 mL.mL-1
................................................................................................................ 222
Figure 8.4 TG and DTG of fresh and spent Co-Mo/Al2O3 catalyst recovered from CAPRI
reactor after reaction with and without steam addition at reaction temperature 425oC, pressure
20 barg, and N2-to-oil ratio 500 mL.mL-1
........................................................................... 228
Figure 8.5 CO2 and CO production during catalytic upgrading in the presence and absence of
steam at temperature of 425oC, pressure 20 barg, SOR 0.1 mL.mL
-1, and N2-to-oil ratio 500
mL.mL-1
............................................................................................................................. 234
Figure 9.1 Photograph of reactor internal and impeller after reaction at 425oC................... 240

xix
Figure 9.2 Amount distilled as a function of boiling-point fractions for feedstock and
produced oil from thermal cracking (batch), fixed-bed and dispersed micro-particulates of Co-
Mo/Al2O3 catalyst at temperature 425oC, pressure 20 bar, nitrogen gas media, CTO ratio 0.1,
stirring speed 133 rpm, and residence time 10 minutes ....................................................... 241
Figure 9.3 Produced oil amount distilled as function of (a) Agitation, and (b) CTO; using
micro-particulates of Co-Mo/Al2O3 catalyst at temperature of 425oC, pressure 20 bar, nitrogen
gas media, catalysts-to-oil ratio 0.1, and residence time 10 minutes .................................... 248
Figure 9.4 Reaction pathways during dispersed catalyst upgrading .................................... 249
Figure9.5 Amount distilled at different boiling temperature ranges upon simulated distillation
of produced oil from the use of (a) thermal upgrading, (b) micro-particulates of Co-Mo/Al2O3
and Al2O3, and (c) micro-bioPd (20%) catalysts at temperature of 425oC, pressure of 20 bar,
CTO of 0.02, stirring speed 500 rpm, and residence time 10 minutes under N2 and H2
environments ..................................................................................................................... 253
Figure 10.1 Factors affecting the performance of heavy oil upgrading catalysts ................. 259
Figure A.1 Nitrogen adsorption-desorption isotherm: (a) Co-Mo/Al2O3 and Ni-Mo/Al2O3
catalyst, (b) Activated and (c) Alumina support .................................................................. 267
Figure A.2 BET plot of fresh Co-Mo/Al2O3 ...................................................................... 268
Figure A.3 Mercury porosimetry of (a) Fresh Co-Mo, Ni-Mo, and Regenerated Co-Mo
catalysts, (b) activated carbon and (c) alumina support ....................................................... 270
Figure A.4 N2 adsorption-desorption isotherm for the commercial Ni-Mo/Al2O3 and prepared
Ni/zeolite-based catalyst both cylindrically shaped............................................................. 272
Figure C.1 TG and DTG of spent Co-Mo/γ-Al2O3 catalyst after 6 hours time-on-stream
reaction under hydrogen, methane, THAI gas, and nitrogen atmospheres at reaction
temperature of 425oC, pressure 10 barg, and gas-to-oil ratio 50 mL.mL
-1 ........................... 275
Figure C.2 Nitrogen adsorption-desorption isotherm of fresh and spent Co-Mo after 6 hours
reaction in hydrogen, methane, and nitrogen media at reaction temperature of 425oC, pressure
10 barg, and gas-to-oil 10 mL.mL-1
.................................................................................... 278
Figure C.3 HDM and HDS reactions under hydrogen atmosphere ..................................... 279
Figure D.1 Change in API gravity (a) and degree of viscosity reduction (b) for the produced
oil using fresh Co-Mo catalyst and oxidative-regenerated spent Co-Mo catalyst from the
nitrogen medium experiment at reaction temperature of 425oC, pressure 10 barg, and
nitrogen-to-oil ratio 50 mL.mL-1
........................................................................................ 282

xx
Figure D.2 TBP distribution curves for feed and upgraded oils obtained from using fresh Co-
Mo catalyst and oxidative-regenerated spent Co-Mo catalyst from the nitrogen atmosphere
experiment at reaction temperature of 425oC, pressure 10 barg, and nitrogen-to-oil ratio 50
mL.mL-1
............................................................................................................................. 283
Figure D.3 TG and DTG curves of the spent Co-Mo catalyst obtained with the nitrogen
reaction medium before and after oxidative-regenerated was conducted after 6 hours time-on-
stream reaction at temperature of 425oC, pressure 10 barg, and nitrogen-to-oil ratio 50
mL.mL-1
............................................................................................................................. 284
Figure E.1 Hydroconversion of anthracene with time at 350 and 400oC, using Co-Mo/Al2O3
catalyst............................................................................................................................... 286
Figure E.2 Identified products of the catalytic cracking of anthracene at 400oC using Co-
Mo/Al2O3 catalyst in hydrogen atmosphere: (a) 1,4-diethyl-benzene, (b) 1-propenylbenzene,
(c) 9,10-dihydroanthracene, (d) 2-methylnaphthalene, and (e) 1-ethyl-benzene .................. 288
Figure E.3 Modified reaction pathway for hydrogenation and hydrocracking of anthracene
using Co-Mo/Al2O3 catalyst, where BTX (i.e., benzene, toluene, and xylene derivatives) and
R is alkyl hydrocarbon ....................................................................................................... 288
Figure F.1 Nitrogen adsorption-desorption isotherm of pulverised and pellets Co-Mo/Al2O3
.......................................................................................................................................... 289

xxi
List of Tables
Table 2.1 Benefits of THAI process for recovery and upgrading of heavy oil (Xia, et al.,
2003). .................................................................................................................................. 44
Table 2.2 Bond dissociation energy (Rahimi and Gentzi, 2006) ........................................... 60
Table 2.3 Key classes of catalytic upgrading reactions during CAPRI process. .................... 63
Table 3.1 Properties of the THAI heavy feed oils ................................................................ 67
Table 3.2 Operating conditions in the experiments .............................................................. 70
Table 3.3 Packed bed characteristics for 6 g of catalyst; gas flow rate of 500 mL.min-1
; oil
flow rate 1 mL.min-1
............................................................................................................ 74
Table 3.4 Composition and properties of used catalysts ....................................................... 76
Table 3.5 RGA calibration gas composition ......................................................................... 90
Table 3.6 Catalyst fine particles size distribution and surface area ....................................... 91
Table 3.7 Operating conditions for dispersed nano-catalyst experiments .............................. 93
Table 4.1 Thermal effect on API gravity, viscosity, and conversion of heavy oil using 3 mm
glass beads as a function of temperature under nitrogen medium (feedstock: 13 oAPI,
0.49Pa.s, and 59.5 % 343 oC+). ............................................................................................ 95
Table 4. 2 Viscosity and change in API gravity of CAPRI produced oil at 350, 400 and 425
°C; Reaction Media (N2), Pressure 20 barg, Oil flow rate 1mL.min-1
, Gas flow rate 500
mL.mL-1
and Catalysts: Co-Mo, Ni-Mo and Co-Mo on top Ni-Mo. ...................................... 95
Table 4.3 Mass balances; Catalysts Co-Mo/Al2O3 and Ni-Mo/Al2O3, Reaction Media (N2),
Pressure 20 barg, Oil flow rate 1 mL.min-1
, Gas flow rate 500 mL.mL-1
. .............................. 99
Table 4.4 Average API gravity of CAPRI produced oil at 350, 400 and 425 °C; Reaction
Media (N2), Pressure 20 barg, Oil flow rate 1 mL.min-1
, Gas flow rate 500 mL.mL-1
and
Catalysts: Co-Mo, Ni-Mo and Co-Mo on top Ni-Mo (feed: 13oAPI). ................................. 103
Table 4.5 Average viscosity and DVR of CAPRI produced oil at 350, 400 and 425 °C;
Reaction Media (N2), Pressure 20 barg, Oil flow rate 1mL.min-1
, Gas flow rate 500mL.mL-1
and Catalysts: Co-Mo, Ni-Mo and Co-Mo on top Ni-Mo (feed: 0.5 Pa.s). .......................... 107
Table 4.6 Conversion of 343 oC+ HCs at temperatures 350, 400, and 425
oC, pressure 20barg,
N2 reaction media, nitrogen-to-oil flow ratio 500 mL.mL-1
, oil flow rate 1 mL.min-1
and
Catalysts Co-Mo and Ni-Mo. ............................................................................................. 111

xxii
Table 4.7 Asphaltenes, sulphur and metal content of feed and produced oil at 400 and 425 °C;
Reaction Media (N2), Pressure 20 barg, Oil flow rate 1 mL.min-1
, Gas flow rate 500 mL.min-1
,
Catalysts: Co-Mo and Ni-Mo. ............................................................................................ 112
Table 4.8 Average off-gas composition during CAPRI reaction at 400 and 425 °C; Reaction
Media (N2), Pressure 20 barg, Oil flow rate 1mL.min-1
, Gas flow rate 500mL.min-1
, Catalysts:
Co-Mo, Ni-Mo and Glass beads. ........................................................................................ 114
Table 4.9 Catalyst bed characteristics at oil flow 1 mL.min-1 and different WHSV. .......... 118
Table 4.10 Effect of WHSV on the API gravity, viscosity, Asphaltenes content, and
conversion of 343 oC+ HCs at 425
oC reaction temperature, 20 barg pressure, nitrogen-to-oil
ratio 500 mL.mL-1
, and oil flow rate 1 mL.min-1
(Mean values for 6 hours time-on-stream
operations). ........................................................................................................................ 119
Table 5.1 Mass balances; Catalyst Co-Mo/Al2O3, Reaction Media: N2, H2, and CH4, Reaction
Temperature 425oC, Pressure 10 barg, Oil flow rate 1 mL.min
-1, Gas flow rate 50 mL.min
-1
.......................................................................................................................................... 138
Table 5.2 Produced gas composition for different reaction gas media; temperature 425oC,
pressure 10barg, oil flow rate 1 mL.min-1
, gas flow rate 50 mL.min-1
................................. 146
Table 5.3 Asphaltene, metals, and sulphur content before and after CAPRI reaction using Co-
Mo/γ-Al2O3 catalyst under hydrogen, methane, THAI gas, and nitrogen atmospheres at
reaction temperature of 425oC, pressure 10barg, oil flow rate 1 mL.min
-1, and gas flow rate
50mL.min-1
........................................................................................................................ 148
Table 5.4 Elemental composition of feed and produced oil from upgrading under nitrogen,
hydrogen, methane, and THAI gas reaction gas media using Co-Mo/Al2O3 catalyst at
temperature 425oC, pressure 10 barg, and gas-to-oil ratio 50 mL.mL
-1 ............................... 151
Table 5.5 Asphaltene content of produced oil as a function of hydrogen pressure at
temperature 425oC; gas-to-oil ratio 200 mL.mL
-1; Catalyst: CoMo/Al2O3 .......................... 162
Table 6.1 Asphaltene, sulphur, and metals content before and after reaction with and without
activated carbon guard using Co-Mo/Al2O3 at 425oC, 20barg, 500mLmL
-1 and feed oil-A . 178
Table 6.2 Produced gas composition during catalytic upgrading process under nitrogen and
hydrogen atmospheres using AC with Ni-Mo/Al2O3 catalyst at temperature 425oC, pressure
20 barg, gas/oil ratio 200 mL.mL-1
..................................................................................... 186

xxiii
Table 6.3 Asphaltene content of oil produced with cylindrical Ni-Mo/Al2O3 catalyst only and
with AC guard bed under nitrogen or hydrogen addition at 425oC, 20 barg, and gas-to-oil ratio
200 mL.mL-1
...................................................................................................................... 188
Table 7.1 Spent Co-Mo/Al2O3 catalyst coke content at temperature 425oC, hydrogen-to-oil
flow ratio 200 mL.mL-1
, and hydrogen pressure from 20-40 barg ....................................... 197
Table 8.1 Operating conditions in the experiments ............................................................ 216
Table 8.2 Product yields from CAPRI process without and with steam at reaction temperature
of 425oC, pressure 20 barg; N2-to-oil ratio 500 mL.mL
-1; steam-to-oil ratio 0.05 mL.mL
-1 . 217
Table 8.3 Conversion of 343oC+ HCs to lower boiling fractions at reaction temperature
425oC, pressure 20barg; N2-to-oil ratio 500 mL.mL
-1, and varying SOR using Co-Mo/Al2O3
catalyst............................................................................................................................... 224
Table 8.4 Asphaltenes, sulphur, and metals content before and after CAPRI reaction with and
without steam addition at reaction temperature 425oC, pressure 20barg, N2-to-oil ratio
500mLmL-1
, and different SORs ........................................................................................ 225
Table 8.5 Spent Co-Mo catalyst coke content after CAPRI upgrading with and without steam
addition at reaction temperature 425oC, pressure 20barg, and N2-to-oil ratio 500mLmL
-1 ... 228
Table 8.6 Produced gas composition during catalytic upgrading reaction in nitrogen
atmosphere only and in combination with steam using Co-Mo/γ-Al2O3 catalyst at temperature
425oC; pressure 20 barg; N2/oil ratio 500 mL.mL
-1 and different SORs .............................. 231
Table 9.1 Comparison of upgrading level with fixed-bed Co-Mo pellets and dispersed micro-
Co-Mo at temperature 425oC, pressure 20 bar, CTO 0.1, Stirring speed 133 rpm, and thermal
cracking only (in batch). Feed oil (14o API and 1.091 Pa.s) ................................................ 238
Table 9.2 Micro elemental analysis of samples obtained from thermal, fixed-bed, and
dispersed micro-particulates of CoMo/Al2O3 upgrading at temperature of 425oC, pressure of
20 bar, stirring speed 133 rpm, CTO 0.1, and residence of 10 minutes under nitrogen
atmosphere ......................................................................................................................... 243
Table 9.3 Produced gas composition for supported and dispersed Co-Mo/Al2O3 catalyst at
temperature 425oC, pressure 20 bar, nitrogen gas media, catalysts-to-oil ratio 0.1, stirring
speed 133 rpm, and residence time 10 minutes ................................................................... 244
Table 9.4 Effect of agitation and CTO using dispersed micro-particulates of Co-Mo/Al2O3
catalyst at 425oC, 20 bar, 10 minutes reaction time and nitrogen-reaction medium. Feed oil
(14o API and 1.091 Pa.s) .................................................................................................... 246

xxiv
Table 9.5 Produced oil upgrade using thermal, micro-CoMo/Al2O3, micro-Al2O3, and micro
bioPd (20%) at 425oC temperature, 0.02 CTO (except thermal upgrading), 20 bar pressure,
and 500 rpm agitation under nitrogen or hydrogen reaction media. Feed oil (14o API and
1.091 Pa.s) ......................................................................................................................... 250
Table 9.6 Produced gas upon upgrading under nitrogen atmosphere using thermal, micro Co-
Mo/Al2O3, and micro-bioPd at 425 oC, 20 bar, 500 rpm, 0.02 CTO, and 10 minutes reaction
time ................................................................................................................................... 255
Table A.1 Properties of the activated carbon and alumina support used as guard bed ......... 270
Table B.1 Sulphur and metals before and after catalytic upgrading process at temperature
425°C; Reaction Media N2, Pressure 20 barg, Oil flow rate 1 mL.min-1
, Gas flow rate 500
mL.min-1
, Catalyst: Co-Mo/Al2O3 ...................................................................................... 274
Table C.1Coke content of spent Co-Mo/γ-Al2O3 catalyst under hydrogen, methane, THAI gas
and nitrogen atmospheres at reaction temperature of 425oC, pressure 10barg, and gas-to-oil
ratio 50mL.mL-1
, after 6 hours time-on-stream operation ................................................... 276
Table E.1 Gas yield during the hydrocracking of anthracene ............................................. 287
Table F.1 Characteristics of heavy oil, fixed-bed and batch reactors ................................. 290

xxv
Nomenclature
CAPRI CAtalytic upgrading PRocess In situ
DTG Differential Thermal Gravimetric
HDS Hydrodesulphurization
HDT Hydrotreating
HDA Hydrodeasphaltization
HDS Hydrodesulphurization
HDM Hydrodemetalisation
OOIP Original Oil In Place
SARA Saturates, Aromatics, Resins and Asphaltenes
TGA Thermogravimetric Analysis
THAI Toe-to-Heel Air Injection
WHSV Weight Hourly Space Velocity

Chapter 1: Introduction
1
Chapter 1
Introduction
1. Background and Motivation
World oil demand is expected to increase by more than 40% by 2025 (USEIA, 2005).
The global society needs fuel for heating, cooking, and transportation. Also, the world’s
chemical industries depend majorly on hydrocarbon as primary feedstock. The demand is
therefore ever increasing swiftly as a result of population growth at an average annual growth
rate of 1.6% (OECD/IEA, 2005), industrialisation, and developing economies. As the world’s
conventional light crude oil approaches its peak, exploitation of vast deposits of heavy oil and
bitumen remains one of the mitigating options to off-set the rise in demand (Hirsch, et al.,
2006). The heavy crude oil and tar sands (i.e., non-conventional oil) reserve globally is
estimated by the International Energy Agency (IEA) to be about 6 trillion barrels, with major
reserves found in Canada and Venezuela (OECD/IEA, 2005; Das and Butler, 1998). This
amount could fill the gap between world energy supply and demand in future. According to
Zhang et al. (2012) heavy oil, extra heavy oil, and bitumen make up about 70% of the world’s
total oil resources of about 9-13 trillion barrels. In this respect, the reserve of non-
conventional oil resources outweighs that of conventional light crude oil reserve which is
about 1.02 trillion barrels (Hein, 2006). Hence, non-conventional oils could potentially meet
global energy needs for the next five decades. The global distribution of non-conventional oil
in place as estimated is presented in Figure 1.1.

Chapter 1: Introduction
2
Figure 1.1 World heavy oil distribution (modified from Smalley, 2000).
Although Canada and Venezuela have extraction and upgrading industries in place,
very little has been done by other nations to exploit non-conventional oil resources. For
instance in Africa, there are large heavy crude oil and bitumen deposits onshore in Egypt,
Nigeria, Angola, etc., but there are no firm plans and technology to extract them at the
moment (Atkins, 2011). The major hurdles being issues such as greenhouse gas emissions
from production, the cost of upgrading heavy crude oil by refining is double that of
conventional crude oil, technical challenges associated with transportation, and their
extraction is energy and capital intensive. Also, the market value of non-conventional oil is
low compared to light crude oil.
On the other hand, heavy crude oil and bitumen are characterised by high viscosity
(i.e., resistance to flow), high density/low API gravity, high asphaltenes and heteroatom
content, which is the reason for the high cost and technical challenges associated with their
extraction and refining. The key factors controlling the commercial development of heavy

Chapter 1: Introduction
3
crude oil resources are therefore world crude oil price, the capital expense and the technology
(Focus, 2006; Atkins, 2011). Unlike the light crude oil, the heavy oil/bitumen requires further
processing by upgrading, that is the process that converts heavy oil/bitumen into synthetic oil
with API gravity, viscosity, and heteroatom characteristics similar to light crude oil, before
being subjected to further refining processes (Carrillo and Corredor, 2012). Parenthetically,
surface upgrading of heavy crude oil/bitumen to light crude oil is cost-effective when the
deviation between the light and heavy crude oil prices is enough to cover the cost of
production and upgrading (Focus, 2006). A combination of different surface upgrading
processes such as delayed coking, hydroconversion processes, catalytic cracking, solvent
deasphalting, etc. are required to produce synthetic crude (or syncrude) suitable for refining.
However, these surface upgrading processes significantly impact the environment with the
emission of greenhouse gases (GHG). Additionally, the use of surface upgrading processes
like visbreaking and delayed coking have been characterised by low conversion and high
yield of undesirable by-product coke (Furimsky, 2009). In this respect, effort is being focused
on in situ upgrading technologies, that is, converting the heavy crude oil to light oil prior to
reaching the surface.
With regard to the economics, the major cost associated with heavy oil and bitumen
exploitation is the additional cost incurred for the surface upgrading facility (Atkins, 2011;
Hart, et al., 2014a). Therefore, the development of efficient in situ upgrading technologies
could substantially improve the economics of production of heavy oil and bitumen resources.
Conventional light oil is produced by primary and secondary methods before the declining of
the reservoir energy, but the production of heavy crude oil/bitumen requires thermal and/or
solvent stimulation of the reservoir, which are termed Enhanced Oil Recovery, (EOR)
techniques. Thermal EOR processes can be classified as steam-based and in-situ combustion

Chapter 1: Introduction
4
techniques. The steam-based methods includes: steam flooding, Steam Assisted Gravity
Drainage (SAGD), and Cyclic Steam Stimulation (CSS), and the in-situ combustion processes
are namely conventional in Situ Combustion (ISC) and the novel Toe-to-Heel Air Injection
(THAI) and its add-on catalytic upgrading process in-situ (CAPRI). These processes all rely
on viscosity reduction through heating to improve oil fluidity and production. However, for
steam processes such as SAGD and CSS for every 2-5 barrels of water injected as steam a
barrel of oil is produced, which makes it very energy-intensive with a large environmental
burden (Gates and Chakrabarty, 2006). This implies that large volumes of water and natural
gas are needed for steam generation adding to the capital and operational cost. Additionally,
the produced oil from steam EOR processes requires the addition of expensive diluents to aid
pipeline transportation to refineries as well as further surface upgrading to meet refinery
feedstock specification. In-situ combustion processes however require less amount of water
and also the heat provided by the combustion reactions aid oil recovery.
In situ upgrading of heavy oil/bitumen downhole could present a number of
advantages, such as use of available heat and gases, reduced requirement for surface
upgrading and production of low-viscosity oil that can be transported without diluent addition
(Xia and Greaves, 2001; Xia, et al., 2002). THAI and its catalytic add-on CAPRI have been
developed over the last 10-15 years as techniques for thermal heavy oil recovery and in situ
upgrading. In CAPRI the horizontal producer well is incorporated with an annular packed-bed
of refinery catalyst. As the mobilized heavy oil flow through the packed-bed of catalyst it
undergoes further upgrading reactions. The yardstick for measuring the extent of heavy crude
oil upgrade is the improvement in API gravity, viscosity, and the reduction of asphaltenes and
hetero-atoms (Ovalles and Rodriguez, 2008). Xia and Greaves (2001) reported a 3-D physical
model study of catalytic upgrading of Wolf lake heavy oil using THAI-CAPRI. They found

Chapter 1: Introduction
5
that thermal cracking upgrading alone by THAI achieved about 9o increase in the API gravity
of the produced oil, while the API gravity of the produced oil by incorporating CAPRI
increased upgrading further by 3-7 o API with 85 % recovery of original oil in place (OOIP).
This result indicates that it can be possible to convert heavy oil to light oil in a single step
down-hole process. Subsequent work by Shah and co-workers (2011) gave a detailed
optimisation of process variables such as reaction temperature, pressure, oil flow rate, and
gas-to-oil ratio to be used in the CAPRI process. They found an optimum reaction
temperature of 425oC, oil flow rate of 1 mL.min
-1, and that the deposited coke and metals on
the catalyst during reaction rapidly deactivate the catalyst. In this study therefore the central
objective is extending the lifetime of the catalyst by controlling coke formation while
improving upgrading by performing the reaction under hydrogen, steam, and methane
environments and also activated carbon guard-bed. However, CAPRI conventionally requires
the packing of the well with commercial pelleted hydrodesulphurisation catalyst prior to start-
up, and has been associated with catalyst deactivation issues during production. So, the
hurdles of packing the horizontal producer well as well as the catalyst deactivation problems
could potentially be solved by the use of dispersed once-through nano-catalytic particles
injection ahead of the combustion front during THAI-CAPRI process. Coke formation is
minimised, because nanosized catalyst exposes more active sites and possess short diffusion
routes, rather than diffusion limitation of large molecules experienced in their pelleted
counterpart (Xuhong, et al., 2013). The upgrading levels achieved in the fixed-bed process are
compared with the dispersed nanoparticulate catalyst. The objectives of the study and thesis
layout are detailed in Sections 1.2 and 1.3, respectively.

Chapter 1: Introduction
6
1.2 Aim and Objectives of the Study
The aim of the THAI-CAPRI process was not only to improve API gravity and
viscosity of the oil to promote pipeline transportation, but also to remove impurities and
provide a feedstock that meet downstream processing and refinery specification. The specific
objectives investigated in the current study were:
1. To investigate the effectiveness and performance of catalyst under different conditions, by
evaluation of;
a. The extent of thermal versus catalytic cracking upgrading.
b. Effect of reaction temperature and weight hourly space velocity (WHSV).
c. Effect of catalyst type, shape and mono/bi-metallic catalysts.
d. Effect of different heavy oil feedstocks.
2. To obtain an understanding of the role of reaction gas environment on the chemistry of the
in situ catalytic upgrading process, namely to investigate;
a. The effect of hydrogen, methane, blend of gases (CO, CO2, CH4 and N2), and
nitrogen on the upgrading chemistry and coke formation.
b. Comprehend the role of hydrogen and methane in hydroconversion of
macromolecules, olefin saturation, and heteroatom removal.
c. Performance evaluation of ex situ regenerated catalyst against fresh catalyst.
3. To understand the magnitude of upgrading and coke deposition reduction in controlling
catalyst deactivation.

Chapter 1: Introduction
7
a. Investigate the influence of a guard bed installed prior to the catalyst bed upon the
extent of upgrading, impurities removal and coke reduction.
b. Investigate the role of hydrogen-addition in reducing coke formation and
hydrogenation.
c. Evaluate the role of steam environment in reducing coke deposition as well as
removing sulphur and metals.
d. To evaluate the potential of water-gas-shift reaction in providing hydrogen for in
situ hydrocracking and hydrogenation reactions in steam atmosphere.
4. To evaluate the effect of alternative contacting pattern using dispersed nanoparticulate
catalyst as compared to conventional fixed-bed catalyst CAPRI process. Also, the
performance of biomanufactured and refinery catalyst was tested.
1.3 Thesis Organisation and Overview
The eight technical Chapters in this thesis demonstrated the experimental technique of
catalytic upgrading of heavy crude oil in-situ. The study explores the CAPRI concept of
down-hole catalytic upgrading of heavy oils with emphasis on controlling coke formation and
catalyst deactivation while maximising the level of upgrading. The extent of upgrading was
evaluated in terms of change in API gravity, viscosity, true boiling point (TBP) distribution,
sulphur and metals removal, and change in asphaltenes content.
Chapter 1 provides an in-depth introduction to the study and motivation. It also
identified the need to sustain petroleum-based fuels, provides an overview of world heavy oil
distribution, and identified considerable areas of challenges from previous studies that require
further investigation. In Chapter 2, the different EOR technologies available for heavy oil and
Chapter 1: Introduction
8
bitumen extraction as well as the upgrading is reviewed. The Chapter provides the
fundamental knowledge of CAPRI on which the entire thesis was built. The experimental set-
up and procedures used in this study are detailed in Chapter 3. Also, the instrumental
techniques used to measure changes in upgraded oil samples properties; produced gas
composition, characterised fresh and spent catalysts after reactions are described in this
Chapter.
Chapter 4 is devoted to finding the optimum reaction temperature and WHSV for
upgrading. The emphasis is on effects of reaction temperature, WHSV, catalyst type, and
feedstock on the extent of upgrading and performance of CAPRI. Subsequent experimental
runs were based on the optimum temperature and WHSV obtained.
The impact of reaction gas environments on the chemistry of upgrading reactions and
coke formation is the subject of Chapter 5. In this Chapter, different media such as hydrogen,
methane, blend of gases (i.e., CO, CO2, CH4, and N2), and nitrogen are reported. In addition,
hydrogen-addition route to heavy oil upgrading was further explored. Understanding the role
of hydrogen in the conversion of poly-aromatic compounds was treated using anthracene. Ex
situ regenerated spent catalyst was also evaluated against fresh catalyst in terms of upgrading
level obtainable.
Catalytic upgrading process deals with cracking of heavy molecules into lighter ones.
However, these molecules contribute to high coking and catalyst deactivation as they impact
directly on the catalyst bed. In this regard, the aspect of this study that deals with controlling
coke formation by introducing guard-bed on top of the catalytic bed is described and reported
in Chapter 6. Consequently, the impacts of the guard-bed on upgrading, asphaltenes as well as
sulphur and metals removal are also explored.

Chapter 1: Introduction
9
In Chapter 7, analysis of the spent catalysts recovered from the CAPRI reactor after
upgrading reactions for coke content, elemental composition, surface morphology, and micro-
structural changes before and after reaction are reported. Chapter 8 is concerned with the
effect of steam environment on the extent of upgrading and coke formation.
Chapter 9 is concerned with a comparative study of alternative contacting pattern by
dispersing nanoparticulate catalyst at the mobile oil zone (MOZ) beyond the combustion front
during THAI process and the conventional CAPRI which involves packing of the horizontal
well with pelleted refinery catalyst prior to start-up. Also, biomanufactured Pd are compared
with its chemical counterpart.
Finally, Chapter 10 presents some concluding remarks on the results of the studies and
highlights various aspects of this study that still need further investigation.

Chapter 2: Review of Heavy Oils Recovery and Upgrading Processes
10
Chapter 2
Review of Heavy Oils Recovery and Upgrading Processes
2. Introduction
Crude oil is a fossil fuel formed from the remains of plants and animals which have
accumulated at sediment bottoms. Over time, pressure, heat, and bacterial action transformed
the deposits into hydrocarbons, water, carbon dioxide, hydrogen sulphides, etc. (Robinson,
2006). Geologically, crude oil becomes heavy via biological, chemical and physical
degradation processes during migration and after entrapment inside the pore-space of the
rocky reservoir. Hence, heavy oil and bitumen is formed from the residue of formerly light oil
whose light molecular weight hydrocarbons components have been lost through microbial
degradation, water-washing and evaporation (Meyer and Attanasi, 2003). The U.S. Geological
Survey (USGS) Energy Resource Program has classified crude oils depending on their API
(i.e., American Petroleum Institute) gravity and viscosity (i.e., the resistance flow) as shown
in Figure 2.1.
It is clear that the API gravity of heavy oil is several points lower than that of light oil.
Similarly, the viscosity of heavy oil is extremely high in magnitude compared with that of
light oil. Natural bitumen (or tar sands) is more dense, has poor mobility, and extremely low
viscosity. The photographs in Figure 2.2 illustrate the physical characteristics of light oil,
heavy oil and oilsand.

Chapter 2: Review of Heavy Oils Recovery and Upgrading Processes
11
Figure 2.1 Crude oil classification based on API gravity and viscosity (Smalley, 2000).
Figure 2.2 Photograph of (a) heavy oil; (b) light oil and (c) oilsand.
While light crude oils are produced easily by the natural reservoir pressure and water
flooding, heavy oil and bitumen rely on Enhanced Oil Recovery (EOR) technologies for their
(a) (b) (c)

Chapter 2: Review of Heavy Oils Recovery and Upgrading Processes
12
exploitation. This Chapter provides an in-depth description of the different methods of
extracting and upgrading heavy oils and bitumen into light oil.
2.1 Composition of Heavy Oils
The crude oil composition and properties vary with location, origin and type. Heavy
crude oil and bitumen are a complex mixture of about 105-10
6 different hydrocarbon
components (Wiehe, 1999). Notwithstanding, heavy crude oil components can be classified
into four components: saturates, aromatics, resins, and asphaltenes collectively called SARA,
as illustrated in Figure 2.3.
Figure 2.3 Molecular structures illustrating SARA components of heavy oil (Strauz and
Lown, 2003).
A micro-emulsion model involving the above four components present in the crude oil
was proposed by Wiehe and Liang (1996). In the model, asphaltenes occupy the core of
micelles dispersed by the surfactant-like properties of resin that have been adsorbed on their
ParaffinNaphtheneNaphthene Paraffin
Aromatic
Resin
Asphaltene
Saturate

Chapter 2: Review of Heavy Oils Recovery and Upgrading Processes
13
surface, which are held in solution by aromatic, as shown in Figure 2.4 (Wiehe and Liang,
1996; Leyva, et al., 2007).
Saturates are a fraction of the heavy oil consisting of non-polar hydrocarbons with
linear, branched, and cyclic structures saturated with hydrogen. They include paraffins (i.e.,
saturated straight and/or branched chains hydrocarbon) and naphthenes (i.e., cyclic saturated
hydrocarbon with one or more rings and in some case with paraffin side chains, as shown in
Figure 2.3). Moreover, a high proportion of saturates in the crude oil indicates an increase in
the yield of lower molecular weight or lower boiling point fractions.
Aromatics are hydrocarbons with one or more unsaturated benzene rings fused
together. They may be linked with paraffinic side chains and/or a naphthenic ring as shown in
Figure 2.3. However, saturates and aromatics are light components compared to resins and
asphaltenes, which implies that light crude oil contains high percentage of these components.
Asphaltenes and resins are the heaviest components of the crude oil; as such the
heaviness of crude oil can be linked to the high proportion of asphaltenes compared to light
crude oil (Alvarez-Ramirez, et al., 2006). Resins are polar poly-aromatic molecules often
Asphaltenes
Resins
Saturates
Aromatics
Figure 2.4 Micro-emulsion of crude oil SARA components.

Chapter 2: Review of Heavy Oils Recovery and Upgrading Processes
14
containing heteroatoms such as nitrogen, oxygen, or sulphur. They are soluble in light alkanes
such as n-pentane, n-heptane, etc. with molecular weight less than 1000 g.mol-1
. Asphaltenes
are composed of aromatic polycyclic clusters linked with one or more aliphaltic (or
naphthenic) structure (Alvarez-Ramirez, et al., 2006; Montel, et al., 2008). The model of
asphaltene molecular structure from California, Venezuela and Maya crude oils, respectively,
obtained from the literature are shown in Figure 2.5.
Figure 2.5 Four asphaltenes molecular structures (a) i. Obtained from California crude oil by
Groenzin and Mullins (2000), ii. Obtained from Venezuela crude oil by Speight and
Moschopedis (1979) (b) i. Obtained from Mayan crude oil by Zajac et al. (1994) and ii.
Obtained from Venezuela crude oil by Murgich et al. (1996).
(a) (b)
(i)
(ii)
(ii)
(i)

Chapter 2: Review of Heavy Oils Recovery and Upgrading Processes
15
The constituents of the heavy oil/bitumen that are soluble in n-alkanes are referred to as
maltenes/petrolenes (i.e., saturates, aromatics and resins). Whilst the asphaltene components
of the crude oil are insoluble in low-molecular weight n-alkanes (e.g., n-C5 to n-C7), they are
soluble in aromatic solvents such as toluene (Pacheco-Sanchez, et al., 2004). Also, their
molecular weight ranges from 3000 to 5000 g.mol-1
(Jacob, 1971). Mansur et al. (2012) used
Photo Correlation Spectroscopy (PCS) to study the size of asphaltene macromolecules. They
found the average size of the asphaltene particles ranging from 12 to 22 nm, which is too
large to pass through micro-pores or even some meso-pores in the catalyst. This component of
the oil has the tendency to agglomerate due to temperature, pressure, and composition
changes during extraction, transport, and upgrading stages. Additionally, asphaltenes possess
a high content of Conradson Carbon Residue, CCR (i.e., the coking tendency) more than the
other components. The coke formation during upgrading is a consequence of a series of
multiple reactions that proceeds from saturates to aromatics, then resins to asphaltenes and
finally to coke, as the conversion to light hydrocarbon oil occurs (Sawarkar, et al., 2007). The
asphaltene cores (i.e., aromatics) are suspended in the oil by paraffinic side chains that
interact with the other components. Upon reaction, the aromatic cores are separated from the
asphaltene and the cracked paraffin form gas or liquid product while the aromatic core
polymerises to coke (Chianelli, et al., 2013).
Heavy metals (e.g., Ni, V, etc.) and other heteroatoms (e.g., S, N, and O) are known to
be more concentrated in the heavier components of the crude oil such as asphaltenes and
resins, and less linked with saturates and aromatics. The organometallic compounds readily
poison and shorten catalyst lifetime during catalytic upgrading. These heavy metals such as
nickel and vanadium exist in chelating complexes in the form of porphyyrinic or
nonporphyrinic structures (Yin, et al., 2009; Leyva, et al., 2007), as shown in Figure 2.6.

Chapter 2: Review of Heavy Oils Recovery and Upgrading Processes
16
Figure 2.6 Organo-metallic compounds in heavy oil as porphyrinic, non porphyrinic, and
other form of complex (Leyva, et al., 2007).
Moreover, both porphyrin and non-porphyrin form of the metals can result from the
presence of rock minerals in the oil reservoir induced by temperature and pressure changes
within the reservoir during crude oil formation.

Chapter 2: Review of Heavy Oils Recovery and Upgrading Processes
17
2.2 Enhanced Oil Recovery (EOR) Technologies
With heavy oil having viscosities in the range of 1 to more than 50 Pa.s, primary (i.e.,
by natural reservoir pressure) and secondary recovery methods such as water flooding are
limited to 5-10% recovery of the original oil in place (OOIP), due to unfavourable mobility
ratio between oil and water phases, leaving a considerable amount of oil (about 80-95%) in
the reservoir (Liu, et al., 2007; Dong, et al., 2009). EOR is therefore regarded as a tertiary
recovery or Improved Oil Recovery (IOR) technique. EOR techniques are mainly applied to
recover trapped residual oils retained in the reservoir after secondary recovery, owing to
capillary forces and immobility of oils as a result of high viscosity at reservoir conditions of
temperature and pressure (Thomas, 2008). EOR techniques typically involve increasing the
temperature of the oil-bearing formation (i.e., heating) or reducing interfacial tension to
improve oil mobility. Heavy oil recovery technologies are generally classified into two main
groups the thermal and non-thermal recovery methods as shown in Figure 2.7 (page 18).
After laboratory assessment of the various EOR methods, ExxonMobil classified the
applicability of the various EOR technologies based on the grade of oil: light oil – gas
injection (miscible and immiscible) and chemical processes, heavy oil – thermal processes
and mining, and viscous oil – polymer flooding, cold flow (ExxonMobil, 2009). However,
reservoir geology and thickness plays a significant role in the choice of technique in addition
to the oil properties (Shah, et al., 2011). In the following Sections the various types of EOR
techniques are reviewed in detail and compared.

Chapter 2: Review of Heavy Oils Recovery and Upgrading Processes
18
Figure 2.7 Heavy oil recovery technologies.

Chapter 2: Review of Heavy Oils Recovery and Upgrading Processes
19
2.3 Chemical Flooding
Chemical flooding involves the injection of chemical formulation as the displacing
fluid into the reservoir to reduce interfacial tension between the oil and water, decrease
mobility ratio, increase capillary number and improve sweep efficiency (Shah, et al., 2011;
Thomas, 2008; Greaves, et al., 2000; Thomas and Farouq, 2009). Chemical flooding requires
higher reservoir permeability compared to gas injection, however it offers an environmental
benefit as it produces no green house gases. The technique has a typical recovery factor (i.e.,
the ratio of produced oil to the initial oil in place) up to 40% OOIP; it is limited by the high
cost of chemicals and its application to large reservoirs (Thomas, 2008; Shah, et al., 2011).
2.3.1 Polymer Flooding
Polymer flooding involves the injection of water soluble polymer solutions such as
polysaccharides and polyacrylamides into the oil-bearing formation to improve the water-oil
mobility ratio, increase viscosity of water, reduce the permeability of the aqueous phase, and
improves displacement sweep efficiency in order to enhance oil recovery (Thomas, 2008;
Hou, 2007). In the light of this, the method is sometimes referred to as polymer-augmented
water flooding, applied as a slug process and driven using dilute brine. The technique has
considerably higher oil recovery potentials than water flooding, typically about 6-12% higher,
which gives a 40-50% recovery factor of initial oil in place (IOIP) after application (Hou,
2007).
Following this recovery level, polymer flooding has been found to be suitable for
reservoirs with high mobile oil saturation and moderate reservoir heterogeneity, and not
recommended for oil with viscosity greater than 200 mPa.s (Wang and Dong, 2009).

Chapter 2: Review of Heavy Oils Recovery and Upgrading Processes
20
However, the technique is limited by polymer degradation in the reservoir, loss of polymer to
porous matrix of the reservoir, and for heavy oils higher concentration of polymer solution is
required to reduce the mobility ratio, which may cause injection difficulty and more cost
(Sheng, 2011 and 2013).
2.3.2 Surfactant Flooding
Surfactants are a blend of surface active substances which are usually amphiphilic
compounds (e.g., petroleum sulfonates). The blend of these surface active materials has the
potential to reduce interfacial tension between oil and water because of its amphiphilic
character, boosting the dispersion of oil in water, making oil droplets more readily deformed
and easing the flow through pores, lowering the threshold pressure and residual oil saturation
in the oil-bearing formation upon injection, thereby increasing the oil production rate (Bryan
and Kantzas, 2007; Dai-yin and Hui, 2008). In some cases, co-surfactants such as alcohol and
water-soluble polymers are injected to improve the interactions between surfactant and
sandstone rocks. However, the porous medium geology in addition to the reservoir pore
wettability greatly influences the performance of surfactant-based flooding for EOR
(Jamaloei, et al., 2011). Besides, the slug size and surfactant concentration are limited by cost.
Additional difficulties facing surfactant flooding are: excessive surfactant loss to the porous
medium of the reservoir incurring more cost, treatment and disposal of emulsions, and also
the adsorption and reactions of surfactant with rock and sandstones in the reservoir in some
cases (Krumrine and Falcone, 1983).

Chapter 2: Review of Heavy Oils Recovery and Upgrading Processes
21
2.3.3 Alkaline Flooding
Alkaline flooding involves the injection of an aqueous alkaline solution such as
sodium hydroxide, sodium orthosilicate, potassium hydroxide, sodium carbonate, ammonium
hydroxide, etc. in slug form into the oil-bearing formation. The improved recovery depends
on the chemical reaction between the alkaline agent and the organic acid constituents (i.e.,
saponifiable component) of the crude oil to produce in situ surfactant (i.e., soap) that has the
ability of reducing interfacial tension between oil, water and rock in the reservoir (Thomas,
2008; Sheng, 2011; Mayer, et al., 1983).
It has been reported that the fundamental recovery mechanisms of the alkaline
flooding process include in situ formation of water-in-oil (O/W) emulsions, penetration of the
alkaline solution into the oil and the formation of water drops inside the crude oil phase. This
implies that the crude oil should have a significant amount of saponifiable components (i.e.
organic acid) for its effectiveness and formation of in situ surfactants. The method is suitable
for reservoirs with oil viscosity less than 100 cP (Sheng, 2011).
Despite its simplicity, low cost of chemicals and operation in comparison to other
chemical methods, there has been little field application, as most of them have been
unsuccessful. This is because of the complex reactions between the alkaline solution and the
rocks and reservoir fluids, the technique not being suitable for reservoirs of carbonate
formation, and the cost of treating produced emulsion and fluids recovered from the reservoir.
Other challenges associated with the method for heavy oil recovery includes channelling of
injected alkaline solution, the formed water-in-oil emulsion may block the high permeability
zone, and poor volumetric sweep efficiency (Sheng, 2013; Chen, et al., 2013).

Chapter 2: Review of Heavy Oils Recovery and Upgrading Processes
22
2.3.4 Micellar Flooding
In this process, a slug solution containing surfactant, co-surfactant, alcohol, brine and
oil are formulated to form surfactant-stabilised microemulsions slug with droplet sizes of 10-4
to 10-6
mm composed of micelles that are miscible with reservoir oil as well as water
(Thomas, 2008). The micellar solutions injected into the oil-bearing formation lowers the
interfacial tension between the oil, aqueous phase and rocks, to release and improve the
mobility of trapped oil in the pores of the formation of the reservoir. This is immediately
followed by the injection of a polymer buffer for mobility control, and subsequent injection of
a buffer of fresh water to prevent contamination.
Notwithstanding the recorded field successes compared to other chemical methods
(Gogarty and Tosch, 1968), the geology and conditions of the reservoir such as high salinity,
high temperature and clay content have limited its applications (Thomas, 2008). Moreover,
the design and formulation of the micellar solution is expensive and complex due to the
multiple phase behaviour. However, investigations have shown that micellar flooding has the
potential to recover 35-50% of the oil in place after water flooding (Thomas, 2008).
2.3.5 Alkaline-Surfactant-Polymer (ASP) Flooding
ASP flooding was developed in the 1980’s and its oil recovery potential is based on
the combined mechanisms of alkaline, surfactant and polymer flooding in a single unit. In the
light of this, an aqueous solution containing alkali, surfactant and polymer is injected into the
oil-bearing strata of the reservoir to drive the crude oil out of the formation and enhance
production rate. It has been found that the EOR potential of the technology is over 20% OOIP
(Deng, et al., 2005). The ASP flooding method has had several field trials especially in China,

Chapter 2: Review of Heavy Oils Recovery and Upgrading Processes
23
such as Daqing and Shengli oilfields with some satisfactory increase in oil production (Kang,
2001; Hong, et al., 2009).
The drawbacks identified during field application of ASP flooding method are severe
scaling in the injection lines and the produced water contains large amounts of residual
chemicals, which forms a complex and stable emulsion, therefore making it difficult to treat
(Hong, et al., 2009; Wang, et al., 2011). Furthermore, no effective treatment technique has
been developed to treat the produced waste water from ASP flooding, which makes it a
potential environmental pollutant and therefore limited further field applications (Wang, et al.,
2011).
2.4 Miscible Displacement
The two main reasons of using a fluid that is miscible with the oil residue include:
firstly, it eliminates the effects of interfacial intensions. Secondly, if the miscible fluid has
lower viscosity than the oil, upon solubilising with the oil it creates a mixture which has a
lower viscosity than that of the OOIP, thus aiding recovery with low pressure gradient to
displace the oil mix from the porous medium. The technique therefore involves the injection
of common driving fluids such as carbon dioxide, light hydrocarbon, nitrogen or liquefied
petroleum gas (LPG) into a separate injection well to drive the oil into another well called the
production well.
As the displacing fluid advances, a mixing zone develops with spreading profile as the
solvent front advances. The miscibility of the process is however governed by the
temperature, pressure, composition of the oil in the reservoir as well as the composition of the
displacing fluid. Thus, the key parameter for designing a miscible displacement system for

Chapter 2: Review of Heavy Oils Recovery and Upgrading Processes
24
EOR is the minimum miscibility pressure (MMP), which depends on the reservoir
temperature, oil composition and the displacing fluid (Zuo, et al., 1993).
The various miscible drive methods are miscible slug process, enriched gas drive,
vaporizing gas drive and high pressure gas (e.g., CO2, N2, etc.) injection. The fluids that are
used for miscible displacement have lower density than the reservoir oil, as the greater density
difference between the fluid and oil increases the sweep efficiency (Thomas, 2008). However,
channelling and viscous fingering can decrease efficiency of the process. Hence, miscible
displacement is only economical for enhanced recovery of low viscosity crude oil with API
gravity greater than 20o API (Zuo, et al., 1993).
2.4.1 Carbon dioxide Miscible Displacement
Carbon dioxide miscible displacement for enhanced oil recovery was first
implemented in 1964 at the Mead-Strawn Oilfield and in 1972 at the Collie-Schneider
Oilfield in the United States (PingPing, et al., 2010). Carbon dioxide can become a
supercritical fluid at relatively low temperatures (31.1oC) and pressures (73.8 bar), and is less
viscous than oil. The use of carbon dioxide for EOR process is based on its properties which
are ability to reduce the viscosity of the oil, decreasing the residual oil saturation; its low
minimum miscibility pressure for a wide range of crude oils, and swelling the oil phase in the
reservoir formation (Mehos and Ramirez, 1989). It has the ability to vaporise heavier
components (C5-C30), leading to reduction in surface tension and viscosity of the oil which
improves miscible displacement through multiple contact extraction of the C5-C30
hydrocarbons. Carbon dioxide miscible flooding is suitable for light and medium crude oils,
low temperature and shallow reservoir.

Chapter 2: Review of Heavy Oils Recovery and Upgrading Processes
25
After oil recovery has been completed the CO2 is left behind in the reservoir.
Therefore, its use for EOR would be of potential importance in reducing greenhouse gas
emission, due to the increasing concern about global warming. Also, CO2 flooding is
applicable to both sandstones and carbonate reservoirs. However, due to its low viscosity,
mobility control is poor and the gas tends to channel and bypass the producer well, leaving
most areas of the oil reservoir unswept. In addition, severe reservoir heterogeneity can lead to
excessive channelling and bypassing of the injected CO2, because it is less dense and
therefore tends to move upwards through the reservoir. Other problems encountered on the
use of CO2 miscible displacement includes low reservoir volumetric sweep efficiency due to
viscous fingering and gravity override, which is not suitable for heavy oil and bitumen as high
miscibility pressure is required. Also, it requires laboratory and field evaluation to acquire
adequate information for planning and implementation of a full scale project, in addition it is
expensive compared to water flooding (Matthews, 1989). Additionally, dissolved CO2 could
induce asphaltene precipitation, which upon deposition onto the porous matrix, plugs and
reduces the amount of oil recovery.
Regardless of the above limitations, the CO2 miscible displacement technique can
achieve up to 30-35% recovery factor of IOIP (Matthews, 1989). Tuzunoglu and Bagci (2000)
reported that in continuous CO2 injection mechanism, the highest recovery factor (15.1%
OOIP) was obtained using Vertical Injection Horizontal Production (VIHP) well arrangement
and water-alternating-gas (WAG) injection mechanism yield a higher recovery factor of about
34.5% OOIP. The main problem of the process is severe corrosion of the injection well.
Chapter 2: Review of Heavy Oils Recovery and Upgrading Processes
26
2.4.2 Nitrogen Miscible Displacement
Nitrogen has been used successfully as the injection fluid for EOR, in the following
oilfields; Jay field, FL (Exxon), Painter field, WY (Chevron), East Binger field, OK
(Phillips), and Lake Barre field, LA (Texaco) (Hudgins, et al., 1990). The fundamental
principle and mechanisms of nitrogen miscible displacement is similar to that of CO2 miscible
flooding, except that the MMP for nitrogen miscible displacement is higher. The extent of
miscibility is affected by the temperature and pressure of the oil reservoir. The conditions that
improve miscibility of nitrogen with crude oil in the reservoir include high reservoir pressure
and light crude oil containing intermediate hydrocarbon components C2-C5 (Hudgins, et al.,
1990). In this regard, the reservoir that will satisfy this condition must be deep enough to
withstand this high pressure.
Subsequently, the advantages of nitrogen EOR include the ready availability of
nitrogen gas which makes the process more economical, cheaper than the use of CO2 or LPG,
environmentally friendly, completely inert even in the presence of water and not corrosive.
The estimation of MMP of nitrogen is one of the major limitations to its application.
2.4.3 Hydrocarbon Miscible Displacement
Hydrocarbon flooding is becoming a viable means of EOR; it involves the injection of
short-chain hydrocarbon fluids such as methane, propane or liquefied petroleum gas (LPG)
through an injection well into the oil-bearing formation to aid dilution of the heavy oil. As a
result of mixing through diffusion and/or dispersion of the LPG into the residue/heavy oil, the
heavy oil viscosity reduces and the fluidity improves, which causes a displacement towards
the production well. This is because the short-chain hydrocarbons are considerably less

Chapter 2: Review of Heavy Oils Recovery and Upgrading Processes
27
viscous than the oil in place. The rate of oil recovery is affected by several factors such as
mass transfer, viscous forces and gravity drainage (Salama and Kantzas, 2006). The
molecules of the injected hydrocarbon fluid may continue to mix with the oil in the reservoir
until a saturation concentration is reached at the reservoir temperature and pressure.
Moreover, when the mobility ratio M (i.e., the ratio hydrocarbon mobility/oil
mobility) is less than 1 it favours dispersion, mixing and displacement. If M > 1, it causes
instability in the displacement front leading to viscous fingering or channelling. This will
therefore lead to early breakthrough of the fluid and poor sweep efficiency, as most portions
of the porous medium remain unswept by the displacing fluid. Therefore, the main challenges
to the process are ensuring sufficiently high rock permeability to gain access to a large
fraction of the oil in the reservoir (Salama and Kantzas, 2006). Hydrocarbon fluid is
expensive to use. Another limitation of using hydrocarbon fluids is their propensity to
precipitate asphaltenes from the crude oil (Mehran, et al., 2008).
2.5 Microbial Enhanced Oil Recovery (MEOR)
The MEOR was first proposed by Bechman in 1926, but the laboratory work of
ZoBell in the 1940s brought a serious consideration of the technology (Zobell, 1947). MEOR
techniques rely on the inoculation of the oil reservoir with mixed anaerobic or facultative
hydrocarbon degrading microbes such as clostridium, bacillus, micrococcus, arthrobacterium,
or xanthomonous. The enhancement of recovery is based on their ability to generate bio-
surfactants (to help reduce interfacial tension between oil and rock/water surface),
biopolymers, gases, acids, and solvents as they multiply exponentially. The modes of
injecting the microorganisms into the oil-bearing formation include cyclic microbial recovery

Chapter 2: Review of Heavy Oils Recovery and Upgrading Processes
28
(single well stimulation), microbial flooding recovery and selective plugging recovery (Lazar,
et al., 2007).
Over 400 patents have been issued on MEOR technology, however it has not gained
wide acceptance by the oil industries because most of the literature reports are on laboratory
scale and field trials lack convincing proof (Brown, 2010). Additionally, the physical and
environmental constraints within the oil reservoir such as temperature, pressure, the pore size
and geometry, chemical and biological factors, and salinity level limits microbial activities in
the oil-bearing formation. In the view of this, attention has been turned to anaerobic
extremophiles such as thermophiles, barophiles and halophiles that can withstand extreme
conditions in the oil reservoir (Sen, 2008). The microbes can reside and perform in situ
conditions of temperature up to 94oC, formation depth range 2400-3500 m, and water
salinities as high as 140,000 ppm total dissolved solids (Govreau, et al., 2013). In contrast,
microbial EOR offers the following advantages: the products are biodegradable and
environmentally friendly, and the method is economical since no energy is required.
2.6 Thermal Methods
Cold production of heavy oil typically achieves oil recovery factors of less than 20%
OOIP (Greaves, et al., 2000; Tuzunoglu and Bagci, 2000). In such situations, reducing the
viscosity of the heavy oil is the most efficient and immediate means to produce the oil left in
the reservoir after cold production. In order words, thermal EOR is a potential candidate for
secondary recovery as it supplies heat to the reservoir, which induces temperature rise in the
oil-bearing matrix, reducing the viscosity of the heavy oil in situ by several orders of
magnitude, vaporising the lighter components of the oil and thus mobilising the oil. In

Chapter 2: Review of Heavy Oils Recovery and Upgrading Processes
29
essence, compared with other methods of in EOR, thermal methods for heavy oil recovery are
the most efficient and successful owing to their high oil recovery following the field reports
(Xia and Greaves, 2006; Greaves, et al., 2000b; Nare, et al., 2007).
Thermal methods include hot fluid injection, in situ combustion (i.e. heat generated in
situ by burning small fraction of the reservoir crude) and use of electrical heaters. The high
cost of energy and thermal efficiency influences the choice of thermal EOR.
2.6.1 Steam Flooding
It is well known that heavy oil and bitumen viscosity decreases steadily with
increasing temperatures. In this respect, high temperature steam is used to convey heat to the
oil-bearing matrix. Steam flooding is one of the most commonly used thermal EOR
techniques that have been studied extensively over the past 40 years and as a result of these
trials is considered suitable for medium and heavy oil reservoirs, with many commercial
successes from field projects reported in the literature (Bagci, et al., 1998). The continuous
injection of steam into the oil-bearing formation via the injection well induces heat energy,
thereby improving the fluidity of the oil towards the producer well, as shown in Figure 2.8
(Shah, et al., 2010).
Steam flooding is a complex EOR process involving heat, mass and momentum
transport in the porous media, leading to viscosity reduction, phase change, thermal
expansion, steam distillation, gas drive, solvent extraction and capillary variations to improve
oil fluidity and production (Jabbour, et al., 1996; Liu and Ramirez, 1994).
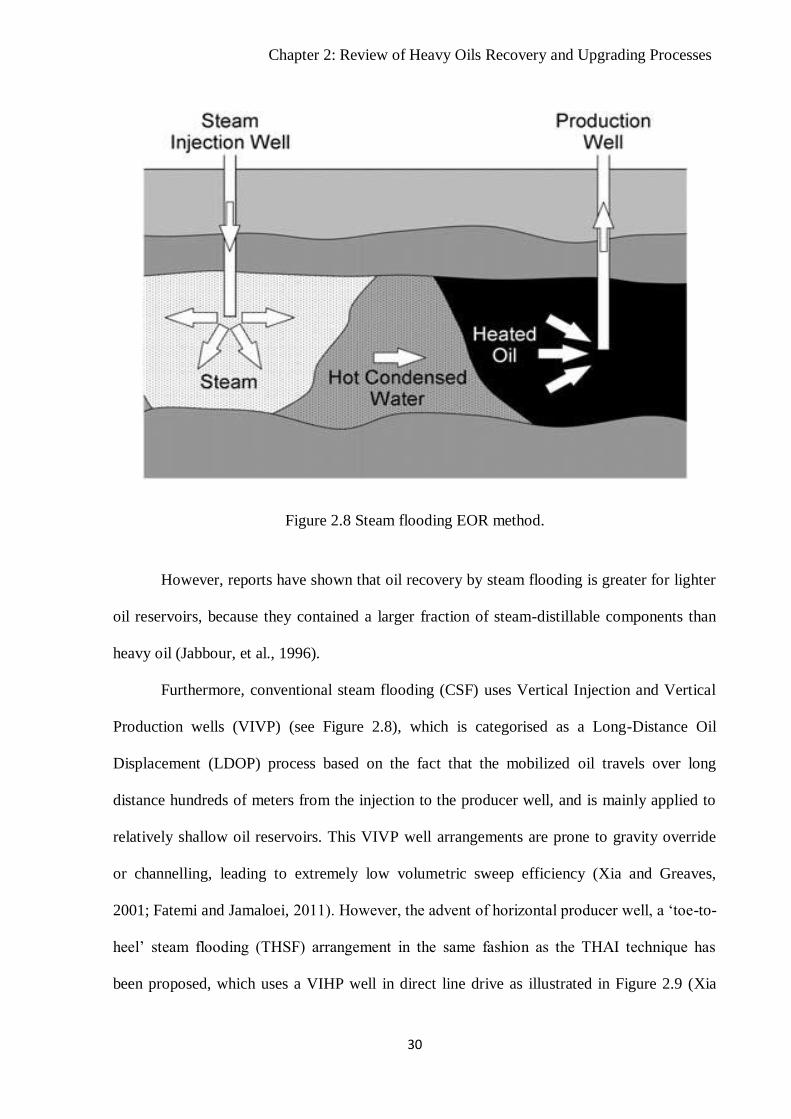
Chapter 2: Review of Heavy Oils Recovery and Upgrading Processes
30
Figure 2.8 Steam flooding EOR method.
However, reports have shown that oil recovery by steam flooding is greater for lighter
oil reservoirs, because they contained a larger fraction of steam-distillable components than
heavy oil (Jabbour, et al., 1996).
Furthermore, conventional steam flooding (CSF) uses Vertical Injection and Vertical
Production wells (VIVP) (see Figure 2.8), which is categorised as a Long-Distance Oil
Displacement (LDOP) process based on the fact that the mobilized oil travels over long
distance hundreds of meters from the injection to the producer well, and is mainly applied to
relatively shallow oil reservoirs. This VIVP well arrangements are prone to gravity override
or channelling, leading to extremely low volumetric sweep efficiency (Xia and Greaves,
2001; Fatemi and Jamaloei, 2011). However, the advent of horizontal producer well, a ‘toe-to-
heel’ steam flooding (THSF) arrangement in the same fashion as the THAI technique has
been proposed, which uses a VIHP well in direct line drive as illustrated in Figure 2.9 (Xia

Chapter 2: Review of Heavy Oils Recovery and Upgrading Processes
31
and Greaves, 2000 & 2001; Fatemi and Jamaloei, 2011). This arrangement achieves high
steam front sweeping efficiency compared to the VIVP well, as the mobilised oil and the
steam condensate ahead of the steam front is drained into the exposed section of the
horizontal producer well immediately. Therefore, the VIHP well is called a short distance oil
displacement (SDOD) method.
Figure 2.9 Toe-to-heel steam flooding (THSF).
Typical oil recovery factors in steam flooding are in the range 50-60% of oil in place
(Thomas, 2008). Research on steam flooding EOR has identified factors such as rock
properties, crude oil composition, steam quality, steam/oil ratio and steam injection rate as the
key variables that determine the performance and success of the process (Bagci, et al., 1998).
The amount of water required depends on the steam/oil ratio. For instance, a steam/oil of 2
means that two barrels of water converted to steam are required to produce one barrel of the
heavy oil. Additionally, gravity override and excessive heat loss to adjacent formations occur,
Steam

Chapter 2: Review of Heavy Oils Recovery and Upgrading Processes
32
steam generation is energy intensive and expensive, and steam breakthroughs are other
common factors that impede the process efficiency.
2.6.2 Cyclic Steam Stimulation (CSS)
Cyclic steam stimulation was discovered accidentally by Shell in Venezuela during
production of heavy crude oil by steam flooding of the Mene Grande field (Butler and
Stephens, 1980). The process is also known by the ‘steam soak’ and ‘huff and puff’. The CSS
method of heavy oil recovery has been used to produce 14,500 m3 per day bitumen from Cold
Lake, Alberta, Canada by Imperial Oil Limited for over ten years (Label and Moriyama,
1997). In CSS technology, the heavy oil recovery mechanism is similar to other steam
flooding techniques which include heating oil-bearing matrix, steam distillation, viscosity
reduction, gas drive and mobilisation of oil towards the well.
The CSS technique involves alternating cycles of injecting steam and producing oil
from the same well, involving a three stage process (i.e., injection, soak and production) as
illustrated in Figure 2.10. The first stage involves the injection high pressure and high
temperature steam into the oil reservoir for several weeks depending on the formation
thickness, oil saturation and number of previously performed injection cycles. Then in the
second stage (see Figure 2.10), the well is temporally shut for a period (some weeks) to allow
the steam to heat or “soak” the oil-bearing formation, reduce oil viscosity and improve
mobility towards the well. After an adequate soaking period, the injection well is then opened
for oil production. The oil production rate continues until the rate of oil recovery becomes
uneconomical due to heat losses to rock formations. At this stage, the cycle of soak-and-
produce or huff-and-puff is then repeated. However, the oil production rates tend to reduce

Chapter 2: Review of Heavy Oils Recovery and Upgrading Processes
33
with each successive cycle and require an increasing amount of injection steam (Fanaritis and
Chilingarian, 1989). The steam to oil ratios starts from 2:1, and increases as the cycles are
repeated in the range 3:1 to 4:1.
Figure 2.10 The 3 stages of cyclic steam stimulation (CSS).
The temperature of the heated zone with time and the radius of the heated zone
determines the stimulation ratio (or percentage increase in oil production), that is, the ratio of
oil production rate following steam stimulation to oil production rate prior to steam
stimulation (Fanaritis and Chilingarian, 1989). Although, there is a faster production response
and lower capital cost initially using CSS than steam flooding, it is challenging to estimate the
stimulation ratio due to factors such as steam bypassing through fractures in the formation,
well-bore heat loss and gravity segregation (Razavi and Kharrat, 2009). Thus, due to its
discontinuous manner, the typical recovery factor is 10-40% of oil in place.
Stage 1Steam injection
Stage 2Soak phase
Stage 3Production
Oil
Injected steamHeated oil
and water
Steam and hot condensed water
heat oil
Chapter 2: Review of Heavy Oils Recovery and Upgrading Processes
34
2.6.3 Steam Assisted Gravity Drainage (SAGD)
The advent of horizontal wells in the 1980s, led to the development of SAGD. It is
another steam injection technique, with greater superiority compared to other steam processes
because its gravity-assisted mechanism allows the expansion of a stable steam chamber and
the short distance oil displacement (Greaves, et al., 2000a). The concept of SAGD technology
for heavy oil recovery was developed by Roger Butler with Imperial Oil, and the technique
was first trialled at Cold Lake for the recovery of heavy oil in the 1980s (Butler and Stephens,
1980; Butler, 1985). Presently, there are many of the SAGD process projects in progress for
the recovery of heavy oils, bitumen and tar sands in operations in Canada.
SAGD uses two parallel horizontal wells which are about 4-6 meters apart into the oil-
bearing formation, as illustrated schematically in Figure 2.11. The top is the steam injection
well and the bottom horizontal well serves as the producer well. The heated heavy oil or
bitumen drains down by gravity with condensed steam into the producer well immediately
below.
The technique is described as a short distance oil displacement process, since the
mobilised oil flows into the producer well in the shortest distance (a few metres) compared to
the long distance displacement encountered with the VIVP well configuration of conventional
steam-flooding. The driving force is therefore the gravity force (Xia, et al., 2003; Greaves, et
al., 2000a). The continuous injection of steam creates a rising high-temperature steam
chamber, which then spreads vertically and horizontally in the oil reservoir reducing viscosity
and enhancing fluidity (Thomas, 2008).

Chapter 2: Review of Heavy Oils Recovery and Upgrading Processes
35
Figure 2.11 Steam Assisted Gravity Drainage (SAGD) process.
However, the counter-current flow between the rising steam and the draining oil,
limits the efficiency and the utilisation of the reservoir energy (i.e., natural drive) and the
gravity drive; therefore, SAGD is mainly recommended for reservoirs with low reservoir
energy (i.e., low pressure and low solution-gas oil ratio) such as exist in tar sands (Greaves, et
al., 2000a; Batycky, 1997).
Furthermore, the SAGD process is faced with challenges such as the cost and the large
volume of water and natural gas required for steam generation, the applicability is demanding
in terms of large formation thickness and permeability greater than 5000 mD (Batycky, 1997;
Farouq, 1997). The process is complex and labour intensive (Greaves, et al., 2000a), not
suitable for thin reservoirs, and it is also sensitive to operational and reservoir parameters such
as steam injection rate and duration, well separation, reservoir heterogeneity, and rock
permeability. Additionally, at the early stage efficiency is higher, but lowers significantly with
Steam Injection (Injection well)
Injected steam
Oil
Oil production (producer well)
Heated oil and condensed steam

Chapter 2: Review of Heavy Oils Recovery and Upgrading Processes
36
time due to heat losses to the formation. The oil recovery factor ranges from 40-70% of
OOIP.
These limitations and the quest to improve the economics of SAGD, led to the
development of alternative processes such as vapour-assisted petroleum extraction (VAPEX),
expanding solvent steam assisted gravity drainage (ES-SAGD), and steam and gas push
(SAGP). VAPEX process is the solvent analogue of SAGD for heavy oil recovery, it was
proposed by Butler and Mokrys (Mokrys and Butler, 1993; Butler and Mokrys, 1989 &
1991). VAPEX is therefore non-thermal version of SAGD, in which mixture fluids such as
ethane, propane, butane, etc., are injected alongside a carrier gas (e.g., nitrogen, carbon
dioxide, etc. used to raise the dew point of the solvent to keep it in vapour phase) into the
upper horizontal well instead of steam (Mokrys and Butler, 1993). The vaporising solvents
forms a vapour chamber, which spread through diffusion and dispersion into the oil-bearing
formation, reducing the viscosity of the heavy oil by dilution, and the diluted and reduced-
viscosity oil is drained down by gravity into the lower production well, as shown in Figure
2.12 (Swapan and Butler, 1997).

Chapter 2: Review of Heavy Oils Recovery and Upgrading Processes
37
Figure 2.12 Mechanism of VAPEX process (Swapan and Butler, 1997).
The process offers some benefits such as lower energy cost, in situ upgrading
attributed to deasphalting, less energy consumption, and less environmental pollution (i.e.,
reduction greenhouse gas emission) compared to SAGD (Swapan and Butler, 1997).
However, the mechanisms of viscosity reduction and upgrading are slow compared to SAGD.
Because of the large difference between molecular and thermal diffusivities thermal processes
tend to be faster than solvent methods. The basic mechanisms of viscosity reduction by
VAPEX are dispersion and diffusion, which are relatively less efficient than the application of
heat for viscosity reduction (Thomas, 2008). Additionally the cost of solvent adds to its
capital and operational cost.
ES-SAGD process is a combination of VAPEX and SAGD process (Nasr and Isaac,
2001), in which small amount of solvent is injected with steam. The solvent and steam enters
into the vapour chamber and flows to the edge of the chamber, with the steam delivering its
Vapour Chamber
or
Sweep Area
Drainage Edge
Injector

Chapter 2: Review of Heavy Oils Recovery and Upgrading Processes
38
latent heat to the heavy oil and the solvent diffusing and dissolving into the heavy oil,
lowering viscosity via dilution, the mobilised oil and condense steam with solvent drained
down by gravity into the producer well (Gates, 2007 & 2010). However, using solvent and
steam incur an additional cost. The steam and gas push (SAGP) was proposed in which a non-
condensable gas (natural gas or nitrogen) is injected with steam. This therefore reduces the
amount of steam used, increases the thermal efficiency, oil/steam ratio is improved and the
steam chamber expands faster laterally (Liu, et al., 2011; Butler, 1999). However, the SAGP
process is still at the developmental stages.
2.6.4. In Situ Combustion (ISC)
In situ combustion (fire flooding) is a thermal EOR technology, in which an oxidizing
gas (e.g., air) is injected into the oil-bearing formation to generate heat as it combusts with a
small fraction of the oil in the reservoir. The generated coke supports continuous combustion
with air. The released heat increases the temperature of the oil-bearing formation, which
causes viscosity reduction by several orders of magnitude and mobilises the flow of the
unburned oil fraction (Xia and Greaves, 2000; Xia, et al., 2003; Castanier and Brigham,
2003). The conventional in-situ combustion technique for heavy oil recovery uses vertical
injection well and vertical production well (VIVP) arrangement, as illustrated in Figure 2.13.
Therefore, the mobilised oil in conventional ISC builds up in the colder region of the oil
reservoir before getting to the producer well.

Chapter 2: Review of Heavy Oils Recovery and Upgrading Processes
39
Figure 2.13 Schematics conventional In Situ Combustion (ISC).
The progression of this combustion front in the oil reservoir creates several zones
between the injection well and the producer well, in this order: burned zone, combustion zone,
cracking region, evaporation and visbreaking region, steam plateau, water bank, oil bank and
initial zone, the details of each zones can be found in Castanier and Brigham (2003). An
exothermic oxidation reaction is believed to occur between the hydrocarbons and oxygen,
while pyrolysis takes at higher temperature. Because of these reactions, the temperature of the
oil-bearing formation in the combustion zone can increase in the range of 500-700oC, which is
significantly higher compared to steam flooding 150-250oC (Xia and Greaves, 2000). High
temperature is favourable for heavy oil as it lowers the oil viscosity drastically and aids
pyrolysis of the heavy oil to lighter oil. However, when ISC is operated in high temperature
oxidation (HTO), the reactions occurring are (Xia and Greaves, 2001 & 2006):
(a) Thermal cracking (pyrolysis):
Enriched air
injection well
Production
well

Chapter 2: Review of Heavy Oils Recovery and Upgrading Processes
40
Heavy residue → Light oil + Coke (2.1)
(b) Oxidation of coke (HTO):
Coke + Oxygen → CO + CO2 + H2O (2.2)
(c) Oxidation of heavy residue:
Heavy residue + Oxygen → CO + CO2 + H2O (2.3)
According to Moore et al. (1997), ISC offers many advantages over other EOR
methods, because the generation of thermal energy in situ in the reservoir offers: high thermal
efficiency in terms of heat utilisation, highly efficient displacement drive mechanism, less
environmental impact, and subsequently upgrades the heavy crude oil (Xia, et al., 2002).
Despite the extensive laboratory and field studies, the conventional ISC technique has not
gained wide acceptance because the process has not achieved the success predicted by the
theory (Xia and Greaves, 2006), due to poor control of the process and the challenges
associated with the use of VIVP wells for heavy oil recovery.
Nonetheless, the continuous supply of sufficient air flux is necessary to maintain the
process in HTO mode. However, a very high gas flux leads to gas overriding and oxygen
breakthrough at the production well (Xia and Greaves, 2003). The methods of operating ISC
include:
Forward combustion;
o dry combustion.
o wet combustion.
Reverse combustion;
High pressure air injection.

Chapter 2: Review of Heavy Oils Recovery and Upgrading Processes
41
In the forward combustion technique, the combustion front moves in the same
direction as the air flow towards the production well from the injection well. It is the most
widely practiced in the field. The forward combustion is further categorised as “dry” when
only enriched air is injected and “wet” when water and air are co-injected (Castanier and
Brigham, 2003), while the reverse combustion operation occurs when the combustion front
advances in opposite direction to the flow of air. The high pressure air injection is a low
temperature oxidation (LTO) process that occurs below 300oC, which does not support
combustion leading to the production of oxidized hydrocarbons (Greaves, et al., 2000b;
Thomas, 2008).
2.6.5 Toe-to-Heel Air Injection (THAI)
The limitations of the VIVP wells of the conventional ISC process led to the concept
of THAI. The THAI technology was developed by the Improved Oil Recovery group at the
University of Bath, in collaboration with the Petroleum Recovery Institute, Calgary, Canada
in the 1990’s (Greaves, 2004). The technology has been field trialled at Christina Lake,
Alberta, Canada. It integrates ISC and horizontal production well(s) to create a stable
propagation of combustion front, as illustrated in Figure 2.14. The fundamental principles of
operations of THAI process are same with conventional ISC process. However, the mobilised
oil travels a short distance to the producer well in a region called the mobile oil zone (MOZ).
The coke for combustion is produced ahead of the combustion front by thermal cracking of
heavy oil (Xia, et al., 2003; Xia and Greaves, 2006).

Chapter 2: Review of Heavy Oils Recovery and Upgrading Processes
42
Figure 2.14 Schematic presentation of THAI process.
One of the basic prerequisites for in situ combustion is fuel (i.e., coke material that is
rich in carbon) availability in the reservoir, sufficient to support the propagation of the
combustion front (Greaves, et al., 2008, 2012; Jinzhong, et al., 2012; Wenlong, et al., 2011).
The fuel accessibility is a function of thermal cracking of high molecular weight hydrocarbon
molecules. This complex process is primarily a function of: oil composition, porous matrix
properties, cracking temperature, reservoir pressure, fluid flow, and temperature (Greaves, et
al., 2008; Wenlong, et al., 2011). The main distinguishing feature between THAI process and
conventional ISC process is that THAI uses a horizontal producer well(s) instead of vertical
producer well as in conventional ISC process (Greaves and Xia, 2004). The propagation of
the combustion front from toe-to-heel due to continuous injection of air creates different
zones namely: burned zone, combustion front, coke zone, mobile oil zone (MOZ), and cold
oil zone, as shown in Figure 2.15, further details can be found in Xia et al. (2002).

Chapter 2: Review of Heavy Oils Recovery and Upgrading Processes
43
Figure 2.15 Illustration of the recovery and upgrading process in THAI.
The temperature ranges from 500-600 oC in the combustion zone, to aid thermal
cracking (or pyrolysis) of high molecular weight hydrocarbons (see Eq. 2.1). A mobile oil
zone (MOZ) is created ahead of the combustion front (see Figure 2.15) where most of the
thermal upgrading reactions are occurring. The mobilised and thermally upgraded oil in MOZ
does not pass through the cold region as in conventional ISC process, but rather are drawn
downward into the horizontal production well(s) via the shortest pathway. This VIHP
however eliminates the problem of gas overriding and bypass, as the horizontal well seals as a
result of coke formation during the propagation of the combustion front (Shah, et al., 2010;
Xia, et al., 2003). However, the recovery factor of THAI process ranges from 70-80% of oil in
place (Greaves, et al., 2012; Thomas, 2008). Table 2.1 summarizes the main benefits of THAI
process for the recovery of heavy oil and bitumen.

Chapter 2: Review of Heavy Oils Recovery and Upgrading Processes
44
Table 2.1 Benefits of THAI process for recovery and upgrading of heavy oil (Xia, et al.,
2003).
1. controlled gas override, resulting in a quasi-upright in situ combustion front
2. High sweep efficiency due to the absence of gas channelling in the producer
3. Less environmental impact due to the removal of sulphur and heavy metals
4. Maintain process in HTO mode, avoiding LTO mode as a result of high air flux
5. Unique enhanced mobile oil zone (MOZ) ahead of the combustion front reduces
sensitivity to reservoir heterogeneity in the virgin zone.
6. Front tracking capability through its ‘toe-to-heel’ propagation with tight control of
propagation.
7. Create ideal condition for downhole catalytic upgrading, through CAPRITM
process.
According to the available results from 3D combustion cell (0.6 х 0.4 х 0.1 m)
experiment and study carried out by Greaves et al. (2012), the propagating front average
temperature of 500-550 oC, and in situ upgrading up to 16-17
o API gravity compared to 10.9
o
for the feedstock was reported. The API gravity increment was the result of thermal cracking
of the heavy fractions into lighter component in MOZ. In addition to the oil undergoing
pyrolysis, upgrading reactions could also result from the natural catalytic activity of the host
rock. In another study of THAI fire-flooding process by Jinzhong et al. (2012) and Wenlong
et al. (2011) using 3D sand-pack cell (0.4 х 0.4 х 0.15 m) consisting of injection, production,
and measuring and control systems. The experiment was performed for heavy oil viscosity of
12,090 mPa.s at 50 oC, sand-pack porosity of 39%, injected air/oil ratio 1400 m
3/m
3, and oil
saturation of 84%. They found that the combustion front could reach temperature as high as
600 oC with average in the range of 450-550
oC, with 70 % recovery of OOIP.

Chapter 2: Review of Heavy Oils Recovery and Upgrading Processes
45
2.7 Heavy Crude Oil Upgrading Technologies
The need to upgrade heavy oil into cleaner and more valuable light oil is increasing
continuously, in order to sustain future fuel needs. However, heavy oils and bitumen
properties such as high viscosity/low fluidity, high density/low API gravity, high asphaltenes,
sulphur, and metal does meet refinery feedstock specifications. Therefore, the objectives of
upgrading are 1) to reduce the viscosity to aid production and pipeline transportation without
diluents addition and 2) to produce synthetic crude oil that meets the qualities of refinery
feedstock (see Figure 2.16).
Figure 2.16 Route to refinery for conventional and non-conventional oils.
Consequently, upgrading heavy oil and bitumen is pivotal to the economics of their
exploitation, as it adds to the total capital cost of making them commercially viable (Hedrick,
et al., 2006). In addition, the profitability of heavy crude oil/bitumen upgrading is a function
of the market value, i.e., the price differential between the heavy oil and the upgraded oil
(Leyva, et al., 2007). Thus, the rising price of crude oil globally favours heavy oil
exploitation. The upgrading technologies are generally classified under two headings, namely
surface upgrading and in-situ upgrading (Speight, 2009). The different technologies used in
upgrading heavy oil and bitumen are presented in Figure 2.17.
Non-conventional oil
(e.g, heavy oil,
bitumen, etc.)
Upgrading
processes
Refinery
Conventional light
crude oil

Chapter 2: Review of Heavy Oils Recovery and Upgrading Processes
46
Figure 2.17 Classification of heavy oil upgrading processes.
The conversion of heavy crude oil to synthetic light crude oil is either accomplished
by carbon-rejection (i.e., thermal cracking reducing carbon content), hydrogen-addition (i.e.,
hydroprocessing increasing hydrogen content), and/or solvent deasphalting.
Surface upgrading processes
Solvent
deasphalting
Heavy-to-light
process
Aquaconversion
technology
Delayed Coking
Visbreaking
Steam cracking
Fluid catalytic
cracking
Coking process
Carbon rejection
processes
Separation
processes
Hydrogen addition
processes
Hydrocracking
Hydropyrolysis
Hydrotreating
Heavy oil and bitumen upgrading
technologies
THAI-CAPRI
Ultra-dispersed
catalyst particles
In situ upgrading processes

Chapter 2: Review of Heavy Oils Recovery and Upgrading Processes
47
2.8 Surface Upgrading Processes
Existing refineries can be modified to accommodate heavy oil/bitumen or a stand-
alone upgrading facility can be used convert the heavy oil into synthetic light crude suitable
for conventional refineries. A surface upgrading facility is an integrated collection of two or
more unit processes mentioned in Figure 2.17. However, surface upgrading is cost and
energy intensive and also faced with environmental pollution problems associated with
emissions (Shen, et al., 2008).
2.8.1. Coking Processes
The coking process was first used by Great Canadian Oil Sands (now Suncor) in 1967,
to upgrade heavy crude oil (Flores, 2010). Coking is the generic term for thermal conversion
(i.e., carbon-rejection process) used to upgrade heavy crude oils, bitumen or
atmospheric/vacuum distillation residues to light oils, with coke as by-product. However, the
coking process is a severe thermal cracking of high molecular weight hydrocarbons into light
weight hydrocarbons performed at high temperature range of 450-520oC. There are three main
coking processes, namely delayed coking, fluid coking and flexicoking (Hsu and Robinson,
2006; Sawarkar, et al., 2007).
Delayed coking is a semi-continuous process in which the heavy crude oil is heated in
a furnace to initiate thermal cracking and charged into a large coking drum. The coking drum
provides a sufficient residence time necessary for the cracking reactions to proceed to
completion (Sawarkar, et al., 2007). The produced coke accumulates at the bottom of the
drum. To aid continuous upgrading two coking drums are used. The cracked product is sent to

Chapter 2: Review of Heavy Oils Recovery and Upgrading Processes
48
a hydrocracking/hydrotreating unit to improve stability and H/C atomic ratios, as shown in
Figure 2.18.
Figure 2.18 Schematic diagram of delayed coking upgrading process.
The coking process is capable of accounting for up to 30 wt% of the product as
produced coke, making it challenging in term of handling the coke stockpiles generated (Hsu
and Robinson, 2006). Despite the fact that it is the most preferred surface upgrading
technology by refiners, high coke formation and low liquid product are some of the demerits
of the process. In addition, the emissions of greenhouse gas (GHG) have been a major
environmental concern regarding the use.
Meanwhile, fluid coking (continuous coking) involves the use of a fluidized-bed of
hot coke particles to convert the heavy crude oil into light oil, as it is atomised into the fluid
bed. The hot coke particles aid the thermal cracking reactions in the reactor. The fluid coking
Heavy
Oil
Heater
Coke Coke
Coking drumsHydrocracker/
Hydrotreater
E-1
E-4 E-4
E-5
H2
Upgraded
oil
Gases
Chapter 2: Review of Heavy Oils Recovery and Upgrading Processes
49
process consists of a reactor and a burner. The cokes deposited on the particles are burned-off
in the burner and the particles recycled. However, the operating temperature is higher than
that of delayed coking, while the contact is time for cracking reactions is short. This condition
therefore reduces the amount of coke generated in fluid coking process.
2.8.2. Hydroprocessing
Hydroprocessing of heavy crude oil includes hydrocracking and hydrotreating,
respectively. In this process, cracking of the heavy crude is accompanied by hydrogen-
addition reactions, which facilitates the termination of many of the coke forming reactions in
the course of the cleavage of C-C bond. Hydroprocessing does not only upgrade the heavy
crude oil, but also produce synthetic oil of lower heteroatom and metal content (Leyva, et al.,
2007). While coking processes lower the carbon content, hydroprocessing increases the
hydrogen content with little carbon-rejection. In addition to dealkylation of aromatic rings and
C-C bond cleavage are hydrodesulphurisation (HDS), hydrodenitrogenation (HDN),
hydrodemetallisation (HDM), and hydrodeasphaltenization (HDAs), which are reactions
occurring simultaneously with hydrocracking during the process (Hsu and Robinson, 2006;
Leyva, et al., 2007).
Hydroprocessing reactors used to upgrade heavy oil or residues are typically operated
as fixed-bed, slurry phase, ebullating-bed, or moving bed of catalysts (Scherzer and Gruia,
1996). The commonly used catalysts are combinations of the following transition metals such
as Ni, Co, Mo, W, Pd, etc. (e.g., Ni-Mo, Co-Mo, Ni-W, Co-Pd, etc.) supported on solid acidic
silica, alumina (i.e., Al2O3), or zeolites (Leyva, et al., 2007). The profitability of the process
is a function of the catalyst lifetime. In spite of decreased coke formation, high hydrogen

Chapter 2: Review of Heavy Oils Recovery and Upgrading Processes
50
partial pressure is required (Batholomew, 1993). Moreover, the reaction conditions of
temperature, pressure (or hydrogen partial pressure) and space velocity influences the process
(Sanchez and Ancheyta, 2007). On the other hand, when impurities and heteroatoms are to be
removed from the crude oil/distillates, the process is called non-destructive (i.e.,
hydrotreating)
2.8.3. HTL (Heavy-to-Light) Upgrading Technology
The Rapid Thermal Processing, RTP (now HTL) was developed by Ivanhoe Energy
Inc. in the 1980s. The HTL process is similar to the fluidized catalytic cracking (FCC) unit,
however it is non-catalytic. The technology uses a circulating transport bed of hot sand to
rapidly induce thermal cracking of the heavy crude oil/bitumen in the absence of air to
convert them to a synthetic light crude oil, as shown in Figure 2.19 (Silverman, et al., 2011).
The HTL begins with atmospheric and vacuum pre-fractionation process as illustrated in
Figure 2.19. These initial fractionations add to the cost of the process. Also, the extent of
upgrading depends on sand-to-oil ratio and contact time, and it is a stand-alone upgrading
facility. Details of the HTL process can be found in Silverman et al. (2011), Koshka, et al.
(2008) and Veith, et al. (2007), respectively.

Chapter 2: Review of Heavy Oils Recovery and Upgrading Processes
51
Figure 2.19 HTL process flow diagram (Silverman, et al., 2011).
Subsequently, the cost of HTL surface upgrading process ranges from USD $12,000-
$20,000 per installed barrel of capacity, which depends on the scale, configuration and heavy
crude oil properties (Silverman, et al., 2011).
2.8.4. Visbreaking
Visbreaking (viscosity breaking) is a non-catalytic mild thermal cracking process used
to upgrade heavy crude oil with the aim of reducing viscosity as well as pour point
(Ogbuneke, et al., 2009; Joshi, et al., 2008). The process is mainly used in the petroleum
industry to upgrade heavy residue from atmospheric and vacuum distillation, to enhance the
production of naphtha and light distillate, respectively. The heavy crude oil is heated to a
temperature of about 480oC and transferred to a soaker at a pressure range of 140-300 psig
(Hsu and Robinson, 2006). Most of the thermal cracking and viscosity reduction occur in the
soaker.
Feed Product
Product
Atmospheric
Distillation
Tower
Feed
Atmospheric
Distillation
Tower
Reactor
Atmospheric Tower Bottoms
Vacuum
Distillation
Tower
Reheater
Air BlowerSand
Cooler
Reactor
Cyclone
Product
Quench

Chapter 2: Review of Heavy Oils Recovery and Upgrading Processes
52
The residence time in the soaker is short compared to delayed coker process. Thus, the
stability of the visbroken product depends on the heavy crude oil characteristics such as
paraffin, aromatic, asphaltenes, and heteroatom content (Kataria, et al., 2004). However,
during visbreaking, some C-C bonds split leading to reduction in carbon number, aromatics
and resins undergo dealkylation reaction, and asphaltenes also condensation reactions
(Fainberg, et al., 1996).
2.8.5. Solvent Deasphalting
This involves selective removal of asphaltenes from the heavy oil. In this respect, the
solvent deasphalting process makes use of the fact that asphaltene compounds are insoluble in
light hydrocarbons such as n-alkanes or paraffin, e.g., propane, butane, heptane, etc. to
selectively precipitate the asphaltenes present in the heavy crude oil (Hsu and Robinson,
2006). The process separation is achieved by molecular weight (i.e., density) rather than
boiling point.
The blend is heated slightly above the critical temperature of the used solvent, and
pumped into a rotating-disc solvent extraction tower at a temperature range of 65-120 oC and
pressure of 350-600 psig (Hsu and Robinson, 2006). The product is charged into a solvent
evaporator and steam stripped to recover used solvent. The deasphalted oil (DAO) has a
relatively low content of metals (Speight, 2009). A typical solvent deasphalting scheme is
shown in Figure 2.20.
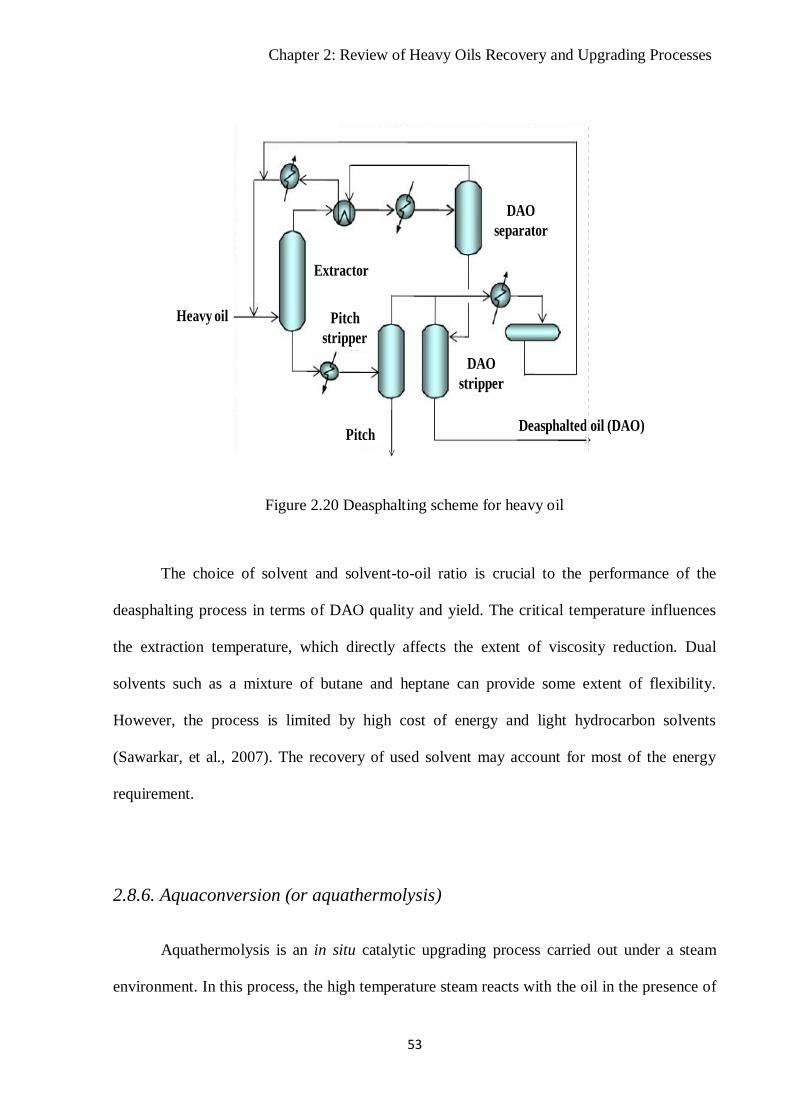
Chapter 2: Review of Heavy Oils Recovery and Upgrading Processes
53
Figure 2.20 Deasphalting scheme for heavy oil
The choice of solvent and solvent-to-oil ratio is crucial to the performance of the
deasphalting process in terms of DAO quality and yield. The critical temperature influences
the extraction temperature, which directly affects the extent of viscosity reduction. Dual
solvents such as a mixture of butane and heptane can provide some extent of flexibility.
However, the process is limited by high cost of energy and light hydrocarbon solvents
(Sawarkar, et al., 2007). The recovery of used solvent may account for most of the energy
requirement.
2.8.6. Aquaconversion (or aquathermolysis)
Aquathermolysis is an in situ catalytic upgrading process carried out under a steam
environment. In this process, the high temperature steam reacts with the oil in the presence of
Heavy oil
Extractor
Deasphalted oil (DAO)
DAO
separator
DAO
stripper
Pitch
stripper
Pitch
Chapter 2: Review of Heavy Oils Recovery and Upgrading Processes
54
catalyst; this was first studied by Hyne et al. (1982). The heat released by the steam pyrolyzes
the large molecular weight hydrocarbons present in the heavy oil in the presence of catalyst
into light hydrocarbon components (Wang, et al., 2010). The chemical reaction detail for
aquathermolysis proposed by Hyne et al. (1982) is:
RCH2-CH2S-CH3 + 2H2O → RCH3 + CO2 + H2 + H2S + CH4
Notably, the breaking of C-S bond and the generation of hydrogen gas from water are the
main mechanism of aquathermolysis. Nevertheless, the produced hydrogen improves the
stability of the liquid product. The process has the potential of converting heavy crude oil into
synthetic crude oil (syncrude) with reduced viscosity and high API gravity. In addition,
aquathermolysis does not yield much solid-byproduct such as coke nor does it require
external hydrogen, as the hydrogen-donor is steam (Speight, 2009). With the aid of catalysis,
the pyrolysis of the heavy oil is enhanced, its viscosity reduced significantly to enhance the
extraction of the oil (Wang. et al., 2010).
Though steam reduces viscosity by some order of magnitude, the issue of viscosity
regression with time remains a concern. The viscosity regression is attributed to the
interaction between the heteroatoms in the oil and other groups through hydrogen bonding or
van der Waals forces which lead to the formation larger molecules that cause viscosity
regression (Wang, et al., 2010). Furthermore, steam acts as a hydrogen-donor to support
hydrogenation, hydrodesulphurisation, hydrodenitrogenation, and hydrodemetallisation
reactions, respectively. Another limitation of the method is that the generation of steam is
expensive, as it requires large amount of water and natural gas.
Chapter 2: Review of Heavy Oils Recovery and Upgrading Processes
55
2.9. In-situ Upgrading Processes
Commonly used surface upgrading processes, have shown to be environmentally
unfriendly, in addition to the costs of building stand-alone facilities and emission of gaseous
pollutants such as CO2, H2S and other pollutants. The petroleum industries are presently
focusing attention on in situ upgrading of heavy oil. In-situ upgrading of heavy oil/bitumen in
the reservoir presents a number of advantages, such as production of low-viscosity oil that can
be transported without diluent addition, and that some of the impurities in the heavy oil are
left behind in the reservoir during extraction and upgrading process in-situ.
Furthermore, in situ upgrading of heavy oil prior to reaching the surface in the
reservoir offers significant economic and environmental advantages over surface upgrading
techniques, because it is less capital intensive, can be applied on a well by well basis,
produces valuable product, and reduces demanding downstream processing (Moore, et al.,
1999). Subsequently, the reservoir serves as the reactor which implies that there is no need to
build a large costly pressure vessel as in the case of surface upgrading technology (Weissman,
et al., 1996). Weissman et al. (1996) and Moore et al. (1999) have outlined the requirements
for a successful down-hole or in situ catalytic upgrading of heavy oil in the reservoir, which
are: provision and placement of a down-hole catalyst bed in the oil-bearing formation,
creating appropriate reaction conditions of temperature and pressure at the catalyst bed and
process, mobilisation of heavy oil and co-reactants such as hydrogen, water, or carbon
monoxide over the catalyst in order to achieve adequate catalytic upgrading and produce
upgraded oil. The in situ upgrading processes include ISC, THAI and THAI-CAPRI.

Chapter 2: Review of Heavy Oils Recovery and Upgrading Processes
56
2.9.1 CAtalytic upgrading PRocess In-situ (CAPRI)
In 1998 the Improved Oil Recovery group at the University of Bath, UK, in
collaboration with the Petroleum Recovery Institute (PRI), Calgary, Canada, developed the
CAPRITM
process. The concept is based on THAI process, by placing an active catalyst layer
between the concentric slotted liners of the horizontal production well(s), as illustrated in
Figure 2.21. This creates a down-hole catalytic reactor aimed at achieving further upgrading
of the heavy crude as it flows across the catalyst layer, in addition to thermal upgrading
occurring (Xia and Greaves, 2001b; Shah, et al., 2011). The produced oil possesses improved
fluidity for pipeline transport and decreased impurities.
Figure 2.21 Schematic of the THAI-CAPRI process
Xia and Greaves (2001) experimentally demonstrated the potential of THAI-CAPRI
using Wolf Lake heavy oil. The result showed that THAI alone achieves roughly 10o

Chapter 2: Review of Heavy Oils Recovery and Upgrading Processes
57
increment of API gravity in the produced oil, with a further increase in the range of 4-7o API
points upon the addition of CAPRI. The produced oil had a low viscosity of 10 mPa.s at 20oC.
In another investigation Xia, et al. (2002) carried out a series of 3-D combustion cell
experiments, using Lloydminster heavy crude oil (11.9oAPI) and Co-Mo/alumina HDS
catalyst at a temperature of 500-550oC. They found that the oil recovery factor was 79%
OOIP and upgraded oil was 23o
compared to 11.9oAPI initially, with low viscosity of 20-30
mPas. These results show that THAI-CAPRI process has the potential to convert heavy crude
oil to almost light crude oil in a single step and with a recovery factor in a range 79-85%
OOIP, without resorting to expensive surface upgrading process.
On September 22nd
2008, Petrobank Energy and Resources Ltd. announced the first
THAI-CAPRITM
production (Petrobank, 2008). The well (P-3B) located at Whitesands near
Conklin, Alberta, Canada, commenced production in August, 2008. The P-3B well
demonstrated the additional upgrading ability of the CAPRI section, as reported in the
laboratory scale experiments of Xia, et al. (2002). Subsequently, the P-3B well has been in
continuous production, with oil production level up to 400 barrels per day on low air injection
rate and limited sand produced from the sandstone reservoir encountered at Whitesands
(Petrobank, 2008).
The hydroprocessing catalyst used for in situ catalytic upgrading are derived from
oxides of transition metals of group VIB such as Mo, W, and group VIII such as Co, Ni,
supported on high-surface-area alumina, silica, or silica-alumina. Examples are: Ni-
Mo/Al2O3, Co-Mo/Al2O3, Ni-W/Al2O3, Pd-Rh promoted Co/HPS (high porous saponite)
(Hossian, et al., 2004), and active carbon (Fukuyama, et al., 2004). In the work of Shah et al.
(2011), it was found that coke and metals are deposited on the catalyst during reaction and
rapidly deactivate the catalyst in the CAPRI section within a short time period (typically a few

Chapter 2: Review of Heavy Oils Recovery and Upgrading Processes
58
hours). Though, catalyst deactivation is inevitable, extending the catalyst lifespan could
improve the process economy. In this study, various means of extending catalyst lifetime
while improving upgrading will be explored by using hydrogen-addition, guard bed on top of
the catalyst, in-situ steam generation and its impact on coke reduction, and alternative
contacting pattern with nanoparticulate catalyst.
The cracking functions are provided by the acidic alumina support, whereas the Co,
Ni, and Mo metals perform the hydrogenation function. It is imperative to maintain rapid
molecular transfer between the acid sites and the hydrogenation sites in order to avoid
undesirable coke formation reaction. Coke formation suppression due to hydrogen-addition is
widely thought of as capping of free radical coke precursors, formed when carbon-carbon and
carbon-heteroatoms bonds split, leading to lower molecular weight compounds than the
original feed oil molecules (Benito and Martinez, 1996; Galarraga, et al., 2012). Active
hydrogen is released from the dissociation of hydrogen molecules on the metal sites of the
catalyst, and then subsequently reacts with coke precursors to form a stable molecule (Liu, et
al., 2003; Rezaei, et al., 2012).
Comparing THAI-CAPRI with SAGD, the most commonly used thermal EOR
method, it is obvious that SAGD projects are capital intensive in line with rising oil prices,
with some projects built at ~C$30,000-35,000/bbl/day five years ago, with a large amount of
natural gas and water is required to create steam for SAGD or CSS (Macquarie, 2010). A
surface upgrading plant was recently proposed for the UK at a cost of $2-3 billion, while the
THAI-CAPRI process could potentially cost a fraction of the surface upgrading process
because standard hydrotreating (HDT) catalysts are relatively cheap (Shah, et al., 2010).
Additionally, CAPRI uses the in-situ generated energy via combustion to drive the upgrading

Chapter 2: Review of Heavy Oils Recovery and Upgrading Processes
59
reactions, from which produced oil has enough fluidity for pipeline transport with little or no
diluents required.
The conventional CAPRI fixed-bed horizontal production well presented in Figure
2.21 stand the risks of well plugging as a result of asphaltenes and coke deposition, which can
cause possible shutdown as well as loss of production stability (Hashemi, et al., 2013). In this
respect attention has been turned to slurry-phase in situ catalytic upgrading with
nanoparticules. Dispersed nanoparticulate catalysts display several advantages over their
pelleted counterpart such as high metal utilisation due to the absence of diffusion limitation,
more active sites per unit mass, reduces the chances of pore plugging experienced in fixed-
bed, and high moderation of coke formation and deactivation (Alkhaldi and Husein, 2014;
Galarraga and Pereira-Almao, 2010; Hashemi, et al., 2013; Angeles, et al., 2013). The
formulation of nanoparticulate catalysts is similar to that of conventional pelleted catalysts in
which soluble precursors or water-in-oil emulsions containing metallic precursors such as Mo,
W, Co, Ni, or mixture thereof is used (Galarraga, et al., 2012). Galarraga and Pereira-Almao
(2010) tested trimetallic (Ni-W-Mo) submicronic catalyst in a batch reactor for dispersed-
phase upgrading at 380oC, a stirring speed of 500 rpm, and reaction time 3-70 h. After
upgrading reactions, they found that the produced oil sample (API gravity 16o and viscosity
at 40oC, 60 cP) compared to the Athabasca bitumen (API gravity 9.5
o and viscosity 7,680 cP).
However, it is challenging to recover and reuse the catalyst powder after reaction.
2.10 Chemistry of Heavy Oil Upgrading
Heavy crude oil and bitumen are complex mixtures of about 105-10
6 different
hydrocarbon components (Wiehe, 1999). Therefore, the chemistry of heavy crude oil

Chapter 2: Review of Heavy Oils Recovery and Upgrading Processes
60
upgrading is complicated, because of the many complex reaction mechanisms involved in the
thermal and catalytic upgrading to syncrude. The two main reaction routes to upgrade heavy
crude oil to synthetic light crude oil either carbon-rejection and/or hydrogen-addition, with or
without catalyst, basically driven by thermal energy (Heck and Diguiseppi, 1994). The overall
aim is to improve H/C atomic ratio, decrease heteroatom (e.g., S, N, etc.) and metals (e.g., Ni,
V, Fe, etc.), lower the viscosity, and increase the yield of distillates. Consequently, upgrading
occurs as a result of bond breaking. The most significant bond dissociation that leads to
upgrading is the cleavage of C-C bonds. The dissociation energies of the common bonds
found in the crude oil is presented in Table 2.2.
Table 2.2 Bond dissociation energy (Rahimi and Gentzi, 2006)
Bonds Kcal/mol
H-H 103
C-C 83-85
C-H 96-99
N-H 93
S-H 82
O-H 110-111
C=C 146-151
C-N 69-75
C-S 66
Ar-CH2-CH2-Ar 71
Ar-H 111
* Ar is an aromatic hydrocarbon
Furthermore, Hsu and Robinson (2006) outlined the numerous possible chemical
reactions that occur during upgrading, they include: homolytic cleavage of C-C bonds, side
chain fragmentation (or cleavage), ring growth, hydrogen shuttling, hydrogenation of

Chapter 2: Review of Heavy Oils Recovery and Upgrading Processes
61
aromatic/dehydrogenation of cycloparaffins, ring opening, heteroatom and heavy metals
removal. It is believed that the reaction mechanism during upgrading proceeds via the
formation of free radicals, as a result of the cleavage of C-C bond through free radical chain
reactions (Gray, 1994). Other reactions that take place in upgrading include thermal and
catalytic cleavage of C-C, C-S, and C-N bond dissociation (McMillan, et al., 1994; Rahimi
and Gentzis, 2006). From Table 2.2, it is clear that C-S has the lowest bond dissociation
energy; therefore it will easily break at low temperatures.
2.11 The Mechanism of Catalytic Upgrading
The mechanisms of catalytic upgrading are discussed in this section, in order to later
explain the observed experimental results. The catalytic upgrading reactions proceed through
the carbonium ion intermediate and beta-scission (Jian-hong, et al., 2008). The carbonium
ions are hydrocarbon ions having a positive charge on a carbon atom. This mechanism is
similar to the chain reaction mechanism in thermal cracking. However it has three basic
stages: initiation step, chain propagation, and termination. The initiation step begins with
formation of carbenium ion generated by paraffin cracking over the acid sites of the catalyst,
which was initiated by the direct attack of the Brǿnsted acid sites on C-C and/or abstraction of
a hydride ion (H-) from C-H bonds. Additionally, the other routes through which carbenium
ions may be generated include: 1) protolytic cracking, 2) hydride abstraction of paraffins, or
3) protonation of olefins by Brǿnsted acid sites (Lee, et al., 2011).
Thereafter, a series of hydride ion transfers from the hydrocarbon molecules to
carbocations takes place in the chain propagation stage, yielding carbenium ions steadily. In
some cases, the generated carbenium ions undergo isomerisation to stable secondary or

Chapter 2: Review of Heavy Oils Recovery and Upgrading Processes
62
tertiary carbenium ion through hydride shift or alkyl shift (Lee, et al., 2011). However, the
produced carbenium ions could split to various smaller hydrocarbons through β-scission,
hydride transfer, isomerisation, cracking, alkylation/dealkylation, protonation/deprotonation,
ring opening (i.e., naphthenic), cyclisation, etc. In the termination stage the carbonium ions
are depronated from the catalyst, collapse to give light hydrocarbons and/or hydrogen, and tri-
co-ordinated carbenium ions (Jian-hong, et al., 2008). In Figures 2.22 and 2.23, the cracking
pathways for paraffins, naphthenes, and aromatics are illustrated, respectively.
Ring opening
Light paraffin + olefin
Cracking
Aromatics
Dehydrogenation
Large paraffins
Naphthenes
Alkyl side chains
Aromatics Aromatic rings
Aromatic rings
Cracking
Coke
Naphthenes
Condensation and
dehydrogenation
Hydrogenation
Figure 2.22 Reaction pathways for paraffins, naphthenes, and aromatics.

Chapter 2: Review of Heavy Oils Recovery and Upgrading Processes
63
Figure 2.23 Aromatic cracking mechanisms (Lee, et al., 2011).
The several classes of reactions occurring are illustrated in Table 2.3. These reactions may be
responsible for the occurrence of low-boiling components in the upgraded oil (Pashikanti and
Liu, 2011).
Table 2.3 Key classes of catalytic upgrading reactions during CAPRI process.
Description Reactants and products
Class 1: Cracking reactions
Paraffin cracked to smaller paraffin and
olefins:
Cm+nH2[(m+n)+2] → CmH2m+2 + CnH2n+2
CnH2n+2 → CmH2m+2 + Cn-mH2(n-m) n > m
Olefins cracked to smaller olefins: C(m+n)H2(m+n) → CmH2m + CnH2n
Aromatics side-chain cracked: Ar-C(m+n)H2(m+n)+1 → Ar-CmH2m-1 + CnH2n+2
Naphthenes (cycloparaffins) cracked to
olefins and smaller naphthenes:
C(m+n)H2(m+n) (naphthene) → CmH2m
(naphthene) + CnH2n (olefin)
Class 2: Dehydrogenation and hydrogenation
Paraffin dehydrogenated to olefin: n-CnH2n+2 → CnH2n + H2
Naphthenes dehydrogenated to aromatics: Naphthene → Aromatic + 3H2

Chapter 2: Review of Heavy Oils Recovery and Upgrading Processes
64
Olefin to paraffin: CnH2n + H2 → CnH2n+2 or
CnHm + H2 → CnHm+2
Class 3: Hydrogen transfer
Paraffins and olefins converted to aromatics
and paraffins:
CnH2n (naphthene) CmH2m (olefin) → Ar-
CxH2x+1 (aromatic) + CpH2p+2 (paraffin)
where x = m + n – 6 – p
Class 4: Isomerisation
Normal paraffin to isoparaffin: n-CnH2n+2 → i-CnH2n+2
Normal olefin to iso-olefin: n-CnH2n → i-CnH2n
Class 5: Polymerisation and condensation of aromatics rings
Condensation of mono-, di-, and tri-
aromatics to poly-aromatics:
Ar-CHCH2 + R1CH-CHR2 → Ar – Ar + H2
where; Ar is aromatic compound, and R1, R2 are alkyl group
2.12. Conclusion
In this Chapter, various heavy oil recovery and upgrading technologies were reviewed. The
advantages and limitations of each process were highlighted. Findings showed that combining
extraction and upgrading in-situ has several advantages over surface upgrading. Also, thermal
extraction process has superior advanatages nonthermal processes. The review of the CAPRI
process for in-situ downhole upgrading of heavy oil revealed that rapid catalyst deactivation
as result of asphaltenes, coke and heavy metals deposition impact adversely on the economy
and operations. Therefore, in subsequent Chapters extending catalyst lifetime by minimising
coke and metals deposition will be explored. Alternatively, contacting the heavy oil via
nanoparticles application to THAI-CAPRI technology was investigated and reported.

Chapter 3: Materials and Method
65
Chapter 3
Materials and Method
3.1 Introduction
Crude oil remains a major provider of not only transportation fuels, but also feedstock
for paint, plastics, fertilizer and related industries. It is well known that light and heavy crude
oils have outstanding differences. Upgrading therefore is aimed at producing oil with similar
characteristics as light oil.
The in-situ catalytic upgrading process (CAPRI) starts with in-situ combustion to
supply thermal energy to the reservoir by heating the heavy oil and the rocks to high
temperature (400-550 oC). This will induce cracking reactions as well as drive catalytic
conversion incorporated to the horizontal well to reduce viscosity, remove impurities and
produce upgraded oil. The overview of the CAPRI experimental method and analytical
schemes used in this study is presented in Figure 3.1. The presence of hundreds of component
undergoing different reactions and competing for active sites of the catalysts contribute to the
complexity of the CAPRI. Details of the feed oil properties, experimental procedures, catalyst
characteristics, and assay of crude oil used to evaluate the level of upgrading relative to the
feedstock are presented in the following Sections. The catalyst performance assessment was
based on their ability to crack heavy fraction of the feed oils with boiling point above 343 oC
into lighter fractions, increase API gravity, decrease viscosity, remove impurities, and less
prone to coking.

Chapter 3: Materials and Method
66
3.2 Feedstock Properties
The heavy crude oil used in this study was supplied by Petrobank Energy and
Resources Ltd. from its WHITESANDS THAI pilot trial at Christina Lake, Alberta, Canada.
The feedstocks have been partially upgraded during thermal recovery by the THAI process
alone. The physical and chemical properties of the feedstocks are presented in Table 3.1. The
first denoted feed oil-A, was produced by THAI from a single well and the second is a blend
Spent catalyst:
Coke content by
thermogravimetric
analyser (TGA)
Scanning electron
microscopy (SEM)
Investigation includes:
Effect of reaction temperature, weight hourly
space velocity (WHSV), feedstock, and catalyst
shape
The use of guard bed on top of the catalyst
Effect of hydrogen-addition
Effect of steam environment
Dispersed nanoparticulate catalyst
Heavy crude oil (Feed oil)
CAPRI replicated using a Fixed-bed reactor
Produced gas:
analysed using refinery
gas analyser (RGA)
Upgraded oil samples:
API gravity
Viscosity
Simulated distillation
Asphaltenes content
Sulphur and metals
content
Micro elemental analysis
Figure 3.1 Experimental method and analytical schemes of the study.

Chapter 3: Materials and Method
67
of partially upgraded oil produced by THAI trials obtained from eight different wells, denoted
feed oil-B. The feed oil-B displayed 1oAPI greater than feed oil-A, but its viscosity is two
times that of feed oil-A. It is clearly seen from the simulated distillation that feed oil-B
contains more distillable fraction than THAI feed oil-A.
Table 3.1 Properties of the THAI heavy feed oils.
Parameter Feed oil-A Feed oil-B
API gravity (o) ~13 14.1
Viscosity at 20oC (Pa.s) 0.49 1.091
Density at 15oC (g.cm
-3) 0.9801 0.972
Sulphur (wt.%) 3.8 3.52
Ni (ppm) 56 41
V (ppm) 150 108
Ni + V (ppm) 206 149
Asphaltene (wt.%) 11.1 10.4
ASTM D2887 Distillation, oC
10 vol.% 105 104
30 vol.% 151 145
50 vol.% 208 177
70 vol.% 293 240
90 vol.% 405 336
3.3 Experimental Set-Up and Procedure
In the THAI process, air (and initially steam for raising temperature) is injected and
once the combustion is started the oil flows downwards in the mobile oil zone (MOZ) into the
perforated horizontal production well (Figure 3.2). This is the area where most of the thermal

Chapter 3: Materials and Method
68
cracking is believed to be happening. Hence the process moves from the ‘Toe’ position to the
‘Heel’. The oil in the MOZ remains hot upon reaching the horizontal production well due to
heat gained from the combustion zone. In the CAPRI section, the horizontal production well
has been packed with annular catalyst layer. As the hot oil passes through the catalytic layer,
catalytic upgrading is believed to occur. The CAPRI section was replicated by a cylindrical
core of 1 cm taken in a radial direction through the layer of the catalyst surrounding well as
represented in Figure 3.2.
Figure 3.2 Scaling the field CAPRI section to laboratory model representation with catalyst
bed volume of 12.86 cm3.
A flow diagram of the experimental rig used in this study is shown in Figure 3.3. The
experimental set-up was built and commissioned at the School of Chemical Engineering,
University of Birmingham, UK. A down flow micro reactor was used to ensure the complete
wetting of the catalytic bed with the help of gravity. The experiment was initiated by turning
on the furnace (Baskerville Ltd., UnK) and the trace heating (Omega, UK) and setting the

Chapter 3: Materials and Method
69
controls to the desired temperatures and pressures. Once the operating conditions of
temperatures and pressures were achieved in the reactor, the oil flow metering valve was
opened manually to initiate the oil flow from a feed tank pressurised by nitrogen gas. The
flow metering valve was adjusted until the desired flow rate of 1mL.min-1
was achieved.
The pressure in the feed tank was kept 5-10 barg higher than the packed microreactor
inside the furnace to ensure oil flow through the reactor. The feed oil (i.e., heavy crude oil)
was delivered to the packed catalyst bed in down flow mode to ensure flow by gravity and
complete wetting of the catalytic bed.
Figure 3.3 Schematic diagram of the CAPRI experimental setup (Hart, et al., 2013).
The feed oil was fed into trace heated lines having a set temperature of 280oC and into
the furnace after achieving the desired experimental temperature. The furnace provides
isothermal conditions along the active section of micro-reactor. Four gases, N2, H2, CH4, or
THAI gas (comprising 80% N2, 13-14% CO2, 3% CO, 4% CH4) were used as the reaction
N2
THAI Feed Oil
ReserviorMixing
Chamber
Vent
Refinery
Gas
Analyser
Vent
Sample Drain
Reactor
inside the
Furnace
H2
N2 80%
CO2 12-14%
CO 2-3%
CH4 2-4%

Chapter 3: Materials and Method
70
media to simulate the combustion gases expected in a real THAI-CAPRI reservoir. These
gases were mixed with the THAI feed oil in the mixing chamber and the gas-oil mixture
passed through the reactor in co-current flow. The gas-oil mixture of the partially vaporised
THAI feed oil flowed downward through the voids of the packed catalyst bed where it
undergoes cracking reactions aided by heat consumption.
The product stream coming out of the reactor passed through a back pressure regulator
(Swagelok Co. UK), which regulated and maintained a constant pressure of 20 barg in the
reactor. The upgraded products which include light oil and gases were passed to the gas-
liquid separator, where the light oil was collected. While the gaseous products are flashed off,
and either vented or sent to refinery gas analyser (RGA) for concentration and compositional
analysis by gas chromatography. The analyses were performed every 20 minutes during each
experimental run. The light oil sample was drained from the gas-oil separator initially every
20 minutes for the first hour, every 30 minutes for 4 hours and thereafter every 40 minutes,
and the collected oil was analysed using techniques listed in next section. The experimental
conditions used in this study are listed in Table 3.2.
Feed flowrate (mL.min-1
) 1
Catalyst inventory (g) 2.5 – 6
Pressure (barg) 10 – 40
Reaction temperature (oC) 350 – 425
WHSV (h-1
) 9 – 21.8
Gas-to-oil ratio (mL.mL -1
) 50 – 500
Steam-to-oil ratio (mL.mL-1
) 0.02 – 0.1
Table 3.2 Operating conditions in the experiments.

Chapter 3: Materials and Method
71
The micro-reactors each consist of a fixed catalytic bed of 1 cm diameter and length
41 cm. The reactors have three distinct zones: preheating, catalyst bed and post reaction
zones. The first zone was packed with inert glass beads 3 mm in diameter to a length of 9.3
cm to ensure homogeneous flow distribution of the feed oil and gas, to enhance the radial
contact and prevent axial mixing. The middle zone contains the catalyst bed comprised of
catalyst pellets, with a volume of 9.11 cm3 for 6 g catalyst (see Figure 3.4). This section is
intended to represent a cylindrical core of 1 cm diameter and 11.6 cm height taken in the
radial direction of the annular CAPRI section of the well. Finally, the post reaction zone of
the reactor was also packed with an inert glass beads to facilitate the disengagement of the
gas-oil mixture by the impingement of oil droplets upon the beads. However, when guard-bed
was introduced, the reactor was loaded in four zones: preheating, guard-bed (Activated
Carbon (AC) or alumina), catalyst-bed, and post reaction zones, as illustrated in Figure 3.5.
The weight ratio of the guard-bed material to the catalysts is 2:6 (w/w).
Figure 3.4 Reactor packing for 6 g of catalyst microreactor loading with catalyst only (Actual
bed is vertical in orientation).
Gla
ss b
eads
(2.5
cm
)
Gla
ss b
eads
(8.7
cm
)
Cat
alyst
(13.4
cm
)
AC
or
Alu
min
a
(7.3
cm
)
Fre
e sp
ace
(9.1
cm
)
Oil flow
Gla
ss b
eads
(9.8
cm
)

Chapter 3: Materials and Method
72
Figure 3.5. Microreactor loading for catalyst with guard-bed (Actual bed is vertical in
orientation).
In order to understand the influence of the generated gases of the THAI process on the
CAPRI upgrading effect, a laboratory bottled gas mixture representing the typical combustion
gases released by in-situ combustion in the THAI process, consisting of 13% CO2, 3% CO,
4% CH4, and 80% N2, was used as gas feed in selected experiments. In some experiments
the catalyst was reduced with hydrogen prior to the experiments at 425 °C for 45 minutes.
The catalysts used for the experiments were industrial hydrotreating catalysts.
3.3.1 Characteristics of the Packed-Bed Reactor
The bed void fraction was determined by the volume of water displaced by 6 g of
catalyst and the volume of bed from the height of the same catalyst in the reactor. The
porosity, bulk density, surface area of particles, and residence time of the fixed bed therefore
calculated using equation 3.1 to 3.4.
(3.1)
(3.2)
Gla
ss b
eads
(2.5
cm
)
Gla
ss b
eads
(8.7
cm
)
Cat
alyst
(13.4
cm
)
AC
or
Alu
min
a
(7.3
cm
)
Fre
e sp
ace
(9.1
cm
) Oil flow

Chapter 3: Materials and Method
73
(3.3)
(3.4)
where; ɛB is the bed porosity, VB, Vp are volume of the fixed bed and catalyst particles (cm3),
ρB , ρp are density of bed and particles (kg.m-3
), av, surface area of particles per unit volume
(cm2.cm
-3), dpeq is the equivalent particle diameter (cm), τ, is the residence in the catalyst bed
(min), Fi is the flow rate of the oil or gas phase.
The weight hourly space velocity (WHSV) is the ratio of the hourly mass flow rate of oil
charged to the mass of catalyst in the reactor. The WHSV is calculated using equation 3.5.
(3.5)
The pressure drops for both the oil and gas phase were calculated using Ergun’s equation (see
equation 3.6). The calculated pressure drop does account for build up due to coke deposition
on the catalyst. The liquid and gas hold up are calculated using equations 3.7 to 3.9.
(3.6)
(3.7)
(Ramachandran and Chaudhari, 1983) (3.8)
(3.9)
where; LB is the catalyst bed height, Pi is the pressure drop (Pa), µi is the fluid viscosity
(Pa.s), the fraction of the catalysts bed occupied by the gas phase (ɛg), HL, is liquid hold up
(cm3.cm
-3) is a measure of the extent of contacting between the oil and the catalyst.

Chapter 3: Materials and Method
74
The pressure drop over the reactor is a vital fixed-bed reactor characteristic, as it
influences operation cost. The liquid holdup is a function of the gas and oil flow rates, the oil
properties (e.g., density, viscosity, etc.), and the catalyst characteristics (e.g., size, shape, etc.).
Therefore, using the above equations 3.1 to 3.9 the characteristics of the packed-bed catalyst
was estimated for 6 g of catalyst and presented in Table 3.3.
Table 3.3 Packed bed characteristics for 6 g of catalyst; gas flow rate of 500 mL.min-1
; oil
flow rate 1 mL.min-1
.
Parameter Value
Reactor dimension
Inner diameter, ID (cm) 1
Outer diameter, OD (cm) 1.3
Packed Characteristics for 6 g catalyst
Bed height (cm) 12.6 – 13.2
Bed porosity, ɛB 0.45
Equivalent particle diameter, dpeq (cm) 3.55
Oil residence time in catalyst-bed, τo (min) 5.1
Gas residence time in catalyst-bed, τg (min) 0.01
WHSV (h-1
) 9.1
Oil pressure drop, Po (kPa) 12.6
Gas pressure drop, Pg (kPa) 7.64
Liquid holdup, HL (cm2.cm
-3) 0.36
Total oil residence time in the 3-zones of fixed-bed reactor (min) 9.8
3.3.2 Mass Balance
During the reactions gases are liberated and coke deposited in the bed as heavy oil gets
converted into light oil. The mass of gas evolved therefore was calculated as the mass
remaining after subtracting the masses of produced liquid and solid deposits in the reactor

Chapter 3: Materials and Method
75
from a known mass of heavy oil fed. The mass balances of the three products liquid, gas and
coke were calculated as percentage of the mass of feed oil fed using equations 3.10 and 3.11:
(3.10)
Gas (wt. %) = 100 – liquid yield (wt. %) – coke yield (wt. %) (3.11)
where wi is the weight of component i and wFeed is the overall weight of the THAI feed oil.
3.4 Characteristics of Catalyst
Hydrotreating (HDT) catalysts of Co-Mo/Al2O3 and Ni-Mo/Al2O3 quadra-lobe shaped
extrudate (AkzoNobel) were used in this study. The microstructural properties of the catalysts
such as specific surface area, pore volume, and pore diameter were determined by Brunauer –
Emmett – Teller (BET) technique of nitrogen adsorption-desorption experiment and mercury
porosimetry. The compositions as well as the properties of the used catalysts are presented in
Table 3.4. The size and shape of the catalyst pellets (see Figure 3.6) are important parameters
that require quantification; therefore the dimensions of the catalyst were measured using
Mitutoyo, CD-6˝ Cp calliper. The nitrogen adsorption-desorption isotherm of the catalysts are
presented in Appendix A.
Figure 3.2 Quadra-lobe catalyst sample.

Chapter 3: Materials and Method
76
Co-Mo/Al2O3 catalyst Ni-Mo/Al2O3-SiO2 catalyst
Component Value Component Value
Cobalt (II) oxide, CoO
(wt. %)
1-10 Nickel (II) oxide, NiO (wt. %) 1-10
Molybdenum (VI) oxide, MoO3
(wt. %)
10-20 Molybdenum (VI) trioxide,
MoO3 (wt. %)
10-20
Aluminium oxide (or alumina,
Al2O3) as support (wt. %)
> 50 Aluminium oxide (or alumina,
Al2O3) as support (wt. %)
20-70
Boron oxide, B2O3 (wt. %) 10-20 Silicon dioxide (or silica, SiO2)
as support (wt. %)
20-70
Aluminium orthophosphate, AlO4P
(wt. %)
< 2
Pellet dimension and BET characteristics
Diameter, (a, b) (mm) 1.5 ± 0.03,
1.3 ± 0.02
1.40 ± 0.03,
1.21 ± 0.02
Length (mm) 6 ± 3 5 ± 2
Specific surface area, (m2.g
-1)
214.1± 0.4 195.4 ± 2.1
Micropore volume, (cm3.g
-1) 0.004 0.011
Micropore area, (m2.g
-1) 12.73 22.7
External surface area, (m2.g
-1) 201.4 175.8
Pore diameter, (nm) 63.7 34
Bulk density (g.cm-3
) 1.27 1.05
Acid sites and strength
Moderate at 320 oC, (mmol
adsorbed (CH3)3CNH2/g sample)
2.86 Moderate at 280 oC, (mmol
adsorbed CH3)3CNH2/g
sample)
0.62
Strong at 500 oC, (mmol
adsorbed (CH3)3CNH2/g sample)
0.45 Strong at 480 oC, (mmol
adsorbed (CH3)3CNH2/g
sample)
0.11
The surface area and pore size of the catalysts were measured using the BET method
according to ASTM C1274 by physical adsorption. This was accomplished by performing
nitrogen adsorption and desorption on the catalysts pellets at a temperature of 77K, using a
Micromeritics Analytical Instrument ASAP® 2010, to measure an adsorption isotherm. Prior
to the analysis, the catalyst samples weighing about 1.27 g were degassed at elevated
Table 3.4 Composition and properties of used catalysts.

Chapter 3: Materials and Method
77
temperature to remove contaminants. Analysis was performed using the BET equation (3.12)
presented below, which describes the relationship between nitrogen adsorbed at a given
partial pressure and the volume adsorbed at monolayer coverage. The formation of monolayer
(i.e., a layer of adsorbed gas one molecule thick) of gas molecules on the surface of the
catalyst is used to estimate the specific surface area, while the principle of capillary
condensation of the N2 gas enables the determination of pore size, pore volume and size
distribution. However, nitrogen is commonly used as its molecular size is well established,
available in high purity, cost-effective, and inert.
(3.12)
where p is the partial pressure of N2, Po is the saturation pressure at the experimental
temperature, V volume adsorbed at P, Vm volume adsorbed at monolayer coverage, and C a
constant. A sample of BET plot and calculation for fresh Co-Mo/Al2O3 is presented in
Appendix A.
The BET surface area (SBET) was then calculated using equation (3.13):
(3.13)
where na is the Avogadro’s number (6.022 x 10²³
mol-1
), am is the cross-sectional area
occupied by each adsorbate molecule at 77 K (0.162 nm2) and mv is the gram-molecule
volume (22.414 mL).

Chapter 3: Materials and Method
78
The catalysts used in the experiments reported here was pre-sulphided ex-situ using
carbon disulphide (CS2). This was carried in two steps; firstly the fresh catalyst was contacted
with sulphur containing CS2, and dried in inert atmosphere as described by Eijsbouts et al.
(2008). Additionally, the feed oil contains sulphur that could promote activation and
sulphiding during reaction (Barman, et al., 1997).
A mercury porosimeter (AutoPoreTM
IV 9500, Micromeritics) was used to measure the
pore size and distribution, pore volume, and other porosity related characteristics of the
catalysts. The technique uses the Washburn equation (see equation 3.14) to describe the
intrusion of mercury into the catalyst pellets as a function of applied pressure. Therefore, the
pressure required to force mercury into the pores of the catalyst pellets is inversely
proportional to the size of the pores.
(3.14)
where P is differential pressure, is surface tension of mercury 485 dynes.cm-1
(or
0.480 N.m-1), is the contact angle 130
o and Dp is the pore diameter. Notably, the Washburn
equation assumes cylindrical pores.
Nevertheless, prior to the start of analysis all the penetrometers were calibrated
without sample to obtain the baseline error due to compressibility and thermal effects of
mercury and the penetrometer. The penetrometer with sample was then transferred to the high
pressure chamber, where the intrusion of mercury into the sample under controlled pressure
from 15 to 30000 psia takes place. As pressure increases during the analysis, the pore size is
calculated for each equilibrium pressure point, the volume of mercury required to fill the

Chapter 3: Materials and Method
79
pores is recovered and was used to estimate the catalyst characteristics such as pore size and
distribution, total pore volume and area, and surface area.
The temperature programmed desorption (TPD) of the fresh catalysts samples were
carried out in a Micromeritics AutoChem II 2920 analyser (Micromeritics Instrument
Corporation). This was performed to determine the number, the relative strength and
distribution of the acid sites based on the adsorption-desorption of tert-butylamine
((CH3)3CNH2). The acid sites possessed by the solid catalysts play a vital role in catalytic
cracking reactions and also provide some understanding about their catalytic activity. For the
TPD analysis about 0.158 g of the catalyst sample was loaded into a U-shaped quartz tube
which was placed in a sample port located in an enclosed furnace. Prior to the TPD, the
catalyst sample was degassed at temperature ramp of 25 to 500 oC at 10
oC.min
-1 for 60
minutes under argon flow of 50 mL.min-1
. The catalyst sample was saturated with tert-
butylamine by the flow of a mixture of gas containing tert-butylamine and helium (He). Thus,
the physically adsorbed tert-butylamine was removed by flowing helium gas at the rate of
50mL.min-1
for 30 minutes. In order to determine the strength of the acid sites, tert-
butylamine desorption was conducted at temperature range of 25-500 oC at the rate of 15
oC.min
-1 under flowing helium gas. The thermal conductivity detector (TCD) analysed the He
gas leaving from the catalyst sample. The strength of the acid sites was determined from the
area, position and shape of the peak produced by the tert-butylamine adsorbed and desorbed.
The temperature at which a given peak occurs indicates the strength of the acid site. Both
catalysts have two acid sites (see Table 3.4).

Chapter 3: Materials and Method
80
3.4.1 Oxidative Regeneration of Spent Catalyst
The spent catalyst from upgrading reaction with nitrogen atmosphere was regenerated
at high temperature using 14.4 g of the spent catalyst in a Carbolite®
furnace (Keison
Products, UK) under air atmosphere. Thereafter, reduction was performed in the CAPRI
reactor using hydrogen gas at a flow rate of 50 mL.min-1
for 45 minutes, before being retested
for catalytic activity. The oxidative regeneration furnace was programmed as follows: ramp
increase in temperature in range of 25 – 600 oC at a heating rate of 20
oC.min
-1, followed by
holding at 600 oC for a total of four hours to avoid sintering. This temperature is typical of the
regeneration temperature used in fluidised-bed catalytic cracker reactors in the petroleum
industry. At the end of the reaction, 24.5 wt.% of the carbonaceous deposits were burned-off
upon thermal oxidative regeneration. Nonetheless, oxidative-regeneration removes mostly the
asphaltene and coke deposits, whilst the metal sulphides of Mo and Co are transformed into
their oxides, which was reduced with hydrogen before reuse.
3.4.2 Preparation of Ni-based Zeolite Catalyst
It has been reported that by modifying the catalyst support it is possible to improve its
activity, stability, and selectivity as the surface properties are manipulated (Biswas, et al.,
2011). In this regard, a zeolite Ni-based catalyst was prepared by the incipient wetness
impregnation method. 12 g of Ni (NO3)2.6H2O was dissolved in 20 mL ethanol and 10 g HY-
zeolite was added. The mixture was stirred vigorously for 2 hours using a magnetic stirrer.
After impregnation, the samples were filtered and dried at room temperature overnight,
followed by calcinations at 500 oC for 4 hours in a muffle furnace. Furthermore, dry phase

Chapter 3: Materials and Method
81
mixing of 50 wt.% of Ni/HY-zeolite and 50 wt.% of commercial alumina boehmite, was
followed by peptization with 5% (v/v) acetic acid (CH3COOH). Extrusion was performed and
the extrudates were subsequently dried at 100oC for 5 hours and calcined at 500
oC for 5 hours.
The flowchart for the catalyst preparation is shown in Figure 3.7. The detailed properties and
composition of the synthesised zeolite Ni-based catalyst was determined by X-ray fluorescent
(XRF) analyser and BET analysis, respectively. Zeolite was considered because of its use in
the oil refining processes such as catalytic cracking (e.g., FCC).
Figure 3.3 Flowchart of the zeolite Ni-based on alumina catalyst synthesis.
Catalyst
Dried extrudates at 100oC (5 hours)
and calcinations at 500 oC (5 hours)
Extrusion
Peptization with acetic
acid 5 % (v/v)
Dry phase mixing
50 wt.%
Dry (overnight) and calcined at
500 oC (4 hours)
Ni/HY-zeolite
Wet impregnation of Ni
on HY-zeolite (2 hours)
Commercial boehmite
(Al2O3)

Chapter 3: Materials and Method
82
3.4.3 Analysis of Surface Morphology using SEM
The external morphology and texture of the fresh Co-Mo and Ni-Mo catalyst as well
as the spent catalysts were studied using a Philips XL 30 Scanning Electron Microscope (XL
30 ESEM-FEG) equipped with a LaB5 emission source. Energy-Dispersive X-ray
spectroscopy (EDX) was used for elemental composition analysis of the catalyst before and
after upgrading reactions. The XL 30 ESEM-FEG was used because of its ability to examine
the natural state of oily materials without preparation or modification. This technique was
useful for detecting changes affecting the catalyst morphology due to coke deposition before
and after reactions. The SEM photomicrographs was collected over a selected area of the
surface of the catalyst, which is 2 µm in width and magnification of 35000X.
3.5 Analytical Instruments
The following instruments were used to analyse the produced oils, evolved gas and
coke deposited upon the used catalyst. The extent of upgrading in the oil produced from
catalytic upgrading process relative to the feed oil was evaluated in terms on viscosity, API
gravity, true boiling distribution, asphaltenes content, sulphur and metals content before and
after reactions.
3.5.1 Density and API Gravity Measurement
The density and American Petroleum Institute (API) gravity (i.e., how heavy or light a
crude oil is compared to water) of the feed and produced oils was determined using digital
Anton Paar DMA 35 portable density meter density meter (Anton Paar GmbH, Austria) at

Chapter 3: Materials and Method
83
15°C and reported in g.cm-1
. The crude oil is introduced into the U-shaped glass tube through
the pump lever as shown in Figure (3.8). The filled U-shaped tube is agitated and the density
measurement is based on oscillating U-tube principle. A temperature sensor measures the oil
temperature right at the measuring cell. The API gravity and increment was calculated using
equations (3.15) and (3.16):
Figure 3.4 Photograph of Anton Paar digital density and API gravity meter.
131.5SG
141.5 gravity API (3.15)
Change in API gravity (o) = API of feedstock – API of produced oil (3.16)
where SG represents specific gravity.
3.5.2 Viscosity Measurement
The oil viscosity is a measure of its internal resistance to flow. Advanced rheometer
AR 1000 (TA Instruments Ltd, United Kingdom) was used to measure the viscosity of the

Chapter 3: Materials and Method
84
feed and produced oils. An aluminium plate of parallel geometry with diameter 40 mm and a
polished surface was used as shown in Figure 3.9. Firstly, the viscometry mode that measures
the viscosity of the crude oil as a function of shear stress versus shear rate was carried out to
assess the rheological behaviour of the oil with parallel plate gap size set at 150 µm.
Figure 3.5 Advanced rheometer AR 1000 (Rodger, et al., 2008).
All the analysed samples showed Newtonian fluid behaviour before and after upgrading
reactions, that is, the viscosity of the oil is constant with increasing shear rate ranging from
0.5 to 600s-1
. This therefore implies that the viscosity of the crude oil is independent of shear
rate. Subsequently, the viscosity measurements were performed using a shear rate of 100 s-1
.
All viscosity measurements were performed at 20 ± 0.1 oC. The reported data were averages
of duplicate measurements, each of which are averaged from five data points. The degree of
viscosity reduction (DVR) is calculated using equation (3.17):

Chapter 3: Materials and Method
85
DVR (%) = (µo - µ) / µo х 100 (3.17)
where; µo and µ viscosity of the THAI feed oil and produced oils (Pa.s), respectively.
3.5.3 Asphaltene Measurement
Asphaltenes are the heaviest component of the heavy crude oil generally separated by
collecting its precipitate from the diluted heavy oil with straight chain alkanes such as n-
pentane or n-heptane, as shown in Figure 3.10. The remaining portion thereafter is known as
maltene (mixture of saturates, aromatics, and resins). In this study, the asphaltene fraction was
precipitated from the corresponding THAI feed oils and produced upgraded oils using n-
heptane in accordance to the ASTM D2007-80.
Specifically, 1 g of the samples was mixed with 40 mL of n-C7H16, which was used as
a precipitant. The oil plus n-C7H16 mixture was agitated for 4 hours using a magnetic stirrer.
Feed and
upgraded oils
n-Heptane
extraction
Maltene Asphaltenes
Figure 3.6 Asphaltene precipitation from feed and produced oils using n-heptane as solvent.

Chapter 3: Materials and Method
86
Thereafter, the mixture was left for 24 hours to allow the asphaltenes precipitate and settled.
The precipitated fraction was vacuum filtered using a Whatman 1 filter paper with 11 µm
pore size and 4.25 cm diameter to separate the n-C7H16 soluble portion (i.e., maltene) from the
asphaltene portion (i.e., n-C7H16 insoluble). The filtered asphaltenes were washed with n-
C7H16 until a colourless liquid was observed from the filter. The filter paper and precipitate
were dried under an inert gas flow (N2) in the hood for 24 hours to remove any residual n-
C7H16, and then the precipitated asphaltenes was weighed. The weight percent of the
asphaltenes content was calculated as follows:
(3.18)
3.5.4 Sulphur and Metals Content
The extent of catalytic upgrading process was also evaluated in terms of impurities
removals. The sulphur and metals content of the crude oil before and after upgrading reactions
was performed by Intertek Laboratories Sunbury Technology Centre, UK, using ICP-OES
(Inductively Coupled Plasma Optical Emission Spectrometry). The results were analysed as
percentage of impurities removed through desulphurization, demetalization, and
deasphaltenization and calculated using equation 3.19:
(3.19)

Chapter 3: Materials and Method
87
where Cfeed oil and Coil produced are the amount of sulphur, metals and asphaltenes in the feed oil
and produced oils, respectively.
3.5.5 True Boiling Point (TBP) Distribution
Method ASTM-D2887 provides a comprehensive TBP distribution range of carbon
numbers of petroleum and its distillates. For this reason simulated distillation (SIMDIS) based
on an Agilent 6850N gas chromatography (GC) and calibrated in accordance with the ASTM-
D2887 was used to characterize the feed and produced oils. The Agilent 6850N GC (Agilent
Technologies, Inc., Germany) was fitted with a J&W 125-10 DB-1 10m length, 530 µm ID
and 2.65 µm film thickness capillary column. Before injection, the feed and produced oil
samples were diluted with carbon disulphide (CS2) in a ratio of 1 to 10. CS2 was chosen as the
dilution solvent due to its miscibility with crude oil, low response factor in the Flame
Ionization Detector (FID) as well as the low boiling point (BP). Thereafter, 1 µL of the blend
was taken by means of a syringe and injected into the GC; each run was performed in
duplicate. The FID was maintained at 260 oC, provided with 450 mL.min
-1 air, hydrogen flow
40mL.min-1
and nitrogen as make up gas with flow 32.3 mL.min-1
, respectively. The column
was eluted with helium at a flow 20 mL.min-1
. The analyses were performed at a programmed
column temperature of 20 oC.min
-1 from 40 to 260
oC. However, the maximum oven
temperature of the GC is 280 oC. The GC was calibrated with a hydrocarbon standard mixture
containing C5 – C40. The conversion of high-boiling-point (or high molecular weight)
fractions to lighter fractions (BP < 343 oC) was defined as the conversion of the 343
oC+
hydrocarbons (HCs) that are found in the feed oil to the produced upgraded oils. The thermal
and catalytic cracking during CAPRI can simply be expressed by equation (3.20):
heavy fractions (343 oC+) → distillable (< 343
oC) + coke + gas (3.20)

Chapter 3: Materials and Method
88
The distillables consist of light and medium oil fractions in the produced oil. Therefore, the
calculation is made by first determining the weight of the BP greater than 343oC HCs in the
feed oil and the liquid products, then using equation 3.21 to calculate the conversion (Ortiz-
Moreno, et al., 2012).
(3.21)
The above conversion equation only accounts for materials that elute the GC column.
This is the definition that is utilised throughout the thesis for conversion; this is a typical way
of measuring conversion (Ortiz-Moreno, et al., 2012). However, the maximum temperature
attainable using the previous column is 280oC, the Agilent 6850N GC was modified to the
ASTM-2887-08 method. The new column details are as follows: DB-HT 5 m length, 0.53
mm internal diameter and 0.15 µm film thickness capillary. This was fitted with a
Programmed Temperature Vaporisation (PTV) injector which rapidly heats the sample to 355
oC to vaporise the sample before been introduced into the GC. The integrated PTV injector
reduces the effect of large volume of sample that causes column and detector overload.
3.5.6 Thermogravimetric Analysis (TGA)
A thermogravimetric analyser (TGA) was used to determine the amount of coke
deposit on the spent catalysts. In this study, TGA was carried out with NETZSCH-Geratebau
GmbH, TG 209 F1 Iris®. 15-18 mg of the spent catalyst sample was recovered from the
reactor and placed on alumina crucible above the microbalance. The micro-furnace is
programmed as follows: ramp temperature in range of 25 – 1000 oC and a heating rate of 20
oC.min
-1. At 1000
oC an isothermal condition was maintained for 20 min to enable total burn-

Chapter 3: Materials and Method
89
off of the materials deposited on the spent catalysts. An air flow rate of 50 mL.min-1
was used.
The mass change of the sample in percent (wt.%) due to burn-off as the temperature rises was
registered in the TG 209 F1 Iris® which runs under Proteus
® software. The vacuum-tight
thermo-microbalance, works based on the principles of electromagnetic power compensation
as illustrated in Figure 3.11. The sample is heated by a micro-furnace enclosed by a cooling
jacket. Typically, the loss of the weight of the sample due to burn-off on heating and exposure
to air is measured by the TGA sensitive microbalance.
Figure 3.7 The working principle of the thermo-microbalance of the TGA.
The issue of corrosion and coke at high temperature led to the use of platinum crucible with
lid top. The method was then modified as follows: firstly a ramp temperature in range of 25 –
900 oC at a heating rate of 10
oC.min
-1 with the same air flow rate of 50 mL.min
-1. At 900
oC
an isothermal condition was maintained for 20 minutes to enable total burn-off of the
materials deposited on the spent catalysts.
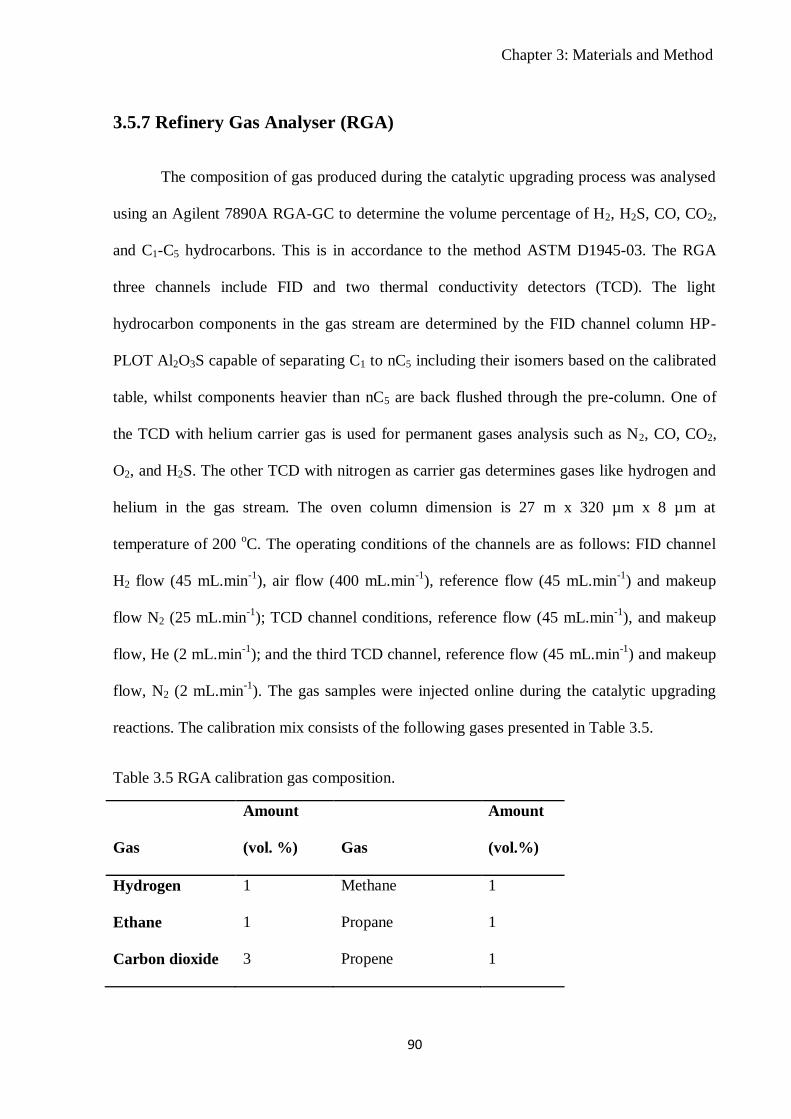
Chapter 3: Materials and Method
90
3.5.7 Refinery Gas Analyser (RGA)
The composition of gas produced during the catalytic upgrading process was analysed
using an Agilent 7890A RGA-GC to determine the volume percentage of H2, H2S, CO, CO2,
and C1-C5 hydrocarbons. This is in accordance to the method ASTM D1945-03. The RGA
three channels include FID and two thermal conductivity detectors (TCD). The light
hydrocarbon components in the gas stream are determined by the FID channel column HP-
PLOT Al2O3S capable of separating C1 to nC5 including their isomers based on the calibrated
table, whilst components heavier than nC5 are back flushed through the pre-column. One of
the TCD with helium carrier gas is used for permanent gases analysis such as N2, CO, CO2,
O2, and H2S. The other TCD with nitrogen as carrier gas determines gases like hydrogen and
helium in the gas stream. The oven column dimension is 27 m x 320 µm x 8 µm at
temperature of 200 oC. The operating conditions of the channels are as follows: FID channel
H2 flow (45 mL.min-1
), air flow (400 mL.min-1
), reference flow (45 mL.min-1
) and makeup
flow N2 (25 mL.min-1
); TCD channel conditions, reference flow (45 mL.min-1
), and makeup
flow, He (2 mL.min-1
); and the third TCD channel, reference flow (45 mL.min-1
) and makeup
flow, N2 (2 mL.min-1
). The gas samples were injected online during the catalytic upgrading
reactions. The calibration mix consists of the following gases presented in Table 3.5.
Table 3.5 RGA calibration gas composition.
Gas
Amount
(vol. %)
Gas
Amount
(vol.%)
Hydrogen 1 Methane 1
Ethane 1 Propane 1
Carbon dioxide 3 Propene 1

Chapter 3: Materials and Method
91
i-butane 1 n-butane 1
Trans-2-butene 1 1-butene 1
Cis-2-butene 1 i-pentane 1
n-pentane 1 Carbon monoxide 4
Nitrogen 1 Hydrogen sulphide 0.0005
3.6 Fine Particulate Catalyst
The Co-Mo/Al2O3 and Ni-Mo/Al2O3 catalysts pellets were crushed using a Tema
laboratory disc mill model T 750K (TEMA Machinery Ltd, UK). The size of the catalyst
particles after pulverization was measured by laser diffraction particle size analyser (Helos-
Rodos T4.1, Sympatec, Germany). The particle size distribution and BET result is presented
in Table 3.6. The mean size is approximately 2.6 ± 1.08 µm.
Table 3.6 Catalyst fine particles size distribution and surface area.
Particle size (µm) Value
< 10 62 %
10 – 30 24.3 %
> 30 13.7 %
BET surface area (m2.g
-1) 196.2
3.6.1 Experimental Procedure for Dispersed Nano-particulate Catalysts
The dispersed micro-catalyst experiments were performed in batch autoclave reactor. The
schematics diagram of the batch autoclave reactor used for the dispersed catalyst experiments
is shown in Figure 3.12.

Chapter 3: Materials and Method
92
Figure 3.8 Photograph of the batch autoclave reactor 100 mL used in dispersed catalyst
experiments.
0.4 to 2 g of micro-particulate catalyst was placed in 20 g heavy oil in the batch
autoclave reactor (100 mL). Agitation was performed by a two blade impeller. The upgrading
reaction was performed at the optimised reaction temperature 425 oC in fixed-bed reactor,
stirring speed of 133 rpm that gives the same Reynolds number as the fixed-bed; detailed
experimental conditions are presented in Table 3.7. It is generally accepted that the reaction
time starts when the heavy oil and reactants are confined in the reactor and operating
conditions have been reached. Thus, zero time was taken when the temperature inside reached
425 oC.
Reactor
Stirrer
Pressure
relief valve
Pressure gauge Motor

Chapter 3: Materials and Method
93
Table 3.7 Operating conditions for dispersed nano-catalyst experiments.
Parameter Value
Catalyst weight (g) 0.4 – 2
Catalyst-to-oil ratio (w/w) 0.03 – 0.1
Feed oil (g) 20
Stirring speed (rpm) 133 – 500
Reaction time (minutes) 10
Temperature (oC) 425
Pressure (barg) 20
The spare space of the reactor was purged with nitrogen to remove air and pressurised to 20
bar. After a reaction time of 10 minutes (to replicate the same residence time as the fixed-bed
reactor) had elapsed the heating was stopped and the reactor cooled to room temperature. The
composition of the produced gas was determined using RGA-GC. In order to evaluate the
effect of dispersed micro-catalyst, the experiment was also conducted without catalyst as
control.

Chapter 4: Effects of Reaction Conditions, Catalyst and Feedstock on upgrading
94
Chapter 4
Effects of Reaction Conditions, Catalyst and Feedstock on
Upgrading
4.1 Introduction
In any heavy oil upgrading process, the main characteristics of the produced liquid
product of interest are: the total liquid yield, the API gravity and viscosity of the produced oil,
the conversion of high boiling heavy fractions, and the removal impurities.
In this chapter therefore, the effects of reaction conditions such as temperature on
thermal cracking and catalytic CAPRI upgrading are presented in Sections 4.2 and 4.3. The
effect of Weight Hourly Space Velocity (WHSV) is presented in Section 4.4, catalyst type,
mono- vs. bi-metallic catalyst in Section 4.5 to 4.6, and feedstock on the extent of upgrading
in Section 4.7.
4.2 Thermal Cracking Effect
In this Section, the thermal cracking upgrading was evaluated using inert 3 mm glass
beads. The extent of non-catalytic reactions on API gravity, viscosity and conversion was
evaluated. The investigation was carried out in the temperature range 350-425 oC, at 20 bar
reactor pressure, 1 mL.min-1
oil flow rate, and 6 hours time-on-stream operation. The change
in API gravity, viscosity and the conversion of 343 oC+ heavy fractions of the produced oil
samples as a function of reaction temperature are presented in Table 4.2 and Table 4.2 shows
the results from catalytic upgrading counterpart at the same conditions.

Chapter 4: Effects of Reaction Conditions, Catalyst and Feedstock on upgrading
95
Table 4.1 Thermal effect on API gravity, viscosity, and conversion of heavy oil using 3 mm
glass beads as a function of temperature under nitrogen medium (feedstock: 13 oAPI,
0.49Pa.s, and 59.5 % 343 oC+).
Reaction
temperature (oC)
Change in API
gravity (o)
Viscosity
(Pa.s)
Conversion 343oC+
(%)
350 0.7 ± 0.2 0.3683 6.5
400 1.1 ± 0.18 0.2931 8.8
425 1.7 ± 0.18 0.226 16.8
Table 4. 2 Viscosity and change in API gravity of CAPRI produced oil at 350, 400 and 425
°C; Reaction Media (N2), Pressure 20 barg, Oil flow rate 1mL.min-1
, Gas flow rate 500
mL.mL-1
and Catalysts: Co-Mo, Ni-Mo and Co-Mo on top Ni-Mo.
Temperature (oC) Co-Mo/Al2O3 Ni-Mo/Al2O3 Co-Mo + Ni-Mo
Absolute viscosity (Pa.s)
350 0.282 ± 0.05 0.261 ± 0.09 0.245 ± 0.08
400 0.170 ± 0.03 0.160 ± 0.06 0.155 ± 0.06
425 0.094 ± 0.03 0.089 ± 0.04 0.151 ± 0.03
Change in API gravity of upgraded oil (o)
350 1.97 ± 0.24 1.69 ± 0.91 1.72 ± 0.66
400 2.63 ± 0.76 2.21 ± 0.86 2.21 ± 0.71
425 3.75 ± 0.93 3.73 ± 0.66 2.74 ± 0.62
As noticed in Table 4.1, thermal cracking effect causes an average of 0.7, 1.1, and 1.7o
API points increased in the produced oil at 350, 400 and 435 oC above 13
o API gravity (feed
oil). Conversely, the degrees of viscosity reduction (DVR) as the temperature increases from
350 to 400 then 425 oC are 24, 40 and 51%. Clearly, thermal cracking becomes significant as
the reaction temperature increases, promoting the splitting of heavy molecules into smaller
molecules. This is in line with the results of thermal cracking effect reported in the literature
for fixed and fluidized bed cracking of residue at similar temperatures (Kressmann, et al.,
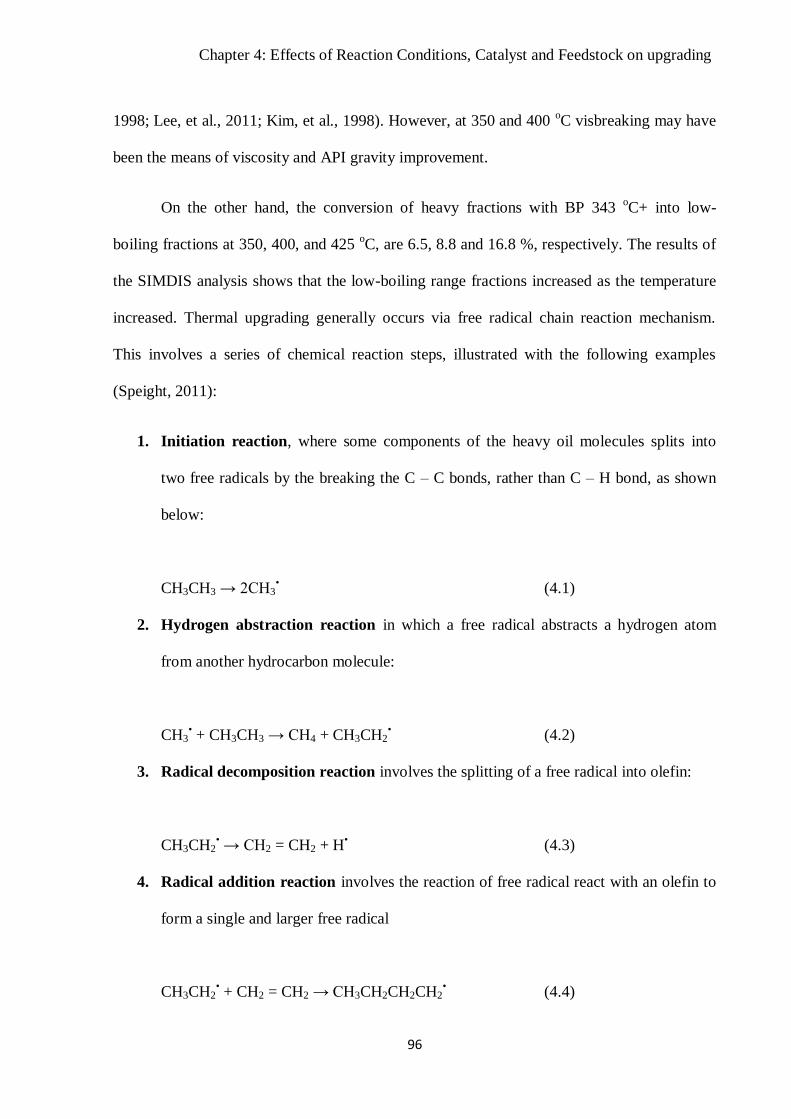
Chapter 4: Effects of Reaction Conditions, Catalyst and Feedstock on upgrading
96
1998; Lee, et al., 2011; Kim, et al., 1998). However, at 350 and 400 oC visbreaking may have
been the means of viscosity and API gravity improvement.
On the other hand, the conversion of heavy fractions with BP 343 oC+ into low-
boiling fractions at 350, 400, and 425 oC, are 6.5, 8.8 and 16.8 %, respectively. The results of
the SIMDIS analysis shows that the low-boiling range fractions increased as the temperature
increased. Thermal upgrading generally occurs via free radical chain reaction mechanism.
This involves a series of chemical reaction steps, illustrated with the following examples
(Speight, 2011):
1. Initiation reaction, where some components of the heavy oil molecules splits into
two free radicals by the breaking the C – C bonds, rather than C – H bond, as shown
below:
CH3CH3 → 2CH3• (4.1)
2. Hydrogen abstraction reaction in which a free radical abstracts a hydrogen atom
from another hydrocarbon molecule:
CH3• + CH3CH3 → CH4 + CH3CH2
• (4.2)
3. Radical decomposition reaction involves the splitting of a free radical into olefin:
CH3CH2• → CH2 = CH2 + H
• (4.3)
4. Radical addition reaction involves the reaction of free radical react with an olefin to
form a single and larger free radical
CH3CH2• + CH2 = CH2 → CH3CH2CH2CH2
• (4.4)

Chapter 4: Effects of Reaction Conditions, Catalyst and Feedstock on upgrading
97
5. Termination reaction involves the recombination reaction between two free radicals
to form a molecule and/or disproportionation reaction in which a free radical transfers
a hydrogen atom to the other to form an alkane and an olefin:
CH3• + CH3CH2
• → CH3CH2CH3 (4.5)
CH3CH2• + CH3CH2
• → CH2 = CH2 + CH3CH3 (4.6)
The smallest free radicals in the reacting system are hydrogen, methyl, and ethyl
radicals which are more stable than higher ones. These free radicals form saturated
hydrocarbon when they capture hydrogen from another hydrocarbon molecule or radical.
These cracking reactions break the higher molecular weight hydrocarbons into lower
molecular weight fractions. The rate of these reactions is a function of temperature. The
following gases where determined by the RGA which are typical products of thermal
cracking: hydrogen, methane, ethane, n-butane, n-pentane, i-pentane, trans-2-butene, ciss-2-
butene, carbon dioxide, and carbon monoxide.
4.3 CAPRI Process
In this Section, catalytic cracking upgrading is reported. The effect of temperature
upon the yield of liquid, gas and coke deposited upon the used catalyst was studied, together
with the extent of upgrading of the produced oil as measured by viscosity, API gravity and
true boiling point (TBP) distribution.

Chapter 4: Effects of Reaction Conditions, Catalyst and Feedstock on upgrading
98
4.3.1 Effect of Temperature: Thermal vs Catalytic Cracking
Thermal and catalytic cracking are routes of upgrading heavy oils driven by
temperature. However, for accurate evaluation of catalyst role and performance, CAPRI
results were compared with thermal cracking counterpart (see Section 4.2 and Table 4.1 &
4.2), at the same experimental conditions. For the thermal reactions only, average change in
API gravities at 350, 400 and 425 °C were 0.7, 1.1 and 1.7o API, respectively. This compares
less favourably with the catalytic upgrading counterpart where an average upgrading of 3.8,
2.5 and 1.7° API gravity occurred at 425, 400 and 350 °C, respectively. In the same vein, the
absolute viscosity was measured as 0.22, 0.29 and 0.37 Pa.s for thermal compared to the
catalytic runs viscosities of 0.09, 0.18 and 0.24 Pa.s at temperature 425, 400 and 350 °C,
respectively. This represented a 2.4, 1.6 and 1.5 times viscosities reduction for CAPRI
experiments compared to thermal cracking over glass beads, establishing the superiority of
incorporating catalytic upgrading with THAI.
From Table 4.2, the conversion of residue fractions (BP > 343 oC) for thermal
cracking reactions only was 16.8 % at 425 oC, whereas 36.6 and 34.6 % were obtained in
CAPRI experiments using Ni-Mo/Al2O3 and Co-Mo/Al2O3, respectively. This represents 17-
20% increase in residue fraction conversion. This observation is in conformity with that
reported in literature (Panariti, et al., 2000). Similarly, the asphaltenes content of the produced
oil using thermal cracking at 350, 400, and 425 oC were 9.9, 9.4, and 8.9 wt%, and upon
catalytic upgrading at the same conditions the conversions were 9.6, 8.6, and 6.7 wt.%,
respectively, relative to the feed oil (11.14 wt%). In all cases, the catalytic cracking effect
over Co-Mo/Al2O3 and Ni-Mo/Al2O3 catalysts outweighs thermal cracking upgrading.

Chapter 4: Effects of Reaction Conditions, Catalyst and Feedstock on upgrading
99
4.3.2 Effect of Temperature on Mass Balance
The liquid (i.e., produced oil), gas, and coke yields were calculated using equations
3.10 and 3.11 (see Chapter 3 and Section 3.3.2). Table 4.3 displays the yields, from which it
can be observed that the lower temperature favours lesser production of gases and coke and
more liquid products for both catalysts, suggesting a low degree of thermal and catalytic
upgrading. The amount of coke produced at 350 °C was 0.64 wt.% compared to 1.86 wt.% at
425 °C, and the corresponding measured liquid yields were 97.4 and 93.8 wt.% respectively,
for Co-Mo catalyst. The yield of gases was 1.96 wt.% at 350 °C and 4.34 wt.% at 425 °C.
Whilst for Ni-Mo catalyst, the amount of coke and liquid produced at 350 oC 0.7 and 97.2 wt.
%, 400 oC: 0.85 and 96.2 wt.%, and at 425
oC: 1.73 and 93.6 wt.%, respectively. The yields of
gas were 2.1 wt.% at 350 °C and 4.4 wt.% for 425 °C.
Table 4.3 Mass balances; Catalysts Co-Mo/Al2O3 and Ni-Mo/Al2O3, Reaction Media (N2),
Pressure 20 barg, Oil flow rate 1 mL.min-1
, Gas flow rate 500 mL.mL-1
.
Reaction
temperature (oC)
Gas
(wt.%)
Liquid
(wt.%)
Coke
(wt.%)
Co-Mo/Al2O3
350 1.96 97.4 0.64
400 2.96 95.87 1.17
425 4.34 93.8 1.86
Mean STDev* 0.2 1.20 0.91
Ni-Mo/Al2O3
350 2.1 97.18 0.72
400 2.77 96.2 0.85
425 3.81 93.56 1.73
Mean STDev* 0.32 0.98 0.74
*STDev is standard deviation

Chapter 4: Effects of Reaction Conditions, Catalyst and Feedstock on upgrading
100
A similar mass balance was reported by Krumm et al. (2011) and Fesharaki et al.
(2013) they found that gas, coke and liquid yields were 5.49, 0.76, and 93.75% from
upgrading using nanoporous catalyst on vacuum residue at 420 oC. The increase in yields of
gas and coke at 425 oC temperature can be attributed to increased catalytic cracking reactions
with temperature rise. Additionally, coke and gas are end products therefore expected to
increase with reaction temperature.
4.3.3 Effect of Temperature on API gravity
The API gravity of the crude oil is one of the yardsticks for assessing the amount of
distillate obtainable from the oil. In Figure 4.1 (a), (b), and (c), the API gravity of the
produced oils at different processing temperatures as a function of time-on-stream for Co-Mo,
Ni-Mo, and Co-Mo plus Ni-Mo (Co-Mo on top Ni-Mo in 3:3 w/w) catalysts are presented.
For all the three scenarios, it is clear that the API gravity of the produced oil increased as the
reaction temperature increases from 350 to 425 oC. At an experimental temperature of 425
oC,
the API gravity for the oil produced with the three catalysts runs was roughly 19 to 21 oAPI at
the early hours, which drastically fell shortly after the reaction started and reached its lowest
value of about ~3° API (above 13 oAPI for feed oil) at about 200 minutes into the experiment
and remained at a plateau of roughly 16 oAPI upgrading until the end of the experiment.

Chapter 4: Effects of Reaction Conditions, Catalyst and Feedstock on upgrading
101
(a)
(b)

Chapter 4: Effects of Reaction Conditions, Catalyst and Feedstock on upgrading
102
(c)
Figure 4.1 API gravity of CAPRI produced oil at 350, 400 and 425 °C; Reaction Media N2,
Pressure 20 barg, Oil flow rate 1 mL.min-1
, Gas flow rate 500 mL.mL-1
and Catalysts (a) Co-
Mo (b) Ni-Mo and (c) Co-Mo on top Ni-Mo.
During the first 100 minutes, significant API gravity increase in the produced oil
samples can be observed at all the three reaction temperatures and reaches a maximum value
of 6.5° (Co-Mo/Al2O3), 8o (Ni-Mo/Al2O3) and 6.3
o (Co-Mo + Ni-Mo), respectively at 425 °C.
This is because at the earlier part of the reaction, the catalyst is still fresh, active and has not
coked. At lower temperatures of 350 and 400 °C, an initial API increase in the range of 4 to
6°API can be noticed compared to the feed oil of 13 oAPI. At higher temperatures in the
plateau region the level of upgrading also seems to depend on temperature, with about 1.7°
increase at 350 °C and increasing up to ~4-5 °API upgrading at 425 °C. These trends in API
gravity values were expected as reported earlier by Shah et al. (2011) that 425 °C was the
optimum upgrading temperature for CAPRI, and further increase in temperature leads to

Chapter 4: Effects of Reaction Conditions, Catalyst and Feedstock on upgrading
103
increased coke deposition which led to reactor shut down due to coke blockages. Also, the
results are consistent with those reported by Kim et al. (1997) on upgrading of bitumen-
derived heavy oils using commercial Ni-Mo/Al2O3 catalyst and also with the work of Ovalles
and Rodriguez (2008) on upgrading of extra heavy oil down-hole under cyclic steam injection
conditions. Comparing with the mass balance in Table 4.3, it can be observed that more liquid
production occurs at lower temperature (350oC), however, the level of upgrading at this
temperature is not as significant as the previously optimized temperature of 425°C, suggesting
a trade-off between liquid production and quality. Even so, it is clear that the catalyst activity
decreased with time-on-stream, as can be observed in Figure 4.1 for all the experimental
conditions and catalysts used. Xia and Greaves (2001) reported that coking of the catalyst
with time-on-stream could reduce its activity.
The average API gravity of CAPRI produced oils at 350, 400, and 425 oC is presented
in Table 4.4. These results however, establish the fact that even at lower temperatures of
350°C the average API gravity increase of 1.97° (Co-Mo), 1.69o (Ni-Mo) and 1.72
o (Co-Mo +
Ni-Mo) shows some measurable improvement compared to thermal cracking upgrading
presented in Table 4.2 for all reaction temperatures.
Table 4.4 Average API gravity of CAPRI produced oil at 350, 400 and 425 °C; Reaction
Media (N2), Pressure 20 barg, Oil flow rate 1 mL.min-1
, Gas flow rate 500 mL.mL-1
and
Catalysts: Co-Mo, Ni-Mo and Co-Mo on top Ni-Mo (feed: 13oAPI).
Temperature (oC) Co-Mo/Al2O3 (
o) Ni-Mo/Al2O3 (
o) Co-Mo + Ni-Mo (
o)
350 14.97 ± 0.24 14.69 ± 0.91 14.72 ± 0.66
400 15.63 ± 0.76 15.21 ± 0.86 15.21 ± 0.71
425 16.75 ± 0.93 16.73 ± 0.66 15.74 ± 0.62

Chapter 4: Effects of Reaction Conditions, Catalyst and Feedstock on upgrading
104
The increase in API gravity as observed from Figure 4.1 and the averaged values
presented in Table 4.4 shows improved quality of the produced oil as Greaves et al. (2000)
noted that with a 5.9 °API increase needed only about 15% of diluent to meet pipeline
transportation specifications, compared to 30–50% required for non-upgraded bitumen
produced from SAGD and CSS operations.
4.3.4 Effect of Temperature on Viscosity
It is well known that high viscosity of heavy oils hinders their extraction and
pipelining to refineries. The viscosities of the CAPRI produced oils as a function of time-on-
stream at the reaction temperatures and for different catalysts are presented in Figure 4.2 (a),
(b) and (c), respectively. As can be seen there is a substantial viscosity reduction of the
upgraded oil samples observed compared to the feed oil, with higher viscosity reduction
noticed at 425 oC. Additionally, the viscosity reduced from 0.5 Pa.s for the feed oil to 0.11
Pa.s (350 oC), 0.085 Pa.s (400
oC) and 0.022 Pa.s (425
oC) during the early hours of the
reaction. After about 200 minutes the viscosity progressively increases with time-on-stream to
settle in the range 0.245-0.282 Pa.s (350 oC), 0.155-0.17 Pa.s (400
oC) and 0.089-0.106 Pa.s
(425 oC), respectively depending on the catalysts type. A similar trend was observed for the
change in API gravity presented in Figure 4.1, which corresponds to the mirror trend of
viscosity increase with time-on-stream as shown in Figure 4.2.
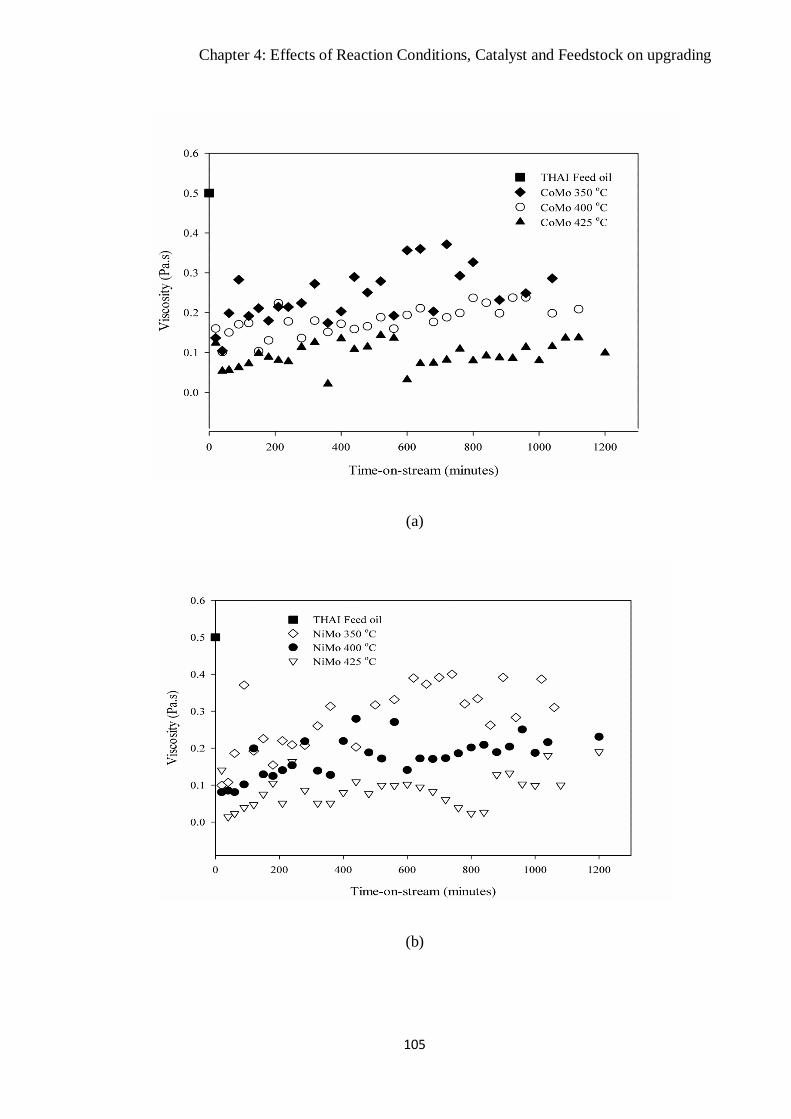
Chapter 4: Effects of Reaction Conditions, Catalyst and Feedstock on upgrading
105
(a)
(b)

Chapter 4: Effects of Reaction Conditions, Catalyst and Feedstock on upgrading
106
(c)
Figure 4.2 Viscosity of CAPRI produced oil at 350, 400 and 425 °C; Reaction Media N2,
Pressure 20 barg, Oil flow rate 1 mL.min-1
, Gas flow rate 500 mL.mL-1
and Catalysts: (a) Co-
Mo (b) Ni-Mo and (c) Co-Mo on top Ni-Mo.
The absolute viscosity and DVR for the upgraded oil samples at the different reaction
temperatures and catalyst types are presented in Table 4.5. Notably, at reaction temperatures
of 350 and 400oC, the use of Co-Mo + Ni-Mo catalyst further increased the DVR by 7.7 % (at
300 oC) and 3 % (at 400 °C) above that for Co-Mo and 3.3 and 0.9 % above that for Ni-Mo
catalysts, respectively. This is due to the synergistic effect of the Co, Ni, and Mo metals upon
the combined use of Co-Mo + Ni-Mo catalysts could be higher at 350 and 400 oC compared
to 425 oC. This DVR is capable of improving the oil fluidity, quality and production index
during the recovery as the oil viscosity is less than 0.2 Pa.s, the classical maximum viscosity
for pipeline transport (Kessick, 1982). The viscosities of the produced oil obtained for
reactions carried out at 400 and 425 oC for all three catalysts are below 0.2 Pa.s at 20
oC, the

Chapter 4: Effects of Reaction Conditions, Catalyst and Feedstock on upgrading
107
expected range of viscosity for pipeline transport of crude oil (Ancheyta, et al., 2005).
Additionally, they are lower than those reported in Table 4.1 for thermal upgrading only.
Table 4.5 Average viscosity and DVR of CAPRI produced oil at 350, 400 and 425 °C;
Reaction Media (N2), Pressure 20 barg, Oil flow rate 1mL.min-1
, Gas flow rate 500mL.mL-1
and Catalysts: Co-Mo, Ni-Mo and Co-Mo on top Ni-Mo (feed: 0.5 Pa.s).
Temperature (oC) Co-Mo/Al2O3 Ni-Mo/Al2O3 Co-Mo + Ni-Mo
Absolute viscosity (Pa.s)
350 0.282 ± 0.05 0.261 ± 0.09 0.245 ± 0.08
400 0.170 ± 0.03 0.160 ± 0.06 0.155 ± 0.06
425 0.094 ± 0.03 0.089 ± 0.04 0.151 ± 0.03
Degree of viscosity reduction, DVR (%)
350 42.3 46.7 50
400 65.3 67.4 68.3
425 88.9 81.9 78.5
Previously, the Saturates, Aromatics, Resins and Asphaltenes (SARA) analysis were
carried out and reported by Shah et al. (2011) for experiments performed in the same reactor
and under the same conditions as reported in this section. They found that saturates,
aromatics, resins and asphaltene contents were 15.38, 57.04, 20.18 and 7.4 % for the feed oil
and the values for the produced oil at 425 oC were 16.37, 67.62, 9.11 and 6.9 % respectively.
They concluded that rise in API and viscosity reduction was due mainly to the increased
amount of saturates and aromatics and the subsequent decrease in the resins and asphaltenes
contents of the produced oil from the CAPRI process. This occurs as a result of the C-C bond
cleavage in large hydrocarbons chains to lower molecular weight fractions (see Table 4.1), the
occurrence is observed in the produced gas. In the course of reaction, the paraffinic side
chains of the aromatic ring structures break while some portions of the aromatics undergo
hydrogenation and/or polymerisation and condensation reactions to form coke (Chen and Cao,

Chapter 4: Effects of Reaction Conditions, Catalyst and Feedstock on upgrading
108
1994). Notably, low viscosity oil has high API gravity; however there is no correlation
between API gravity and viscosity of the produced oil after close examination of experimental
data, because different factors influenced the viscosity and API gravity values differently
(Ancheyta, et al., 2005).
Commercial HDS catalysts are low cost catalyst (Xia, et al., 2002). Shah et al. (2011)
estimated that 20 tonnes of new HDS catalyst for 500 m horizontal producer well cost about
$60– 100k. Early estimates from Petrobank suggested that the THAI-CAPRI process costs
about one third per producing barrel of the equivalent SAGD process (Petrobank, 2010).
4.3.5 Effect of Temperature on TBP Distribution
Figure 4.3 provides the results of the TBP distribution curves of feed and produced
oils at the different reaction temperatures and catalyst type. It can be observed that as the
reaction temperature increased from 350 to 425 oC in the upgrading experiment; it favours a
significant shift in TBP curves towards lighter distillate fractions in comparison to the feed
oil. It has been demonstrated in Sections 4.3.2 and 4.3.3, that increasing upgrading
temperature from 350-425 oC increases API gravity and DVR. It is clear therefore that
upgraded oils that have high API gravity and low viscosity values present also the highest
yields of distillates.

Chapter 4: Effects of Reaction Conditions, Catalyst and Feedstock on upgrading
109
(a)
(b)

Chapter 4: Effects of Reaction Conditions, Catalyst and Feedstock on upgrading
110
(c)
Figure 4.3 Viscosity of CAPRI produced oil at 350, 400 and 425 °C; Reaction Media N2,
Pressure 20 barg, Oil flow rate 1mL.min-1
, Gas flow rate 500 mL.min-1
and Catalysts: (a) Co-
Mo at different temperatures (b) Ni-Mo at different temperatures and (c) different catalysts at
the optimum temperature of 425 oC TBP curves.
For example in the TBP distribution curves for the use of Co-Mo/Al2O3 (Figure 4.3a),
at the boiling point of 200 oC the cumulative percentage yields for reaction temperatures 350,
400, and 425 oC were 15, 22 and 23 %, respectively, relative to the feed oil (10 %). On the
contrary, it can be seen in Figure 4.3 (a) that 10 % yield of distillate at 200 oC for the feed oil
is obtained at lower temperatures for the produced upgraded oils depending on the reaction
temperature, which explains the shift of curves to the left. This result is consistent with the
literature (Fumoto, et al., 2009). They found that the yield of lighter distillates increased with
reaction temperature on the cracking heavy oil using zirconia-alumina-iron oxide catalyst in a
steam environment. Additionally, the increased yield of light distillates with reaction
temperature is in line with the increased API gravity and reduced viscosity of the produced oil

Chapter 4: Effects of Reaction Conditions, Catalyst and Feedstock on upgrading
111
relative to the feed oil presented in Figures 4.1 and 4.2. From Figure 4.3c, it is clear that Co-
Mo/Al2O3 catalyst produced higher amount of low-boiling fractions than Ni-Mo/Al2O3 and
Co-Mo + Ni-Mo catalysts at 425 oC. Consequently, the conversion of residue fraction (BP >
343 oC) was calculated and presented in Table 4.6.
Table 4.6 Conversion of 343 oC+ HCs at temperatures 350, 400, and 425
oC, pressure 20barg,
N2 reaction media, nitrogen-to-oil flow ratio 500 mL.mL-1
, oil flow rate 1 mL.min-1
and
Catalysts Co-Mo and Ni-Mo.
Catalyst Experimental
temperature (oC)
Conversion of 343oC+
(%)
Co-Mo 350 16.8
Co-Mo 400 28.7
Co-Mo 425 34.6
Ni-Mo 350 26.2
Ni-Mo 400 22.2
Ni-Mo 425 36.6
As the temperature increased from 350 to 425 oC the conversion of the heavy end
fractions into lighter distillates increased with the highest conversion obtained at 425 oC. As
expected the increase in the yield of distillates with boiling point less than 343 oC drastically
lowers the viscosity of the produced oil (Ancheyta, et al., 2005). Evidence from Figures 4.1
and 4.2 and Table 4.6 showed that improved oil quality was obtained at 425 oC, however the
magnitude of coke produced at 425 oC can not be ignored (see Table 4.3), as coke is known to
drastically deactivate the catalyst and plug the bed.
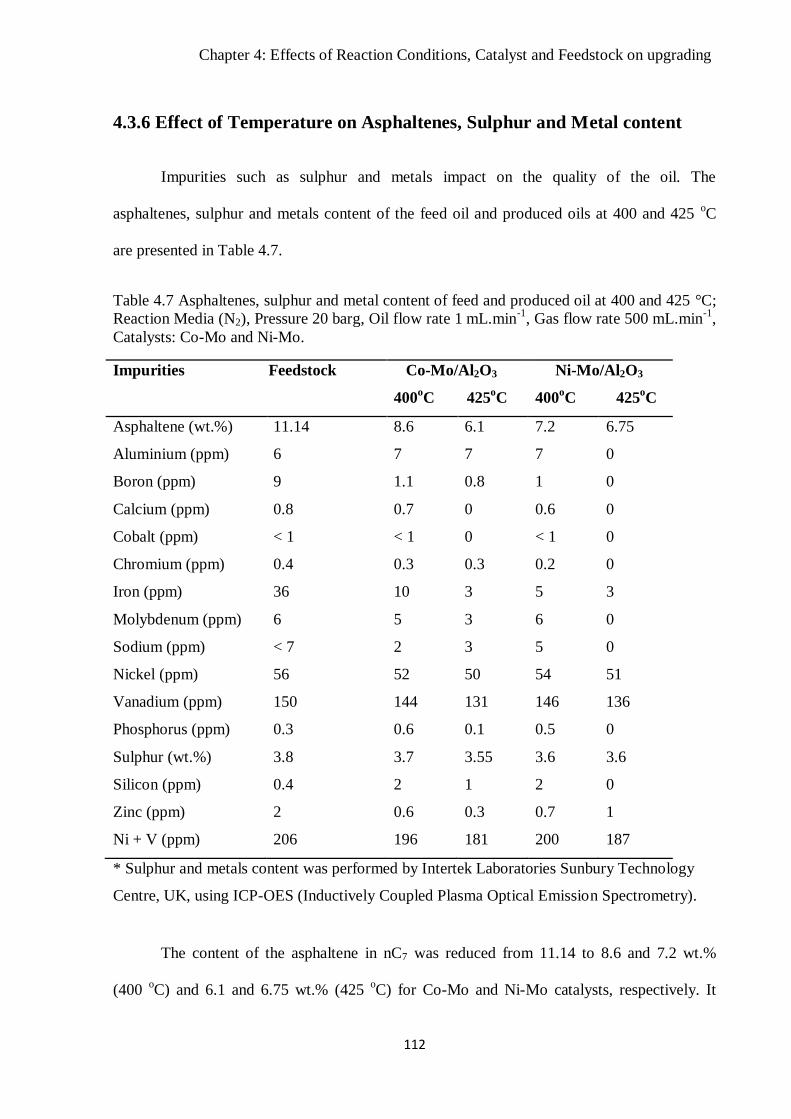
Chapter 4: Effects of Reaction Conditions, Catalyst and Feedstock on upgrading
112
4.3.6 Effect of Temperature on Asphaltenes, Sulphur and Metal content
Impurities such as sulphur and metals impact on the quality of the oil. The
asphaltenes, sulphur and metals content of the feed oil and produced oils at 400 and 425 oC
are presented in Table 4.7.
Table 4.7 Asphaltenes, sulphur and metal content of feed and produced oil at 400 and 425 °C;
Reaction Media (N2), Pressure 20 barg, Oil flow rate 1 mL.min-1
, Gas flow rate 500 mL.min-1
,
Catalysts: Co-Mo and Ni-Mo.
Impurities Feedstock Co-Mo/Al2O3
400oC 425
oC
Ni-Mo/Al2O3
400oC 425
oC
Asphaltene (wt.%) 11.14 8.6 6.1 7.2 6.75
Aluminium (ppm) 6 7 7 7 0
Boron (ppm) 9 1.1 0.8 1 0
Calcium (ppm) 0.8 0.7 0 0.6 0
Cobalt (ppm) < 1 < 1 0 < 1 0
Chromium (ppm) 0.4 0.3 0.3 0.2 0
Iron (ppm) 36 10 3 5 3
Molybdenum (ppm) 6 5 3 6 0
Sodium (ppm) < 7 2 3 5 0
Nickel (ppm) 56 52 50 54 51
Vanadium (ppm) 150 144 131 146 136
Phosphorus (ppm) 0.3 0.6 0.1 0.5 0
Sulphur (wt.%) 3.8 3.7 3.55 3.6 3.6
Silicon (ppm) 0.4 2 1 2 0
Zinc (ppm) 2 0.6 0.3 0.7 1
Ni + V (ppm) 206 196 181 200 187
* Sulphur and metals content was performed by Intertek Laboratories Sunbury Technology
Centre, UK, using ICP-OES (Inductively Coupled Plasma Optical Emission Spectrometry).
The content of the asphaltene in nC7 was reduced from 11.14 to 8.6 and 7.2 wt.%
(400 oC) and 6.1 and 6.75 wt.% (425
oC) for Co-Mo and Ni-Mo catalysts, respectively. It

Chapter 4: Effects of Reaction Conditions, Catalyst and Feedstock on upgrading
113
shows that the cracking of asphaltenes increases as the reaction temperature increases.
Notably, the decomposition of the asphaltene content of the feed oil as temperature increases
was accompanied by the drop in viscosity, rise in API gravity and lower-boiling components
in upgraded oil samples (see Figures 4.1, 4.2 and 4.3).
In the same reaction, sulphur content was reduced from 3.8 to 3.55 and 3.6 wt.% at
425 oC for Co-Mo and Ni-Mo catalysts. More so, the metal content of the produced oils was
significantly lower than that of the feed oil mainly at 425 oC reported optimum by Shah et al.
(2011). At 400 oC the nickel plus vanadium (Ni + V) content reduced from 206 to 196 and
200 ppm, while at 425 oC it was 181 and 187 ppm for Co-Mo and Ni-Mo catalysts,
respectively. This indicates that Ni + V contents were further reduced by 7.24 and 6.31% for
both catalysts as the temperature increased from 400 to 425 oC. It is therefore clear that the
rate of desulphurisation and demetallisation reaction increased with temperature (Shah, et al.,
2011; Ancheyta, et al., 2002). Under the conditions used in this study, the two catalysts
showed different performance on sulphur and metal removal with Co-Mo being better for
demetallisation and Ni-Mo better for the desulphurisation reaction (see Table 4.7).
4.3.7 Effect of Temperature on Produced Gas Composition
Table 4.8 provides quantitative composition of the produced gas during the
experiments. The reported values are average of duplicate experimental runs. The presence of
hydrogen in the gas indicates its in situ production during CAPRI. Its concentration increased
from 2.57 to 2.70 vol.% with Co-Mo and 1.6 to 3.9% with Ni-Mo catalysts as the
temperature increased from 400 to 425 oC. It is known that hydrogen is majorly produced by
thermal cracking and dehydrogenation reactions either by hydrogen-abstraction from

Chapter 4: Effects of Reaction Conditions, Catalyst and Feedstock on upgrading
114
saturated hydrocarbon to form unsaturated compounds or the cleavage of carbon-hydrogen
bond.
Co-Mo Ni-Mo Glass bead
Gas (vol.%) 400oC 425
oC 400
oC 425
oC 425
oC
Hydrogen 2.574 2.701 1.588 3.900 1.590
Methane 0.146 0.071 0.074 0.092 0.190
Ethane 0.279 0.277 0.150 0.405 0.120
Propane 0.124 0.131 0.104 0.182 0.610
Carbon dioxide 0.034 0.048 0.022 0.043 0.321
Propene 0.073 0.078 0.061 0.076 0.000
i-Butane 0.000 0.000 0.000 0.032 0.000
n-Butane 0.064 0.072 0.034 0.082 0.080
trans-2-Butane 0.038 0.033 0.014 0.037 0.040
1-Butene 0.033 0.048 0.020 0.032 0.000
Cis-2-Butene 0.036 0.000 0.000 0.000 0.070
i-Pentane 0.042 0.027 0.000 0.034 0.020
n-Pentane 0.000 0.047 0.000 0.055 0.020
Carbon monoxide 0.034 0.035 0.014 0.038 0.096
Hydrogen sulphide 0.0002 0.0004 0.00042 0.0042 0.0001
The dehydrogenation index (DHI), which is defined as the volume ratio of H2 to the
sum of C1 and C2 yields {H2 / (C1+C2)} in gas can be used to measure the degree of
dehydrogenation reaction that leads to coke formation (Wang, et al., 2012; Zhang, et al.,
Table 4.8 Average off-gas composition during CAPRI reaction at 400 and 425 °C; Reaction
Media (N2), Pressure 20 barg, Oil flow rate 1mL.min-1
, Gas flow rate 500mL.min-1
, Catalysts:
Co-Mo, Ni-Mo and Glass beads.

Chapter 4: Effects of Reaction Conditions, Catalyst and Feedstock on upgrading
115
2013). In this regard, high DHI represents more H2 in the gas phase with more carbon-
rejection from the feedstock to balance H/C atomic ratio in all products (i.e., gas, light oil, and
coke). Therefore, as the reaction temperature increases from 400 to 425 oC the DHI increased
from 6.1 to 7.8 (Co-Mo) catalyst and 7.1 to 7.9 (Ni-Mo), respectively. This increase in DHI
values favours dehydrogenation and coke formation which causes catalyst deactivation
(Wang, et al., 2012; Section 4.3.2, Table 4.3).
In line with Table 4.3, the overall amount of gas also rises with temperature in the
catalytic runs. The level of CO and CO2 were roughly identical in the two catalytic runs,
whereas in the experiment conducted with glass beads the percentage of CO and CO2 were
2.5 and 6.6 times that produced in the use of Co-Mo/Ni-Mo catalyst at 425 oC. The high
concentrations of olefins in the off-gas are considered as a sign of effectual cracking
reactions. Clearly, thermal cracking over glass beads produces more of certain gas
components such as methane, propane, n-butane, trans-2-butane and cis-2-butene and n-
pentane compared with catalytic cracking, however, some other components such as propene,
i-butane and 1-butene were not produced over glass beads that were present over the catalyst.
For both catalysts when the reaction temperature increased from 400 to 425 oC, the yield of
hydrogen, light olefins and paraffin gases increased. This is because temperature rise makes
the cracking reactions propagate faster (Fesharaki, et al., 2013). These trends are in
conformity with trends reported elsewhere, where upgrading has largely been attributed to
simultaneous thermal and catalytic cracking effects (Krumm, et al., 2011; Hashemi, et al.,
2013).
The production of hydrogen during the catalytic upgrading process is vital to support
hydroconversion in-situ. Hydrogen, methyl and ethyl are the smallest radicals in the reaction
medium. Their presence therefore would help cap radicals of macromolecules that readily

Chapter 4: Effects of Reaction Conditions, Catalyst and Feedstock on upgrading
116
recombined to larger molecules and coke. They are rich in hydrogen, their abstraction from
hydrocarbon molecules of the heavy oil leads to the formation carbon-rich material coke. In
Figure 4.4 (a), (b), and (c) the plots of the amount of hydrogen, methane and ethane in the gas
stream with time-on-stream are presented.
(a)
(b)
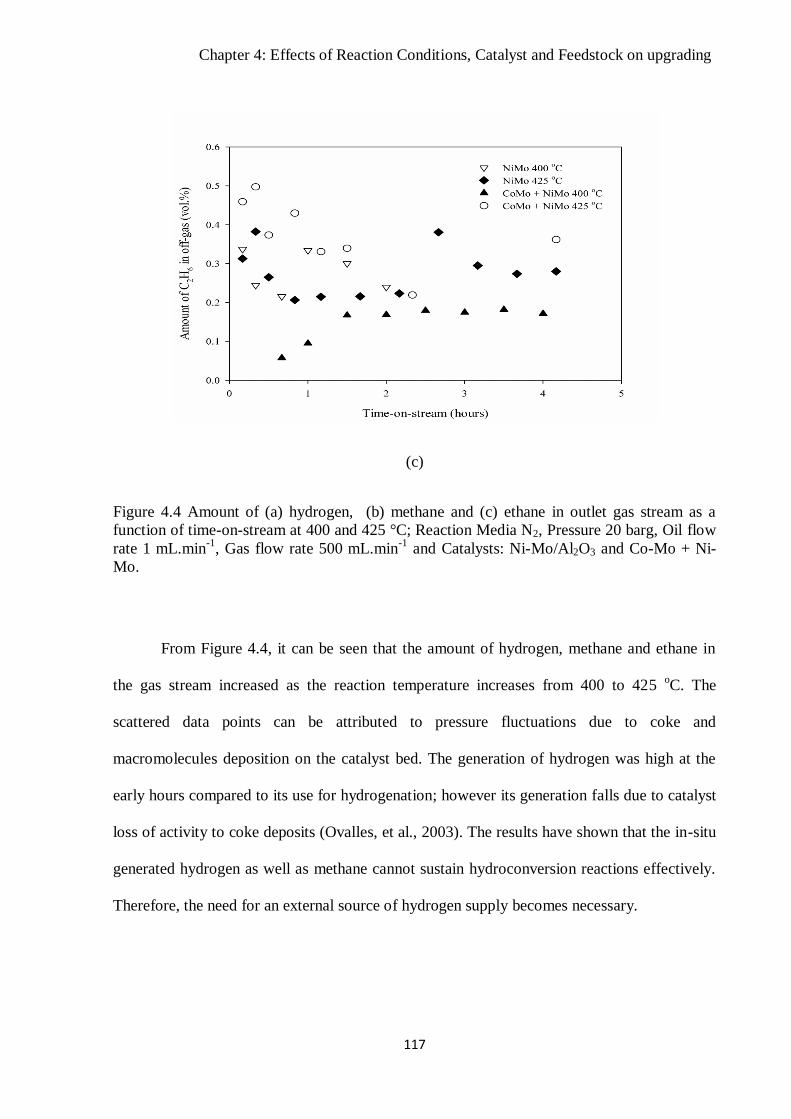
Chapter 4: Effects of Reaction Conditions, Catalyst and Feedstock on upgrading
117
(c)
Figure 4.4 Amount of (a) hydrogen, (b) methane and (c) ethane in outlet gas stream as a
function of time-on-stream at 400 and 425 °C; Reaction Media N2, Pressure 20 barg, Oil flow
rate 1 mL.min-1
, Gas flow rate 500 mL.min-1
and Catalysts: Ni-Mo/Al2O3 and Co-Mo + Ni-
Mo.
From Figure 4.4, it can be seen that the amount of hydrogen, methane and ethane in
the gas stream increased as the reaction temperature increases from 400 to 425 oC. The
scattered data points can be attributed to pressure fluctuations due to coke and
macromolecules deposition on the catalyst bed. The generation of hydrogen was high at the
early hours compared to its use for hydrogenation; however its generation falls due to catalyst
loss of activity to coke deposits (Ovalles, et al., 2003). The results have shown that the in-situ
generated hydrogen as well as methane cannot sustain hydroconversion reactions effectively.
Therefore, the need for an external source of hydrogen supply becomes necessary.

Chapter 4: Effects of Reaction Conditions, Catalyst and Feedstock on upgrading
118
4.4 Effect of WHSV
In the Section above, the reported upgrading at 425 oC gave a better result in terms of
increase in API gravity, viscosity reduction, conversion, and reduction of sulphur and metals
content. In this section, the experiments were performed at constant reaction temperature
425oC, pressure 20 barg, gas-to-oil ratio 500 mL.mL
-1, oil flow rate 1mLmin
-1 and the effect
of WHSV was investigated in the range of 9 to 21.8 h-1
by changing the weight of the catalyst
used for six hours time-on-stream operation. The catalyst bed characteristics for the different
WHSVs are presented in Table 4.9.
Table 4.9 Catalyst bed characteristics at oil flow 1 mL.min-1 and different WHSV.
Catalyst
weight (g)
Catalyst bed
height (cm)
Oil residence time in
the catalyst bed (min)
WHSV
(h-1
)
2.5 5.2 1.84 21.8
4.0 8.1 2.86 13.6
6.0 11.6 4.10 9.1
4.4.1 Effect of WHSV on API gravity, viscosity, asphaltenes, and conversion
In Table 4.10 the average value of API gravity, asphaltenes content, absolute
viscosity, and the conversion of 343 oC+ HCs for the produced oil after six hours time-on-
stream operation as a function of WHSV is presented. It is clear that as WHSV decreases the
produced oil API gravity increased from 16 to 18.4 oAPI and the viscosity reduced
significantly from 0.1 to 0.72 Pa.s which is better than the original feed oil (13 oAPI and
0.5Pa.s). This occurs in view of the fact that the WHSV is inversely proportional to the
residence time of the oil in the catalyst bed. Because the catalyst bed height decreased with
increasing WHSV (see Table 4.9).

Chapter 4: Effects of Reaction Conditions, Catalyst and Feedstock on upgrading
119
Table 4.10 Effect of WHSV on the API gravity, viscosity, Asphaltenes content, and
conversion of 343 oC+ HCs at 425
oC reaction temperature, 20 barg pressure, nitrogen-to-oil
ratio 500 mL.mL-1
, and oil flow rate 1 mL.min-1
(Mean values for 6 hours time-on-stream
operations).
Catalyst
WHSV
(h-1
)
API gravity
(o)
Viscosity
(Pa.s)
Conversion
343oC+ (%)
Asphaltenes
(wt.%)
Co-Mo 21.8 15.7 0.0998 24.9 8.2
Co-Mo 13.6 16.8 0.0993 37.7 6.1
Co-Mo 9.1 18.4 0.0728 45.1 5.5
Ni-Mo 21.8 16.1 0.0976 22 7.7
Ni-Mo 13.6 17.5 0.0843 28.6 6.4
Ni-Mo 9.1 18.2 0.0731 36 6.75
The WHSV is inversely proportional to the contact time between the feed oil and the
catalyst-bed, and is defined as weight per hour of feed oil divided by the weight of catalyst
(Gao, et al., 2012). At higher WHSV the residence time is lower and hence the contact time
of the oil with the catalyst bed is less. Conversely, as the contact time increased at low
WHSV, cracking reactions would have increased giving rise to a higher yield of lighter
hydrocarbon components. This can be seen in the next section on simulated distillation
characteristics of the produced oil at the different WHSV. This finding however is in
agreement with the results reported by Abuhesa and Hughes (2009); they found 7-9o API
points’ increase in oil produced by catalytic in situ combustion of middle Clair crude oil of
19.8o API when the amount of catalyst was increased from 1 to 5 g.
On the other hand, the produced oil viscosity was 0.0728 Pa.s (9.1 h-1
), and 0.098 Pa.s
(21.8 h-1
) relative to the feed oil (0.49 Pa.s). This represents a DVR of 79 % (21 .8 h-1
) and
85% at 9.1 h-1
, respectively. This showed that the lower WHSV of 9.1 h-1
gave the highest
percentage reduction in viscosity of the produced oil through catalytic upgrading process.
However, high WHSV (i.e., short contact time) may have altered the extent of cracking
Chapter 4: Effects of Reaction Conditions, Catalyst and Feedstock on upgrading
120
reactions leading to lower yield of light ends hydrocarbons in the oil produced (Wang, et al.,
2009). Whilst, longer contact time gives the heavy oil adequate time to be cracked into
lighter components.
Furthermore, the asphaltene content reduced from 11.14 wt.% (feed oil) to 8.2 and
7.7wt.% (21.8h-1
) and 5.5 and 6.7 wt.% (9.1h-1
) in the produced oil using Co-Mo and Ni-Mo
catalysts, respectively. The catalytic conversion of asphaltenes into light hydrocarbons, gas,
and coke increased as the WHSV decreased, due to increased contact time between the oil and
catalyst as result of increased bed height. Hence, the extent of catalytic conversion in the
CAPRI process can be correlated with the contact time between the catalyst active surface and
the oil (Kim, et al., 1998). The effect of WHSV at the optimum reaction temperature 425 oC
was noticeable for both Co-Mo and Ni-Mo catalysts types. From Table 4.10, the conversion
of 343 oC+ HC fractions increases from 25 to 45 % (Co-Mo) and 22 to 36 % (Ni-Mo) catalyst
when the WHSV decreased from 21.8 to 9.1 h-1
at constant 425 oC temperature. This
represents a decrease by roughly 7 % for both catalysts. This demonstrates that the
conversions of 343 oC+ fraction were limited at high WHSV due to limited acid sites of the
catalyst responsible for cracking reactions. The opportunity of components in the feed oil to
contact with acid sites increase as the WHSV decreases (i.e., amount of catalyst in the bed
increase). Therefore, with sufficient acid sites (or catalysts) most components in the oil
undergo sufficient cracking and conversion before they leave the catalytic bed (Li, et al.,
2013).
4.4.2 Effect of WHSV on TBP distribution
The TBP distribution curve of the produced oil as a function of the WHSV is
presented in Figure 4.5. It is clear that the yield of distillate of 40 vol.% in the TBP curves

Chapter 4: Effects of Reaction Conditions, Catalyst and Feedstock on upgrading
121
corresponds to the shift to the left along the boiling temperature axis as the WHSV decreased.
This indicates that the content of high carbon number hydrocarbons has been decreased while
light hydrocarbons are increased in the produced oil (Junaid, et al., 2012).
Figure 4.5TBP distribution curves of feedstock and produced oil as a function of WHSV at
temperature 425 oC, pressure 20 barg, nitrogen-to-oil ratio 500 mL.mL
-1 and Catalyst: Co-Mo
and Ni-Mo.
The increase in conversion with decreasing WHSV was responsible for the shift of the
TBP distribution curves of the upgraded oils to the left of the boiling temperature axis with
reference to the feedstock curve. This means that high boiling (or high molecular weight)
components in the feedstock have been converted into lighter ones. As expected, the increased
API gravity and decreased viscosity of the produced oils confirmed the notion as WHSV
decreased. Conclusively, the highest yield of the distillable fractions (i.e., fractions with

Chapter 4: Effects of Reaction Conditions, Catalyst and Feedstock on upgrading
122
boiling temperature less than 343 oC) was accomplished at the highest reaction temperature of
425 oC and lowest WHSV of 9.1 hr
-1.
4.4.3 Effect of Catalyst Type
Alumina (Al2O3) supported molybdenum oxide catalysts promoted with nickel, cobalt,
or tungsten are mostly used in the refinery for hydrodesulphurisation (HDS). In this study,
Co-Mo/Al2O3 and Ni-Mo/Al2O3 was used to experimentally investigate the CAPRI
conversion of heavy oil into light oil. Both catalysts have the same shape, and similar pellet
length and diameter. However, Co-Mo catalyst has larger surface area and bigger pore
diameter compared to that of the Ni-Mo catalyst (214.1 vs. 195.4 m2g
-1; 63.7 vs. 33.7 nm).
The performance of both catalysts was evaluated based on changes in API gravity, viscosity,
asphaltenes content, metal and sulphur removal, and the conversion of boiling-fractions
higher than 343 oC into low-boiling fractions.
In this study, the Co-Mo catalyst shows considerably higher conversion of 343 oC+
hydrocarbons into low-boiling fractions 25-45 % against 22-36 % for Ni-Mo catalyst
depending on the WHSV. Though at the optimum temperature and WHSV there is no
difference in the average API gravity and absolute viscosity of the produced oil (Co-Mo:
0.073 Pa.s, 18.4o
API and Ni-Mo: 0.073 Pa.s, 18.2o
API), compared to the original feed oil
(0.5 Pa.s and 13o
API), nonetheless from Figure 4.5 the upgraded oil with Co-Mo/Al2O3
catalyst has a higher percentage of low-boiling fractions than the upgraded oil with Ni-
Mo/Al2O3 catalyst. However, for the conversion of asphaltenes, Co-Mo catalyst reduced the
asphaltene content of the feed oil from 11.14 to 5.5 wt.% compared to 6.75 wt.% (Ni-Mo)
catalyst. This indicates that Co-Mo performed better than Ni-Mo, because of its large surface
area and pore size provides easy access to the active site for macromolecules such as resins

Chapter 4: Effects of Reaction Conditions, Catalyst and Feedstock on upgrading
123
and asphaltenes in the feed oil while the high acid strength enhanced the cracking activity for
them to be converted into low molecular weight fractions compared to small pore and
moderate acid sites Ni-Mo catalyst (Stanislaus, et al., 1996; Mouli et al., 2011; Boahene et al.,
2011). In section 4.3.5, it is clear that while Ni-Mo performed better in desulphurisation
reactions, however Co-Mo catalyst was better for demetallisation reactions.
4.5 Effect of Mono- Vs. Bi-metallic Catalysts
The metal sites of the catalyst promote hydrogen-dehydrogenation function and the
acidic sites of the support perform cracking reactions. The performance of bimetallic Ni-
Mo/Al2O3 was compared with mono-metallic Ni/Al2O3 counterpart.
4.5.1 Effect of Mono- and Bi-metallic Catalyst on API gravity and Viscosity
In Figure 4.6 (a) and (b), the API gravity and the viscosity of the produced oil using
Ni-Mo/Al2O3 and Ni/Al2O3 as a function of time-on-stream is presented. It is clear that the
bimetallic Ni-Mo catalyst performed better with a mean API gravity increase of 2.9 ± 1.5oAPI
compared to Ni based catalyst with 1.5 ± 1.2 oAPI, which indicate additional 1.4
o points API
gravity increase using bimetallic Ni-Mo catalyst. At the same time, the DVR is 86.9 % for Ni-
Mo/Al2O3 bimetallic against 78.8 % for Ni/Al2O3 monometallic catalyst below the viscosity
of the feed oil (i.e., 1.091 Pa.s). As expected, the Ni-Mo bimetallic catalyst produced oil
showed 1.4 oAPI further increments in API gravity and 8.1 % additional viscosity reduction to
that obtained when Ni monometallic catalyst was used. Additionally, the asphaltene contents
were respectively 6.8 wt.% (Ni-Mo/Al2O3) and 8.2 wt.% (Ni/Al2O3) catalysts against the feed
oil (10.3 wt.%). Shah et al. (2011) pointed out that the rise in API and decrease in viscosity
was due largely to hydroconversion in addition to cracking reactions by the acid sites.

Chapter 4: Effects of Reaction Conditions, Catalyst and Feedstock on upgrading
124
(a)
(b)
Figure 4.6 Effect of mono and bimetallic catalysts on produced oil (a) API gravity and (b)
viscosity at temperature 425 oC, pressure 20 barg, nitrogen-to-oil ratio 500 mL.mL
-1 and
Catalysts: Ni-Mo/Al2O3 and Ni/Al2O3.

Chapter 4: Effects of Reaction Conditions, Catalyst and Feedstock on upgrading
125
Therefore, bimetallic catalyst promotes hydrogen uptake by free radicals to facilitate
hydrogenation reactions than their monometallic counterpart. It has also been reported that the
presence of molybdenum in the catalyst gives it intrinsic activity for hydrodesulphurisation
(HDS) reactions (Vishwakarma, et al., 2007). Shah et al. (2011) concluded that the rise in API
and viscosity was due largely to hydroconversion in addition to HDS, HDM or HDA activity.
To confirm this, the produced hydrogen gas for the use of Ni-Mo/alumina and Ni/alumina
catalysts was measured. It was found that the mean produced hydrogen gas for Ni-
Mo/alumina is 1.88 ± 0.37 compared to 1.21 ± 0.78 vol.% for Ni/alumina.
This superiority of bimetallic Ni-Mo/Al2O3 catalyst over monometallic Ni/Al2O3 is the
result of the synergistic effect of the Mo metal which enhanced the catalyst activity (Jeon, et
al., 2011). This synergistic effect is sustained as far as the two metals in the bimetallic catalyst
remain chemically bound without decomposing to individual metals. In addition, Panariti et
al. (200a, b) found that Mo metal is more active and activate faster than Ni metal, which
explained the high performance of Ni-Mo over Ni based catalyst.
4.6 Commercial Vs. Prepared Zeolite-based Catalyst
The compositions of the commercial HDT catalysts previously used are Co, Ni, and
Mo supported on alumina. The cracking activity, stability, and selectivity can be manipulated
by modifying the support (Biswas, et al., 2011). In this Section, the results of the test carried
out with prepared Ni/Zeolite-Alumina compared with that of commercial Ni-Mo/Al2O3 and
Ni/Al2O3 all cylindrically shaped are presented and discussed. Properties of the prepared
Ni/Zeolite-Alumina catalyst are presented in Appendix A.

Chapter 4: Effects of Reaction Conditions, Catalyst and Feedstock on upgrading
126
4.6.1 Effect on API Gravity and Viscosity
The produced oil API gravity and viscosity as a function of time-on-stream using the
prepared Ni/Zeolite-Alumina, commercial Ni-Mo/Al2O3 and Ni/Al2O3 at the same conditions
of temperature, pressure, and N2/oil flow ratio is presented in Figures 4.7 (a) and (b),
respectively. The results showed that in all cases the produced oil API gravity in Figure 4.9a
is at least roughly 1o above that of the feed oil (14
oAPI). Clearly, the API gravity of the
produced oil samples with commercial Ni-Mo/Al2O3 was higher than those of prepared
Ni/Zeolite-Alumina and Ni/Al2O3 catalysts. Consequently, the API gravity of the produced oil
samples with prepared Ni/Zeolite-Alumina was significantly higher than that of commercial
Ni/Al2O3.
When prepared Ni/Zeolite-Alumina was used a maximum API gravity of 5.7o was
achieved before dropping to 1.3o in 200 minutes and thereafter settles at an average of 2.4 ±
1.2o API. However, the average upon the use of commercial Ni-Mo/Al2O3 and Ni/Al2O3 were
3.2 ± 1.2 and 1.4 ± 1.1o API, respectively. The rapid decrease in API gravity can be attributed
to the loss of catalytic activity due to early coke deposition on the catalyst. Also, the basic
nitrogen compounds present in the feed oil could have also contributed to acid sites
deactivation via neutralisation of the alumina support and the zeolite during cracking
reactions (Bej, et al., 2001).

Chapter 4: Effects of Reaction Conditions, Catalyst and Feedstock on upgrading
127
(a)
(b)
Figure 4.7 (a) API gravity and (b) viscosity of Produced oils as a function of time-on-stream
using prepared Ni/zeolite-alumina, commercial Ni-Mo/Al2O3 and Ni/Al2O3 catalysts, reaction
temperature 425 oC, pressure 20 barg, and N2/oil ratio 500 mL.mL
-1.

Chapter 4: Effects of Reaction Conditions, Catalyst and Feedstock on upgrading
128
From Figure 4.7b, the viscosities of the produced oil samples with commercial HDT
Ni-Mo/Al2O3 catalyst are lower than that obtained with the prepared Ni/Zeolite-Alumina
catalyst. The viscosity of the produced oil samples with the prepared Ni/Zeolite-Alumina
catalyst increases from 0.03 to 0.15 Pa.s at 200 minutes and thereafter it settles at an average
of 0.148 ± 0.06 Pa.s with time-on-stream. This represents 86.5 % reduction of 1.091 Pa.s
(feedstock) after catalytic upgrading with Ni/Zeolite-Alumina. On the other hand, commercial
Ni-Mo/Al2O3 and Ni/Al2O3 respectively gave 90.2 and 78.8 % viscosity reduction. The
superiority of commercial Ni-Mo/Al2O3 over prepared Ni/Zeolite-Alumina catalyst is because
of its larger pores, bimetallic, in addition to the active phase Ni – Mo – S that possesses high
hydrocracking activities (Vishwakarma, et al., 2007). Eventually, the nitrogen adsorption-
desorption isotherm revealed that the prepared Ni/Zeolite-Alumina catalyst had smaller pore
sizes compared to the commercial catalysts, which limits the diffusion of macromolecules and
their cracking activity. Instead, the macromolecules adsorbs on the zeolite-based catalyst
surface, thereby limiting effective cracking of large and complex molecules (Stoyanov, et al.,
2008). However, the cracking performance of the prepared zeolite-based catalyst over
commercial Ni/Al2O3 catalyst can be attributed to the molecular sieve structure of the zeolite
and their crystalline aluminosilicates nature which enhanced their cracking functions, because
the Si-O-Al framework within the zeolite pore channels optimise the acid strength and
distribution within the catalyst (Zhicheng, et al., 2012).
4.7 Effect of Feedstock
The extent of catalytic upgrading could differ depending on the feedstock properties
and the location of the oil. Two heavy oil feedstocks were investigated; Feed-A (13 oAPI and

Chapter 4: Effects of Reaction Conditions, Catalyst and Feedstock on upgrading
129
0.49 Pa.s) and Feed-B (14 oAPI and 1.091 Pa.s). However, detailed properties of both
feedstocks have been reported in Table 3.1 of Chapter 3.
4.7.1 Effect of Feedstock on API Gravity and Viscosity
In Figure 4.8 (a) and (b), the upgrading trend of the produced oil in terms of change in
API gravity points for both feed oils is presented using Co-Mo and Ni-Mo catalysts are
presented. The average API gravity rise for the produced oil with Co-Mo is 3 ± 0.9 oAPI
(Feed-A) and 2.3 ± 1.2 oAPI (Feed-B). Whilst with the use of Ni-Mo catalyst an average API
gravity points increase of Feed-A and Feed-B are 3.8 ± 1.6 and 2.7 ± 1.3 oAPI, respectively.
The lower API gravity points for the produced oil observed in Feed-B is due to its higher
viscosity compared to Feed-A. Generally, the in situ catalytic process achieved a similar
further increase of approximately 2 to 7 oAPI points for both feedstock and catalysts.
This is consistent with previous results on CAPRI reported by Xia and Greaves (2001)
and Xia et al. (2002). They found a maximum of 6.4 oAPI point gain to THAI upgraded oil.
However, with Ni-Mo catalyst, it requires almost 100 minutes to achieve a similar of catalytic
upgrading obtained in Feed-A as in the run of Feed-B. This may be due to difference in
feedstock properties and their influence on flow.

Chapter 4: Effects of Reaction Conditions, Catalyst and Feedstock on upgrading
130
(a)
(b)
Figure 4.8 Effect of feedstock on produced oil API gravity at temperature 425 oC, pressure 20
barg, nitrogen-to-oil ratio 500 mL.mL-1
and Catalysts: (a) Co-Mo/Al2O3 and (b) Ni-Mo/Al2O3
(the legend indicate the feed oils start API gravity and viscosity values).

Chapter 4: Effects of Reaction Conditions, Catalyst and Feedstock on upgrading
131
It is noteworthy that flow rate control for the highly viscous feed-B proved
challenging because of the presence of sediments in the oil and its tendency to block and/or
obstruct flow in the lines and the catalyst bed. This contributed to the possible source of the
scatter of data points observed in the API gravity as well as viscosity with repeatability for
duplicate runs within ± 3.8 % for API and ± 4.7 % for viscosity, respectively. Therefore, the
volume of oil collected in a given time was used to estimate the flow rate. The average flow
rate was 1 ± 0.3 mL.min-1
. For this reason, whenever there is a slight change in flow, this
could have led to changes in residence time which influences the contact time between the oil
and the catalyst, resulting in the observed scatter in the API gravity and viscosity,
respectively. Similar flow fluctuations are likely in the down-hole CAPRI process because the
mobile oil zone (MOZ) passes through the oil sand at varying permeability and flow rate.
The measurement of produced upgraded oil samples viscosity in comparison to that of
the feedstock is necessary for predicting the easiness of oil flow during the recovery process.
The viscosity of the produced oils from both feedstock with Co-Mo and Ni-Mo catalysts are
presented in Figure 4.9 (a) and (b). There is significant reduction of viscosity in both
experimental runs with both catalysts compared to the original feed oils. Figures 4.8 and 4.9
are reversed trend as a decrease in API gravity conforms to an increase in viscosity of the
produced oil samples with time-on-stream.

Chapter 4: Effects of Reaction Conditions, Catalyst and Feedstock on upgrading
132
(a)
(b)
Figure 4.9 Effect of feedstock on produced oil API gravity at temperature 425 oC, pressure 20
barg, nitrogen-to-oil ratio 500 mL.mL-1
and Catalysts: (a) Co-Mo/Al2O3 and (b) Ni-
Mo/Al2O3.

Chapter 4: Effects of Reaction Conditions, Catalyst and Feedstock on upgrading
133
At the end of the experimental runs, the average viscosity of the produced oils with
Co-Mo and Ni-Mo catalysts were 0.092 and 0.082 Pa.s (feed-A) and 0.151 and 0.133 Pa.s
(feed-B) compared to the original 0.49 and 1.091 Pa.s for feed-A and B, respectively. This
indicates that the viscosity reductions with Co-Mo and Ni-Mo catalysts were 81.2 and 83.3 %
(feed-A) and 86.2 and 87.8 % (feed-B), respectively. This shows roughly the same DVR and
API gravity rise is achievable despite the difference in feedstock properties. Similarly, Xia
and Greaves, (2001) reported 70-80% reduction in viscosity using CAPRI. They found that
after CAPRI, the amounts of resins and asphaltenes decreased, while the amounts of saturates
and aromatics increased in the produced oil. Notably, the asphaltenes content with Co-Mo and
Ni-Mo catalysts reduced from 11.14 wt.% (feed-A) to 6 and 6.7 wt.% and for feed-B from
10.3 wt.% to 5.11 and 4.4 wt.%, respectively. Therefore, conversion of asphaltenes was
roughly 39-47 % (feed-A) and 52-58 % (feed-B), depending on the catalysts.
4.7.2 Effect of Feedstock on TBP Distribution
The TBP distribution curves for this sample were obtained using the integrated PTV
injector and Agilent 6850N gas chromatography according to the ASTM-2887-08. Figure
4.10 provides the results of the cumulative volume percent yield of feed and produced oils at
selected simulated distillation temperatures for Co-Mo/alumina and Ni-Mo/alumina catalysts.
It can be observed that the upgraded oils from the experiments performed with Co-Mo and
Ni-Mo catalysts caused a significant shift towards lighter distillate fractions with low-boiling
temperatures in comparison to the feedstock.

Chapter 4: Effects of Reaction Conditions, Catalyst and Feedstock on upgrading
134
Figure 4.10 TBP distribution curves for the feed and produced upgraded oils at 425 °C;
Catalysts: Co-Mo/Al2O3 and Ni-Mo/Al2O3, Reaction Media (N2), Pressure 20 barg, Oil flow
rate 1 mL.min-1
, Gas flow rate 500 mL.min-1
.
For instance, a dramatic 4 °C shift in the boiling temperature was noticed at 10 vol.% yield
compared to feed oil-A. This rises to 10, 29, 60, and 101 °C as the cumulative amount
distilled increased from 30 to 90 vol.% yield for Co-Mo catalyst at upgrading temperature of
425 °C and feed oil-A. A similar trend can be observed for the use of Ni-Mo catalyst with
feed oil-A as well. The shift towards lower distillable temperatures is an indication that the
produced oils contain lower molecular weight components compared to the original
feedstock. However, for feed oil-B approximately 14 oC shift towards low-boiling
temperature was observed up to 50 vol.% cumulative yield followed by 23 and 46 oC rise in
the shift as the yield increased from 70 to 90 vol.% with the use of Co-Mo. The level of
upgrading in the presence of Co-Mo/Al2O3 and Ni-Mo/Al2O3 catalysts for both feedstocks is
approximately similar irrespective of the difference in feedstock properties. The level of
impurities reduction after upgrading is presented in Appendix B.
Chapter 4: Effects of Reaction Conditions, Catalyst and Feedstock on upgrading
135
4.8 Conclusions
The in-situ catalytic upgrading process (CAPRI) starts with in situ combustion to
supply thermal energy to the reservoir by heating the heavy oil/bitumen and the rock to high
temperature (400-550 oC). These conditions induce thermal cracking as well as drive catalytic
conversion of the oil as it flows across the catalyst bed incorporated on the horizontal
production well, thus reducing its viscosity and generating lighter hydrocarbon fractions.
This entire process was demonstrated in a laboratory scale in a fixed-bed reactor. The effect
of temperature, WHSV, feedstock, mono- and bi-metallic catalyst and catalyst type was
investigated. It was found that temperatures of 425 oC and WHSV 9.1 h
-1 gave the optimum
upgrading level in API gravity, viscosity reduction and yield of light distillates.
Chapter 5: Effect of Reaction Gas Media on Upgrading
136
Chapter 5
Effect of Reaction Gas Media on Upgrading
5.1 Introduction
Hydrogen-addition offers an alternative route to upgrade heavy oils, resulting in less
coke formation and higher liquid yield compared to the carbon-rejection route (Liu, et al.,
2003). Hydrogen and methane are sources of the smallest radicals (i.e., active hydrogen and
methyl) found in the reaction media that can quench free radical addition reactions. If free
radical reactions are not terminated they would otherwise lead to the formation of larger
molecules which confer characteristics of high viscosity, low API gravity, and low conversion
of (BP > 343 oC) in the produced oil and subsequently high coke. Apart from the use of
hydrogen itself, other sources of hydrogen such as light hydrocarbons or hydrogen donor
solvents could be considered (Alemán-Vázquez, et al., 2012). In fact, high H/C ratio of
methane makes it a potential alternative to expensive hydrogen gas as a source of hydrogen
atom in the reaction medium.
In Chapter 2 and Sections 2.6.6 and 2.9.1 the THAI and its catalytic CAPRI are
presented. In the Mobile Oil Zone (MOZ) the combustion reactions generate gases as
illustrated by the following four equations (Xia and Greaves, 2001; Xia, et al., 2002;
Wenlong, et al., 2011; Greaves, et al., 2012):
heavy oil → light oil + gas + coke + absorbed heat (5.1)
coke + O2 → H2O + CO2/CO + heat (5.2)
heavy oil + O2 → H2O + CO2/CO + heat (5.3)

Chapter 5: Effect of Reaction Gas Media on Upgrading
137
light oil + O2 → H2O + CO2/CO + heat (5.4)
These reactions aid the thermal upgrading of the heavy oil; light oil is first generated as
shown in eq. 5.1 and the other reactions generate heat to drive the reaction. In the CAPRI
‘add-on’ further upgrading occurs by catalytic conversion into light oil.
In this Chapter 5, the effect of reactant gases upon the extent of upgrading and coke
formation are investigated and reported in Section 5.2. In Section 5.3 hydrogen-addition route
to upgrading was reported. Ex situ oxidative-regeneration of spent catalyst and hydrocracking
of anthracene as model compound of typical poly-aromatics are reported in Sections 5.4 and
5.5, respectively.
5.2 Effect of Reaction Gas Environment
Upgrading results are presented below for experiments carried out under hydrogen,
methane, nitrogen, and a blended THAI gas (see Chapter 3 and Section 3.3) representing the
typical gases generated during the field THAI process, which were studied over a Co-Mo/γ-
Al2O3 catalyst. The experiments were conducted at a reaction temperature of 425 oC, pressure
10bar, oil flow rate 1 mL.min-1
, and gas-to-oil ratio 50 mL.mL-1
for 6 hours time-on-stream
operation using feed oil-B.

Chapter 5: Effect of Reaction Gas Media on Upgrading
138
5.2.1 Effect of Hydrogen and Methane on Mass Balance
In Table 5.1, the mass balance of gas, liquid (i.e., light oil) and coke yields from
catalytic upgrading of heavy oil under nitrogen, hydrogen and methane reaction gas at the
same conditions is presented. The reported values are an average of duplicate experimental
runs. The chemistry of upgrading is presented in Section 4.2 of Chapter 4.
Table 5.1 Mass balances; Catalyst Co-Mo/Al2O3, Reaction Media: N2, H2, and CH4, Reaction
Temperature 425 oC, Pressure 10 barg, Oil flow rate 1 mL.min
-1, Gas flow rate 50 mL.min
-1.
Products
N2
(wt.%)
H2
(wt.%)
CH4
(wt.%)
Liquid 92.6 94.64 93.28
Gas 4.49 3.88 4.35
Coke 2.91 1.48 2.37
Clearly, the coke yield when the reaction was carried under hydrogen atmosphere was
1.43 wt.% lower than of nitrogen. Also, under methane environment the coke yield was
0.54wt.% below 2.91 wt.% (nitrogen). Most of the upgrading reaction with nitrogen
atmosphere proceeds via carbon-rejection with less indirect hydroconversion reactions
because of limited in situ hydrogen generated by hydrocarbons. On the other hand, yield of
liquid product increased by 2.04 wt.% (hydrogen) and 0.68 wt.% (methane) above 92.6 wt.%
obtained under nitrogen atmosphere. As Graue (2001) observed that the liquid yield from
hydrogen-addition to heavy oil upgrading processes can increase up to 20-25 volume percent
greater than the yield from carbon-rejection counterparts. The hydrogenation and methylation
of fragments improved liquid yield.

Chapter 5: Effect of Reaction Gas Media on Upgrading
139
5.2.2 Effect Reaction Media upon API Gravity, Viscosity and Distillable
yield
The reported data points on the graphs are average values taken from duplicate
experimental runs with maximum standard deviation of ± 0.41oAPI. The API gravity,
viscosity and the true TBP distribution curves for the feed and the produced oil samples as a
function of time-on-stream are respectively shown in Figures 5.1 (a), (b) and (c) for hydrogen,
methane, THAI gas, and nitrogen reaction gas. The feed oil had an API gravity of 14o. Upon
processing in hydrogen, the initial change in API gravity for the first sample taken from the
reactor at 25 minutes was quite low, before increasing up to a maximum of 8o points after 50
minutes, thereafter decreasing and settling at an average of 4.4 ± 1.3o
increase in API points.
Similarly for reaction in methane the increase in API gravity was initially 5o
thereafter settling
at an average of 3.33 ± 1o
API, whilst for THAI gas the initial upgrading was 6.9o
settling at
an average increase of 2.93 ± 1.5o API. For nitrogen the maximum upgrading of 5
o occurred
thereafter settling at an average increase of 2.72 ± 1o API. A possible reason for the low API
gravity change of the first sample taken from the reactor could be instability of oil flow at
start up due to the difficulties of regulating the flow manually using a metering valve. The
price of crude oil increases exponentially with its API gravity, in other words the higher the
API gravity the higher the price (Ancheyta and Rana, 2007). Hence, every degree rise in API
gravity of the produced oil will enhance the value of the oil in the market.

Chapter 5: Effect of Reaction Gas Media on Upgrading
140
(a)
(b)

Chapter 5: Effect of Reaction Gas Media on Upgrading
141
(c)
Figure 5. 1 Effect of hydrogen, methane, THAI gas and nitrogen reaction media upon (a) API
gravity, (b) viscosity of produced oil, and (c) the true boiling point distribution curves for the
feed oil and the produced oils at reaction temperature 425 oC, pressure 10barg, and gas-to-oil
ratio 50 mL.mL-1
using Co-Mo/Al2O3 catalyst and feed oil-B.
Viscosity is an important physical property of the crude oil and as a guideline should
be lower than 0.2 Pa.s at 20 oC to achieve pumping in order to aid pipeline transport
(Ancheyta, et al., 2005; Hart, 2013). In Figure 5.1b, the absolute viscosity reduced from the
feed value of 1.091 Pa.s to 0.078 Pa.s (92.8 % reduction) in hydrogen, 0.105 Pa.s (90.4 %
reduction) in methane and 0.1181 Pa.s (89.2 % reduction) in THAI gas blend. An upgrading
experiment carried out under nitrogen as an inert/control experiment led to oil with lowest
change in API gravity of 2.71o and smallest viscosity reduction of 0.121 Pa.s (88.9 %
reduction).
A comparison of performance under different gases, the major change in API gravity
of 1.68° and viscosity reduction of 3.9% occurred under hydrogen above the values obtained

Chapter 5: Effect of Reaction Gas Media on Upgrading
142
when nitrogen was used. This suggested the involvement of hydrogen in further upgrading
reactions. The produced oil under methane also showed additional improvement, with a
further increase of 0.44o API and 1.5 % viscosity reduction compared with nitrogen. From the
above results it appears that there was no significant difference in API gravity and viscosity of
produced oil upon the use of THAI gas, with API gravity increase of 0.21o and viscosity
reduction 0.3%, from produced oil upon the use of nitrogen. The slight improvement in API
gravity and viscosity under THAI gas above that of nitrogen can be attributed to the activity
of 4% methane in the THAI gas (see Section 5.1), which could have been a source of
hydrogen to assist in upgrading reactions.
In Figure 5.1c, the true boiling point (TBP) distribution curves for the feed oil and the
produced upgraded oil samples carried out under hydrogen, methane, THAI gas, and nitrogen
reaction media are presented. It is clear that the yield of low-boiling fractions increased
above that of the feed oil for all the experimental runs as shown by the shift of the distillation
curves to the left of the feed oil curve. However, the distillables increased further upon the
addition of hydrogen and a slight increase was also noticed with methane compared to the use
of THAI gas and nitrogen in relation to the feed oil. The improvement upon hydrogen
addition is in line with the reports of Hart et al. (2013) and Longstaff, et al. (1994).
The conversions of 343oC+ HC fractions under hydrogen, methane, THAI gas, and
nitrogen atmospheres were 41%, 38.1%, 32.6% and 29.5%, respectively. These values follow
the trends observed in Figure 5.1c, and also reflect similar results observed for the API gravity
and viscosity, thus confirming the participation of hydrogen and methane in the upgrading
reactions. The increased low-boiling fractions of the produced oil with hydrogen and methane
are thought to be mainly due to the moderated retrogressive polymerisation reactions of
macromolecular radical addition reaction which led to high-boiling fractions observed with
Chapter 5: Effect of Reaction Gas Media on Upgrading
143
inert nitrogen. The hydrogen-donor reaction mechanisms are thought to be responsible for the
increased yield of light and middle hydrocarbon distillates (Aleman-vazquez, et al., 2012).
Ancheyta et al. (2005) reported that the viscosity of the oil depends on the amount of the >
350 oC heavy fractions and/or the yield of < 350
oC distillates fractions. The increased lighter
fractions in the upgraded samples thin the unconverted heavy fractions, which resulted in
lower viscosity (see Figure 5.1b).
As observed in Figures 5.1a-c, the CAPRI upgrading reactions conducted under
hydrogen atmosphere produced oil with improved API gravity, viscosity and conversion of
343oC+ fraction than the values obtained under methane, followed by THAI gas and nitrogen.
Hence, the order of reactivity of these gases during reaction may be summarised as H2 > CH4
> THAI gas > N2, which is consistent with the reports of Ovalles et al. (1998 & 2003). The
capping of free radical under hydrogen atmosphere, as shown in equations (5.5-5.6), could
have contributed to these improvements. Also, the free-radical pathway that occurs in
methane during upgrading (equations 5.7-5.9) is thought to be a mechanism by which the API
gravity and viscosity of the oil are improved (Ovalles, et al., 1998).
active chains + active H2 → low molecular weight compound (5.5)
active chain + active chain → high molecular weight compound (5.6)
R − R'→ R• + R'
• (5.7)
R• + CH4→ RH + CH3
• (5.8)
CH3• + R − R'→ R'CH3 (or RCH3) + R
• (or R'
•) (5.9)
where R and R' are naphthenic or aromatic hydrocarbons

Chapter 5: Effect of Reaction Gas Media on Upgrading
144
Upon methane activation hydrogen and methyl radicals are produced. The radicals
react with hydrocarbon molecules to give either hydrogenated or methylated species (RH or
RCH3) with free radicals (R•) in a continuous chain process, as illustrated in equations 5.7-5.9
(Ovalles, et al., 1998). Ovalles et al. (1998) found that methane decomposes to form CHx
(where x =1, 2, or 3) and H4-x species on the surface of MoS2 catalyst, with lot of methyl
(CH3) species all attached to the catalyst surface at a temperature of 420oC and pressure 0.3
MPa. The adsorbed CHx on the catalyst can be incorporated into the hydrocarbon molecules
to form methylated products, and subsequently the H4-x species are available to hydrogenate
cracked fragments, moderate coke precursors and remove sulphur in the form of H2S
(Ovalles, et al., 2003).
The fundamental cleavage that results in substantial upgrading is the temperature
driven splitting of C – C and C-heteroatom bonds (Hart, et al., 2014). This can lead to
remarkable viscosity decrease, notable increase in distillable fractions, and increase API
gravity. In the reported work of Hart et al. (2013) and the results presented in Chapter 4 in
which nitrogen gas media was investigated at 350, 400 and 425 oC, the average changes in
API gravities were respectively 2, 2.8, and 3.7o
API, viscosity reductions were 42, 65.3 and
81% and conversions of boiling fractions >343 °C were 16.5, 28.6 and 36.5 %. In this Chapter
5, improvements in the API gravity, viscosity, and the distillable yield upon upgrading with
methane, THAI gas and nitrogen only vary within a relatively narrow range but slightly
higher differences are observed for reactions performed with hydrogen (Figures 5.1a-c). This
confirms that the primary upgrading reactions depend mostly on the reaction temperature,
whereas the reaction media play a role in the chemistry of upgrading reactions.

Chapter 5: Effect of Reaction Gas Media on Upgrading
145
5.2.3 Effect on Produced Gas Composition
The composition of the produced gas during CAPRI reaction experiments under
hydrogen, methane, THAI gas, and nitrogen atmospheres are presented in Table 5.2. It is clear
that the produced gas consists of paraffin and olefin hydrocarbons. Olefins are known coke
precursors because they can transform into larger molecular weight compounds if there is
insufficient active hydrogen available to quench their addition reaction. In Table 5.2, the total
paraffin content of the gas under hydrogen and nitrogen are 9.23 and 6.67 vol.%, respectively.
Whilst, the olefin contents for the produced gases upon upgrading under the following feed
gases were: hydrogen (0.81 vol.%), methane (0.86 vol.%), THAI gas (1.1 vol.%), and
nitrogen (1.24 vol.%). Notably, the amount of olefins in the gas upon the use of THAI gas
was 0.14 vol.% less than that of nitrogen used in the inert control run.
It was deduced that the amounts of ethene, propene, trans-2-butene, and cis-2-butene
decreased upon the use of hydrogen and methane as reaction media compared to the use of
THAI and nitrogen gases. This confirmed the participation of hydrogen and methane in the
reaction, meaning that the addition of hydrogen promotes hydrogenation of olefins to
paraffins, which can be confirmed by a corresponding increase in the amount of paraffins in
the produced gas. Under a hydrogen environment, the generated methyl radicals during
upgrading reactions may have been terminated by hydrogen which gave rise to the increased
amount of methane gas in the produced gas stream compared to nitrogen atmosphere.

Chapter 5: Effect of Reaction Gas Media on Upgrading
146
Table 5.2 Produced gas composition for different reaction gas media; temperature 425oC,
pressure 10barg, oil flow rate 1 mL.min-1
, gas flow rate 50 mL.min-1
.
Gas
Composition
Hydrogen
(Vol.%)
Methane
(Vol.%)
THAI gas
(Vol.%)
Nitrogen
(Vol.%)
Methane 5.93 Used 10.5 2.3
Ethane 0.37 0.49 0.35 0.47
Ethene 0.19 0.21 0.31 0.29
Propane 1.21 2.37 1.63 2.06
Propene 0.37 0.39 0.41 0.58
n-butane 0.52 1.02 0.79 0.82
i-butane 0.54 0.38 0.21 0.34
1-butene 0.13 0.13 0.18 0.18
Trans-2-butene 0.1 0.09 0.14 0.14
Cis-2-butene 0.03 0.04 0.06 0.05
i-pentane 0.29 0.36 0.34 0.37
n-pentaane 0.37 0.45 0.49 0.37
Hydrogen Used 14.76 4.41 6.22
Hydrogen
sulphide
0.001 0.00073 0.00063 0.00036
Carbon dioxide 0.11 0.1 6.36 0.68
Carbon
monoxide
0.12 0.15 1.45 0.15
Total paraffin 9.23 5.07 3.81 6.67
Total olefins 0.81 0.86 1.1 1.24
*Note the methane component of the outlet gas stream was not included in the calculation of
total paraffin under THAI gas due to its initial presence in the gas.
Furthermore, Table 5.2 shows that the produced hydrogen sulphide under hydrogen
atmosphere is respectively 1.4 and 2.8 times the values obtained under methane and nitrogen
gas reaction media. This provides evidence that hydrodesulphurisation (HDS) reactions
occurred to a greater extent under hydrogen reaction media compared to methane, THAI gas,
Chapter 5: Effect of Reaction Gas Media on Upgrading
147
and nitrogen. Additionally, the produced H2S under methane and THAI gas atmosphere were
2 and 1.75 times that produced when nitrogen gas was used. This indicates that the generated
active hydrogen from catalytic decomposition of methane can be partly consumed by HDS,
resulting in additional H2S in the released gas. It should be noted that the higher
concentrations of CO2, CO and CH4 in the gas under THAI gas atmosphere compared to the
other reaction media are because of their presence in the feed (see Chapter 3 and Section 3.3).
5.2.4 Effect on Asphaltenes, Metal and Sulphur Content
The asphaltene, sulphur and metal contents of the feed and produced oil samples under
the different reaction media are presented in Table 5.3. The asphaltene content decreased
remarkably after CAPRI upgrading in the different reaction media relative to the feed oil. This
suggests that the conversion of the heaviest fraction (asphaltene) to lighter fractions such as
maltene, gases, and coke occurred. However, the use of hydrogen and methane produced
higher conversions of asphaltene of 43.4 and 51.6 %, respectively, compared to 13 %
(nitrogen). This is concluded to be because the generated active hydrogen in hydrogen and
methane media neutralised the cross-linking of macromolecular intermediate radicals that are
generated during cracking of the heavy oil (Liu, et al., 2013).
Conversely, the asphaltene content of the produced oil upon the use of methane is
lower than that of hydrogen. This can be attributed to the larger amount of dissolved hydrogen
under an atmosphere of pure hydrogen at 10 bar compared with the low partial pressure of
generated hydrogen from methane. The increased hydrogen dissolved in the oil with the
hydrogen feed was assumed to promote condensation reactions between radicals of asphaltene
macromolecules (Liu, et al., 2013).

Chapter 5: Effect of Reaction Gas Media on Upgrading
148
Table 5.3 Asphaltene, metals, and sulphur content before and after CAPRI reaction using Co-
Mo/γ-Al2O3 catalyst under hydrogen, methane, THAI gas, and nitrogen atmospheres at
reaction temperature of 425 oC, pressure 10barg, oil flow rate 1 mL.min
-1, and gas flow rate
50mL.min-1
.
Impurities Feed oil-B CoMo +
N2
CoMo +
CH4
CoMo +
THAI gas
CoMo +
H2
Asphaltene (wt.%) 10.3 9.2 5.3 8.4 6.1
Aluminium (ppm) 2 2 2 2 2
Boron (ppm) 3 2 2 2 2
Iron (ppm) 5 2 < 1 < 1 < 1
Sulphur (wt.%) 3.52 3.4 3.09 3.03 2.77
Silicon (ppm) 1 < 1 < 1 < 1 < 1
Nickel (ppm) 41 34 30 37 36
Vanadium (ppm) 108 90 79 82 89
Ni + V (ppm) 149 124 109 119 125
* Sulphur and metals content was performed by Intertek Laboratories, Sunbury Technology
Centre, UK, using ICP-OES (Inductively Coupled Plasma Optical Emission Spectrometry).
One of the objectives of upgrading is to remove impurities such as metals and sulphur
to a level that will minimise their impact on downstream processing catalysts, equipment and
also improve the yield of low-boiling fractions. The results show that in all cases the sulphur
and metals content of the produced oil in different reaction media were less than those of the
feed oil, which indicates that the Co-Mo/Al2O3 HDT catalyst was active for desulphurization
and demetalization reactions. It was therefore deduced that the breaking of C-heteroatom
bonds in addition to C-C bond cleavage contributed to the increased API gravity, decreased
viscosity, and improved yield of distillates noticed in the previous sections. However, when
hydrogen gas was used as reaction gas medium, sulphur removal was 21.4%, which is

Chapter 5: Effect of Reaction Gas Media on Upgrading
149
significantly higher than the values obtained using methane (12.2%), THAI gas (13.9), and
nitrogen (3.4 %), correspondingly. Some of the sulphur content is removed in gaseous form as
H2S, which was confirmed by the high concentration of H2S detected in the produced gas
when hydrogen feed was used. Also, sulphur is deposited on the catalyst as metallic sulphide
during reaction (Hart, et al., 2014). This is because HDS reaction was promoted in the
presence of hydrogen, which was not experienced to the same extent in the methane, THAI
gas and inert nitrogen atmosphere. The reaction pathways through which sulphur can be
removed from the different structures in the heavy oil during CAPRI process is illustrated in
Figure 5.2.
Figure 5.2 Typical organosulphur compounds (where; R1 and R
2 are alkyl hydrocarbon) found
in heavy oil and their reaction pathway during upgrading reactions (Babich and Moulijn,
2003).

Chapter 5: Effect of Reaction Gas Media on Upgrading
150
The thiophenes can either undergo hydrogenolysis and/or hydrogenation to non-
aromatic sulphide prior to been subjected to cracking and desulphurisation to give H2S
obvious in the off-gas presented in Table 5.2 (Gray and Ayasse, 1995).
It can be seen from Table 5.3 that the cracking of asphaltenes resulted in a decrease in
sulphur and metal content in the produced oil. This suggests that sulphur and metals such as
nickel and vanadium in porphyrin-like form, were associated with asphaltene molecules
(Ancheyta, et al., 2002). The percentage reductions of nickel plus vanadium (Ni + V) content
under the different environments were: 16.8 % (nitrogen), 26.9 % (methane), 20.1 % (THAI
gas), and 16.2 % (hydrogen) relative to the value of 149 ppm (feed oil). This observed
behaviour can be attributed to the conversion of asphaltenes into smaller molecules in the
different environments as shown in Table 5.3. Under the same conditions other trace elements
such as boron, iron, and silicon were reduced after upgrading. These metals are transformed
into metal sulphides upon deposition on the catalyst (Ancheyta, et al., 2002). This suggests
that catalyst high activity should be harmonized with high metal tolerance.
5.2.5 Effect on Elemental Composition
The elemental composition of the feedstock and produced oil from the different
reaction gas media was determined using micro-elemental analyser EA 1110 CHNS and
presented in Table 5.4.

Chapter 5: Effect of Reaction Gas Media on Upgrading
151
Table 5.4 Elemental composition of feed and produced oil from upgrading under nitrogen,
hydrogen, methane, and THAI gas reaction gas media using Co-Mo/Al2O3 catalyst at
temperature 425 oC, pressure 10 barg, and gas-to-oil ratio 50 mL.mL
-1.
Sample
Nitrogen
(%)
Carbon
(%)
Hydrogen
(%)
H/C Carbon-
rejection (%)
Feedstock 0.57 88.82 10.17 0.114 N/A
Feed oil + N2 0.48 85.80 10.55 0.123 3.01 ± 0.4
Feed oil + CH4 0.44 87.53 10.96 0.125 1.28 ± 0.2
Feed oil + THAI
gas
0.47 87.66 10.72 0.122 1.15 ± 0.2
Feed oil + H2 0.28 87.75 11.01 0.126 1.06 ± 0.1
It can be seen that the H/C atomic ratio increased from the feed value of 0.114 to
0.126 (hydrogen), 0.125 (methane) and 0.122 (THAI gas). However, an experiment carried
under nitrogen atmosphere as control gave the highest carbon-rejection of 3.01 % while the
hydrogen environment gave the lowest 1.06 %. This is evident that the upgrading reaction in
nitrogen atmosphere is majorly carbon-rejection with limited hydrogen-transfer reaction from
the hydrocarbons. On the other hand, the nitrogen content of the feedstock decreased from
0.57% to 0.28% (hydrogen) compared to 0.48% (nitrogen). This represents 51% removal of
nitrogen upon the use of hydrogen. This is because of increased hydrodenitrogenation (HDN)
reaction occurring in the presence of hydrogen.
The effect of reaction gas environment on the spent catalyst coke content after reaction
in each of the gas environment is presented in Appendix C. However, the spent catalyst coke
content decreased in this order H2 < CH4 < THAI gas < N2 (see Appendix C and Table C.1).

Chapter 5: Effect of Reaction Gas Media on Upgrading
152
5.3 Hydrogen-Addition Route to Upgrading
The amount of hydrogen available for catalytic upgrading reactions is directly
proportional to its partial pressure at constant temperature according to Henry’s law. In other
words, operating at high pressures will enhance solubility, mass transfer and inhibits coke
formation (Elizalde, et al., 2010; Aleman-Vazquez, et al., 2012). The effect of hydrogen-
addition and hydrogen pressure were investigated at the following operating conditions:
reaction temperature 425 oC, pressure 20 barg, oil flow rate 1 mL.min
-1, and gas-to-oil ratio
200 mL.mL-1
using feed oil-A. The effect of injected hydrogen compared to nitrogen in the
catalytic upgrading process on the produced oil API gravity as a function of time-on-stream
using Co-Mo/Al2O3 and Ni-Mo/Al2O3 are presented in Figure 5.3 (a) and (b), respectively.
It is clear from Figure 5.3a that under nitrogen gas reaction media the API gravity
decreased sharply from 7 to ~2.5 oAPI at 200 minutes, however under hydrogen atmosphere
the API gravities of the produced oil samples were sustained at approximately 5o above the
feedstock value (13oAPI) with time-on-stream for most of the samples. Also, when Ni-Mo
catalyst was used at the same conditions as Co-Mo the API gravity decrease from 6.8o to 3.1
o
at 210 minutes, thereafter it settles at 2.58 ± 1.45o
API under nitrogen. However, under
hydrogen atmosphere, the API gravity decrease from 7o and settles at 4.3 ± 1.3
o API (see
Figure 5.3b). The fluctuations in the data are largely due to hydrogen gas flow control issues.
This shows that the injected hydrogen could have inhibited the extent of catalyst deactivation
experienced in nitrogen reaction media (Hart, et al., 2013a,b).
The effect of hydrogen-addition compared to nitrogen on the produced oil viscosity as
a function of time-on-stream using Co-Mo/Al2O3 and Ni-Mo/Al2O3 are presented in Figure
5.4 (a) and (b), respectively. It can be seen that the upgraded oil samples under hydrogen

Chapter 5: Effect of Reaction Gas Media on Upgrading
153
atmosphere for both Co-Mo and Ni-Mo catalysts have lower viscosities compared to those
obtained with nitrogen.
(a)
(b)
Figure 5.3 Effect of hydrogen-addition on API gravity of produced oil; reaction temperature
425 °C, Reaction Media H2 or N2, Pressure 20 barg, Oil flow rate 1mL.min-1
, Gas flow rate
200 mL.min-1; Catalysts: (a) Co-Mo/Al2O3, and (b) Ni-Mo/Al2O3 as a function of time-on-
stream using feed oil-A.

Chapter 5: Effect of Reaction Gas Media on Upgrading
154
(a)
(b)
Figure 5.4 Effect of hydrogen-addition on viscosity of produced oil; reaction temperature 425
°C, Reaction Media H2 or N2, Pressure 20 barg, Oil flow rate 1mL.min-1
, Gas flow rate 200
mL.min-1
; Catalysts: (a) Co-Mo/Al2O3, and (b) Ni-Mo/Al2O3 as a function of time-on-stream
using feed oil-A.
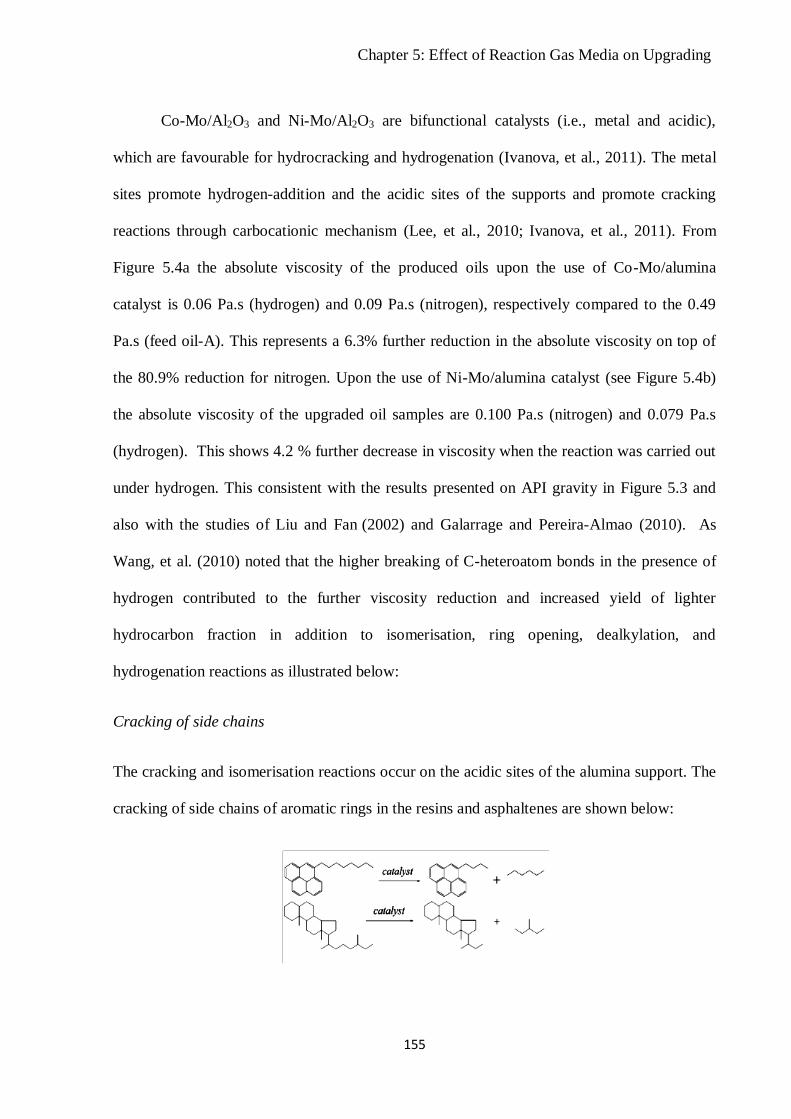
Chapter 5: Effect of Reaction Gas Media on Upgrading
155
Co-Mo/Al2O3 and Ni-Mo/Al2O3 are bifunctional catalysts (i.e., metal and acidic),
which are favourable for hydrocracking and hydrogenation (Ivanova, et al., 2011). The metal
sites promote hydrogen-addition and the acidic sites of the supports and promote cracking
reactions through carbocationic mechanism (Lee, et al., 2010; Ivanova, et al., 2011). From
Figure 5.4a the absolute viscosity of the produced oils upon the use of Co-Mo/alumina
catalyst is 0.06 Pa.s (hydrogen) and 0.09 Pa.s (nitrogen), respectively compared to the 0.49
Pa.s (feed oil-A). This represents a 6.3% further reduction in the absolute viscosity on top of
the 80.9% reduction for nitrogen. Upon the use of Ni-Mo/alumina catalyst (see Figure 5.4b)
the absolute viscosity of the upgraded oil samples are 0.100 Pa.s (nitrogen) and 0.079 Pa.s
(hydrogen). This shows 4.2 % further decrease in viscosity when the reaction was carried out
under hydrogen. This consistent with the results presented on API gravity in Figure 5.3 and
also with the studies of Liu and Fan (2002) and Galarrage and Pereira-Almao (2010). As
Wang, et al. (2010) noted that the higher breaking of C-heteroatom bonds in the presence of
hydrogen contributed to the further viscosity reduction and increased yield of lighter
hydrocarbon fraction in addition to isomerisation, ring opening, dealkylation, and
hydrogenation reactions as illustrated below:
Cracking of side chains
The cracking and isomerisation reactions occur on the acidic sites of the alumina support. The
cracking of side chains of aromatic rings in the resins and asphaltenes are shown below:

Chapter 5: Effect of Reaction Gas Media on Upgrading
156
Hydrogenation reactions
The hydrogenation function is provided by the Co, Ni, and Mo metals. This reaction occurs
on the unsaturated hydrocarbons (i.e., olefins and aromatic) and the heteroatom-containing
compounds (Wang, et al., 2010).
Ring opening reaction
Where; R represents alkyl hydrocarbon. This type of reaction occurs to the cycloalkanes in the
saturated hydrocarbons and the heterocyclic aromatic groups (Wang, et al., 2010).
Isomerisation reaction

Chapter 5: Effect of Reaction Gas Media on Upgrading
157
This kind of reaction occurs commonly on straight chain paraffins, the side chains of aromatic
compounds, and cyclopraffins in the heavy oil (Wang, et al., 2010). The presence of iso-
paraffins and iso-olefins, H2S, and C1-C5 gases in the produced gas analysed using the RGA
clearly confirmed these reactions (see section 5.2.3). Although, hydrocarbons take part in
hydrogen-transfer reactions, their impact on hydroconversion is limited, as external hydrogen
source is required.
The comparison between TBP distribution curves for hydrogen and nitrogen
atmospheres with Co-Mo or Ni-Mo catalysts is presented in Figure 5.5. As can be seen, the
amount distillate fractions increased upon catalytic upgrading under hydrogen compared to
the use of nitrogen. It was found that with hydrogen a further 10-12C shift towards low-
boiling temperature distillates can be observed compared to nitrogen in order to obtain a
cumulative distillate of 75 vol.%.
Figure 5.5 Effect of hydrogen-addition on TBP distribution of produced oil; Reaction
Temperature 425 °C, Reaction Media; H2 or N2, Pressure 20 barg, Oil flow rate 1mL.min-1
,
Gas flow rate 200 mL.min-1
; Catalysts: Co-Mo and Ni-Mo.

Chapter 5: Effect of Reaction Gas Media on Upgrading
158
The conversion of residue fractions (> 343oC) to light fractions (BP < 343
oC) are as
follows: under nitrogen (28.6 and 37.4 %) and hydrogen (34.5 and 44.1 %) for Ni-Mo and
Co-Mo catalysts, respectively. The involvement of hydrogen in the chemistry of the reaction
is evident of 6-7 % conversion increase noticed. In distillates distribution, the resins and
asphaltenes components concentrate majorly in the residue fractions while saturates
concentrate in the low-boiling distillates (Zhao, et al., 2007). Therefore, the major differences
between the TBP distribution curves presented in Figure 5.5 for the upgraded oils under
nitrogen and hydrogen environments is related to the difference saturates and macromolecules
components.
5.3.1 Effect of Hydrogen Pressure on API Gravity and Viscosity
In Figure 5.6, the effect of hydrogen pressure on the API gravity of the produced oil
samples as a function of time-on-stream is presented. It can be seen that the API gravity
increases slightly as the pressure increases with an average of 0.3o API for every 10 bar rise in
hydrogen pressure. This is because increased hydrogen pressure increases the availability of
hydrogen for hydroconversion reactions (Sambi, et al., 1982; Elizalde, et al., 2010).
Also, the effect of hydrogen pressure on the viscosity of the produced oil samples is
presented in Figure 5.7. In the same way, the viscosity of produced oil is slightly lowered as
the hydrogen pressure increases from 20 to 40 bar with mean DVR increase of 1% for every
10 bar rise in pressure.

Chapter 5: Effect of Reaction Gas Media on Upgrading
159
Figure 5.6 Effect of hydrogen pressure on API gravity of produced oil as a function of time-
on-stream at temperature 425 oC, gas-to-oil ratio 200 mL.mL
-1, Catalyst: Co-Mo/Al2O3.
Figure 5.7 Effect of hydrogen pressure on viscosity of produced oil as a function of time-on-
stream at temperature 425 oC, gas-to-oil ratio 200 mL.mL
-1, Catalyst: Co-Mo/Al2O3.

Chapter 5: Effect of Reaction Gas Media on Upgrading
160
This shows that hydrogen pressure does not exert as much effect on API gravity
increase and viscosity reduction as reaction temperature and WHSV reported in Chapter 4.
Though catalytic upgrading reaction proceeds by large molecules breaking down into smaller
ones, the cracked intermediates can reassemble into larger molecules when there are
inadequate active hydrogen and methyl radicals in the reaction environment to moderate their
addition reactions. The formation of large molecular weight compounds under nitrogen
atmosphere leads to low API gravity and increase viscosity of the produced oil samples with
time-on-stream (see section 5.2.2).
The measured difference between inlet and outlet hydrogen concentration in the
produced gas showed a decrease by 13.3, 17.33 and 19.83 vol.% below 99.99 vol.% pure
hydrogen fed into the CAPRI reactor as pressure increased from 20 to 40 bar. Though
equations of state for the calculation of hydrogen consumption have been proposed by Maipur
et al. (2010), in this work the outlet gas flow was not measured, so overall loss of hydrogen in
moles was not calculated. However, this drop in hydrogen concentration shows that the
solubility and involvement of hydrogen drastically improved as the pressure increased (Cai, et
al., 2001; Maipur, et al., 2009; Rezaei, et al., 2010). This provides evidence that during the
reactions hydrogen involved in hydrogenation of free radicals and aromatics, saturation of
olefins, removal heteroatom, and hydrocracking (Longstaff, et al., 1994).
5.3.2 Effect of Hydrogen Pressure on TBP Distribution
The TBP distribution data of six selected samples obtained at hydrogen pressure of 20,
30, and 40 barg, with that obtained under nitrogen (20 barg) are presented in Figure 5.8. The

Chapter 5: Effect of Reaction Gas Media on Upgrading
161
experiment was performed in duplicate with deviation of ± 1.8 %. It is clear that increase in
hydrogen pressure slightly shifted the distillation curve to the left, with 30 bar producing the
highest shift to the left.
Figure 5.8 Effect of hydrogen pressure on TBP distribution at temperature 425 oC, gas-to-oil
ratio 200 mL.mL-1
, Catalyst: Co-Mo/Al2O3.
It was noted that 65 vol.% cumulative amount distilled was obtained at boiling
temperature of 414 oC for the feed oil, and after catalytic upgrading under nitrogen
atmosphere it shifted to 350 oC, that is a shift to the left by 64
oC at 20 bar. However, under
hydrogen at 20 bar it shifted to 338 oC, which is 12
oC to the left of the TBP curve under
nitrogen. The increase in hydrogen pressure from 30 to 40 bar resulted in a shift to the left of
TBP curve under nitrogen by 6 and 30 oC, respectively. It is therefore clear that hydrogen
addition to catalytic upgrading process increased the yield of low-boiling fractions. As noted

Chapter 5: Effect of Reaction Gas Media on Upgrading
162
by Jarullah and co-workers (2011), that the yield of middle distillate fractions increased after
the hydrotreatment of the whole crude oil in a trickle-bed reactor.
The calculation of residue fractions (>343 oC) conversion showed that at 20 bar the
conversion was 37.4 % (nitrogen) and 44.1 % (hydrogen), and with the increased in hydrogen
pressure leading to increased conversion of 52.5 % (30 bar) and 41.2 % (40 bar). This
represents 6.7-15.1 % above that of nitrogen which further affirms the fact that hydrogen was
involved in the upgrading reactions, activated by the Ni, Co and Mo metals to produce active
hydrogen that terminates active hydrocarbon chains generated during the cracking reactions.
This is consistent with early result presented in section 5.2.2 (Figure 5.1c).
5.3.3 Effect of Hydrogen Pressure on Asphaltene Content
Table 5.5 shows the asphaltenes content of the produced oil under the different
hydrogen pressure. As the hydrogen pressure increased, the asphaltenes content of the
produced oil decreases to 8.63 wt.% (20 bar), 7.5 wt.% (30 bar) and 5.68 wt.% (40 bar)
relative to 11.14 wt.% (feed oil-A). Thus, the maltene components which comprises of
saturates, aromatics, and resins increases from 2.51 to 5.46 wt.% in the produced oil above
88.86 wt.% (feedstock). A similar trend with increasing hydrogen pressure was observed and
reported by Liu et al. (2013).
Table 5.5 Asphaltene content of produced oil as a function of hydrogen pressure at
temperature 425 oC; gas-to-oil ratio 200 mL.mL
-1; Catalyst: CoMo/Al2O3.
Hydrogen
pressure (barg)
Asphaltene
Content (wt.%)
20 8.63
30 7.5
40 5.68

Chapter 5: Effect of Reaction Gas Media on Upgrading
163
The trends described above may have occurred because the conversion of asphaltenes
in the presence of hydrogen enhanced the hydrogenation of cracked fragments which could
have reduced their recombination to larger molecular weight species and subsequent
precipitation during the catalytic upgrading process. This reaction is favoured at high
hydrogen pressure and temperature, and involves hydrogen transfer from gas phase to the
hydrocarbon radicals and asphaltenes fragments in the liquid phase (Fathi and Pereira-Almao,
2013; Liu, et al., 2013). This transfer of active hydrogen reduces hydrogen abstraction from
the deposited macromolecules such as asphaltenes on the catalyst. The asphaltenes content
decreased significantly therefore at 40 bar hydrogen pressure, because more active hydrogen
radicals were available to neutralise the condensation of aromatic radicals that are generated
during the cracking reactions. Whilst at 20 bar hydrogen pressure, the macromolecule of
asphaltenes radicals were less constrained, which led to increased content of asphaltenes.
Moreover, asphaltenes are major contributors to high crude oil viscosity and low API gravity,
therefore the decreasing content of asphaltenes in the upgraded oil samples could have
contributed to increase fluidity (i.e., low viscosity) and high API gravity increments observed
in Figures 5.6 & 5.7.
5.4 Fresh vs. Regenerated Catalyst
Catalyst deactivation by coke is potentially reversible by burning-off the carbonaceous
deposits in air at high temperature. It is well known that upgrading reactions occur on the
catalyst surface (Hart, et al., 2013), which needs to be recovered to restore catalyst activity.
Ex-situ oxidative-regeneration of the spent Co-Mo/Al2O3 catalyst recovered after upgrading
under nitrogen atmosphere was carried out, and its performance compared with the fresh
counterpart.

Chapter 5: Effect of Reaction Gas Media on Upgrading
164
5.4.1 Characterisation of Fresh and Regenerated Catalyst
The nitrogen adsorption-desorption isotherms of the fresh Co-Mo catalyst, spent Co-
Mo after reaction under nitrogen atmosphere and oxidative-regenerated spent Co-Mo catalyst
from the nitrogen medium experiment are presented in Figure 5.9. It is clear that the catalyst
textural properties such as pore volume, specific surface area, and pore-size distribution
changed after oxidative-regeneration in air environment at 600oC relative to the fresh and
spent Co-Mo catalysts. This is mainly because of coke and metal deposits, which were not
fully removed by the burning process.
Figure 5.9 Nitrogen adsorption-desorption isotherm of fresh Co-Mo catalyst, spent Co-Mo
after reaction under nitrogen, and oxidative-regenerated spent Co-Mo catalyst at 600 oC.

Chapter 5: Effect of Reaction Gas Media on Upgrading
165
Additionally, the catalyst pore sizes became narrower with some of the micropores
blocked as can be seen in the shift of the hysteresis loop towards higher relative pressure and
lower adsorbed volume. From these data the specific surface area of the spent catalyst was
0.36m2.g
-1 while the oxidative-regenerated Co-Mo was calculated to be 103.9m
2g
-1, which is
lower than the value of 214.4m2g
-1 for the fresh catalyst sample. This indicates that only
48.5% of the specific surface area was recovered after oxidative-regeneration at 600 oC.
The fresh and oxidative-regenerated Co-Mo/alumina catalyst at 600oC were also
characterised with Scanning Electron Microscope (SEM). Figure 5.10 shows the SEM images
of the same catalyst microstructure before reaction (i.e., fresh) and oxidative-regenerated after
upgrading reactions (i.e., Figure 5.13B).
Figure 5.10 SEM photomicrograph of Co-Mo/Al2O3 catalyst; (A) fresh and (B) oxidative-
regenerated spent catalyst after upgrading reaction under nitrogen atmosphere.
A B
metals coke

Chapter 5: Effect of Reaction Gas Media on Upgrading
166
The surface morphologies of the oxidative-regenerated Co-Mo/alumina revealed a
visible coating of coke and metals blocking the pores observed in the fresh catalyst. This is
consistent with Figure 2.9. Because of the metals and unburned coke within regenerated
catalyst, 51.5 % specific surface area of regenerated catalyst was loss. Consequently, it shows
that oxidative-regeneration can not completely burn-off the deposited coke onto the surfaces
within the catalyst pores. The performance of oxidative-regenerated spent Co-Mo/Al2O3
against its fresh counterpart is presented in Appendix D.
5.5 Hydrocracking of Poly-aromatic Model Compounds
Generally, Ni-Mo, Co-Mo, etc. supported on alumina and/or silica promote hydrogen-
transfer reactions while the acidic support promotes cracking, ring-opening, and de-alkylation
reactions (Korre and Klein, 1995). The large bond dissociation energy of aromatic rings is
lessen by converting C=C bonds (i.e., 146-151 Kcal/mol.) to C-C bonds (i.e., 83-85
Kcal/mol.), thereby enhancing the cracking of poly-aromatic hydrocarbons into lighter
hydrocarbons (Sun, et al., 2004).
The chemistry of heavy oil is complex since it contains several compounds such as
paraffins, naphthenes, mono-aromatics, diaromatics, and poly-aromatics, respectively. Poly-
aromatic hydrocarbons (PAHs) account for a large portion of the structures contained in the
heavy oil, therefore hydrocracking (HDC) of a model compound representative will provide a
comprehensive understanding of their conversion during the catalyst upgrading process. In
this regard, a tricyclic aromatic fused ring structure anthracene (C14H10) was investigated as a
model compound representing the PAHs family. The HDC of the anthracene was investigated
using the same CAPRI experimental set up, Co-Mo/Al2O3 catalyst at temperatures 350 and

Chapter 5: Effect of Reaction Gas Media on Upgrading
167
400 oC, hydrogen pressure 20 barg, and flow rate 200 mL.min
-1. The liquid product was
analysed using Thermo Electron Corporation Trace GC Ultra DSQ II. The results are
discussed in Appendix E and elucidate the roles of hydrogen in the catalytic upgrading of
highly aromatic heavy oil into light oil which include aromatic hydrogenation, olefin
saturation, and active chain termination.
5.6 Conclusions
The deposition of coke on the catalyst surface during the upgrading reactions in
CAPRI is a major contributor to catalyst deactivation. It was found that the hydrogen and
hydrogen-donor reactive media play a role in inhibiting coke formation and growth, while
also improving the quality and stability of produced upgraded oil. Addition of hydrogen or a
hydrogen-donor to the feed promotes hydrocracking and hydrogenation reactions, whereas in
a nitrogen atmosphere most of upgrading occurred via carbon-rejection with associated heavy
coke deposition upon the catalyst. Hence, reaction under nitrogen leads to characteristically
low API gravity, high viscosity, and low distillates in the produced oil compared with gases
containing hydrogen and hydrogen-donor. Additionally, it was found that hydrogen and
hydrogen-donor atmospheres promote olefin saturation, enhance the paraffin yield, and
improve distillable hydrocarbon fractions. The spent catalyst regenerated ex situ by oxidising
the deposited asphaltenes and coke lost 52.5 % of the surface area compared with the fresh
catalyst. However its upgrading performance in terms of change in API gravity, viscosity
reduction and the yield of distillable was similar to that of the fresh catalyst.

Chapter 6: Effect of Guard Bed on CAPRI Upgrading
168
Chapter 6
Effect of Guard Bed on CAPRI Upgrading
6.1 Introduction
In Chapter 4 it was found that better upgrading at reaction temperature (425 oC) and
WHSV (9.1 h-1
) occurs at the expense of high coke formation, leading to rapid catalyst
deactivation. Larger molecular weight compounds such as resins and asphaltenes are major
contributors to coke formation. Therefore, a guard bed on top of the catalyst bed could
selectively adsorb these macromolecules. Hence, the catalyst lifetime could potentially extend
as premature catalyst deactivation due to coking would have reduced. It is known that foulants
such as metals, sulphur, and sediments that cause catalysts deactivation and shorten catalyst
lifespan during the upgrading process are associated with these macromolecules in the heavy
oil.
Activated Carbon (AC) has shown an affinity for macro-hydrocarbon molecules,
adsorptive selectivity for asphaltenes, resins and coke precursors (Fukuyama, et al., 2004;
Ming et al., 2007). Besides, the use of AC as catalyst support for heavy oil upgrading has also
been reported in the literature (Fukuyama, et al., 2004; Ming et al., 2007; Terai, et al., 2000;
Solar, et al., 1991). This is because of its large surface area, macro- and mesoporous
characteristics and affinity for large molecular weight species. An AC with a surface area of
819.92 m2.g
-1 and pore diameter 412 nm was selected for use as the guard bed on top of the
Co-Mo/Al2O3 and Ni-Mo/Al2O3 catalysts. The results of AC and pelleted alumina as guard-
beds are reported in this Chapter. Meanwhile, the nitrogen sorption isotherm, the porosimetry,
and the properties of the AC and the alumina support are presented in Appendix A.

Chapter 6: Effect of Guard Bed on CAPRI Upgrading
169
6.2 Effect of Guard-Bed
6.2.1 Effect of Guard Bed on API Gravity
The API gravity is a measure of the heaviness or lightness of crude oils. The higher
the API gravity of the crude oil the lighter and the higher the market value. In Figures 6.1 (a)
and (b), the API gravity of the upgraded oil samples over AC only, Co-Mo/Al2O3 only and
Co-Mo/Al2O3 catalyst with AC or Alumina guard bed as a function of time-on-stream are
presented.
In the experimental run with AC guard bed on top of Co-Mo/Al2O3 catalyst, a
substantial level of upgrading was evident by the further increase in the API gravity of the
produced oil in the range of 3 to 9oAPI points above 13
oAPI of the feed oil can be observed.
Whilst, in the experiment carried out with Co-Mo/Al2O3 catalyst only the oil produced was
upgraded by ~2 to 5o API, as compared with the feed oil. Furthermore, 7
o was the maximum
obtained API gravity using Co-Mo/Al2O3 catalyst only, while 9o
API is achievable when AC
guard-bed was added on top of the same catalyst. This shows an additional 2o
API gravity
increment. Without the guard bed, the API gravity for the catalyst significantly fell shortly
after the reaction started and reached its lowest value of about 2° at around 200 minutes into
the experiment and retained a plateau of lower API upgrading until the end of the experiment.
However, the addition of AC guard bed to the catalytic upgrading bed sustained the activity of
the catalyst with the API gravity of the produced oil above 2o (observed upon the use of Co-
Mo/Al2O3 only) for almost 840 minutes before a noticeable decrease of API gravity was
observed in the produced oil (see Figure 6.1a). This effectively adds an additional 10 hours of
catalytic activity compared to the use of Co-Mo/Al2O3 catalyst only.

Chapter 6: Effect of Guard Bed on CAPRI Upgrading
170
(a)
(b)
Figure 6.1 API gravity of produced oil as function of time-on-stream for Co-Mo/Al2O3 only,
AC only, alumina only, and Co-Mo/Al2O3 with (a) activated carbon (AC) and (b) Alumina;
Temperature 425 °C, Reaction Media N2, Pressure 20 barg, Oil flow rate 1 mL.min-1
, Gas
flow rate 500 mL.min-1
.
0
2
4
6
8
10
0 200 400 600 800 1000 1200
Chan
ge
in A
PI
gra
vit
y (
o)
Time-on-stream (minutes)
CoMo
Activated Carbon (AC)
AC + CoMo
-1
1
3
5
7
9
0 200 400 600 800 1000 1200
Chan
ge
in A
PI
gra
vit
y (
o)
Time-on-stream (minutes)
CoMo
Alumina
Alumina + CoMo

Chapter 6: Effect of Guard Bed on CAPRI Upgrading
171
This confirmed the loss of catalytic activity in a short time without the use of a guard
bed. Moreover, the use of AC only produced oil with an average API gravity of 3.1 ± 1.7o
compared to 3 ± 0.92o and 5.6 ± 1.6
o observed for Co-Mo/Al2O3 only and AC on top of Co-
Mo/Al2O3 catalyst. The upgrading noticed upon the use of AC only can be attributed to
adsorptive properties and thermal cracking occurring on its surface since the material is
neutral, unlike alumina that is acidic.
In contrast with the use of an AC guard bed, the use of pelleted alumina guard bed on
top of Co-Mo/Al2O3 catalyst follows a similar trend as that of the Co-Mo/Al2O3 catalyst only
(see Figure 6.1b). The API gravity of the produced oil starts from 7.6o for the alumina plus
Co-Mo/Al2O3 catalyst and rapidly fell to 3o in 200 minutes, before settling to an average value
of 3.44 ± 1.54° with time-on-stream until the experiment was stopped. This represents an
average change in API of approximately 0.6o above 2.8 ± 0.93
o for Co-Mo/Al2O3 catalyst
only. Interestingly, the use of alumina without catalytic metals (i.e., Co, Ni, or Mo) produced
oil which increased to maximum of 8o and drastically fell to 1
o after 200 minutes. After 400
minutes time-on-stream the API gravities of most of the produced oils approach that of the
feed oil, with some measured values 0.03 – 0.24o less than 13
o API for the feed oil. The
decreased API gravity compared to that of the feed oil can be attributed to increased
macromolecular weight species such as asphaltenes in the oil produced (Javadli and Klerk,
2012; Hart, et al., 2012). The strong acid sites of the alumina were responsible for cracking
reaction which improved the API gravity of the oil produced at the early hours of operation.
However, this resulted in a drastic change in composition towards the lighter end
hydrocarbons within the reaction environment. This shift in composition could have caused
asphaltenes aggregation, polymerisation and condensation to form large molecular weight
compounds, thus leading to the decrease in API gravity and subsequent increase in the

Chapter 6: Effect of Guard Bed on CAPRI Upgrading
172
viscosity of the oil produced with time-on-stream (Guangshou, et al., 2009). To confirm this,
the asphaltenes content of the produced oil after 400 minutes was measured. It was found to
be 0.4 to 0.8 wt.% higher than 11.14 wt.% (feed oil), which confirms asphaltenes precipitation
and aggregation.
From the results presented in Figures 6.1 (a) and (b), it is clear that AC gave better
performance than alumina. Notably, produced oil samples have an average API gravities of
5.6 ± 1.6o for AC on top of Co-Mo/Al2O3 catalyst compared to 3.44 ± 1.54
o achieved upon the
use of alumina. This is because of the difference in material properties, in particular it was
noted that AC was neutral and alumina acidic.
6.2.2 Effect of Guard Bed on Viscosity
Lowering heavy oil viscosity significantly decreases the energy requirements for
pumping. The viscosity of the produced oil samples versus time-on-stream for the Co-
Mo/Al2O3 catalyst only, AC only, alumina only, and AC/alumina guard bed with Co-
Mo/Al2O3 catalyst are shown in Figures 6.2 (a) and (b), respectively. It is clear that the
viscosity of the produced oils in all cases was significantly lower than 0.5 Pa.s (feed oil). The
standard deviation for duplicate runs is within ± 0.06.
It has been shown in previous chapters that the viscosity reduction can be attributed to
the increase in the lighter hydrocarbon components in the produced oil as a result of the
conversion of heavy molecular weight (i.e., boiling point < 343 oC) into lower fractions. It is
clear therefore that Co-Mo/Al2O3 catalyst with AC guard-bed on top produced oil with lower
viscosity than with Co-Mo/Al2O3 catalyst and AC only (see Figure 6.2a).

Chapter 6: Effect of Guard Bed on CAPRI Upgrading
173
(a)
(b)
Figure 6.2 Viscosity of produced oil samples as a function of time-on-stream for Co-
Mo/Al2O3 only, AC only, alumina only, and Co-Mo/Al2O3 with (a) AC and (b) alumina;
Temperature 425 °C, Reaction Media N2, Pressure 20 barg, Oil flow rate 1mL.min-1
, Gas flow
rate 500 mL.min-1
.
0
0.1
0.2
0.3
0.4
0.5
0.6
0 200 400 600 800 1000 1200
Vis
cosi
ty (
Pa.s
)
Time-on-stream (minutes)
Feed Oil
CoMo
Activated carbon (AC)
AC+ CoMo
0
0.1
0.2
0.3
0.4
0.5
0.6
0 200 400 600 800 1000 1200
Vis
cosi
ty (
Pa.s
)
Time-on-stream (minutes)
Feed Oil
CoMo
Alumina
Alumina + CoMo

Chapter 6: Effect of Guard Bed on CAPRI Upgrading
174
This result is consistent with that reported in Figure 6.1a for API gravity of the
produced oil samples for the same system. The average viscosity of the produced oil in 20
hours is approximately 0.052 Pa.s with AC only, 0.094 Pa.s with Co-Mo/Al2O3 only, and
0.048 Pa.s with AC plus Co-Mo/Al2O3, respectively compared to 0.49 Pa.s (feed oil). This
represents a viscosity reduction of 81% (Co-Mo/Al2O3 only), whereas with AC on top of Co-
Mo/Al2O3 viscosity reduction was 89.5% in the same time of operation. Hence, an additional
8.5% decrease in the produced oil viscosity occurred upon the use of AC guard-bed plus Co-
Mo/Al2O3 catalyst.
The larger viscosity reduction is evident from Figure 6.2 (or API gravity increase from
Figure 6.1) upon the addition of the guard bed compared with only Co-Mo/Al2O3 catalyst.
The improved upgrading with guard bed is thought to occur largely because macro-molecules
and coke precursors in the feed oil could have been adsorbed onto the AC due to its affinity
for asphaltenes and resins (Ming, et al., 2007). As a result relatively less complex molecules
proceed from the AC guard bed on to the Co-Mo/Al2O3 catalyst bed where they are cracked.
This statement is further supported by the fact that neither the AC guard-bed nor the Co-
Mo/Al2O3 catalyst achieved the higher upgrading on its own. The guard-bed acted as a sieve
and allowed the diffusion of less complex molecules through into the catalytic pellet active
sites of the main catalyst bed. In this scenario, the catalyst therefore exhibits better metal
retention capacity and asphaltenes cracking than when used without the guard bed. This
therefore prevents premature plugging of the catalyst pore network and allows effective use of
surface area and metals (Rana, et al., 2007; Hart, et al., 2012).
The effect of using alumina support as an alternative material for the guard bed is
presented in Figure 6.2 (b) at the same conditions. The result shows that the viscosity of the
produced oil samples was sustained below 0.1 Pa.s up to 400 minutes (alumina plus Co-

Chapter 6: Effect of Guard Bed on CAPRI Upgrading
175
Mo/Al2O3), while that of the Co-Mo/Al2O3 and alumina only lasted for 360 and 320 minutes,
respectively. This represents a gain in 40 minutes at the early hours of operation. The cracking
activity of the alumina guard bed was dominant because of its number and strength of acid
sites (Leyva, et al., 2007). However, at the end of 20 hours time-on-stream, the average
degree of viscosity reduction for the alumina guard bed with Co-Mo/Al2O3 catalyst, alumina
only and Co-Mo/Al2O3 catalyst only are 73.9, 67.5, and 80.8%, respectively. This showed that
in terms of viscosity reduction for the same time-on-stream operation the Co-Mo/Al2O3
improved the flow properties of the produced oil by approximately 7% compared to the
integrated alumina guard bed system. Higher levels of average upgrading were not observed
because of the premature deactivation caused by the plugging of the 8.2 nm pore mouths of
the alumina as a result of deposition of the by-product coke. Secondly, the precipitation of
asphaltenes and regrouping of free radicals to form larger molecular weight species lead to the
decreased API gravity and increased viscosity of the produced oils observed beyond 400
minutes (see Figures 6.1b and 6.2b). Therefore, a neutral material like AC performed better as
guard bed than acidic material such as alumina based on the above results. This is because
acid sites are prone to fast deactivation within a short time due to carbon and metal deposition
(Leyva, et al., 2007).
6.2.3 Effect of Guard Bed on TBP Distribution
The TBP distribution curves obtained from SIMDIS of selected samples from Co-
Mo/Al2O3 only, alumina only, AC only, and AC or alumina on top of Co-Mo/Al2O3 with that
of the feed oil for comparison are presented in Figure 6.3. It is obvious that the TBP curves of
the produced oil samples in all cases shifted to the left of the feedstock TBP distribution
Chapter 6: Effect of Guard Bed on CAPRI Upgrading
176
curve. This shows increased low-boiling fractions in the produced oils. For instance the yield
of cumulative amount of 60 vol.% from the feedstock SIMDIS occurs at a temperature of
402oC, but after upgrading was performed with Co-Mo/Al2O3, AC, and alumina each as
standalone the boiling temperature shifted to the left to values of 339, 379, and 358 oC,
respectively for the same 60 vol.% yield. The temperature shifts observed therefore are 23 oC
(AC only), 44 oC (alumina only) and 63
oC (Co-Mo/Al2O3 only) to the left indicating
increased low-boiling fractions in the produced oil. However, when AC and alumina was used
on top of Co-Mo/Al2O3 catalyst as guard bed the temperature shifted from 339oC (Co-
Mo/Al2O3 only) to 334 oC (AC plus Co-Mo/Al2O3) and 336
oC (alumina plus Co-Mo/Al2O3).
This represents respectively 3 and 5 oC temperature shift towards the low-boiling fractions.
It can be observed that the guard bed combination with the Co-Mo/Al2O3 catalyst does
not differ significantly in the boiling point ranges from the experiment where only Co-
Mo/Al2O3 catalyst was used. In fact they are almost identical (see Figure 6.3). The sieve like
character of the AC guard-bed can further be evident from the fact that AC bed is neutral and
therefore does not perform cracking functions as does the alumina, instead the upgrading
observed is only due to adsorbed macro-molecules and thermal cracking reactions. The
SIMDIS curves provide conclusive proof to this statement where both the Co-Mo/Al2O3 and
AC with Co-Mo/Al2O3 TBP distribution were almost identical, suggesting no chemical role of
the guard bed.

Chapter 6: Effect of Guard Bed on CAPRI Upgrading
177
Figure 6.3 TBP distribution curves of feed and produced oils for guard bed integrated with
catalyst, Co-Mo/Al2O3 catalyst only, Alumina only; AC only, AC + Co-Mo/Al2O3, and
alumina + Co-Mo/Al2O3 catalysts; Temperature 425 °C, Reaction Media (N2), Pressure 20
barg, Oil flow rate 1mL.min-1
, Gas flow rate 500mL.min-1
.
6.2.4 Effect of AC Guard Bed on Asphaltenes, Sulphur and Metals Contents
The results presented in previous sections showed that the AC performed
better than alumina as a guard bed material. The asphaltene, sulphur and metals content of the
produced oil from the use of Co-Mo/Al2O3 and AC on top of the Co-Mo/Al2O3 catalysts are
presented in Table 6.1. It can be seen that the sulphur content of the feed oil reduced from 3.8
to 3.55 wt.% with Co-Mo/Al2O3 only and 3.25 wt.% with AC on top of the Co-Mo/Al2O3
catalyst. It was also observed that the nickel plus vanadium (Ni + V) metals content decreased
from 206 to 186 ppm (Co-Mo/Al2O3 only) and 60 ppm (AC on top of Co-Mo/Al2O3 catalyst).
This indicates reduction of (Ni + V) content by 10 % (Co-Mo/Al2O3) and 70.9 % (AC + Co-
Mo/Al2O3), respectively. Additionally, other elements such as molybdenum, boron, iron, zinc,
and phosphorus reduced significantly with the use of AC guard bed on top of Co-Mo catalyst
0
20
40
60
80
100
0 100 200 300 400 500
Am
ount
dis
till
ed (
%)
Temperature (oC)
Feed oil
Alumina
CoMo
Alumina + CoMo
AC + CoMo
Activated carbon (AC)

Chapter 6: Effect of Guard Bed on CAPRI Upgrading
178
compared to the use of Co-Mo catalyst only. Notably, the level of Ni + V upon AC guard-bed
with Co-Mo/Al2O3 catalyst was significantly higher than the level of sulphur removed.
Table 6.1 Asphaltene, sulphur, and metals content before and after reaction with and without
activated carbon guard using Co-Mo/Al2O3 at 425 oC, 20 barg, 500 mLmL
-1 and feed oil-A.
Impurities Feedstock Co-Mo/Al2O3 AC + Co-Mo/Al2O3
Asphaltene (wt.%) 11.14 5.99 3.95
Aluminium (ppm) 6 7 < 1
Boron (ppm) 9 0.8 < 1
Cobalt (ppm) < 1 0 < 1
Iron (ppm) 36 10 1
Molybdenum (ppm) 6 3 1
Sodium (ppm) < 7 3 2
Nickel (ppm) 56 50 18
Vanadium (ppm) 150 136 42
Ni + V (ppm) 206 186 60
Phosphorus (ppm) 0.3 0.1 < 1.5
Sulphur (wt.%) 3.8 3.55 3.25
Silicon (ppm) 0.4 1 < 1
Zinc (ppm) 2 0.3 1
* Sulphur and metals content was performed by Intertek Laboratories Sunbury Technology
Centre, UK, using ICP-OES (Inductively Coupled Plasma Optical Emission Spectrometry)
The deasphalting and/or cracking of asphaltenes into smaller molecules will reduce the
sulphur as well as the metal content of the produced oil. Moreover, Ancheyta, et al. (2002)
and Ancheyta (2011) found that higher asphaltene content in crude oil correlate with higher
metals content; however pointed out that sulphur and nitrogen are very much present in light
hydrocarbons. For this reason sulphur removal was low even though AC was used on-top of
Co-Mo/Al2O3 catalyst. Ferreira et al. (2012) studied the reactivity of vacuum residue towards

Chapter 6: Effect of Guard Bed on CAPRI Upgrading
179
HDS and HDM and it was found that HDS and HDM are not only controlled by process
conditions and catalyst properties, but also the concentration and size of the heavy molecules
such as asphaltenes and resins. Therefore, the low removal of sulphur and metals (i.e., Ni +
V) when only Co-Mo/alumina catalyst was used is thought to be due to high concentration of
asphaltenes in the heavy oil. However, the integration of AC guard-bed could also act as a
hydrogen transfer agent in hydrocarbon cracking in addition to selective adsorption of
macromolecules leading to high sulphur and metals removal (Dockner, 1988).
Consequently, the asphaltenes (nC7) content decreased from 5.99 wt.% (Co-
Mo/Al2O3) to 3.95 wt.% upon the use of AC on-top of the Co-Mo/Al2O3 catalyst because
some of the high molecular weight species such as asphaltenes, resins and other heavy
molecules were adsorbed onto the AC. This implies that lighter and less complex molecular
weight species are processed onto the catalyst bed, which is easier to crack in order to remove
the contaminants associated with the molecule (Hart, et al., 2013). This is confirmed as the
produced oil from AC plus Co-Mo/Al2O3 catalyst contain less asphaltene and heavy metals
components as also observed in the additional 2o increment in API gravity and 8.5% further
reduction of viscosity.
6.2.5 The Role of AC and Alumina Guard Bed
It is well known that the acid sites of the Co-Mo/Al2O3 promote cracking reactions. To
elucidate the role of the AC or alumina in the heavy oil upgrading, TGA profile (i.e., weight
loss as a function of temperature plot) and derivative weight loss curve for the recovered AC
and alumina used as guard-bed superimposed with asphaltenes separated using n-C7 is shown
in Figure 6.4 (a) and (b). Clearly, the asphaltenes burn-off range 420-600 oC (see Figure 6.4a).
From Figure 6.4 (a), the deposits of larger molecular weight compounds (e.g., resins and

Chapter 6: Effect of Guard Bed on CAPRI Upgrading
180
asphaltenes) onto the AC bed was determined as 31 wt. %, which burns-off in the same
temperature range of 440-600 oC. This shows that some of the macro-molecules have been
adsorbed by AC prior to catalytic upgrading.
(a)
(b)
Figure 6.4 TGA and DTG of (a) fresh and spent AC and separated asphaltenes (Asph.); (b)
alumina, used as guard bed placed on top of the Co-Mo/Al2O3 catalyst; Temperature 425 °C,
Reaction Media (N2), Pressure 20 barg, Oil flow rate 1 mL.min-1
, Gas flow rate 500 mL.min-1
.
-6.0
-5.0
-4.0
-3.0
-2.0
-1.0
0.0
1.0
-10
10
30
50
70
90
110
0 200 400 600 800 1000
Dif
fere
nti
al
wei
ght
loss
(%
/oC
)
Wei
ght
loss
(w
t.%
)
Temperature (oC)
TG Spent AC
TG of Asph.
TG Fresh AC
DTG Fresh AC
DTG of asph.
DTG Spent AC
-1.0
-0.8
-0.6
-0.4
-0.2
0.0
0.2
0
20
40
60
80
100
0 200 400 600 800
Dif
fere
nti
al
wei
ght
loss
(%
/oC
)
Wei
ght
loss
(w
t.%
)
Temperature (oC)
TG Alumina
DTG Alumina

Chapter 6: Effect of Guard Bed on CAPRI Upgrading
181
Referring again to Figure 6.4 (b), the peaks between 476-600oC represent burn-off of
asphaltenes and sediments deposited on the alumina bed, which accounts for 9.8 wt.%, while
the burn-off between 600-800 oC represents coke, which accounts for 17.6 wt.% loss of
weight. The presence of coke on the alumina however indicates its propensity for cracking
activity due to the acid sites, which was not the case in the use of neutral AC. Therefore, the
macroporous and mesoporous characteristics of the AC were thought to have played critical
roles in the adsorption by allowing the passage of small molecules and hydrocarbon free
radicals generated by thermal cracking of adsorbed asphaltenes to reach the catalyst bed,
thereby limiting polycondensation reaction (Viet, et al., 2012; 2013).
6.3 Effect of Hydrogen-addition and AC Guard Bed
In Chapter 5 it was shown that hydrogen-addition improved API gravity, viscosity and the
conversion level. In this section, the combined effect of hydrogen-addition and AC guard-bed
was investigated using cylindrical Ni-Mo/Al2O3 at temperature 425 oC, pressure 20 barg,
H2/oil ratio 200 mL.mL-1
and feed oil-B.
6.3.1 Effect on API gravity and Viscosity
The API gravity and the viscosity of the produced upgraded oil as a function time-on-
stream for the three scenarios are shown in Figures 6.5 (a) and (b), respectively. From Figure
6.5 (a), the API gravity of the produced oil for all of the three runs increased by ~1 to 6o API
depending on the use of AC guard-bed, nitrogen or hydrogen, as compared to the original feed
oil 14o. The API gravity of the produced oil with cylindrical Ni-Mo/Al2O3 only started from
roughly 3o rise and falls to 1
o in 200 minutes, thereafter settles at an average of 1.7 ± 0.74
o API
under nitrogen as the reaction media. Under the same nitrogen atmosphere, with AC on top of

Chapter 6: Effect of Guard Bed on CAPRI Upgrading
182
the cylindrical Ni-Mo/Al2O3 catalyst the API gravity was raised to 5o before settling at an
average of 3.15 ± 1.22o. This indicates 1.45
o further increase in API gravity.
(a)
(b)
Figure 6.5 (a) Change in API gravity and (b) viscosity of produced oil using Ni-Mo/Al2O3
only, AC guard bed on top of the Ni-Mo/Al2O3 catalyst; Temperature 425 °C, Reaction Media
H2 or N2, Pressure 20 barg, Oil flow rate 1mL.min-1
, Gas flow rate 200 mL.mL-1
.

Chapter 6: Effect of Guard Bed on CAPRI Upgrading
183
The combined effect of hydrogen atmosphere with AC on top of the Ni-Mo/Al2O3
catalyst can be observed in Figure 6.6 (a), from which it can be seen that the increment in API
gravity was more stable than the other investigated conditions, with most data points at 4o
with an average 3.93 ± 0.82o for 12 hours time-on-stream. This is approximately 1
o above that
obtained when nitrogen was used as reaction media with AC plus Ni-Mo/Al2O3 catalyst.
From Figure 6.5 (b) the average DVR after 12 hours time-on-stream operation are 81.5
% (Ni-Mo/Al2O3 only under N2 media), 88.5 % (AC guard bed with Ni-Mo/Al2O3 under N2
media), and 91.3 % (AC guard bed with Ni-Mo/Al2O3 under H2 media) less than 1.091 Pa.s
(feed oil-B). Therefore, it could be concluded that hydrogen-addition further reduced the
viscosity by 2.8 % compared with that obtained with AC on top of Ni-Mo/Al2O3 catalyst
under N2 media. This is in line with previous results on the effect of hydrogen on upgrading
(Chapter 5 and Section 5.3) and also with the 1o API gravity rise presented in Figure 6.5a.
In the reaction environment cracking occurs as the carbon-carbon bond generate
radicals that take part in abstraction of hydrogen, radical intermediate rearrangement, radical
termination, or another β-scission propagation step to form other active hydrocarbon chains
with products covering a range of lower molecular weight than the starting molecule.
However, if the radical reacts with another radical via an addition-reaction then an adduct
radical of larger molecular size will be formed (Habib, et al., 2013). This adduct radical
intermediate may undergo cracking, abstract-hydrogen, or radical termination to a bigger
molecule. The ability of the generated radicals to undergo addition-reaction to form adducts
with larger molecular weight than the starting hydrocarbon has been reported by Gray and
McCaffrey (2002). Under an inert environment such as nitrogen these reactions are favoured
(Savage, et al., 1988). This type of reaction however decreases the yield of low-boiling
components with the produced oil characterised by low-API gravity and high viscosity. In the

Chapter 6: Effect of Guard Bed on CAPRI Upgrading
184
light of this, the higher API gravity and lower viscosity under hydrogen atmosphere suggests
the suppression of addition-reactions between free radicals and olefins formed from
hydrogen-abstraction or β-carbon cleavage (Habib, et al., 2013). Hydrogenation of cracked
olefins and radicals would have decreased their concentration, lower the extent of addition-
reactions, as well as inhibit macromolecules formation (Hashemi, et al., 2013; Speight, 2011).
Consequently, adduct formation leads eventually to coke formation. In addition, Viet et al.
(2012) found that AC act as a hydrogen transfer mediator in the catalytic hydrocracking of
heavy oil which leads to high conversion high-boiling components into low-boiling fractions.
Convincingly, the synergistic effect of the AC guard-bed and hydrogen-addition to catalytic
cracking improved the physical and flow properties of the produced oil relative to the feed oil.
6.3.2 Effect on TBP Distribution
Heavy crude oil yields little of fuel distillates in the range of 10-30% with BP below
343oC. In this respect, upgrading converts most of the high-boiling fractions with BP greater
than 343oC into valuable fuel fractions. The SIMDIS was performed using the integrated PTV
injector and Agilent 6850N gas chromatography according to the ASTM-2887-08. The TBP
distribution curves showing the effect of hydrogen-addition with AC guard bed on top of Ni-
Mo/Al2O3 catalyst are presented in Figure 6.6.

Chapter 6: Effect of Guard Bed on CAPRI Upgrading
185
Figure 6.6 TBP distribution curves of feed and produced oil using Ni-Mo/Al2O3 only, AC
used as guard bed placed on top of the Ni-Mo/Al2O3 catalyst; Temperature 425 °C, Reaction
Media H2 or N2, Pressure 20 barg, Oil flow rate 1mL.min-1
, Gas flow rate 200 mL.mL-1
.
The accumulative amount distilled at the boiling temperature of 200oC was 58% (feed oil-B).
However, at the same boiling temperature the produced oil amount distilled is 60 % (Ni-
Mo/Al2O3 only under N2 media), 67 % (AC on top of Ni-Mo/Al2O3 under N2 media) and 71.4
% (AC with Ni-Mo/Al2O3 catalyst under H2 media). This represents 2, 9, and 13.4% upward
shift of the cumulative amount distilled at the same boiling temperature of 200 oC, due to
increased low-boiling fractions in the oil produced.
6.3.3 Effect on Produced Gas Composition
The off-gas composition during catalytic upgrading process can be classified into H2,
permanent gases (e.g., CO, CO2, H2S, etc), paraffins (C1-C5), isoparaffins (i-C4), and olefins
(C1-C4). In Table 6.2, the produced gas composition using AC with Ni-Mo/Al2O3 catalysts
0
20
40
60
80
100
120
0 50 100 150 200 250 300 350 400 450
Am
ount
dis
till
ed (
vo
l.%
)
Temperature (oC)
THAI Feed Oil-B
NiMo/alumina (Nitrogen)
AC + NiMo/alumina (Nitrogen)
AC + NiMo/alumina (Hydrogen)

Chapter 6: Effect of Guard Bed on CAPRI Upgrading
186
under hydrogen and nitrogen reaction gas is presented. It is clear that the use of hydrogen
increased the yield of light saturated hydrocarbon gases such as methane, ethane, propane,
butane, and pentane while their corresponding olefins were decreased as a result of
hydrogenation reaction in the presence of bi-functional Ni-Mo/Al2O3 catalyst. Consequently,
the use of hydrogen increased the paraffinic gas content from 13.16% (use of nitrogen gas) to
25.85% and subsequently reduced the olefinic content from 0.25% (use of nitrogen gas) to
0.06%.
Table 6.2 Produced gas composition during catalytic upgrading process under nitrogen and
hydrogen atmospheres using AC with Ni-Mo/Al2O3 catalyst at temperature 425 oC, pressure
20 barg, gas/oil ratio 200 mL.mL-1
.
Gas
AC + Ni-Mo/Al2O3 (N2)
(vol.%)
AC + Ni-Mo/Al2O3 (H2)
(vol.%)
Methane 12.1 24.6
Hydrogen 5.15 (61.23)
Ethane 0.54 0.63
Carbon dioxide 2.54 4.13
Ethene 0.04 0.00
Propane 0.12 0.13
Propene 0.14 0.05
i-Butane 0.16 0.21
n-Butane 0.05 0.06
1-Butene 0.05 0.01
Cis-2-butene 0.00 0.00
Trans-2-butene 0.02 0.00
n-Pentane 0.12 0.014
i-Pentane 0.08 0.11
Carbon monoxide 0.65 0.52
Hydrogen sulphide 0.00041 0.0006

Chapter 6: Effect of Guard Bed on CAPRI Upgrading
187
It is known that the olefins are the most reactive class of hydrocarbons in the presence
of catalyst and readily undergo polymerisation as well as condensation reactions to give
aromatic species which are known coke precursors (Speight, 2011). Therefore, hydrogen-
addition has helped to saturate some of the olefins and aromatics to produce more paraffins,
thereby yielding more low-molecular weight components that improved API gravity,
viscosity, and the yield of fuel distillates.
It is noteworthy that the amount of produced H2S in the gas increased from 0.00041 %
(N2 reaction gas) to 0.0006 % (H2 reaction gas), that is 31.7% increase under hydrogen
atmosphere. This is indicative of increased HDS reaction as a result of excess hydrogen in the
reaction environment. Subsequently, the gas generated via cracking reactions during the in-
situ catalytic upgrading process can act as a solution gas drive to push the oil from the pore
matrix into the producer well (Alpak, et al., 2013).
6.3.4 Effect on Asphaltenes content
The asphaltene component contributes greatly to high density/low-API-gravity and
high viscosity of the heavy oil. The produced oil asphaltenes content was measured using n-
C7 solvent separation and presented in Table 6.3. After upgrading over Ni-Mo/Al2O3 catalyst
only the produced oil asphaltenes content reduced from 10.3 wt% (feed oil) to 8.3 wt%, but
the addition of AC on top of Ni-Mo/Al2O3 catalyst caused further reduction of 2 wt.%
(nitrogen atmosphere) and subsequently 6.3 wt.% (hydrogen atmosphere).

Chapter 6: Effect of Guard Bed on CAPRI Upgrading
188
Table 6.3 Asphaltene content of oil produced with cylindrical Ni-Mo/Al2O3 catalyst only and
with AC guard bed under nitrogen or hydrogen addition at 425 oC, 20 barg, and gas-to-oil
ratio 200 mL.mL-1
.
System
Reaction
media
Aspaltene content
(wt.%)
Conversion (343 oC+)
(%)
Feed oil-B NA 10.3 ± 0.6 NA
Ni-Mo/Al2O3 N2 8.3 ± 0.4 12.3
AC + Ni-Mo/Al2O3 N2 6.1 ± 0.4 43.8
AC + Ni-Mo/Al2O3 H2 2.0 ± 0.8 77.7
This 4 wt.% further decrease in asphaltenes content under hydrogen can be attributed
to the synergistic effect of AC guard-bed and hydrogen. While the AC guard-bed filters out
the macromolecules before catalytic cracking, the hydrogen saturate the generated cracked
fragments, thus suppressing their recombination to large molecular weight compounds.
6.4 Conclusions
It has been demonstrated that the use of a neutral material such as activated carbon as
guard bed could selectively filters out some macromolecules such as asphaltenes and resins
that are responsible for catalyst pores plugging and coke formation. Also, impurities such as
asphaltenes and metals (e.g., Ni, V, etc.) in the feedstock were extensively decreased in the
produced oil. Additionally, the produced oil API gravity and viscosity are further improved
by ~1-3o and 6.8 %, respectively above that obtained with a standalone refinery catalyst.
However, the TBP distribution curves shows that the chemistry of the upgrading reactions
was not altered by the AC guard-bed. Secondly, the synergistic effect of AC guard-bed and
hydrogen however further reduced the produced oil asphaltenes content compared to that
produced under nitrogen atmosphere.

Chapter 7: Coke and Metal Deposition Analysis
189
Chapter 7
Coke and Metals Deposition Analysis
7.1 Introduction
Coke formation is a complicated process involving chemical reactions, changes in
composition of the liquid medium, and thermodynamic behaviour (Speight, 1998). During the
catalytic upgrading, the formation of light liquid hydrocarbons causes instability in the
solubility parameter of the highly aromatic and polar species to separate from the oil phase as
an insoluble phase and deposits on the catalyst (Zhang and Shaw, 2006; Speight, 1998; Gray
et al., 2000). Once these highly aromatic compounds are deposited on the catalyst, reactions
that promote coke can occur, such as (Speight, 1998 &2011):
Cracking of side chains from aromatic hydrocarbons.
Dehydrogenation (i.e., the removal of hydrogen from the parent molecule) of
naphthenes to form aromatics.
Condensation of aliphatic structures to form aromatics.
Polymerisation and condensation of olefins.
Condensation of aromatics to form higher fused-ring aromatics.
Dimerisation or oligomerisation reactions.
The results in previous Chapters show that the API gravity of the produced oil decreases,
viscosity increases and yield of low-boiling distillates lowers with time-on-stream during the
heavy oil upgrading, which is thought to be mainly due to the deposition of carbon and
metals. In this Chapter, the effect of operating conditions, feedstock, hydrogen, and activated

Chapter 7: Coke and Metal Deposition Analysis
190
carbon guard-bed on the catalyst coke content is explored. Also, the catalyst deactivation rate
and coke content with time-on-stream were modelled using semi-empirical models and the
impurities deposited on the catalyst after upgrading reaction identified using SEM-EDX.
7.2 Effect of Reaction Temperature on Spent Catalyst Coke Content
Coke is one of the by-products of the upgrading reactions, which becomes adsorbed
on the acid sites of the catalysts. It consists of high-molecular weight poly-aromatic species,
hydrogen-deficient, non-volatile components and usually the main cause of catalyst
deactivation by fouling and poisoning active sites and or plugging catalyst pores (Wang and
Manos, 2007; Chen and Manos, 2004). In order to determine the start of coke burn-off, the
asphaltenes content of heavy oil was precipitated with n-heptane and thermogravimetric
analysis (TGA) performed. The TGA and DTG (differential thermogravimetric) of the
asphaltenes are presented in Figure 7.1. It is clear that the asphaltenes are completely burned-
off at a temperature of about 610 oC. This observation is in line with the findings of Douda et
al. (2004), Trejo et al. (2010) and Barman et al. (1997). They found that asphaltenes from
Maya heavy crude oil begin to volatilise and decompose at 410 oC and these processes end at
620 oC, which is consistent with the signal range observed in the DTG curve shown in Figure
7.1.

Chapter 7: Coke and Metal Deposition Analysis
191
Figure 7.1 TGA thermogram and DTG of asphaltenes precipitated with n-heptane.
Figure 7.2 (a) and (b) provides the TGA thermograms or weight loss curves as a
function of ramp temperature for the spent Co-Mo/Al2O3 and Ni-Mo/Al2O3 recovered
catalysts after the upgrading experiments. The ramp temperature increase enables the
interpretation of the different chemical changes occurring during the burn-off when compared
to the asphaltenes TGA and DTG curves. The isothermal temperature of 1000 oC towards the
end ensures that all carbon species are completely burnt off during the heating period.
However, above 620 oC (see Figure 7.1), the deposits on the spent catalysts are defined as
coke, because of the higher energy requirement to burn-off coke than asphaltenes.
Nonetheless, Murugan et al. (2009 and 2011) observed that the non-isothermal weight loss
during the combustion of the deposits on the spent catalyst especially coke in air atmosphere
is a complex phenomenon, with numerous reactions proceeding at the same time, from which
products include carbon oxide (COx), carbon monoxide and water, as expressed in the
following equation 7.1:
. (7.1)
-6
-5
-4
-3
-2
-1
0
1
-10
10
30
50
70
90
110
0 200 400 600 800 1000
Der
ivat
ive
wei
ght
loss
(%
/oC
)
Wei
ght
loss
(w
t.%
)
Temperature (oC)
TG of Asphaltene
DTG of asphaltene

Chapter 7: Coke and Metal Deposition Analysis
192
(a)
(b)
Figure 7.2 TGA and DTG of spent Co-Mo/Al2O3 (a) and Ni-Mo/Al2O3 (b) catalysts under
reaction temperatures of 350, 400, and 425 °C; Catalyst Co-Mo/Al2O3, Reaction Media N2,
Pressure 20 barg, Oil flow rate 1mL.min-1, Gas flow rate 500mL.mL-1
.

Chapter 7: Coke and Metal Deposition Analysis
193
Subsequently, to interpret the different stages during the heating period, the derivative
of the weight loss curve (DTG) was obtained as presented in Figure 7.2. Figure 7.2 shows that
the weight loss process of the spent catalyst can be divided into several steps; the region from
25 to 210 oC represents loss due to de-volatilisation of light oil, 210-620
oC represents burn-
off of macromolecules such as asphaltenes, resins, and sediments, and beyond 620 oC is coke.
Beside catalyst fouling and clogging, coke build up on the catalyst bed is one of the main
routes for deactivation and shortening of lifespan (Ali, et al., 2006). However, coke on the
catalysts has been described as evidence of catalytic cracking (Krumm, et al., 2011). The coke
content of the spent Co-Mo/alumina catalyst increased in the order 48.4, 53.5 and 57.3 wt.%
at 350, 400 and 425 oC. Whilst the coke content of spent Ni-Mo/alumina catalyst increased in
the order 37.2, 46.5, and 48.9 wt.%, respectively for 25 hours time-on-stream operation.
Notably the coke content of spent Co-Mo was higher than that of Ni-Mo catalyst due to its
stronger acid sites. A stronger acid site improves catalyst activity, but promotes high coke
formation and deactivation (Leyva, et al., 2007; Marafi and Stanilaus, 2001). Also, it can be
seen in Figure 7.2 that the coke formed at 350 oC started to burn-off at a lower temperature
compared to coke deposited on the spent catalysts at 400 oC and 425
oC. This observation is in
line with the report of Murugan et al. (2009) that coke formed at higher temperature has
higher molecular weight species with condensed structures of poly-aromatics, whereas those
formed at lower reaction temperature have less condensed structure (Ren, et al., 2007).
Consequently, Sanford (1994) has pointed out that during the earlier stages of coking
and hydrocracking reactions in residue conversion, C-C bonds are broken. At higher
temperatures of 425 °C and above the coking reactions become more predominant, which
accelerate catalyst deactivation and change in selectivity toward undesirable products i.e. coke
and gaseous species occurs (Yan, 1980; Furimsky and Massoth, 1999; Zhao, et al., 2001;

Chapter 7: Coke and Metal Deposition Analysis
194
Meng, et al., 2007). This is evident from the effect of reaction temperature on mass balance
where 4.34 % of products formed were gases at 425 °C compared to 1.96 % at 350 °C and
coke was 1.86 at 425 °C compared to only 0.64 % at 350 °C. This can be explained by the
fact that at higher temperatures bond scission of the side chains of compounds present in
crudes such as alkylaromatics increases and results in the formation of more coke, gases and
lower liquid products (Marafi, et al., 2008). This resulted in higher upgraded oil in terms of
increased API gravity and lowered viscosity as evident and also the TBP curve shift towards
low-boiling fractions as reaction temperature increased. However, deactivation caused by
coke is reversible and generally removed via oxidative regeneration.
7.3 Effect of WHSV on Spent Catalyst Coke content
The coke content of the spent Co-Mo/Al2O3 catalyst as a function of WHSV at 425 oC,
pressure 20 barg, nitrogen-to-oil flow ratio 500 mL.mL-1
, and 6 hours time-on-stream is
presented in Figure 7.3. It can be seen that coke deposition on the catalyst decreased as the
WHSV increases. A similar trend of the effect of WHSV on coke yield was reported by Li et
al. (2012 & 2013) for fluid catalytic cracking of heavy gas oil. This is because the conversion
of heavy hydrocarbon increases as the contact time between the oil and catalyst increase.
Notwithstanding, catalytic upgrading reactions are endothermic cracking reactions favoured
by high temperature and long contact time.

Chapter 7: Coke and Metal Deposition Analysis
195
Figure 7.3 Spent Co-Mo/Al2O3 catalyst coke content as a function WHSV at temperature
425oC, Reaction Media (N2), Pressure 20 barg, Oil flow rate 1 mL.min
-1, Gas flow rate
500mL.mL-1
.
In the light of this, improved upgraded oil obtained at high reaction temperature of 425 oC and
lower WHSV will result in more undesired side reactions leading to high coke and gas yields.
The result of higher API gravity and lower viscosity in produced oil is therefore accompanied
by high coke deposition on the catalyst and gas production, in order to elementally balance
the carbon and hydrogen distribution in the upgraded oil, coke, and gas (Gao, et al., 2012).
7.4 Effect of Hydrogen-addition on Spent Catalyst Coke content
It is well known that coke deposition on the catalyst decreases its activity and lifespan
due to active sites coverage. Figure 7.4 presents the amount of coke deposited on the Co-
Mo/Al2O3 catalyst after 25 hours time-on-stream operation under hydrogen or nitrogen
atmosphere. From the TGA curves the coke content was 52.4 wt.% (nitrogen atmosphere) and

Chapter 7: Coke and Metal Deposition Analysis
196
35 wt.% (hydrogen atmosphere). This represents 17 wt.% spent coke content reduction under
a hydrogen environment.
Figure 7.4 TGA and DTG of spent catalyst Co-Mo/Al2O3 obtained after reaction from CAPRI
reactor with and without hydrogen-addition; Temperature 425 °C, Reaction Media H2 and N2,
Pressure 20 barg, Oil flow rate 1mL.min-1
, Gas flow rate 200mL.mL-1
.
Coke precursors such as poly-aromatics, olefins, radicals of resins and asphaltenes
macromolecules become adsorbed on the catalyst active sites and slowly form protocoke (i.e.,
large sediments commonly called soft coke) via polymerisation and condensation reactions
and subsequently through dehydrogenation reactions to coke, as illustrated in equation 7.2
(Liu, et al., 2003):
(7.2)
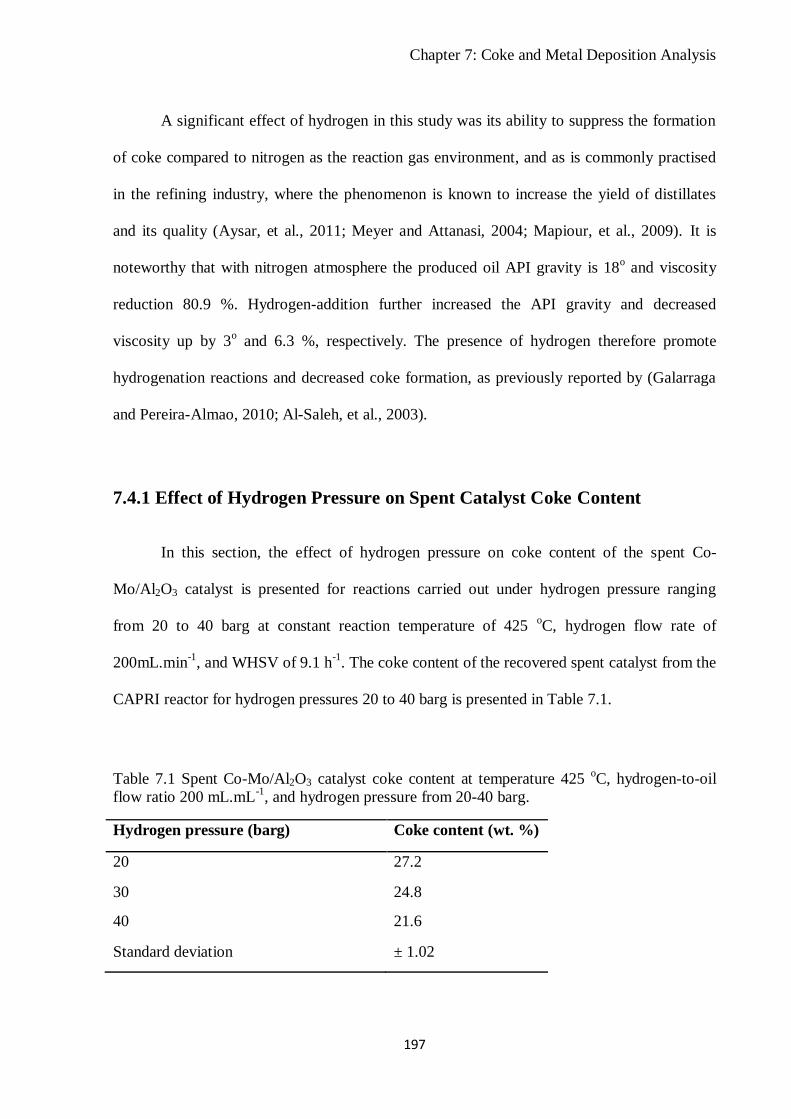
Chapter 7: Coke and Metal Deposition Analysis
197
A significant effect of hydrogen in this study was its ability to suppress the formation
of coke compared to nitrogen as the reaction gas environment, and as is commonly practised
in the refining industry, where the phenomenon is known to increase the yield of distillates
and its quality (Aysar, et al., 2011; Meyer and Attanasi, 2004; Mapiour, et al., 2009). It is
noteworthy that with nitrogen atmosphere the produced oil API gravity is 18o and viscosity
reduction 80.9 %. Hydrogen-addition further increased the API gravity and decreased
viscosity up by 3o and 6.3 %, respectively. The presence of hydrogen therefore promote
hydrogenation reactions and decreased coke formation, as previously reported by (Galarraga
and Pereira-Almao, 2010; Al-Saleh, et al., 2003).
7.4.1 Effect of Hydrogen Pressure on Spent Catalyst Coke Content
In this section, the effect of hydrogen pressure on coke content of the spent Co-
Mo/Al2O3 catalyst is presented for reactions carried out under hydrogen pressure ranging
from 20 to 40 barg at constant reaction temperature of 425 oC, hydrogen flow rate of
200mL.min-1
, and WHSV of 9.1 h-1
. The coke content of the recovered spent catalyst from the
CAPRI reactor for hydrogen pressures 20 to 40 barg is presented in Table 7.1.
Table 7.1 Spent Co-Mo/Al2O3 catalyst coke content at temperature 425 oC, hydrogen-to-oil
flow ratio 200 mL.mL-1
, and hydrogen pressure from 20-40 barg.
Hydrogen pressure (barg) Coke content (wt. %)
20 27.2
30 24.8
40 21.6
Standard deviation ± 1.02

Chapter 7: Coke and Metal Deposition Analysis
198
It can be seen that the coke content of the spent catalyst decreased as the hydrogen
pressure increased from 20 to 40 bar, indicating that higher hydrogen pressure can effectively
suppress coke formation. From Table 7.1 every 10 bar rise in hydrogen pressure produced
approximately 2 wt.% decrease in coke. Zhang and Shaw (2006) and Matsumura et al. (2005)
observed a similar trend in coke content of the catalyst as hydrogen pressure increased. This
can be attributed to the increase hydrogen solubility with pressure rise. At a higher hydrogen
pressure more hydrogen is soluble in the reaction medium, therefore increasing its availability
on the catalyst surface for hydrogenation and hydrocracking reactions (Al-Mutairi and Marafi,
2012; Cai, et al., 2001; Mapiour et al., 2010). Consequently, it has been reported that high
hydrogen pressure thermodynamically favours hydrogenation reactions (Al-Mutairi and
Marafi, 2012). Since less coke is formed in hydrogen-addition, loss of the catalyst surface
area, pore volume and active sites comparatively lower compared to the use of nitrogen.
7.4.2 Empirical Model of Catalyst Coke Content
The catalytic coke is the by-product of cracked hydrocarbons on the acid sites of the
catalyst. Therefore, it is necessary to understand coke deposition and its deactivation effect.
Voorhies (1945) reported that catalyst coke content is a function of time-on-stream in a fixed-
bed reactor at given condition, as defined by equation (7.3):
Cc = A.tn (7.3)
where; A and n are constant depending on catalyst, feedstock, and reaction temperature, Cc is
coke on catalyst and t is time-on-stream.

Chapter 7: Coke and Metal Deposition Analysis
199
Figure 7.5 depicts the correlation between experimental data and the Voorhies model
for catalyst coke content as a function of time-on-stream during upgrading reaction using Co-
Mo/Al2O3 at 425 oC reaction temperature, under nitrogen and hydrogen reaction media. Each
data point on the chart represents an experimental run in duplicate on a fresh batch of catalyst
for both nitrogen and hydrogen reaction media.
Figure 7.5 Co-Mo/Al2O3 catalyst coke content as a function of time-on-stream during
upgrading reaction in N2 or H2 reaction media at temperature 425 oC, pressure 20 barg, oil
flow rate 1 mL.min-1
, gas flow rate 200 mL.mL-1
and feed oil-B; (A) in N2 model (i.e., Cc =
4.661t0.306
) and (B) in H2 Model (Cc = 4.097t0.296
).
It is clear that the initial coke formation is rapid followed by progressive build-up with
time-on-stream. A similar trend in coke formation with time was reported by Maity et al.
(2012). The high coke formation observed at the early hours of the upgrading reactions can be
explained by high catalytic activity and acidity which result in high cracking rate, as reflected
in the early upgraded oil samples which showed high API gravity and low viscosity.
However, this rapid coke formation caused deactivation which lowers the cracking activity, as

Chapter 7: Coke and Metal Deposition Analysis
200
well as decreases the rate of coke formation with time (Garcia-Dopico, et al., 2006; Sun, et
al., 2010). Unlike nitrogen atmosphere, the generated active hydrogen under hydrogen
atmosphere hampers the progressive addition-reaction that leads to coke (Bagheri, et al.,
2012). It can be clearly seen in Figure 7.5 that the key to reducing the impact of coke
formation on catalytic activity depends on the reduction in amount of initial coke formed.
7.4.3 Catalyst Deactivation Rate
Catalyst deactivation is a combined effect of coke, metal and hetero-atoms (e.g., S, N,
etc.) deposits during upgrading reactions. The rate of catalyst deactivation has been defined
by Chen and Hsu (1997), Hollander, et al. (1998) and Maity et al. (2012) using equation (7.4):
Xt = Xoexp(-b.tn) (7.4)
where; Xt is the conversion of heavy fraction (> 343 oC) at time t, Xo is the initial conversion,
and b is the deactivation rate constant (s-1
), n = 1 (Chen and Hsu, 1997).
In Figure 7.6, the plot of –ln(Xt/Xo) against time-on-stream for Co-Mo/alumina
catalyst at 350, 400, and 425 oC under nitrogen media is presented. The correlation coefficient
between the data and equation (7.4) is 0.98.
A higher value of b (i.e., deactivation rate constant) implies faster deactivation of the
catalyst. As the reaction temperature increased from 350 to 425 oC, the value of b increases as
thus 0.077, 0.082 and 0.085 s-1
. It can be seen from the above values that the deactivation rate
at 425 oC reaction temperatures is slightly faster than that of 350 and 400
oC. Conspicuously,
in a fixed-bed system, the instantaneous conversion decreases with time-on-stream as the
catalyst becomes fouled and poisoned with coke and metal deposits (Voorhies, 1945; Chen

Chapter 7: Coke and Metal Deposition Analysis
201
and Hsu, 1997; Maity, et al., 2012). This progressive decrease of the catalysts activity is
called deactivation rate, which resulted in decreased API gravity and increased viscosity of
upgraded oils samples with time-on-stream.
Time-on-stream (hour)
0 2 4 6 8 10 12 14 16 18 20
-ln(
Xt/X
o)
0.0
0.2
0.4
0.6
0.8
1.0
1.2
1.4
1.6
1.8
CoMo 425oC
-ln(Xt/X
o) = 0.085t
CoMo 350oC
-ln(Xt/X
o) = 0.077t
CoMo 400oC
-ln(Xt/X
o) = 0.082t
Figure 7.6 Conversion vs. time-on-stream as a function of activity Co-Mo/Al2O3 catalyst at
temperatures 350, 400, and 425 oC, constant pressure 20 barg and N2/oil ratio 500 mL.mL
-1.
7.4.4 Nitrogen Adsorption-Desorption of Fresh and Spent Catalyst
The nitrogen sorption isotherms of the fresh and spent catalysts were analysed using
BET theory. The analysed spent catalysts were collected from the centre of the fixed-bed
reactor. The adsorption-desorption isotherm of the fresh and spent Co-Mo/Al2O3 and Ni-
Mo/Al2O3 catalysts are compared for the nitrogen and hydrogen atmospheres after the
upgrading experiment, as shown in Figures 7.7a, b and c.

Chapter 7: Coke and Metal Deposition Analysis
202
(a)
(b)
Relative Pressure (P/Po)
0.0 0.2 0.4 0.6 0.8 1.0 1.2
Vo
lum
e A
ds
orb
ed
Fre
sh
Co
Mo
(c
m3.g
-1)
0
50
100
150
200
250
300
350
Vo
lum
e A
ds
orb
ed
Sp
en
t C
oM
o (
cm
3.g
-1)
0.0
0.1
0.2
0.3
0.4
0.5
Fresh CoMo
Spent CoMo+N2 at 425°C

Chapter 7: Coke and Metal Deposition Analysis
203
(c)
Figure 7.7 Fresh and spent (at 425 °C reaction temperature) Co-Mo and Ni-Mo catalysts
adsorption-desorption isotherm (a) fresh and spent Co-Mo under nitrogen atmosphere, (b)
fresh and spent Ni-Mo under nitrogen atmosphere, and (c) fresh and spent Co-Mo under
hydrogen environment; Temperature 425 oC, Reaction Media H2 or N2, Pressure 20 barg, Oil
flow rate 1mL.min-1
, Gas flow rate 200mL.mL-1
.
The adsorption-desorption curve reveals a large hysteresis loop in the isotherm
indicative of the type IV which is associated with meso-pores for the fresh Co-Mo and Ni-Mo
catalysts. The adsorption-desorption curve reveals a large hysteresis loop in the isotherm of
the spent catalyst, which confirms deposits in the pores and blockage of active sites (Rana, et
al., 2008). The loss of surface area due to coke and metal deposits is approximately 99.9%
under nitrogen environment. Similar loss in surface area was reported in the literature by
Ancheyta et al. (2002). It is known that during the upgrading reaction hydrocarbon molecules
diffuse into the catalyst first before they are cracked into smaller molecules. While small
hydrocarbon components diffuses faster, the diffusion of macromolecules such as resins and
Relative Pressure (P/Po)
0.0 0.2 0.4 0.6 0.8 1.0 1.2
Vo
lum
e A
ds
orb
ed
Fre
sh
Co
Mo
(c
m3.g
-1)
0
50
100
150
200
250
300
350
Vo
lum
e A
ds
orb
ed
Sp
en
t C
oM
o (
cm
3.g
-1)
0
10
20
30
40
50
60
70
Fresh CoMo
Spent CoMo+H2 at 425°C

Chapter 7: Coke and Metal Deposition Analysis
204
asphaltenes was slow inside the catalyst pore channels which contributed to early coking and
pore blockage.
As can be seen from Figure 7.7a-b, the spent Co-Mo/Al2O3 and Ni-Mo/Al2O3 catalysts
have a significantly lower volume of adsorbed-desorbed nitrogen at the same relative pressure
compared to their fresh counterparts. This loss in porosity and pore volume may have resulted
from the highly aromatic and coke-forming molecules such as resins and asphaltenes residing
within the small pores of the catalysts, due to limited diffusion of reactants and products
(Dupain, et al., 2006; Absi-Halabi, et al., 1995). The significant decrease in specific surface
area and pore volume of the spent catalyst also indicates that deposits (e.g., coke, metals, etc.)
may have altered the pore structure, textural properties, and subsequent catalytic activity.
Absi-Halabi et al. (1991) found that the initial coke deposition was most significant in the
smaller pores of the catalyst pellet while asphaltenes and coke deposition block catalyst pore
throat, thereby reducing the bed porosity and increasing pressure drop. Also, Dupain et al.
(2006) identified external coke deposits on the outer surface of the catalyst as a major
contributor to inaccessibility of pores.
On the other hand, when the upgrading reaction was performed under hydrogen gas
media the loss of surface area by the spent Co-Mo/Al2O3 catalyst was 78.6% compared to
99.8% under nitrogen atmosphere at the same operating conditions. Also, the pore volume
was higher compared to spent catalyst after upgrading in nitrogen. This indicates lesser
deactivation due to the blockage of catalytic site by coke deposition in the presence of
hydrogen (see Figure 7.7c). This is because hydrogen helps to suppress the polymerisation
reaction of the coke precursors formed large molecules and coke during the CAPRI process.
To confirm the pore blockage due to coke and metal deposits, mercury porosimetry of
the fresh and spent Co-Mo after upgrading at 425 oC, 20 barg, and 200 mL.mL
-1under
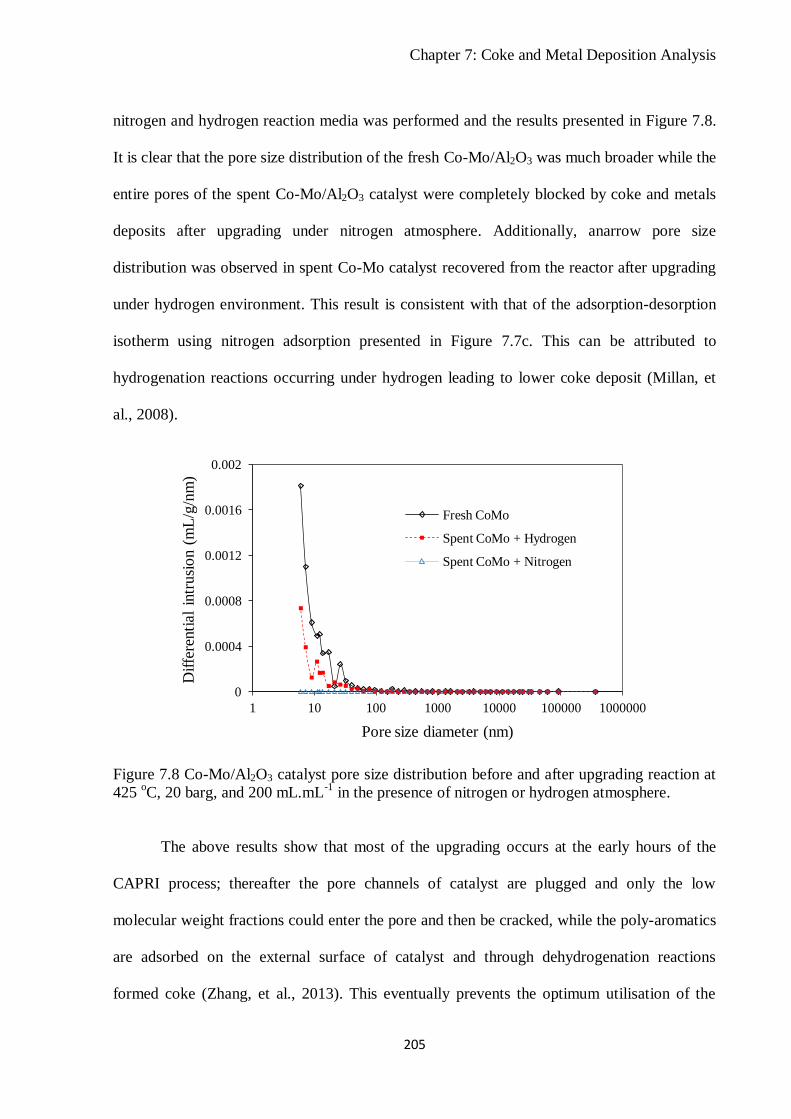
Chapter 7: Coke and Metal Deposition Analysis
205
nitrogen and hydrogen reaction media was performed and the results presented in Figure 7.8.
It is clear that the pore size distribution of the fresh Co-Mo/Al2O3 was much broader while the
entire pores of the spent Co-Mo/Al2O3 catalyst were completely blocked by coke and metals
deposits after upgrading under nitrogen atmosphere. Additionally, anarrow pore size
distribution was observed in spent Co-Mo catalyst recovered from the reactor after upgrading
under hydrogen environment. This result is consistent with that of the adsorption-desorption
isotherm using nitrogen adsorption presented in Figure 7.7c. This can be attributed to
hydrogenation reactions occurring under hydrogen leading to lower coke deposit (Millan, et
al., 2008).
Figure 7.8 Co-Mo/Al2O3 catalyst pore size distribution before and after upgrading reaction at
425 oC, 20 barg, and 200 mL.mL
-1 in the presence of nitrogen or hydrogen atmosphere.
The above results show that most of the upgrading occurs at the early hours of the
CAPRI process; thereafter the pore channels of catalyst are plugged and only the low
molecular weight fractions could enter the pore and then be cracked, while the poly-aromatics
are adsorbed on the external surface of catalyst and through dehydrogenation reactions
formed coke (Zhang, et al., 2013). This eventually prevents the optimum utilisation of the
0
0.0004
0.0008
0.0012
0.0016
0.002
1 10 100 1000 10000 100000 1000000
Dif
fere
nti
al
intr
usi
on (
mL
/g/n
m)
Pore size diameter (nm)
Fresh CoMo
Spent CoMo + Hydrogen
Spent CoMo + Nitrogen

Chapter 7: Coke and Metal Deposition Analysis
206
internal surface of the catalyst. The consequences of this on the catalyst performance are
reduced accessibility, activity, and lifetime.
7.4.5 Carbonaceous Deposits on Catalyst
The coke and metals deposited during the CAPRI process block the pore space, reduce
oil flow rate and increase pressure drop across the bed. Additionally, it lowers the efficiency
and performance of the catalyst. The cross section of coked Ni-Mo/Al2O3 catalyst bed in the
reactor after upgrading reactions is presented in Figure 7.9. As can be seen the catalyst
particles with the deposited asphaltenes, coke and contaminants tend to form agglomerates
within the bed leading to bed clogging. The extent of clogging of the inter-particle voids and
subsequent rise in pressure drop in reactor greatly impacts on the process economy.
Figure 7.9 Photograph of coked Ni-Mo/Al2O3 catalyst of the CAPRI reactor cross-section
after upgrading at temperature 425 oC, nitrogen-to-oil ratio 500 mL.mL
-1, and pressure 20
barg (Reactor tube internal diameter 10 mm).
It is clear that the inter-particle void of the bed is almost completely filled with
macromolecules of asphaltenes, sediments, and coke. These are rejected by-products of the

Chapter 7: Coke and Metal Deposition Analysis
207
catalytic upgrading reactions. This photograph correlates with the nitrogen-sorption isotherm
and mercury porosimetry results of the spent Ni-Mo/Al2O3 catalyst which showed the catalyst
pore blockage which occurred after the upgrading reaction. Millan et al. (2008) studied
catalytic activity of pre-coated Ni-Mo/Al2O3 catalyst with carbonaceous material and found
that despite large coke deposition and a significant drop in surface area and pore volume, the
catalyst continued to display some activity. This could be because of thermal cracking
reactions occurring, which are not catalyst activity dependent (Shah, et al., 2011). Secondly,
the deposited metals, coke, and sediments themselves can act as catalyst through exchange of
hydrogen, methyl, ethyl, radicals or groups with the molecules in the oil phase. This explains
the reason for the sustained catalytic activity despite coke and metal deposition.
7.4.6 Surface Morphology and Composition
SEM-EDX was used to study the fresh and spent catalyst surface morphology as well
as to determine their elemental composition. The SEM photomicrographs of the fresh and the
spent catalyst after upgrading reactions in different environments are shown in Figure 7.10.
SEM provides detailed surface morphology with magnification up to x10000, allowing
submicron-scale features such as metal and coke deposits, characterisation of defects and
particulates to be seen when compared with the fresh catalyst. It is clear that the deposition of
carbonaceous materials and metals occurs in the pores and on the surface of the catalysts,
which have contributed to loss of activity and reduced product quality with time-on-stream.
Under nitrogen and hydrogen atmosphere the coke form was amorphous while the metal
clusters are distributed around the catalyst surface and pores. However, under a steam
environment it was observed that the coke forms relatively small graphite-like planes and
agglomerates with some smaller globular coke growth.

Chapter 7: Coke and Metal Deposition Analysis
208
Figure 7.10 SEM photomicrographs of fresh Co-Mo/Al2O3 (A) and spent catalysts after
upgrading under different reaction media (B) Spent Co-Mo in N2 425 oC, (C) Spent Co-Mo in
H2 425 oC, and (D) Spent Co-Mo in steam 425
oC.
The elemental composition of the fresh and spent catalysts was determined using
Energy Dispersive X-ray analyser (EDX). The EDX mapped a small micro-area of the fresh
Co-Mo/alumina and Ni-Mo/alumina catalysts and their spent counterpart surface are
presented in Figure 7.11 (a) and (b). The analysis results revealed the deposition of carbon
(i.e., coke), sulphur, as well as metals onto the surface of the catalyst. The deposited
A B
C Dmetals
metals
metals

Chapter 7: Coke and Metal Deposition Analysis
209
impurities also contributed towards the loss of catalytic activity revealed in the decreased API
gravity and conversion of 343oC+ HCs with time-on-stream.
(a)
(b)
Figure 7.11 EDX of (a) fresh and spent Co-Mo/Al2O3 after upgrading in H2 atmosphere at 425 oC, 20 barg, and 200 mL.mL
-1; (b) fresh and spent Ni-Mo/Al2O3 catalyst after upgrading in N2
atmosphere at 425 oC, 20bar, and 500 mL.mL
-1.
(a) Fresh Co-Mo/Al2O3
(b) Spent Co-Mo/Al2O3
(a) Fresh Ni-Mo/Al2O3
(b) Spent Ni-Mo/Al2O3

Chapter 7: Coke and Metal Deposition Analysis
210
It is worthy to note that the active metals (i.e., Ni, Mo, and Co) of the catalyst are
converted from oxides to sulphide form during the catalytic upgrading reactions, due to the
sulphur content of the heavy oil. The metals are therefore deposited on the catalyst as metallic
sulphides e.g MxSy, where; M is V, Ni, Fe, etc. (Rezaei, et al., 2012; Leyva, et al., 2007). In
the light of this, the conversion of high-boiling species into low-boiling fractions led to
boiling point shift to the left of the feed oil TBP curve due to the following reactions:
cracking of C-C bonds in the heavy oil
cracking of C-S and C-N (i.e., C-hetero-atoms bonds) and
metals removal
Gray (1994) has also pointed out that the reduction of the heteroatoms content of the produced
oil could contribute to its low-boiling range more than the original heavy oil. Conclusively,
catalyst deactivation was caused by coke and metal deposition, resulting in pore constriction
and blockage. However, the SEM morphology revealed that the effect of coke deposition on
deactivation was more than that of metal deposits. Furthermore, it was found by Wilson
(1975) that the metals deposited on the catalyst contribute massively to coke formation,
hydrogen subtraction, and excessive yield of gases in the outlet-gas stream at the expense of
light oil.
7.5 Effect of Feedstock on Catalyst Coke Content
In section 7.2 and 7.3 the effect of reaction temperature and WHSV on catalyst coke
content were presented. In this section, effect of feedstock on catalyst coking is presented.
Figure 7.12 shows the effect of feedstock on spent catalyst coke content for Co-Mo and Ni-

Chapter 7: Coke and Metal Deposition Analysis
211
Mo catalysts after upgrading reaction. It is clear that the coke content of the spent catalyst
after 18 hours time-on-stream operation is different for feed-A and B.
Figure 7.12 TGA and DTG of spent catalyst obtained from the CAPRI reactor after upgrading
reaction using feed oil-A & B with Co-Mo/Al2O3 and Ni-Mo/Al2O3; Temperature 425 °C,
Reaction Media (N2), Pressure 20 barg, Oil flow rate 1mL.min-1
, Gas flow rate 500 mL.mL-1
.
The coke contents of the spent Ni-Mo/alumina catalyst after reaction with the two oils
were 48.2 wt.% (feed oil-A) and 39.6 wt. % (feed oil-B). Whilst, for spent Co-Mo/alumina it
was 49.84 wt.% (feed-A) and 41.07 wt.% (feed oil-B), respectively. This represents a
difference of approximately 9 wt.% between feed oil-A and B for the use of each catalyst.
Gray et al. (1999) found that the catalyst coke content increase is directly proportional to the
asphaltenes content of the heavy oil. Therefore, the difference in the spent catalyst coke
content could be attributed to the higher asphaltenes content of feed oil-A (11.14 wt.%)
compared to 10.3 wt.% for feed-B, knowing that asphaltenes are major contributors to coke.

Chapter 7: Coke and Metal Deposition Analysis
212
7.6 Effect of AC Guard-bed on Catalyst Coke Content
The TGA and DTG of spent Co-Mo/Al2O3 catalyst recovered after upgrading with AC
on top of Co-Mo/Al2O3 catalyst and that without guard-bed are presented in Figure 7.13. It is
clear that the coke content of the experiment with guard-bed placed ahead of the Co-
Mo/Al2O3 catalyst was 39.6 wt. % compared to the run where only Co-Mo/Al2O3 was used
which is 57.4 wt. %. This represents 17.8 wt.% coke content decrease for 25 hours time-on-
stream operation.
Figure 7.13 TGA and DTG of spent Co-Mo/Al2O3 catalyst obtained from a guard-bed reactor
and without guard bed; Temperature 425 °C, Reaction Media (N2), Pressure 20 barg, Oil flow
rate 1 mL.min-1
, Gas flow rate 500 mL.mL-1
.
This confirmed the previous impact of AC guard-bed to further improved the API
gravity, viscosity, asphaltenes, and metals contents of the produced oil compared to using Co-
Mo/alumina catalyst only. This is because the AC guard-bed selectively adsorbed some of the
large molecules that are polar and hydrogen-deficient such as resins, asphaltenes and

Chapter 7: Coke and Metal Deposition Analysis
213
heteroatom containing compounds upstream the catalyst bed (Hart, et al., 2013). The affinity
of AC for these heavier molecules has been reported by Ming et al. (2007) and Fukuyama et
al. (2004). The act therefore lowered early catalyst deactivation due to the initial formation of
coke resulting from asphaltenes and resins adsorption onto the catalyst, according to the
chemistry of coke formation illustrated in Figure 7.14.
Figure 7.14 Chemistry of coke formation on catalyst surface during upgrading reaction (Gray,
et al. 2000).
Therefore, as the feed oil passes through the AC guard-bed on top of the Co-
Mo/alumina catalyst, its coking tendency lowers before catalyst cracking, however less
condensed aromatics are readily adsorbed strongly on the catalyst surface. The coke formation
process however set in with the transfer of hydrogen from the deposited macro-molecules to

Chapter 7: Coke and Metal Deposition Analysis
214
stabilise lower hydrocarbon radicals in the light oil phase, resulting in the formation carbon-
rich material (i.e., coke).
7.7 Conclusions
The results of the coke and spent catalyst analysis show that the lay-down of coke on
the catalyst during upgrading reaction is temperature-dependent and higher temperature
subjected the catalyst to severe deactivation effect. It starts with macromolecular weight
species adsorption onto the catalyst, proceeds with loss of hydrogen and eventually forms
coke with various degrees of hardness. The covered active sites consequently choke-off
access to the catalyst interiors and acid sites. Also, metals deposition contributed to the
blockage of the pores and catalyst deactivation. Catalyst deactivation is the gradual loss its
activity to convert heavy fraction (> 343 oC) into lighter fractions (< 343
oC) with time-on-
stream. However, hydrogen-addition and activated carbon guard-bed on top of the catalyst
bed significantly decreased coke formation.

Chapter 8: Effect of Steam on Catalytic Upgrading and Coke Formation
215
Chapter 8
Effect of Steam on Catalytic Upgrading and Coke Formation
8.1 Introduction
During heavy oil extraction using THAI-CAPRI, the combustion zone can reach
temperatures of 450-700 oC which can heat up the water in the oil layer to generate steam,
resulting in steam flooding and/or hot water flooding (Jinzhong, et al., 2012; Xia, et al., 2002;
Wenlong, et al., 2011). The addition of steam to the generated gases during THAI process
may impact on the upgrading reactions occurring in CAPRI, and thus it is important to
understand the effect of the steam environment upon upgrading and coke formation.
In Chapter 5 and 6, the use of an activated carbon guard-bed on top of the catalyst and
hydrogen-addition was reported as a remedy for reducing coke formation and sustaining
catalyst lifetime. Hydrogen-addition from an external source can however prove challenging
to introduce into the oil reservoir unless sufficient hydrogen can be generated in situ. In this
Chapter, the effect of steam on the extent of CAPRI upgrading and its contributions to
reducing coke formation are reported. In situ hydrogen can be generated from steam via the
water-gas-shift reaction and this source of hydrogen could promote hydrocracking and
hydroconversion reactions (Hart, et al., 2014b). The in-situ generated hydrogen could
potentially improve the economics of the process compared to surface processing and
externally injecting hydrogen into the well. In addition to reducing the viscosity of the heavy
oil, it has been reported that there are chemical reactions between steam and heavy oil which
changes the composition of the heavy oil towards the light ends. Hyne et al. (1982) describe
this chemical interaction between steam and heavy oil as aquathermolysis. The experimental

Chapter 8: Effect of Steam on Catalytic Upgrading and Coke Formation
216
results presented in this chapter therefore provide further insight into the extent of
aquathermolysis occurring in THAI-CAPRI.
The reaction was carried out at a previously optimized temperature of 425oC and the
other conditions are presented in Table 8.1. Steam was generated by feeding water into trace
heated lines having a set temperature of 280oC and thereafter mixed with the feed oil prior to
entering the CAPRI reactor where the desired reaction temperature of 425oC was achieved.
Therefore, the steam-to-oil ratio (SOR) stated in Table 8.1 represents millilitre cold water
equivalent (CWE) of water per millilitre of feed oil (CWE/oil) into the CAPRI reactor.
Table 8.1 Operating conditions in the experiments.
Paramete value
Oil flow rate (mL.min-1
) 1 ± 0.3
Catalyst (g) 6
Pressure (barg) 20
Reaction temperature (oC) 425
Weight hourly space velocity, WHSV (h-1
) 9.1
Gas-to-oil ratio, GOR (mL.mL-1
) 500
Steam-to-oil ratio, SOR (mL.mL-1
) 0.02 – 0.1
8.2 Effect of Steam on Mass Balance
The yields of gas, liquid and coke after 15 hours time-on-stream catalytic upgrading
reactions with and without steam are presented in Table 8.2. It is however clear that the yield
of liquid product when the reaction was carried out under nitrogen only was 93.4% and upon
steam-addition 94.8%.
The liquid yield of the experiment represents a 1.4 wt. % increase, while the coke
yield decreased by 0.88 wt. % when the reaction was carried out in a steam atmosphere
compared to 2.11 wt. % coke observed under nitrogen environment alone. Following the

Chapter 8: Effect of Steam on Catalytic Upgrading and Coke Formation
217
decrease in the yields of coke and gas under steam atmosphere, the increase in liquid product
was expected. Accordingly, Gao et al. (2010) reported a similar trend that the addition of
steam to catalytic upgrading of heavy oil reduces coke formation and increases the yield of
light oil. Consequently, as the carbon-carbon bond scissions occurred to give low-boiling
hydrocarbons, the hydrogen gas generated by the steam inhibits the secondary reactions that
lead to coke formation as well as hydrogenates the cracked products, once formed, thereby
increasing the yield of liquid product (Zachariah, et al., 2013). Notably, the amount of
produced gas under steam atmosphere was reduced by 0.52 wt. % compared to that obtained
under nitrogen gas only, as shown in Table 8.2.
Table 8.2 Product yields from CAPRI process without and with steam at reaction temperature
of 425oC, pressure 20 barg; N2-to-oil ratio 500 mL.mL
-1; steam-to-oil ratio 0.05 mL.mL
-1
Reaction system
Liquid yield
(wt.%)
Coke yield
(wt. %)
Gas yield
(wt. %)
Feed oil + N2 93.4 2.11 4.49
Feed oil + N2 + Steam 94.8 1.23 3.97
Standard deviation ± 0.43 ± 0.6 ± 0.14
8.3 Effect of Steam-to-Oil Ratio
In this section, the results of the experimental runs conducted in triplicate, including
API gravity and viscosity measurements, TBP distribution curve of feedstock and liquid
products, produced gas composition, and coke content of spent catalyst are presented and
discussed.
8.3.1 Effect of Steam on API Gravity and Viscosity of Produced Oil
The simultaneous reactions of thermolysis, the action of high-temperature steam, and
cracking are known to occur in catalytic aquathermolysis environment. These reactions help

Chapter 8: Effect of Steam on Catalytic Upgrading and Coke Formation
218
to pyrolyse large hydrocarbon molecules into smaller ones while the catalytic actions improve
the cracking of the heavy oil. In Figure 8.1, the API gravity of the produced oil samples under
steam and steam-free environment as a function of time-on-stream is presented. Each data
point in the figure represents an average of triplicate of experimental run. The maximum
observed standard deviations between the experimental runs for API gravity and viscosity are:
steam-free (0.9o and 0.046 Pa.s), SOR 0.02 (1.02
o and 0.065 Pa.s), SOR 0.05 (0.93
o and 0.057
Pa.s) and SOR 0.1 (0.88o and 0.038 Pa.s), respectively. Clearly, the API gravity of the
produced oil samples was higher than the feed oil. There is a noticeable difference in API
gravity of the produced oil with and without steam addition.
Figure 8.1 Change in API gravity of Produced oils as a function of time-on-stream using Co-
Mo/γ-Al2O3 catalyst, reaction temperature 425 oC, pressure 20 barg, N2-to-oil ratio 500
mL.mL-1
; steam-to-oil (SOR) ratios 0.02, 0.05, and 0.1 mL.mL-1
.

Chapter 8: Effect of Steam on Catalytic Upgrading and Coke Formation
219
In a steam-free environment, the API gravity increases by a maximum change of
roughly 6o during the early part of the experiment and thereafter settles at an average increase
of 2.14 ± 1.2o API for 15 hours time-on-stream, above an initial value of 14
o API for the feed
oil. Compared with a maximum increase of 6 using nitrogen, when steam was introduced the
API gravity increased to 9o
API. Thereafter, the average value settled into the following
ranges: 2.5 ± 1.44o, 2.93 ± 0.98
o, and 2.91 ± 1.92
o API for steam/oil ratios (SORs) 0.02, 0.05
and 0.1, respectively. This represents approximately 0.4 to 1o further increment in API gravity
upon steam addition above the value obtained in a steam-free atmosphere.
The feedstock has high viscosity (1.091 Pa.s at 20 oC) and low API gravity (14
o). This
shows that the feed oil has poor fluidity that can cause difficulty in pipeline transportation and
refine-ability. In this regard, to meet refinery and pipeline transportation specifications, it is
necessary therefore to increase the API gravity by 5-9o and decrease the viscosity to 0.25 Pa.s
at 20 oC (Hashemi, et al., 2014). Figure 8.2 shows the viscosity of produced oil samples in the
absence of steam and at different SORs as a function of time-on-stream operation. Clearly, the
viscosity of the produced oil in each of the experimental runs is lower than that of the partially
upgraded THAI feed oil (1.091 Pa.s). It is noteworthy that under a steam-free atmosphere the
average viscosity of the produced oil reduces from 1.091 to 0.158 Pa.s, representing a
decrease by 85.5 %. However, upon steam-addition, the average viscosity of the produced oil
is reduced by 87.8, 92.1 and 89.2 % respectively as the SOR increases from 0.02 to 0.1.
These data represent a further decrease in viscosity by 2.3 to 6.6% above the value of
85.5 % viscosity reduction obtained under steam-free atmosphere. This shows that the impact
of steam environment on viscosity reduction was comparatively higher than its effect on API
gravity increase. Li et al. (2013) reported 86.1 to 94.7 % viscosity reduction after catalytic
upgrading in a steam atmosphere using Cu2+
and Fe3+
as catalytic ions for six different heavy

Chapter 8: Effect of Steam on Catalytic Upgrading and Coke Formation
220
oils obtained from China with original viscosities from 22 to 180 Pa.s at 50 oC. A similar
trend of observation was also reported by Fan et al. (2004).
It also suggests that steam
addition to the process is able to affect further upgrading than catalytic carbon-rejection which
is thought to occur with under nitrogen.
Figure 8.2 Viscosity of Produced oils as a function of time-on-stream using Co-Mo/γ-Al2O3
catalyst, reaction temperature 425 oC, pressure 20 barg, N2-to-oil ratio 500 mL.mL
-1; steam-
to-oil (SOR) ratios 0.02, 0.05, and 0.1 mL.mL-1
.
Consequently, Chuan, et al. (2010) and Wang, et al. (2012) found that during catalytic
upgrading of heavy oil under steam atmosphere, the steam not only acts as a solvent, reactant,
and hydrogen donor, but also aids the production of acid sites by interacting with catalytic
metals and contributes to many reactions such as catalytic cracking, hydrogenation, ring
opening, and desulphurisation involving the splitting of C-S, C-N, C-O, C-C, C=S, and C=O
bonds. These reactions affect viscosity reduction (see Figure 8.2), increase API gravity (see

Chapter 8: Effect of Steam on Catalytic Upgrading and Coke Formation
221
Figure 8.1), remove heteroatoms, and improve the produced oil quality. Additionally, in situ
donation of hydrogen via water-gas shift reaction will help reduce the chances of
recombination of free radicals or active chains formed by the cleavage of C-C, C-S, C-N, and
C-O bonds to form large molecules by terminating the active chains (Maity, et al., 2010).
Fan et al. (2001b) attributed these compositional changes and viscosity reduction of
the produced oil to the synergistic effects of catalyst and steam. It is clear that this synergistic
effect of the catalyst and steam improved the cracking behaviour and the yield of light oil (see
Table 8.2) as reflected in the API gravity and viscosity reduction. This can be illustrated by
the reactions in Equations 8.1-3 below:
(8.1)
active chains + active H2 → low molecular weight compound (8.2)
active chain + active chain → high molecular weight compound (8.3)
Furthermore, Li et al. (2013) pointed out that the acid sites of the catalyst cracks the
C-heteroatom bonds of the macromolecules of the heavy oil, in which the C-S, C-N, and C-O
bonds are weakened and the injected steam interaction with these bonds to facilitate cleavage.
During crude oil production, oil flow is inversely proportional to its viscosity through the
porous reservoir matrix, as very light oil has enough mobility that aids production by natural
reservoir pressure or water flooding. From the results above, it is therefore interesting to note
that the 87 to 92 % viscosity reduction in the steam assisted catalytic upgrading process is

Chapter 8: Effect of Steam on Catalytic Upgrading and Coke Formation
222
capable of producing oil with the required fluidity for pipeline transport with little or no
diluent addition.
8.3.2 Effect of steam on TBP Distribution
SIMDIS provides the TBP distribution of hydrocarbon fractions in the samples. The
estimated standard deviation falls within ± 4.6% for triplicate run. Figure 8.3 shows the TBP
distribution curves for the feed and produced oil samples with Co-Mo/Al2O3 catalyst when
the reaction was carried out under a nitrogen atmosphere only and in combination with steam
at the different SOR. The feed oil TBP curve is presented for the purpose of comparison.
Figure 8.3 TBP distribution curves for feed and produced oils using Co-Mo/γ-Al2O3 at
reaction temperature 425 oC; pressure 20 barg; N2-to-oil ratio 500 mL.mL
-1; SORs: 0.02, 0.05,
and 0.1 mL.mL-1
.

Chapter 8: Effect of Steam on Catalytic Upgrading and Coke Formation
223
The effect of steam environment on the conversion of heavy fractions and the
production of lighter fractions is illustrated by the shift in TBP curves of the produced oil
samples to the left, indicating that the samples contain lower boiling components than the
feed oil. Thus, the cumulative amount distilled at a boiling temperature of 343 oC increases
from 70.5 % in the feed oil to 89.8 % in nitrogen atmosphere alone. However, when steam
was added this value rose to 97.2, 92 and 91.6% for SORs 0.1, 0.05, and 0.02, respectively.
Compared to the feed oil, catalytic upgrading improved the distillate yield by up to 20 %
which is thought to occur mainly through carbon-rejection with limited indirect
hydrogenation via hydrogen-transfer reactions in a steam-free atmosphere. It can be
concluded from the results that a higher steam injection rate improves the yield of low-boiling
fractions. The additional 1 to 7 % increase in distillates yield as a result of steam environment
can be attributed to the hydrogenation of cracked fragments by the hydrogen generated from
water-gas-shift reaction of steam and carbon monoxide within the upgrading media. This
therefore indicates an increase in the percentage of middle fractions (200-343 oC) in the
produced oil due to the hydrogen donor ability of steam. A similar increase in the amount of
middle distillates was found when pure hydrogen was added to the reaction media during
catalytic upgrading process (Hart, et al., 2013 & 2014a).
From the TBP curves shown in Figure 8.3, it can be inferred that some of the heavy
molecular weight hydrocarbons in the partially upgraded THAI feedstock have been
converted to hydrocarbons of the middle distillate fractions (200-343 oC) while the middle
fractions are converted to light hydrocarbons (IBP-200 oC), gases (C1-C5) and coke. In Table
8.3 the conversion of 343 oC+ HCs as a function of SOR is presented. It is clear that the
conversion increased as the SOR increased from 0.02 to 0.1.

Chapter 8: Effect of Steam on Catalytic Upgrading and Coke Formation
224
Table 8.3 Conversion of 343 oC+ HCs to lower boiling fractions at reaction temperature
425oC, pressure 20barg; N2-to-oil ratio 500 mL.mL
-1, and varying SOR using Co-Mo/Al2O3
catalyst.
SOR (mL.mL-1
)
Conversion (%)
No steam 65.4
0.02 71.5
0.05 72.9
0.1 90.5
It can be seen in Figure 8.3 that there is greater impact on conversion above 343 oC.
For instance, the production of the distillate fractions in the range of temperature (200-380 oC)
is higher compared to distillates in the lower temperature range (100-200 oC). The further
shift of the TBP curve for SOR of 0.1 to the left (between temperatures 200-380 oC), relative
to that without steam addition, means that there is a higher proportion of lighter components
upon SOR (0.1) and is accompanied by a reduction in the viscosity from 1.091to 0.121 Pa.s.
The simulated distillation results provide an explanation of why most of the macromolecules
in the feed oil are converted to middle distillates, rather than lighter fractions. Similar trends
were also reported for HDS catalysts on hydrocracking of atmospheric residue (Lababidi and
AlHumaidan, 2011; Marroquin-Sanchez, et al., 2001). Also, Wang et al. (2012) reported a
similar improvement in the amount of distillate yield from produced oil after catalytic
upgrading of heavy oil in a steam environment using tungsten oxide on zirconia (W/Zr)
catalyst.
8.3.3 Effect of Steam on Asphaltenes, Sulphur, and Metals Content
Heavy oil and bitumen are rich in asphaltenes, containing roughly 10-30 wt.% of this
component, which give rise to the characteristics high viscosity as well as contaminants such
as heavy metals, sulphur and nitrogen (Galarraga, et al., 2012). In Table 8.4, the asphaltenes,

Chapter 8: Effect of Steam on Catalytic Upgrading and Coke Formation
225
metals and sulphur content of the feed and selected samples for steam-free and with different
SOR are presented. Interestingly, the asphaltenes content of the upgraded samples decreased
from 5.1 wt.% in a steam-free environment to 4.9 and 2.4 wt.% as the SOR increased from
0.05 to 0.1. Hyne et al. (1982) and Fan et al. (2001a) investigated aquathermolysis and
catalytic aquathermal cracking of heavy oils and found that after reaction, the saturates and
aromatics increased, while the resins and asphaltenes decreased. Saturates fractions are the
lightest and consist mainly of paraffinic and naphthenic molecules. Therefore, the
compositional shift of the upgraded samples towards the low-boiling temperature after
catalytic upgrading reactions as shown in the TBP curves in Figure 8.3 is an indication of
increased saturate content. As a consequence, the decreased amount of asphaltenes content
correlated with viscosity reduction and improved distillable yields. Similar observation was
reported in the literature (Maity, et al., 2010; Hongfu, et al., 2002).
Table 8.4 Asphaltenes, sulphur, and metals content before and after CAPRI reaction with and
without steam addition at reaction temperature 425 oC, pressure 20 barg, N2-to-oil ratio
500mLmL-1
, and different SORs.
Impurities
Feedstock
No
steam
SOR
(0.02)
SOR
(0.05)
SOR
(0.1)
Asphaltene (wt. %) 10.3 5.1 5.1 4.9 2.4
Aluminium (ppm) 2 2 < 1 1 < 1
Boron (ppm) 3 2 1 1 < 1
Iron (ppm) 5 < 1 1 < 1 < 1
Nickel (ppm) 41 34 30 23 12
Vanadium (ppm) 108 90 78 62 32
Ni + V (ppm) 149 124 108 85 44
Sulphur ( wt. %) 3.52 3.4 3.08 2.95 2.62
Silicon (ppm) 1 < 1 < 1 < 1 < 1
* Sulphur and metals content was performed by Intertek Laboratories Sunbury Technology Centre,
UK, using ICP-OES (Inductively Coupled Plasma Optical Emission Spectrometry).

Chapter 8: Effect of Steam on Catalytic Upgrading and Coke Formation
226
As the active oxygen and hydrogen generated from steam over the catalyst reacts with
the heavy oil fractions to produce lighter fractions and carbon dioxide, the hydrogen
terminates free radical addition reactions and increases the saturates and aromatic content of
the produced oil (Fumoto, et al., 2011; Sato, et al., 2013).
From Table 8.4, the sulphur content of the produced oils decreased from 3.52 wt.% for
the feedstock to 3.4 wt. % (steam-free), and 3.08, 2.62 and 2.95 wt.% as the SOR increased
from 0.02 to 0.1 mL.mL-1
. This indicates sulphur removal of 3.4% (steam-free), 12.2 % (SOR
0.02), 16.2% (SOR 0.05), and 25.6 % (SOR 0.1), thus the trend increased as the SOR
increases. The significant reduction of sulphur content upon steam addition provides
evidence that a greater degree of C-S bond cleavage occurred under steam atmosphere. This is
because steam addition promoted hydrodesulphurisation (HDS) reactions which were evident
from the high concentration of hydrogen sulphide in the produced gas analysis. Moreover, it
has been widely reported in the literature that the mechanism of viscosity reduction during
catalytic upgrading of heavy oil in the presence of steam is based on the theory of C-S bond
breaking (Li, et al., 2013; Fan, et al., 2001a; Clark and Hyne, 1990; Liu and Fan, 2002). They
pointed out that the C-S bond is one of the weakest bonds amongst heavy oil molecules;
hence the additional increase in the viscosity reduction of the samples relative to the feed oil
and that obtained in steam-free atmosphere can be attributed to increased HDS reactions in
the presence of steam (Table 8.4). This confirmed the potential of steam to donate hydrogen
through water-gas-shift reaction, where steam participated as reactant and solvent (Li, et al.,
2013). As SOR increases more active hydrogen became available, which increased the extent
of HDS reaction causing additional 8.8 to 22.2% sulphur reduction above 3.4% (steam-free).
Also, 2.3 to 6.6 % increase in viscosity reduction was noticed above the value of 85.5 %
(steam-free) due to the cleavage of more C-S bonds.

Chapter 8: Effect of Steam on Catalytic Upgrading and Coke Formation
227
Concurrent with the trends in sulphur removal, the nickel and vanadium (Ni + V)
content of the samples was reduced from 149 ppm (feedstock) to 124 ppm (steam-free), and
with steam environment 108, 85 and 44 ppm as SOR increased from 0.02 to 0.05 and 0.1,
respectively. Therefore, demetallization increased from 16.8 % (steam-free) to 43-70.5 % as
the SOR increased from 0.05 to 0.1. This indicates 26-54 % further reduction of (Ni + V)
content upon steam-addition. The reduction in sulphur and metals content of the oil produced
is consistent with the conversion of asphaltene molecules. It is possible that this significant
reduction in the metal content of the produced oil contributed to the 1o increase in API gravity
upon steam-addition above obtained under steam-free atmosphere, since the presence of
metals influences the heavy oil density. Additionally, the donated hydrogen via WGSR
therefore promoted hydrodemetallization (HDM) reactions, which is not experienced to the
same extent in steam-free environment. Moreover, the concentrations of other impurities such
as aluminum, boron, and iron were also reduced.
8.4 Spent Catalyst Coke Content
In chapter 7, it was found that coke formation in the catalytic upgrading process can
be suppressed by adding hydrogen (Hart, et al., 2013 & 2014a). In this Chapter, steam
environment was investigated as a potential source of hydrogen via WGS reaction. TG and
DTG analysis of the fresh and spent Co-Mo/Al2O3 catalyst recovered from the CAPRI reactor
after upgrading reactions with and without steam injection is presented in Figure 8.4. The
spent catalyst contains unconverted oil, cracked oil products and intermediates, and coke. The
latter starts to burn-off at about 530 oC during TGA analysis (Hart, et al., 2013). In Table 8.5,
the coke content of the recovered spent catalyst is presented. The recovered catalyst from the
CAPRI reactor after an upgrading experiment was carried out in a steam atmosphere showed
lower coke content compared to the experiment in nitrogen atmosphere only.
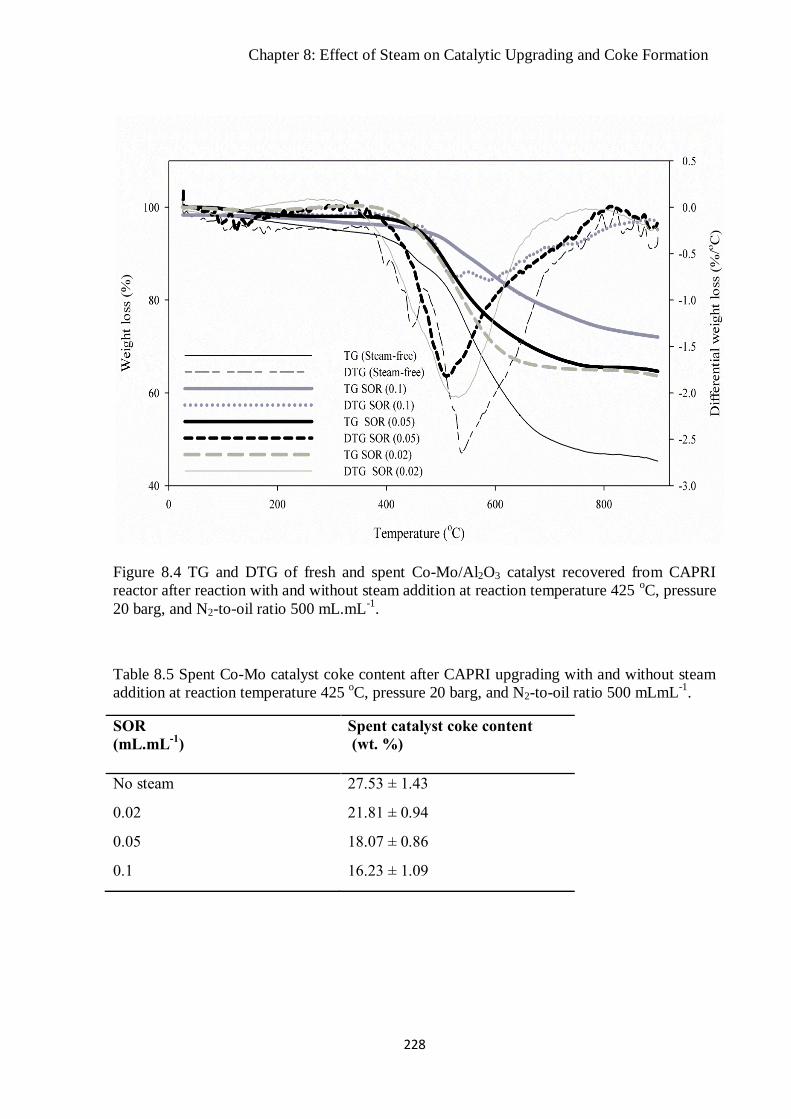
Chapter 8: Effect of Steam on Catalytic Upgrading and Coke Formation
228
Figure 8.4 TG and DTG of fresh and spent Co-Mo/Al2O3 catalyst recovered from CAPRI
reactor after reaction with and without steam addition at reaction temperature 425 oC, pressure
20 barg, and N2-to-oil ratio 500 mL.mL-1
.
Table 8.5 Spent Co-Mo catalyst coke content after CAPRI upgrading with and without steam
addition at reaction temperature 425 oC, pressure 20 barg, and N2-to-oil ratio 500 mLmL
-1.
SOR
(mL.mL-1
)
Spent catalyst coke content
(wt. %)
No steam 27.53 ± 1.43
0.02 21.81 ± 0.94
0.05 18.07 ± 0.86
0.1 16.23 ± 1.09

Chapter 8: Effect of Steam on Catalytic Upgrading and Coke Formation
229
The feed oil cracked over the Co-Mo/Al2O3 catalyst at 425oC yields light hydrocarbon
fractions, gas, and coke. However, in a steam atmosphere the coke content of the spent
catalyst decreased from 27.53 wt. % (steam-free) to 21.81, 18.07 and 16.23 wt. % as the SOR
increased from 0.02 to 0.05 and 0.1, respectively. In this respect, the coke content was
reduced by 5.72-11.3 wt.% as SOR increased. Consequently, the DTG curves indicate that the
coke formed in the presence of steam started to burn-off at a lower temperature of
approximately 521 oC compared with the coke formed in a steam-free atmosphere which
starts to burn-off about 539 oC. These results also provide evidence that steam was involved
in the catalytic upgrading reactions, as hydrogen donor solvent. The 18 oC difference in burn-
off temperature is thought to arise from structural differences in the coke molecules. The
impact of steam-addition on reduction of catalyst coke is significantly higher compared to that
of API gravity increase and viscosity reduction.
Nevertheless, Maity et al. (2010) pointed out that the addition of a small amount of
water depressed coke formation, with the coke content of catalyst decreasing with additional
water and levelled off after 10 wt.% of water. This is thought to be because the high SOR
increased the generation of active in situ hydrogen for hydrogenation reactions. Similarly,
Fumoto, et al. (2009) found that at lower steam flow rate, there is inadequate generation of
these active species, causing coke build-up on the catalyst. Since the reaction medium has
insufficient hydrogen-transfer capability at low SOR, free radical propagation could not be
adequately moderated. This is supported by the decrease in the methane and hydrogen
concentration in the off-gas as the SOR decreased from 0.1 to 0.02 (Zachariah, et al., 2013).
The decreased coke deposition due to steam addition can be attributed to the reaction
between steam and coke, generating carbon monoxide and hydrogen (Kapadia, et al., 2011).
This hydrogen produced can further react with coke as a precursor to form methane; details of

Chapter 8: Effect of Steam on Catalytic Upgrading and Coke Formation
230
the reactions are presented in Equations 8.4 and 8.5. In addition, Fumoto et al. (2009)
reported that active oxygen and hydrogen are produced from steam over the catalyst (see
equation 8.6 and 8.7). The reaction between the coke and active oxygen can also help to
suppress coke build-up (Fumoto, et al., 2011). Some of the produced hydrogen is utilized to
stabilize unsaturated and unstable hydrocarbons products such as olefins and coke precursors.
Coke(s) + H2O(g) → CO(g) + H2(g) Kapadia, et al. (2011) (8.4)
Coke(s) + 2H2(g) → CH4(g) Kapadia, et al. (2011) (8.5)
2H2O (g) ↔ 2H2 + O2 (8.6)
Coke (s) + O2 → CO2(g) (8.7)
In the work of Fumoto and co-workers (2009) it was shown that the reaction of
oxygen generated from steam with the heavy oil over the catalyst produced an appreciable
amount of light oil and carbon dioxide with a lower amount of coke. Also, Sato et al. (2013)
pointed out that the presence of a hydrogen donor (through WGS reaction) in the oil-rich
phase is effective for suppression of coke formation during the catalytic upgrading process.
8.5 Effect of Steam on Produced Gas Composition
The produced gas composition during the experiments determined using RGA
analyser and the results are presented in Table 8.6. The gases are products of the upgrading
reactions resulting from the splitting of large molecules into smaller ones. The gas
composition provides further insight into the reaction mechanism. The presence of hydrogen
in the gas indicates the potential of the process to generate hydrogen in the reservoir.

Chapter 8: Effect of Steam on Catalytic Upgrading and Coke Formation
231
Table 8.6 Produced gas composition during catalytic upgrading reaction in nitrogen
atmosphere only and in combination with steam using Co-Mo/γ-Al2O3 catalyst at temperature
425 oC; pressure 20 barg; N2/oil ratio 500 mL.mL
-1 and different SORs.
Gas
No steam
(vol. %)
SOR (0.1)
(vol. %)
SOR (0.05)
(vol. %)
SOR (0.02)
(vol.%)
Methane 2.33 1.15 1.27 1.46
Hydrogen 2.4 1.37 1.1 1.41
Ethane 0.82 0.06 0.033 0.03
Carbon dioxide 0.03 0.07 0.064 0.054
Ethene 0.03 0.07 0.08 0.073
Propane 0.23 0.21 0.15 0.113
Propene 0.14 0.10 0.07 0.068
i-Butane 0.12 0.14 0.03 0.062
n-Butane 0.06 0.14 0.03 0.073
1-Butene 0.051 0.035 0.034 0.044
Cis-2-butene 0.00 0.037 0.029 0.038
Trans-2-butene 0.02 0.033 0.00 0.023
n-Pentane 0.19 0.11 0.064 0.11
i-Pentane 0.17 0.07 0.034 0.064
Carbon monoxide 0.02 0.016 0.018 0.019
Hydrogen sulphide 0.00042 0.00052 0.00044 0.00043
Notably, 2.4 vol.% of hydrogen was detected in the outlet gas stream in a steam-free
environment against 1.1-1.4 vol.% in steam atmosphere depending on the SOR. This decrease
in hydrogen volume is deduced to be because some of the generated hydrogen is consumed in
hydrogenation, HDS, HDM reactions, and the inhibition of hydrogen abstraction from macro-
hydrocarbon molecules, leading to coke formation, even though additional hydrogen may be
generated in the presence of steam. The evolved hydrogen originates from two reaction
routes: firstly through hydrogen subtraction from the excited saturated hydrocarbon to form
an unsaturated hydrocarbon molecule as illustrated by Equation 8.8:

Chapter 8: Effect of Steam on Catalytic Upgrading and Coke Formation
232
2RH saturated → 2R unsaturated + H2 (8.8)
RH → R • + H
• (8.9)
RH + H • → R
• + H2 (8.10)
where, R is a hydrocarbon molecule
Furthermore, C–H bond cleavage produces hydrocarbon radicals and active hydrogen.
The active hydrogen on collision with another molecule abstracts hydrogen to form a
hydrogen molecule, as illustrated by Equations 8.9 and 8.10 (Alfi, et al., 2013). In this way
the macromolecule structure continues to grow further while the free radical sites at the
formed coke surface are revived by continuous hydrogen abstraction (Reyniers, et al., 1994;
Wang, et al., 2007). The free radicals formed, unsaturated molecules, and aromatics, are
common coke precursors. They promote coke formation by terminating reactions with coke
macro-radicals. Alternatively, the active hydrogen can react with other hydrocarbon radicals
to form a stable molecule via hydrogen-transfer reactions. Reactions 8.8 to 8.10 could have
been inhibited by injection of steam as hydrogen donor giving rise to less hydrogen in the
produced gas.
Consequently, the total olefin content of the produced gas is as follows: 0.241 vol.%
(steam-free), 0.31 vol.% (SOR, 0.1), 0.242 vol. % (SOR, 0.05) and 0.246 vol.% (SOR, 0.02).
Under the same conditions, the paraffinic contents are, respectively, 3.92 vol.% (steam-free),
1.804 vol.% (SOR, 0.1), 1.661 vol.% (SOR, 0.05) and 1.912 vol.% (SOR, 0.02). It is clear,
therefore, that the presence of steam limits olefin saturation (Gao, et al., 2010). Furthermore,
when steam was introduced to the catalytic upgrading process, less gases such as light
hydrocarbons (i.e., C1-C5), carbon monoxide, and hydrogen were produced, because in the
presence of steam the catalyst accelerates aquathermolysis of the oil, in addition to

Chapter 8: Effect of Steam on Catalytic Upgrading and Coke Formation
233
hydrogenation. However an increase in carbon dioxide production was observed, from 0.03
vol.% (steam-free) to 0.054, 0.064 and 0.07 vol.%, as the SOR was increased from 0.02 to
0.05 and 0.1, respectively. This is because the water-gas-shift reaction occurs within the
upgrading media. The lower gas production in the presence of steam is consistent with result
of the mass balance presented in Table 8.2 and with the result reported by Fan et al. (2001).
The two reaction routes for sulphur removal are: direct removal of the sulphur atom
from the straight chain molecule and hydrogenation of aromatic rings, followed by removal of
the sulphur atom (Marroquin-Sanchez, et al., 2001). Upon injection of steam, the amounts of
hydrogen sulphide in the produced gas increased from 0.00042 % (steam-free) to 0.00052%
for SOR of 0.1, indicating that additional C-S bonds in the sulphur-containing compounds of
the feed oil have been ruptured and converted to H2S. The removal of the sulphur as hydrogen
sulphide demonstrated that HDS reaction occurred during the catalytic upgrading process and
the injection of steam increased the extent. The amount of methane and hydrogen in the gas
decreased with the increasing amount of added steam. The results were consistent with those
reported in the literature (Maity, et al., 2010; Hongfu, et al., 2002).
The decrease in the
amount of methane with increase in steam addition can be attributed to the following
reactions (see Equation 8.11) postulated by Hongfu, et al. (2002):
(8.11)
The observed decrease in the amount of hydrogen was attributed to in situ HDS,
hydrogenation of the free radicals and olefins produced during the process (Hongfu, et al.,
2002).

Chapter 8: Effect of Steam on Catalytic Upgrading and Coke Formation
234
8.6 Water-Gas-Shift Reaction
The produced carbon dioxide and carbon monoxide in the gas as a function of time-
on-stream, for nitrogen only and nitrogen with steam environment are presented in Figure 8.5.
It is clear that steam environment increased the amount of carbon dioxide gas produced while
carbon monoxide decreased. The high amount of carbon dioxide produced can be attributed
largely to the water-gas-shift (WGS) reaction (CO + H2O (g) = CO2+ H2, H= -41.1 kJ.mol-1
)
that occurs in the presence of steam, catalyst and CO generated from aquathermolysis of
heavy oil (Fan, et al., 2001a; Li et al., 2013; Smith, et al., 2010).
Figure 8.5 CO2 and CO production during catalytic upgrading in the presence and absence of
steam at temperature of 425 oC, pressure 20 barg, SOR 0.1 mL.mL
-1, and N2-to-oil ratio
500mL.mL-1
.

Chapter 8: Effect of Steam on Catalytic Upgrading and Coke Formation
235
It is also noteworthy the increased amount of carbon dioxide and the decreased
amount of carbon monoxide in the gas in the presence of steam provides evidence that the
WGS reaction occurred to a greater extent with the addition of steam. It can also be seen from
Figure 8.5 that the carbon dioxide produced via WGS reaction decreased with time-on-stream,
because of loss of catalytic activity resulting from catalyst surface, pores, and voids been
fouled by coke produced during cracking reactions of hydrocarbons.
Therefore, during the upgrading reaction, water acts as a hydrogen donor, providing
hydrogen for hydrogenation, HDM and HDS. Carbon dioxide and C2-C5 light hydrocarbons
could have also helped to decrease the produced oil viscosity via miscible and/or immiscible
displacement and improve recovery of heavy oils in reality. Carbon dioxide generated in-situ
via water-gas shift reaction could be potentially sequestered in the reservoir so that emissions
to the atmosphere are reduced (Kapadia, et al., 2011).
8.7 Conclusions
The extent of aquathermolysis occurring in THAI-CAPRI process was investigated at
reaction temperature of 425 oC, gas/oil ratio 500 mL.mL
-1, pressure 20 bar, and water/oil ratio
0.02, 0.05 and 0.1 mL.mL-1
. It was found that viscosity reduction of the produced oil further
increased by 2-7 % under steam atmosphere compared to 85.5 % viscosity reduction under
steam-free atmosphere. Also, the API gravity of the produced oil increased by at least 1o
above obtained under steam-free environment. Depending on the steam/oil ratio used, the
sulphur and metals (Ni + V) content removal increased by 8.1-22.2 % and 26-54 %
respectively, compared to 3.4 % and 16.8 % under steam-free atmosphere.

Chapter 9: Comparative Study of Fixed-bed and Dispersed Catalysts
236
Chapter 9
Comparative Study of Fixed-bed and Dispersed Catalysts
9.1 Introduction
In Chapters 4 to 8, the conventional CAPRI reactor, requiring the packing of the
horizontal well with pelleted HDS catalysts prior to starting up, was reported. It was found
that catalyst deactivation remains an issue during production. Coke deposition is a major
drawback of fixed-bed catalyst. In other words, the activity of the catalyst rapidly decreases
with time-on-stream, eventually plugging the pores and voids of the fixed-bed (Froment,
1991; Cerqueira, et al., 1997). This adversely impact on the process economy. In this Chapter
9, a substitute approach to dealing with this challenge using a once-through nano-particulate
catalyst is reported.
In reality, the application of dispersed particles could potentially avoid the hurdles of
pre-packing the horizontal well with catalyst pellets prior to starting up, but requires the
transport of the nano-particles into the mobile oil zone during the THAI process. The delivery
of nano-catalyst to the oil-bearing formations at reservoir condition still imposes a great
challenge, which is alleviated as nanocatalyst can readily be injected for in situ upgrading in
the oil reservoir pore matrix with an injected fluid as slurry (Weissman and Kessler, 1996;
Hassanzadeh and Abedi, 2010). Consequently, dispersed nanoparticulate catalysts increase
contact as well as effective reactor volume for upgrading reactions.
In this Chapter, dispersed nanocatalyst for in situ catalytic upgrading was tested in a
batch reactor at the same residence time (10 minutes), catalyst-to-oil ratio (CTO) 0.02-0.1,
temperature (425 oC), pressure (20 bar), and gas media (N2 and H2) used in the fixed-bed

Chapter 9: Comparative Study of Fixed-bed and Dispersed Catalysts
237
experiments. A test run without adding catalyst was performed to evaluate the effect of
thermal cracking only. In Section 9.4, the result of testing biomanufactured catalyst and its
chemical counterpart (Co-Mo/γAl2O3) was reported.
9.2 Fixed-Bed vs. Dispersed Catalyst
The results of experiments performed in fixed-bed and the dispersed microcatalyst
tested in a batch reactor at the same residence time (10 minutes) and CTO (0.1 g/g) are
presented in this Section. A stirring speed of 133 rpm was used, as it approximately gives the
same Reynolds number of 0.2 experienced in the fixed-bed reactor (see Appendix F), thereby
ensuring dynamic similitude. Also, the nitrogen sorption isotherm of the pellets and crushed
Co-Mo/Al2O3 is presented in Appendix F.
9.2.1 Produced oil API Gravity, Viscosity, Conversion and Products yield
The comparison of the extent of upgrading achieved with fixed-bed and dispersed
micro-particulates of Co-Mo/γ-Al2O3 catalyst in a batch process are presented in Table 9.1,
based on equivalent residence time and CTO. For duplicate runs, the average API increment
was 8.7 ± 0.7o and 5.6 ± 1.8
o for dispersed micro-catalyst and fixed-bed system respectively.
The API gravity achieved using micro-particulates of Co-Mo/γ-Al2O3 catalyst was 3o points
above that obtained with fixed-bed catalyst. Ovalles et al. (1998) observed API gravity
increase of 7o and 55 % conversion of heavy fractions using dispersed molybdenum catalyst
at 410oC reaction temperature. Additionally, the price of crude oil is directly related to its API
gravity, in other words the higher the API gravity the higher the price (Ancheyta and Rana,
2007).

Chapter 9: Comparative Study of Fixed-bed and Dispersed Catalysts
238
Table 9.1 Comparison of upgrading level with fixed-bed Co-Mo pellets and dispersed micro-
Co-Mo at temperature 425 oC, pressure 20 bar, CTO 0.1, Stirring speed 133 rpm, and thermal
cracking only (in batch). Feed oil (14 oAPI and 1.091 Pa.s).
Experimental
Run
API
Increment
(o)
Viscosity
(Pa.s)
Conversion
(343oC+)
(%)
Coke
(wt.%)
Gas
(wt.%)
Liquid
(wt.%)
Thermal
(No catalyst)
6.6
0.008
33.1
12.95
8.15
78.9
Dispersed
micro-catalyst
8.7
0.007
59.7
7.1
8.05
84.85
Fixed-bed
catalyst
5.63
0.028
46.4
1.86
3.34
93.8
Similarly, the 1.091 Pa.s (feed oil) was reduced to 0.0284 Pa.s (fixed-bed) and 0.007
Pa.s (dispersed). This represents 97.4 and 99.4 % viscosity reduction, which is 2% increase in
DVR upon use of dispersed micro-catalyst of Co-Mo/γ-Al2O3. Wei et al. (2007) reported 98.9
% viscosity reduction of Liaohe extra-heavy oil using nano-nickel catalyst. This magnitude of
viscosity reduction could increase the fluidity of the oil through the porous reservoir, thereby
increasing production rate and ensure pipeline transport.
Thermal cracking without a catalyst showed the lowest conversion of heavy fractions
(BP > 343 oC) of 33.1 %, whereas the conversion was improved with catalyst 46.4 % (fixed-
bed) and 59.7 % (dispersed). The superiority of dispersed micro-catalyst over fixed-bed
pellets is because they offer better contact as probability of preferential channelling
encountered in fixed-bed is decreased. Additionally, they promote faster cracking reactions
because of their reduced particle size and large surface-area-to-volume ratio, high heat and
mass transfer, and effective contact and wetting of the macro-dispersed catalyst compare to
the fixed-bed catalyst (Angeles, et al., 2013; Le Perchec, et al., 1993). According to Le
Perchec et al. (1993), nano-catalyst exhibited higher reaction rate than their fixed-bed
counterpart, because the generated hydrogen in situ activated by the finely divided particles

Chapter 9: Comparative Study of Fixed-bed and Dispersed Catalysts
239
for hydroconversion reactions helped to stabilise the free radicals produced during the
cracking of heavy oil.
The API gravity of the produced oil was compared for catalytic and thermal cracking
run as well. As can be seen in Table 9.1, the oil produced in non-catalytic run was upgraded
by 6.6 ± 0.65 oAPI, above the original feed oil of 14
oAPI. Whilst the catalytic run with
dispersed micro-particulates of Co-Mo/Al2O3 produced oil was upgraded by 8.7 ± 0.7 oAPI.
This represents 2 oAPI above thermal cracking alone. Abuhesa and Hughes (2009) reported
similar findings on catalytic and noncatalytic in situ combustion. However, the effect of
dispersed micro-catalyst on viscosity of produced oil seems to be roughly the same with that
obtained with thermal at 425 oC. This is because temperature is the driving force for viscosity
reduction.
The yields of gas, light oil, and concentrated carbon material; coke was calculated
using equations 3.10 and 3.11 (Castañeda, et al., 2012). The material balance presented in
Table 9.1 shows that the amount of coke produced at 425 °C was 12.95 wt.% (thermal
cracking only) compared to 7.1 wt.% (dispersed micro-particulate Co-Mo/Al2O3), and the
corresponding liquid yields were 78.9 and 84.85 wt.% respectively. Observation of reactor
internals revealed that the coke formation starts at the bottom near the wall and then proceeds
towards the centre of the reactor with accumulation at dead volume areas (see Figure 9.1).
Coke formation is the consequence of precipitation and accumulation of unconverted
asphaltenes cores resulting from the decrease of solvent power (i.e., ability to dissolve another
substance) due to composition changes caused by cracking reactions, temperature and
hydrogen-abstraction (Sawarkar, et al., 2007; Rogel, et al., 2013).

Chapter 9: Comparative Study of Fixed-bed and Dispersed Catalysts
240
Figure 9.1 Photograph of reactor internal and impeller after reaction at 425 oC (vessel 100 mL
and impeller diameter 10 mm).
In the case of micro-particulate catalyst, the strong affinity between them and
asphaltenes serves as a starting point for their cracking, thereby suppressing the
polymerisation and condensation reaction to form coke (Zhang, et al., 2007). Nonetheless,
aggregation of micro-catalyst and the carbonaceous deposits inside the batch reactor was
observed. It can be seen therefore that thermal cracking produced high coke and lower liquid
yields compared to catalytic upgrading process. High yield of coke affirms that thermal
upgrading is majorly accomplished by carbon-rejection.
9.2.2 Produced oil TBP Distribution
Heavy crude oil produces less fuel distillates with more of residue fraction when
distilled. The demand for low-boiling distillates is ever growing (Jarullah, et al., 2011). The
SIMDIS of the feedstock and upgraded oils was divided into the following distillates;
gasoline (IBP to 200 oC), middle distillates (200 – 343
oC), and residual fraction (BP >
Coke

Chapter 9: Comparative Study of Fixed-bed and Dispersed Catalysts
241
343oC). In Figure 9.2, the yields of the distillate fractions are presented for the feedstock and
produced oil with dispersed micro-particles and fixed-bed Co-Mo/Al2O3 catalyst, respectively.
Figure 9.2 Amount distilled as a function of boiling-point fractions for feedstock and
produced oil from thermal cracking (batch), fixed-bed and dispersed micro-particulates of Co-
Mo/Al2O3 catalyst at temperature 425 oC, pressure 20 bar, nitrogen gas media, CTO ratio 0.1,
stirring speed 133 rpm, and residence time 10 minutes.
It is clear that while the residual fraction decreased from 24 vol.% in the feedstock to
13.3 and 10 vol.%, the gasoline fractions increased from 34.6 vol.% (feedstock) to 45.5 and
56.6 vol.%, respectively for the produced oils from fixed-bed and dispersed Co-Mo/Al2O3
catalysts. However, with fixed-bed more middle distillates (200 – 343 oC) were produced
compared to dispersed micro-particulates of Co-Mo/Al2O3 in batch. The heavy molecules are
transported to the active sites of the micro-particulates earlier, unlike in the fixed-bed where
diffusional limitation leading to pore plugging was experienced. The reduced particle sizes

Chapter 9: Comparative Study of Fixed-bed and Dispersed Catalysts
242
improved contact, reaction rate, hydroconversion, and subsequently yield of light distillates
increased (Panariti, et al., 2000a; Noguera, et al., 2012). As can be seen in Figure 9.2, that
thermal cracking produced the highest residue fraction of 16.6 vol.% (343 oC – FBP)
compared to dispersed particulate and fixed-bed Co-Mo/Al2O3. The improved gasoline
fractions as well as decreased residual fractions in the produced oils after catalytic upgrading
process positively contributed to the increased API gravity and reduced viscosity as shown in
Table 9.1, compared to the original feed oil.
9.2.3 Micro Elemental Analysis
The results of the micro elemental analysis of the samples obtained from thermal,
fixed-bed and dispersed micro-particulates of Co-Mo/Al2O3 upgrade compared to that of the
feedstock are shown in Table 9.2. It can be seen that the H/C atomic ratio increased after
thermal and catalytic upgrading. However, thermally upgraded oil sample showed the highest
carbon-rejection of 5.16 % and the lowest atomic hydrogen of 10.06 %. Notably, the amount
of carbon-rejected upon thermal upgrading is approximately 3 times that of catalytic
upgrading. This confirmed the mass balance presented in Table 9.1 and also evident that
thermal cracking is majorly carbon-rejection. As a consequence, the incorporation of catalyst
improved the H/C ratio and suppressed carbon-rejection (see Table 9.1 and 9.2).
It has been reported by Klerk et al. (2014) that an increase in H/C ratio indicates a
decrease in naphthenic and aromatic content relative to the original feed oil. The poly-form of
these could have adversely impact on the H/C, API gravity and viscosity because of their high
density and carbon content. Correspondingly, the nitrogen content decreased as thus 0.07,
0.13 and 0.12% upon thermal, fixed-bed, and dispersed micro-particulates upgrading below
0.57% (feedstock). It follows that the denitrogenation reaction was not experienced in the

Chapter 9: Comparative Study of Fixed-bed and Dispersed Catalysts
243
same extent under thermal cracking as it was in catalytic upgrading; nevertheless the reaction
was performed under nitrogen atmosphere.
Table 9.2 Micro elemental analysis of samples obtained from thermal, fixed-bed, and
dispersed micro-particulates of CoMo/Al2O3 upgrading at temperature of 425 oC, pressure of
20 bar, stirring speed 133 rpm, CTO 0.1, and residence of 10 minutes under nitrogen
atmosphere.
Samples
C
(%)
H
(%)
N
(%)
H/C
(%)
Carbon
rejection
(%)
Feedstock 88.82 10.17 0.57 0.114
Produced oil
(Thermal)
83.66 10.06 0.50 0.120 5.16 ± 0.8
Produced oil
(Fixed-bed)
87.01 11.49 0.44 0.132 1.81± 0.4
Produced oil
(micro-particulates Co-Mo/Al2O3)
86.85 10.75 0.45 0.124 1.97 ± 0.1
9.2.4 Produced Gas Composition
The produced gas forms one of the major products of the upgrading process with the
yield up to 5.6 wt.% depending on the reaction temperature. The gas composition was
determined using RGA and the results are presented in Table 9.3.
The amounts of methane and ethane produced with thermal upgrading were higher
than those of catalytic upgrading process. This observation is in agreement with the results of
methane and ethane in off-gas during thermal upgrading of blend of vacuum residues in a
batch reactor by Sawarkar and co-workers (2007). This is because thermal cracking proceeds
through free radical mechanism with methyl and ethyl being the smallest hydrocarbon
radicals generated by arbitrary splits of the hydrocarbon chains while catalytic cracking of the

Chapter 9: Comparative Study of Fixed-bed and Dispersed Catalysts
244
hydrocarbon chains in the oil proceeds in a systematic fashion of carbonium ion intermediates
and beta-scission. Thus, releasing large amount of methane and ethane promoted carbon-
rejection to balance the elemental hydrogen and carbon between the upgraded oil, produced
gas, and coke deposit (see Table 9.1 and 9.2 for thermal upgrading alone).
Table 9.3 Produced gas composition for supported and dispersed Co-Mo/Al2O3 catalyst at
temperature 425 oC, pressure 20 bar, nitrogen gas media, catalysts-to-oil ratio 0.1, stirring
speed 133 rpm, and residence time 10 minutes.
Gas
Dispersed
micro-CoMo
(vol.%)
Fixed-bed
CoMo
(vol.%)
Thermal
cracking
(vol.%)
Methane 5.25 2.33 7.68
Hydrogen 1.66 2.4 1.47
Ethane 0.36 0.82 0.92
Carbon Dioxide 0.23 0.03 0.063
Ethene 0.1 0.03 0.13
Propane 1.48 0.23 0.94
Propene 0.3 0.14 0.25
i-Butane 0.19 0.12 0.07
n-Butane 0.45 0.06 0.16
1-Butene 0.094 0.051 0.21
cis-2-Butene 0.04 0 0
trans-2-Butene 0.06 0.02 0.05
n-Pentane 0.14 0.19 0.4
i-Pentane 0.12 0.17 0.38
Nitrogen
Carbon Monoxide 0.01 0.02 0.063
Hydrogen sulphide 0.002 0.00042 0.00025
The light hydrocarbon gases C1-C5 produced with dispersed catalyst were higher than
that of fixed-bed, except for ethane, n-pentane, and i-pentane. Overall, the experiment carried
out with dispersed micro-catalyst produced twice the gas produced from fixed-bed. This
affirmed the increase rate of reaction with fine particulate catalyst. Hashemi et al. (2013)
found that in addition to light oil been produced, the emitted gases under in situ upgrading

Chapter 9: Comparative Study of Fixed-bed and Dispersed Catalysts
245
could contribute towards viscosity reduction via miscible displacement and subsequently
enhance oil recovery. It is worth mentioning that the produced H2S upon the use of dispersed
micro-particulate Co-Mo/Al2O3 was 4.8 and 8 times more than that produced by fixed-bed
process and thermal upgrading.
9.3 Effect of Agitation and Catalyst-to-Oil Ratio
For a comprehensive understanding of mass transfer between gas-oil-solid phases,
experimental runs were carried out by varying the agitation speed and catalyst loading (i.e.,
CTO). The amount of dispersed micro-Co-Mo/Al2O3 catalyst range 0.4-2 g and stirring speed
133-500 rpm at constant reaction temperature of 425 oC, pressure 20 bar, and time 10
minutes.
9.3.1 Effect on API Gravity, Viscosity and Products Yield
In Table 9.4, the effect of agitation and CTO on API gravity, viscosity and mass
balance using micro-Co-Mo/γ-Al2O3 catalyst are presented. The API gravity of the produced
oil increases from 9o to 12.9
o as the stirring speed increase from 133 to 500 rpm. This
represents further increase of 3.9o at 500 rpm. The upgrading of heavy oil with dispersed
micro-particulate catalyst involves mass transfer of molecules between gas-oil-catalyst phases
coupled with cracking reactions occurring simultaneously. As a consequence, low stirring
speed of 133 rpm causes mass transfer limitation. On the other hand, high agitation rate can
cause a shift from mass transfer limited to kinetic control regime because of the increased
contact allowing adequate utilisation of high surface-area-to-volume ratio of the micro-
particulate catalyst.

Chapter 9: Comparative Study of Fixed-bed and Dispersed Catalysts
246
Table 9.4 Effect of agitation and CTO using dispersed micro-particulates of Co-Mo/Al2O3
catalyst at 425 oC, 20 bar, 10 minutes reaction time and nitrogen-reaction medium. Feed oil
(14o API and 1.091 Pa.s).
The above results show that the catalyst activity is controlled by the degree of catalyst
dispersion via agitation (Hashemi, et al., 2013). Furthermore, higher agitation maintains the
fine particles in homogenised suspension in the oil-phase which improves catalyst
performance. The same trend was observed in the produced oil viscosities 0.0071 Pa.s (133
rpm) and 0.0039 Pa.s (500 rpm). As expected well-dispersed catalyst showed higher activity.
However while the yield of coke increase by 4.2 wt.%, the yield of liquid products decrease
by 4.3 wt.% at 500 rpm compared to 7.1 wt.% (coke) and 84.85 wt.% (liquid) at 133 rpm.
Micro-particulate catalyst increases the yield of low-boiling fractions by lowering the
activation energies (Rezaei, et al., 2013).
From Table 9.4, it can be observed that high CTO increased API gravity, high
conversion (BP > 343 oC), and lowered viscosity values were obtained compared to low CTO
at the same agitation 500 rpm. As the CTO increased, the yield of coke and light oil
decreased. A similar trend was reported by Shuyi et al. (2008). This is because at high CTO
catalytic cracking dominate thermal cracking, thereby inhibiting the extent of carbon-
rejection. Furthermore, comparing the level of upgrading at CTO (0.02) and agitation 500
rpm with that obtained at CTO (0.1) and agitation 133 rpm at the same temperature (425 oC)
Stirring speed
(rpm)
CTO
(g/g)
API
increase
(o)
Viscosity
(Pa.s)
Conversion
(343 oC+)
(%)
Liquid
(wt.%)
Gas
(wt.)
Coke
(wt.%)
133 0.1 9 0.0071 60 84.85 8.05 7.1
500 0.1 12.9 0.0032 77.4 80.55 8.15 11.3
500 0.02 9.8 0.0039 55 80.8 7.05 12.15

Chapter 9: Comparative Study of Fixed-bed and Dispersed Catalysts
247
and pressure (20 bar), it can be observed that the mass transfer between gas-oil-solid phases
during upgrading reactions at 133 rpm was limited.
9.3.2 Effect on TBP Distribution
The yield of the (IBP-200 oC), (200-343
oC) and (343
oC-FBP) fractions from the
produced oil as a function agitation and CTO are presented respectively in Figure 9.3 (a) and
(b). It can be seen that some of the middle fractions (200-343 oC) and the heavy fractions (>
343 oC) in the feedstock have been converted to low-boiling fractions (IBP-200
oC) during the
upgrading using micro-particulate Co-Mo/Al2O3. Subsequently, the conversion of high-
boiling fractions (> 343 oC) at 500 rpm was 77.4 % and 60 % (133 rpm). This represents 17.4
% increase, as reflected in additional 4 % rise in low-boiling distillates and 4.4 % drop in
heavy fractions compared to that obtained at 133 rpm (see Figure 9.3a).
From Figure 9.3b, it can be seen that the produced oil at CTO (0.1) has high low-
boiling fractions (IBP – 200 oC) and low residue fraction (> 343
oC) than that of CTO (0.02)
at 500 rpm. However, the middle distillates (200 – 343 oC) of the produced oil at CTO (0.02)
was 4.53 vol.% higher than 33.8 vol.% for CTO (0.1). This shows that higher catalyst
loading advanced the conversion of heavy fractions into low-boiling fractions. The results
therefore show that the cracking reaction mechanism follows the pathways shown in Figure
9.4: the heavy feedstock molecules crack to form gas (C1-C5, H2), gasoline fractions, middle
distillates, coke, and unconverted heavy fraction. As the agitation and CTO increases, it
resulted in subsequent conversion of middle and residue fractions into light fractions, gas, and
coke. Puron et al. (2014) found that the yield of coke was majorly from the cracking of
residue fraction. Therefore, the low viscosity and API gravity increase observed can be
attributed to the thinning effect of the high yield of IBP-200 oC.

Chapter 9: Comparative Study of Fixed-bed and Dispersed Catalysts
248
(a)
(b)
Figure 9.3 Produced oil amount distilled as function of (a) Agitation, and (b) CTO; using
micro-particulates of Co-Mo/Al2O3 catalyst at temperature of 425 oC, pressure 20 bar,
nitrogen gas media, catalysts-to-oil ratio 0.1, and residence time 10 minutes.

Chapter 9: Comparative Study of Fixed-bed and Dispersed Catalysts
249
Figure 9.4 Reaction pathways during dispersed catalyst upgrading.
9.4 Microparticulates of Bio-Pd vs. Co-Mo/Al2O3 Catalysts
In this section, the level of heavy oil upgrade obtained by dispersed micro-particulates
of Co-Mo/Al2O3 (2.5 µm) and microparticulates of bio-Pd (20%) were tested. The
microparticulates of bio-Pd were prepared by reducing a solution of sodium
tetrachloropalladate (II) (Na2PdCl4) on an anaerobic bacterium (Desulfovibrio desulfuricans
NCIMB 8307 to make a 20% bio-Pd) with an average particle size of 13.8 µm. Therefore,
upgrading by the biomanufactured catalyst was compared with its chemical counterpart.
9.4.1 Mass Balance, API Gravity, Viscosity and Conversion
In Table 9.5, the level of upgrading by thermal, microparticulates of Co-Mo/Al2O3,
microparticulates of Al2O3, and microparticulates of bio-Pd (20%) at 425 oC temperature, 0.02

Chapter 9: Comparative Study of Fixed-bed and Dispersed Catalysts
250
CTO, 20 bar pressure, 500 rpm agitation under nitrogen and hydrogen reaction gas are
presented. The reported data are an average of duplicate experimental runs with standard
deviation for API gravity and viscosity as follows: thermal (0.32 oAPI and 0.004 Pa.s), micro-
CoMo/Al2O3 (0.26 oAPI and 0.002 Pa.s), micro-bioPd (0.3
oAPI and 0.001 Pa.s), and micro-
Al2O3 (0.34 oAPI and 0.003 Pa.s), respectively. After upgrading, the produced oil API gravity
increased while the viscosity decreased significantly compared to the feed oil (14 oAPI and
1.091 Pa.s). However, the incorporation of micro-particulates of Co-Mo/Al2O3 or bio-Pd
catalysts further increased the API gravity by 2 to 3.5o above that obtained in a blank
experimental run (6.5 oAPI) for both nitrogen and hydrogen environment. A similar trend of
observation can be seen for the viscosity. The overall viscosity reductions therefore range
from 96 to 99.4 % below 1.091 Pa.s (feedstock).
Table 9.5 Produced oil upgrade using thermal, micro-CoMo/Al2O3, micro-Al2O3, and micro
bioPd (20%) at 425 oC temperature, 0.02 CTO (except thermal upgrading), 20 bar pressure,
and 500 rpm agitation under nitrogen or hydrogen reaction media. Feed oil (14 oAPI and
1.091 Pa.s).
Experiments API
increment
(o)
Viscosity
(Pa.s)
Conversion
(343oC+)
(%)
Liquid
(wt.%)
Gas
(wt.)
Coke
(wt.%)
Thermal + N2 6.4 0.018 33.2 77.1 10.55 12.35
Thermal + H2 6.5 0.013 46 78.9 11.3 9.8
Micro-CoMo + N2 9.8 0.004 55 80.8 7.05 12.15
Micro-CoMo + H2 10.1 0.006 67.7 83.15 7.95 8.9
Micro-Al2O3 + H2 8.9 0.004 51.6 73.05 13.3 13.65
Micro bio-Pd
(20%) + N2
8 0.0097 37.1 87.13 6.94 5.93
Micro bio-Pd
(20%) + H2
8.2 0.009 63.7 88.4 7.73 3.87
Chapter 9: Comparative Study of Fixed-bed and Dispersed Catalysts
251
Comparing the level of upgrading, it is clear that the produced oil with micro-
particulates of Co-Mo/Al2O3 has roughly 2 oAPI gravity higher and 0.005 Pa.s viscosities
lower than that produced with micro-bioPd (20%). This noticeable difference in API gravity
and viscosity can be attributed to the acid sites of the alumina support of Co-Mo, which are
thought to be responsible for the cracking reactions.
In contrast, the yield of coke in the experimental run with micro-particulates of Co-
Mo/Al2O3 doubled that of micro-bioPd for both nitrogen and hydrogen environment. This is
because in addition to thermal reactions the alumina support was actively involved in cracking
reactions, which triggers the formation of radicals that polymerise into coke. Puron et al.
(2014) pointed out that the formation of coke during catalytic upgrading process depends on
catalyst type in addition to reaction temperature and mass transfer. Hence, the non-acidic
support of micro-bioPd could have played an active role in suppressing coke formation. In
fact this was confirmed from the experiment performed with micro-particulates of Al2O3,
which showed an increase in coke yield by 4.8 wt.% above observed 8.9 wt.% (Co-Mo/Al2O3)
under hydrogen atmosphere. Correspondingly, the 13.3 wt.% yield of gas upon the use micro-
Al2O3 against 7.95 wt.% (Co-Mo/Al2O3) also supported the effect of acid sites in promoting
the reaction routes that lead to coke and gas formation instead of maximising liquid product
under hydrogen atmosphere.
Hydrogen-addition to the catalytic upgrading experiment using dispersed micro-
particles promoted the conversion of residue fraction while maximising the yield of liquid
product. Thermal upgrading appears to give high yield of coke, while the use of dispersed
micro-CoMo/Al2O3 and micro-bioPd resulted in low yield of coke except micro-Al2O3. The
fact that micro-Al2O3 did not have any hydrogenation function (with no added metals such as
Co, Mo, etc.) led to catalytically controlled C-C bond cleavage reaction. Meaning the splitting

Chapter 9: Comparative Study of Fixed-bed and Dispersed Catalysts
252
of C-C bonds was enhanced by their strong acid sites, therefore yielding large amounts of gas
and coke (Leyva, et al., 2007; Klerk, et al., 2014). Despite the presence of hydrogen,
hydroconversion was limited because of the absence of metals such as Ni, Co, Mo, etc.
9.4.2 TBP Distribution
The amount of distillate fractions upon SIMDIS of the produced oil from the use of
thermal, micro-CoMo/Al2O3, micro-Al2O3, and micro-bioPd (20%) are presented in Figures
9.5(a), (b) and (c), respectively. It is worthy to note that the difference in the yields of low-
boiling fractions between the feedstock and the samples after reaction confirmed that
upgrading took place.
(a)
0
10
20
30
40
50
60
IBP - 200 ºC 200 - 343 ºC 343 ºC - FBP
Am
ount
dis
till
ed (
vo
l. %
)
Boiling temperature range (oC)
Feed oil
Thermal (Nitrogen)
Thermal (Hydrogen)

Chapter 9: Comparative Study of Fixed-bed and Dispersed Catalysts
253
(b)
(c)
Figure 9.5 Amount distilled at different boiling temperature ranges upon simulated distillation
of produced oil from the use of (a) thermal upgrading, (b) micro-particulates of Co-Mo/Al2O3
and Al2O3, and (c) micro-bioPd (20%) catalysts at temperature of 425 oC, pressure of 20 bar,
CTO of 0.02, stirring speed 500 rpm, and residence time 10 minutes under N2 and H2
environments.
0
10
20
30
40
50
60
70
Feed oil Micro-CoMo
(Nitrogen)
Micro-CoMo
(Hydrogen)
Micro-Alumina
(Hydrogen)
Am
ou
nt
dis
till
ed (
vo
l.%
)
IBP - 200 ºC 200 - 343 ºC 343 ºC - FBP
0
10
20
30
40
50
60
70
IBP - 200 ºC 200 - 343 ºC 343 ºC - FBP
Am
ount
dis
till
ed (
vo
l. %
)
Boiling temperature range (oC)
Feed oil
Micro-bioPd (Nitrogen)
Micro-bioPd (Hydrogen)

Chapter 9: Comparative Study of Fixed-bed and Dispersed Catalysts
254
The common transport fuels are gasoline, diesel, and jet fuel of which their boiling
range falls within 35-343 oC. Therefore, comparing hydrogen and nitrogen reaction
environment, it is clear from Figures 9.5 (a)-(c) that hydrogen-addition route to upgrading
increased the yield of (IBP – 200 oC) fraction by 7 % (thermal), 8.83% (micro-CoMo/Al2O3)
and 10% (micro-bioPd), while the residue fraction (343 oC+) decreased by 3.6% (thermal),
3.17% (micro-CoMo/Al2O3), and 6.6% (micro-bioPd), respectively compared to upgrading
under nitrogen atmosphere. Thermally upgraded oil gave the lowest and highest yields of low-
boiling fractions and residue. Hydrogen-addition therefore increased the fuel distillates
without a substantial decrease in liquid product yield (see Table 9.5). Hydrogen molecules are
known to split into active H• over the catalyst surface, and the H• radicals are thought to be
responsible for hydrogenation of coke precursors and lowering coke yield. Whereas reaction
under nitrogen atmosphere the intermediate radicals readily reassemble to form residue
fraction and coke.
Fine particulate catalyst possesses much more accessible active sites per unit mass,
which enhances the extent of metal utilisation. The results presented here are line with those
reported by Alkhaldi and Husein (2014). They found that heavy oil upgrading activity of fine
particulate catalyst is metal dependent. However, most of the particulates tend to agglomerate
and become incorporated with the produced coke, but yield of coke decreased under hydrogen
because of hydrogenation reaction. Furthermore, under the same conditions the bioPd releases
Pd metal to activate the hydrogen required to stabilise the free radicals produced by thermal
cracking of heavy oil. The structure of the micro-bioPd promote hydrogen uptake for
hydroconversion reactions.

Chapter 9: Comparative Study of Fixed-bed and Dispersed Catalysts
255
9.4.3 Produced Gas
The composition of produced gas evolved using micro-particulates of Co-Mo/Al2O3,
microparticulates of bioPd, and thermal upgrading under nitrogen environment are presented
in Table 9.6. Upgrading by thermal cracking produced more nC1 – C5 light hydrogen in the
gas compared to the catalytic counterpart. This explains the high carbon-rejection upon
thermal upgrading. However, the use of micro-particulates of Co-Mo/Al2O3 produced more
olefins than thermal cracking.
Table 9.6 Produced gas upon upgrading under nitrogen atmosphere using thermal, micro Co-
Mo/Al2O3, and micro-bioPd at 425 oC, 20 bar, 500 rpm, 0.02 CTO, and 10 minutes reaction
time.
Gas
Micro-CoMo
(vol.%)
Micro-bioPd
(vol.%)
Thermal
(vol.%)
n(C1-C5) 7.68 6.34 10.1
i(C4-C5) 0.31 0.87 0.45
Olefin (C2-C4) 0.59 0.37 0.39
CO2 0.23 0.41 0.1
CO 0.01 0.16 0.1
H2S 0.002 0.001 0.0003
H2 1.66 1.15 1.47
This indicates that catalytic upgrading reaction did occur. It is noteworthy that reaction
carried out with microparticulates of bioPd produced less hydrogen compared to thermal and
micro Co-Mo/Al2O3. This can be as a result of more interaction of Pd with hydrogen-transfer
reactions.

Chapter 9: Comparative Study of Fixed-bed and Dispersed Catalysts
256
9.5 Conclusions
The experimental results have demonstrated potential of in-situ catalytic upgrading
process at laboratory-scale. It was found that the dispersed fine particulate catalyst has greater
surface-area-to-volume ratio, therefore showed high activity and performance compared to
fixed-pelleted catalyst. This study of dispersed particulates will provide better understanding
and design of field-scale process. The upgrading effects were primarily due to heavy
hydrocarbons cracking over the dispersed particulate catalysts in a heated zone, which
delivers 7 to 10 oAPI gain in API gravity, 97.8 % viscosity reduction, as well as improved
yield of fuel distillates. However, the challenge of recovery and reuse the nano-catalyst after
reaction need to be addressed.

Chapter 10: Conclusions and Recommendations
257
Chapter 10
Conclusions and Recommendations
10.1 Conclusions
In a time of surging global energy demand, petroleum industries and researchers are
actively investigating means of extracting vast deposits of heavy oils and bitumen using
diverse enhanced oil recovery (EOR) techniques. THAI-CAPRI technology involves
subsurface catalytic upgrading process in situ aimed at simultaneously extracting heavy oils
and converting them into light oil prior to reaching the surface. Upgrading produces a crude
oil with similar characteristics to conventional light crude oil that can meet refinery feedstock
qualities. This involves carbon-subtraction, hydrogen-addition as well as heteroatom removal.
The surface upgrading facilities presently in use demand huge capital investment to
build and maintain the upgrader, and are energy-intensive leading to substantial amount of
greenhouse gas emissions. Down-hole upgrading in situ using CAPRI offers the following
advantages: 1) less energy-intensive as it utilises heat energy from an in situ combustion to
drive the catalysis, 2) most of the impurities such as sulphur and heavy metals are left behind
in the reservoir lowering environmental footprint, 3) reduce sand handling and 4) produce
partially upgraded oil to the surface with significant fluidity that will reduce capital cost for
lifting operation and transportation from underground to the refinery (Speight, 2013;
Hashemi, et al., 2013).
The target was to upgrade the Whitesands partially upgraded heavy oil by THAI
process of 13-14 oAPI gravity to an API gravity of 18-22
oAPI, considerably lower the
viscosity to enhance fluidity for pipeline transportation. With the asphaltenes, sulphur and

Chapter 10: Conclusions and Recommendations
258
metals content lowered remarkably. A laboratory micro-fixed catalyst bed was used to
replicate the CAPRI section of the THAI process. The impact of operating parameters,
feedstock, catalyst type, guard-bed on top the catalyst bed, hydrogen-addition, and steam-
environment upon upgrading and coke formation was investigated. The major challenge of the
fixed catalysts bed was the deactivation which decreases the activity and lifetime. The
formation of coke and the deposit of metals were detrimental to the process efficiency and to
the catalyst performance. In the light of this, alternative contacting method between the oil
and catalyst was investigated using nanoparticulate catalyst.
Effect of Temperature, WHSV, and Feedstock
In reality, during the THAI process the lighter and more volatile hydrocarbon
components move rapidly through the reservoir. The slower moving heavy molecular weight
components such as resins and asphaltenes are subjected to cracking and coking reactions.
Thermal upgrading by carbon-rejection occurs in the THAI process and subsequent catalytic
cracking upgrading in CAPRI process incorporated to the horizontal producer well. The
experimental results of the CAPRI process in this study have shown an increase in API
gravity by ~3-9 oAPI points and 40-85 % reduction of viscosity on top the in situ thermally
upgraded oil by THAI alone. This is dependent on the upgrading temperature, weight hourly
space velocity (WHSV), and oil flow rate across the catalyst bed. Based on these results, the
combination of THAI and CAPRI could deliver in situ upgrading that could produce oil that
can be transported by pipeline without diluents, which lowers refining cost.
It was found that high reaction temperature (425 oC) favoured the C-C and C-
heteroatom bond cleavages which led to improved yields of low-boiling distillates, removal
sulphur and heavy metals, in addition to significant viscosity reduction compared to 350 and

Chapter 10: Conclusions and Recommendations
259
400 oC. At the same time, it causes high dehydrogenation and condensation reactions, which
resulted to high catalyst deactivation due to high coke formation. The results on the effect of
WHSV clearly showed that low WHSV of 9.1 h-1
was necessary to accomplish a fairly good
upgrading in terms of API gravity, viscosity reduction, and conversion of 343 oC+ fractions of
the heavy oil into light oil. On the other side, deactivation by coke is minimised at high
WHSV due to less acid sites, short residence and contact time between the oil and the catalyst
bed. Deactivation is linked to activity and lifetime of the catalysts, as illustrated in Figure
10.1. The economy of the process strongly depends on the catalyst lifetime.
Figure 10.1 Factors affecting the performance of heavy oil upgrading catalysts.
The activity of the catalyst was found to decrease rapidly with time owing to aging of
the catalyst caused by coke and metals deposition. This therefore suggests that the
development of catalyst system which can tolerate deposition of coke, sediment, and metal,

Chapter 10: Conclusions and Recommendations
260
under reservoir conditions will open up commercialisation of THAI-CAPRI process. The
study has shown that the decrease in catalyst activity is the result of the deposited coke and
metals which are associated with highly aromatic, hydrogen deficient, and metal-containing
asphaltenic and resinic structure in the heavy oil released during the catalytic upgrading. In
addition to catalyst deactivation, CAPRI process in fixed-bed catalyst involves typical
challenges such as hot spot occurrence and pressure drop build-up. The performance of
catalyst used in CAPRI is therefore dependent on numerous parameters: feedstock
composition, contact time between oil and catalyst, catalyst properties, and operating
conditions.
Effect of Hydrogen and Steam Environment
The ability to control deactivation in CAPRI will facilitate down-hole catalytic
upgrading of heavy oil and its economy. With a view to controlling catalyst deactivation,
hydrogen and steam addition were investigated. When hydrogen was added to the CAPRI
process, it was also found that the API gravity of the produced oil increased further by point
~1 to 2 oAPI and viscosity reduced further by 6-8%, in addition to the 6
o API and 82%
viscosity reduction obtained using Co-Mo/Al2O3 and/or Ni-Mo/Al2O3 under nitrogen
atmosphere. After CAPRI upgrading under the different gas environments, the spent catalyst
coke contents are as follows: 23.5 wt.% (nitrogen), 20.08 wt.% (THAI gas), 20.4 wt.%
(methane) and 17.4 wt.% (hydrogen), respectively for 6 hours time-on-stream operation. It
was observed that the spent catalyst coke content after upgrading was carried out under
hydrogen atmosphere was significantly decreased compared to nitrogen and THAI gas
environment. This is because hydrogen effectively moderates the addition reactions of
macromolecules of asphaltenes and resins radicals that results in coke formation compared to
Chapter 10: Conclusions and Recommendations
261
when the reaction was carried out under the other gas environments such as nitrogen and
methane.
Consequently, because of the challenges of introducing hydrogen into the reservoir
during the THAI-CAPRI recovery and upgrading process, an alternative in-situ technique of
donating hydrogen via water-gas-shift reaction from steam was investigated. It was found
that upon steam atmosphere an overall viscosity reduction of 88 to 92 % was observed as the
steam/oil ratio increased from 0.02 to 0.1 compared to 85.5 % observed when the reaction
was carried out under nitrogen environment alone. Correspondingly, demetallization and
desulphurisation increase in the range of 43 to 70.5 % and 16 to 25.6 % as the steam/oil ratio
increased from 0.02 to 0.1 compared to 16.8 % (demetallization) and 3.4 % (desulphurisation)
observed under steam-free (nitrogen) atmosphere. Also, an additional 1 oAPI gravity above
the 3 oAPI (steam-free atmosphere) was noticed upon steam-addition. This improvement of
produced oil quality when steam was added can be attributed the role played by the donated
hydrogen through water-gas-shift reaction. It was also found that after CAPRI upgrading in
nitrogen and nitrogen plus steam environment, the spent catalyst coke content were thus 27.53
wt.% (nitrogen) and decreased to 17.02 – 11.2 wt.% as the steam/oil ratio was increased from
0.02 to 0.1. These results showed that steam and hydrogen environments were capable to
improve the fluidity of the produced oil as well as decreased coke formation and removing
sulphur and metals.
In order to understand the role of hydrogen on poly-aromatic compounds, anthracene
was selected as model compound. It was found that hydrogenation, hydrocracking, and hydro-
refining function of the bi-functional HDS catalyst (i.e., Co-Mo and Ni-Mo) in the presence of
hydrogen was responsible for the improved API gravity, reduced viscosity and reduced coke
formation. The effect of hydrogen pressure on coke content of the catalyst is more effective at

Chapter 10: Conclusions and Recommendations
262
high pressure of 40 bar and 425 oC reaction temperature, because the hydrogen transfer to the
gas-oil interface has been considered faster compared to the rate of hydrogen uptake due to
upgrading reactions in the oil phase (Panariti, et al., 2000b). The produced gas analysed by
RGA showed that the addition of hydrogen prevents olefin addition reactions by promoting
direct olefin hydrogenation and partial hydrogenation of polynuclear aromatic hydrocarbons.
The hydrogenation of olefins during the upgrading of heavy oil is vital as the polymerisation
of olefins has the capacity to form large molecular weight compounds that can lead to the
formation of coke. Nevertheless, hydrogen-addition to the CAPRI process suppressed these
addition reactions.
Use of Guard Bed
The challenges of rapid fouling and coking leading to deactivation of the catalytic bed
was remedied with the use of activated carbon (AC) guard bed on the top the catalyst bed to
trap macromolecules and particulate which are known foulant and coke precursors in the feed
oil. This was confirmed by 21 wt.% reduction of catalyst coke content after upgrading was
carried out with Co-Mo/Al2O3 only and AC on top of Co-Mo/Al2O3 catalyst at the same
conditions and 20 hours time-on-stream. In this way, it was possible to prolong the catalyst
lifetime by additional 10 hours, improved API gravity by approximately 2o and 4-6% further
viscosity reduction. It therefore makes more effective use of the downstream catalytic bed.
The Ni + V metal content of the feed heavy oil (206 ppm) decreased by 10 % (Co-Mo/Al2O3
only) and 70.9 % (AC on top of Co-Mo/Al2O3 catalyst). At the same time, the asphaltenes
content of the produced oil was 5.99 wt.% when upgrading was carried out with Co-
Mo/alumina catalyst only and 3.95 wt.% upon the use of AC on top of Co-Mo/Al2O3 catalyst
against 11.14 wt.% for the feed oil.

Chapter 10: Conclusions and Recommendations
263
The incorporation of a bed of AC on top of the catalytic bed gave better improvement
in API gravity, viscosity reduction, and low coke content than the use of alumina support as
guard bed. With this scheme, it was possible to remove some of the macromolecules from the
feed oil at the first stage, reducing the asphaltenic and resinic content of the oil before
proceeding to the catalytic cracking upgrading in the next stage; this reduced the coking
propensity of the oil and improved upgraded oil flow properties compared to the upgrading
performed without AC guard bed. The reduction in catalyst coke content for this scheme was
due to the reduced possibility of asphaltenes precipitation in the catalytic bed. However, this
scheme introduces additional challenge to packing the horizontal producer well.
Fixed-bed and Dispersed Micro-Catalyst
Based on the challenges associated with fixed-bed catalyst, alternative contacting
technique using nanoparticulate catalyst was investigated. In this approach, once-through
nano-particulate catalyst was used to surmount the catalyst deactivation caused by coke and
metal deposition upon fixed-bed catalyst. The key factor to handling heavy oil is reducing the
viscosity. After upgrading with fixed-bed and dispersed particulate catalyst, the produced oil
API gravity and viscosity for fixed-bed (5.6 oAPI and 0.0284 Pa.s) and dispersed micro-
catalyst (8.7 oAPI and 0.007 Pa.s) compare to the heavy feed oil (13
oAPI and 1.091 Pa.s). It
was found that the API gravity and viscosity reduction further increased by 3 oAPI and 2%
upon the use particulate catalyst. This is because of the improved contact and high surface-
area to volume ratio resulting from particle size reduction.
In comparison to the thermal upgrading, all catalysts tested were effective for the
conversion heavy fractions into low-boiling fractions as well as decreasing viscosity.
However the effectiveness remarkably varied with the type of catalyst, the type of metals (Co,

Chapter 10: Conclusions and Recommendations
264
Ni, Mo, Pd, etc.), the support material, and the textural properties of the catalyst. It was found
that the extent of coke formation during CAPRI depends on the catalyst type and properties,
the feedstock properties, and the operating condition. Additionally, the coke content of the
catalyst increases with the increasing conversion of 343 oC+ HC fractions and decreasing
viscosity of produced oil. Also, the yield of low-boiling fuel distillates increased and coke
formation suppressed when upgrading was carried out under hydrogen compared to nitrogen
atmosphere. The experimental results showed that the extent of heavy oil conversion to light
oil via CAPRI is not only a function of reaction temperature but also dependent upon the
heavy oil composition, residence time, catalyst properties, and reaction media.
Conclusively, in situ upgrading of heavy crude oil enhances oil production, benefits
pipeline transportation through reduction of diluents, and most of the impurities such as
sulphur and metals are left behind in the reservoir, lowering impact on downstream processes
and the environment. There is a major benefit from reduction of surface upgrading facilities.
10.2 Recommendations
The use of fixed-bed catalyst display short service life due to carbon and heteroatoms
deposits, poor operation stability because of gradual increase in pressure drop, and
subsequently experienced periodic shut-down. In the light of the above challenges, slurry-
phase catalytic upgrading process is proposed for further investigation. The concept adopts
unsupported dispersed catalysts which include heterogeneous nano-catalysts and
homogeneous (either water-soluble or oil-soluble) dispersed catalysts. The difference
therefore is that catalytic upgrading reactions will take place at the porous media of the
reservoir rather than across a fixed-catalyst bed incorporated to the horizontal producer well.

Chapter 10: Conclusions and Recommendations
265
The gradual build up of pressure drop and subsequent shutdown due to asphaltenes
and coke coverage of the catalyst pores and inter-particles void can be overcome using graded
catalyst packing arranged as thus macro- and mesopores materials in layers is therefore
recommended for future investigation. Also, a structured monolithic catalyst with macro-
channels and meso-pores walls is potential candidate for future studies, as an alternative to
overcoming the challenges of high pressure drop in fixed-bed and as a result of coke,
asphaltenes, and heavy metal deposits.
Most of the experiments carried out in the fixed-bed CAPRI process were done in one-
dimensional representation. Therefore, future studies should focus on 3-dimentional
laboratory-scale of the CAPRI process. This will provide a comprehensive understanding of
the field application compared to fixed-bed model. Additionally, the contribution of sulphur
and heavy metals to catalyst deactivation requires further investigation as most of the
deactivation evaluation here was done mainly on the bases of coke deposit.
In-situ regeneration of the spent HDT catalyst will improve process economics.
Further studies should involved developing suitable catalyst for in situ upgrading process
rather than using commercially manufacture HDS catalyst mainly for surface refining
processes. Characteristics of the catalyst should include high metal retention capacity,
moderate acidity, slow to deactivation by coke deposition, and ability to withstand the salinity
of the reservoir fluids. As microporous catalysts limit diffusion and promote pore plugging
and external deposition of coke and metals, the structural characteristics should include
macro- and mesopores to facilitate the diffusion of macromolecules and minimise deposition
within the pore channels. In addition to this, knowledge of the molecular size of the
macromolecules in the heavy oil is therefore essential for the development of the catalyst.

Appendix A
266
Appendix A
Characterisation of Catalyst and Guard bed Material
A.1 Nitrogen adsorption-desorption isotherm of catalyst, activated carbon and alumina
support
(a)
(b)
0
50
100
150
200
250
300
350
400
450
0 0.2 0.4 0.6 0.8 1
Vol
ume
abso
rbed
(cm
3 /g)
Relative pressure (P/Po)
NiMo
CoMo
230
235
240
245
250
255
260
265
0 0.2 0.4 0.6 0.8 1 1.2
Volu
me a
bso
rb
ed
(cm
3/g
)
Relative pressure (P/Po)
Activated carbon

Appendix A
267
(c)
Figure A.1 Nitrogen adsorption-desorption isotherm: (a) Co-Mo/Al2O3 and Ni-Mo/Al2O3
catalyst, (b) Activated and (c) Alumina support.
It is clear from Figure A.2c that the alumina support has small pores and pore volume
compared to the activated carbon (Figure A.2b) material as the hysteresis loop is small and
falls in the region of high relative pressure.
A.1.2 Calculation of BET Surface Area
In Figure A.2, the BET plot of the nitrogen sorption data of fresh Co-Mo/Al2O3 using
equation 3.12 is presented.
(3.12)
where p is the partial pressure of N2, Po is the saturation pressure at the experimental
temperature, V volume adsorbed at P, Vm volume adsorbed at monolayer coverage, and C a
constant.
0
50
100
150
200
250
300
350
400
0 0.2 0.4 0.6 0.8 1 1.2
Volu
me a
bso
rb
ed
(cm
3/g
)
Relative pressure (P/Po)
Alumina support

Appendix A
268
Figure A.2 BET plot of fresh Co-Mo/Al2O3.
From Figure A.2:
1 / Vm C = 0.0002
(C – 1) / Vm C = 0.0201
It follows that C = 101.5 and Vm = 49.26 cm3.g
-1. The BET surface area is however calculated
using equation (3.13):
(3.13)
where; Vm is 49.26 cm3.g
-1, na is the Avogadro’s number (6.022 x 10
23 mol
-1), am is the cross-
sectional area occupied by each adsorbate molecule at 77 K (0.162 nm2) and mv is the gram-
molecule volume (22.414 mL). Therefore, SBET for fresh Co-Mo/Al2O3 is 214.1 m2.g
-1.
y = 0.0201x + 0.0002
R² = 1
0
0.001
0.002
0.003
0.004
0.005
0 0.05 0.1 0.15 0.2 0.25
P /
V(P
o-P
)
P/Po

Appendix A
269
A.2 Mercury porosimetry of catalyst, activated carbon and alumina support
(a)
(b)
0
0.0004
0.0008
0.0012
0.0016
0.002
1 10 100 1000 10000 100000 1000000
Dif
fere
nti
al
intr
usi
on (
mL
/g/n
m)
Pore size diameter (nm)
Regenerated CoMo
Fresh NiMo
Fresh CoMo
0
0.0001
0.0002
0.0003
0.0004
1 10 100 1000 10000 100000 1000000
Dif
fere
nti
al
intr
usi
on (
mL
/g/n
m)
Pore size diameter (nm)
Fresh activated carbon

Appendix A
270
(c)
Figure A.3 Mercury porosimetry of (a) Fresh Co-Mo, Ni-Mo, and Regenerated Co-Mo
catalysts, (b) activated carbon and (c) alumina support.
A.3 Properties of the Alumina and Activated Carbon Guard Bed Materials
The activated carbon (AC) used in this study was purchased from Sigma-Aldrich,
United Kingdom. The trilobe alumina (Al2O3) purchased from Johnson Matthey PLC Catalyst
& Chemical Division, England, was also used as a guard bed. The physical properties of both
the AC and alumina are presented in Table A.1.
Parameter Activated carbon Alumina support
Surface area (m2.g
-1) 819.9 114.6
Micropore volume (m3.g
-1) 0.3087 12.4
External surface area (m2.g
-1) 168.9 102.2
Average pore diameter (nm) 411.6 8.2
0
0.04
0.08
0.12
0.16
1 10 100 1000 10000 100000 1000000
Dif
fere
nti
al
inst
rusi
on (
mL
/g/n
m)
Pore size diameter (nm)
Fresh alumina
Table A.1 Properties of the activated carbon and alumina support used as guard bed.

Appendix A
271
A.4 Properties of prepared Ni/zeolite-alumina and Ni-Mo/Al2O3 catalysts
Prepared Ni/zeolite-alumina catalyst
Support composition (wt. %)
HY-zeolite 32.7
Al2O3 in support 36.2
SiO2 in support 20.8
Catalyst composition (wt. %)
NiO 17
Catalyst physical properties
Shape Cylindrical extrudate
Diameter (mm) 3
Length (mm) 4.3 ± 1.17
Specific surface area (m2/g) 444.1 ± 5.85
Average pore diameter (Å) 62.3
Commercial Ni-Mo/Al2O3
Support composition (wt.%)
Al2O3 in support 38.3
SiO2 7.9
Catalyst composition (wt. %)
NiO 9.8
MoO3 40.8
Catalyst physical properties

Appendix A
272
Shape Cylindrical extrudate
Diameter (mm) 1.6
Length (mm) 4.1 ± 1.88
Specific surface area (m2/g) 239.7 ± 1.52
Average pore diameter (Å) 85.2
A.4.1 Nitrogen adsorption-desorption isotherm
Figure A.4 N2 adsorption-desorption isotherm for the commercial Ni-Mo/Al2O3 and prepared
Ni/zeolite-based catalyst both cylindrically shaped.
0
50
100
150
200
250
300
350
0 0.2 0.4 0.6 0.8 1 1.2
Vo
lum
e ad
sorb
ed (
cm3/g
)
Relative pressure (P/Po)
Prepared Ni/Zeolite-alumina
Commercial Ni-Mo/Alumina

Appendix B
273
Appendix B
Effect of Feedstock on Impurities Removal
B.1 Effect of Feedstock on Impurities Removal
One primary objective of catalytic upgrading is to remove impurities such as
heteroatom and metal-containing compounds from the heavy oil. The cost of downstream
processing however is influence by the content of sulphur and metals (Javadli and Klerk,
2012). The sulphur and metals content of the oils before and after catalytic upgrading process
with Co-Mo/alumina catalyst at 425 oC is presented in Table B.1. It is clear that for feedstock-
A and B, the sulphur and metals content of the produced oils after CAPRI process was
remarkably reduced. It can be observed that after CAPRI with Co-Mo catalyst at 425oC, the
sulphur content was reduced from 3.8 to 3.55 wt.% for feedstock-A and from 3.52 to 3.4 wt.%
for feedstock-B. This indicates 6.6 and 3.41 % desulphurisation reactions, respectively. This
low level of desulphurisation is due to the refractory nature of the sulphur compounds as the
oil becomes heavier (Javadli and Klerk, 2012). This is expected because feedstock-A contains
has more sulphur content than feedstock-B. The sulphur in the organosulphur compound is
commonly removed as hydrogen sulphide in the off-gas stream.
On the other hand, the Ni + V content was lowered from 206 to 181 ppm for
feedstock-A and from 149 to 124 ppm for feedstock-B. The percentage removal therefore is
12.1 and 16.8 %, respectively for feed oil A and B after catalytic upgrading process. Ancheyta
et al. (2002) pointed out that nickel and vanadium are mostly associated with the asphaltenes
fractions in the oil. Therefore, high conversion of asphaltenes promotes the removal of nickel
and vanadium metals. In the light of this, higher removal of Ni + V from feedstock-B can be

Appendix B
274
attributed to the 52.4 % conversion of asphaltenes against 46.8 % for feedstock-A. Also, the
iron, zinc, and boron content reduced significantly after catalytic upgrading process.
Impurities Feed-A After Feed-B After
Aluminium (ppm) 6 7 2 2
Boron (ppm) 9 0.8 3 2
Calcium (ppm) 0.8 0 1 < 1
Cobalt (ppm) < 1 0 < 1 < 1
Chromium (ppm) 0.4 0.3 < 1 < 1
Iron (ppm) 36 3 5 < 1
Molybdenum (ppm) 6 3 < 1 < 1
Sodium (ppm) < 7 3 < 7 < 7
Nickel (ppm) 56 50 41 34
Vanadium (ppm) 150 131 108 90
Phosphorus (ppm) 0.3 0.1 < 1.5 < 1.5
Sulphur (wt.%) 3.8 3.55 3.52 3.4
Silicon (ppm) 0.4 1 1 < 1
Zinc (ppm) 2 0.3 < 1 < 1
Ni + V (ppm) 206 181 149 124
* Sulphur and metals content was performed by Intertek Laboratories Sunbury Technology
Centre, UK, using ICP-OES (Inductively Coupled Plasma Optical Emission Spectrometry).
Table B. 1 Sulphur and metals before and after catalytic upgrading process at temperature
425°C; Reaction Media N2, Pressure 20 barg, Oil flow rate 1 mL.min-1
, Gas flow rate 500
mL.min-1
, Catalyst: Co-Mo/Al2O3.

Appendix C
275
Appendix C
Effect of Reaction Gas Media on Spent Catalyst Coke Content
C.1 Effect of Reaction Gas Environment on Spent Catalyst Coke Content
Coke formation is an inevitable by-product during catalytic upgrading of heavy crude
oil. Its deposition decreases catalyst activity, and can be determined as the weight percent of
coke on the catalyst (Maity, et al., 2012; Hart, et al., 2013a). The term coke is used to describe
a carbonaceous material of reasonably low hydrogen content (Hollander, et al., 1998). The
spent Co-Mo/Al2O3 catalysts after reaction under hydrogen, methane, THAI gas, and nitrogen
environments were analysed using TGA, the TG and DTG curves as presented in Figure C.1.
The weight loss at the start of first peak around 200 oC is for the soft coke on the catalyst,
whilst the weight loss from the start of the peak around 526 oC (see DTG curves) is sharp and
prominent, and signified the start of hard coke burn-off.
Figure C.1 TG and DTG of spent Co-Mo/γ-Al2O3 catalyst after 6 hours time-on-stream
reaction under hydrogen, methane, THAI gas, and nitrogen atmospheres at reaction
temperature of 425 oC, pressure 10 barg, and gas-to-oil ratio 50 mL.mL
-1.

Appendix C
276
The coke contents of the spent catalysts under the different reaction media are presented in
Table C.1. It can be observed that the coke content of the spent catalyst after 6 hours time-on-
stream operation under a hydrogen atmosphere was lower than those of methane, THAI gas,
and nitrogen at the same reaction conditions.
Table C.1Coke content of spent Co-Mo/γ-Al2O3 catalyst under hydrogen, methane, THAI gas
and nitrogen atmospheres at reaction temperature of 425 oC, pressure 10barg, and gas-to-oil
ratio 50 mL.mL-1
, after 6 hours time-on-stream operation.
Reactants
Coke content of the spent
catalyst (wt.%)
Heavy oil + Co-Mo + H2 17.4 ± 0.82
Heavy oil + Co-Mo + CH4 20.4 ± 1.32
Heavy oil + Co-Mo THAI gas 20.8 ± 0.97
Heavy oil + Co-Mo + N2 23.5 ± 1.06
The spent catalyst coke contents are 6 % (hydrogen), 3.1 % (methane) and 2.7 %
(THAI gas) respectively lower than that obtained after upgrading under nitrogen (23.5 wt.%).
This implies that hydrogen and methane in the reacting media were involved in the upgrading
reactions, hence most of the upgrading in nitrogen media can be attributed largely to carbon-
rejection with a low degree of hydrogenation occurring (Hart, et al., 2013a,b; section 5.2.5).
During the CAPRI process, most of the C-C bond cleavages take place through a free
radical mechanism described above, in which thermal cracking forms distillable fractions with
lower molecular weight; the asphaltene molecules lose their paraffin side chains through de-
alkylation reactions and in the process large aromatic radicals are produced (Liu, et al., 2013;
Qi, et al., 2012; Zhao, et al., 2001). The subtraction of hydrogen rich components such as
hydrogen, methane, and ethane by the gas phase radicals from the oil-phase and coke
precursor molecules are therefore a potential contributor to the growth of coke lay-down on

Appendix C
277
the catalyst. The active hydrogen and methyl species in hydrogen, methane and THAI gas
reaction environment are thought to suppress the addition reactions of coke precursors, and
cause less coke formation because they subsequently inhibit the dehydrogenation reaction
occurring after the condensation of poly-aromatics. In contrast, with nitrogen gas, these large
radicals cross-link together, condense and finally form coke through hydrogen-subtraction.
With hydrogen/methane, the produced large aromatic radicals are terminated by the released
active hydrogen and methyl suppressing coke formation (Liu, et al., 2013; Qi, et al., 2012).
Consequently the coke content of the spent catalyst under methane atmosphere is notably
lower than that reacted under nitrogen (see Table C.1).
Deactivation of a catalyst can occur by poisoning, aging, fouling and sintering;
however the major cause of deactivation in CAPRI is thought to be the formation of coke
(Gray, et al., 1999). In the light of this, the nitrogen adsorption-desorption isotherms for the
fresh and spent Co-Mo/Al2O3 catalyst recovered from the CAPRI reactor after 6 hours
upgrading under hydrogen, methane, and nitrogen gas media were determined and are
presented in Figure C.2. The percentage loss in specific surface area in the different reaction
media are as follows: 57.2 % for hydrogen, 68 % for methane, and 96 % for nitrogen relative
to the fresh catalyst with specific surface area 214.4 m2g
-1.
The nitrogen adsorption-desorption of the spent catalyst recovered after upgrading
reaction with THAI gas was not conducted because it contains a large amount of oil in both
duplicate experimental runs which can create a vapour pressure and damage the
Micromeretics Analytical Instrument ASAP® 2010 used. If dried externally the residual oil on
the spent catalyst will add to surface area loss. However, Table C.1 shows that the coke
content of the spent catalyst with methane and THAI gas were approximately 20 wt.%

Appendix C
278
compared to 23.5 wt.% with nitrogen. Therefore, the loss in specific surface area for THAI
gas could be in the same range as that for methane gas.
Figure C.2 Nitrogen adsorption-desorption isotherm of fresh and spent Co-Mo after 6 hours
reaction in hydrogen, methane, and nitrogen media at reaction temperature of 425 oC, pressure
10 barg, and gas-to-oil 10 mL.mL-1
.
The reaction environment changes pathways of the upgrading reactions as well as
interactions of molecules with the catalytic sites. For example under hydrogen environment
sulphur and/or metal containing hydrocarbon first got adsorbed on the acid sites of the
catalysts before cracking reactions proceed as illustrated in Figure C.3.

Appendix C
279
Figure C.3 HDM and HDS reactions under hydrogen atmosphere.
At the surface of the catalyst the cracked sulphur react with hydrogen and is removed
as H2S, while the generated active hydrocarbon chains (i.e., R1 and R2) are hydrogenated to
stable molecules and released into the oil phase (see Figure C.3). This reaction is dependent
on hydrogen availability and catalyst age. In hydrogen limited atmosphere therefore the
hydrocarbon active chains re-unite to form larger molecules. In the light of this, the collective
changes such as TBP distribution, sulphur and metals removal, and coke formation evident
under hydrogen, methane, THAI gas, and nitrogen gas emerge from the interaction between
the oil molecules, catalytic active sites and reaction gas media.
The surface areas are consistent with the coke contents of catalyst presented in Table
C.1, showing that hydrogen and methane are effective reactants during catalytic upgrading to
reduce coke deposition in the catalyst pores compared to nitrogen. The three stages of catalyst
deactivation by coke are as follows: 1) rapid formation of initial coke with remarkable loss of
catalytic activity; 2) gradual build-up of coke and metal deposits resulting in further loss of
activity; and 3) pore blockage due to progressive deposition of coke and metals leading to loss
R1-S-R2
CoMo/Al2O3
or
NiMo/Al2O3
HDS
H2S
R1H
R2H
CnH2n+2
CnH2n
HDM
+ H2

Appendix C
280
of activity (Gray, et al., 1999). Coke build up under nitrogen was higher than hydrogen,
methane and THAI gas reaction media (Figure C.1), which is thought to be due to the inert
nature of nitrogen which does not suppress poly-aromatics radical addition reactions. The
losses in pore volume and surface area of the spent catalyst reacted under nitrogen atmosphere
are an indication of pore mouth plugging (Hart, et al., 2013a; Ancheyta, et al., 2002; Puron, et
al., 2013; Hart, et al, 2013b) caused by the deposition of asphaltenes and coke (Hart, et al.,
2013). The small pores within the catalyst not only hinder access of macromolecules to the
active sites but also are preferential sites for coke deposition, resulting in pore blockage and
surface area loss (Puron, et al., 2013). Micro-structural properties of the catalyst support such
as surface area and porosity, therefore determine to a certain degree the ability of the catalyst
to adsorb asphaltenes and coke deposits.
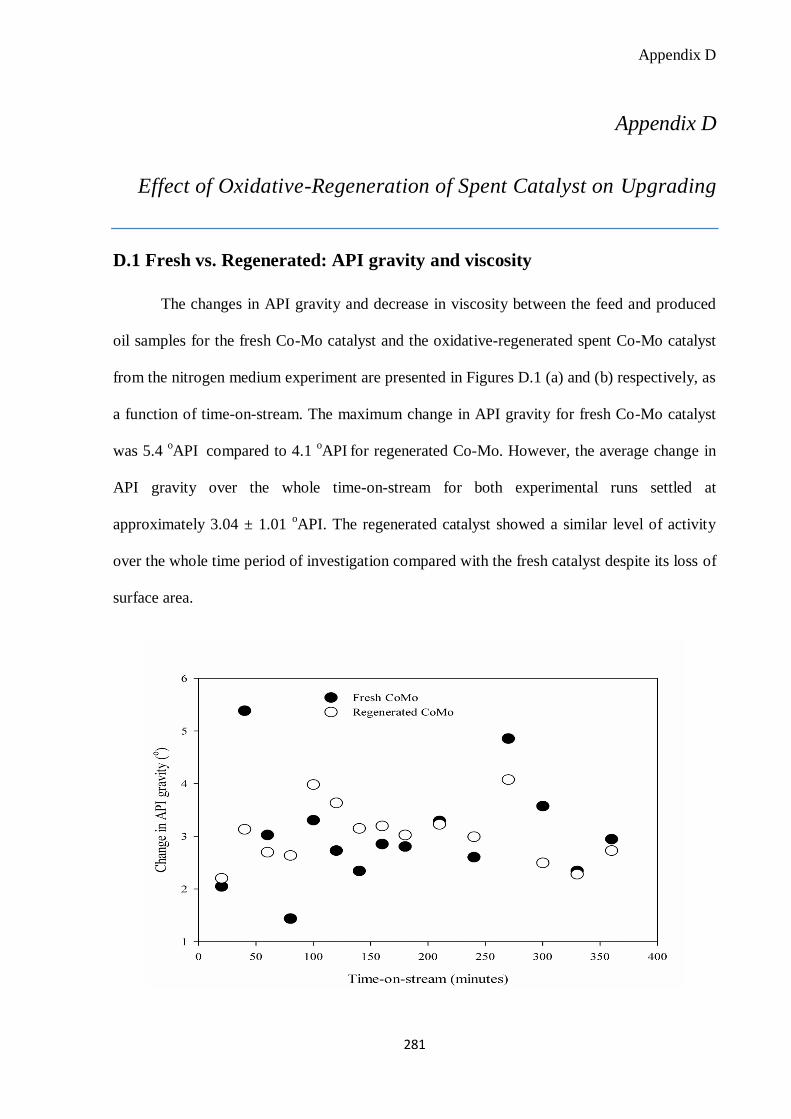
Appendix D
281
Appendix D
Effect of Oxidative-Regeneration of Spent Catalyst on Upgrading
D.1 Fresh vs. Regenerated: API gravity and viscosity
The changes in API gravity and decrease in viscosity between the feed and produced
oil samples for the fresh Co-Mo catalyst and the oxidative-regenerated spent Co-Mo catalyst
from the nitrogen medium experiment are presented in Figures D.1 (a) and (b) respectively, as
a function of time-on-stream. The maximum change in API gravity for fresh Co-Mo catalyst
was 5.4 oAPI
compared to 4.1
oAPI
for regenerated Co-Mo. However, the average change in
API gravity over the whole time-on-stream for both experimental runs settled at
approximately 3.04 ± 1.01 oAPI. The regenerated catalyst showed a similar level of activity
over the whole time period of investigation compared with the fresh catalyst despite its loss of
surface area.

Appendix D
282
(a)
(b)
Figure D.1 Change in API gravity (a) and degree of viscosity reduction (b) for the produced
oil using fresh Co-Mo catalyst and oxidative-regenerated spent Co-Mo catalyst from the
nitrogen medium experiment at reaction temperature of 425 oC, pressure 10 barg, and
nitrogen-to-oil ratio 50 mL.mL-1
.
In Figure D.1b, there is no significant difference in the trend of viscosity reduction as
a function of time-on-stream between the use of fresh and rejuvenated Co-Mo catalyst.
Notably, the average viscosity reduction in both runs was approximately 90 %. This trend is
consistent with that of the API gravity.
D.2 Fresh vs. regenerated: TBP distribution
In Figure D.2, the simulated distillation curves for the feed and produced oil samples
with fresh Co-Mo catalyst and oxidative-regenerated spent Co-Mo from experiment

Appendix D
283
performed under nitrogen reaction media are presented. It is clear from the curves that
distillates in the produced oil from fresh Co-Mo were improved compared with regenerated
Co-Mo. Conversion of 29.5 % of343 oC+ hydrocarbons from the feed oil into low boiling
products occurred for the fresh Co-Mo and 25 % for the regenerated Co-Mo catalysts,
showing a further decrease of 4.5 % after regeneration of the spent Co-Mo catalyst.
Figure D.2 TBP distribution curves for feed and upgraded oils obtained from using fresh Co-
Mo catalyst and oxidative-regenerated spent Co-Mo catalyst from the nitrogen atmosphere
experiment at reaction temperature of 425 oC, pressure 10 barg, and nitrogen-to-oil ratio
50mL.mL-1
.
This is concluded to be because some of the catalyst active sites may have been fouled
and poisoned by coke and metal during the first experimental run, as the deposited coke and
metals on the spent catalyst were not completely removed by oxidative-regeneration (see
Chapter 5 and Figures 5.9 & 5.10). The catalytic upgrading reaction is a complicated process
where molecules in the feedstock become adsorbed onto the catalyst acid sites first before
reaction proceeds. Therefore, the strength of the acid sites of the oxidative-regenerated Co-
Mo/alumina could have been weakened by the deposits after the first experimental use (Ho, et

Appendix D
284
al., 1992). This can limit the cracking ability of the regenerated Co-Mo/alumina catalyst
leading to the observed low conversion and yield of low-boiling distillates. Also, the narrower
pore size of the regenerated Co-Mo catalyst as revealed by the adsorption-desorption isotherm
presented in Figure 5.9 does not grant the large molecules access to the acid sites.
D.3 Fresh vs. Regenerated: Spent Catalyst Coke Content
A comparison between the TG and DTG curves of the spent Co-Mo catalyst obtained
with the nitrogen reaction medium before and after oxidative-regenerated was conducted are
presented in Figure D.3 after 6 hours time-on-stream experiment. The coke contents of the
fresh and regenerated catalysts were 23.48 and 24.73 %, respectively. It was noted that the
coke content of the rejuvenated sample after reaction was 1.25 % higher than the catalyst used
only once, which indicates that regeneration promotes the propensity of the catalyst to support
the formation of coke.
Figure D.3 TG and DTG curves of the spent Co-Mo catalyst obtained with the nitrogen
reaction medium before and after oxidative-regenerated was conducted after 6 hours time-on-
stream reaction at temperature of 425 oC, pressure 10 barg, and nitrogen-to-oil ratio
50mL.mL-1
.

Appendix D
285
The elevated yield of highly poly-aromatic coke corresponds to faster catalyst
deactivation (Greaves, et al., 2012), with lower yield of liquid hydrocarbons of low boiling
points upon the use of regenerated relative to fresh catalyst as reflected by the data shown in
Figure D.2 and also by the SEM photomicrograph of the fresh and regenerated Co-
Mo/alumina catalysts shown in Chapter 5, Figure 5.10. Additionally, the narrow pore
structure of the regenerated catalyst could have to high coking.

Appendix E
286
Appendix E
Hydrocracking of Anthracene
E.1 Results and Discussion
The conversion of anthracene as a function of time-on-stream and temperature are
shown in Figure E.1. It is clear that the conversion of anthracene increased as reaction
temperature increases from 350 to 400 oC. This result is in line with that reported by Zhang et
al. (1998) on the hydrogenation of anthracene over active carbon-supported nickel catalyst
and Chareonpanich et al. (1996) on HDC of anthracene using USY-zeolite.
Figure E.1 Hydroconversion of anthracene with time at 350 and 400oC, using Co-Mo/Al2O3
catalyst.
Consequently, the hydroconversion of the anthracene could follow the sequence three-
fused-ring aromatic (i.e., anthracene) → two-fused-ring aromatics (e.g., naphthalene) →

Appendix E
287
monoaromatics (e.g., benzene) → olefins → paraffin. The presence of olefins and paraffin in
the produced gas presented in Table E.1 confirmed the above mentioned sequence, which
consists of hydrogenation of aromatic ring to naphthenic ring, followed by ring-opening and
subsequently, side chain splitting.
Table E.1 Gas yield during the hydrocracking of anthracene.
Gas component
350 oC
Yield (vol.%)
400 oC
Yield (vol.%)
Methane (CH4) 0.16 0.09
Ethane (C2H6) 0.16 0.21
Ethene (C2H4) 0.12 0.17
Propene (C3H6) 0.23 0.27
i-butane (C4H10) 0.04
Trans-2-butene (C4H8) 0.032 0.037
Moreover, analyses of collected liquid samples using GC connected to mass spectrometer
(GC-MS) indicate the presence of the following: (a) 1,4-diethyl-benzene, (b) 1-
propenylbenzene, (c) 9,10-dihydroanthracene, (d) 2-methylnaphthalene, and (e) 1-ethyl-
benzene as shown in Figure E.2. Pinilla et al. (2013a,b) also reported the formation of these
products upon anthracene catalytic cracking with steam as hydrogen-donor.
The hydroconversion reaction could have occurred through two possible pathways:
one is the hydrogenation of the middle ring and the other is the outer ring leading to the
formation of naphthenic ring (Chareonpanich, et al., 1996; Guan, et al., 2003). The naphthenic
ring undergoes ring opening to aliphatic hydrocarbon substitute and subsequent dealkylation
(i.e., cleavage of side chain). The formation of C1-C4 gases confirms the dealkylation
reactions. Therefore, the anthracene being a tricyclic aromatic compound has been converted

Appendix E
288
to mono- (e.g., benzene, toluene, etc.) and di-aromatic (e.g., naphthalene, etc.) compounds
along with their alkylated derivatives and cracked to C1-C4 hydrocarbons (see Table E.1).
Based on the identified products from the conversion of anthracene, the proposed reaction
pathway for hydroconversion of anthracene, therefore, is presented in Figure E.3.
Figure E.2 Identified products of the catalytic cracking of anthracene at 400 oC using Co-
Mo/Al2O3 catalyst in hydrogen atmosphere: (a) 1,4-diethyl-benzene, (b) 1-propenylbenzene,
(c) 9,10-dihydroanthracene, (d) 2-methylnaphthalene, and (e) 1-ethyl-benzene.
Figure E.3 Modified reaction pathway for hydrogenation and hydrocracking of anthracene
using Co-Mo/Al2O3 catalyst, where BTX (i.e., benzene, toluene, and xylene derivatives) and
R is alkyl hydrocarbon.
Pinilla et al. (2013a) pointed out that the formation of naphthalene from anthracene is
commonly recognized as the key reaction pathway in the hydroconversion reaction through an
orderly occurrence of hydrogenation, isomerisation, and cracking reactions. They also found
that the opening of the central ring leads to the formation valuable intermediates such as
monocyclic products.
(a) (b) (c)
(d) (e)
+ C1-C4

Appendix F
289
Appendix F
Fixed-Bed and Dispersed Catalyst
F.1 Catalysts characterisation
The nitrogen adsorption-desorption isotherm of the pellets and crushed Co-Mo/γ-
Al2O3 is presented in Figure F.1. Though the pore volume has decreased after pulverisation,
the isotherm revealed that the shape of the hysteresis loop are identical and almost matches
the values of the pelleted catalyst. This indicates there is not much modification to the pore
and microstructures of the catalyst upon pulverisation.
Figure F.1 Nitrogen adsorption-desorption isotherm of pulverised and pellets Co-Mo/Al2O3.
F.2 Reynolds Number of Fixed-Bed and Batch Reactors
In Table F.1, the heavy oil, fixed-bed and batch reactors properties are presented. Equations 1
and 2 were used to calculate the Reynolds number of the fixed-bed and batch reactors,
respectively.
0
50
100
150
200
250
300
350
0 0.2 0.4 0.6 0.8 1 1.2
Vo
lum
e ad
sorb
ed (
cm3g
-1)
Relative pressure (P/Po)
CoMo/alumina pellets
CoMo/alumina pulverised

Appendix F
290
Table F.1 Characteristics of heavy oil, fixed-bed and batch reactors.
Parameter Value
Density of heavy oil, ρ (kg.m-3
) 974.5
Velocity of oil, vs (m.s-1
) 0.0032
Viscosity of heavy oil, µ (Pa.s) 1.091
Porosity of the fixed-bed, ɛ 0.48
Diameter of impeller, D (m) 0.01
Equivalent particle diameter, dp (m) 0.035
(1)
(2)
where; N number of revolution per second
From eq. (1), the Reynolds number of the fixed-bed reactor is 0.1951. Therefore, the stirring
speed of the batch reactor impeller that will give the same Reynolds number can be calculated
using eq. 2. This gives 2.2 revolutions per second (i.e., 132 rpm).

Appendix G
291
Appendix G
Publications and Conferences
G.1 Publications (available upon request)
G.1.1 Journal Papers
1. Hart Abarasi, Leeke Gary, Greaves Malcolm, Wood Joseph, (2014) Downhole Heavy
Crude Oil Upgrading Using-CAPRI: Effect of Steam upon Upgrading and Coke Formation,
Energy & Fuels, 28 (3), 1811-1819.
2. Hart Abarasi, Leeke Gary, Greaves Malcolm, Wood Joseph, (2014) Down-hole heavy
crude oil upgrading by CAPRI: Effect of hydrogen and methane gases upon upgrading and
coke formation, Fuel, 119, 226-235.
3. Hart Abarasi, Shah Amjad, Leeke Gary, Greaves Malcolm, Wood Joseph, (2013)
Optimization of the CAPRI process for heavy oil upgrading: Effect of hydrogen and guard
bed, Industrial & Engineering Chemistry Research, 52 (44), 15394-15406.
G.1.2 Conferences Papers and Presentations
1. Hart Abarasi, Leeke Gary, Greaves Malcolm, Wood Joseph, (2013) Will heavy oil and
bitumen be a significant source of energy in the next decades? Poster presented at the MEGS
IV Annual Conference, Public Engagement with Energy, Loughborough, 12-13 September.

Appendix G
292
2. Hart Abarasi, Abdullah Al-Marshed, Amjad Shah, Gary Leeke, Malcolm Greaves and
Joseph Wood, (2013) Prolonging Catalyst Lifetime in the THAI-CAPRI Process for
Enhanced Oil Recovery, 34th
International Energy Agency (IEA)-Enhanced Oil Recovery
(EOR) Annual Workshop & Symposium, Stavanger, Norway, September 8-13 (oral
presentation).
3. Hart Abarasi, Leeke Gary, Greaves Malcolm, Wood Joseph, (2013) Laboratory Scale
Investigation of CAPRI Upgrading of Heavy oil and Bitumen, Poster presented at Catalysis
and Chemical Engineering (IChemE), Institute of Physics, London, 4 June.
4. Hart Abarasi, Leeke Gary, Greaves Malcolm, Wood Joseph, (2013) Down-hole catalytic
upgrading of heavy oil and bitumen to meet tomorrow’s energy needs: the THAI-CAPRI
process, Proceedings of the 3rd
North American Symposium on Chemical Reaction
Engineering, Houston, Texas, March 17-20 (oral presentation and paper on CDROM).
5. Hart Abarasi, Leeke Gary, Greaves Malcolm, Wood Joseph, (2012) Sustaining Petroleum-
based Energy Source through the Recovery and Upgrading of Heavy oil and Bitumen using
THAI-CAPRI, Poster presented at MEGS III Annual Conference; Systems Thinking in
Energy,Available:http://www.megs.ac.uk/megs/imagesmultimedia/documents/abarasihart.pdf,
Birmingham, 18-19 September.
6. Hart Abarasi, Leeke Gary, Greaves Malcolm, Wood Joseph, (2012) Control of Catalyst
Deactivation in THAI-CAPRI Process for In-Situ Oilsand Recovery and Upgrading, Paper
presented at the World Heavy Oil Congress Conference, Aberdeen, 10-13 September, 2012
(oral presentation and paper on CDROM).
7. Hart Abarasi, Leeke Gary, Greaves Malcolm, Wood Joseph, (2012) Minimising Catalyst
Deactivation in THAI-CAPRI Process for Heavy Oil Recovery and Upgrading by using

Appendix G
293
Guard Bed, Paper presented at the IChemE-RSC Applied Catalysis and Reaction Engineering
Young Researchers Focus Conference, Warwick, 19-20 April, 2012 (oral presentation).
8. Hart Abarasi, Leeke Gary, Greaves Malcolm, Wood Joseph, (2011) Laboratory Scale
Investigation of the CAPRI Add-on to the THAI Process of Heavy Oil Recovery and
Upgrading In-situ, A Poster Presented at the Midlands Energy Graduate School II Christmas
Event and MEGS Inaugural Lecture, Loughborough, 13 December, 2011.

References
294
References
Abuhesa, B. M., Hughes R., (2009). Comparison of conventional and catalytic in situ
combustion processes for oil recovery, Energy Fuels, 23, 186-192.
Absi-Halabi, M., Stanislaus, A., Al-Mughni, T., (1995). Hydroprocessing of vacuum residues:
relation between catalyst activity, deactivation and pore size distribution, Fuel, 74 (8), 1211-
1215.
Absi-Halabi, M., Stanislaus, A., Trimm, D. L., (1991). Coke formation on catalysts during the
hydroprocessing of heavy oils, Applied Catalysis, 72, 193-215.
Abuhesa, B. M., Hughes, R., (2009). Comparison of conventional and catalytic in situ
combustion processes for oil recovery, Energy Fuels, 23, 186-192.
Alemán-Vázquez, L. O., Cano-Domínguez, J. L., García-Gutiérrez, J. L., (2012). Effect of
tetralin, decalin and naphthalene as hydrogen donors in the upgrading of heavy oils. Procedia
Engineering, 42, 532 – 539.
Alfi, M., Barrufet, A. M., Paulo, D. F. S., Rosana, G. M., (2013). Simultaneous application of
heat and electron particles to effectively reduce the viscosity of heavy deasphalted petroleum
fluids, Energy Fuels, dx.doi.org/10.1021/ef400883z.
Ali, A. F., Hauser, A., Abdullah, H. A., Al-adwani, A., (2006). Accelerated solvent extraction
of spent hydrotreating catalysts: A study on oil and coke fractions, Energy Fuels, 20, 45-53.
Alkhaldi, S., Husein M. M., (2014). Hydrocracking of heavy oil by means of in situ prepared
ultradispersed nickel nanocatalyst, Energy Fuels, 28, 643-649.
Al-Mutairi Adel and Marafi Abdulazim, (2012). Effect of the operating pressure on residual
oil hydroprocessing, Energy Fuels, dx.doi.org/10.1021/ef3011228.
Alpak, O. F., Vink, C. J., Gao, G., Mo, W., (2013). Techniques for effective simulation,
optimization, and uncertainty quantification of the in-situ upgrading process, Journal of
Unconventional Oil and Gas Resources, http://dx.doi.org/10.1016/j.juogr.2013.09.001.

References
295
Al-Saleh, M. A., Hossain, M. M., Shalabi, M. A., Kimura, T., Inui, T., (2003). Hydrogen
spillover effects on Pt-Rh modified Co-clay catalysts for heavy oil upgrading, Applied
Catalysis A: General, 253, 453-459.
Alvarez-Ramirez, F., Edgar, R.-J., Yosadara, R. -M., (2006). Calculation of the interaction
potential curve between asphaltene-asphaltene, asphaltene-resin, and resin-resin systems
using density functional theory, Energy Fuels, 20 (1), 195-204.
Ancheyta, J., (2011). Modeling and simulation of catalytic reactors for petroleum refining,
John Wiley & Sons, Inc., New Jersey, pp.2-8.
Ancheyta, J., Betancourt, G., Marroquin, G., Centeno, G., Castaneda, L.C., Alonso, F.,
Munoz, J. A., Gomez, T. M., Rayo, P., (2002). Hydroprocessing of Maya heavy crude oil in
two reaction stages, Applied Catalysis A: General, 233, 159-170.
Ancheyta, J., Rana, M. S., (2007). Petroleum Engineering-Downstream, Eolss Publishers,
Oxford, UK.
Ancheyta, J., Rana, S. M., Furimsky, E., (2005). Hydroprocessing of heavy petroleum feeds:
Tutorial, Catalysis Today, 109, 3-15.
Angeles, M. J., Leyva, C., Ancheyta, J., Ramirez, S. A., (2013). A review of experimental
procedures for heavy oil hydrocracking with dispersed catalyst, Catalysis Today,
http://dx.doi.org/10.1016/j.cattod.2013.08.016.
Atkins, L., (2011). Heavy crude oil: A global analysis and outlook, available at
www.heavyoilinfo.com/feature-items/heavy-crude-oil-a-global-analysis-and-outlook,
accessed 23/08/2011.
Aysar, J. T., Mujtaba, I. M., Wood, A. S., (2011). Improvement of the middle distillate yields
during crude oil hydrotreatment in a trickle-bed reactor, Energy Fuels, 25, 773-781.
Babich, V. I. and Moulijn, A. J., (2003). Science and technology of novel processes for deep
desulfurization of oil refinery streams: a review, Fuel, 82, 607-631.
Bagci, S., Turna, E. P., Altmos, U., (1998). Steamflooding of medium and light oils in
limestone using 3-D laboratory model, Trans IChemE, Part A, Vol.76, pp. 604-611.

References
296
Bagheri, S. R., Gray, R. M., Shaw, M. J., and McCaffrey, C. W., (2012). In situ observation
of mesophase formation and coalescence in catalytic hydroconversion of vacuum residue
using a stirred hot-stage reactor, Energy Fuels, 26, 3167-3178.
Barman, N. B., Leonidas, S., David, J. K., (1997). Simultaneous determination of oil and coke
contents in spent hydroprocessing catalyst by thermogravimetry, Energy Fuels, 11 (3), 593-
595.
Batholomew, C. H., (1993). Catalytic hydroprocessing of petroleum and distillates,
Proceedings of the AIChE Spring National Meeting, Houston, TX, March 29 – April 1.
Batycky, J., (1997). An assessment of in-situ oil sands recovery processes, J. Can. Petrol.
Technol., 36 (9), 15-19.
Bej, K. S., Dalai, K. A. and Adjaye, J., (2001). Comparison of hydrodehydrogenation of basic
and nonbasic nitrogen compounds present in oil sands derived heavy gas oil, Energy & Fuels,
15, 377-383
Benito, A. M., Martinez, M. T., (1996). Catalytic hydrocracking of an asphaltenic coal
residue, Energy Fuels, 10 (6), 1235-1240.
Biswas, P., Narayanasarma, P., Kotikalapudi, M. C., Ajay, K. D., John, A., (2011).
Characterization and activity of ZrO2 doped SBA-15 supported NiMo catalysts for HDS and
HDN of bitumen derived heavy gas oil, Ind. Eng. Chem. Res., 50, 7882-7895.
Boahene, E. P., Kapil, K. S., Ajay K. D., John, A., (2011). Application of different pore
diameter SBA-15 supports for heavy gas oil hydrotreatment using FeW catalyst, Applied
Catalysis A: General, 402, 31-40.
Brown, R. L., (2010). Microbial enhanced oil recovery (MEOR), Current Opinion on
Microbiology, 13, 316-320.
Bryan, J., Kantzas, A., (2007). Enhanced heavy-oil recover by alkali-surfactant flooding [c],
SPE 110738, Anaheim, California, USA, 462-468.
Butler, R. M., (1985). A new approach to the modelling of steam-assisted gravity drainage, J.
Can. Petrol. Technol., 42-50.

References
297
Butler, R. M., Jiang, Q., Yee, C. T., (1999). Steam and gas push (SAGP) 3: recent theoretical
developments and laboratory results, Presented at the 48th
and 49th
Annual Technical Meeting
of the Petroleum Society of Canada, Calgary, Alberta, Canada, June 14-18.
Butler, R. M.., Mokrys, I. J., (1989). Solvent analogue model of steam-assisted gravity
drainage, AOSTRA J. Res., 5 (1), 17-32.
Butler, R. M., Mokrys, I. J., (1991). A new approach (VAPEX) for recovery heavy oil using
hot water and hydrocarbon vapour, J. Canadian Petrol. Technol., 30 (1), 97-106.
Butler, R. M., Stephens, D. J., (1980). The gravity-drainage of steamheated heavy-oil to
parallel horizontal wells, Paper presented at 31st Annual Technical Meeting of the Petroleum
Society of CIM in Calgary, Canada, May 25-28.
Cai, H. -Y., Shaw, J. M. and Chung, K. H., (2001). Hydrogen solubility measurements in
heavy oil and bitumen cuts, Fuel, 80, 1055-1063.
Carrillo, A. J., Corredor, M. L., (2012). Upgrading of heavy crude oils: Castilla. Fuel
Process. Technol., http://dx.doi.org/10.1016/j.fuproc.2012.09.059.
Castañeda, L. C., Muñoz, J. A., Ancheyta, J., (2012). Combined process schemes for
upgrading of heavy petroleum, Fuel, 100, 110-127.
Castanier, L. M., Brigham, W. E., (2003). Upgrading of crude oil via in situ combustion,
Journal of Petroleum Science and Engineering, 39, 125-136.
Cerqueira, S. H., Evaristo, C. B. Jr., Eduardo, F. S. –A., (1997). Mathematical modelling and
simulation of catalytic cracking of gasoil in a fixed bed: coke formation, Applied Catalysis A:
General, 164, 35-45.
Chareonpanich, M., Zhang, Z. –G., and Tomita, A., (1996). Hydrocracking of aromatic
hydrocarbons over USY-zeolite, Energy Fuels, 10, 927-931.
Chen, J. W., Cao, H. C., (1994). Heavy oil upgrading and change of its chemical structure,
Pet. Ref. Eng., 24 (6), 1-9.

References
298
Chen, L., Zhang, G., Ge, J., Jiang, P., Tang, J., Liu, Y., (2013). Research of the heavy oil
displacement mechanism by using alkaline/surfactant flooding system, Colloids and Surfaces
A: Physicochemical and Engineering Aspects, 434, 63-71.
Chen Shuo and Manos George, (2004). Study of coke and coke precursors during catalytic
cracking of n-hexane and 1-hexene over ultrastable Y zeolite, Catalysis Letters, 96 (3-4), 195-
200.
Chen, Y.W. and Hsu, W. C., (1997). Hydrodemetalation of residue oil over CoMo/alumina-
aluminum-phosphate catalysts in a trickle bed reactor, Ind. Eng. Chem. Res., 36, 2526-2532.
Chianelli, R. R., Rendina, D., Hauptmann, G. E., Lucchesi, J. P., Torres, B., (2013).
Conversion of heavy tar sands with asphaltene chemical structures via catalytic coking using
MoS2 catalytic material, Energy Fuels, dx.doi.org/10.1021/ef4014532.
Chuan, W., Lei, G. -L., Yao, C., Sun, K., Ping-yuan, G., Yan-bin C., (2010). Mechanism for
reducing the viscosity of extra-heavy oil by aquathermolysis with an amphiphilic catalyst, J.
Fuel Chem. Technol., 38 (6), 684-690.
Clark, P. D., Hyne, J. B., (1990). Studies on the chemical reactions of heavy oils under steam
stimulation condition, AOSTRA J. Res., 29, 29-39.
Dai-yin, Y., Hui, P., (2008). Numerical simulation study on surfactant flooding for
permeability oilfield in the condition of threshold pressure, Journal of Hydrodynamics, 20 (4),
492-498.
Das, K., Butler, M. R., (1998). Mechanism of the vapour extraction process for heavy oil and
bitumen, Journal Petroleum Science & Engineering, 21, 43-59.
Deng, S., Yu, G., Jiang, Z., Zhang, R., Ting, Y., (2005). Destabilization of oil droplets in
produced water from ASP flooding, Colloids Surf. A: Physicochem. Eng. Aspects, 252, 113-
119.
Dockner, T., (1988). Reduction and hydrogenation with the system hydrocarbon/carbon,
Angew Chem. Int. Ed., 27 (5), 679-82.

References
299
Dong, M., Shanzhou, M., Qiang, L., (2009). Enhanced heavy oil recovery through interfacial
instability: A study of chemical flooding for Brintnell heavy oil, Fuel, 88, 1049-1056.
Douda, J., Llanos, M. E., Álvarez, R., López Franco, C., Montoya de la. Fuente, J. A., (2004).
Pyrolysis applied to the study of a Maya asphaltenes, Journal of Analytical and Applied
Pyrolysis, 71, 601-612.
Dupain, X., Makkee, M., Moulijn, J. A., (2006). Optimal conditions in fluid catalyst cracking:
A mechanistic approach, Applied Catalysis A: General, 297, 198-219.
Eijsbouts, S., Battiston, A. A., Leerdam van, G. C., (2008). Life cycle of hydroprocessing
catalysts and total catalyst management, Catalysis Today, 130, 361-373.
Elizalde, I., Rodriguez, A. M., Ancheyta, J., (2010). Modeling the effect of pressure and
temperature on the hydrocracking of heavy crude oil by the continuous kinetic lumping
approach, Applied Catalysis A: General, 382, 205-212.
ExxonMobil, (2009). Global experience in Enhanced and Improved Oil Recovery, available at
http://www.exxonmobilchemical.comIOGCECTechnology-EOR-insert-en.pdf, accessed
10/04/2011.
Fainberg, V., Podorozhansky, M., Hetsroni, G., Brauch, R., Kalchouck, H., (1996). Changes
in the composition and properties of the vacuum residues as a result of visbreaking, Fuel Sci.
Technol. Int., 14, 839.
Fanaritis, J. P., Chilingarian, V. G., (1989). Steam enhanced oil recovery, Development in
Petroleum Science, 19 (2), 221-282.
Fan, H., Liu, Y., Zhao, X. A., (2001a). study on heavy oil recovery by in-situ catalytic
aquathermal cracking, Oilfield Chem., 8 (1), 13-16.
Fan, H. -F., Liu, Y. -J., Zhong, L. -G., (2001b). Studies of the synergetic effects of mineral
and steam on the composition changes of heavy oils, Energy Fuels, 15, 1475-1479.
Fan, H.-F., Zhang, Y., Lin, Y., (2004). The catalytic effects of minerals on aquathermolysis of
heavy oils, Fuel, 83, 2035-2039.
Farouq, A., (1997). Is there life after SAGD? J. Can. Petrol. Technol., 36 (6), 20-23.

References
300
Fatemi, S. M., Jamaloei, Y. B., (2011). Preliminary considerations on the application of toe-
to-heel steam flooding (THSF): Injection well-producer well configurations, Chemical
Engineering Research and Design, doi:10.1016/j.cherd.2011.03.007.
Fathi, M. M. and Pereira-Almao, P., (2013). Kinetic modelling of Arab light vacuum residue
upgrading by aquaprocessing at high space velocities, Industrial & Engineering Chemistry
Research, 52, 612-623.
Ferreira C., Tayakout-Fayolle M., Guibard I., Lemos F., Toulhout H., Ramoa-Ribero, F.,
(2012). Hydrodesulfurisation and hydrodemetallization of different origin vacuum residues:
characterization and reactivity, Fuel, 98, 218-228.
Fesharaki, J. M., Ghashghaee, M., Karimzadeh, R., (2013). Comparison of our nanoporous
catalysts in thermocatalytic upgrading of vacuum residue, Journal of Analytical and Applied
Pyrolysis, 102, 97-102.
Flores, E., (2010). Heavy oil upgrading, Technology Today, Spring, Available at
www.swri.org, accessed 15/05/2011, pp.10-15.
Focus, (2006). Bitumen and heavy crudes: the energy security problem solved? Oil and
Energy Trends, 31 (6), 3-6.
Froment, G. F., (1991). The modelling of catalyst deactivation by coke formation, Rev. Chem.
Eng., 6 (4), 295-328.
Fukuyama, H., Terai, S., Uchida, M., Cano, L. J., Ancheyta, J., (2004). Active carbon catalyst
for heavy oil upgrading, Catalysis Today, 98, 207-215.
Fumoto, E., Akimitsu, M., Sato, S., Takanohashi, T., (2009). Recovery of lighter fuels by
cracking heavy oil with zirconia-alumina-iron oxide catalysts in a steam atmosphere, Energy
Fuels, 23, 1338-1341.
Fumoto, E., Matsumura, A., Sato, S., Takanohashi, T., (2009). Recovery of lighter fuels by
cracking heavy oil with zirconia-alumina-iron oxide catalysts in a steam atmosphere, Energy
Fuels, 23, 1338-1341.

References
301
Fumoto, E., Sato, S., Takanohashi, T., (2011). Production of light oil by oxidative cracking of
oil sand bitumen using iron oxide catalysts in a steam atmosphere, Energy Fuels, 25, 524-527.
Furimsky, E., (2009). Lowered emissions schemes for upgrading ultra heavy petroleum feeds,
Ind. Eng. Chem. Res., 48, 2752-2769.
Furimsky, E., Massoth, F. E., (1999). Deactivation of hydroprocessing catalysts, Catal.
Today, 52, 381.
Galarraga, E. C., Pereira-Almao, P., (2010). Hydrocracking of Athabasca bitumen using
submicronic multimetallic catalysis at near in-reservoir conditions, Energy Fuels, 24, 2383-
2389.
Galarraga, E. C., Scott, C., Loria, H., Pereira-Almao, P., (2012). Kinetic models for upgrading
Athabasca bitumen using unsupported NiWMo catalyst at low severity conditions, Ind. Eng.
Chem. Res., 51, 140-146.
Gao, H., Wang, G., Li, R., Xu, C., Gao, J., (2012). Study on the catalytic cracking of heavy
oil by proper cut for higher conversion and desirable products, Energy Fuels, 26, 1880-1891.
Gao, L., Liu, Y., Wen, L., Huang, W., Mu, X., Zong, B., Fan, H., Han, B., (2010). The effect
of supercritical water on the hydroconversion of Tahe residue, Environ. Energy Eng., 56 (12),
3236-3242.
Garcia-Dopico, M., Garcia, A., and Garcia, A. S., (2006). Modelling coke formation and
deactivation in a FCCU, Applied Catalysis A: General, 303, 245-250.
Gates, D. I., (2007). Oil phase viscosity behaviour in expanding-solvent steam-assisted
gravity drainage, Journal of Petroleum Science and Engineering, 59, 123-134.
Gates, D. I., (2010). Solvent-aided steam-assisted gravity drainage in thin oil sand reservoir,
Journal of Petroleum Science and Engineering, 74, 138-146.
Gates, I. D., Chakrabarty, N., (2006). Optimization of steam assisted gravity drainage in
McMurray reservoir. J. Can. Petrol. Technol., 45, 54–62.

References
302
Gogarty, W. B., Tosch W. C., (1968). Miscible-type waterflooding: Oil recovery with
micellar solutions, J. Petrol. Technol., 1407-1414.
Govreau, B., Marcotte, B., Sheehy, A., Town, K., Zahner, B., Tapper, S., Akintunji, F.,
(2013). Field application of organic oil recovery-A new MEOR method, Enhanced Oil
Recovery Field Case Studies, 581-614.
Graue, J. Dennis, (2001). Upgrading and recovery of heavy crude oils and natural bitumen by
in situ hydrovisbreaking, US Patent No. 6,328,104 B1.
Gray, R. M., (1994). Heavy oil and residue properties and composition, in upgrading
petroleum residue and heavy oils, Marcel Dekker, Inc., New York, NY, pp. 1-40.
Gray, R. Murray and Ayasse R. Alan, (1995). Kinectics of hydrodesulfurization of thiophenic
and sulphide sulphur in Athabasca bitumen, Energy Fuels, 9, 500-506.
Gray, R. M. and McCaffrey, W., (2002). Role of chain reactions and olefin formation in
cracking, hydroconversion, and coking of petroleum and bitumen fractions, Energy Fuels, 16,
756-766.
Gray, R. M., Zhao, Y., and McKnight, C. M., (2000). Coke and mineral removal from
bitumen hydroconversion catalysts, Fuel, 79, 285-294.
Gray, R. M., Zhao, Y., McKnight, M. C., Komar, A. D., Carruthers, D. J., (1999). Coking of
hydroprocessing catalyst by residue fractions of bitumen, Energy Fuels, 13, 1037-1045.
Greaves, M., (2004). Air injection-improved oil recovery strategy for the UK continental
shelf, Business Briefing: Exploration & Production: the Oil & Gas Review, 118-121.
Greaves, M., Dong, L. L., Rigby, S. P., (2012). Simulation study of the Toe-to-Heel Air
Injection three-dimensional combustion cell experiment and effect in the mobile oil zone,
Energy Fuels, 26, 1656-1669.
Greaves, M., El-Saghr, A., Xia, T. X., (2000). CAPRI horizontal well reactor for catalytic
upgrading of heavy oil, Preprints-ACS, Division of Petroleum Chemistry, 47 (4), 595-598.

References
303
Greaves, M., Xia, T. X., (2004). Downhole upgrading of Wolf Lake oil using THAI/CAPRI
processes-tracer tests, Prep. Pap.-Am. Chem. Soc., Div. Fuel Chem., 49 (1), 69-72.
Greaves, M., Xia, T. X., Turta, A. T., (2008). Stability of THAITM
process – theoretical and
experimental observation, Journal of Canadian Petroleum Technology, 47 (9), 65-73.
Greaves, M., Xia, T. X., Turta, A. T., Ayasse, C., (2000a). Recent laboratory results of THAI
and its comparison with other IOR process, SPE/DOE Improved Oil Recovery Symposium,
Tulsa, Oklahoma, 3-5 April.
Greaves, M., Young, T. J., El-Usta, S., Rathbone, R. R., Ren, S. R., Xia, T. X., (2000b). Air
injection into light and medium heavy oil reservoirs: combustion tube studies on West of
Shetland clair oil and light Australian oil, Trans IChemE, Vol.78, Part A, pp. 721-730.
Groenzin, H. G., Mullins, O. C., (2000). Molecular size and structure of asphaltenes from
various sources, Energy Fuels, 14 (3), 677-684.
Guan, C., Wang, Z., Yu, S., Guo, A., and Que, G., (2003). Upgrading petroleum residue by
two-stage hydrocracking, Fuel Processing Technology, 85, 165-172.
Guangshou, S., Zhou, T., Cheng, L., Wang, Y., Tian, G., Pi, J., Zhang, Z., (2009).
Aquathermolysis of conventional heavy oil with superheated steam, Pet. Sci., 6, 289-293.
Habib, K. F., Diner, C., Stryker, M. J., Semagina, N., Gray, R. M., (2013). Suppression of
addition reactions during thermal cracking using hydrogen and sulfided iron catalyst, Energy
Fuels, dx.doi.org/10.1021/ef401904q.
Hart, A., (2013). A review of technologies for transporting heavy crude oil and bitumen via
pipeline, Journal of Petroleum Exploration and Production Technology, DOI:
10.1007/s13202-013-0086-6.
Hart, A., Leeke, G., Greaves, M., and Wood, J., (2012). Control of Catalyst Deactivation in
THAI-CAPRI Process for In-Situ Oilsand Recovery and Upgrading, Proceedings of the
World Heavy Oil Congress Conference, Aberdeen, Scotland, 10-13 September.

References
304
Hart, A., Leeke, G., Greaves, M., and Wood, J., (2013b). Down-hole catalytic upgrading of
heavy oil and bitumen to meet tomorrow’s energy needs: the THAI-CAPRI process, P. of the
3rd
North Am. Symp. Chem. React. Eng., Houston, Texas, March 17-20.
Hart, A., Leeke, G., Greaves, M., Wood, J., (2014a). Down-hole heavy crude oil upgrading by
CAPRI: Effect of hydrogen and methane gases upon upgrading and coke formation, Fuel,
119, 226-235.
Hart, A., Leeke, G., Greaves, M., Wood, J., (2014b). Downhole Heavy Crude Oil Upgrading
Using-CAPRI: Effect of Steam upon Upgrading and Coke Formation, Energy Fuels, 28 (3),
1811-1819.
Hart, A., Shah, A., Leeke, G., Greaves, M., and Wood, J., (2013a). Optimization of the
CAPRI process for heavy oil upgrading: Effect of hydrogen and guard bed, Ind. Eng. Chem.
Res., 52 (44), 15394-15406.
Hashemi, R., Nassar, N. N., Pereira-Almao, P., (2013). Enhanced heavy oil recovery by in
situ prepared ultradispersed multimetallic nanoparticles: A study of hot fluid flooding for
Athabasca bitumen recovery, Energy Fuels, dx.doi.org/10.1021/ef3020537.
Hashemi, R., Nassar, N. N., Pereira-Almao, P., (2013). In situ upgrading of Athabasca
bitumen using multimetallic ultradispersed nanocatalysts in an oil sands packed-bed column:
Part 1. Produced liquid quality enhancement, Energy Fuels, dx.doi.org/10.1021/ef401716h.
Hassanzadeh Hassan, Abedi Jalal, (2010). Modelling and parameter estimation of ultra-
dispersed in situ catalytic upgrading experiments in a batch reactor, Fuel, 89, 2822-2828.
Heck, R. H., Diguiseppi, F. T., (1994). Kinetic effects in resid hydrocracking, Energy Fuels,
8, 557-560.
Hedrick, B. W., Seibert, K. D., Crewe, C., (2006). A new approach to heavy oil and bitumen
upgrading, Report No. AM-06-29, UOP LLC, Des Plaines, Illinois.
Hein, F. J., (2006). Heavy oil and oil (tar) sands in North America: An overview & summary
of contributions, Nat. Resour. Res., 15 (2), 67-84.

References
305
Hirsch, L. R., Bezdek, R., and Wendling, R., (2006). Peaking of world oil production and its
mitigation, Perspective, 52 (1), 2-8.
Ho, T. C., Katritzky, A. R., Cato, S. J., (1992). Effect of nitrogen compounds on cracking
catalysts, Ind. Eng. Chem. Res., 31, 1589-1597.
Hollander, dM. A., Makkee, M., Moulijn, J. A., (1998). Coke formation in fluid catalysic
cracking studies with the microriser, Catalysis Today, 46, 27-35.
Hong, Y. W., Cao, X., Zhang, J., Zhang, A., (2009). Development and application of dilute
surfactant-polymer flooding system for Shengli oilfield, Journal of Petroleum Science and
Engineering, 65, 45-50.
Hongfu, F., Yongjian, L., Liying, Z., Xiaofei, Z., (2002). The study on composition changes
of heavy oils during steam stimulation processes, Fuel, 81, 1733-1738.
Hossain, M. M., Al-Saleh, M. A., Shalabi, M. A., Kimura, T., Inui, T., (2004). Pd-Rh
promoted Co/HPS catalysts for heavy oil upgrading, Applied Catalysis A: General, 278, 65-
71.
Hou, J., (2007). Network modelling of residual oil displacement after polymer flooding,
Journal of Petroleum Science and Engineering, 59, 321-332.
Hsu, C., Robinson, P., (2006). Practical advances in petroleum processing, Vol. 1, Springer
Science + Business Media, Inc, p.22.
Hudgins, D. A., Llave, F. M., Chung F. T. H., (1990). Nitrogen miscible displacement of light
crude oil: A laboratory study, SPE Reservoir Engineering, 5 (1), 100-106.
Hyne, J. B., Greidanus, J. W., Tyrer, J. D., Verona, D., Rizek, C., Clark, P. D., Clarke, R. A.,
Koo, J., (1982). Aquathermolysis of heavy oil, Proceedings of the 2nd
International
Conference on Heavy Crude and Tar Sands, Caracas, Venezuela, 25-30.
Ivanova, A. S., Korneeva, E. V., Bukhtiyarova, G. A., Nuzhdin, A. L., Budneva, A. A.,
Prosvirin, I. P., Zaikovskii, V. I., and Noskov, A. S., (2011). Hydrocracking of vacuum gas oil
in the presence of supported nickel-tungsten catalysts, Kinetics and Catalysis, 52 (3), 446-
458.

References
306
Jabbour, C., Quintard, M., Bertin, H., Robin, M., (1996). Oil recovery by steam injection:
three-phase flow effects, Journal of Petroleum Science and Engineering, 16, 109-130.
Jacob, R. R., (1971). Coke quality and how to make it, Hydrocarbon Process, 9, 132-136.
Jamaloei, B., Yadali, R. K., Koorosh, A., Farshid, T., (2011). The influence of pore
wettability on the microstructure of residual oil in surfactant-enhanced water flooding in
heavy oil reservoirs:Implications for pore-scale flow characterization, Journal of Petroleum
Science and Engineering, 77, 121-134.
Jarullah, T. A., Mujtaba, M. I., Wood, S. A., (2011). Improvement of the middle distillate
yields during crude oil hydrotreatment in a trickle-bed reactor, Energy Fuels, 25, 773-781.
Javadli Rashad and Klerk de Arno, (2012). Desulfurization of heavy oil – oxidative
desulfurization (ODS) as potential upgrading pathway for oil sands derived bitumen, Energy
Fuels, 26, 594-602.
Javadli, R., Klerk, de A., (2012). Desulfurization of heavy crude oil, Appl. Petrolchem. Res.,
1, 3-19.
Jeon, G. S., Na, J. -G., Ko, H. C., Yi, B. K., Rho, S. N., Park, B. S., (2011). Preparation and
application of an oil-soluble CoMo bimetallic catalyst for the hydrocracking of oil sands
bitumen, Energy & Fuels, 25, 4256-4260.
Jian-hong, G., Long, J., Xu, Y., (2008). Protolytic cracking in daqing VGO catalytic cracking
process, Journal of Fuel Chemistry and Technology, 36 (6), 691-695.
Jinzhong, L., Wenlong, G., Youwei, J., Changfeng, X., Bojun, W., Xiaoling, L., (2012).
Propagation and control of fire front in the combustion assisted gravity drainage using
horizontal wells, Petrol. Explor. Dev., 39 (6), 764-772.
Joshi, B. J., Pandit, B. A., Kataria, L. K., Kulkarni, P. R., Sawarkar, N. A., Tandon, D., Ram,
Y., Kumar, M. M., (2008). Petroleum residue upgradation via visbreaking: A review, Ind.
Eng. Chem. Res., 47, 8960-8988.

References
307
Junaid, A. S. M., Street, C., Wang, W., Rahman, M. M., An, W., McCaffrey, W. C.,
Kuznicki, S. M., (2012). Integrated extraction and low severity upgrading of oilsands bitumen
by activated natural zeolite catalysts, Fuel, 94, 457-464.
Kang, W., (2001). Mechanism of the alkaline-surfactant-polymer flooding chemicals in
Daqing oilfield, Vol.1, Petroleum Industry Publishers, Inc., Beijing, Pp.4-15.
Kapadia, R. P., Michael, S., Ian, D. G., (2011). Potential for hydrogen generation from in situ
combustion of Athabasca bitumen, Fuel, 90, 2254-2265.
Kataria, L. K., Rohit, P. K., Aniruddha, B. P., Jyeshtharaj, B. J., Kumar, M. M., (2004).
Kinetic studies of low severity visbreaking, Ind. Eng. Chem. Res., 43, 1373-1387.
Kessick, M. A., (1982). Pipeline transportation of heavy crude oil, US Patent 4, 343, 323.
Kim, J. –W., Longstaff, C. D., Hanson, V. F., (1997). Upgrading of bitumen-derived heavy
oils over a commercial HDN catalyst, Fuel, 76 (12), 1143-1150.
Kim, J. –W., Longstaff, C. D., Hanson, V. F., (1998). Catalytic and thermal effects during
hydrotreating of bitumen-derived heavy oil, Fuel, 77 (15), 1815-1998.
Kisman, K. E., Lau, E. C., (1993). A new combustion process utilizing horizontal wells and
gravity drainage, The CIM 1993 Annual Technical Conference, Calgary, Canada, 9-12 May.
Klerk, d. A., Gray, R. M., Zerpa, N., (2014). Chapter 5 – Unconventional oil and gas:
Oilsands, Future Energy (Second Edition), pp. 95-116.
Korre, C. S. and Klein, T. M., (1995). Polynuclear aromatic hydrocarbons hydrogenation, 1.
Experimental reaction pathways and kinetics, Ind. Eng. Chem. Res., 34, 101-117.
Koshka, E., Kuhach, J., Veith, E., (2008). Improving Athabasca bitumen development
economics through integration with HTL upgrading, World Heavy Oil Congress, Edmonton,
March 2008.
Kressmann, S., More, F., Harle, V., Kasztelan, S., (1998). Recent development in fixed-bed
catalytic residue upgrading, Catalysis Today, 43, 203-215.

References
308
Krumm, L. R., Milind, D., and Petrick, M., (2011). Direct thermal and catalytic Treatment of
Paraffinic crude oils and heavy fractions, Energy Fuels, 26, 2663-2671.
Krumrine, P. H., Falcone Jr., J. S., (1983). Surfactant, polymer and alkaline interactions in
chemical flooding processes, Paper SPE 11778, Proceeding of the SPE International
Symposium on Oilfield and Geothermal Chemistry, Denver, Co, June 1-3, Pp. 79-86.
Lababidi, M. S. H., AlHumaidan, S. F., (2011). Modeling the hydrocracking kinetics of
atmospheric residue in hydrotreating processes by the continuous lumping approach, Energy
Fuels, 25, 1939-1949.
Label, J. P., Moriyama, R. T., (1997). History match of a mature cyclic steam stimulation
process at Cold Lake, Presented at the SPE International Thermal Operations & Heavy Oil
Symposium, held in Bakersfield, California, 10-12 February.
Lau, E. C., Kisman, K. E., (1994). Attractive control features of the combustion override
split-production horizontal well process in a heavy oil reservoir, Presented at the 45th
Annual
Technical Meeting of the Petroleum Society of CIM and AOSTRA, Calgary, June 12-15.
Lazar, I., Petrisor, I. G., Yen, T. F., (2007). Microbial Enhanced Oil Recovery (MEOR),
Petroleum Science and Technology, 25, 1353-1366.
Lee, H. J., Kang, S., Kim, Y., Park, S., (2011). New approach for kinetic modelling of
catalytic cracking of paraffinic naphtha, Industrial & Engineering Chemistry Research, 50,
4264-4279.
Lee, J., Hwang, S., Lee, S. -B., and Song, K. I., (2010). Production of middle distillate
through hydrocracking of paraffin wax over NiMo/TiO2-SiO2 catalysts, Korean J. Chem.
Eng., 27 (6), 1755-1759.
Le Perchec, P., Fixari, B., Elmouchnino, J., Peureux, S., Vrinat, M., Morel, F., (1993). New
developments in deep hydroconversion of heavy oil residues with dispersed catalysts. Part 1:
Thermocatalytic analysis of the transformation with various catalysts precursors, Prepr. –Am.
Chem. Soc., Div. Pet. Chem., 38, 401.
Leyva, C., Rana, S. M., Trejo, F., Ancheyta, A., (2007). On the use of acid-base-support
catalysts for hydroprocessing of heavy petroleum, Ind. Eng. Chem. Res., 46 (23), 7448-7466.

References
309
Li, J., Chen, Y., Liu, H., Wang, P., Liu, F., (2013). Influences on the aquathermolysis of
heavy oil catalyzed by two different catalytic ions: Cu2+
and Fe3+
, Energy Fuels, 27, 2555-
2562.
Li, Z., Wang, G., Liu, Y., Gao, J., Xu, C., Liang, Y., Wang, X., (2013). Study on reaction
performance and competitive adsorption effect during coker gas oil catalytic cracking, Fuel
Processing Technology, 115, 1-10.
Li, Z., Wang, G., Liu, Y., Wang, H., Liang, Y., Xu, C., Gao, J., (2012). Catalytic cracking
constrainsts analysis and divisional fluid catalytic cracking process for coker gas oil, Energy
Fuels, 26, 2281-2291.
Liu, D., Li, Z., Fu, Y., Zhang, Y., Gao, P., Dai, C., Zheng, K., (2013). Investigation on
asphaltene structures during Venezuela heavy oil hydrocracking under various hydrogen
pressures, Energy Fuels, 27, 3692-3698.
Liu, K., Fung, C. S., Ho, C. T., Rumschitzki, S. D., (2003). Hydrogasification of coke in
heptane reforming over Pt – Re/Al2O3, Ind. Eng. Chem. Res., 42, 1543-1550.
Liu, Q., Mingzhe, D., Shanzhou, M., Yun, T., (2007). Surfactant enhanced alkaline flooding
for Western Canadian heavy oil recovery, Colloids and Surfaces A: Physicochem. Eng.
Aspects, 293, 63-71.
Liu, W., Fred, R. W., (1994). Optimal control of three-dimensional steamflooding processes,
Journal of Petroleum Science and Engineering, 11, 137-154.
Liu, Y., Fan, H., (2002). The effect of hydrogen donor additive on the viscosity of heavy oil
during steam stimulation, Energy Fuels, 16 (4), 842-846.
Liu, Z., Cheng, L., Ji, Y., Liu, Q., (2011). Production features of steam and gas push:
comparative analysis with steam assisted gravity drainage, Petroleum Exploration and
Development, 38 (1), 79-83.
Longstaff, D. C., Deo, M. D., Hanson, F. V., (1994). Hydrotreatment of bitumen from the
Whiterocks oil sands deposit, Fuel, 73 (9), 1523-1530.

References
310
Macquarie, R., (2010). The “In situ”-ation Report, available at
www.macquarie.com.au/research/disclosures, accessed 23/04/2011.
Maity, S. K., Ancheyta, J., Marroquin, G., (2010). Catalytic aquathermolysis used for
viscosity reduction of heavy crude oils: A review, Energy Fuels, 24, 2809-281.
Maity, S. K., Blanco, E., Ancheyta, J., Alonso, F., Fukuyama, H., (2012). Early stage
deactivation of heavy crude oil hydroprocessing catalysts, Fuel, 100, 17-23.
Mansur, R. E., Claudia, M. R. de A., Lucas, F. E., (2012). Determination of asphaltene
particle size: Influence of flocculant, additive, and temperature, Energy Fuels,
dx.doi.org/10.1021/ef300365x.
Mapiour, M., Sundaramurthy, V., Dalai, A. K., and Adjaye, J., (2009). Effect of hydrogen
purity on hydroprocessing of heavy gas oil derived from oil-sands bitumen, Energy Fuels, 23,
2129-2135.
Mapiour, M., Sundaramurthy, V., Dalai, A. K., and Adjaye, J., (2010). Effect of hydrogen
partial pressure on hydrotreating of heavy gas oil derived from oil-sands bitumen:
Experimental and kinetics, Energy Fuels, 24, 772-784.
Marafi, M., Stanilaus, A., (2001). Effect of catalyst acidity and feedstock quality on
hydrotreaing catalyst deactivation by coke deposition, Pet. Sci. Technol., 19 (5&6), 697-710.
Marafi, A., Kam, E., Stanislaus, A., (2008). A kinetic study on non-catalytic reactions in
hydroprocessing Boscan crude oil, Fuel, 87, 2131-2140.
Marroquin-Sanchez, G., Ancheyta-Juarez, J., Ramirez-Zuniga, A., Farfan-Torres, E., (2001).
Effect of crude oil properties on the hydrodesulphurisation of middle distillates over NiMo
and CoMo catalysts, Energy Fuels, 15, 1213-1219.
Matsumura, A., Kondo, T., Sato, S., Saito, K., Ferraz de Souza, W., (2005). Hydrocracking
Brazilian Marlin vacuum residue with natural limonite. Part I: catalytic activity of natural
limonite, Fuel, 84, 411-416.
Matthews, C. S., (1989). Carbon dioxide flooding, Developments in Petroleum Science, 17
(2), 129-156.

References
311
Mayer, E. H., Breg, R. L., Carmichael, J. D., Weinbrandt, R. M., (1983). Alkaline injection
for enhanced oil recovery-A status report, Journal of Petroleum Technology, 209-221.
McMillan, D. F., Manion, J. A., Tse, D. S., Malhotra, R., (1994). Hydrogen transfer promoted
ring growth during catalytic resid hydroprocessing, Symposium on Hydrogen Transfer in
Hydrocarbon Processing presented at the Division of Petroleum Chemistry, Inc. at the 208th
National Meeting, American Chemical Society, 422-425.
Mehos, J. G. Ramirez, W. F., (1989). Use of optimal control theory to optimise carbon
dioxide miscible-flooding enhanced oil recovery, Journal of Petroleum Science and
Engineering, 2, 247-260.
Mehran, S., Ali, D., Dabir, H. T., Mahmoud, J., (2008). Microscopic mechanisms of oil
recovery by near-miscible gas injection, Transp. Porous Med., 72, 351-360.
Meng, X., Xu, C., Gao, J., (2007). Coking behaviour and catalyst deactivation for catalytic
pyrolysis of heavy oil, Fuel, 86, 1720-1726.
Meyer, R. F., Attanasi, E. D., (2003). Heavy oil and natural bitumen-strategic petroleum
resources, USGS Fact Sheet 70-03, August. Available at http://pubs.usgs.gov/fs/fs070-
03/fs070-03.html, Accessed April 26, 2011.
Meyer, F. R., Attanasi, E., (2004). Survey of Energy resources, 20th Edition, World Energy
Council, 93-117.
Millan, M., Adell, C., Hinojosa, C., Herod, A.A., Kandiyoti, R., (2008). Mechanisms of
catalytic activity in heavily coated hydrocracking catalysts, Oil & Gas Science and
Technology-Rev. IFP, 63 (1), 69-78.
Ming, L., Wang, J., Deng, W., Que, G., (2007). Effects of Fe/carbon black, Ni/carbon black
catalysts on hydrocracking reaction of residual oil, Journal of Fuel Chemistry and
Technology, 35 (5), 558-562.
Mokrys, I. J., Butler, R. M., (1993). In-situ upgrading of heavy oils by propane deasphalting:
the VAPEX process, SPE 25452, March 21.

References
312
Montel, V., Veronique, L., Benjamin, B., Honggang, Z., (2008). Asphaltene cake properties,
Energy Fuels, 22 (6), 3970-3975.
Moore, R. G., Laureshen, C. J., Mehta, S. A., Ursenbach, M. G., Belgrave, J. D. M.,
Weissman, J. G., Kessler, R. V., (1999). A downhole catalytic upgrading process for heavy
oil using in situ combustion, Journal of Canadian Petroleum Technology, 38(13), Pp. 1-8.
Moore, R. G., Laureshen, C. J., Belgrave, J. D. M., Ursenbach, M. G., and Mehta, S. A.,
(1997). In-Situ combustion heavy oil reservoirs: problems and perspectives, In Situ, 21(1), 1-
26.
Mouli, C. K., Kapil, S., Ajay, D., John, A., (2011). Effect of pore diameter of Ni-Mo/Al-
SBA-15 catalysts on the hydrotreating of heavy gas oil, Applied Catalysis A: General, 404,
21-29.
Murgich, J., Rodriguez, J., Aray, Y., (1996). Molecular recognition and molecular mechanics
of micelles of some model asphaltenes and resins, Energy Fuels, 10, 68-76.
Murugan, P., Mahinpey, N., Thilakavathi, M., (2009). Thermal cracking and combustion
kinetics of asphaltenes derived from Fosterton oil, Fuel Processing Technology, 90, 1286-
1291.
Murugan, P., Thilakavathi, M., Mahinpey, N., Dong, M., (2011). Pyrolysis kinetics of
Athabasca bitumen using a TGA under the influence of reservoir sand, The Canadian Journal
of Chemical Engineering, 9999, 1-5.
Nares, H. R., Schacht-Hernandez, P., Ramirez-Garnica, M. A., Cabrera-Reyes, M. C., (2007).
Heavy-crude-oil upgrading with transition metals, Presented at SPE Latin American and
Caribbean Petroleum Engineering Conference, Buenos Aires, 15-18 April.
Nasr, T. and Isaac, E., (2001). Process for enhancing hydrocarbon mobility using a steam
additive, U.S. Patent 6230814.
Noguera, G., Araujo, S., Hernandez, J., Rivas, A., Mendoza, D., Castellano, O., (2012). A
comparative activity study of a new ultra-dispersed catalyst system for a
hydrocracking/hydrotreating technology using residue oil: Merey/Mesa, Chemical
Engineering Research and Design, 90, 1979-1988.

References
313
OECD/IEA, (2005). World Energy Outlook 2005, available at
http://www.worldenergyoutlook.org/docs/weo2005/WEO2005.pdf, Accessed 20/06/2011.
Ogbuneke, U.K., Snape, E.C., Andresen, M.J., Crozier, S., Russell, C., and Sharpe, R.,
(2009). Identification of a polycyclic aromatic hydrocarbon indicator for the onset of coke
formation during visbreaking of a vacuum residue, Energy Fuels, 23, 2157-2163.
Ortiz-Moreno, H., Ramirez, J., Cuevas, R., Marroquin, G., Ancheyta, J., (2012). Heavy oil
upgrading at moderate pressure using dispersed catalysts: Effects of temperature, pressure and
catalytic precursor, Fuel, 100, 186-192.
Ovalles, C., Filgueiras, E., Morales, A., Scott, E. C., Gonzalez, G. F., Pierre, E. B., (2003).
Use of a dispersed iron catalyst for upgrading extra-heavy crude oil using methane as source
of hydrogen, Fuel, 82, 887-892.
Ovalles, C., Filgueiras, E., Morales, A., Rojas, I., Jesus, de J. C., Berrios, I., (1998). Use of a
dispersed molybdenum catalyst and mechanistic studies for upgrading extra-heavy crude oil
using methane as source of hydrogen, Energy Fuels, 12, 379-385.
Ovalles, C. and Rodriguez, H., (2008). Extra heavy crude oil downhole upgrading using
hydrogen donors under cyclic steam injection conditions: physical and numerical simulation
studies, Journal of Canadian Petroleum Technology, 47 (1), 43-50.
Pacheco-Sanchez, J. H., Alvarez-Ramirez, F., Martinez-Magadan, J. M., (2004). Morphology
of aggregated asphaltene structure model, Energy Fuels, 18, 1676-1686.
Panariti, N., Bianco, D. A., Piero, D G., Marchionna, M., (2000a). Petroleum residue
upgrading with dispersed catalysts Part 1. Catalysts activity and selectivity, Applied Catalysis
A: General, 204, 203-213.
Panariti, N., Bianco, D. A., Piero, D G., Marchionna, M., (2000b). Petroleum residue
upgrading with dispersed catalysts Part 2. Effect of operating conditions, Applied Catalysis A:
General, 204, 215-222.

References
314
Pashikanti, K. and Liu, Y. A., (2011). Predictive modelling of large-scale integrated refinery
reaction and fractionation systems from plant data, Part2: fluid catalytic cracking (FCC)
process, Energy Fuels, 25, 5298-5319.
Petrobank (2008) announces first THAI-CAPRI
TM Production, available at
http://www.marketwire.com/press-release/Petrobank-Announces-First-THAI-CAPRI-
Production-TSX-PBG-902105.htm, accessed 19/04/2011.
Petrobank Energy and Resources Ltd., (2010). CAPRI/THAI Processes for Upgrading and
Recovering Getting Closer. http://nextbigfuture.com/2009/01/petrobank-caprithai-processes-
for.html. Accessed 8/1/2010.
PingPing, S., Chen, X., Qin, J., (2010). Pressure characteristics in CO2 flooding experiments,
Petroleum Exploration and Development, 37 (2), 211-215.
Pinilla, J. L., Arcelus-Arrillaga, P., Puron, H., Millan, M., (2013a). Reaction pathways of
anthracene selective catalytic steam cracking using a NiK/Al2O3 catalyst, Fuel, 109, 303-308.
Pinilla, J. L., Arcelus-Arrillaga, P., Puron, H., Millan, M., (2013b). Selective catalytic steam
cracking of anthracene using mesoporous Al2O3 supported Ni-based catalysts doped with Na,
Ca, or K, Applied Catalysis A: General, 459, 17-25.
Puron, H., Arcelus-Arrillaga, P., Chin, K. K., Pinilla, J. L., Fidalgo, B., Millan, M., (2014).
Kinetic analysis of vacuum residue hydrocracking in early reaction stages, Fuel, 117, 408-
414.
Puron, H., Pinilla, L. J., Berrueco, C., Fuente, de la M. J. A, Millan, M., (2013).
Hydrocracking of Maya vacuum residue with NiMo catalysts supported on mesoporous
alumina and silica-alumina, Energy Fuel, 27, 3952-3960.
Qi, W., Lei, G., Zong-xian, W., Bao-quan, M., Ai-jun, G., He, L., (2012). Hydrogen donor
visbreaking of Venezuela vacuum residue, J. Fuel Chem. Technol., 40 (11), 1317-1322.
Rahimi, M. P., Gentzis, T., (2006). The chemistry of bitumen and heavy oil processing,
Practical Advances in Petroleum Processing, Vol.1, Springer Science + Business Media, Inc.,
149-186.

References
315
Ramachandran, P. A., Chaudhari, R. V., (1983). Three phase catalytic reactor, Gordon and
Breach, Science Publishers, S. A.
Rana, M. S., Ancheyta, J., Maity, S. K., Rayo, P., (2008). Heavy crude oil hydroprocessing: A
zeolite-based CoMo catalyst and its spent catalyst characterisation, Catalysis Today, 130,
411-420.
Rana, M. S., Sa´mano, V., Ancheyta, J., Diaz, J. A. I., (2007). A review of recent advances on
process technologies for upgrading of heavy oils and residua, Fuel, 86, 1216–1231.
Razavi, S. D., Kharrat, R., (2009). Application of cyclic steam stimulation by horizontal wells
in Irranian heavy oil reservoirs, Transactions C: Chemistry and Chemical Engineering, 16 (2),
pp. 125-139.
Ren, Y., Mahinpey, N., Freitag, N., (2007). Kinetic model for the combustion of coke derived
at different coking temperature, Energy & Fuels, 21, 82-87.
Reyniers, C. G., Froment, F. G., Kopinke, F. -D., Zimmermann, G., (1994). Coke formation
in thermal cracking of hydrocarbons. 4 Modeling of coke formation in naphtha cracking, Ind.
Eng. Chem. Res., 33, 2584-2590.
Rezaei, H., Ardakani, J. S., and Smith, J. K., (2012). Comparison of MoS2 catalysts prepared
from Mo-micelle and Mo-octoate precursors for hydroconversion of Cold Lake vacuum
residue: catalyst activity, coke properties and catalyst recycle, Energy Fuels, 26, 2768-2778.
Rezaei, H., Liu, X., Ardakani, J. S., Smith, J. K., Bricker, M., (2010). A study of Cold Lake
vacuum residue hydroconversion in batch and semi-batch reactors using unsupported MoS2
catalysts, Catalysis Today, 150, 244-254.
Rezaei Mehdi, Schaffie Mahin, Ranjbar Mohammad, (2013). Thermocatalytic in situ
combustion: Influence of nanoparticles on crude oil pyrolysis and oxidation, Fuel, 113, 516-
521.
Robinson, R. P., (2006). Petroleum processing overview Chapter 1 in Practical Advances in
Petroleum Processing, Vol. 1, Springer, Science + Business Media, Inc. New York, 31-42.

References
316
Rodger, A., Chmel, P. N., Razmkhah, K., et al., (2008). Rheology study,
http://www2.warwick.ac.uk/fac/sci/chemistry/research/arodger/arodgergroup/people/msrhab/c
ollaborators/rheologystudy/ (Accessed, 24/10/2013).
Rogel, E., Ovalles, C., Pradhan, A., Leung, P., Chen, N., (2013). Sediment formation in
residue hydroconversion processes and its correlation to asphaltene behavior, Energy Fuels,
dx.doi.org/10.1021/ef401614a.
Salama, D., Kantzas, A., (2006). Experiment observation of miscible displacement of heavy
oil with hydrocarbon solvent, Journal of Petroleum Technology, SPE 97854, 102-104.
Sambi, I. S., Khulbe, K. C., Mann, and Ranveer, S., (1982). Catalytic hydrotreatment of
heavy gas oil, Ind. Eng. Chem. Pro. Dev., 21 (4), 575-580.
Sanchez, S., Ancheyta, J., (2007). Effect of pressure on the kinetics of moderate
hydrocracking of Maya crude oil, Energy Fuels, 21 (2), 653-661.
Sanford, E. C., (1994). Molecular approach to understanding residue conversion, Ind. Eng.
Chem. Res., 33 (1), 109-117.
Sato, T., Tomita, T., Trung, H. P., Itoh N., Sat, S., Takanohashi, T., (2013). Upgrading of
bitumen in the presence of hydrogen and carbon dioxide in supercritical water, Energy Fuels,
27, 646-653.
Savage, P., Klein, M., Kukes, S., (1988). Asphaltenes reaction pathways 3. Effect of reaction
environment, Energy Fuels, 2, 619-628.
Sawarkar, A. N., Pandit, A. B., Joshi, J. B., (2007). Studies in coking of Arabian mix vacuum
residue, Trans IChemE, Part A, Chemical Engineering Research and Design, 85 (A4), 481-
491.
Sawarkar, A. N., Pandit, A. B., Shriniwas, D. S., Jyeshtharaj, J. B., (2007). Petroleum residue
upgrading via delayed coking: A review, The Canadian Journal of Chemical Engineering, 85,
1-24.
Scherzer, J., Gruia, A. J., (1996). Hydrocracking science and technology, Marcel Dekker,
New York.

References
317
Sen, R. K., (2008). Biotechnology in petroleum recovery: the microbial EOR, Progress in
Energy and Combustion Science, 34, 714-724.
Shah A., Fishwick, R. P., Wood, J., Leeke, G., Rigby, S., Greaves, M., (2010). A review of
novel techniques for heavy oil and bitumen extraction and upgrading, Energy &
Environmental Science, 3, 700-714.
Shah, A., Fishwick, R. P., Leeke, A. G., Wood, J., Rigby, S. P., Greaves, M., (2011).
Experimental optimisation of catalytic process in situ for heavy-oil and bitumen upgrading, J.
Can. Petrol. Technol., 50 (11-12), 33-47.
Sheng, J. J., (2011). Modern Chemical Enhanced Oil Recovery, Elsevier Inc, DOI:
10.1016/B978-1-85617-745-0.00010-3, pp.389-460.
Sheng, J. J., (2013). Enhanced Oil Recovery Field Cases Studies, pp. 63-167.
Shen Z., Cao Z., Zhu X., Li, X., (2008). Visbreaking of Chinese oilsands bitumen, Pet. Sci.
Technol., 26, 1676-1683.
Shuyi, Z., Deng, W., Luo, H., Liu, D., Que, G., (2008). Slurry-phase residue hydrocracking
with dispersed nickel catalyst, Energy Fuels, 22, 3583-3586.
Shuyi, Z., Liu, D., Deng, W., Que, G., (2007). A review of slurry-phase hydrocracking heavy
oil technology, Energy Fuels, 21 (6), 3057-3062.
Silverman, M. A., Pavel, S. K., Hillerman, M. D., (2011). HTL heavy oil upgrading: A key
solution for heavy oil upstream and midstream operations, World Heavy Oil Congress
[WHOC11-419], Edmonton, Alberta, Canada.
Smalley, C., (2000). Heavy oil and viscous oil, Chapter from Modern Petroleum Technology,
R. A. Dawe, ed., John Wiley and Sons Ltd.
Solar, J. M., Derbyshire, F. J., Radovic, L. R., (1991). Effects of surface and structural
properties of carbon on the behaviour of carbon-supported molybdenum catalysts, J. Catal.,
129 (2), 330-342.

References
318
Smith, B. R. J., Loganathan, M., Murthy, S. S., (2010). A review of the water gas shift
reaction kinetic, Int. J. of Chem. Reactor Eng., 8, 1-32.
Speight, J. G., (1998). The chemistry and physics of coking, Korean J. Chem. Eng., 15 (1), 1-
8.
Speight, J. G., (2009). Enhanced recovery methods for heavy oil and tar sands, Gulf
Publishing Co., Houston, Texas, 261-291.
Speight, J. G., (2011). The refinery of the future, Gulf Professional Publishing, London, 81-
116.
Speight, J. G., (2013). Oil sand and tar production processes, Gulf Professional Publishing,
Elsevier, Oxford, 139-153.
Speight, J. G. and Moschopedis, S. E., (1979). Some observations on the molecular nature of
petroleum asphaletnes, Prepr.-Am. Chem. Soc., Div. Pet. Chem., 24, 910-923.
Stanislaus, A., Absi-Halabi, M., and Khan, Z., (1996). Influence of catalyst pore size on
asphaltenes conversion and coke-like sediments formation during catalytic hydrocracking of
Kuwait vacuum residues, Studies in Surface Science and Catalysis, 100, 189-197.
Stoyanov, R. S., Gusarov, S., Kuznicki, M. S., Kovalenko, A., (2008). Theoretical modelling
of zeolite nanoparticle surface acidity for heavy oil upgrading, J. Phys. Chem. C., 112 (17),
6794-6810.
Strauz, O. P., Lown, E. M., (2003). The chemistry of Alberta oil sands, bitumen and heavy
oils, Book Published by the Alberta Energy Research Institute, Calgary, AB, Canada.
Sun, L.-B, Zong, Z.-M, Kou, J.-H, Zhang, L.-F, Ni, Z.-H, Yu, G.-Y, Chen, H., Wei, X.-Y, and
Lee, C.W., (2004). Activated carbon-catalyzed hydrogenation of polycyclic arenes, Energy
Fuels, 18, 1500-1504.
Sun, Y., Yang, C., Zhao, H., Shan, H., and Shen, B., (2010). Influence of asphaltene on the
residue hydrotreating reaction, Energy Fuels, 24, 5008-5011.
Swapan, K. D., Butler, R. M., (1997). Mechanism of the vapour extraction process for heavy
oil and bitumen, Journal of Petroleum Science and Engineering, 21, 43-59.

References
319
Terai, S., Fukuyama, H., Uehara, K., (2000). Hydrocracking of heavy oil using iron-active
carbon catalyst, Sekiyu Gakkaishi, 43 (1), 17-24.
Thomas, S., (2008). Enhanced oil recovery – An overview, Oil & Gas Science and
Technology – Rev-IFP, 68 (1), 9-19.
Thomas, S., Farouq Ali S. M., (1999). Status and assessment of chemical oil recovery
methods, Energy Sources, 21, 177-189.
Trejo, F., Rana, S. M., Ancheyta, J., (2010). Thermogravimetric determination of coke from
asphaltenes, resins and sediments and coking kinetics of heavy crude asphaltenes, Catalysis
Today, 150, 272-278.
Tuzunoglu, E. and Bagci, S., (2000). Scaled 3-D mode studies of immiscible CO2 flooding
using horizontal wells, Journal of Petroleum Science and Engineering, 26, 67-81.
US. Department of Energy, Energy Information Administration, EIA (2005) Int. Energy
Outlook, July.
Veith, E. J., (2007). Performance of Heavy-to-Light-Crude-Oil upgrading Process, presented
at 2007 SPE International Oil Conference and Exhibition, Veracruz, Mexico, 27-30 June.
Viet, T. T., Lee, H. J., Ma, F., Kim, R. G., Ahn, I. –S., Lee, C. –H., (2013). Hydrocracking of
petroleum vacuum residue with activated carbon and metal additives in a supercritical m-
xylene solvent, Fuel, 103, 553-561.
Viet, T. T., Lee, H. J., Ryu, W. J., Ahn, I.-S., Lee, C. –H., (2012). Hydrocracking of vacuum
residue with activated carbon in supercritical hydrocarbon solvents, Fuel, 94, 556-562.
Vishwakarma, K. S., Sundaramurthy, V., and Ajay, K. D., (2007). Performances of Co-W/γ-
Al2O3 catalysts on hydrotreatment of light gas oil derived from Athabasca bitumen, Ind. Eng.
Chem. Res., 46, 4778-4786.
Voorhies, A., (1945). Carbon formation in catalytic cracking, Ind. Eng. Chem. Res., 37, 318-
22.
Wang Baodong and Manos George, (2007). A novel thermogravimetric method for coke
precursor characterisation, Journal of Catalysis, 250, 121-127.

References
320
Wang, B., Tao, W., Yujiang, L., Dejun, S., Min, Y., Yingxin, G., Fengjuan, L., Xia, L.,
(2011). The effects of oil displacement agents on the stability of water produced from ASP
(Alkaline/Surfactant/Polymer) flooding, Colloids and Surface A: Physicochem. Eng. Aspects,
379,121-126.
Wang, G., Li, Z. K., Liu, Y. D., Gao, J. S., Xu, C. M., Lan, X. Y., Ning, G. Q., Liang, Y. M.,
(2012). FCC-catalyst coking: sources and estimation of their contribution during coke gas oil
cracking process, Ind. Eng. Chem. Res., 51, 2247-2256.
Wang, G., Liu, Y., Wang, X., Xu, C., and Gao, J., (2009). Studies on the catalytic cracking
performance of coker gas oil, Energy Fuels, 23, 1942-1949.
Wang, H., Wu, Y., Li, H., Liu, Z., (2012). Supporting tungsten oxide on zirconia by
hydrothermal and impregnation methods and its use as a catalyst to reduce the viscosity of
heavy crude oil, Energy Fuels, 26, 6518-6527.
Wang, J., Dong, M., (2009). Optimum effective viscosity of polymer solution for improving
heavy oil recovery, Journal of Petroleum Science and Engineering, 67, 155-158.
Wang, J., Reyniers, M. -F., Marin B. G., (2007). Influence of dimethyl disulfide on coke
formation during steam cracking of hydrocarbons, Ind. Eng. Chem. Res., 46, 4134-4148.
Wang, Y., Chen, Y., He, J., Li, P., and Yang, C., (2010). Mechanism of catalytic
aquathermolysis: Influences on heavy oil by two types of efficient catalytic ions: Fe3+
and
Mo6+
, Energy Fuels, 24, 1502-1510.
Wei, L., Zhu, J., Qi, J., (2007). Application of nano-nickel catalyst in the viscosity reduction
of Liaohe extra-heavy oil by aqua-thermolysis, Journal of Fuel Chemistry and Technology, 35
(2), 176-180.
Weissman, J. G., Kessler, R. V., (1996). Downhole heavy crude oil hydroprocessing, Applied
Catalysis A: General, 140 (1), 1-16.
Weissman, J. G., Kessler, R. V., Sawicki, R. A., Belgrave, J. D. M., Laureshen, C. J., Mehta,
S. A., Moore, R. G., Ursenbach, M. G., (1996). Downhole catalytic upgrading of heavy crude
oil, Energy Fuel, 10 (4), 883-889.

References
321
Wenlong, G., Xi, C., Chen, Y., Zhang, X. M., Jinzhong, L., Jihong, H., Jian, W., (2011). Fire-
flooding technoloies in post-steam-injected heavy oil reservoirs, Petrol. Explor. Dev., 38 (4),
452-462.
Wiehe, I. A., (1999). Tutorial on resid conversion and coking, Proceedings 2nd
International
Conference on Refinery Processing, AIChE 1999 Spring National Meeting, Houston, TX,
March 14-18, 499-505.
Wiehe, I. A. and Liang, K. S., (1996). Asphaltenes, resins, and other petroleum
macromolecules, Fluid Phase Equilibrium, 117, 201-210.
Wilson R. Geoffrey, (1975). Heavy oil demetallization and desulfurization process, United
States Patent, No. 3,898,155.
Xia, T. X. and Greaves, M., (2000). Upgrading Athabasca tar sand using toe-to-heel air
injection, SPE/Petroleum Society of CIM 65524, International Conference on Horizontal
Well Technology, Calgary, Alberta, Canada, 6-8 November.
Xia, T. X., Greaves, M., (2001). Downhole upgrading Athabasca tar sand bitumen using
THAI-SARA analysis, SPE 69693, SPE International Thermal Operations and Heavy Oil
Symposium held in Portlamar, Margarita Island, Venezuela, 12 March.
Xia, T. X., Greaves, M., (2001b). 3-D physical model studies of downhole catalytic upgrading
of Wolf-Lake heavy oil using THAI, Petroleum Society’s Canadian International Petroleum
Conference, Calgary, Alberta, Canada, June 12-14, Paper 2001-17.
Xia, T. X., Greaves, M., (2006). In situ upgrading of Athabasca tar sand bitumen using THAI,
Chemical Engineering Research and Design, 84 (A9), pp. 856-864.
Xia, T. X., Greaves, M., Turta, A. T., Ayasse, C., (2003). THAI-A short-distance
displacement in situ combustion process for the recovery and upgrading of heavy oil, Institute
of Chemical Engineers, Vol.18, Part A, pp. 295-304.
Xia, T. X., Greaves, M., Werfilli, W.S., Rathbone, R. R., (2002). Downhole conversion of
Lloydminster heavy oil using THAI-CAPRI process, SPE/Petroleum Society of CIM/CHOA
78998 International Thermal Operations and Heavy Oil Symposium and International
Horizontal Well Technology Conference, Calgary, Alberta, Canada, 4-7 November.

References
322
Xuhong, M., Dianzhong, W., Yongrui, W., Min, L., Shibiao, C., Xingtian, S., (2013).
Nanosized molecular sieves as petroleum refining and petrochemical catalysts, Chinese
Journal of Catalysis, 34, 69-79.
Yan, T. Y., (1980). Dynamics of a trickle-bed hydrocracker with a quenching system, Can. J.
Chem. Eng., 58, 259.
Yin, C.-X., Jeffrey, M. S., and Gray, R. M., (2009). Separation of petroporphyrins from
asphaltenes by chemical modification and selective affinity chromatography, Energy Fuels,
23, 2600-2605.
Zachariah, A., Wang, L., Yang, S., Prasad, V., Klerk, d. A., (2013). Suppression of coke
formation during bitumen pyrolysis, Energy Fuels, 27, 3061 – 3070.
Zajac, G. W., Sethi, N. K., and Joseph, J. T., (1994). Maya petroleum asphaltene imaging by
scanning tunnelling microscopy: verification of structure from 13
C and proton nuclear
magnetic resonance, Scanning Microsc., 8, 463-470.
Zhang, H. Q., Sarica, C., and Pereyra, E., (2012). Review of high-viscosity oil multiphase
pipe flow, Energy Fuel, dx.doi.org/10.1021/ef300179s.
Zhang, J., Shan, H., Liu, W., Chen, X., Li, C., and Yang, C., (2013). Synergistic process for
coker gas oil catalytic cracking and gasoline reformation, Energy Fuels, 27, 654-665.
Zhang Xiaohui and Shaw M. John, (2006). Impact of multiphase behaviour on coke
deposition in heavy oils hydroprocessing catalysts, Energy Fuels, 20, 473-480.
Zhang, Z. -G., Okada, K., Yamamoto, M. and Yoshida, T., (1998). Hydrogenation of
anthracene over active carbon-supported nickel catalyst, Catalysis Today, 45, 361-366.
Zhao, S., Kotlyar, S. L., Woods, R. J., Sparks, D. B., Chung, H. K., (2001). Effect of thermal
and hydro-catalytic treatment on the molecular chemistry of narrow fractions of Athabasca
bitumen pitch, Energy Fuels, 15, 113-119.
Zhao, S., Sparks, B. D., Kotlyar, L. S., Chung, K. H., (2007). Correlation of processability
and reactivity data for residua from bitumen, heavy oils and conventional crudes:

References
323
characterization of fractions from super-critical pentane separation as a guide to process
selection, Catalysis Today, 125, 122-136.
Zhao, Y., Gray, R. M., Chung, K. H., (2001). Molar kinetics and selectivity in cracking of
Athabasca asphaltenes, Energy Fuels, 15, 751-755.
Zhicheng, L., Wang, Y., Xie, Z., (2012). Thoughts on the future development of Zeolite
catalysts from an industrial point of view, Chinese Journal of Catalysis, 33 (1), 22-38.
Zobell, C., (1947). Bacterial release of oil from sedimentary metrials, Oil & Gas Journal, 46,
62-65.
Zuo, Y. –X., Ji-Zheng, C., Shui-lin, K. and Tian-Min, G., (1993). A study on the minimum
miscibility pressure for miscible flooding systems, Journal of Petroleum Science and
Engineering, 8, 315-328.