Advanced Spacesuit Informatics Software Design for Power ...
38
Theodore W. Wright Glenn Research Center, Cleveland, Ohio Advanced Spacesuit Informatics Software Design for Power, Avionics and Software Version 2.0 NASA/TM—2016-219149 September 2016
Transcript of Advanced Spacesuit Informatics Software Design for Power ...

Theodore W. WrightGlenn Research Center, Cleveland, Ohio
Advanced Spacesuit Informatics Software Design for Power, Avionics and Software Version 2.0
NASA/TM—2016-219149
September 2016

NASA STI Program . . . in Profi le
Since its founding, NASA has been dedicated to the advancement of aeronautics and space science. The NASA Scientifi c and Technical Information (STI) Program plays a key part in helping NASA maintain this important role.
The NASA STI Program operates under the auspices of the Agency Chief Information Offi cer. It collects, organizes, provides for archiving, and disseminates NASA’s STI. The NASA STI Program provides access to the NASA Technical Report Server—Registered (NTRS Reg) and NASA Technical Report Server—Public (NTRS) thus providing one of the largest collections of aeronautical and space science STI in the world. Results are published in both non-NASA channels and by NASA in the NASA STI Report Series, which includes the following report types: • TECHNICAL PUBLICATION. Reports of
completed research or a major signifi cant phase of research that present the results of NASA programs and include extensive data or theoretical analysis. Includes compilations of signifi cant scientifi c and technical data and information deemed to be of continuing reference value. NASA counter-part of peer-reviewed formal professional papers, but has less stringent limitations on manuscript length and extent of graphic presentations.
• TECHNICAL MEMORANDUM. Scientifi c
and technical fi ndings that are preliminary or of specialized interest, e.g., “quick-release” reports, working papers, and bibliographies that contain minimal annotation. Does not contain extensive analysis.
• CONTRACTOR REPORT. Scientifi c and technical fi ndings by NASA-sponsored contractors and grantees.
• CONFERENCE PUBLICATION. Collected papers from scientifi c and technical conferences, symposia, seminars, or other meetings sponsored or co-sponsored by NASA.
• SPECIAL PUBLICATION. Scientifi c,
technical, or historical information from NASA programs, projects, and missions, often concerned with subjects having substantial public interest.
• TECHNICAL TRANSLATION. English-
language translations of foreign scientifi c and technical material pertinent to NASA’s mission.
For more information about the NASA STI program, see the following:
• Access the NASA STI program home page at http://www.sti.nasa.gov
• E-mail your question to [email protected] • Fax your question to the NASA STI
Information Desk at 757-864-6500
• Telephone the NASA STI Information Desk at 757-864-9658 • Write to:
NASA STI Program Mail Stop 148 NASA Langley Research Center Hampton, VA 23681-2199

Theodore W. WrightGlenn Research Center, Cleveland, Ohio
Advanced Spacesuit Informatics Software Design for Power, Avionics and Software Version 2.0
NASA/TM—2016-219149
September 2016
National Aeronautics andSpace Administration
Glenn Research CenterCleveland, Ohio 44135

Available from
Trade names and trademarks are used in this report for identifi cation only. Their usage does not constitute an offi cial endorsement, either expressed or implied, by the National Aeronautics and
Space Administration.
Level of Review: This material has been technically reviewed by technical management.
NASA STI ProgramMail Stop 148NASA Langley Research CenterHampton, VA 23681-2199
National Technical Information Service5285 Port Royal RoadSpringfi eld, VA 22161
703-605-6000
This report is available in electronic form at http://www.sti.nasa.gov/ and http://ntrs.nasa.gov/

Contents
1 Introduction1 Introduction 1
2 Hardware Platform2 Hardware Platform 1
2.1 PAS 1.0 Hardware2.1 PAS 1.0 Hardware . . . . . . . . . . . . . . . . . . . . . . . . . . . . . . . . . . . 1
2.1.1 Real Time Clock2.1.1 Real Time Clock . . . . . . . . . . . . . . . . . . . . . . . . . . . . . . . 3
2.1.2 Compass and Accelerometer2.1.2 Compass and Accelerometer . . . . . . . . . . . . . . . . . . . . . . . . . 4
2.1.3 GPS2.1.3 GPS . . . . . . . . . . . . . . . . . . . . . . . . . . . . . . . . . . . . . . 4
2.2 PAS 2.0 Hardware2.2 PAS 2.0 Hardware . . . . . . . . . . . . . . . . . . . . . . . . . . . . . . . . . . . 4
2.2.1 Development Hardware2.2.1 Development Hardware . . . . . . . . . . . . . . . . . . . . . . . . . . . 5
2.2.2 Final PAS 2.0 Hardware2.2.2 Final PAS 2.0 Hardware . . . . . . . . . . . . . . . . . . . . . . . . . . . 5
3 Operating System and Software Libraries3 Operating System and Software Libraries 6
3.1 Linux3.1 Linux . . . . . . . . . . . . . . . . . . . . . . . . . . . . . . . . . . . . . . . . . 7
3.2 Media Handling3.2 Media Handling . . . . . . . . . . . . . . . . . . . . . . . . . . . . . . . . . . . . 7
3.3 Qt3.3 Qt . . . . . . . . . . . . . . . . . . . . . . . . . . . . . . . . . . . . . . . . . . . 8
3.4 Sending data between assemblies3.4 Sending data between assemblies . . . . . . . . . . . . . . . . . . . . . . . . . . . 8
3.4.1 ZeroMQ in PAS 1.03.4.1 ZeroMQ in PAS 1.0 . . . . . . . . . . . . . . . . . . . . . . . . . . . . . 8
3.4.2 Custom serial protocol in PAS 2.03.4.2 Custom serial protocol in PAS 2.0 . . . . . . . . . . . . . . . . . . . . . . 9
3.5 Data Serialization3.5 Data Serialization . . . . . . . . . . . . . . . . . . . . . . . . . . . . . . . . . . . 10
3.5.1 Google Protocol Buffers/Nanopb in PAS 1.03.5.1 Google Protocol Buffers/Nanopb in PAS 1.0 . . . . . . . . . . . . . . . . 10
3.5.2 Electronic Data Sheets in PAS 2.03.5.2 Electronic Data Sheets in PAS 2.0 . . . . . . . . . . . . . . . . . . . . . . 11
3.6 Experimental Voice Recognition3.6 Experimental Voice Recognition . . . . . . . . . . . . . . . . . . . . . . . . . . . 12
4 Software Architecture4 Software Architecture 12
4.1 C++ Infrastructure4.1 C++ Infrastructure . . . . . . . . . . . . . . . . . . . . . . . . . . . . . . . . . . 13
4.1.1 Setup4.1.1 Setup . . . . . . . . . . . . . . . . . . . . . . . . . . . . . . . . . . . . . 13
4.1.2 Periodic Processing4.1.2 Periodic Processing . . . . . . . . . . . . . . . . . . . . . . . . . . . . . . 14
4.1.3 Sending Data4.1.3 Sending Data . . . . . . . . . . . . . . . . . . . . . . . . . . . . . . . . . 14
4.1.4 Receiving Data4.1.4 Receiving Data . . . . . . . . . . . . . . . . . . . . . . . . . . . . . . . . 15
4.1.5 AppData Data Exchange4.1.5 AppData Data Exchange . . . . . . . . . . . . . . . . . . . . . . . . . . . 16
4.2 QML/Javascript Graphical User Interface4.2 QML/Javascript Graphical User Interface . . . . . . . . . . . . . . . . . . . . . . 16
4.2.1 Persistent Display4.2.1 Persistent Display . . . . . . . . . . . . . . . . . . . . . . . . . . . . . . . 17
4.2.2 Consumable Display4.2.2 Consumable Display . . . . . . . . . . . . . . . . . . . . . . . . . . . . . 18
4.2.3 Communications Display4.2.3 Communications Display . . . . . . . . . . . . . . . . . . . . . . . . . . . 19
4.2.4 Buddy Display4.2.4 Buddy Display . . . . . . . . . . . . . . . . . . . . . . . . . . . . . . . . 20
4.2.5 File Selection4.2.5 File Selection . . . . . . . . . . . . . . . . . . . . . . . . . . . . . . . . . 21
4.2.6 Procedure Display4.2.6 Procedure Display . . . . . . . . . . . . . . . . . . . . . . . . . . . . . . 22
4.2.7 Timeline Display4.2.7 Timeline Display . . . . . . . . . . . . . . . . . . . . . . . . . . . . . . . 23
4.2.8 Camera Display4.2.8 Camera Display . . . . . . . . . . . . . . . . . . . . . . . . . . . . . . . . 24
4.2.9 Setup Display4.2.9 Setup Display . . . . . . . . . . . . . . . . . . . . . . . . . . . . . . . . . 25
4.2.10 Warning Display4.2.10 Warning Display . . . . . . . . . . . . . . . . . . . . . . . . . . . . . . . 27
NASA/TM—2016-219149 iii

5 Summary5 Summary 28
6 References6 References 29
NASA/TM—2016-219149 iv

1 Introduction
This is a description of the software design for the 2016 edition of the Informatics computer as-
sembly of the NASA’s Advanced Extravehicular Mobility Unit (AEMU), also called the Advanced
Spacesuit. The Informatics system is an optional part of the spacesuit assembly. It adds a graphical
interface for displaying suit status, timelines, procedures, and warning information. It also provides
an interface to the suit mounted camera for recording still images, video, and audio field notes. In
the future, it will add navigation functions that display maps with GPS position data for surface
operations.
Many Informatics software features have not changed since the 2013 Power, Avionics and Software
(PAS) 1.0 assembly integration tests[11],[22]. This document has been updated from the version that
describes the PAS 1.0 software design[33] to describe the features developed for the PAS 2.0 design,
including camera integration, experimental voice recognition, and a new hardware platform, all
of which are important for assessing assembly performance. A description of PAS 1.0 hardware
and software is retained to highlight differences with PAS 2.0. The PAS 2.0 assembly integration
tests[44] were completed in July of 2016.
2 Hardware Platform
There are currently no space-rated radiation-hardened computer systems with a Graphics Process-
ing Unit (GPU). Until a path-to-flight graphics capable computer is available, for breadboard testing
Informatics uses simple, low cost, low power, embedded computers that are hopefully representa-
tive of future space-rated hardware.
2.1 PAS 1.0 Hardware
The hardware selected for PAS 1.0 development is called a Beaglebone Black[88]. It is a small (3.4”
by 2.1”), light (1.4 oz.), $45 computer board with an Advanced RISC Machine (ARM) 7 archi-
tecture processor and PowerVR graphics coprocessor combined in a System-On-Chip package. It
has 512 MB of RAM memory, a 2 GB flash file system, an SD card slot for the operating sys-
tem and user file systems, 100 Mbit/s Ethernet, and a USB host connector. The processor has a
maximum speed of 1 GHz, but if the software load permits, it slows to 300 MHz to reduce power
consumption.
The Informatics system receives inputs over an Ethernet network. This includes audio information
(for field notes and possible voice recognition) and video information (for real time video displays),
but those are not implemented in the PAS 1.0 Informatics software. Reception of streaming audio
over Ethernet has been successfully tested with the PAS 1.0 Informatics software, but the audio
was just stored to a file (voice recognition is not implemented).
NASA/TM—2016-219149 1

Figure 1: Beaglebone Black computer driving the Desert RATS cuff display
With the addition of a High-Definition Multimedia Interface (HDMI) to Low-Voltage Differential
signaling (LVDS) converter board, the Beaglebone can drive the cuff display (shown in Figure
11) developed for the NASA Desert Research and Technology Studies (Desert RATS) tests. The
1024 by 600 resolution 5” cuff display has edge buttons to use for operator control, and the buttons
connect through a USB keyboard interface. For bench top testing, the Beaglebone can drive an
LCD7 800 by 480 resolution 7” LCD display that mounts on top of the Beaglebone. The LCD7 has
five pushbuttons that emulate keystrokes for operator input (and a resistive touchscreen, but that
will not work if the operator is wearing gloves).
The Beaglebone has expansion connectors that can add optional additional hardware. Hardware
and software support has been tested for the following expansions:
• Real Time Clock
• Compass and Accelerometer
• GPS
A Beaglebone Black computer with breadboard connections for the hardware expansions is shown
in Figure 22.
NASA/TM—2016-219149 2

Figure 2: Beaglebone Black computer with breadboard Clock, Compass and GPS
2.1.1 Real Time Clock
The Beaglebone hardware does not include a battery-backed real-time clock circuit, so when the
system is powered on, the operating system time defaults to January 1, 1970. The correct time
and date can be set manually or with a Network Time Protocol daemon if the appropriate server
is available (the Radio assembly provides this, if present). Adding a battery backed clock chip
enables correctly time stamped data under all configurations without user intervention.
A battery-backed clock based on the Maxim DS3231 temperature compensated chip is easily con-
nected with a 2 wire (plus 3.3V power and ground) I2C interface. An I2C interface is preconfigured
on a stock Beaglebone Black on P9 expansion header pins 19 and 20. The clock appears at address
0x68. A Linux driver for the compatible DS1307 chip comes with Angstrom Linux distribution,
so the clock can be configured and read by adding two lines to a system startup script as shown in
Listing 11.
Listing 1: Configuring the clock driver and reading the clock
1 # c r e a t e / dev / r t 1
2 echo ds1307 0 x68 > / s y s / c l a s s / i2c−a d a p t e r / i2c −1/ new_device
3
4 # r e a d b a t t e r y backed ha rdware c l o c k
5 hwclock −r −f / dev / r t c 1
NASA/TM—2016-219149 3
2.1.2 Compass and Accelerometer
The Informatics display has a compass heading indicator to help astronauts orient themselves for
surface operations. For testing on Earth, this can be driven by an electronic compass. The bread-
board design uses an STMicroelectronics LSM303 chip containing a 3 axis magnetometer and a 3
axis accelerometer with an I2C interface (with addresses 0x1e and 0x19 respectively). Vector cross
products can be used to combine the magnetic field vector with the gravity vector to determine a
compass heading without requiring a fixed orientation of the assembly.
There is no pre-written device driver for this chip, so a Python language script is started in the
background that reads the I2C registers to determine magnetic field and gravity vectors, combines
them to generate a compass heading, and publishes the heading using the ZeroMQ/Protocol Buffer
format described in Sections 3.4.13.4.1 and 3.5.13.5.1.
2.1.3 GPS
The Informatics display also has an astronaut location display, which appears as latitude, longitude
and altitude for Earth testing. This information comes from GPS satellites, using a GlobalTop
MTK3339 GPS chipset connected through a 2 wire (plus power and ground) serial interface.
The Beaglebone Black P9 header pins 21 and 22 can be configured as a serial UART using the
Linux device tree overlay support. Pre-compiled device tree overlays for the Beaglebone UARTs
come with Angstrom Linux, so all that is needed to make the UART device appear is to write the
device name to the configuration register at system startup, as shown in Listing 22.
Listing 2: Configuring the Serial UART connected to the GPS
1 # c r e a t e s e r i a l p o r t / dev / t t y 0 2
2 echo BB−UART2 > / s y s / d e v i c e s / bone_capemgr . 8 / s l o t s
There is no pre-written device driver for a serial GPS, so a Python language script is started in the
background that opens the serial port and parses the NEMA formatted text data stream to extract
latitude, longitude and altitude. It then publishes the data using the ZeroMQ/Protocol Buffer format
described in Sections 3.4.13.4.1 and 3.5.13.5.1.
2.2 PAS 2.0 Hardware
The hardware focus of PAS 2.0 Informatics development was the transition to a more flight-like
computer system, which means a system without a dedicated graphics processor. Graphics output
is performed using a frame buffer interface that maps part of the Random Access Memory (RAM)
used by the processor to pixels on the video display. The frame buffer has a standard operating
system interface, so higher levels of software such as graphics libraries and Informatics code can
be unchanged for the new hardware (if the hardware performance is adequate).
NASA/TM—2016-219149 4

2.2.1 Development Hardware
The development hardware selected for PAS 2.0 development is called a ZedBoard[99]. The Zed-
Board is a low cost development board with a Xilinx Zynq 7020 System-On-Chip. The Zynq has
a dual core ARM architecture processor running at 667 MHz combined with Xilinx Artix 7 Field
Programmable Gate Array (FPGA) fabric. The FPGA fabric can be configured via Programmable
Logic (PL) to implement the Direct Memory Access and interrupt controller hardware needed to
connect processor memory to an external video serializer chip capable of driving a video display.
The ZedBoard has an Analog Devices ADV 7511 video serializer chip with an HDMI connector, a
Secure Digital (SD) card slot that can be used to hold the software and act as a storage file system,
an Ethernet network interface, 512 MB of RAM, and a USB host controller.
Analog Devices supplies an FPGA reference design supporting their ADV 7511 video serializer
chip and a customized Linux kernel with a driver for the design. This combination was imple-
mented as the frame buffer interface on the ZedBoard. The ZedBoard ARM processor is compat-
ible with the ARM processor used on the Beaglebone, so once the video hardware interface was
implemented, the Informatics software could be ported by just recompiling it. The details of con-
figuring the FPGA programmable logic, boot loaders, and operating system for the ZedBoard are
described in a separate document[55].
2.2.2 Final PAS 2.0 Hardware
A second phase of PAS 2.0 Informatics hardware was built that replaced the ZedBoard with a
conduction cooled Alpha-Data ADM-XRC-7Z1 board suitable for use in vacuum chamber testing.
The 7Z1 board has a Xilinx Zynq 7045 System-On-Chip and is compatible with software developed
for the ZedBoard, but the PAS 2.0 design also adds a custom-designed Carrier board to implement
the additional required hardware peripherals and a custom Power Management and Distribution
(PMAD) board. Like the ZedBoard, the Alpha-Data board has 512 MB of RAM, a micro-SD card
for file systems, and a USB host controller. The Alpha-Data 7Z1 board attached to the Carrier board
is shown in Figure 33.
The Analog Devices ADV 7511 video serializer chip is one of the Carrier board peripherals, so the
Analog Devices Programmable Logic (PL) design for graphics can be reused with minor changes.
Other PL-based interfaces on the Carrier board include 3 serial ports: one RS232 port for a console
display and two LVDS ports for low speed data exchange with the Communications and Radio
(COMM) and Caution and Warning (CWS) assemblies. Two additional Ethernet ports are added
for a total of three: one for the multi-stream camera, one for the Utility port, and one for the high
speed media data exchange with the COMM assembly. About two dozen voltage, current, power
and temperature sensors are on the Carrier and PMAD boards, and three power control outputs
are present that give the Informatics software the ability to switch power to the display, the utility
port, and the camera. All of these hardware peripherals are interfaced to the processor with FPGA
programmable logic.
NASA/TM—2016-219149 5
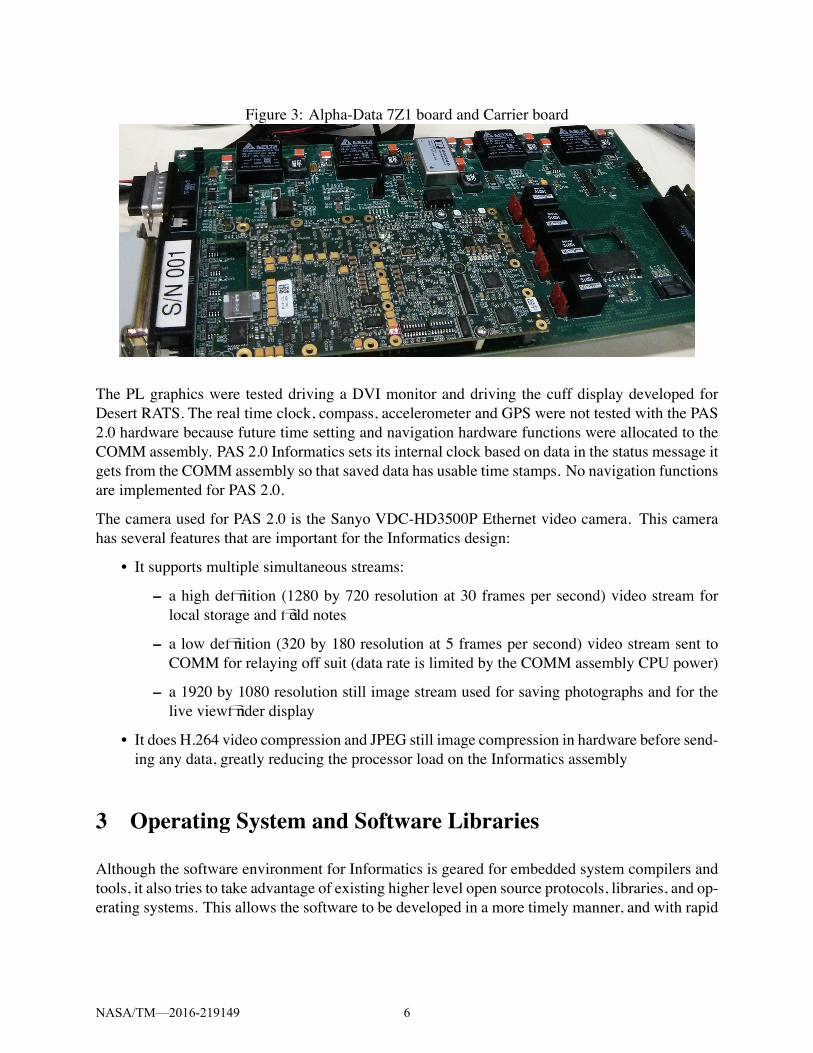
Figure 3: Alpha-Data 7Z1 board and Carrier board
The PL graphics were tested driving a DVI monitor and driving the cuff display developed for
Desert RATS. The real time clock, compass, accelerometer and GPS were not tested with the PAS
2.0 hardware because future time setting and navigation hardware functions were allocated to the
COMM assembly. PAS 2.0 Informatics sets its internal clock based on data in the status message it
gets from the COMM assembly so that saved data has usable time stamps. No navigation functions
are implemented for PAS 2.0.
The camera used for PAS 2.0 is the Sanyo VDC-HD3500P Ethernet video camera. This camera
has several features that are important for the Informatics design:
• It supports multiple simultaneous streams:
– a high definition (1280 by 720 resolution at 30 frames per second) video stream for
local storage and field notes
– a low definition (320 by 180 resolution at 5 frames per second) video stream sent to
COMM for relaying off suit (data rate is limited by the COMM assembly CPU power)
– a 1920 by 1080 resolution still image stream used for saving photographs and for the
live viewfinder display
• It does H.264 video compression and JPEG still image compression in hardware before send-
ing any data, greatly reducing the processor load on the Informatics assembly
3 Operating System and Software Libraries
Although the software environment for Informatics is geared for embedded system compilers and
tools, it also tries to take advantage of existing higher level open source protocols, libraries, and op-
erating systems. This allows the software to be developed in a more timely manner, and with rapid
NASA/TM—2016-219149 6

prototyping several ideas can be tried and discarded to determine the better way to do things.
3.1 Linux
There are no hard real-time software requirements for Informatics, so Linux was chosen as the
operating system due to its ease of use, good development tools, documentation, hardware support,
and price (free). Real-time operating systems sacrifice throughput for better latency and are not a
good match for Informatics.
For PAS 1.0, the Beaglebone Black was delivered with the Angstrom Linux distribution on its
flash file system. This was updated to the latest version at the time of testing (Angstrom release
August 21, 2013 - Linux kernel version 3.8.13), and run from a 16 GB high speed micro SD card to
provide ample free file system space. Ubuntu Linux 13.04 was also tested, and it was found to be a
easier to work with due to primarily to past experience and familiarity. However, it was decided to
use Angstrom because it had drivers that support the hardware accelerated GPU, and Ubuntu did
not.
Several standard Linux software daemons are important for Informatics. The Beaglebone has no
battery-backed clock, so it relies on a Network Time Protocol (NTP) daemon to set its clock and keep
itself synchronized with other assemblies. The radio assembly provides an NTP server (Informatics
could also use a GPS chip for this purpose, or a dedicated battery-backed clock chip). A Secure
Shell (SSH) daemon allows logging into Informatics across the Ethernet network, and it allows file
transfer to and from Informatics with the Secure Copy Protocol. A File Transfer Protocol (FTP)
daemon could also be used to update files on the Informatics SD card file system.
For PAS 2.0, the primary operating system used was Linaro Linux 14.04 running from the Zed-
Board’s Secure Digital (SD) file system. This is a full featured desktop-style Linux distribution
with software development tools and an X11 graphics environment. The full development envi-
ronment allows easy software development without using a cross compiler, but its multi-gigabyte
size is not very representative of a final embedded system. On the Alpha-Data hardware, the same
root file system was used, but the Informatics software was usually cross compiled and built to run
without the X11 window systems. As an alternative, a minimal embedded Linux root file system
for the ZedBoard was constructed using the Buildroot[1717] software. The Buildroot-generated root
file system with the required network, media and graphics libraries totaled 38 MB in size, and it
was verified to run the Informatics graphics program (without X11) on the ZedBoard. The Linaro
Linux kernel used was version 3.17 with modifications made by Analog Devices to support the
ADV 7511 video serializer, and the Buildroot kernel version was 4.4.0.
3.2 Media Handling
For PAS 1.0, the GStreamer software was used to receive and decode audio streams over Ethernet
from the Audio assembly. The GStreamer software was replaced for PAS 2.0 with the ffmpeg[1515]
NASA/TM—2016-219149 7

program for audio capture. Ffmpeg is also used to capture high definition video and to relay low bit
rate video streams from the Ethernet connected camera. Consolidating the media handling software
into one program reduces dependencies and saves space on the file system. Because the audio
and video media are never decompressed by ffmpeg (only stored or relayed to another interface),
measured processor loading due to ffmpeg is very low (typically under 2 percent).
3.3 Qt
The prototype Informatics system in the Desert RATS generation prior to PAS 1.0 ran on an Intel
computer and used the Adobe ActionScript (Flash) graphics development tools and libraries. Flash
was discontinued and does not support non-Intel platforms (which are required for lower power
consumption), so a different Graphical User Interface (GUI) library was required.
The library chosen was the open source Qt library[1111]. Qt was primarily a C++ based tool, but
recent versions have added a declarative layout language with embedded Javascript called QML.
QML is similar to ActionScript, and it is much faster to work with than C++. GUI development is
tedious and time consuming, so faster development speed is helpful. Qt has several other advan-
tages:
• It is cross-platform. This allows code to be developed on desktop Linux or Apple computers
and simply recompiled to run on the embedded computer, where it looks and runs identically.
• On embedded computers, Qt interfaces directly with the video driver, bypassing operating
system layers such as the X11 Window system. It has good performance even on relatively
slow hardware.
• QML layouts can adapt to different screen resolutions, allowing easy hardware changes.
Qt version 4.8 was installed from the Angstrom software repository and used for PAS 1.0 Infor-
matics development. PAS 2.0 uses Qt version 4.8 installed from the Ubuntu software repository or
built from source by the Buildroot system. Qt version 5 has been released and claims to be even
more optimized for embedded systems, but initial tests have found issues with running some of
the required components on systems without OpenGL support (such as the frame buffer graphics
implementation). This limitation is reportedly no longer a problem as of Qt version 5.7, but it was
released too late to use for PAS 2.0.
3.4 Sending data between assemblies
3.4.1 ZeroMQ in PAS 1.0
A Publish/Subscribe network architecture is a best practice for reliable information exchange be-
tween loosely coupled networked assemblies, such as the Advanced Spacesuit. The overall PAS
1.0 Communication Network Architecture[66],[77] is documented separately.
NASA/TM—2016-219149 8

While it is possible to create a simple data publishing system based on UDP Ethernet broadcasts,
past experience has shown that making broadcasts reliable and fixing all the corner cases can be-
come complicated. Instead of creating a UDP broadcast system from scratch, the open source
ZeroMQ[1212] socket library was used. ZeroMQ made coding a basic Publish/Subscribe system
trivially easy for PAS 1.0, requiring about a dozen lines of code. ZeroMQ is a library that is linked
to code, so unlike most other ”middleware” solutions, it does not require a separate daemon pro-
cess or broker software. It was originally developed for high frequency trading applications on
Wall Street, where efficiency is paramount.
There are dozens of language bindings to ZeroMQ. The Python binding was used to create a simple
”fake telemetry” generator that is used to make network traffic to test the Informatics software.
Another small Python/ZeroMQ script was used to decode and print network traffic generated by
AEMU subassemblies. ZeroMQ version 3.2.2 was used by Informatics.
3.4.2 Custom serial protocol in PAS 2.0
For PAS 2.0, the shared bus Ethernet messaging architecture was replaced by point-to-point LVDS
serial links. This required the development of two custom software components: a framing protocol
to delimit packets within a serial stream, and a routing protocol because the same serial protocols
are used for both inter-assembly messaging and data transfer with the Portable Life Support System
(PLSS) embedded controllers on the CWS assembly.
The framing protocol used is the Serial Line Internet Protocol (SLIP). SLIP allows the data packets
to contain any values while guaranteeing a unique end-of-packet marker. SLIP is a byte-stuffing
protocol that replaces any end-of-packet marker byte in the data with a two byte escape sequence.
The escape marker in the data packet is also replaced by a two byte sequence to make it unique. The
implementation can be a simple as two string replace operations. There was some concern about
SLIP overhead because in a worst case scenario (sending packets containing nothing but end-of-
frame markers) SLIP could double the number of bytes being sent. But, in tests with the final PAS
2.0 message implementation, SLIP added an average of 1 extra byte for every 1666 bytes sent.
Without SLIP, 1 out of every 50 PAS 2.0 messages would be incorrectly split into multiple short
packets that would be rejected with Cyclic Redundancy Check (CRC) errors, losing data.
The routing protocol is based on a draft specification developed for communication between the
CWS and the PLSS controllers, extended to be usable for inter-assembly communication. The
software refers to this format as the PLSS Bus Spec. It consists of a 5 byte header (with fields for To
ID, From ID, Message Type, Sequence Counter, and Data Length), followed by zero to 255 bytes
of serialized data, and finally a two byte CRC computed over the previous fields. This is shown
in Figure 44. The protocol requires both To and From fields because the programable logic on the
CWS assembly routes packets between interfaces (and also implements SLIP in hardware).
NASA/TM—2016-219149 9

Figure 4: PAS 2.0 Serial Routing Protocol
address
FROM COUNT
data count
TYPE
message type
DATA DATA CRC
data data cyclic redundancy check
Generic publish data message
cyclic redundancy check
SEQ
sequence numberaddress
TO
3.5 Data Serialization
3.5.1 Google Protocol Buffers/Nanopb in PAS 1.0
In PAS 1.0, ZeroMQ is responsible for moving bytes between computers, but it does not determine
what format those bytes take. A serialization protocol is needed to standardize the format of the
data being exchanged. The open source Google Protocol Buffer[1313] format was selected as a binary
serialization protocol.
Advantages of using Protocol Buffers include:
• An efficient (slightly compressed) binary data representation
• Easy backwards compatible extension as more data is added
• Thoroughly tested and optimized by Google
• A code generator that creates the necessary encoding and decoding software from a simple
data description language
• Portable generated source code is added to projects instead of requiring a library
Protocol Buffers as packaged from Google has support for the C++, Java and Python languages,
but dozens of implementations for other languages are provided by third parties.
Informatics and the other AEMU subassemblies used the Nanopb[1414] C language implementation.
Nanopb is designed for embedded systems and has an option to statically allocate all of its memory.
Although the Informatics code is partially written in C++ and could use the higher level interface,
it used the Nanopb implementation for commonality with the other AEMU assemblies.
The format of the data published by ZeroMQ is shown in Figure 55. A 16 bit Cyclic Redundancy
Check is stored in the first part of the message (and is computed over the remainder of the message).
Next is two bytes that encode the length of the Protocol Buffer part of the message. The CRC and
length are sent in network byte order. Next is the Protocol Buffer payload, followed by 0 to 3 pad
bytes (ASCII 0x00) to make the total message length a multiple of 4 for compatibility with the
older ARM architecture processor used in the PAS 1.0 Audio assembly.
The Protocol Buffer part of the message has 3 mandatory fields followed by 0 or more optional
fields. The mandatory fields are sender, timestamp, and type. The type field determines which
optional fields follow. For example, the EVENT_LOCATION type will always be followed by the
NASA/TM—2016-219149 10

Figure 5: ZeroMQ/Protocol Buffer wire format
Protocol Buffer Payload16 bit CRCCCITT/xmodem
sender(varint)
timestamp(8 byte double)
type(varint) options
value value
UDP or ZeroMQ Data
key(varint)
value
key(varint)
key(varint)
key(varint)
key(varint)
key(varint)
16 bit length of protocol buffer 0 to 3 pad bytes
latitude, longitude and altitude fields. About two dozen message types are understood by the PAS
1.0 Informatics software.
3.5.2 Electronic Data Sheets in PAS 2.0
For PAS 2.0, the Protocol Buffer message data serialization was replaced with a Consultative Com-
mittee for Space Data Systems (CCSDS) draft standard called Electronic Data Sheets (EDS). EDS
is similar to Protocol Buffers in that it uses a domain specific language to describe the possible
formatting of data messages (XML format for EDS) and it generates custom code to read and write
binary data in the specified format (an EDS library is built and linked to Informatics).
The EDS message format as implemented in PAS 2.0 resulted in bigger messages than the Protocol
Buffer implementation, and EDS has very limited support for languages other than C. However,
unlike Protocol Buffer messages, EDS messages can be created to match existing wire formats.
This is expected to be helpful when communicating with future PLSS controllers.
Note that for PAS 2.0, timestamps are not sent with every message as they were in PAS 1.0. PAS
2.0 Informatics assumes that the time a message is received (based on its own clock) is an adequate
timestamp.
NASA/TM—2016-219149 11

3.6 Experimental Voice Recognition
During PAS 2.0 development, control of the Informatics system using speech recognition was
demonstrated. This was implemented using a separate program from Informatics GUI that calls
the Pocketsphinx[1616] software library. Pocketsphinx is a lighter weight version of the Sphinx
speech recognition engine developed by Carnegie Mellon University. Recognized phrases gen-
erate a Human Machine Interface (HMI) network message to the Informatics GUI that simulates
key press events. Additional key press event handlers were added for common operations such a
take a picture and field note.
The voice recognition program listens for an attention keyword (currently Informatics) before
switching to an Informatics specific list of vocabulary phrases. Using a reduced vocabulary de-
creases the rate of false positive recognition errors. The program switches back to looking only for
the attention keyword if no Informatics vocabulary has been heard in the last five seconds. An au-
dio tone is generated (or a message is sent to the COMM assembly to generate an audio tone) when
the speech recognition program changes modes. The currently recognized Informatics vocabulary
phrases are: page left, page right, page up, page down, enter, take a picture, save, discard, and
field note.
The voice recognition program has been tested using live input from a microphone and using play-
back of voice input captured to a file. It has not yet been testing using audio input being streamed
from another space suit assembly.
Unfortunately, software changes in the final PAS 2.0 design rendered the experimental voice recog-
nition inoperable without significant extra work. The switch to EDS serialization requires HMI
scripts to be rewritten in the C language, and the audio format being sent from COMM to Infor-
matics was changed from uncompressed 16 KHz audio to G.729 compressed 8 KHz audio in order
to reduce processor loading on the COMM assembly. The compressed audio is not suitable for the
stock Pocketsphinx voice recognition configuration.
4 Software Architecture
The software architecture of the Informatics GUI is split into two parts:
• An infrastructure part written in the C++ programming language that is responsible for all
of the inter-assembly communication and packet decoding and verification.
• A graphical user interface part written in the Qt QML language (which is a combination
of a declarative graphics layout language and Javascript) that is responsible primarily for
formatting the display of data.
The architecture uses a custom software component called AppData that handles the exchange of
data between the C++ and QML components. AppData hides the details of the Qt Signal and Slot
NASA/TM—2016-219149 12

Figure 6: Block Diagram of C++ code functions
Setup
Periodic(1 Hz)
Initialize AppData
Initialize Publish Socket
Initialize Subscribe
Socket
Initialize Timers
Update Time in
AppData
CreateInformaticsTelemetry
SendCreate
Message Structure
Fill In Message
Fields
EncodeProtocol Buffer
Add 16 bit CRC Publish
ReceiveSubscribedMessage Arrives
Compute And Check 16 bit CRC
Decode Protocol Buffer
Msg Type Specific
Processing
Update AppData
AppData Change
Graphics Update
update mechanism, and makes it so that when new telemetry arrives and the infrastructure code
changes a value, updates are propagated only to dependent data in the user interface.
4.1 C++ Infrastructure
A block diagram of the C++ infrastructure code is shown in Figure 66. The infrastructure is divided
into five major operations: Setup, Periodic Processing, Sending Data, Receiving Data, and App-
Data Change. Major operations are broken into a number of minor operations, and solid arrows
between them show their order of execution. Some minor operations will trigger the start of differ-
ent major operations, and these links are indicated with dotted arrows. The design is the same for
PAS 1.0 and 2.0, but PAS 1.0 communicates using ZeroMQ Ethernet sockets and Protocol Buffers,
while PAS 2.0 uses LDVS serial links and EDS.
4.1.1 Setup
The Setup code is executed when the program starts. Its first job is to initialize AppData. Since
AppData is actually a C++ class, it is initialized by creating an instance and then calling the setter
functions for the class members that need to have initial values.
NASA/TM—2016-219149 13

Next a ZeroMQ socket (or LVDS serial link for PAS 2.0) is created for publishing any information
that Informatics needs to make available to other AEMU assemblies.
A different ZeroMQ socket (or LVDS serial link) is then subscribed to any data Informatics needs
to receive from the network. A single ZeroMQ subscribe socket can be connected to multiple ports
and interfaces, so only one subscribe socket is needed. The subscribe socket is connected to the
port that the publish socket uses, so anything Informatics publishes will be received and processed
in the same manner as data from other AEMU assemblies (a useful self-check). Serial links cannot
connect to multiple ports, so there are two serial port receivers in PAS 2.0 and Informatics does
not see messages from itself on the serial links. However, in PAS 2.0, an additional UDP message
sender and receiver was implemented (primarily to help with testing on hardware without serial
ports) that allows Informatics to see messages from itself.
The last step of the Setup code is to initialize timers. After initialization, a 1 Hz timer triggers
Periodic Processing at regular intervals.
A second unrelated timer exists in the infrastructure code for keyboard handling. If a key is held
for more than 400 ms before it is released, the Alt flag is added to the keystroke, allowing it to
be treated differently in the user interface code. This is intended to help work around the limited
number of input buttons available on some displays.
4.1.2 Periodic Processing
The Periodic Processing code runs at 1 Hz intervals. The first thing it does is to get the current time
and update the value in AppData. This change in AppData will trigger an update to GUI elements
that depend on time.
The second periodic task is to create and publish a telemetry packet containing the Informatics
status, which so far is always nominal. The process for creating and publishing data is the same for
any type of telemetry, and is described in the next section.
The final (PAS 1.0 only) periodic task is to create and publish a telemetry packet containing Buddy
Information (suit ID, consumable time remaining, position, and any warning messages). In PAS
2.0, the Faultstack message sent by CWS replaces the buddy message.
4.1.3 Sending Data
For PAS 1.0, publishing data starts with allocating a Nanopb protocol buffer structure (a type of ”C
struct”) to hold the details of the packet being created. A call to the standard C memset function is
used to initialize all fields in the structure to zero.
Next, values are assigned to some of the fields in the structure. There are three mandatory fields
that must always have values: sender, type, and timestamp. The sender field indicates that this data
is coming from Informatics. The type field contains the type of the protocol buffer message, which
NASA/TM—2016-219149 14

determines the additional optional fields that must be included. The timestamp field contains the
time the packet is created.
Some data fields that protocol buffer labels ”optional” (not part of every message) may be really be
required for a particular message type. For example, if the type fields say that the packet contains
Informatics Status information, then a value must be assigned to the status field.
Because this is the simple Nanopb interface instead of the more full featured C++ interface for pro-
tocol buffers, an additional field of the form has_X must be set to true for every optional parameter
X to indicate that it is being used.
After the fields are filled in, the structure is encoded as a protocol buffer into an array of bytes. Two
function calls are required to perform this task: pb_ostream_from_buffer and pb_encode.
After encoding, the encoded length is prefixed to the beginning of the encoded data, and 0 to 3 pads
bytes are added to the end.
Next a 16-bit Cyclic Redundancy Check (CRC - CCITT xmodem variant) is computed for the array
of bytes and prepended to its beginning.
Finally, the byte array is sent to the ZeroMQ publish socket for delivery to the network. Note
that since the Informatics subscribe socket is connected to the port of the publish socket, anything
published will trigger the reception of a network packet.
PAS 2.0 works similarly, but allocates and fills a C struct for encoding messages in the EDS format,
calls the EDS library to serialize the data, prepends the PLSS Bus Spec Header, appends a CRC,
does the SLIP encoding, and sends the data out a serial port.
4.1.4 Receiving Data
For PAS 1.0, the Receiving Data operation is started whenever a complete packet has arrived on the
subscribe network socket. A 16-bit CRC is computed for the packet (ignoring the first two bytes),
and then compared to the 16-bit CRC assumed to be stored in the first two bytes of the packet. If
they are not identical, the CRC error counter is incremented and the packet is discarded.
After the CRC is stripped off, the next two bytes are read to find the length of the Protocol Buffer
portion of the packet, which is then extracted from the bytes immediately following the length. The
length is required because there may be pad bytes at the end that must be ignored.
Next, the Protocol Buffer bytes are decoded into a Nanopb protocol buffer structure. If there is
a decoding error (because it somehow received a packet not representing a Protocol Buffer), the
decode error counter is incremented and the packet is discarded.
The type field of the structure is examined, and a case statement chooses some type-specific code
to execute based on the field. In almost all cases, this code simply reads the optional fields required
by the type from the structure and calls the setter functions to write the values to AppData.
NASA/TM—2016-219149 15

Data handling for the Caution and Warning type is slightly different, because that data is maintained
in a separate list structure that works much like AppData, but is variable length (there may be zero
or more Caution and Warning messages that have been received). Items are never deleted from
this list, but their timestamp and acknowledged status is updated with the most recently observed
telemetry.
PAS 2.0 works similarly, but starts when an end-of-frame marker is found in the serial data stream.
The accumulated data before the marker is passed through SLIP decoding to restore any original
values that would have clashed with the end-of-frame marker, checked for a valid data length,
checked for a valid CRC, decoded by the EDS library, and finally passed to the case statement that
executes type specific code.
4.1.5 AppData Data Exchange
The AppData class is basically just a place to store values (as instance variables) with getter and
setter functions for reading and writing each value. The setter function checks to see if the value
has changed, and if so, emits a Qt signal to notify dependent code that it needs to update. The
signal declaration and a Qt property declaration are also part of the class.
This results in five lines of hard to read boilerplate declarations and repetitive code for each value
that is stored in AppData, when all a programmer really cares about is the variable’s type and name.
To help make the code maintainable, the repetitive code is generated from an M4 macro language
expansion. Listing 33 shows the code generated from a line with the APPDATA(double, timeNow)
macro that contains only the type double and name timeNow. This expansion allows the AppData
class definition to consist of an easy to read macro line for each variable.
A prebuild.sh script is run before compilation to perform M4 macro expansion (resulting in the
file called qmlapplicationviewer.h) and to generate the C code for protocol buffer encoding and
decoding from the protocol buffer definition file (aemu.proto). For PAS 2.0, the EDS library is
built instead of the protocol buffer code generation.
Listing 3: M4 macro expansion output for input: APPDATA(double, timeNow)1 / / a u t o g e n e r a t e d from q m l a p p l i c a t i o n v i e w e r . i n − DO NOT EDIT
2 Q_PROPERTY( d o u b l e timeNow READ timeNow WRITE set t imeNow NOTIFY timeNowChanged )
3 p u b l i c : v o i d se t t imeNow ( c o n s t d o u b l e &s ) { i f ( s != m_timeNow ) { m_timeNow = s ; e m i t timeNowChanged ( ) ; }}
4 d o u b l e timeNow ( ) c o n s t { r e t u r n m_timeNow ; }
5 s i g n a l s : v o i d timeNowChanged ( ) ;
6 p r i v a t e : d o u b l e m_timeNow ;
4.2 QML/Javascript Graphical User Interface
The layout of the graphical user interface is based on previous versions of the Informatics interface
as tested at Desert RATS and user interface prototypes from AEMU human factors studies.
NASA/TM—2016-219149 16

The graphical user interface has copious information to display and a limited screen area on which
to display it, so the screen is divided into a number of areas where the largest area varies to show
details of a particular data set. There is a row of tab-like buttons across the top of the display
that are used to select the variable set of data to display. The currently selected tab across the
top is highlighted with a blue border. There are several ways of switching to a different tab to
accommodate running the program on different types of hardware. If a keyboard is connected to
the hardware, the left and right arrow keys will select adjacent tabs. The LCD7 display on the
Beaglebone development board has 5 pushbuttons (up, down, right, left, and enter), where the left
and right buttons switch between tabs. Five of the edge keys on the Desert RATS cuff display are
used for the same purposes. If a mouse is connect to the hardware, the tab can be clicked upon
to select it. If the hardware has a touch-screen interface (like the LCD7), touching the tab on the
display will select it. For PAS 2.0, a Human Machine Interface (HMI) network message was added
that allows other programs (or computers) to simulate key stoke input to Informatics. This was
added to help explore alternate human machine interface paradigms, and it has been tested with
gesture control and speech recognition software.
Some data sets have a secondary menu of operations that appears along the left edge of the display.
For example, Figure 88 shows the Communication display (because the COMM tab is selected at the
top), which has three operations in the menu: Scroll Down, Scroll Up, and Ack Mesg. The currently
selected operation is highlighted with a yellow border, and it can be changed with the up and down
arrow keys, dedicated up and down buttons, mouse click or touch. The enter key or pushbutton
is used to perform the action associated with the currently selected menu item. With a mouse or
touchscreen, selecting an already highlighted menu item will perform its action. The secondary
menu items are dimmed if they cannot be applied in the current circumstances.
Each of the data set displays that have an implementation will be described in greater detail. How-
ever, the user interface is a work in progress, and some of the displays are proof of concept im-
plementations with placeholders for some of the details. The PAS 1.0 placeholder Map Display in
particular was considered less critical for near term implementation, so for PAS 2.0 it was replaced
by a Setup Display that is used for power control and software maintenance tasks (purging old
captured files, scheduling a file system check, and rebooting the computer).
4.2.1 Persistent Display
The data in the rightmost column is considered the most critical and is the same in all displays, no
matter which tab is selected along the top. As shown in Figure 77, it contains system time followed
by EVA time, time remaining for the consumables, and other critical information that is sent from
the CWS assembly. Only the Informatics battery’s state-of-charge and estimated time remaining
are calculated by Informatics.
There is a place for navigation data (unused in PAS 2.0), and at the bottom is a duplicate of the
information on the two line text display that is part of the CWS assembly.
NASA/TM—2016-219149 17

Figure 7: Consumable Display
4.2.2 Consumable Display
There are four consumable displays: Primary Oxygen, Secondary Oxygen, Battery Charge and
Water. Each of these displays has a tab at the top of the screen to select it, labelled O2, S_O2,
BATT, and H2O, respectively. Figure 77 shows the Battery display. Under the name on the tabs
is the estimated time (in hours and minutes) before the consumable is exhausted, with the limiting
(smallest) time colored red for emphasis. Secondary Oxygen is not consumed until Primary Oxygen
is gone, and its time will show 23:59 until it is being consumed (this is the largest number that can
be represented in this implementation).
When any of the four consumable displays are shown, the left side of the display will show bar
graphs for all four consumables. Numbers near the graphs show the current level of the consumable,
the maximum value, the percent remaining, as well as the time remaining. If the current value is
less than some critical value, the bar graph will turn from green to red, and the critical value will
be displayed inside the graph. All of these numbers are received via telemetry from the Caution
and Warning System (CWS) assembly. They are not fixed values in the GUI code.
The center of the screen will show consumable specific details (that vary when a different consum-
able tab is selected), but currently it is just a placeholder for the primary and secondary oxygen
and water displays. For the PAS 2.0 BATT display, it shows the Carrier and PMAD board sensors
(voltages, currents, powers, and temperatures).
Below the consumable specific display is biomedical data, which consists of heart rate in PAS 1.0,
and metabolic rate in all versions. Each bar in the metabolic rate chart represents 10 minutes.
NASA/TM—2016-219149 18

Figure 8: Communications Display
4.2.3 Communications Display
The Communication Display consists of areas for the four major PAS 1.0 assemblies: Informatics,
Radio, Audio, and CWS. For PAS 2.0, the Radio and Audio assemblies have been combined, so
there are three assembly areas (shown in Figure 88). These areas turn green if a recent network
message arrived indicating that the assembly status is nominal. The status and last update time of
the status message for each assembly is shown as text.
The Informatics area also displays counts of total number of network messages received, CRC er-
rors, decoding errors, encoding errors, out-of-sequence warnings, messages skipped (if the optional
message throttling feature is used), statistics concerning SLIP protocol efficiency, software and PL
version numbers, and the Suit ID supplied by the CWS system.
The Comm area shows status information form the COMM assembly, including volume levels, soft-
ware and PL versions, switch modes, and a text description of any tone currently being played.
At the bottom of the Communication Display is an area showing received text messages (sent from
ground stations or other assets). When a new text message arrives, the message list scrolls to the
end to show the new message and the COMM tab at the top of the screen turns blue as a visible
indicator on every screen that a new message has arrived. A new message also triggers a network
message to the Audio assembly to play an alert sound.
The menu items on the left side of the display can be used to scroll up and down the text message
list, and the Ack Mesg menu item will acknowledge that current messages have been viewed by
NASA/TM—2016-219149 19

Figure 9: Buddy Display
turing off the blue highlight on the COMM tab.
The message list has a fixed upper limit to its size (currently 50) to limit memory consumption of
the program. If more than the maximum number of text message are received, the oldest ones will
be dropped form the list.
4.2.4 Buddy Display
The Buddy Display (shown in Figure 99) shows information from other EVA assets. This informa-
tion is the same as the FaultStack message generated by CWS to indicate a warning, but it comes
from off-suit (via COMM).
The buddy information displayed includes a suit ID number, the UTC time of the last update from
a suit, time remaining for the four consumables, position (latitude, longitude and altitude) reported
by the other suit (only in PAS 1.0), and a line for each warning message generated on the other suit.
Receiving a new warning message also triggers a network message to the Audio assembly to play
an alert sound and highlights the BUDD tab at the top of the screen. The Ack button acknowledges
the warning and removes the highlight.
NASA/TM—2016-219149 20

Figure 10: File Selection Display
4.2.5 File Selection
The Informatics assembly has a file system that holds images, procedures, and timeline files that
the astronaut can view. The File Selection display, shown in Figure 1010, provides a way for the
astronaut to navigate the file system and select a file for viewing.
The current directory being viewed is shown at the top of the center section of the display, and
the contents of the directory are shown as a list below. Directory names are shown in bold to
distinguish them from regular files. The currently selected file or directory is highlighted with a
blue background.
The Scroll Up and Scroll Down menu items on the left of the screen change the currently selected
file or directory. Choosing the Select File menu item when a directory is highlighted changes
the current location to that directory and shows its contents. Choosing the Up Level menu item
goes back to the parent directory. The Up Level menu item will be dimmed and disabled if the
current directory is the highest level allowed (the File Display can not be used to explore the entire
computer).
Choosing the Select File menu item when a file is highlighted will load the file and switch to the
appropriate tab to display it. The Timeline Display (TLINE) will display timeline files, and the
Procedure Display (PROC) will display images or procedures.
If a mouse or a touchscreen is available, it can be used to select files and directories.
NASA/TM—2016-219149 21

Figure 11: Procedure Display is a full-featured HTML renderer
4.2.6 Procedure Display
The Procedure Display is used to display images or procedures that the astronaut has selected.
These images and procedure files are stored on a file system, and may be updated by ground sys-
tems or other assets using a file transfer protocol. Images may also come from an Informatics
camera.
Procedure files are formatted using standard Hypertext Markup Language (HTML), and may con-
tain text markup, links and images. The Procedure Display has the features of a web browser. In
fact, it is not restricted to loading data from the local file system, and if it has access to a larger
network, it can load data from standard HTTP URLs. Figure 1111 demonstrates this by rendering an
Internet news site. There is no interface for entering an HTTP URL, but a procedure file can be
loaded that contains an HTTP redirect command. Actual procedures that an astronaut might per-
form have yet to be written, but there are a few placeholder files for demonstration purposes.
The menu items on the left of the screen can be used to pan and zoom around the displayed image
or procedure. If a mouse or a touchscreen in available, they can be used to select and follow
HTTP links. There is currently no interface for selecting and following a link via the keyboard or
pushbuttons.
The Procedure Display (and all other displays) stores its current position within a page, so the
astronaut can switch to another tab to check something and then switch back, returning to the same
place.
NASA/TM—2016-219149 22

Figure 12: Timeline Display
4.2.7 Timeline Display
Timelines are lists of procedures with expected starting times and completion status indications.
They serve as a ”To Do” list for astronaut activities.
The Timeline Display is shown in Figure 1212. The contents of a particular timeline are loaded from
a file on the file system. The contents of the placeholder file used for testing that resulted in Figure
1212 are shown in Listing 44 to demonstrate the file format.
Each line in the timeline display list begins with a starting time (in hours and minutes) relative to
the start of the list. The first entry will will always be 00:00. In the example shown, the second
entry has a start time of 00:20, so the first entry is expected to require a total of 20 minutes. The
third entry has a start time of 00:25, so the second entry is expected to take 5 minutes.
After the starting time, the timeline display list has a short title. If the activity is marked as com-
pleted, the title will be dimmed and a strike-through font will be used (as demonstrated in the second
entry).
A timer showing the current number of hours and minutes since a timeline was loaded is shown in
the tab display underneath TLINE. The same timer (but including seconds) is shown in the menu
on the left of the screen. The timer can be paused or continued by selecting the time display in the
menu with the keyboard, pushbutton, mouse, or touchscreen.
Additional menu items allow the astronaut to toggle the completion status of an entry, scroll up and
NASA/TM—2016-219149 23

Figure 13: Camera Display after still image capture
down the list of entries, and view the procedure associated with an entry. If a procedure is viewed,
it will be loaded and the Informatics display will switch to the PROC tab. It is also possible to
have another timeline as an entry. If a timeline entry is viewed, it will replace the currently shown
timeline and reset the timer to zero,
The timeline files are structured using the JSON text format demonstrated in Listing 44. For each
list entry, a starting time, completion status, title, and path are required. The path is the file system
path to the new procedure or new timeline that will be loaded if the entry is selected. These timeline
files are read-only for the GUI, so the files are not changed if the completion status of an item is
toggled.
Listing 4: Placeholder timeline file: idle.tline1 [ { ” s t a r t ” : 0 , ” c o m p l e t e ” : f a l s e , ” t i t l e ” : ” Read News” , ” p a t h ” : ” / i n f o r m a t i c s / f i l e s / p r o c e d u r e s / GoogleNews . h tml ” } ,
2 { ” s t a r t ” : 2 0 , ” c o m p l e t e ” : t r u e , ” t i t l e ” : ” Read H e l l o ” , ” p a t h ” : ” / i n f o r m a t i c s / f i l e s / p r o c e d u r e s / h e l l o w o r l d . h tml ” } ,
3 { ” s t a r t ” : 2 5 , ” c o m p l e t e ” : f a l s e , ” t i t l e ” : ” Open I d l e t i m e l i n e ” , ” p a t h ” : ” / i n f o r m a t i c s / f i l e s / t i m e l i n e s / i d l e . t l i n e ” } ,
4 { ” s t a r t ” : 2 6 , ” c o m p l e t e ” : f a l s e , ” t i t l e ” : ” Open Second t i m e l i n e ” , ” p a t h ” : ” / i n f o r m a t i c s / f i l e s / t i m e l i n e s / second . t l i n e ” }
5 ]
4.2.8 Camera Display
The Camera Display provides the user interface for recording still images, audio, video, and field
notes, and is shown in Figure 1313.
NASA/TM—2016-219149 24

The top menu item on the left side of the display toggles displaying the live viewfinder from the
Informatics Ethernet camera. When this is toggled on, the Live View menu item is highlighted,
and the central part of the camera display is updated five times per second with a current image
captured from the camera. This is intended to allow the astronaut to see what the camera is seeing,
and to help frame the shots being captured. This live viewfinder functionality is the most processor
intensive task performed by Informatics, and requires about 50% CPU utilization when running on
the ZedBoard with the frame buffer graphics.
The next menu item labelled Still Photo triggers the capture of a high resolution (1920x1280) still
image from the camera that can be stored to the Informatics file system. There is a 3 second count-
down (with the numbers ”3” ... ”2” ... ”1” ... superimposed on the display) before the live image is
stopped and the captured picture is shown for review. During review, the Save, Discard, and Field
Note menu items are highlighted.
The Save menu item stores the image being reviewed in the images directory of the Informatics file
system. The date and time of the captured image is used as the file name.
The Discard menu item deletes the captured image.
The Field Note menu item toggles the recording of a field note consisting of audio data sent from the
Audio assembly, high resolution (1280x720 30 frame per second H.264 encoded) video data from
the camera, and a metadata text file with current latitude, longitude, altitude, heading, field note
start time, and field note stop time. A second selection of the Field Note menu item stops recording
a field note. A field note can be started at any time, but if it starts when a still image is being
reviewed, the same base file name as the photo will be used for all the field note files to indicate
that they all belong together. Field notes are saved in the fieldNote directory of the Informatics file
system.
The Video Record menu item toggles the capture and storage of high resolution (1280x720 30 frame
per second H.264 encoded) video data from the camera to the video directory of the Informatics
file system. This is separate from field notes which are intended to capture ”interesting” events.
The Video Record function is intended to enable the recording of an entire 8 hour Extra Vehicular
Activity session for later review. Note that storing 8 hours of video in this format requires approx-
imately 10 GB of space on the Informatics file system. The files captured by Video Record are
named according to their start time and are split into individual 10 minute files.
Saving audio and video to the Informatics file system is performed by spawning a background
ffmpeg process for each stream to be recorded. This is efficient and only requires a few percent of
CPU utilization. Additionally, a ffmpeg process is active whenever Informatics is running to relay
a low bit rate (320x180 5 frame per second H.264 encoded) video stream from the camera to the
Comm assembly so that it can be sent off suit.
4.2.9 Setup Display
The Setup Display, shown in Figure 1414, is used for three purposes:
NASA/TM—2016-219149 25

Figure 14: Setup Display
1. to manually set the Informatics battery state-of-charge, overriding the calculation that esti-
mates it based on battery voltage at system start
2. to switch power off or on to the display, camera, or utility port
3. to perform some maintenance activities intended for after an EVA has been completed
When the Info BATT SoC menu item is selected, the up and down buttons will change the estimated
number of milliAmp-hours remaining on the Informatics battery in steps of 100. Selecting the menu
item again exits this mode.
Selecting any of the three power menu items toggles the power to appropriate device attached to
Informatics. If the display is powered off, it is difficult to know what menu button to press to
reactivate it, so any button press will turn it back on.
The Clean Files menu item will delete all recorded image, audio, video, and metadata files from the
Informatics file system. It is only intended to be used after copying the files elsewhere (which can be
done using the Secure Copy Protocol with an Ethernet device connected to the Utility port).
The Sched fsck menu item schedules the Linux fsck (file system check) program to run when the
system is next started. This is a potentially time consuming operation that might fix problems
caused by switching off the system power while data is being written.
The Reboot menu item will cleanly shutdown and restart the system. If any of these last three menu
items are selected, nothing will happen until the the Proceed menu item is selected. The operation
NASA/TM—2016-219149 26

Figure 15: Warning Display announcing three faults
can be cancelled by selecting any of the three menu items again.
4.2.10 Warning Display
The Warning Display records warning messages in a list, as shown in Figure 1515. The list (and
display) is initially empty, but one entry is created when a new unique warning message is received
(for example, Battery Level Low). If more messages arrive for the same condition (Battery Level
Low), the data for the existing entry in the list will be updated. Updating existing entries is preferred
over adding new entries to prevent the list from becoming huge and to give the astronaut the ability
to select an entry (which would be difficult if the list is quickly changing order or scrolling).
The first item in an entry is the timestamp associated with the warning. It is followed by a short
readable description of the condition. Entries may have a status of either acknowledged or not
acknowledged. Acknowledged entries are faded to be less noticeable. If any entry is not acknowl-
edged, the WARN tab will change color to show that it needs attention. The Warning Display is
only an output, so it has no interface for changing the acknowledged state of a warning. If a warning
is acknowledged on the CWS assembly, it will show as acknowledged on Informatics.
The menu items on the left side of the display can be used to scroll through the list or to load a
procedure describing what to do about the warning. If such a procedure does not exist, the Go To
Proc menu item will be dim and have no effect. If a procedure is selected, it will be loaded from
the file system and the Informatics display will switch to the PROC tab.
NASA/TM—2016-219149 27

5 Summary
Two generations of an Informatics assembly for spacesuit graphical displays are described. Several
open source software libraries were leveraged to ease development, reducing the schedule and
budget problems often associated with creating graphical software. The Qt graphics library allowed
creating the displays primarily using a declarative markup language, which is much easier than
using a C/C++ language application programming interface.
For PAS 1.0, the ZeroMQ library hid the details of implementing a publish/subscribe network
architecture, and the Nanopb implementation of Google Protocol Buffers simplified creating and
updating the network message formats. Good software libraries and inexpensive but full featured
development hardware allowed one person to develop and test the entire PAS 1.0 prototype in under
6 months.
For PAS 2.0, the Informatics software was extended with performance challenging video capture
and display functionality, and it was demonstrated to run adequately on an embedded computer
with custom peripheral boards using only a frame buffer video interface (no graphics processor).
The message serialization library and assembly interconnect methods were changed without sig-
nificantly affecting the rest of the software design.
NASA/TM—2016-219149 28

6 References
[1] Ivancic, William D.; Sands, Obed S.; Bakula, Casey J.; Oldham, Daniel R.; Wright, Ted;
Bradish, Martin A.; Klebau, Joseph M., Power, Avionics and Software - Phase 1.0: Subsystem
Integration Test Report, NASA Technical Memorandum TM-2014-216664, 2014
[2] Bradish, M., Sands, O., Wright, T., Bakula, C. et al., Advanced Spacesuit Avionics Subsystem
Integration Testing, SAE Technical Paper 2014-01-2150, 2014, doi:10.4271/2014-01-2150
[3] Wright, Theodore W., Advanced Extravehicular Mobility Unit Informatics Software Design,
NASA Technical Memorandum TM-2014-218319, 2014
[4] Scott Bleisath, Michael Casciani, Lisa VanderAar, Ted Wright, Martin Bradish, Casey Bakula,
Dan Oldham, AES Advanced Space Suit (AdvSS) Power, Avionics, Software (PAS) Subsystem -
PAS 2.0 Integration Test Report, Advanced Space Suit Project Documentation, 2016
[5] Wright, Ted, FPGA Graphics on ZedBoard for Informatics, Informatics Project Documenta-
tion, 2015
[6] William D. Ivancic, Obed S. Sands, Casey J. Bakula, Daniel R. Oldham, Ted Wright, Martin A.
Bradish, Joseph Klebau, Power Avionics and Software Communication Network Architecture,
NASA Technical Memorandum TM-2014-216628, 2014
[7] William D. Ivancic, Obed S. Sands, Casey J. Bakula, Daniel R. Oldham, Ted Wright, Martin
A. Bradish, Joseph Klebau, A Communication Architecture for an Advanced Extravehicular
Mobile Unit, 13th International Conference on Space Operations, AIAA 2014-1851722, 2014
The Informatics software has been tested on three embedded hardware platforms:
[8] Beaglebone Black open-hardware computer
http://beagleboard.org/blackhttp://beagleboard.org/black
[9] ZedBoard FPGA development kit
http://zedboard.org/product/zedboardhttp://zedboard.org/product/zedboard
[10] Alpha-Data ADM-XRC-7Z1 FPGA reconfigurable computer
http://www.alpha-data.com/esp/products.php?product=adm-xrc-7z1http://www.alpha-data.com/esp/products.php?product=adm-xrc-7z1
The Informatics software makes use of several open source software libraries and programs:
[11] Qt graphical user interface library
http://qt-project.orghttp://qt-project.org
[12] ZeroMQ network library
http://www.zeromq.orghttp://www.zeromq.org
[13] Google Protocol Buffers data serialization format
http://developers.google.com/protocol-buffershttp://developers.google.com/protocol-buffers
NASA/TM—2016-219149 29

[14] Nanopb C language interface for protocol buffers
http://koti.kapsi.fi/jpa/nanopbhttp://koti.kapsi.fi/jpa/nanopb
[15] Ffmpeg audio and video conversion program
http://www.ffmpeg.orghttp://www.ffmpeg.org
[16] Pocketsphinx speech recognition library
http://cmusphinx.sourceforge.net/wiki/tutorialpocketsphinxhttp://cmusphinx.sourceforge.net/wiki/tutorialpocketsphinx
[17] Buildroot Linux file system generator
http://buildroot.orghttp://buildroot.org
NASA/TM—2016-219149 30