ADVANCED OPENCL - Haifux · –Kernel Source Code An OpenGL API level debugger Integrated into...
23
Transcript of ADVANCED OPENCL - Haifux · –Kernel Source Code An OpenGL API level debugger Integrated into...
ADVANCED OPENCL™ DEBUGGING
AND PROFILING – A CASE STUDY
Yaki Tebeka
Advanced Micro Devices
Fellow, Developer Tools
Budirijanto Purnomo
Advanced Micro Devices
Technical Lead, GPU Compute Tools
3 | Advanced OpenCL™ Debugging and Profiling – a Case Study | June 2011
ABOUT OPENCL
OpenCL is FUN!
New programming language
Exposes the massively multithreaded GPU
And the CPU
A lot of horse power, optimized for parallel computing
Order of magnitude performance improvement!
4 | Advanced OpenCL™ Debugging and Profiling – a Case Study | June 2011
OPENCL DEBUGGING AND PROFILING MODEL
However,
Debugging and profiling parallel processing applications is hard
On-time delivery of robust (bug-free) OpenCL applications is challenging
It is almost impossible to optimize an OpenCL based application to fully utilize the available parallel
processing system resources
5 | Advanced OpenCL™ Debugging and Profiling – a Case Study | June 2011
OPENCL DEBUGGING AND PROFILING MODEL
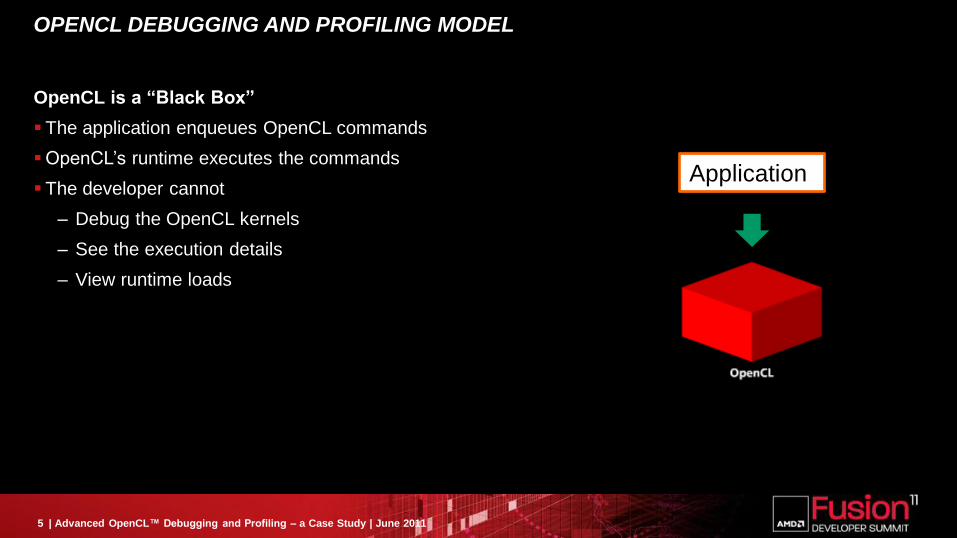
OpenCL is a “Black Box”
The application enqueues OpenCL commands
OpenCL’s runtime executes the commands
The developer cannot
– Debug the OpenCL kernels
– See the execution details
– View runtime loads
Application
6 | Advanced OpenCL™ Debugging and Profiling – a Case Study | June 2011
GDEBUGGER
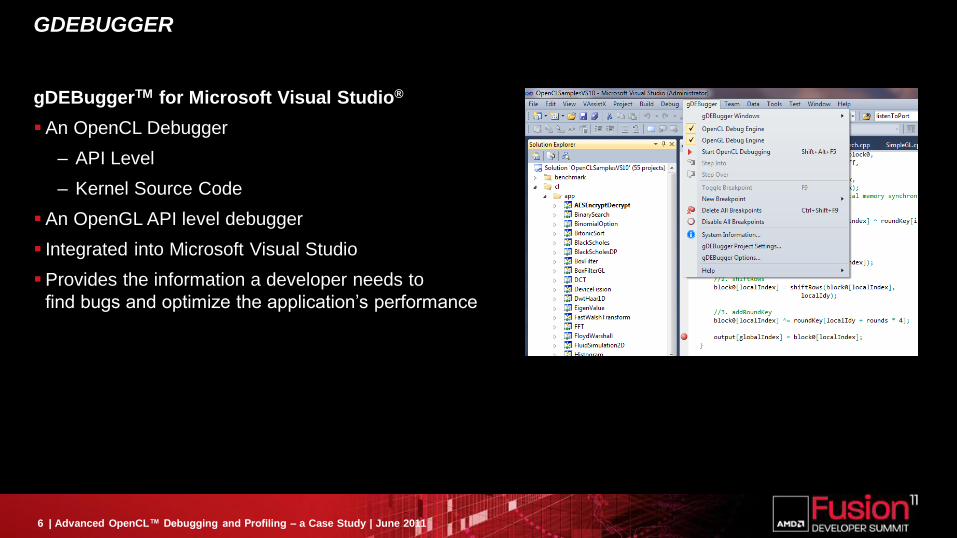
gDEBuggerTM for Microsoft Visual Studio®
An OpenCL Debugger
– API Level
– Kernel Source Code
An OpenGL API level debugger
Integrated into Microsoft Visual Studio
Provides the information a developer needs to
find bugs and optimize the application’s performance

7 | Advanced OpenCL™ Debugging and Profiling – a Case Study | June 2011
DEMO
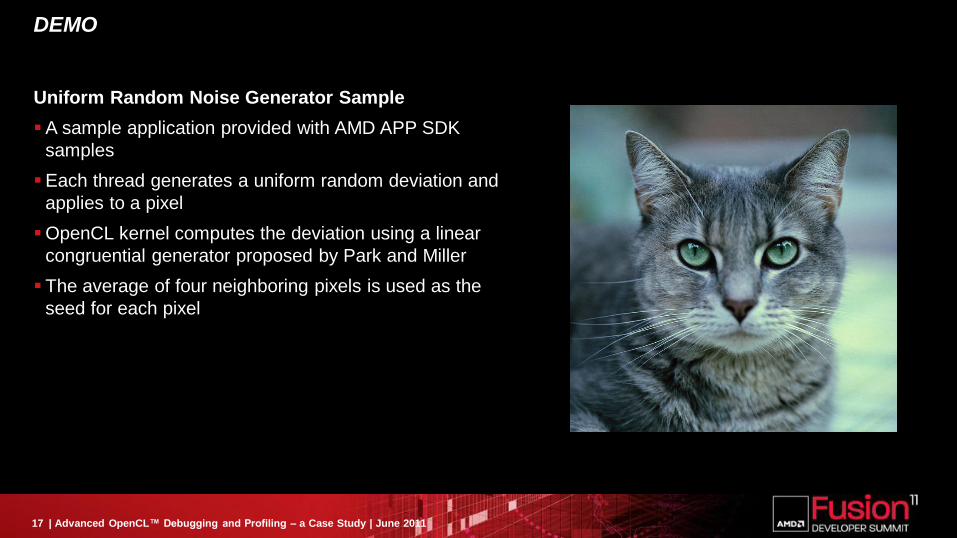
Uniform Random Noise Generator Sample
A sample application provided with AMD APP SDK
samples
Each thread generates a uniform random deviation and
applies to a pixel
OpenCL kernel computes the deviation using a linear
congruential generator proposed by Park and Miller
The average of four neighboring pixels is used as the
seed for each pixel
8 | Advanced OpenCL™ Debugging and Profiling – a Case Study | June 2011
GDEBUGGER
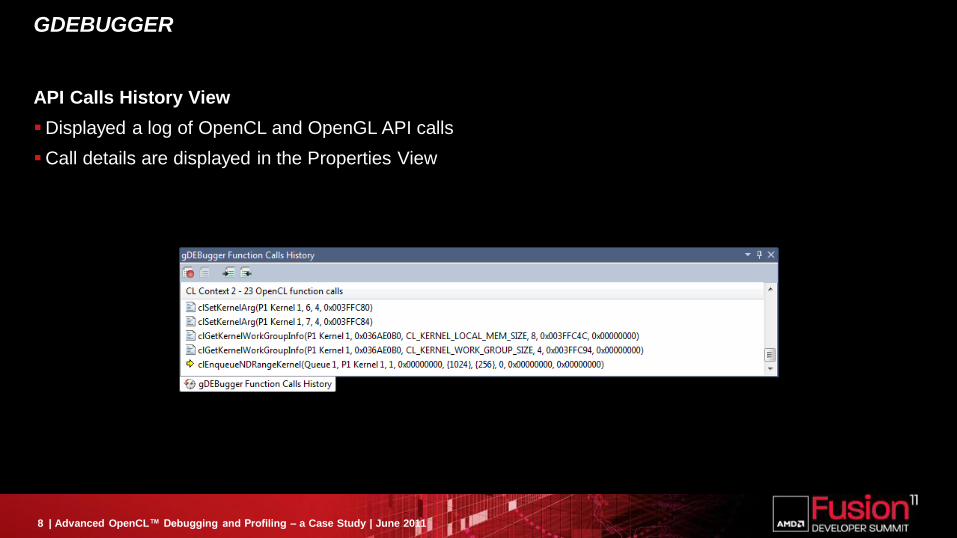
API Calls History View
Displayed a log of OpenCL and OpenGL API calls
Call details are displayed in the Properties View
9 | Advanced OpenCL™ Debugging and Profiling – a Case Study | June 2011
GDEBUGGER
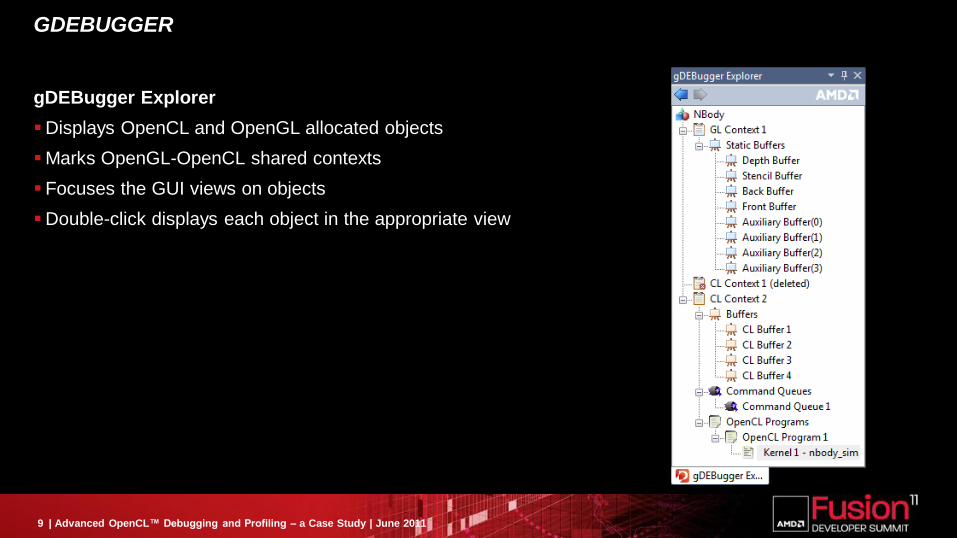
gDEBugger Explorer
Displays OpenCL and OpenGL allocated objects
Marks OpenGL-OpenCL shared contexts
Focuses the GUI views on objects
Double-click displays each object in the appropriate view
10 | Advanced OpenCL™ Debugging and Profiling – a Case Study | June 2011
GDEBUGGER
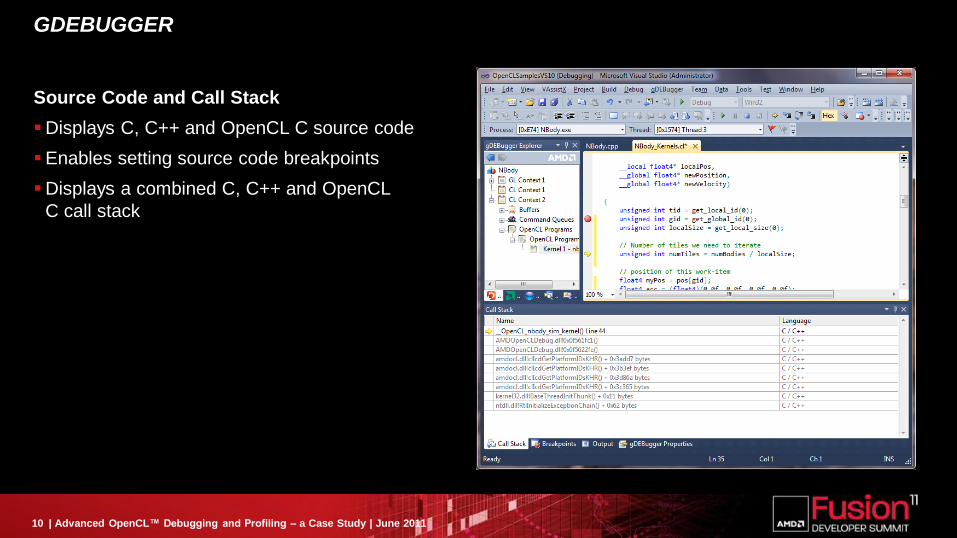
Source Code and Call Stack
Displays C, C++ and OpenCL C source code
Enables setting source code breakpoints
Displays a combined C, C++ and OpenCL
C call stack
11 | Advanced OpenCL™ Debugging and Profiling – a Case Study | June 2011
GDEBUGGER
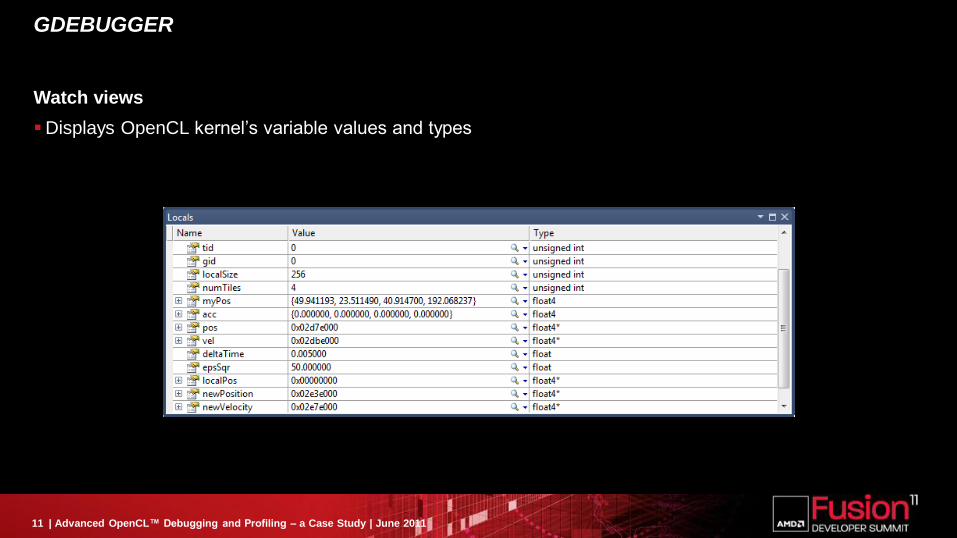
Watch views
Displays OpenCL kernel’s variable values and types
12 | Advanced OpenCL™ Debugging and Profiling – a Case Study | June 2011
GDEBUGGER
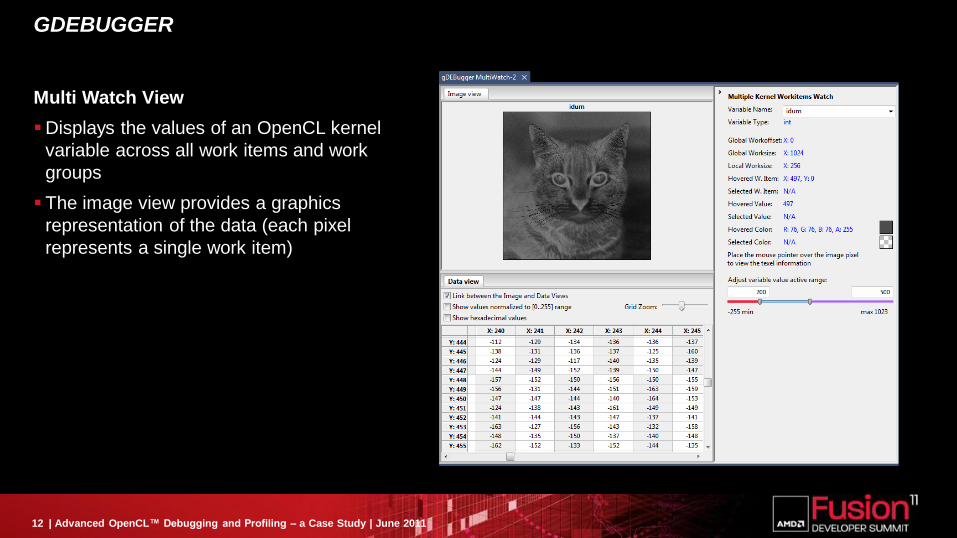
Multi Watch View
Displays the values of an OpenCL kernel
variable across all work items and work
groups
The image view provides a graphics
representation of the data (each pixel
represents a single work item)
13 | Advanced OpenCL™ Debugging and Profiling – a Case Study | June 2011
PROFILING WITH AMD APP PROFILER
AMD APP PROFILER
Analyzes and profiles OpenCL and DirectCompute application for AMD APUs and GPUs
Integrates into Microsoft Visual Studio® 2008 and 2010
Is available as a command line utility program for Windows and Linux platforms
Does not require a custom driver
Does not require source code or project modifications of the target application
14 | Advanced OpenCL™ Debugging and Profiling – a Case Study | June 2011
PROFILING WITH AMD APP PROFILER
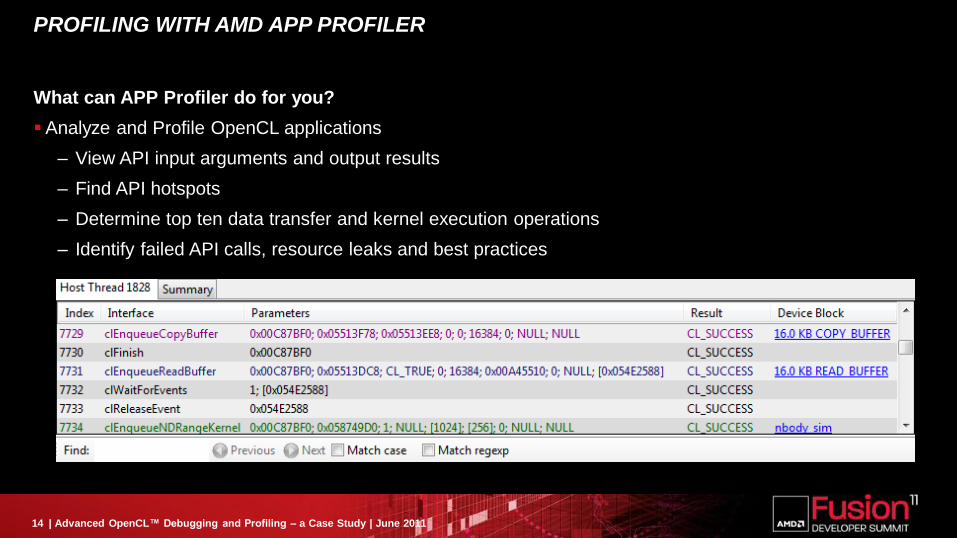
What can APP Profiler do for you?
Analyze and Profile OpenCL applications
– View API input arguments and output results
– Find API hotspots
– Determine top ten data transfer and kernel execution operations
– Identify failed API calls, resource leaks and best practices
15 | Advanced OpenCL™ Debugging and Profiling – a Case Study | June 2011
PROFILING WITH AMD APP PROFILER
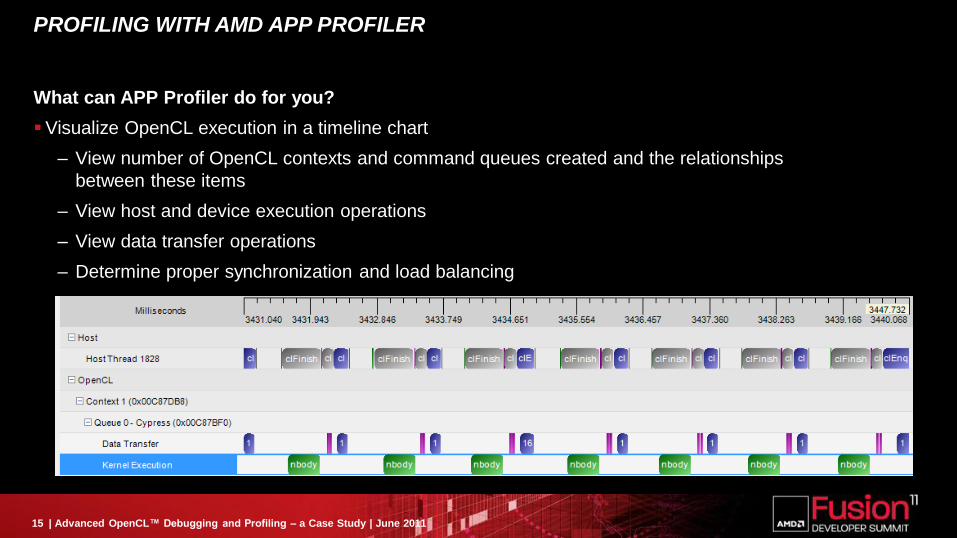
What can APP Profiler do for you?
Visualize OpenCL execution in a timeline chart
– View number of OpenCL contexts and command queues created and the relationships
between these items
– View host and device execution operations
– View data transfer operations
– Determine proper synchronization and load balancing
16 | Advanced OpenCL™ Debugging and Profiling – a Case Study | June 2011
PROFILING WITH AMD APP PROFILER
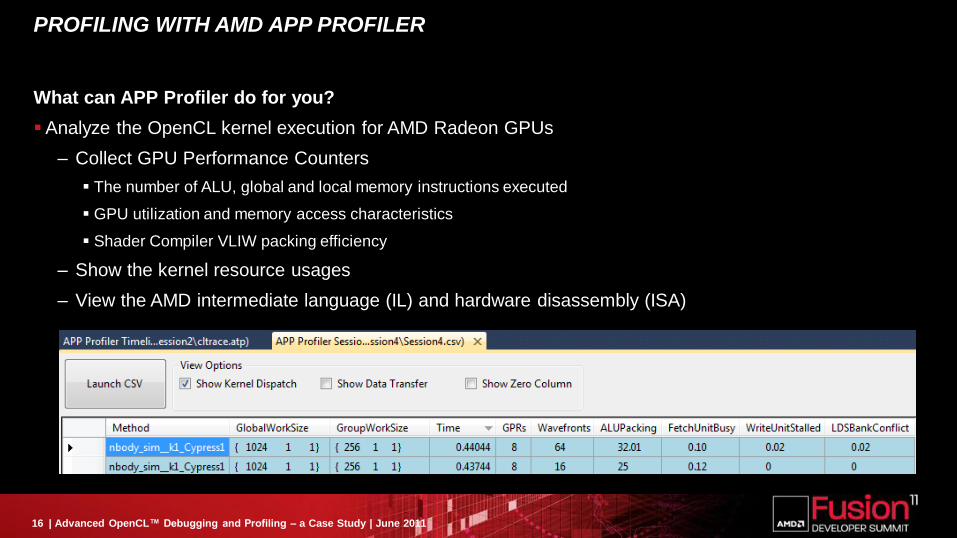
What can APP Profiler do for you?
Analyze the OpenCL kernel execution for AMD Radeon GPUs
– Collect GPU Performance Counters
The number of ALU, global and local memory instructions executed
GPU utilization and memory access characteristics
Shader Compiler VLIW packing efficiency
– Show the kernel resource usages
– View the AMD intermediate language (IL) and hardware disassembly (ISA)
17 | Advanced OpenCL™ Debugging and Profiling – a Case Study | June 2011
DEMO
Uniform Random Noise Generator Sample
A sample application provided with AMD APP SDK
samples
Each thread generates a uniform random deviation and
applies to a pixel
OpenCL kernel computes the deviation using a linear
congruential generator proposed by Park and Miller
The average of four neighboring pixels is used as the
seed for each pixel
18 | Advanced OpenCL™ Debugging and Profiling – a Case Study | June 2011
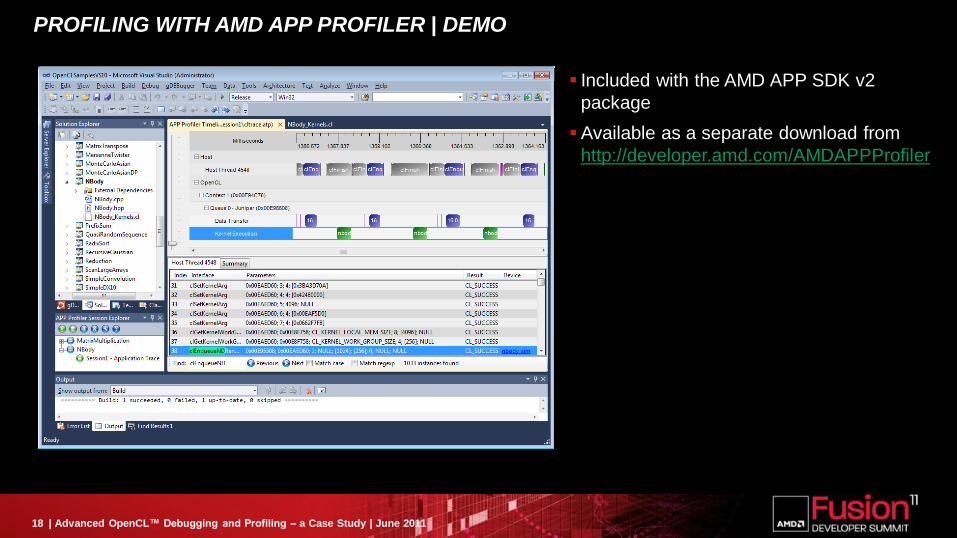
PROFILING WITH AMD APP PROFILER | DEMO
Included with the AMD APP SDK v2
package
Available as a separate download from
http://developer.amd.com/AMDAPPProfiler
19 | Advanced OpenCL™ Debugging and Profiling – a Case Study | June 2011
SUMMARY
gDEBugger for Microsoft Visual Studio
API level debugging: view OpenCL buffers
OpenCL kernel debugging on the GPU
– Single step, set breakpoint and run to breakpoint
– Inspect variables
Call Stack and multi-watch view
AMD APP Profiler
Trace OpenCL API calls and visualize OpenCL execution
Determine kernel execution vs data transfer bottleneck
Determine synchronization issues
Identify failed API calls, resource leaks and best practices
Collect and analyze GPU performance counters of an OpenCL kernel
20 | Advanced OpenCL™ Debugging and Profiling – a Case Study | June 2011
OTHER AMD DEVELOPER TOOLS
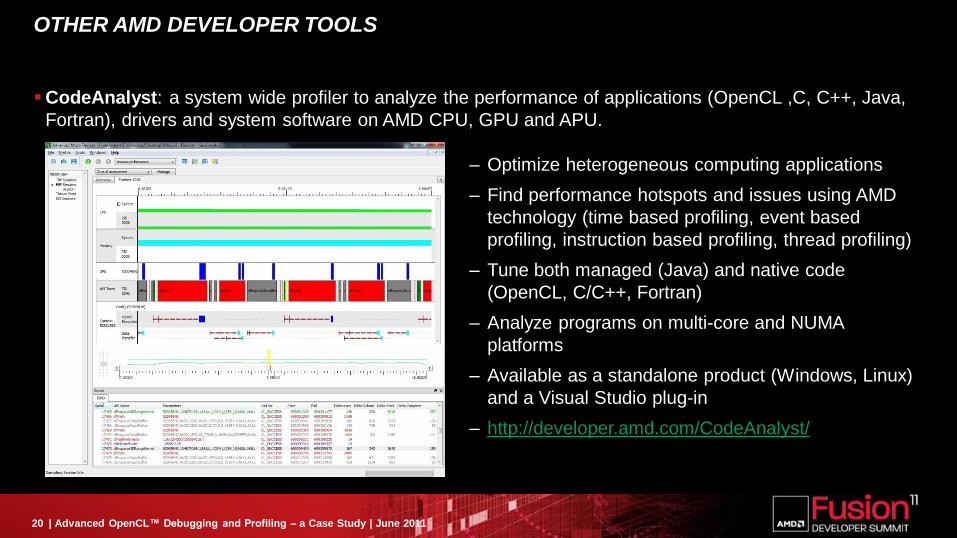
CodeAnalyst: a system wide profiler to analyze the performance of applications (OpenCL ,C, C++, Java,
Fortran), drivers and system software on AMD CPU, GPU and APU.
– Optimize heterogeneous computing applications
– Find performance hotspots and issues using AMD
technology (time based profiling, event based
profiling, instruction based profiling, thread profiling)
– Tune both managed (Java) and native code
(OpenCL, C/C++, Fortran)
– Analyze programs on multi-core and NUMA
platforms
– Available as a standalone product (Windows, Linux)
and a Visual Studio plug-in
– http://developer.amd.com/CodeAnalyst/
22 | Advanced OpenCL™ Debugging and Profiling – a Case Study | June 2011
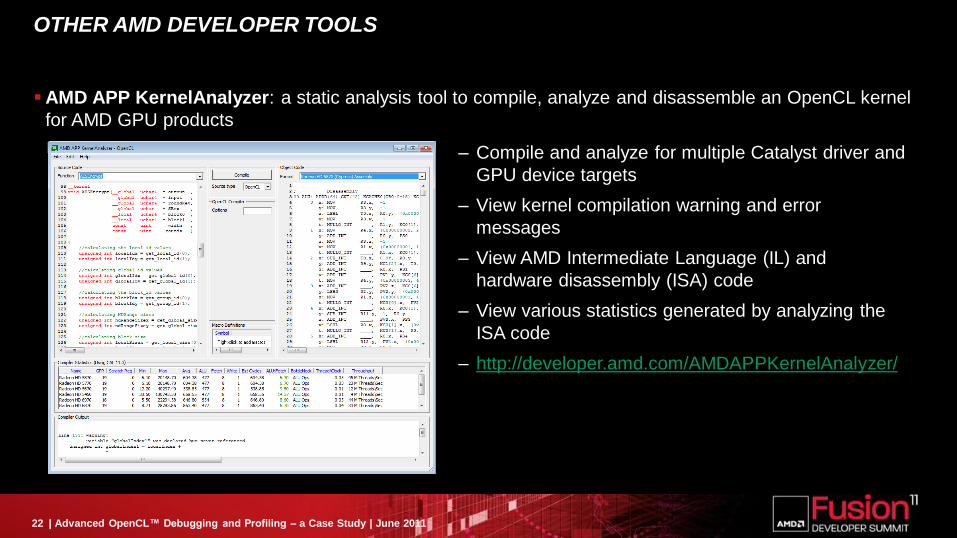
OTHER AMD DEVELOPER TOOLS
AMD APP KernelAnalyzer: a static analysis tool to compile, analyze and disassemble an OpenCL kernel
for AMD GPU products
– Compile and analyze for multiple Catalyst driver and
GPU device targets
– View kernel compilation warning and error
messages
– View AMD Intermediate Language (IL) and
hardware disassembly (ISA) code
– View various statistics generated by analyzing the
ISA code
– http://developer.amd.com/AMDAPPKernelAnalyzer/

QUESTIONS
24 | Making OpenCL™ Simple with Haskell | June 2011
Disclaimer & Attribution The information presented in this document is for informational purposes only and may contain technical inaccuracies, omissions
and typographical errors.
The information contained herein is subject to change and may be rendered inaccurate for many reasons, including but not limited
to product and roadmap changes, component and motherboard version changes, new model and/or product releases, product
differences between differing manufacturers, software changes, BIOS flashes, firmware upgrades, or the like. There is no
obligation to update or otherwise correct or revise this information. However, we reserve the right to revise this information and to
make changes from time to time to the content hereof without obligation to notify any person of such revisions or changes.
NO REPRESENTATIONS OR WARRANTIES ARE MADE WITH RESPECT TO THE CONTENTS HEREOF AND NO
RESPONSIBILITY IS ASSUMED FOR ANY INACCURACIES, ERRORS OR OMISSIONS THAT MAY APPEAR IN THIS
INFORMATION.
ALL IMPLIED WARRANTIES OF MERCHANTABILITY OR FITNESS FOR ANY PARTICULAR PURPOSE ARE EXPRESSLY
DISCLAIMED. IN NO EVENT WILL ANY LIABILITY TO ANY PERSON BE INCURRED FOR ANY DIRECT, INDIRECT, SPECIAL
OR OTHER CONSEQUENTIAL DAMAGES ARISING FROM THE USE OF ANY INFORMATION CONTAINED HEREIN, EVEN IF
EXPRESSLY ADVISED OF THE POSSIBILITY OF SUCH DAMAGES.
AMD, the AMD arrow logo, and combinations thereof are trademarks of Advanced Micro Devices, Inc. All other names used in
this presentation are for informational purposes only and may be trademarks of their respective owners.
OpenCL and OpenCL logo are trademarks of Apple Inc. used by permission by Khronos.
Microsoft and Visual Studio are registered trademarks of Microsoft Corporation in the United States and/or other jurisdictions.
© 2011 Advanced Micro Devices, Inc. All rights reserved.