Advanced myocardial tissue characterisation by a … Advanced myocardial tissue characterisation by...
11
CARDIAC Advanced myocardial tissue characterisation by a multi-component CMR protocol in patients with rheumatoid arthritis Simon Greulich 1 & Agnes Mayr 2 & Daniel Kitterer 3 & Joerg Latus 3 & Joerg Henes 4 & Francesco Vecchio 1,5 & Philipp Kaesemann 1 & Alexandru Patrascu 1 & Andreas Greiser 6 & Stefan Groeninger 6 & Francesco Romeo 5 & Niko Braun 3 & M. Dominik Alscher 3 & Udo Sechtem 1 & Heiko Mahrholdt Received: 4 November 2016 /Revised: 21 March 2017 /Accepted: 3 April 2017 /Published online: 12 May 2017 # The Author(s) 2017. This article is an open access publication Abstract Objectives Rheumatoid arthritis (RA) patients are at increased risk of suffering from adverse cardiovascular events. Cardiovascular magnetic resonance (CMR) mapping tech- niques might be appropriate tools to complement late gadolin- ium enhancement (LGE) for the assessment of myocardial involvement. This study aimed to perform advanced myocar- dial tissue characterisation in RA patients by a multicompo- nent CMR protocol. Methods 22 RA patients were prospectively enrolled and underwent CMR, including LGE and T1/T2 mapping se- quences; 20 volunteers served as controls. * Agnes Mayr [email protected] Simon Greulich [email protected] Daniel Kitterer [email protected] Joerg Latus [email protected] Joerg Henes [email protected] Francesco Vecchio [email protected] Philipp Kaesemann [email protected] Alexandru Patrascu [email protected] Andreas Greiser [email protected] Stefan Groeninger [email protected] Francesco Romeo [email protected] Niko Braun [email protected] M. Dominik Alscher [email protected] Udo Sechtem [email protected] Heiko Mahrholdt [email protected] 1 Division of Cardiology, Robert-Bosch-Medical Center Stuttgart, Stuttgart, Germany 2 Division of Radiology, University Hospital Innsbruck, Anichstrasse 35, 6020 Innsbruck, Austria 3 Division of Nephrology, Department of Internal Medicine, Robert-Bosch-Medical Center Stuttgart, Stuttgart, Germany 4 Centre for Interdisciplinary Clinical Immunology, Rheumatology and Auto-inflammatory Diseases and Department of Internal Medicine II (Oncology, Haematology, Immunology, Rheumatology, Pulmology), University Hospital Tuebingen, Tuebingen, Germany 5 Division of Cardiology, Universita degli Studi di Roma BTor Vergata^, Rome, Italy 6 Siemens Healthcare GmbH, Erlangen, Germany Eur Radiol (2017) 27:4639–4649 DOI 10.1007/s00330-017-4838-4
Transcript of Advanced myocardial tissue characterisation by a … Advanced myocardial tissue characterisation by...

CARDIAC
Advanced myocardial tissue characterisationby a multi-component CMR protocol in patientswith rheumatoid arthritis
Simon Greulich1& Agnes Mayr2 & Daniel Kitterer3 & Joerg Latus3 & Joerg Henes4 &
Francesco Vecchio1,5 & Philipp Kaesemann1& Alexandru Patrascu1
& Andreas Greiser6 &
Stefan Groeninger6 & Francesco Romeo5 & Niko Braun3& M. Dominik Alscher3 &
Udo Sechtem1& Heiko Mahrholdt
Received: 4 November 2016 /Revised: 21 March 2017 /Accepted: 3 April 2017 /Published online: 12 May 2017# The Author(s) 2017. This article is an open access publication
AbstractObjectives Rheumatoid arthritis (RA) patients are at increasedrisk of suffering from adverse cardiovascular events.Cardiovascular magnetic resonance (CMR) mapping tech-niques might be appropriate tools to complement late gadolin-ium enhancement (LGE) for the assessment of myocardial
involvement. This study aimed to perform advanced myocar-dial tissue characterisation in RA patients by a multicompo-nent CMR protocol.Methods 22 RA patients were prospectively enrolled andunderwent CMR, including LGE and T1/T2 mapping se-quences; 20 volunteers served as controls.
* Agnes [email protected]
Simon [email protected]
Daniel [email protected]
Joerg [email protected]
Joerg [email protected]
Francesco [email protected]
Philipp [email protected]
Alexandru [email protected]
Andreas [email protected]
Stefan [email protected]
Francesco [email protected]
Niko [email protected]
M. Dominik [email protected]
Heiko [email protected]
1 Division of Cardiology, Robert-Bosch-Medical Center Stuttgart,Stuttgart, Germany
2 Division of Radiology, University Hospital Innsbruck, Anichstrasse35, 6020 Innsbruck, Austria
3 Division of Nephrology, Department of Internal Medicine,Robert-Bosch-Medical Center Stuttgart, Stuttgart, Germany
4 Centre for Interdisciplinary Clinical Immunology,Rheumatology and Auto-inflammatory Diseases andDepartment of Internal Medicine II (Oncology, Haematology,Immunology, Rheumatology, Pulmology), University HospitalTuebingen, Tuebingen, Germany
5 Division of Cardiology, Universita degli Studi di Roma BTorVergata^, Rome, Italy
6 Siemens Healthcare GmbH, Erlangen, Germany
Eur Radiol (2017) 27:4639–4649DOI 10.1007/s00330-017-4838-4
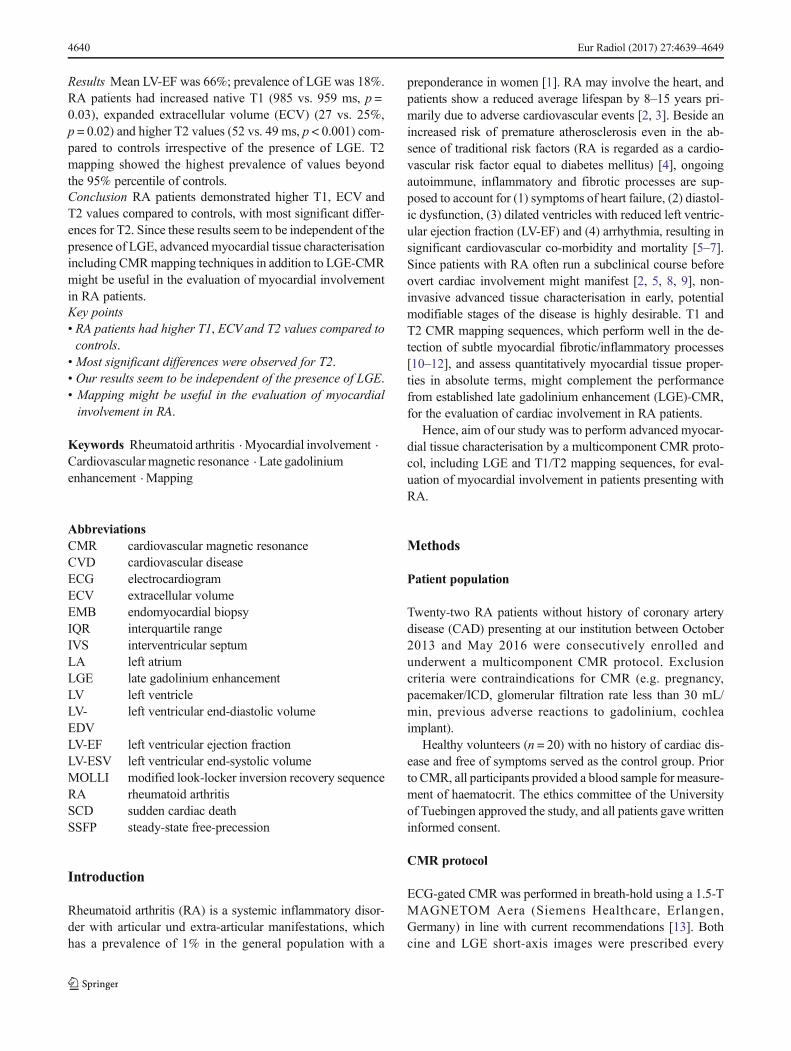
Results Mean LV-EF was 66%; prevalence of LGE was 18%.RA patients had increased native T1 (985 vs. 959 ms, p =0.03), expanded extracellular volume (ECV) (27 vs. 25%,p = 0.02) and higher T2 values (52 vs. 49 ms, p < 0.001) com-pared to controls irrespective of the presence of LGE. T2mapping showed the highest prevalence of values beyondthe 95% percentile of controls.Conclusion RA patients demonstrated higher T1, ECV andT2 values compared to controls, with most significant differ-ences for T2. Since these results seem to be independent of thepresence of LGE, advanced myocardial tissue characterisationincluding CMRmapping techniques in addition to LGE-CMRmight be useful in the evaluation of myocardial involvementin RA patients.Key points• RA patients had higher T1, ECVand T2 values compared tocontrols.
• Most significant differences were observed for T2.• Our results seem to be independent of the presence of LGE.• Mapping might be useful in the evaluation of myocardialinvolvement in RA.
Keywords Rheumatoid arthritis . Myocardial involvement .
Cardiovascularmagnetic resonance . Late gadoliniumenhancement . Mapping
AbbreviationsCMR cardiovascular magnetic resonanceCVD cardiovascular diseaseECG electrocardiogramECV extracellular volumeEMB endomyocardial biopsyIQR interquartile rangeIVS interventricular septumLA left atriumLGE late gadolinium enhancementLV left ventricleLV-EDV
left ventricular end-diastolic volume
LV-EF left ventricular ejection fractionLV-ESV left ventricular end-systolic volumeMOLLI modified look-locker inversion recovery sequenceRA rheumatoid arthritisSCD sudden cardiac deathSSFP steady-state free-precession
Introduction
Rheumatoid arthritis (RA) is a systemic inflammatory disor-der with articular und extra-articular manifestations, whichhas a prevalence of 1% in the general population with a
preponderance in women [1]. RA may involve the heart, andpatients show a reduced average lifespan by 8–15 years pri-marily due to adverse cardiovascular events [2, 3]. Beside anincreased risk of premature atherosclerosis even in the ab-sence of traditional risk factors (RA is regarded as a cardio-vascular risk factor equal to diabetes mellitus) [4], ongoingautoimmune, inflammatory and fibrotic processes are sup-posed to account for (1) symptoms of heart failure, (2) diastol-ic dysfunction, (3) dilated ventricles with reduced left ventric-ular ejection fraction (LV-EF) and (4) arrhythmia, resulting insignificant cardiovascular co-morbidity and mortality [5–7].Since patients with RA often run a subclinical course beforeovert cardiac involvement might manifest [2, 5, 8, 9], non-invasive advanced tissue characterisation in early, potentialmodifiable stages of the disease is highly desirable. T1 andT2 CMR mapping sequences, which perform well in the de-tection of subtle myocardial fibrotic/inflammatory processes[10–12], and assess quantitatively myocardial tissue proper-ties in absolute terms, might complement the performancefrom established late gadolinium enhancement (LGE)-CMR,for the evaluation of cardiac involvement in RA patients.
Hence, aim of our study was to perform advanced myocar-dial tissue characterisation by a multicomponent CMR proto-col, including LGE and T1/T2 mapping sequences, for eval-uation of myocardial involvement in patients presenting withRA.
Methods
Patient population
Twenty-two RA patients without history of coronary arterydisease (CAD) presenting at our institution between October2013 and May 2016 were consecutively enrolled andunderwent a multicomponent CMR protocol. Exclusioncriteria were contraindications for CMR (e.g. pregnancy,pacemaker/ICD, glomerular filtration rate less than 30 mL/min, previous adverse reactions to gadolinium, cochleaimplant).
Healthy volunteers (n = 20) with no history of cardiac dis-ease and free of symptoms served as the control group. Priorto CMR, all participants provided a blood sample for measure-ment of haematocrit. The ethics committee of the Universityof Tuebingen approved the study, and all patients gave writteninformed consent.
CMR protocol
ECG-gated CMR was performed in breath-hold using a 1.5-TMAGNETOM Aera (Siemens Healthcare, Erlangen,Germany) in line with current recommendations [13]. Bothcine and LGE short-axis images were prescribed every
4640 Eur Radiol (2017) 27:4639–4649

10 mm (slice thickness 6 mm) from base to apex. In-planeresolution was typically 1.2 × 1.8 mm. Cine was performedusing a steady-state free-precession (SSFP) sequence. LGEimages were acquired on average 5–10 min after contrastusing a segmented inversion recovery gradient echo (IR-GRE) sequence constantly adjusting inversion time to nullnormal myocardium [14]. The contrast dose (gadopentetatedimeglumine) was 0.15 mmol/kg.
A modified look-locker inversion recovery prototype se-quence (MOLLI) was used for T1 mapping and performedin a single midventricular short-axis (SAX) slice at mid-dias-tole, prior to and 20 min after administration of contrast, inline with current recommendations [15].
Short-axis T2 mapping was performed in a matchingmidventricular SAX before administration of contrastagent using an ECG-triggered T2-prepared single-shotbalanced SSFP prototype sequence with multiple T2preparation times [16].
Detailed information on T1 and T2 mapping sequences isprovided in the Appendix.
CMR analysis
Cine and LGE images were evaluated by experiencedobservers (S.G., H.M.) as described elsewhere [17]. Inbrief, endocardial and epicardial borders were outlinedon the short-axis cine images. Volumes, mass and ejec-tion fraction were derived by summation of epicardialand endocardial contours. The distribution of LGE wascharacterised as epicardial, intramural, transmural orsubendocardial [17].
Colour-coded T1, ECV and T2 maps were generatedon the basis of inline-generated, motion-corrected rawimages using QMap software 1.0 (Medis, Leiden, theNetherlands) in a single matching midventricular SAX.Motion-corrected T1 maps were examined for quality inthree modalities: (1) raw T1 images, (2) T1 maps, (3) R2
maps. Endo- and epicardial contours were manuallydrawn by two experienced observers (S.G., A.M.), andthen divided into six segments using the anterior rightventricular insertion point as reference. Care was takento avoid partial volume effects at the endocardial andepicardial borders for T1, ECV and T2 maps. GlobalT1, ECV and T2 values were calculated: T1 values weredetermined by fitting an exponential model to the mea-sured data [18]. Prior to CMR, the haematocrit was de-termined in all subjects, allowing with native and postcontrast T1 measurements of the myocardium and bloodpool the calculation of extracellular volume (ECV), usinga previously described equation [19]. T2 results wereobtained by fitting a two-parameter intensity-weightedexponential model (no offset term) [20].
Variables and definitions
All variables were collected directly from patients and/or med-ical records except CMR parameters, which were evaluated asdescribed above.
Patients with RA had to fulfil the diagnostic criteria of theAmerican College of Rheumatology [21].
Evaluation of disease activity in RA patients used theDisease Activity Score 28 (DAS-28) [22].
Statistical analysis
Absolute numbers and percentages were computed to describethe patient population. All continuous variables were testedfor normality using the Kolmogorov–Smirnov test. Normallydistributed continuous variables were expressed as means(with standard deviation) and skewed variables were present-ed as medians (with quartiles). Comparisons between groupswere made using the Mann–Whitney U test or the Fisher’sexact test, as appropriate. P values (two-tailed) of less than0.05 were considered significant. Bivariate correlations wereassessed by using the Pearson’s or the Spearman’s coefficient,as appropriate. Intra- and interobserver variability wasassessed via intraclass correlation coefficients (ICC). All sta-tistical analyses were performed using SPSS, version 22.0(IBM Corp., Armonk, NY, USA).
Results
Baseline characteristics
Overall, 42 subjects were studied: 22 RA patients and 20healthy controls who did not differ significantly regardingage and gender (p = 0.09 and p = 0.66, respectively). RA pa-tients were 63 ± 12 years of age, with a female preponderance(64%).
Nonspecific dyspnoea and angina were the most frequentlyreported symptoms in the RA patient population (41% and27%, respectively). ECG abnormalities occurred in 32% ofthe RA patients (n = 7): n = 3 atrial fibrillation, n = 2 ventric-ular extrasystoles, n = 1 supraventricular extrasystoles, n = 1 Twave abnormality. Mean DAS-28 was 3.4, reflecting activedisease in the majority of patients. Consequently, most pa-tients were under immunosuppressive medication during timeof CMR (73% on steroids, 27% on methotrexate). More de-tails can be viewed in Table 1.
Functional and LGE CMR results
CMR findings are displayed in Table 2. We observed no sig-nificant difference in left ventricular (LV) size or ejection frac-tion (EF) between RA patients and controls. Of note, LV-EF
Eur Radiol (2017) 27:4639–4649 4641

was preserved (67 ± 6 in RA patients vs. 66 ± 10 in controls,p = 0.76). Left atrial (LA) size was larger in RA patients thanin controls (p = 0.05). LGE occurred rarely: four of the RApatients (18%) and none of the controls showed LGE.Ischaemic-type LGE pattern could be detected in none of theRA patients; all LGE patterns were classified as non-ischaemic-type origin (epicardial or intramural) [17].
T1 and ECV results
RA patients showed significantly higher native T1 values 985(946–1009) ms than controls 959 (923–978) ms (p < 0.03); alsosee Table 2 and Fig. 1. In contrast, post contrast T1 values didnot differ significantly to those in controls: 508 (485–536) msvs. 524 (509–550) ms (p = 0.14). Expanded ECVwas observedin RA patients: 27 (25–31)% vs. 25 (23–26)% in the controlgroup (p < 0.02). Dividing our RA patients into two groupsaccording to the presence of LGE (LGE positive vs. LGE neg-ative) revealed that native T1 values, post contrast T1 valuesand ECV values were not significantly different between bothgroups (p = 0.28, p = 0.13, p = 0.18, respectively).
We demonstrated excellent intra- and interobserver agree-ment in T1 and ECV values (ICC for intraobserver agreementwas 0.98 each for native T1, post contrast T1 and ECV. ICCfor interobserver agreement was 0.98 for native T1, 0.97 forpost contrast T1 and 0.98 for ECV).
In our RA patients with ECG abnormalities (n = 7), nativeand post contrast T1 values as well as ECV did not differ to thevalues in RA patients with unremarkable ECG (p = 0.44, p =0.48, p = 0.85, respectively).
Table 1 Baseline patient characteristics
Age (years) 63 ± 12
Gender (male) 8 (36%)
Cardiovascular risk factors
Diabetes 2 (9%)
Hypertension 13 (59%)
Smokinga 12 (55%)
Hyperlipidaemia 8 (36%)
Family history of CVD 7 (32%)
Obesity (BMI ≥ 30 kg/m2) 7 (32%)
Symptoms (multiple possible)
Angina 6 (27%)
Dyspnoea 9 (41%)
Palpitations 2 (9%)
Syncope –
ECG abnormality 7 (32%)
Years since diagnosis
3 (2–10)
< 1 3 (14%)
1–4 10 (45%)
5–9 3 (14%)
> 10 6 (27%)
Disease activity
DAS-28 3.4 (1.8–6.2)
Haematocrit 0.38 (0.34–0.42)
Medication
Beta-blockers 7 (32%)
ARB 12 (54%)
ASA 2 (9%)
CCB 8 (36%)
Statins 5 (23%)
Diuretics 4 (18%)
Steroids 16 (73%)
NSAID 4 (18%)
Antibodies 2 (9%)
Cyclophosphamide 2 (9%)
Azathioprine 1 (4%)
Methotrexate 6 (27%)
All values are n or mean SD or median interquartile ranges
CVD cardiovascular disease, BMI body mass index, ECG electrocardio-gram, ARB angiotensin receptor blockers, ASA acetylsalicylic acid, CCBcalcium channel blockers, NSAID nonsteroidal anti-inflammatory druga Current or ever smokers
Table 2 CMR findings
Controls (n = 20) Patients (n = 22) p
LV-EF (%) 67 ± 6 66 ± 10 0.76
LV-EDV (ml) 103 ± 29 112 ± 37 0.65
LV-ESV (ml) 35 ± 14 41 ± 32 0.91
LV-SV 69 ± 16 71 ± 13 0.43
LV-EDD 44 ± 6 46 ± 6 0.48
LA (cm2) 20 ± 3 22 ± 4 0.05
IVS (mm) 10 ± 2 11 ± 2 0.07
PA (mm) 24 ± 4 24 ± 3 0.77
LGE per patient - 4 (18%)
Extent (g)/% LV mass – 2.3 (2%)
Epicardial – 1 (4%)
Intramural – 3 (14%)
Transmural – –
Subendocardial – –
Native T1 (ms) 959 (923–978) 985 (946–1009) 0.03
Post contrast T1 (ms) 524 (509–550) 508 (485–536) 0.14
ECV (%) 25 (23–26) 27 (25–31) 0.02
T2 (ms) 49 (48–51) 52 (50–54) <0.001
All values are mean ± SD or median interquartile ranges
Bold values indicate significant p-values. P-values (two-tailed) of <0.05were considered significant
CMR cardiac magnetic resonance, LV left-ventricular, EF ejection frac-tion, EDVend-diastolic volume, ESVend-systolic volume, SV stroke vol-ume, EDD end-diastolic diameter, LA left atrium, IVS interventricularseptum, PA pulmonary artery, LGE late gadolinium enhancement, ECVextracellular volume
4642 Eur Radiol (2017) 27:4639–4649
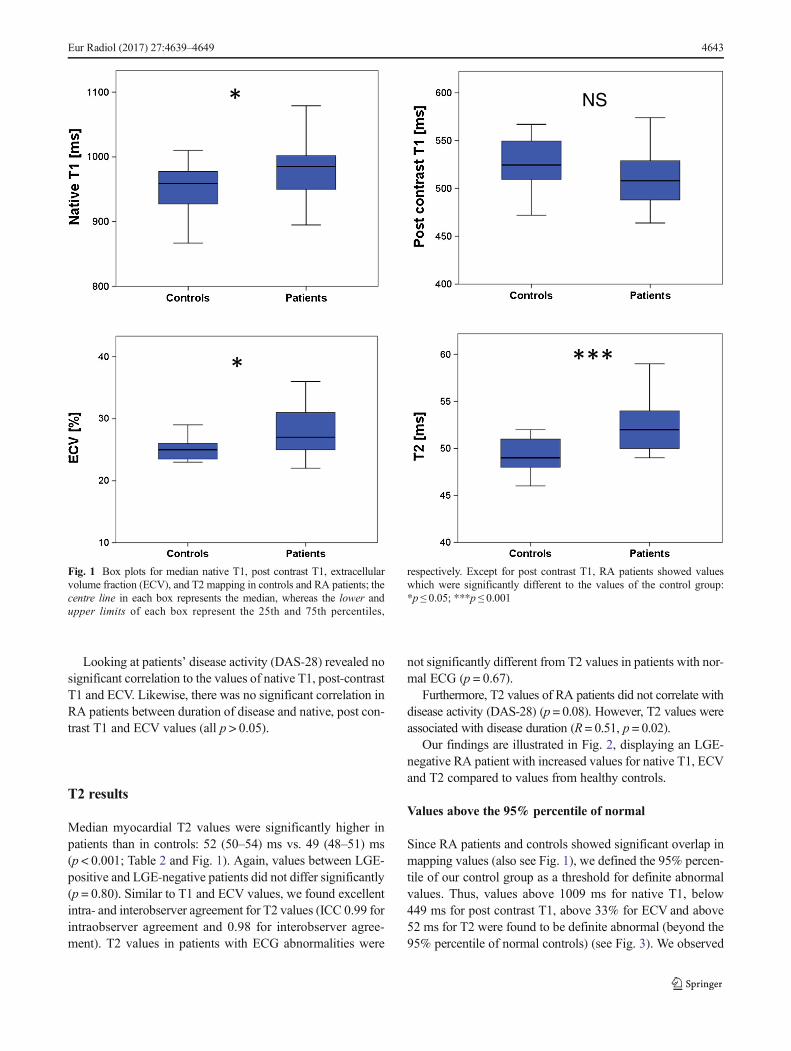
Looking at patients’ disease activity (DAS-28) revealed nosignificant correlation to the values of native T1, post-contrastT1 and ECV. Likewise, there was no significant correlation inRA patients between duration of disease and native, post con-trast T1 and ECV values (all p > 0.05).
T2 results
Median myocardial T2 values were significantly higher inpatients than in controls: 52 (50–54) ms vs. 49 (48–51) ms(p < 0.001; Table 2 and Fig. 1). Again, values between LGE-positive and LGE-negative patients did not differ significantly(p = 0.80). Similar to T1 and ECV values, we found excellentintra- and interobserver agreement for T2 values (ICC 0.99 forintraobserver agreement and 0.98 for interobserver agree-ment). T2 values in patients with ECG abnormalities were
not significantly different from T2 values in patients with nor-mal ECG (p = 0.67).
Furthermore, T2 values of RA patients did not correlate withdisease activity (DAS-28) (p = 0.08). However, T2 values wereassociated with disease duration (R = 0.51, p = 0.02).
Our findings are illustrated in Fig. 2, displaying an LGE-negative RA patient with increased values for native T1, ECVand T2 compared to values from healthy controls.
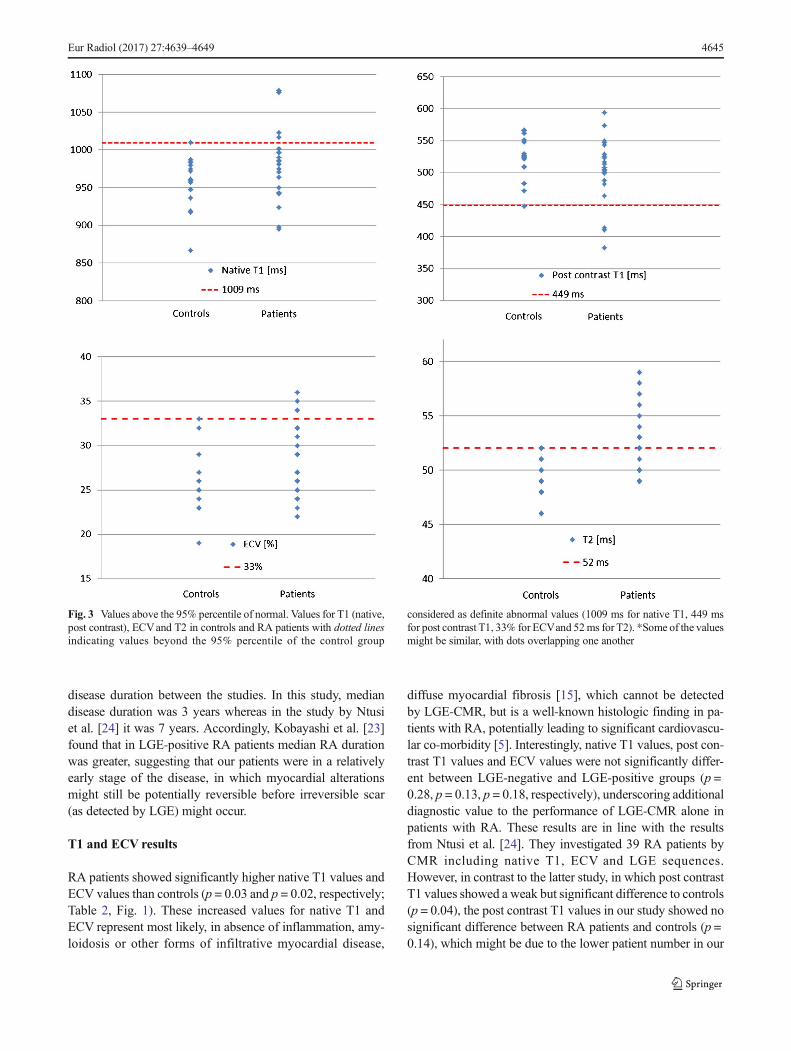
Values above the 95% percentile of normal
Since RA patients and controls showed significant overlap inmapping values (also see Fig. 1), we defined the 95% percen-tile of our control group as a threshold for definite abnormalvalues. Thus, values above 1009 ms for native T1, below449 ms for post contrast T1, above 33% for ECV and above52 ms for T2 were found to be definite abnormal (beyond the95% percentile of normal controls) (see Fig. 3). We observed
NS
Fig. 1 Box plots for median native T1, post contrast T1, extracellularvolume fraction (ECV), and T2 mapping in controls and RA patients; thecentre line in each box represents the median, whereas the lower andupper limits of each box represent the 25th and 75th percentiles,
respectively. Except for post contrast T1, RA patients showed valueswhich were significantly different to the values of the control group:*p ≤ 0.05; ***p ≤ 0.001
Eur Radiol (2017) 27:4639–4649 4643

no significant difference in age between RA patients beyondand within the 95% percentile regarding our mapping results.
In detail, 23% (n = 5/22) of the RA patients demonstrated anative T1 value above the 95% percentile of our matchedcontrol group (Fig. 3). Four patients (18%) showed post con-trast values below the 95% percentile, and 4 (18%) patientshad expanded ECVabove the 95% percentile of controls. Themajority of definite abnormal values were observed for T2values, with 41% (9/22) of the RA patients, underscoring asubstantial grade of inflammation in the RA patient popula-tion. Out of these nine patients with definite abnormal T2values, four patients also showed definite abnormal valuesfor native T1, and two showed definite abnormal values forboth post contrast T1 and ECV, respectively.
Most patients with values beyond the 95% percentile ofcontrols were LGE negative: (a) 80% (4/5 patients) for nativeT1, (b) 50% (2/4 patients) for post contrast T1, (c) 75% (3/4patients) for ECV, (d) 78% (7/9 patients) for T2.
Discussion
This study is unique in performing advanced myocardial tis-sue characterisation by a multicomponent CMR protocol
including LGE-CMR, and T1/T2 mapping in RA patients.First, we found that, despite a low prevalence of LGE, a sig-nificant proportion of RA patients show diffuse myocardialinflammation and fibrosis by mapping techniques on CMR.Second, T2 was the parameter which best separated RA pa-tients and controls, and of all mapping parameters it showedthe highest percentage of values above the 95% percentile ofcontrols.
Baseline characteristics and general CMR results
The majority of RA patients were female and asymptomatic tomildly symptomatic [5] (Table 1). Although dyspnoea wasreported in 41% of the RA patients, it is difficult to separatedyspnoea suggestive of cardiac origin from dyspnoea due tolow physical activity, since RA patients are often severelyaffected by articular and extra-articular manifestations, ham-pering them in their daily lives [5]. Similar to previous studies[23, 24], mean LV-EF was preserved (66%), and LA sizeenlarged compared to controls, suggestive of diastolic dys-function, which is a common finding in RA patients [24](Table 2). Overall, 18% of the RA patients demonstratednon-ischaemic-type LGE, which is lower than in other reports[23, 24]. The difference might be explained by different
Fig. 2 RA patient with no LGE but abnormal mapping values. Cardiacmagnetic resonance (CMR) of a 50-year-old woman suffering from RAwith no history of dyspnoea or angina and normal ECG: Cine images (a)showed a normal LV-EF (66%), LGE images (b) revealed no enhance-ment. Native T1 map (c) showed an increased T1 with 1004 ms (normal
median range 959 (923–978) ms), decreased post-contrast T1 (d) with513 ms (normal median range 524 (509–550) ms) and expanded ECV (e)of 28% (normal median range 25 (23–26)%). T2 (f) was prolonged at54 ms (normal median range 49 (48–51) ms)
4644 Eur Radiol (2017) 27:4639–4649
disease duration between the studies. In this study, mediandisease duration was 3 years whereas in the study by Ntusiet al. [24] it was 7 years. Accordingly, Kobayashi et al. [23]found that in LGE-positive RA patients median RA durationwas greater, suggesting that our patients were in a relativelyearly stage of the disease, in which myocardial alterationsmight still be potentially reversible before irreversible scar(as detected by LGE) might occur.
T1 and ECV results
RA patients showed significantly higher native T1 values andECV values than controls (p = 0.03 and p = 0.02, respectively;Table 2, Fig. 1). These increased values for native T1 andECV represent most likely, in absence of inflammation, amy-loidosis or other forms of infiltrative myocardial disease,
diffuse myocardial fibrosis [15], which cannot be detectedby LGE-CMR, but is a well-known histologic finding in pa-tients with RA, potentially leading to significant cardiovascu-lar co-morbidity [5]. Interestingly, native T1 values, post con-trast T1 values and ECV values were not significantly differ-ent between LGE-negative and LGE-positive groups (p =0.28, p = 0.13, p = 0.18, respectively), underscoring additionaldiagnostic value to the performance of LGE-CMR alone inpatients with RA. These results are in line with the resultsfrom Ntusi et al. [24]. They investigated 39 RA patients byCMR including native T1, ECV and LGE sequences.However, in contrast to the latter study, in which post contrastT1 values showed a weak but significant difference to controls(p = 0.04), the post contrast T1 values in our study showed nosignificant difference between RA patients and controls (p =0.14), which might be due to the lower patient number in our
Fig. 3 Values above the 95% percentile of normal. Values for T1 (native,post contrast), ECVand T2 in controls and RA patients with dotted linesindicating values beyond the 95% percentile of the control group
considered as definite abnormal values (1009 ms for native T1, 449 msfor post contrast T1, 33% for ECVand 52ms for T2). *Some of the valuesmight be similar, with dots overlapping one another
Eur Radiol (2017) 27:4639–4649 4645

study. Anyway, since post contrast T1 values depend on sev-eral factors, including native T1, type and dosage of gadolin-ium contrast applied, and the post contrast acquisition timewithin the contrast pharmacodynamics redistribution process[25], native T1 and ECVare the currently preferred parametersfor myocardial T1 quantification [15].
Almost a third of the RA patients (32%, n = 7) demonstrat-ed ECG abnormalities. Nevertheless, native and post contrastT1 values and ECV did not differ to the values in RA patientswith unremarkable ECG, reflecting the difficulties in the car-diac evaluation of RA patients by a Bstandard^ cardiac assess-ment, and the potential additive value of advanced myocardialtissue characterisation by a multicomponent CMR protocol,which might be repeated arbitrarily not only for diagnosis butalso for monitoring of cardiac involvement in RA.
T2 results
T2 is prolonged in edematous, inflammatory myocardial tis-sue [26]. Compared to other studies, which used T2-weightedimages with all their known limitation for assessment of myo-cardial inflammation [24], this study, as a new finding, per-formed T2 mapping as a quantitative component of amultiparametric CMR protocol. T2 mapping is a recent androbust technique that performs well in inflammatory statessuch as myocarditis, showing good correlation to histologicfindings [11, 27]. Median myocardial T2 values were signif-icantly higher in RA patients than in controls, and T2 seems torepresent the best CMR parameter in our protocol to separateRA patients from controls (p < 0.001), suggesting a significantproportion of myocardial inflammation in our RA patients(Table 2, Fig. 1). Likewise to T1 mapping parameters, T2values (1) did not differ significantly between LGE-positiveand LGE-negative patients (p = 0.80) and (2) were not signif-icantly different in patients with ECG abnormalities from pa-tients with normal ECG (p = 0.67).
Ntusi et al. [24] performed T2-weighted images instead ofrecent T2 mapping in their study with RA patients. Hence,their finding of a non-significant difference in the overall glob-al myocardial T2 signal intensity ratio between RA subjectsand controls might be a limitation of the used sequence ratherthan a reliable description of the patients’ myocardial inflam-matory status. Another potential explanation for these discrep-ant findings might be the fact that our group had shorter timeduration since onset of RA (3 years), with a rather high rate ofsteroids but lower rate of methotrexate medication, and there-fore potentially less controlled inflammation yielding to in-creased T2 values.
T2 values were associated with RA disease duration (R =0.51, p = 0.02), suggesting a higher grade of inflammationwith ongoing disease activity in RA patients. It is importantto keep in mind that these differences of T2 in absolute terms
are only detectable by recent T2 mapping techniques. If fur-ther studies could reveal that mapping values are influencedby the patients’ immunosuppressive medication, which seemsobvious, T2 (and T1) mapping could represent a reliable bio-marker for monitoring of the clinical course in patients withRA.
Our findings are illustrated in Fig. 2, which shows a LGE-negative RA patient with increased values for native T1, ECVand T2.
Values above the 95% percentile of normal
Since RA patients and controls showed overlap in mappingvalues (Fig. 1), we defined the 95% percentile of our controlgroup as a threshold for definite abnormal values (Fig. 3).Similar to the non-significant difference regarding age be-tween control group and RA patient group, we observed nosignificant difference in age between RA patients with map-ping values beyond and within the 95% percentile. Therefore,we think that the highly significant differences in mappingvalues reported in our study are not primarily driven by age.
The majority of definite abnormal values were observed forT2 values (41%, 9/22 of the RA patients), underscoring asubstantial grade of inflammation in the RA patient populationdespite immunosuppressive therapy (Fig. 3). Out of these ninepatients with definite abnormal T2 values, four patients alsoshowed definite abnormal values for native T1, and twoshowed definite abnormal values for both post contrast T1and ECV, illustrating the coincidence of diffuse myocardialinflammation and diffuse myocardial fibrosis. With the major-ity of RA patients classified LGE-negative, these myocardialalterations would have been undetected otherwise, highlight-ing the value of an advanced myocardial tissue characterisa-tion by a multicomponent CMR protocol, including LGE andT1/T2 mapping sequences, in patients with RA.
Clinical implications
This study could show that advanced myocardial tissue char-acterisation by a multicomponent CMR protocol, includingestablished LGE and recent T1 and T2 mapping sequences,might be reasonable in patients with RA. We found increasedvalues for native T1, ECVand T2 in RA patients compared tocontrols, with the most significant difference for T2 mappingvalues, underscoring a substantial part of myocardial inflam-mation and fibrosis in these patients. Since clinical presenta-tion and standard cardiac work-up including ECG and echoare often inconclusive, advanced tissue characterisation by (a)measuring parameters in absolute terms and (b) potential forserial follow-up due to the lack of radiation might be an ap-propriate approach in these patients, who run a high risk ofsuffering from cardiovascular morbidity and mortality.
4646 Eur Radiol (2017) 27:4639–4649

Despite these encouraging results, multicentre randomisedtrials are needed to define further the diagnostic and prognos-tic role of abnormal mapping findings in RA patients, beforethese sequences should be used in clinical routine.
Limitations
Some limitations in this study have to be addressed. Since thisis a single-centre setting, potential centre-specific bias cannotbe excluded. On the other hand, mapping sequences arevendor- and site-specific, so each site should create its ownreference values based upon healthy controls, as suggested bycurrent recommendations [15].
The number of RA patients is small. However, many stud-ies dealing with RA show a comparable number of patients,and as a result of significant differences in comparison tocontrols, the patient number seems appropriate.
Although measurement of myocardial T1 or T2 values inthe entire midventricular slice might tend to miss local abnor-malities, this approach is widely used [28–30], more objectivethan a regional approach and swiftly comparable to follow-upexaminations.
Endomyocardial biopsy (EMB) was not performed.However, EMB suffers from several limitations, e.g. invasive-ness, sampling error, thereby lowering its diagnostic benefit.Furthermore, in RA subjects with nonspecific symptoms andnormal LV-EF, this approach would not correspond to currentguidelines [17].
Comparing mapping results to cardiac biomarkers wouldhave been of interest; however, this was not intention of ourstudy, and should be investigated by further studies.
Finally, we have no follow-up data in these patients and wethus do not know about the additive predictive value of themapping sequences employed in the study.
Conclusions
Our study revealed increased values for native T1, ECV andT2 in RA patients compared to controls, with the most signif-icant difference for T2 mapping values. Furthermore, theseresults were independent of the presence of LGE and suggesta substantial component of diffuse myocardial inflammationand fibrosis in RA patients. Since clinical presentation andstandard cardiac work-up are often inconclusive and face highcardiovascular morbidity and mortality in RA patients, ad-vanced tissue characterisation with a combination of LGEand recent mapping techniques might be an adequate ap-proach for both detection and monitoring of myocardialinvolvement.
Nevertheless, multicentre randomised trials are needed toevaluate further the diagnostic and prognostic value of T1 and
T2 mapping in RA patients, before these sequences can enterthe clinical setting.
Acknowledgements Open access funding provided by University ofInnsbruck and Medical University of Innsbruck.
Compliance with ethical standards
Guarantor The scientific guarantor of this publication is Prof. HeikoMahrholdt, MD.
Conflict of interest A.G. and S.G. are employees of SiemensHealthcare GmbH. No non-financial conflicts of interest exist for any ofthe authors.
Funding This study was funded in part by the Robert BoschFoundation: KKF 13-2, KKF 15-5.
Statistics and biometry No complex statistical methods were neces-sary for this paper.
Ethical approval Institutional review board approval was obtained.
Informed consent Written informed consent was obtained from allsubjects (patients) in this study.
Methodology• prospective• diagnostic or prognostic study• performed at one institution
Appendix
CMR protocol
T1 Mapping
T1 mapping was performed in short axis orientation using amodified Look-Locker inversion recovery (MOLLI) sequencebefore and 20 minutes after contrast media administration.
Three inversion episodes were employed, where in the firstepisode 3 images were acquired, followed by 3 recoveryheartbeats, then 3 images in the second episode and anotherimage in the 3rd episode (3(3)3(0)1 MOLLI acquisitionscheme), resulting in 7 images in total and a scan duration of10 heartbeats.
Inversion times (TI) were 120, 200, 280 ms respectively inthe initial images after inversion,
Typical imaging parameters were TE/TR 1.0/2.4 ms, acqui-sition time per heartbeat 168 ms, flip angle 35°, bandwidth1371 Hz/pixel, matrix 192 × 136 pixels, measured in-planespatial resolution 1.9 × 2.0 mm² and slice thickness 8 mm,PAT acceleration R = 2.
Eur Radiol (2017) 27:4639–4649 4647
T2 Mapping
T2 mapping was performed in short axis orientation beforeadministration of contrast media using a T2-prepared single-shot bSSFP prototype sequence. T2-weighted images wereobtained using ECG gating to diastole in a single breath-hold with 0, 25, and 55 ms T2 preparation times. Motioncorrection based on elastic registration was performedallowing generation of T2 pixel maps. After each single imageacquisition, 4 heartbeats were used for signal recovery.
Typical imaging parameters were TE/TR 1.1/2.5 ms, acqui-sition time per heartbeat 150 ms, flip angle 70°, bandwidth1445 Hz/pixel, matrix 192 × 116 pixels, measured in-planespatial resolution 1.9 × 2.3 mm² and slice thickness 8 mm,PAT acceleration R = 2.
Open Access This article is distributed under the terms of the CreativeCommons At t r ibut ion 4 .0 In te rna t ional License (h t tp : / /creativecommons.org/licenses/by/4.0/), which permits unrestricted use,distribution, and reproduction in any medium, provided you give appro-priate credit to the original author(s) and the source, provide a link to theCreative Commons license, and indicate if changes were made.
References
1. Lawrence RC, Helmick CG, Arnett FC et al (1998) Estimates of theprevalence of arthritis and selected musculoskeletal disorders in theUnited States. Arthritis Rheum 41:778–799
2. Maradit-Kremers H, Crowson CS, Nicola PJ et al (2005) Increasedunrecognized coronary heart disease and sudden deaths in rheuma-toid arthritis: a population-based cohort study. Arthritis Rheum 52:402–411
3. Wolfe F, Freundlich B, StrausWL (2003) Increase in cardiovascularand cerebrovascular disease prevalence in rheumatoid arthritis. JRheumatol 30:36–40
4. Roman MJ, Salmon JE (2007) Cardiovascular manifestations ofrheumatologic diseases. Circulation 116:2346–2355
5. Gerster M, Peker E, Nagel E, Puntmann VO (2016) Decipheringcardiac involvement in systemic inflammatory diseases: noninva-sive tissue characterisation using cardiac magnetic resonance is keyto improved patients' care. Expert Rev Cardiovasc Ther 6:1–13
6. Nicola PJ, Crowson CS, Maradit-Kremers H et al (2006)Contribution of congestive heart failure and ischemic heart diseaseto excess mortality in rheumatoid arthritis. Arthritis Rheum 54:60–67
7. Giles JT, Fernandes V, Lima JA, Bathon JM (2005) Myocardialdysfunction in rheumatoid arthritis: epidemiology and pathogene-sis. Arthritis Res Ther 7:195–207
8. PrasadM, Hermann J, Gabriel SE et al (2015) Cardiorheumatology:cardiac involvement in systemic rheumatic disease. Nat RevCardiol 12:168–176
9. Davis JM 3rd, Roger VL, Crowson CS, Kremers HM, TherneauTM, Gabriel SE (2008) The presentation and outcome of heartfailure in patients with rheumatoid arthritis differs from that in thegeneral population. Arthritis Rheum 58:2603–2611
10. Radunski UK, Lund GK, Stehning C et al (2014) CMR in patientswith severe myocarditis: diagnostic value of quantitative tissue
markers including extracellular volume imaging. JACCCardiovasc Imaging 7:667–675
11. Lurz P, Luecke C, Eitel I et al (2016) Comprehensive cardiac mag-netic resonance imaging in patients with suspected myocarditis: theMyoRacer-Trial. J Am Coll Cardiol 67:1800–1811
12. Puntmann VO, Carr-White G, Jabbour A et al (2016) InternationalT1 multicentre CMR outcome study. T1-mapping and outcome innonischemic cardiomyopathy: all-cause mortality and heart failure.JACC Cardiovasc Imaging 9:40–50
13. Kramer CM, Barkhausen J, Flamm SD, Kim RJ, Nagel E (2013)Society for Cardiovascular Magnetic Resonance Board of TrusteesTask Force on Standardized Protocols. Standardized cardiovascularmagnetic resonance (CMR) protocols 2013 update. J CardiovascMagn Reson 15:91
14. Schultz A, Caspar T, Schaeffer M et al (2016) Late gadoliniumenhancement cardiac imaging on a 3T scanner with parallel RFtransmission technique: prospective comparison of 3D-PSIR and3D-IR. Eur Radiol 26:1547–1555
15. Moon JC, Messroghli DR, Kellman P et al (2013) Society forCardiovascular Magnetic Resonance Imaging; CardiovascularMagnetic Resonance Working Group of the European Society ofCardiology. Myocardial T1 mapping and extracellular volumequantification: a Society for Cardiovascular Magnetic Resonance(SCMR) and CMR Working Group of the European Society ofCardiology consensus statement. J Cardiovasc Magn Reson 15:92
16. Giri S, Chung YC, Merchant A et al (2009) T2 quantification forimproved detection of myocardial edema. J Cardiovasc MagnReson 11:56
17. Mahrholdt H, Wagner A, Judd RM, Sechtem U, Kim RJ (2005)Delayed enhancement cardiovascular magnetic resonance assess-ment of non-ischaemic cardiomyopathies. Eur Heart J 26:1461–1474
18. Messroghli DR, Radjenovic A, Kozerke S, Higgins DM,Sivananthan MU, Ridgway JP (2004) Modified Look-Locker in-version recovery (MOLLI) for high-resolution T1 mapping of theheart. Magn Reson Med 52:141–146
19. Arheden H, Saeed M, Higgins CB et al (1999) Measurement ofthe distribution volume of gadopentetate dimeglumine at echo-planar MR imaging to quantify myocardial infarction: comparisonwith 99mTc-DTPA autoradiography in rats. Radiology 211:698–708
20. He T, Gatehouse PD, Smith GC, Mohiaddin RH, Pennell DJ,Firmin DN (2008) Myocardial T2* measurements in iron-overloaded thalassemia: an in vivo study to investigate optimalmethods of quantification. Magn Reson Med 60:1082–1089
21. Aletaha D, Neogi T, Silman AJ et al (2010) 2010 rheumatoid ar-thritis classification criteria: an American College ofRheumatology/European League Against Rheumatism collabora-tive initiative. Arthritis Rheum 62:2569–2581
22. Prevoo ML, van't Hof MA, Kuper HH, van Leeuwen MA, van dePutte LB, van Riel PL (1995) Modified disease activity scores thatinclude twenty-eight-joint counts. Development and validation in aprospective longitudinal study of patients with rheumatoid arthritis.Arthritis Rheum 38:44–48
23. Kobayashi Y, Giles JT, Hirano M et al (2010) Assessment of myo-cardial abnormalities in rheumatoid arthritis using a comprehensivecardiac magnetic resonance approach: a pilot study. Arthritis ResTher 12:R171
24. Ntusi NA, Piechnik SK, Francis JM et al (2015) Diffuse myocardialfibrosis and inflammation in rheumatoid arthritis: insights fromCMR T1 mapping. JACC Cardiovasc Imaging 8:526–536
25. Ferreira VM, Piechnik SK, Robson MD, Neubauer S, KaramitsosTD (2014) Myocardial tissue characterization by magnetic reso-nance imaging: novel applications of T1 and T2 mapping. JThorac Imaging 29:147–154
4648 Eur Radiol (2017) 27:4639–4649

26. Greulich S, Arai AE, Sechtem U, Mahrholdt H (2016) Recent ad-vances in cardiac magnetic resonance. F1000Res. doi:10.12688/f1000research.8383.1
27. Bohnen S, Radunski UK, Lund GK et al (2015) Performance of t1and t2 mapping cardiovascular magnetic resonance to detect activemyocarditis in patients with recent-onset heart failure. CircCardiovasc Imaging. doi:10.1161/CIRCIMAGING.114.003073
28. Hinojar R, Varma N, Child N et al (2015) T1 mapping in discrim-ination of hypertrophic phenotypes: hypertensive heart disease andhypertrophic cardiomyopathy: findings from the international T1
multicenter cardiovascular magnetic resonance study. CircCardiovasc Imaging. doi:10.1161/CIRCIMAGING.115.003285
29. Mewton N, Liu CY, Croisille P, Bluemke D, Lima JA (2011)Assessment of myocardial fibrosis with cardiovascular magneticresonance. J Am Coll Cardiol 57:891–903
30. Holmström M, Koivuniemi R, Korpi K et al (2016) Cardiac mag-netic resonance imaging reveals frequent myocardial involvementand dysfunction in active rheumatoid arthritis. Clin Exp Rheumatol34:416–423
Eur Radiol (2017) 27:4639–4649 4649