ADVANCED INTERNATIONAL MULTITECH CO., LTD AND …€¦ · (EXPRESSED IN THOUSANDS OF NEWTAIWAN...
38
ADVANCED INTERNATIONAL MULTITECH CO., LTD AND SUBSIDIARIES CONSOLIDATED FINANCIAL STATEMENTS AND REPORT OF INDEPENDENT ACCOUNTANTS JUNE 30, 2017 AND 2016
Transcript of ADVANCED INTERNATIONAL MULTITECH CO., LTD AND …€¦ · (EXPRESSED IN THOUSANDS OF NEWTAIWAN...

ADVANCED INTERNATIONAL MULTITECH CO., LTD
AND SUBSIDIARIES
CONSOLIDATED FINANCIAL STATEMENTS AND
REPORT OF INDEPENDENT ACCOUNTANTS
JUNE 30, 2017 AND 2016

ADVANCED INTERNATIONAL MULTITECH CO., LTD AND SUBSIDIARIES CONSOLIDATED BALANCE SHEETS
JUNE 30, 2017 AND 2016 (EXPRESSED IN THOUSANDS OF NEW TAIWAN DOLLARS)
~2~
J U N E 3 0 , 2 0 1 7 DECEMBER 31,2016 J U N E 3 0 , 2 0 1 6 Assets Notes A M O U N T % A M O U N T % A M O U N T %
Current assets
1100 Cash and cash equivalents 6(1) $ 1,443,920 25 $ 730,522 12 $ 961,305 19
1150 Notes receivable, net 6(3) 5,383 - 10,257 - 6,561 -
1170 Accounts receivable, net 6(4) 1,422,358 25 2,285,122 37 1,058,049 21
1200 Other receivable 16,782 - 18,411 - 20,960 1
1220 Current income tax assets 461 - 348 - 669 -
130X Inventories 6(5) 1,021,994 18 1,299,616 21 908,098 18
1410 Prepayments 6(6) 85,020 2 96,443 1 71,553 2
1470 Other current assets 15,083 - 9,449 - 15,635 -
11XX Total current assets 4,011,001 70 4,450,168 71 3,042,830 61
Non-current assets
1543 Financial assets carried at cost -
non-current
6(2)
55 - 55 - 55 -
1600 Property, plant and equipment 6(7)and8 1,529,666 27 1,627,930 26 1,760,124 36
1780 Intangible assets 6(8) 7,928 - 9,668 - 14,866 -
1840 Deferred income tax assets 66,728 1 54,826 1 57,007 1
1900 Other non-current assets 6(9) and8 106,781 2 100,055 2 90,226 2
15XX Total non-current assets 1,711,158 30 1,792,534 29 1,922,278 39
1XXX Total assets $ 5,722,159 100 $ 6,242,702 100 $ 4,965,108 100
(Continued)

ADVANCED INTERNATIONAL MULTITECH CO., LTD AND SUBSIDIARIES CONSOLIDATED BALANCE SHEETS
JUNE 30, 2017 AND 2016 (EXPRESSED IN THOUSANDS OF NEW TAIWAN DOLLARS)
~3~
J U N E 3 0 , 2 0 1 7 DECEMBER 31,2016 J U N E 3 0 , 2 0 1 6 Liabilities and Equity Notes A M O U N T % A M O U N T % A M O U N T %
Current liabilities
2100 Short-term loans 6(10)and8 $ 40,515 1 $ 40,336 - $ 38,778 1
2150 Notes payable 1,375 - 1,642 - 548 -
2170 Accounts payable 781,870 13 1,280,517 20 547,469 11
2200 Other payables 6(10) 969,282 17 922,160 15 702,540 14
2230 Current income tax
liabilities
69,565 1 113,766 2 79,333 2
2399 Other current liabilities 48,147 1 40,886 1 24,568 -
21XX Total current liabilities 1,910,754 33 2,399,307 38 1,393,236 28
Non-current liabilities
2570 Deferred income tax
liabilities
85,250 2 55,072 1 41,901 1
2640 Net defined benefit
liabilities-non-current
63,278 1 63,285 1 59,142 1
2670 Other non-current liabilities 515 - 577 - 571 -
25XX Non-current liabilities 149,043 3 118,934 2 101,614 2
2XXX Total liabilities 2,059,797 36 2,518,241 40 1,494,850 30
Equity
Equity attributable to owners of
parent
Share capital 6(14)
3110 Share capital - common stock 1,333,757 23 1,333,757 21 1,333,757 27
Capital reserve 6(15)
3200 Capital surplus 733,780 13 733,780 12 733,060 15
Retained earnings 6(16)
(22)
3310 Legal reserve 698,847 12 664,300 11 664,300 13
3320 Special reserve 21,412 - - - - -
3350 Undistributed earnings 615,814 11 650,101 10 362,223 7
Other equity interest
3400 Other equity interest ( 74,694 ) ( 1 ) ( 21,412 ) - 33,062 1
31XX Equity attributable to owners
of the parent
3,328,916 58 3,360,526 54 3,126,402 63
36XX Non-controlling interest 333,446 6 363,935 6 343,856 7
3XXX Total equity 3,662,362 64 3,724,461 60 3,470,258 70
Commitments and Contingent
Liabilities 9
3X2X Total liabilities and equity $ 5,722,159 100 $ 6,242,702 100 $ 4,965,108 100

ADVANCED INTERNATIONAL MULTITECH CO., LTD AND SUBSIDIARIES CONSOLIDATED STATEMENTS OF COMPREHENSIVE INCOME
FOR THE FIRST QUARTER ENDED JUNE 30, 2017 AND 2016
(EXPRESSED IN THOUSANDS OF NEWTAIWAN DOLLARS, EXCEPT FOR EARNING PER SHARE AMOUNTS)
~4~
April 1- June 30,
2017 April 1- June 30,
2016 January 1- June
30,2017 January 1- June
30,2016
Items Notes A M O U N T % A M O U N T % A M O U N T % A M O U N T %
4000 Operating revenue $ 2,345,735 100 $ 1,882,440 100 $ 5,015,504 100 $ 4,277,477 100
5000 Operating costs 6(5)(8)(20)(
21) ( 2,008,402 ) ( 86 ) ( 1,733,162 ) ( 92 ) ( 4,264,038 ) ( 85 ) ( 3,774,436 ) ( 88 )
5900 Net operating margin 337,333 14 149,278 8 751,466 15 503,041 12
Operating expenses 6(8)(20)(21)
6100 Selling expenses ( 54,332 ) ( 2 ) ( 40,442 ) ( 2 ) ( 103,964 ) ( 2 ) ( 94,833 ) ( 2 )
6200 General and administrative
expenses
( 93,036 ) ( 4 ) ( 89,678 ) ( 5 ) ( 190,861 ) ( 4 ) ( 188,342 ) ( 4 )
6300 Research and development
expenses
( 85,641 ) ( 4 ) ( 72,594 ) ( 4 ) ( 168,072 ) ( 3 ) ( 153,139 ) ( 4 )
6000 Total operating expenses ( 233,009 ) ( 10 ) ( 202,714 ) ( 11 ) ( 462,897 ) ( 9 ) ( 436,314 ) ( 10 )
6500 Net other revenue and
expense
6(17)
12,611 1 14,033 1 31,935 - 25,679 -
6900 Operating profit (loss) 116,935 5 ( 39,403 ) ( 2 ) 320,504 6 92,406 2
Non-operating income and
expenses
7010 Other income 6(18) 1,157 - 1,003 - 2,155 - 3,875 -
7020 Other gains and losses 6(19) 1,569 - 34,973 2 ( 102,575 ) ( 2 ) 8,802 -
7050 Finance costs ( 56 ) - ( 1,235 ) - ( 51 ) - ( 1,530 ) -
7000 Total non-operating income
and expenses
2,670 - 34,741 2 ( 100,471 ) ( 2 ) 11,147 -
7900 Profit before income tax 119,605 5 ( 4,662 ) - 220,033 4 103,553 2
7950 Income tax expense 6(22) ( 30,202 ) ( 1 ) 2,926 - ( 28,496 ) - ( 21,668 ) -
8200 Profit for the year (loss) $ 89,403 4 ( $ 1,736 ) - $ 191,537 4 $ 81,885 2
8361 Financial statements
translation differences of
foreign operations
$ 18,543 1 ( $ 21,036 ) ( 1 ) ( $ 53,282 ) ( 1 ) ( $ 32,552 ) ( 1 )
8300 Other comprehensive (loss)
income for the year
$ 18,543 1 ( $ 21,036 ) ( 1 ) ( $ 53,282 ) ( 1 ) ( $ 32,552 ) ( 1 )
8500 Total comprehensive income
for the year
$ 107,946 5 ( $ 22,772 ) ( 1 ) $ 138,255 3 $ 49,333 1
Profit attributable to:
8610 Owners of the parent $ 86,179 4 ( $ 18,578 ) ( 1 ) $ 195,060 4 $ 53,200 1
8620 Non-controlling interest 3,224 - 16,842 1 ( 3,523 ) - 28,685 1
Total $ 89,403 4 ( $ 1,736 ) - $ 191,537 4 $ 81,885 2
Comprehensive income
attributable to:
8710 Owners of the parent $ 104,722 5 ( $ 39,614 ) ( 2 ) $ 141,778 3 $ 20,648 -
8720 Non-controlling interest 3,224 - 16,842 1 ( 3,523 ) - 28,685 1
Total $ 107,946 5 ( $ 22,772 ) ( 1 ) $ 138,255 3 $ 49,333 1
Earnings per share (in
dollars)
6(23)
9750 Basic earnings per share $ 0.65 ( $ 0.14 ) $ 1.46 $ 0.40
9850 Diluted earnings per share $ 0.65 ( $ 0.14 ) $ 1.45 $ 0.40
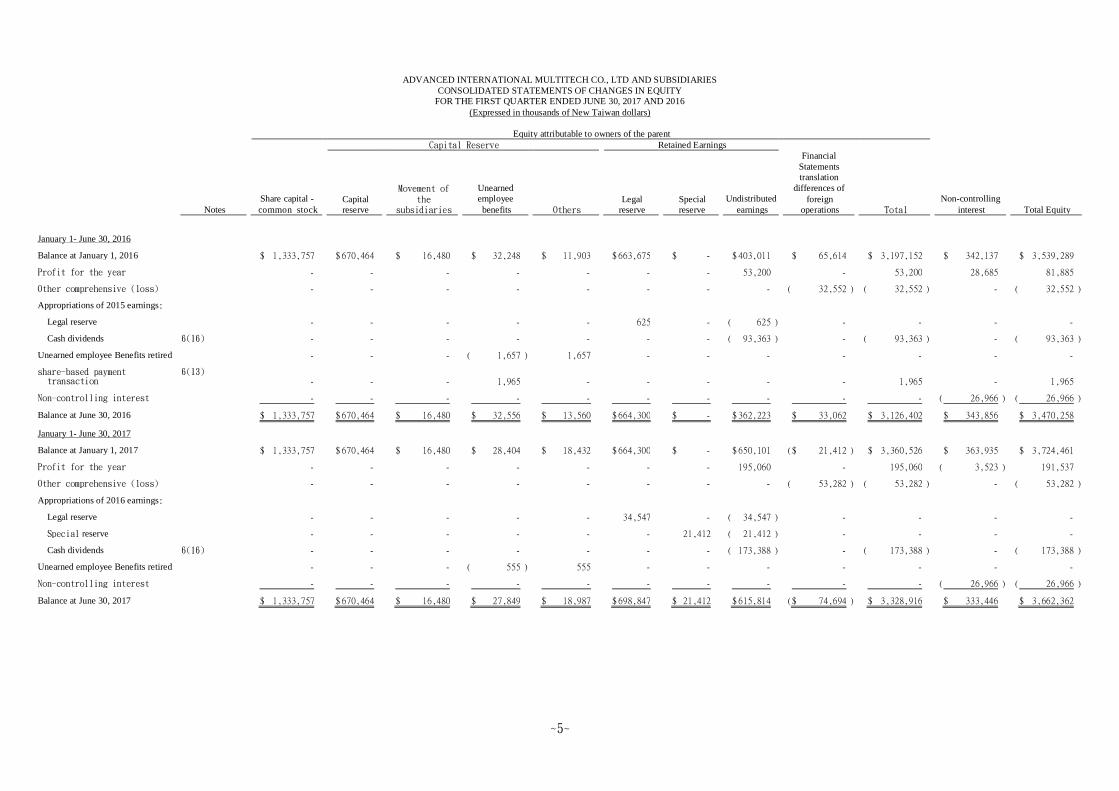
ADVANCED INTERNATIONAL MULTITECH CO., LTD AND SUBSIDIARIES
CONSOLIDATED STATEMENTS OF CHANGES IN EQUITY
FOR THE FIRST QUARTER ENDED JUNE 30, 2017 AND 2016
(Expressed in thousands of New Taiwan dollars) Equity attributable to owners of the parent Capital Reserve Retained Earnings
Notes
Share capital -
common stock
Capital
reserve
Movement of the
subsidiaries
Unearned
employee
benefits
Others
Legal
reserve
Special
reserve
Undistributed
earnings
Financial
Statements
translation
differences of
foreign
operations
Total
Non-controlling
interest
Total Equity
~5~
January 1- June 30, 2016 Balance at January 1, 2016 $ 1,333,757 $ 670,464 $ 16,480 $ 32,248 $ 11,903 $ 663,675 $ - $ 403,011 $ 65,614 $ 3,197,152 $ 342,137 $ 3,539,289 Profit for the year - - - - - - - 53,200 - 53,200 28,685 81,885 Other comprehensive (loss) - - - - - - - - ( 32,552 ) ( 32,552 ) - ( 32,552 ) Appropriations of 2015 earnings: Legal reserve - - - - - 625 - ( 625 ) - - - - Cash dividends 6(16) - - - - - - - ( 93,363 ) - ( 93,363 ) - ( 93,363 ) Unearned employee Benefits retired - - - ( 1,657 ) 1,657 - - - - - - - share-based payment
transaction 6(13)
- - - 1,965 - - - - - 1,965 - 1,965 Non-controlling interest - - - - - - - - - - ( 26,966 ) ( 26,966 )
Balance at June 30, 2016 $ 1,333,757 $ 670,464 $ 16,480 $ 32,556 $ 13,560 $ 664,300 $ - $ 362,223 $ 33,062 $ 3,126,402 $ 343,856 $ 3,470,258
January 1- June 30, 2017 Balance at January 1, 2017 $ 1,333,757 $ 670,464 $ 16,480 $ 28,404 $ 18,432 $ 664,300 $ - $ 650,101 ( $ 21,412 ) $ 3,360,526 $ 363,935 $ 3,724,461 Profit for the year - - - - - - - 195,060 - 195,060 ( 3,523 ) 191,537 Other comprehensive (loss) - - - - - - - - ( 53,282 ) ( 53,282 ) - ( 53,282 )
Appropriations of 2016 earnings: Legal reserve - - - - - 34,547 - ( 34,547 ) - - - - Special reserve - - - - - - 21,412 ( 21,412 ) - - - - Cash dividends 6(16) - - - - - - - ( 173,388 ) - ( 173,388 ) - ( 173,388 ) Unearned employee Benefits retired - - - ( 555 ) 555 - - - - - - - Non-controlling interest - - - - - - - - - - ( 26,966 ) ( 26,966 )
Balance at June 30, 2017 $ 1,333,757 $ 670,464 $ 16,480 $ 27,849 $ 18,987 $ 698,847 $ 21,412 $ 615,814 ( $ 74,694 ) $ 3,328,916 $ 333,446 $ 3,662,362

ADVANCED INTERNATIONAL MULTITECH CO., LTD AND SUBSIDIARIES
CONSOLIDATED STATEMENTS OF CASH FLOWS
FOR THE THE FIRST QUARTER ENDED JUNE 30, 2017 AND 2016 (EXPRESSED IN THOUSANDS OF NEWTAIWAN DOLLARS)
Notes January 1- June30 ,
2017 January 1- June30 ,
2016
~6~
CASH FLOWS FROM OPERATING ACTIVITIES
Profit(Loss) before tax $ 220,033 $ 103,553
Adjustments
Adjustments to reconcile profit (loss)
Depreciation 6(7)(20) 166,656 192,707
Amortization 6(20) 8,998 13,802
Amortization of long-term prepaid rent 6(9)(20) 849 933
Provision for doubtful accounts and sales
discount
6(4)
10,302 15,604
Interest income 6(18) ( 1,636 ) ( 1,602 )
Interest expense 69 1,501
Cost of stock-based payment transaction 6(13) - 1,965
Loss on disposal of property, plant and
equipment, net
6(19)
3,490 5,482
Expense transferred from property, plant and
equipment
328 1,359
Expense transferred from other non-current assets 286 -
Changes in operating assets and liabilities
Changes in operating assets
Notes receivable 4,874 ( 980 )
Accounts receivable 809,891 1,006,146
Other receivables 1,098 ( 11,338 )
Inventories 250,934 216,451
Prepayments 7,035 46,579
Other liquid assets ( 5,683 ) 2,051
Changes in operating liabilities
Notes payable ( 267 ) ( 2,905 )
Accounts payable ( 462,160 ) ( 445,384 )
Other payables ( 145,647 ) ( 196,951 )
Other liquid liabilities 7,389 ( 20,669 )
Accrued pension liabilities ( 7 ) ( 16 )
Other operating liabilities - ( 1 )
Cash inflow generated from operations 876,832 928,287
Income taxes (paid) ( 45,678 ) ( 41,379 )
Net cash flows from operating activities 831,154 886,908
(Continued)

ADVANCED INTERNATIONAL MULTITECH CO., LTD AND SUBSIDIARIES
CONSOLIDATED STATEMENTS OF CASH FLOWS
FOR THE THE FIRST QUARTER ENDED JUNE 30, 2017 AND 2016 (EXPRESSED IN THOUSANDS OF NEWTAIWAN DOLLARS)
Notes January 1- June30 ,
2017 January 1- June30 ,
2016
~7~
CASH FLOWS FROM INVESTING ACTIVITIES
Financial assets carried at cost reduced capital
returns
$ - $ 128
Acquisition of property, plant and equipment ( 56,100 ) ( 119,933 )
Increase in prepayment for equipment ( 34,344 ) ( 20,609 )
Proceeds from disposal of property, plant and equipment 2,088 17,752
Increase in refundable deposits ( 1,984 ) ( 2,100 )
Decrease in refundable deposits 2,301 1,846
Acquisition of intangible assets 6(8) ( 2,077 ) ( 1,483 )
Increase in other non-current assets ( 8,108 ) ( 6,825 )
Interest received 1,543 1,671
Net cash flows used in investing activities ( 96,681 ) ( 129,553 )
CASH FLOWS FROM FINANCING ACTIVITIES
Increase in short-term loans 902,476 2,377,342
Decrease in short-term loans ( 902,297 ) ( 2,606,926 )
Repayment of long-term debt - ( 46,135 )
Increase in guarantee deposits - 414
Decrease in guarantee deposits ( 46 ) -
Interest paid ( 69 ) ( 1,561 )
Net cash flows used in financing activities 64 ( 276,866 )
Effect of exchange rate changes on cash and cash
equivalents
( 21,139 ) ( 4,475 )
Net Increase in cash and cash equivalents 713,398 476,014
Cash and cash equivalents at beginning of year 730,522 485,291
Cash and cash equivalents at end of year $ 1,443,920 $ 961,305
~8~
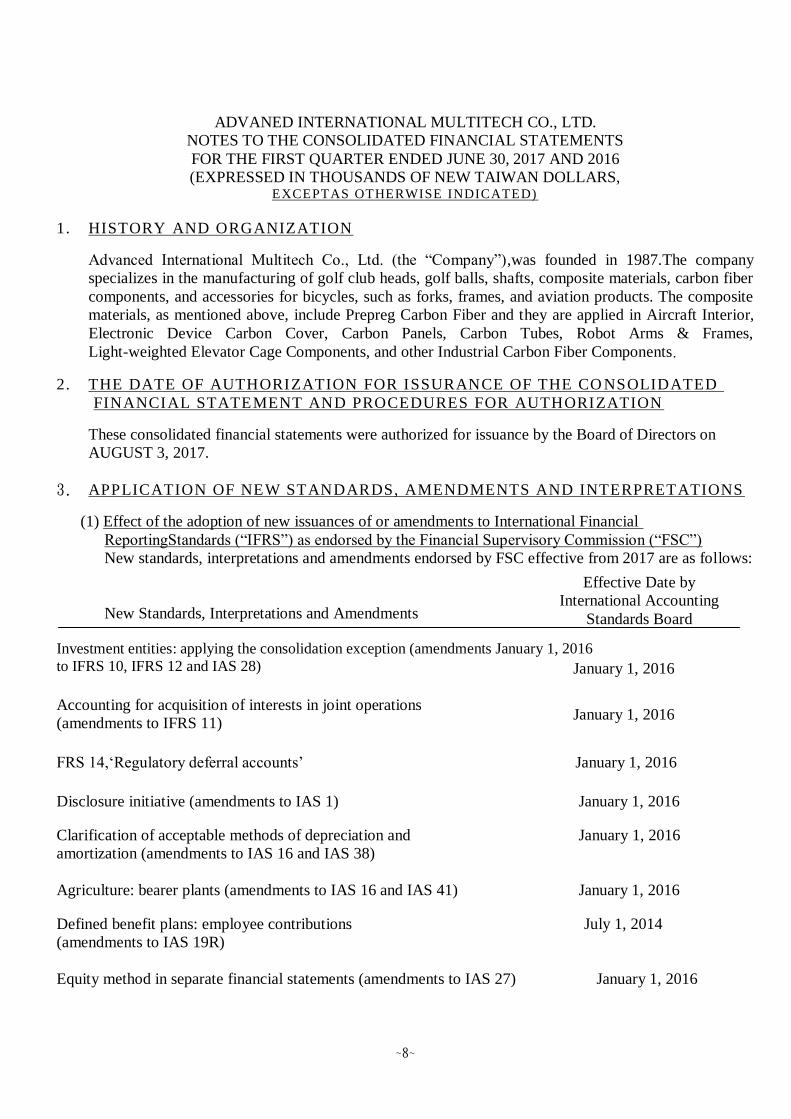
ADVANED INTERNATIONAL MULTITECH CO., LTD.
NOTES TO THE CONSOLIDATED FINANCIAL STATEMENTS
FOR THE FIRST QUARTER ENDED JUNE 30, 2017 AND 2016
(EXPRESSED IN THOUSANDS OF NEW TAIWAN DOLLARS, EXCEPTAS OTHERWISE INDICATED)
1. HISTORY AND ORGANIZATION
Advanced International Multitech Co., Ltd. (the “Company”),was founded in 1987.The company
specializes in the manufacturing of golf club heads, golf balls, shafts, composite materials, carbon fiber
components, and accessories for bicycles, such as forks, frames, and aviation products. The composite
materials, as mentioned above, include Prepreg Carbon Fiber and they are applied in Aircraft Interior,
Electronic Device Carbon Cover, Carbon Panels, Carbon Tubes, Robot Arms & Frames,
Light-weighted Elevator Cage Components, and other Industrial Carbon Fiber Components.
2. THE DATE OF AUTHORIZATION FOR ISSURANCE OF THE CO NSOLIDATED
FINANCIAL STATEMENT AND PROCEDURES FOR AUTHORIZATION
These consolidated financial statements were authorized for issuance by the Board of Directors on
AUGUST 3, 2017.
3. APPLICATION OF NEW STANDARDS, AMENDMENTS AND INTERPRETATIONS
(1) Effect of the adoption of new issuances of or amendments to International Financial
ReportingStandards (“IFRS”) as endorsed by the Financial Supervisory Commission (“FSC”)
New standards, interpretations and amendments endorsed by FSC effective from 2017 are as follows:
New Standards, Interpretations and Amendments
Investment entities: applying the consolidation exception (amendments January 1, 2016
to IFRS 10, IFRS 12 and IAS 28)
Accounting for acquisition of interests in joint operations
(amendments to IFRS 11)
FRS 14,‘Regulatory deferral accounts’ January 1, 2016
Disclosure initiative (amendments to IAS 1) January 1, 2016
Clarification of acceptable methods of depreciation and January 1, 2016
amortization (amendments to IAS 16 and IAS 38)
Agriculture: bearer plants (amendments to IAS 16 and IAS 41) January 1, 2016
Defined benefit plans: employee contributions July 1, 2014
(amendments to IAS 19R)
Equity method in separate financial statements (amendments to IAS 27) January 1, 2016
Effective Date by
International Accounting
Standards Board
January 1, 2016
January 1, 2016

~9~
Recoverable amount disclosures for non-financial assets January 1, 2014
(amendments to IAS 36)
Novation of derivatives and continuation of hedge accounting January 1, 2014
(amendments to IAS 39)
IFRIC 21, ‘Levies’ January 1, 2014
Improvements to IFRSs 2010-2012 July 1, 2014
Improvements to IFRSs 2011-2013 July 1, 2014
Improvements to IFRSs 2012-2014 January 1, 2016
Except for the followings, the above standards and interpretations have no significant impact to the
Group’s financial condition and operating result based on the Group’s assessment.
(2) Effect of new issuances of or amendments to IFRSs as endorsed by the FSC but not yet adopted by
the Group
New standards, interpretations and amendments 2018 version of IFRSs as endorsed by the FSC:
New Standards, Interpretations and Amendments
Classification and measurement of share-based payment transactions January 1, 2018
(amendments to IFRS 2)
Applying IFRS 9 ‘Financial instruments’with IFRS 4‘Insurance contracts’ January 1, 2018
(amendments to IFRS 4)
IFRS 9, ‘Financial instruments’ January 1, 2018
IFRS 15, ‘Revenue from contracts with customers’ January 1, 2018
Clarifications to IFRS 15, ‘Revenue from contracts with customers' January 1, 2018
(amendments to IFRS 15)
Disclosure initiative (amendments to IAS 7) January 1, 2017
0
Recognition of deferred tax assets for unrealized losses January 1, 2017
(amendments to IAS 12)
Transfers of investment property (amendments to IAS 40) January 1, 2018
IFRIC 22, ‘Foreign currency transactions and advance consideration’ January 1, 2018
Annual improvements to IFRSs 2014-2016 cycle- Amendments to IFRS 1,
‘First-time adoption of international financial reporting standards’ January 1, 2018
Annual improvements to IFRSs 2014-2016 cycle- Amendments to IFRS 12,
Effective Date by
International Accounting
Standards Board
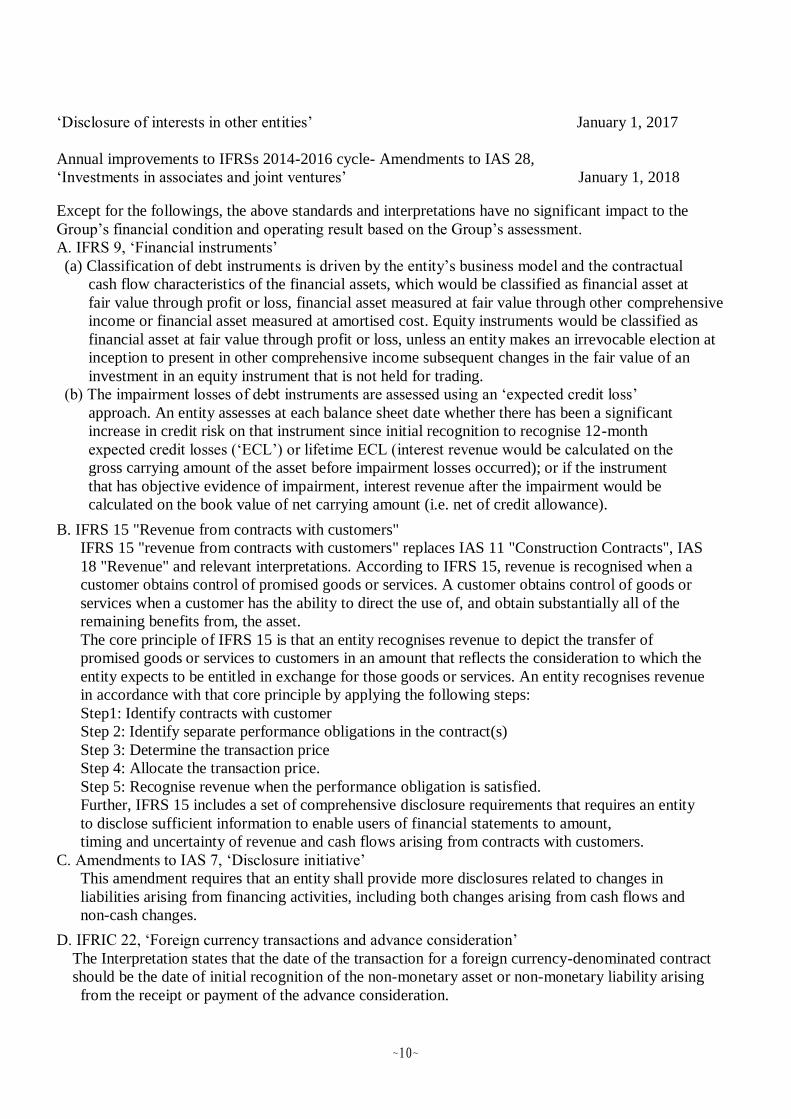
~10~
‘Disclosure of interests in other entities’ January 1, 2017
Annual improvements to IFRSs 2014-2016 cycle- Amendments to IAS 28,
‘Investments in associates and joint ventures’ January 1, 2018
Except for the followings, the above standards and interpretations have no significant impact to the
Group’s financial condition and operating result based on the Group’s assessment.
A. IFRS 9, ‘Financial instruments’
(a) Classification of debt instruments is driven by the entity’s business model and the contractual
cash flow characteristics of the financial assets, which would be classified as financial asset at
fair value through profit or loss, financial asset measured at fair value through other comprehensive
income or financial asset measured at amortised cost. Equity instruments would be classified as
financial asset at fair value through profit or loss, unless an entity makes an irrevocable election at
inception to present in other comprehensive income subsequent changes in the fair value of an
investment in an equity instrument that is not held for trading.
(b) The impairment losses of debt instruments are assessed using an ‘expected credit loss’
approach. An entity assesses at each balance sheet date whether there has been a significant
increase in credit risk on that instrument since initial recognition to recognise 12-month
expected credit losses (‘ECL’) or lifetime ECL (interest revenue would be calculated on the
gross carrying amount of the asset before impairment losses occurred); or if the instrument
that has objective evidence of impairment, interest revenue after the impairment would be
calculated on the book value of net carrying amount (i.e. net of credit allowance).
B. IFRS 15 "Revenue from contracts with customers"
IFRS 15 "revenue from contracts with customers" replaces IAS 11 "Construction Contracts", IAS
18 "Revenue" and relevant interpretations. According to IFRS 15, revenue is recognised when a
customer obtains control of promised goods or services. A customer obtains control of goods or
services when a customer has the ability to direct the use of, and obtain substantially all of the
remaining benefits from, the asset.
The core principle of IFRS 15 is that an entity recognises revenue to depict the transfer of
promised goods or services to customers in an amount that reflects the consideration to which the
entity expects to be entitled in exchange for those goods or services. An entity recognises revenue
in accordance with that core principle by applying the following steps:
Step1: Identify contracts with customer
Step 2: Identify separate performance obligations in the contract(s)
Step 3: Determine the transaction price
Step 4: Allocate the transaction price.
Step 5: Recognise revenue when the performance obligation is satisfied.
Further, IFRS 15 includes a set of comprehensive disclosure requirements that requires an entity
to disclose sufficient information to enable users of financial statements to amount,
timing and uncertainty of revenue and cash flows arising from contracts with customers.
C. Amendments to IAS 7, ‘Disclosure initiative’
This amendment requires that an entity shall provide more disclosures related to changes in
liabilities arising from financing activities, including both changes arising from cash flows and
non-cash changes.
D. IFRIC 22, ‘Foreign currency transactions and advance consideration’
The Interpretation states that the date of the transaction for a foreign currency-denominated contract
should be the date of initial recognition of the non-monetary asset or non-monetary liability arising
from the receipt or payment of the advance consideration.

~11~
(3) IFRSs issued by IASB but not yet endorsed by the FSC
New standards, interpretations and amendments issued by IASB but not yet included in the 2017
version of IFRSs as endorsed by the FSC:
New Standards, Interpretations and Amendments
Sale or contribution of assets between an investor and its associate or
joint venture (amendments to IFRS 10 and IAS 28)
IFRS 16, ‘Leases’ January 1, 2019
IFRS 17, 'Insurance contracts' January 1, 2021
IFRIC 23, ‘Uncertainty over income tax treatments’ January 1, 2019
Except for the followings, the above standards and interpretations have no significant impact to the
Group’s financial condition and financial performance based on the Group’s assessment.
IFRS 16, ‘Leases’
IFRS 16, ‘Leases’, replaces IAS 17, ‘Leases’ and related interpretations and SICs. The standard
requires lessees to recognise a 'right-of-use asset' and a lease liability (except for those leases with
terms of 12 months or less and leases of low-value assets). The accounting stays the same for
lessors, which is to classify their leases as either finance leases or operating leases and account for
those two types of leases differently. IFRS 16 only requires enhanced disclosures to be provided
by lessors.
4.SUMMARY OF SIGNIFICANT ACCOUNTING POLICIES
The principal accounting policies applied in the preparation of these consolidated financial statements
are set out below. The remaining policies are the same as Note.4 of consolidated financial statement in
2016. These policies have been consistently applied to all the periods presented, unless otherwise stated.
(1)Compliance statement
The consolidated financial statements of the Group have been prepared in accordance with the
“Regulations Governing the Preparation of Financial Reports by Securities Issuers” and the
International Accounting Standards 34,“Interim financial reporting” endorsed by the FSC.
(2)Basis of preparation
A. Except for the following items, these consolidated financial statements have been prepared under the
historical cost convention:
(a) Defined benefit liabilities recognized based on the net amount of pension fund assets less present
value of defined benefit obligation.
B. The preparation of financial statements in conformity with International Financial Reporting Standards,
International Accounting Standards, IFRIC Interpretations, and SIC Interpretations as endorsed by the
FSC (collectively referred herein as the “IFRSs”) requires the use of certain critical accounting
estimates. It also requires management to exercise its judgment in the process of applying the Group’s
accounting policies. The areas involving a higher degree of judgment or complexity, or areas where
assumptions and estimates are significant to the consolidated financial statements are disclosed in
Note 5.
Effective Date by
International Accounting
Standards Board
To be determined by
International Accounting
Standards Board
~12~
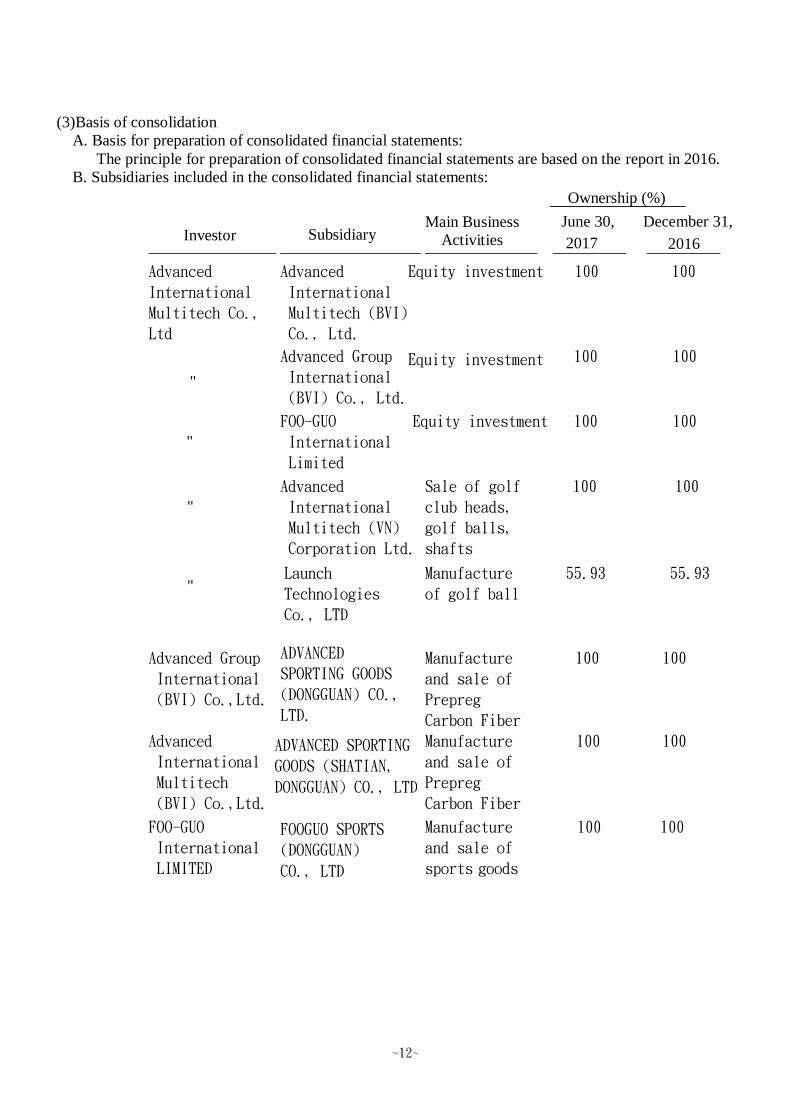
(3)Basis of consolidation
A. Basis for preparation of consolidated financial statements:
The principle for preparation of consolidated financial statements are based on the report in 2016.
B. Subsidiaries included in the consolidated financial statements:
Investor
Subsidiary Main Business
Activities June 30,
2017
Advanced
International
Multitech Co.,
Ltd
Advanced
International
Multitech (BVI)
Co., Ltd.
Equity investment 100 100
Advanced Group
International
(BVI) Co., Ltd.
Equity investment 100 100
FOO-GUO
International
Limited
Equity investment 100 100
Advanced
International
Multitech (VN)
Corporation Ltd.
Sale of golf
club heads,
golf balls,
shafts
100 100
Launch
Technologies
Co., LTD
Manufacture
of golf ball
55.93 55.93
Ownership (%)
December 31,
2016
"
"
"
"
Advanced Group
International
(BVI) Co.,Ltd.
ADVANCED
SPORTING GOODS
(DONGGUAN) CO.,
LTD.
Manufacture
and sale of
Prepreg
Carbon Fiber
100 100
Advanced
International
Multitech
(BVI) Co.,Ltd.
ADVANCED SPORTING
GOODS (SHATIAN,
DONGGUAN) CO., LTD
Manufacture
and sale of
Prepreg
Carbon Fiber
100 100
FOO-GUO
International
LIMITED
FOOGUO SPORTS
(DONGGUAN)
CO., LTD
Manufacture
and sale of
sports goods
100 100

~13~
Ownership (%)
Investor
Subsidiary Main Business
Activities June 30,2016
Advanced
International
Multitech Co.,
Ltd
Advanced
International
Multitech (BVI)
Co., Ltd.
Equity investment 100
"
Advanced Group
International
(BVI) Co., Ltd.
Equity investment 100
"
FOO-GUO
International
Limited
Equity investment 100
" Advanced
International
Multitech (VN)
Corporation Ltd.
Sale of golf
club heads,
golf balls,
shafts
100
" Launch
Technologies
Co., LTD
Manufacture
of golf ball
55.93
" FGI Deportes S
DE RL DE CV
Manufacture
and sale of
sports goods
100
Ownership (%)
Investor
Subsidiary June 30,2016
Advanced Group
International
(BVI) Co.,Ltd.
ADVANCED
SPORTING
GOODS (DONGGUAN)
CO., LTD.
Manufacture
and sale of
Prepreg
Carbon Fiber
100
Advanced
International
Multitech
(BVI) Co.,Ltd.
ADVANCED
SPORTING
GOODS (SHATIAN,
DONGGUAN) CO.,
LTD
Manufacture
and sale of
Prepreg
Carbon Fiber
100
FOO-GUO
International
LIMITED
FOOGUO
SPORTS
(DONGGUAN)
CO., LTD
Manufacture
and sale of
sports goods
100
Main Business
Activities

~14~
C. Subsidiaries not included in the consolidated financial statements: None.
D. Adjustments for subsidiaries with different balance sheet dates: None.
E. Significant restrictions: None.
F. Subsidiaries that have non-controlling interests that are material to the Group:
As of June 30, 2017, December 31, 2016 and June 30, 2016, the non-controlling
interest amounted to $333,446, 363,935 and 343,856, respectively. The information on
non-controlling interest and respective subsidiaries is as follows:
Name of subsidiary Principal place of business Non-controlling interest
June 30, 2017 December 31, 2016
Amount Ownership (%) Amount Ownership (%) Launch Technologies Co., LTD Taiwan $333,446 44.07 363,935 44.07
Name of subsidiary Principal place of business Non-controlling interest June 30, 2016
Amount Ownership (%) Launch Technologies Co., LTD Taiwan $343,856 44.07
Summarized financial information of the subsidiary:
Balance sheets
Statements o f comprehensive income
June 30, 2017 December 31, 2016 June 30, 2016
Current assets 487,199 $ 502,973 $ 475,109 $
Non-current assets 521,865 522,366 526,354
Current liabilities 252,225) ( 198,993) ( 221,223) (
Non-current liabilities 220) 544) (
Total net assets 756,619 $ 825,802 $ 780,240 $
- (
April 1- June 30 , 2017 April 1- June 30 , 2016
Revenue 395,272 $ 344,884 $
Profit before income tax 11,272 49,784
Income tax expense 3,957) ( 11,728) (
Profit(Loss) for the year 7,315 38,056
Other comprehensive (loss) income, net of tax - -
Total comprehensive income for the year 7,315 $ 38,056 $
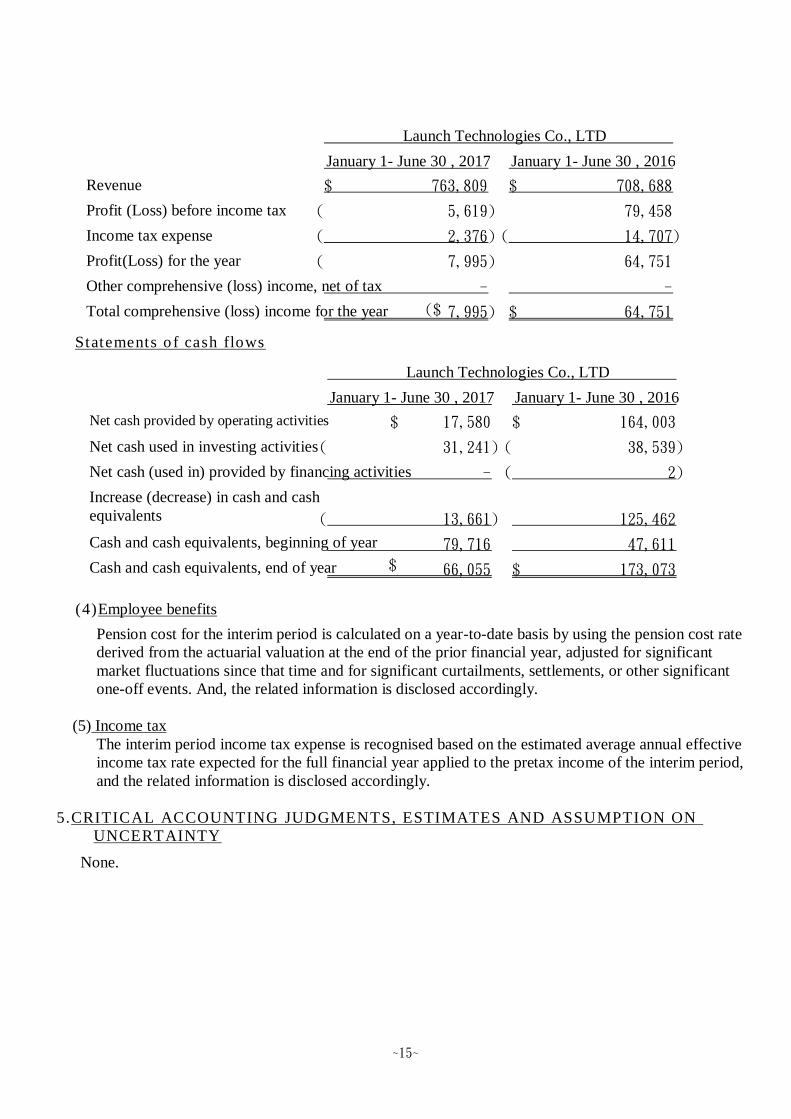
Launch Technologies Co., LTD
~15~
Statements o f cash flows
(4)Employee benefits
Pension cost for the interim period is calculated on a year-to-date basis by using the pension cost rate
derived from the actuarial valuation at the end of the prior financial year, adjusted for significant
market fluctuations since that time and for significant curtailments, settlements, or other significant
one-off events. And, the related information is disclosed accordingly.
(5) Income tax
The interim period income tax expense is recognised based on the estimated average annual effective
income tax rate expected for the full financial year applied to the pretax income of the interim period,
and the related information is disclosed accordingly.
5.CRITICAL ACCOUNTING JUDGMENTS, ESTIMATES AND ASSUMPTION ON
UNCERTAINTY
None.
January 1- June 30 , 2017 January 1- June 30 , 2016
Revenue 763,809 $ 708,688 $
Profit (Loss) before income tax 5,619) ( 79,458
Income tax expense 2,376) ( 14,707) (
Profit(Loss) for the year 7,995) ( 64,751
Other comprehensive (loss) income, net of tax - -
Total comprehensive (loss) income for the year 7,995) ($ 64,751 $
Launch Technologies Co., LTD
January 1- June 30 , 2017 January 1- June 30 , 2016
Net cash provided by operating activities 17,580 $ 164,003 $
Net cash used in investing activities 31,241) ( 38,539) (
Net cash (used in) provided by financing activities - 2) (
Increase (decrease) in cash and cash
equivalents
13,661) ( 125,462
Cash and cash equivalents, beginning of year 79,716 47,611
Cash and cash equivalents, end of year 66,055 $ 173,073 $
Launch Technologies Co., LTD

~16~
6.DETAILS OF SIGNIFICANTACCOUNTS
(1) Cash and cash equivalents
A. The Group associates with a variety of financial institutions with high credit quality for the purpose of
dispersing credit risk, so it expects that the probability of counterparty default is low.
B. The Group has no cash and cash equivalents pledged to others.
(2) Financial assets carried at cost
A.According to the Group’s intension, its investments in above equity instruments should be classified
as “available-for-sale financial assets”. However, as the above equity instruments are not traded in
active market, and no sufficient industry information of companies similar to the above companies or
no financial information of the above companies can be obtained, the fair value of the investment in
above equity instruments cannot be measured reliably. Accordingly, the Group classified those
stocks as ‘financial assets carried at cost’.
B.As of June 30, 2017、December 31, 2016 and June 30, 2016, no financial assets measured at cost
held by the Group were pledged to others.
(3) Notes receivable
(4) Accounts receivable
A.The Group’s accounts receivable that were neither past due nor impaired were fully performing
in line with the credit standards prescribed based on counterparties’ industrial characteristics,
scale of business and profitability.
Items June 30, 2017 December 31, 2016
Non-current items: :
Unlisted stocks 55 $ 55 $ 55 $
December 31, 2016 June 30, 2016
Notes receivable 5,383 $ 10,257 $ 6,561 $
Less: allowance for bad debts - - - 5,383 $ 10,257 $ 6,561 $
June 30, 2017
June 30, 2017 December 31, 2016 June 30, 2016
Accounts receivable 1,444,489 $ 2,297,791 $ 1,079,627 $
Less: allowance for sales returns and discounts 845) ( 1,685) ( 715) (
Less: allowance for bad debts 21,286) ( 10,984) ( 20,863) (
1,422,358 $ 2,285,122 $ 1,058,049 $
June 30, 2017 December 31, 2016 June 30, 2016
Cash on hand and revolving funds 1,293 $ 1,294 $ 4,277 $ Checking accounts and demand deposits 622,614 524,891 764,442 Cash equivalents 820,013 204,337 192,586
Total 1,443,920 $ 730,522 $ 961,305 $
June 30, 2016

~17~
B.The aging analysis of accounts receivable that were past due but not impaired is as follows:
The above aging analysis was based on past due date.
C. Movement analysis of financial assets that were impaired is as follows:
(a) As of June 30, 2017、December 31, 2016 and June 30, 2016, the Group’s accounts receivable that
were impaired amounted to $0、$14,624 and $349, respectively.
(b) Movements on the Group provision for impairment of accounts receivable are as follows:
D.The Group does not hold any collateral as security.
(5)Inventories
June 30, 2017
December 31, 2016
June 30, 2016
Up to 30 days 171,454 $ 273,884 $ 101,373 $
31 to 90 days 62,746 85,945 67,527
91 to 180 days 10,210 31,328 7,672
Over 181 days 9,575 1,991 22,826
253,985 $ 393,148 $ 199,398 $
Individual provision Group provision Total
At January 1 349 $ 4,910 $ 5,259 $
Provision for impairment - 15,604 15,604
At June 30 349 $ $ $
2016
20,514 20,863
Individual provision Group provision
Total
At January 1 - $ 10,984 $ 10,984 $
Provision for impairment - 10,302 10,302
At June 30 - $ 21,286 $ 21,286 $
2017
Cost Allowancefor valuation loss Book value
Raw materials 463,831 $ 28,330) ($ 435,501 $
Work in process
189,905 974) ( 188,931
Finished goods 419,108 41,387) ( 377,721
Inventory in transit 19,841 - 19,841
1,092,685 $ 70,691) ($ 1,021,994 $
June 30, 2017

~18~
The cost of inventories recognised as expense for the period:
(6) Prepayments
Cost Allowancefor valuation loss
Book value
Raw materials 487,205 $ 25,133) ($ 462,072 $ Work in process 311,063 863) ( 310,200 Finished goods 519,688 46,419) ( 473,269
Inventory in transit 54,075 - 54,075
1,372,031 $ 72,415) ($ 1,299,616 $
December 31, 2016
December 31, 2016
Prepaid sales tax 44,208 $ 47,841 $ 26,378 $
Prepaid expenses 23,562 21,745 34,291
Overpaid sales tax 15,174 20,137 8,868
Prepayment for purchases 2,076 6,720 2,016
85,020 $ 96,443 $ $ 71,553
June 30, 2017 June 30, 2016
Cost Allowancefor valuation loss Book value
Raw materials 434,470 $ 26,736) ($ 407,734 $
Work in process 179,773 630) ( 179,143
Finished goods 348,106 48,123) ( 299,983
Inventory in transit 21,238 - 21,238
983,587 $ 75,489) ($ 908,098 $
June 30, 2016
April 1- June 30, 2017 April 1- June 30, 2016
Cost of inventories sold 2,012,962 $ 1,740,059 $ Gain on reversal of decline in market value 7,591) ( 7,015) (
Loss from sale of scraps 4,236 679
Others 1,205) ( 561) (
2,008,402 $ 1,733,162 $
January 1- June 30, 2017 January 1- June 30, 2016
Cost of inventories sold 4,262,869 $ 3,779,536 $ Gain on reversal of decline in market value 121) ( 4,738) (
Loss from sale of scraps 4,236 1,152
Others 2,946) ( 1,514) (
4,264,038 $ 3,774,436 $
~19~
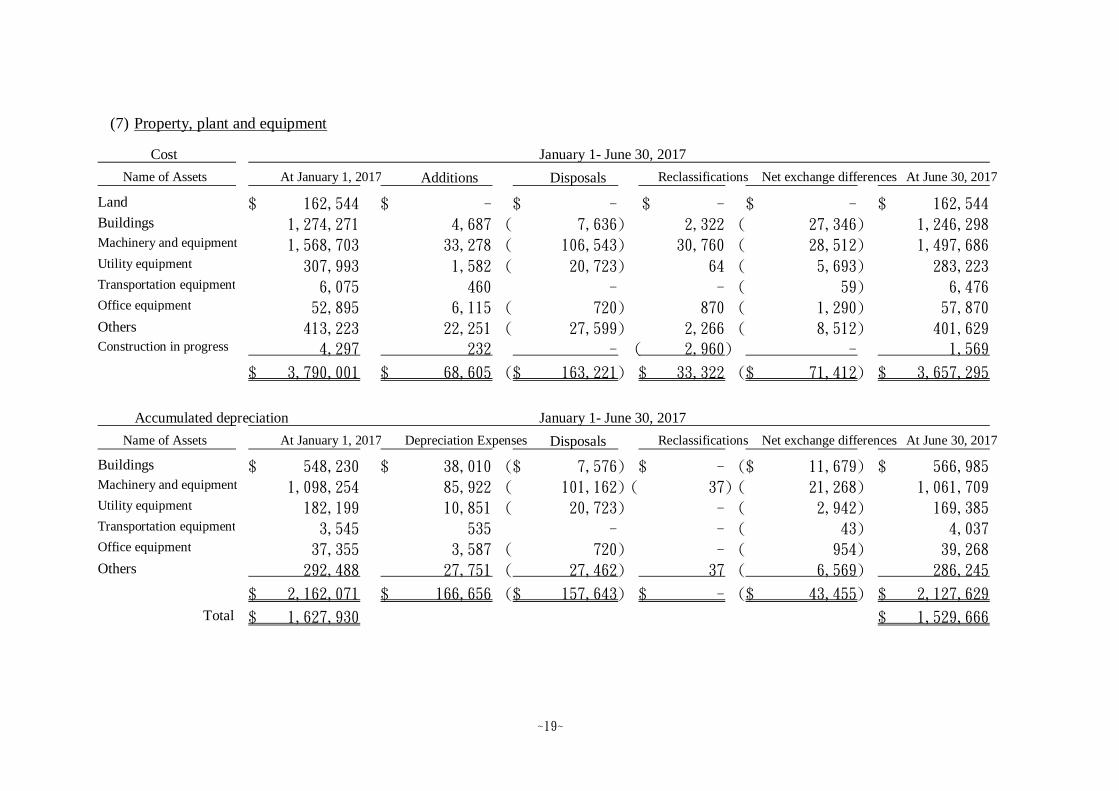
(7) Property, plant and equipment
Cost
Name of Assets At January 1, 2017 Additions Disposals Reclassifications Net exchange differences At June 30, 2017
Land 162,544 $ - $ - $ - $ - $ 162,544 $ Buildings 1,274,271 4,687 7,636) ( 2,322 27,346) ( 1,246,298 Machinery and equipment 1,568,703 33,278 106,543) ( 30,760 28,512) ( 1,497,686 Utility equipment 307,993 1,582 20,723) ( 64 5,693) ( 283,223 Transportation equipment 6,075 460 - - 59) ( 6,476 Office equipment 52,895 6,115 720) ( 870 1,290) ( 57,870 Others 413,223 22,251 27,599) ( 2,266 8,512) ( 401,629 Construction in progress 4,297 232 - 2,960) ( - 1,569
3,790,001 $ 68,605 $ 163,221) ($ 33,322 $ 71,412) ($ 3,657,295 $
Accumulated depreciation
Name of Assets At January 1, 2017 Depreciation Expenses Disposals Reclassifications Net exchange differences At June 30, 2017
Buildings 548,230 $ 38,010 $ 7,576) ($ - $ 11,679) ($ 566,985 $ Machinery and equipment 1,098,254 85,922 101,162) ( 37) ( 21,268) ( 1,061,709 Utility equipment 182,199 10,851 20,723) ( - 2,942) ( 169,385 Transportation equipment 3,545 535 - - 43) ( 4,037 Office equipment 37,355 3,587 720) ( - 954) ( 39,268 Others 292,488 27,751 27,462) ( 37 6,569) ( 286,245
2,162,071 $ 166,656 $ 157,643) ($ - $ 43,455) ($ 2,127,629 $
Total 1,627,930 $ 1,529,666 $
January 1- June 30, 2017
January 1- June 30, 2017
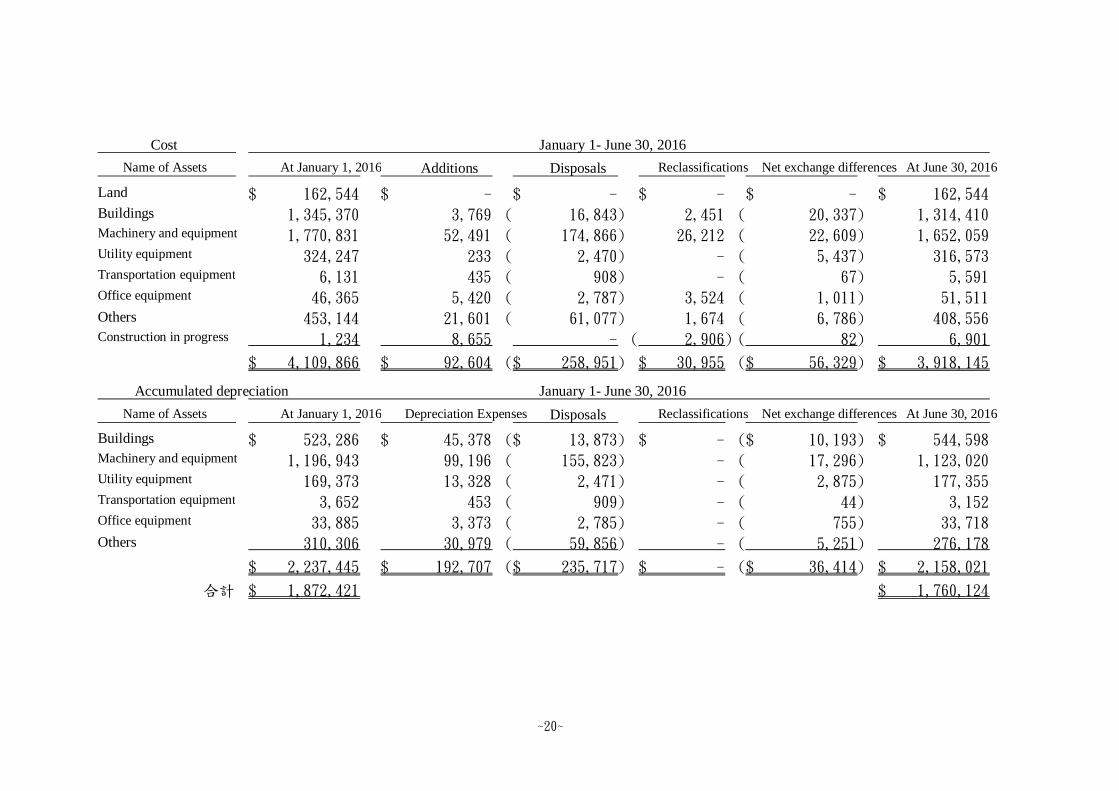
~20~
Cost
Name of Assets At January 1, 2016 Additions Disposals Reclassifications Net exchange differences At June 30, 2016
Land 162,544 $ - $ - $ - $ - $ 162,544 $ Buildings 1,345,370 3,769 16,843) ( 2,451 20,337) ( 1,314,410 Machinery and equipment 1,770,831 52,491 174,866) ( 26,212 22,609) ( 1,652,059 Utility equipment 324,247 233 2,470) ( - 5,437) ( 316,573 Transportation equipment 6,131 435 908) ( - 67) ( 5,591 Office equipment 46,365 5,420 2,787) ( 3,524 1,011) ( 51,511 Others 453,144 21,601 61,077) ( 1,674 6,786) ( 408,556 Construction in progress 1,234 8,655 - 2,906) ( 82) ( 6,901
4,109,866 $ 92,604 $ 258,951) ($ 30,955 $ 56,329) ($ 3,918,145 $
Accumulated depreciation
Name of Assets At January 1, 2016 Depreciation Expenses Disposals Reclassifications Net exchange differences At June 30, 2016
Buildings 523,286 $ 45,378 $ 13,873) ($ - $ 10,193) ($ 544,598 $ Machinery and equipment 1,196,943 99,196 155,823) ( - 17,296) ( 1,123,020 Utility equipment 169,373 13,328 2,471) ( - 2,875) ( 177,355 Transportation equipment 3,652 453 909) ( - 44) ( 3,152 Office equipment 33,885 3,373 2,785) ( - 755) ( 33,718 Others 310,306 30,979 59,856) ( - 5,251) ( 276,178
2,237,445 $ 192,707 $ 235,717) ($ - $ 36,414) ($ 2,158,021 $
合計 1,872,421 $ 1,760,124 $
January 1- June 30, 2016
January 1- June 30, 2016

~21~
(8) Intangible assets
Technical skill Computer Software Others Total
At January 1, 2017
Cost 13,000 $ 29,705 $ 65,500 $ 108,205 $
Accumulated amortisation and impairment
10,811) ( 22,226) ( 65,500) ( 98,537) (
2,189 $ 7,479 $ - $ 9,668 $
2017
At January 1 2,189 $ 7,479 $ - $ 9,668 $
Additions-acquired separately - 2,077 - 2,077
Cost reduce - 15,125) ( 65,500) ( 80,625) (
Amortisation 1,313) ( 2,504) ( - 3,817) (
Reduce in accumulated amortization - 15,125 65,500 80,625
At June 30 876 $ 7,052 $ - $ 7,928 $
At June 30, 2017
Cost 13,000 $ 16,657 $ - $ 29,657 $
Accumulated amortisation and impairment
12,124) ( 9,605) ( - 21,729) (
876 $ 7,052 $ - $ 7,928 $
Technical skill Computer Software Others Total
At January 1, 2016
Cost 14,500 $ 37,321 $ 65,500 $ 117,321 $
Accumulated amortisation and impairment
9,393) ( 24,968) ( 59,496) ( 93,857) (
5,107 $ 12,353 $ 6,004 $ 23,464 $
2016
At January 1 5,107 $ 12,353 $ 6,004 $ 23,464 $
Additions-acquired separately - 1,483 - 1,483
Cost reduce - 9,796) ( - 9,796) (
Amortisation 1,563) ( 5,243) ( 3,275) ( 10,081) (
Reduce in accumulated amortization - 9,796 - 9,796
At June 30 3,544 $ 8,593 $ 2,729 $ 14,866 $
At June 30, 2017
Cost 14,500 $ 29,008 $ 65,500 $ 109,008 $
Accumulated amortisation and impairment
10,956) ( 20,415) ( 62,771) ( 94,142) (
3,544 $ 8,593 $ 2,729 $ 14,866 $

~22~
The details of amortization are as follows:
(9) Long-term prepaid rent (list on other non-current assets)
Long-term prepaid rent refers to the land use rights obtained in China. Upon signing of the lease,
the amount has been paid in full. The Group recognized rental expense of $419、$462、$849
and $933 for the three –month and six-month periods ended June 30, 2017 and 2016, respectively.
(10)Short-term loans
Note: Details of short-term borrowings pledged as collateral are provided in Note 8.
June 30, 2017
December 31, 2016 June 30, 2016
Land use right 35,403 $ 38,269 $ 39,870 $
Type of loans June 30, 2017 Interest rate range
Unsecured loans 40,515 $ -
Type of loans December 31, 2016 Interest rate range
Unsecured loans 40,336 $ -
Type of loans June 30, 2016 Interest rate range
Loans from letter of credits 12,483 $ 1.65%
Unsecured loans 26,295 -
38,778 $
April 1- June 30, 2016
Operating costs 180 $ 140 $
Selling expenses - 2,523
Administrative expenses 844 854
Research and development expenses 884 1,381
1,908 $ 4,898 $
January 1- June 30, 2017 January 1- June 30, 2016
Operating costs 354 $ 281 $
Selling expenses - 5,046
Administrative expenses 1,663 1,701
Research and development expenses 1,800 3,053
3,817 $ 10,081 $
April 1- June 30, 2017
~23~
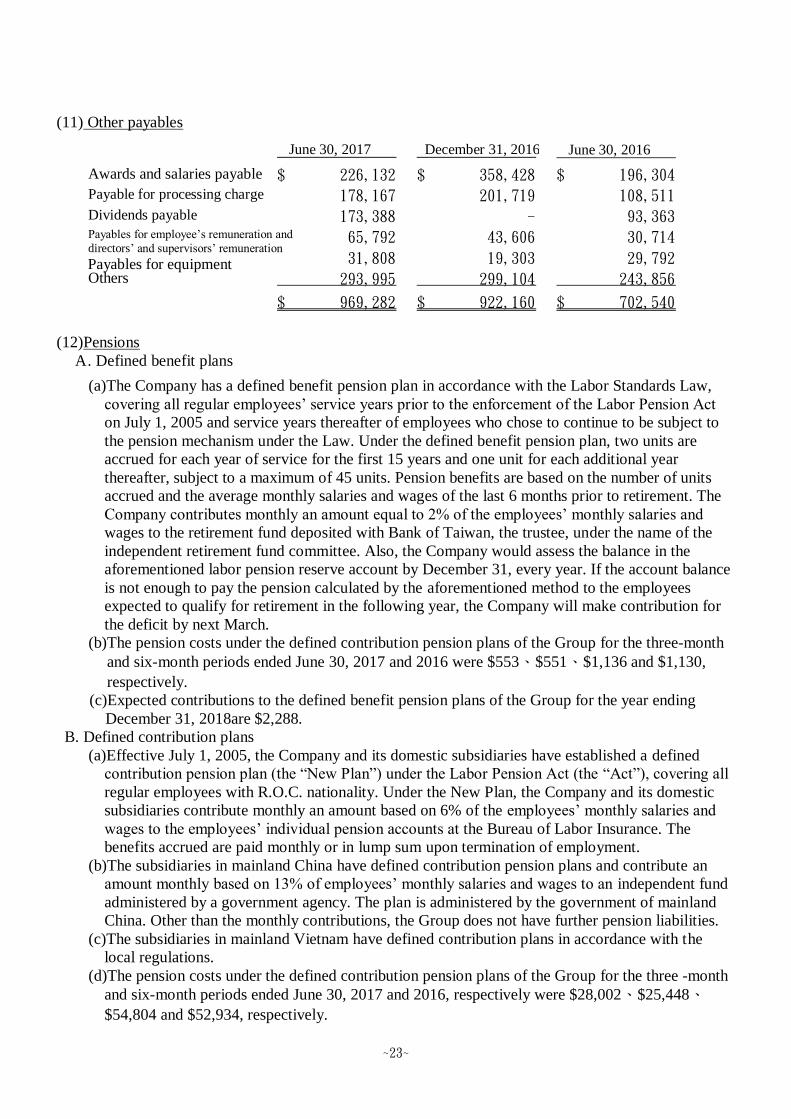
(11) Other payables
(12)Pensions
A. Defined benefit plans
(a)The Company has a defined benefit pension plan in accordance with the Labor Standards Law,
covering all regular employees’ service years prior to the enforcement of the Labor Pension Act
on July 1, 2005 and service years thereafter of employees who chose to continue to be subject to
the pension mechanism under the Law. Under the defined benefit pension plan, two units are
accrued for each year of service for the first 15 years and one unit for each additional year
thereafter, subject to a maximum of 45 units. Pension benefits are based on the number of units
accrued and the average monthly salaries and wages of the last 6 months prior to retirement. The
Company contributes monthly an amount equal to 2% of the employees’ monthly salaries and
wages to the retirement fund deposited with Bank of Taiwan, the trustee, under the name of the
independent retirement fund committee. Also, the Company would assess the balance in the
aforementioned labor pension reserve account by December 31, every year. If the account balance
is not enough to pay the pension calculated by the aforementioned method to the employees
expected to qualify for retirement in the following year, the Company will make contribution for
the deficit by next March.
(b)The pension costs under the defined contribution pension plans of the Group for the three-month
and six-month periods ended June 30, 2017 and 2016 were $553、$551、$1,136 and $1,130,
respectively.
(c)Expected contributions to the defined benefit pension plans of the Group for the year ending
December 31, 2018are $2,288.
B. Defined contribution plans
(a)Effective July 1, 2005, the Company and its domestic subsidiaries have established a defined
contribution pension plan (the “New Plan”) under the Labor Pension Act (the “Act”), covering all
regular employees with R.O.C. nationality. Under the New Plan, the Company and its domestic
subsidiaries contribute monthly an amount based on 6% of the employees’ monthly salaries and
wages to the employees’ individual pension accounts at the Bureau of Labor Insurance. The
benefits accrued are paid monthly or in lump sum upon termination of employment.
(b)The subsidiaries in mainland China have defined contribution pension plans and contribute an
amount monthly based on 13% of employees’ monthly salaries and wages to an independent fund
administered by a government agency. The plan is administered by the government of mainland
China. Other than the monthly contributions, the Group does not have further pension liabilities.
(c)The subsidiaries in mainland Vietnam have defined contribution plans in accordance with the
local regulations.
(d)The pension costs under the defined contribution pension plans of the Group for the three -month
and six-month periods ended June 30, 2017 and 2016, respectively were $28,002、$25,448、
$54,804 and $52,934, respectively.
June 30, 2017 December 31, 2016 June 30, 2016
Awards and salaries payable 226,132 $ 358,428 $ 196,304 $ Payable for processing charge 178,167 201,719 108,511 Dividends payable 173,388 - 93,363 Payables for employee’s remuneration and
directors’ and supervisors’ remuneration 65,792 43,606 30,714
Payables for equipment 31,808 19,303 29,792 Others 293,995 299,104 243,856
969,282 $ 922,160 $ 702,540 $
~24~
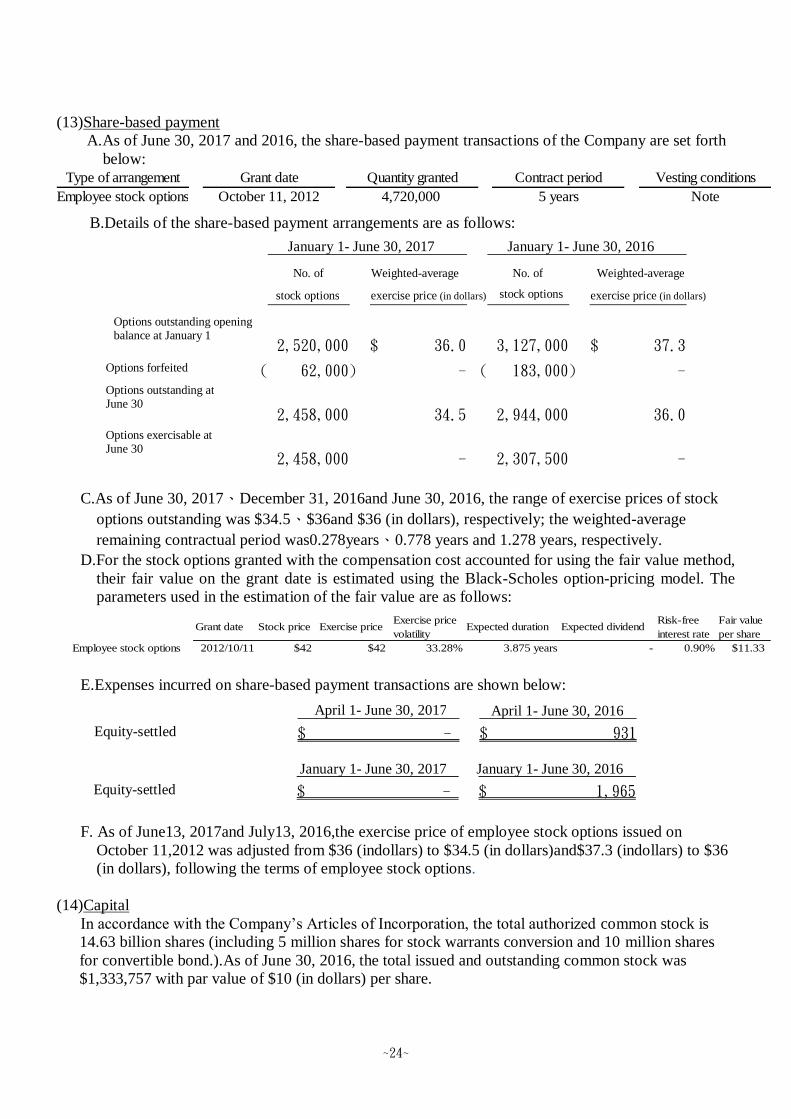
(13)Share-based payment
A.As of June 30, 2017 and 2016, the share-based payment transactions of the Company are set forth
below:
Employee stock options October 11, 2012 4,720,000 5 years Note
Type of arrangement Grant date Quantity granted Contract period Vesting conditions
B.Details of the share-based payment arrangements are as follows:
C.As of June 30, 2017、December 31, 2016and June 30, 2016, the range of exercise prices of stock
options outstanding was $34.5、$36and $36 (in dollars), respectively; the weighted-average
remaining contractual period was0.278years、0.778 years and 1.278 years, respectively.
D.For the stock options granted with the compensation cost accounted for using the fair value method,
their fair value on the grant date is estimated using the Black-Scholes option-pricing model. The
parameters used in the estimation of the fair value are as follows:
Grant date Stock price Exercise priceExercise price
volatilityExpected duration Expected dividend
Risk-free
interest rate
Fair value
per share
Employee stock options 2012/10/11 $42 $42 33.28% 3.875 years - 0.90% $11.33
E.Expenses incurred on share-based payment transactions are shown below:
F. As of June13, 2017and July13, 2016,the exercise price of employee stock options issued on
October 11,2012 was adjusted from $36 (indollars) to $34.5 (in dollars)and$37.3 (indollars) to $36
(in dollars), following the terms of employee stock options.
(14)Capital
In accordance with the Company’s Articles of Incorporation, the total authorized common stock is
14.63 billion shares (including 5 million shares for stock warrants conversion and 10 million shares
for convertible bond.).As of June 30, 2016, the total issued and outstanding common stock was
$1,333,757 with par value of $10 (in dollars) per share.
April 1- June 30, 2016
Equity-settled - $ 931 $
No. of Weighted-average No. of Weighted-average
stock options exercise price (in dollars) stock options exercise price (in dollars)
Options outstanding opening balance at January 1
2,520,000 36.0 $ 3,127,000 37.3 $
Options forfeited 62,000) ( - 183,000) ( - Options outstanding at June 30
2,458,000 34.5 2,944,000 36.0 Options exercisable at June 30
2,458,000 - 2,307,500 -
January 1- June 30, 2017 January 1- June 30, 2016
January 1- June 30, 2017 January 1- June 30, 2016
Equity-settled - $ 1,965 $
April 1- June 30, 2017

~25~
(15)Capital surplus
Pursuant to the R.O.C. Company Law, capital surplus arising from paid-in capital in excess of par
value on issuance of common stocks and donations can be used to cover accumulated deficit or to
issue new stocks or cash to shareholders in proportion to their share ownership, provided that the
Company has no accumulated deficit. Further, the R.O.C. Securities and Exchange Law requires that
the amount of capital surplus to be capitalized mentioned above should not exceed 10% of the paid-in
capital each year. Capital surplus should not be used to cover accumulated deficit unless the legal
reserve is insufficient.
(16)Retained earnings
A. In accordance with the Company’s Articles of Incorporation, current year’s earnings must be
distributed in the following order:
(a)Paying the income tax
(b)Covering accumulated deficit;
(c)Setting aside as legal reserve equal to 10% of current year’s net income after tax and
distribution pursuant to clause
(d)Setting aside a special reserve in accordance with applicable legal and regulatory requirement
(e)The remainder is distributable earnings of which 1% is appropriated as employees’ bonus;
qualified employees include employees of affiliates per criteria set by Board of Directors.
B. The remaining earnings along with the inappropriate earnings at the beginning of the period are
considered as accumulated distributable earnings. In accordance with dividend policy, the
shareholders. proposal of earnings appropriation is prepared by the Board of Directors and
resolved by the shareholders.
C.Except for covering accumulated deficit or issuing new stocks or cash to shareholders in proportion
to their share ownership, the legal reserve shall not be used for any other purpose. The use of legal
reserve for the issuance of stocks or cash to shareholders in proportion to their share ownership is
permitted, provided that the balance of the reserve exceeds 25% of the Company’s paid-in capital.
D. In accordance with the regulations, the Company shall set aside special reserve from the debit
balance on other equity items at the balance sheet date before distributing earnings. When debit
balance on other equity items is reversed subsequently, the reversed amount could be included in
the distributable earnings.
E. The appropriations of 2016 earnings had been approved by the shareholders which is $93,363($0.7
per share).The Shareholders’ Meeting on May 26, 2017 had approved to distribute $1.3 per
common stock holders, the amount of dividend is $173,388.
F. For the information relating to employees’ remuneration (bonuses) and directors’ and supervisors’
remuneration, please refer to Note 6(21).

~26~
(17) Other income and expenses– net
(18)Other revenue
(19)Other gains and losses
April 1- June 30, 2017 April 1- June 30, 2016
Mold income 1,210 $ 3,504 $
Sample income 4,485 3,471
Other income 6,916 7,058
12,611 $ 14,033 $
January 1- June 30, 2017 January 1- June 30, 2016
Mold income 13,727 $ 10,322 $
Sample income 7,681 5,290
Other income 10,527 10,067
31,935 $ 25,679 $
April 1- June 30, 2017 April 1- June 30, 2016
Interest income 1,042 $ 776 $
Others 115 227
1,157 $ 1,003 $
January 1- June 30, 2017 January 1- June 30, 2016
Interest income 1,636 $ 1,602 $
Others 519 2,273
2,155 $ 3,875 $
April 1- June 30, 2017 April 1- June 30, 2016
Gains (losses) on disposal of property, plant
and equipment
3,467) ($ 1,141 $
Net currency exchange gains (losses) 2,800) ( 27,755
Other 7,836 6,077
1,569 $ 34,973 $
January 1- June 30, 2017 January 1- June 30, 2016
Gains (losses) on disposal of property, plant
and equipment
3,490) ($ 5,482) ($
Net currency exchange gains (losses) 105,924) ( 6,546
Other 6,839 7,738
102,575) ($ 8,802 $
~27~
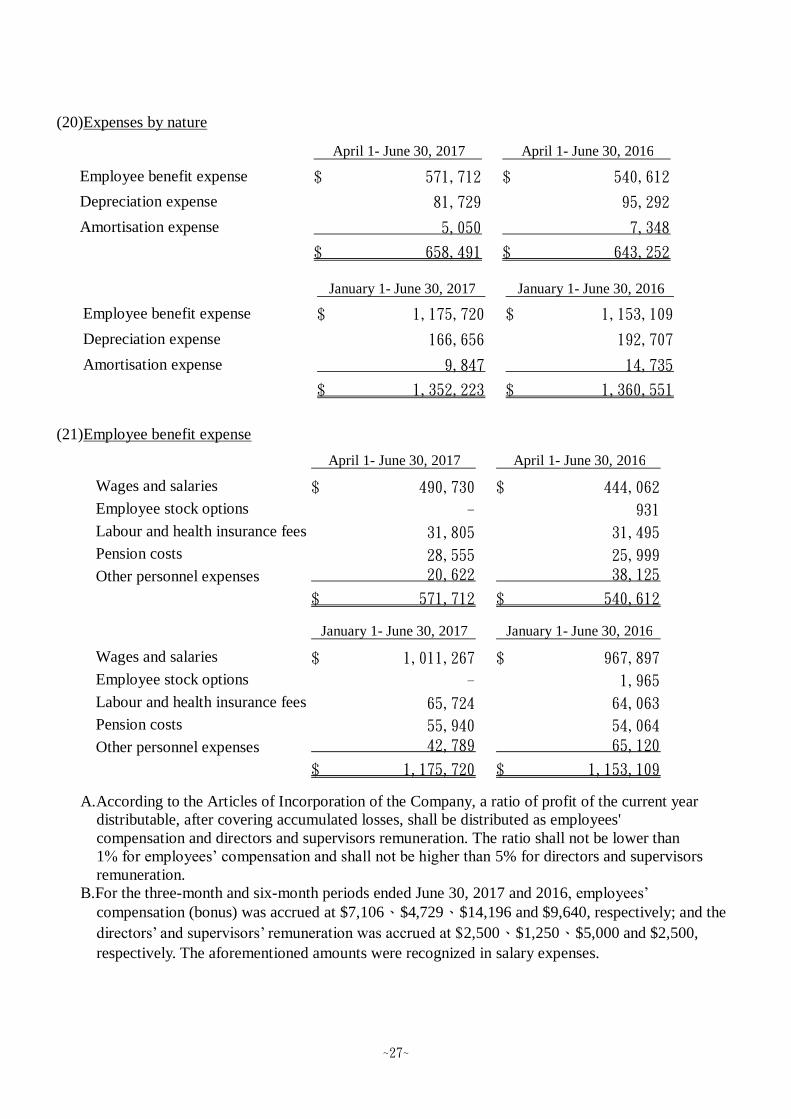
(20)Expenses by nature
(21)Employee benefit expense
A.According to the Articles of Incorporation of the Company, a ratio of profit of the current year
distributable, after covering accumulated losses, shall be distributed as employees'
compensation and directors and supervisors remuneration. The ratio shall not be lower than
1% for employees’ compensation and shall not be higher than 5% for directors and supervisors
remuneration.
B.For the three-month and six-month periods ended June 30, 2017 and 2016, employees’
compensation (bonus) was accrued at $7,106、$4,729、$14,196 and $9,640, respectively; and the
directors’ and supervisors’ remuneration was accrued at $2,500、$1,250、$5,000 and $2,500,
respectively. The aforementioned amounts were recognized in salary expenses.
April 1- June 30, 2017 April 1- June 30, 2016
Employee benefit expense 571,712 $ 540,612 $
Depreciation expense 81,729 95,292
Amortisation expense 5,050 7,348
658,491 $ 643,252 $
January 1- June 30, 2017 January 1- June 30, 2016
Employee benefit expense 1,175,720 $ 1,153,109 $
Depreciation expense 166,656 192,707
Amortisation expense 9,847 14,735
1,352,223 $ 1,360,551 $
April 1- June 30, 2017 April 1- June 30, 2016
Wages and salaries 490,730 $ 444,062 $
Employee stock options - 931
Labour and health insurance fees 31,805 31,495
Pension costs 28,555 25,999
Other personnel expenses 20,622 38,125
571,712 $ 540,612 $
January 1- June 30, 2017 January 1- June 30, 2016
Wages and salaries 1,011,267 $ 967,897 $
Employee stock options - 1,965
Labour and health insurance fees 65,724 64,063
Pension costs 55,940 54,064
Other personnel expenses 42,789 65,120
1,175,720 $ 1,153,109 $

~28~
C.For the six months ended June 30, 2016 , he employees’ compensation and directors’ and
supervisors’ remuneration were estimated and accrued based based on a certain percentage of profit
of current year distributable as of the end of reporting period.
Employees’compensation and directors’and supervisors’remuneration of 2016 as
resolved by the meeting of board of directors were in agreement with those amounts recognised
in the 2016 financial statements. Actual number of cash distributed as employees’compensation
for 2016.Information about employees’ compensation and directors’ and supervisors’ remuneration
of the Company as resolved by the meeting of board of directors will be posted in the “Market
Observation Post System” at the website of the Taiwan Stock Exchange.
(22)Income tax
A.Income tax expense
Components of income tax expense :
April 1- June 30, 2017 April 1- June 30, 2016
Current tax:
Current tax on profits for the period 8,106) ($ 6,495) ($
Tax on undistributed surplus earnings
15,411 5,170
Adjustments in respect of prior years 699 228
Total current tax 8,004 1,097) (
Deferred tax:
Origination and reversal of temporary differences 22,198 1,829) (
Income tax expense (gain) 30,202 $ 2,926) ($
January 1- June 30, 2017 January 1- June 30, 2016
Current tax:
Current tax on profits for the period 24,373 $ 15,684 $
Tax on undistributed surplus earnings
15,411 5,170
Adjustments in respect of prior years 28,676) ( 228
Total current tax 11,108 21,082
Deferred tax:
Origination and reversal of temporary differences 17,388 586
Income tax expense 28,496 $ 21,668 $

~29~
B.The Company’s income tax returns through 2013 have been assessed and approved by the Tax
Authority.
C.Unappropriated retained earnings:
D.As of June 30, 2017、December 31, 2016and June 30, 2016, the balance of the imputation tax credit
account was $118,020、$116,135 and $$131,573,respectively. The creditable tax rate was 33.97%
for 2015 the estimated creditable tax rate is 19.05% for 2016.
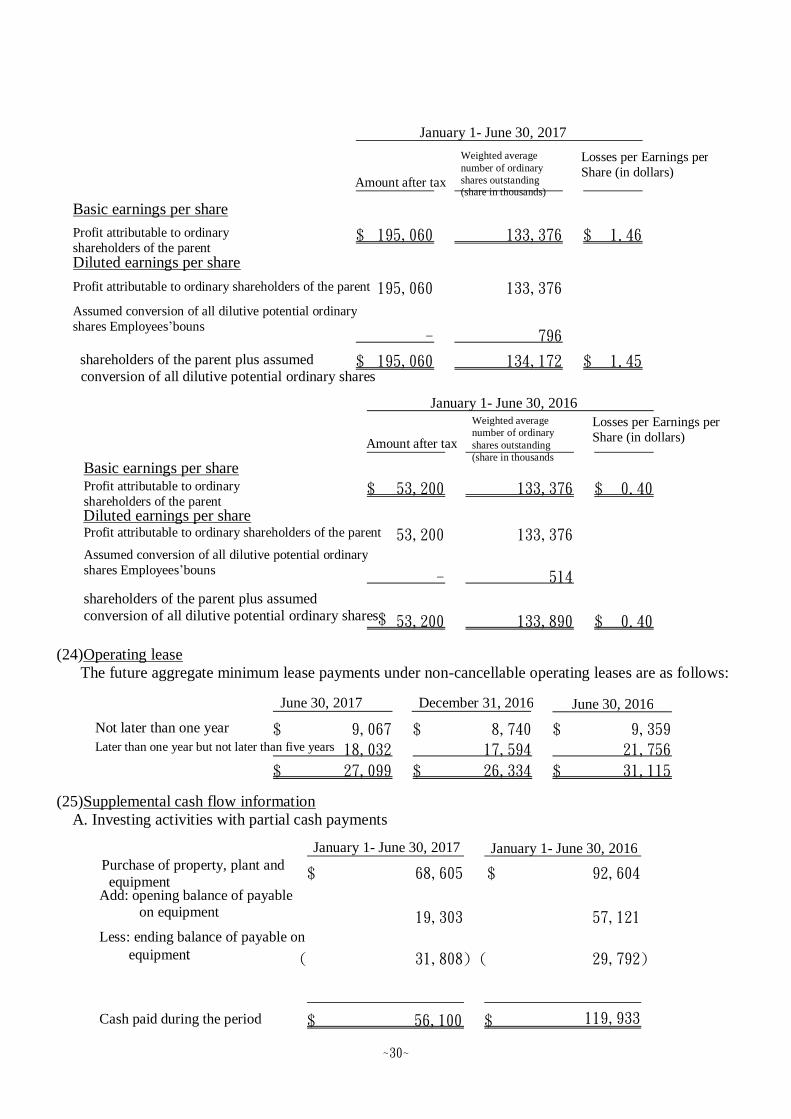
(23)Earnings per share
June 30,2017 December 31,2016 June 30,2016 Earnings generated in and after 1998 615,814 $ 650,101 $ 362,223 $
Weighted average
number of ordinary
shares outstanding
(share in thousands)
Earnings per Earnings per
Share (in dollars) Amount after tax
Basic earnings per share
Profit attributable to ordinary
shareholders of the parent 86,179 $ 133,376 0.65 $
Diluted earnings per share
Profit attributable to ordinary shareholders of the parent 86,179 133,376
Assumed conversion of all dilutive potential ordinary shares Employees’ compensation - 225 shareholders of the parent plus assumed
conversion of all dilutive potential ordinary 86,179 $ 133,601 0.65 $
April 1- June 30, 2017
Weighted average
number of ordinary
shares outstanding
(share in thousands)
Losses per Earnings per
Share (in dollars) Amount after tax
Basic losses per share
Profit attributable to ordinary
shareholders of the parent
18,578) ($ 133,376 0.14) ($
Diluted losses per share
Loss attributable to ordinary shareholders of the parent 18,578) ( 133,376
Assumed conversion of all dilutive potential ordinary
shares Employees’ compensation - - shareholders of the parent plus assumed
conversion of all dilutive potential ordinary 18,578) ($ 133,376 0.14) ($
April 1- June 30, 2016
~30~
(24)Operating lease
The future aggregate minimum lease payments under non-cancellable operating leases are as follows:
(25)Supplemental cash flow information
A. Investing activities with partial cash payments
June 30, 2017 December 31, 2016 June 30, 2016
Not later than one year
9,067 $ 8,740 $ 9,359 $
Later than one year but not later than five years
18,032 17,594 21,756
27,099 $ 26,334 $ 31,115 $
Weighted average
number of ordinary
shares outstanding (share in thousands)
Losses per Earnings per
Share (in dollars) Amount after tax
Basic earnings per share
Profit attributable to ordinary
shareholders of the parent 195,060 $ 133,376 1.46 $
Diluted earnings per share
Profit attributable to ordinary shareholders of the parent 195,060 133,376
Assumed conversion of all dilutive potential ordinary
shares Employees’bouns - 796
shareholders of the parent plus assumed
conversion of all dilutive potential ordinary shares 195,060 $ 134,172 1.45 $
January 1- June 30, 2017
Weighted average
number of ordinary
shares outstanding
(share in thousands
Losses per Earnings per
Share (in dollars) Amount after tax
Basic earnings per share Profit attributable to ordinary
shareholders of the parent
53,200 $ 133,376 0.40 $
Diluted earnings per share Profit attributable to ordinary shareholders of the parent 53,200 133,376 Assumed conversion of all dilutive potential ordinary
shares Employees’bouns - 514
shareholders of the parent plus assumed
conversion of all dilutive potential ordinary shares 53,200 $ 133,890 0.40 $
January 1- June 30, 2016
January 1- June 30, 2017 January 1- June 30, 2016 Purchase of property, plant and
equipment 68,605 $ 92,604 $
Add: opening balance of payable on equipment 19,303 57,121
Less: ending balance of payable on
equipment 31,808) ( 29,792) (
Cash paid during the period 56,100 $ 119,933 $

~31~
B. Financing activities with no cash flow effects
7.RELATED PARTY TRANSACTIONS
Key management compensation
8.PLEDGED ASSETS
The Group’s assets pledged as collateral are as follows:
9.SIGNIFICANT CONTINGENT LIABILITIES AND UNRECOGNIZED CONTRACT
COMMITMENTS
(1)Contingencies
None.
(2)Commitments
A. Capital expenditure contracted for at the balance sheet date but not yet incurred is as follows:
Pledged asset June 30, 2017 December 31,2016 June 30, 2016 Purpose
Land 125,648 $ 125,648 $ 125,648 $ Short and long-term loans Building-net value - 306,972 315,947 326,513 Short and long-term loans Machinery-net value - - - 28,246 Short and long-term loans Time deposits and cash 270 268 268 Customs deposits
(shown as“other non-
current assets”)
432,890 $ 441,863 $ 486,259 $
Book value
June 30, 2017 December 31,2016 June 30, 2016
Raw materials 53,782 $ 98,148 $ 52,543 $
January 1- June 30, 2017 January 1- June 30, 2016
Declared cash dividend 173,388 $ 93,363 $
Less: ending dividend payable
173,388) ( 93,363) (
Cash paid during the period - $ - $
January 1- June 30, 2017 January 1- June 30, 2016
Prepaid equipment to transfer
the property, plant and equipment
33,650 $ 32,314 $
April 1- June 30, 2017 April 1- June 30, 2016 Salaries and other short-term
employee benefits 4,271 $ 5,807 $
Share based payments - 235
4,271 $ 6,042 $
January 1- June 30, 2017 January 1- June 30, 2016 Salaries and other short-term employee benefits 16,487 $ 11,815 $
Share based payments - 487
16,487 $ 12,302 $
~32~
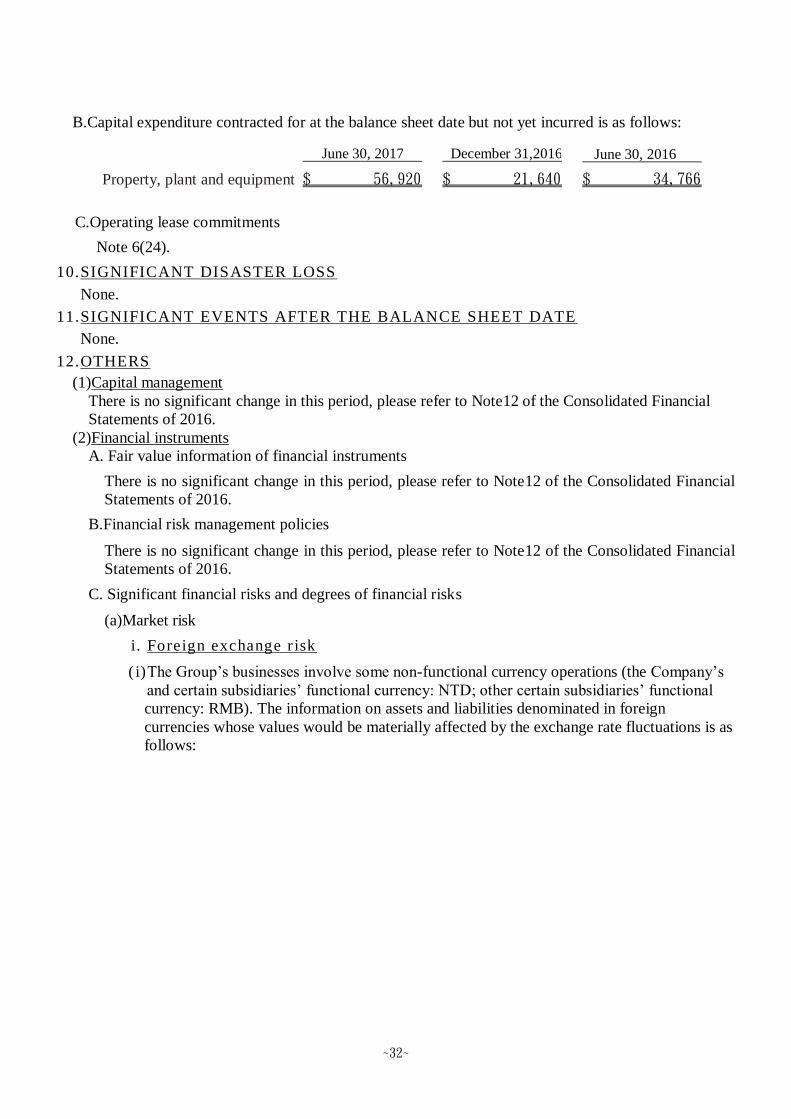
B.Capital expenditure contracted for at the balance sheet date but not yet incurred is as follows:
C.Operating lease commitments
Note 6(24).
10.SIGNIFICANT DISASTER LOSS
None.
11.SIGNIFICANT EVENTS AFTER THE BALANCE SHEET DATE
None.
12.OTHERS
(1)Capital management
There is no significant change in this period, please refer to Note12 of the Consolidated Financial
Statements of 2016.
(2)Financial instruments
A. Fair value information of financial instruments
There is no significant change in this period, please refer to Note12 of the Consolidated Financial
Statements of 2016.
B.Financial risk management policies
There is no significant change in this period, please refer to Note12 of the Consolidated Financial
Statements of 2016.
C. Significant financial risks and degrees of financial risks
(a)Market risk
i. Foreign exchange r isk
( i)The Group’s businesses involve some non-functional currency operations (the Company’s
and certain subsidiaries’ functional currency: NTD; other certain subsidiaries’ functional
currency: RMB). The information on assets and liabilities denominated in foreign
currencies whose values would be materially affected by the exchange rate fluctuations is as
follows:
June 30, 2017 December 31,2016 June 30, 2016
Property, plant and equipment 56,920 $ 21,640 $ 34,766 $

~33~
Book value Foreign currency amount (In thousands)
Exchange rate (NTD)
(Foreign currency: functional currency)
Financial assets
Monetary items
USD : NTD 86,118 $ 32.20 2,773,000 $
USD : RMB 36,140 6.9495 1,163,708
Non-monetary items
RMB : NTD 232,755 4.617 1,074,630
Financial liabilities
Monetary items
USD : NTD 45,114 32.30 1,457,182
USD : RMB 12,028 6.9495 388,504
Non-monetary items
RMB : NTD 5,940 4.617 27,425
December 31,2016
Book value Foreign currency
amount (In thousands) Exchange rate (NTD)
(Foreign currency: functional currency)
Financial assets
Monetary items
USD : NTD 69,176 $ 30.37 2,100,875 $
USD : RMB 33,356 6.7807 1,013,022
Non-monetary items
RMB : NTD 247,398 4.486 1,109,827
Financial liabilities
Monetary items
USD : NTD 36,945 30.47 1,125,714
USD : RMB 7,010 6.7807 213,595
June 30, 2017

~34~
(ii).The unrealised exchange gain (loss) arising from significant foreign exchange variation on
the monetary items held by the Group for the three-month and six-month periods ended June
30, 2017 and 2016, amounted ($2,800)、$27,755、($105,924) and $6,546,respectively.
(iii).Analysis of foreign currency market risk arising from significant foreign exchange
variation:
Book value Foreign currency
amount (In thousands) Exchange rate (NTD)
(Foreign currency: functional currency)
Financial assets
Monetary items
USD : NTD 52,806 $ 32.23 1,701,937 $
USD : RMB 18,302 6.6433 589,873
RMB : NTD 10,980 4.845 53,198
Non-monetary items
RMB : NTD 211,603 4.845 1,025,217
Financial liabilities
Monetary items
USD : NTD 20,345 32.33 657,754
USD : RMB 8,310 6.6433 268,662
Non-monetary items
RMB : NTD 31,918 4.845 154,643
June 30, 2016
Degree of variation Effect on profit or loss Effect on other comprehensive income
(Foreign currency: functional currency)
Financial assets
Monetary items
USD : NTD 1% 21,009 $ - $
USD : RMB 1% 10,130 -
Financial liabilities
Monetary items
USD : NTD 1% 11,257 - $
USD : RMB 1% 2,136 -
January 1- June 30, 2017
Sensitivity analysis

~35~
ii. Pr ice r isk
None.
iii. Interest rate r isk
(i)The Group’s interest rate risk arises from long-term borrowings. Borrowings issued at
variable rates expose the Group to cash flow interest rate risk which is partially offset by
cash and cash equivalents held at variable rates. During January 1-June 30, 2017 and 2016,
the Group’s borrowings at variable rate were denominated in the NTD.
(ii)June 30, 2017 and 2016, if interest rates on NTD-denominated borrowings at that date had
been0.25% higher/lower with all other variables held constant, post-tax profit for the January
1- June 30, 2017 and 2016,would have been $84 and $78 lower/higher,respectively, mainly
as a result of higher/lower interest expense on floating rate borrowings.
(b)Credit risk
i.Credit risk refers to the risk of financial loss to the Group arising from default by the clients or
counterparties of financial instruments. According to the Group’s credit policy, each local entity in
the Group is responsible for managing and analyzing the credit risk for each of their new clients
before standard payment and delivery terms and conditions are offered. The Group assesses the
credit quality of the customers by taking into account their financial position, past experience and
other factors to conduct its internal risk management. Individual risk limits are set based on
internal or external ratings in accordance with limits set by the board of directors. The utilization
of credit limits is regularly monitored. Major credit risk arises from cash and cash equivalents,
derivative financial instruments and other financial instruments. The counterparties are banks with
good credit quality and financial institutions with investment grade or above and government
agencies, so there is no significant compliance concerns and credit risk.
ii.For the January 1- June 30, 2017 and 2016, no credit limits were exceeded during the reporting
periods, and management does not expect any significant losses from non-performance by these
counterparties.
iii.The credit quality information of financial assets that are neither past due nor impaired is provided
in Note 6(4).
Degree of variation Effect on profit or loss Effect on other comprehensive income
(Foreign currency: functional currency)
Financial assets
Monetary items
USD : NTD 1% 17,019 $ - $
USD : RMB 1% 5,899 -
RMB : NTD 1% 532 -
Financial liabilities
Monetary items
USD : NTD 1% 6,578 - $
USD : RMB 1% 2,687 -
January 1- June 30, 2016
Sensitivity analysis

~36~
iv.The ageing analysis of financial assets that were past due but not impaired is provided in Note
6(4).
v. The individual analysis of financial assets that had been impaired is provided in the statement for
each type of financial assets in Note 6.
(c)Liquidity risk
i. Cash flow forecasting is performed by each operating entity of the Group and aggregated by
Group treasury. The Group treasury monitors rolling forecasts of the Group’s liquidity
requirements to ensure it has sufficient cash to meet operational needs while maintaining
sufficient headroom on its undrawn committed borrowing facilities at all times so that the Group
does not breach borrowing limits or covenants on any of its borrowing facilities.
ii. Surplus cash held by the operating entities over and above balance required for working
capital management are transferred to the Group treasury. Group treasury invests surplus
cash in interest bearing current accounts, time deposits, money market deposits and marketable
securities, choosing instruments with appropriate maturities or sufficient liquidity to provide
sufficient head-room as determined by the above-mentioned forecasts.As at June 30,2017、
December 31,2016 and June 30,2016 the Group held money market position of $1,442,627、
$729,228 and $957,028, respectively.
iii.The table below analyses the Group’s non-derivative financial liabilities and net-settled or
gross-settled derivative financial liabilities into relevant maturity groups based on the remaining
period at the balance sheet date to the contractual maturity date for non-derivative financial
liabilities and to the expected maturity date for derivative financial liabilities. The amounts
disclosed in the table are the contractual undiscounted cash flows.
Non-derivative financial liabilities: :
June 30, 2017
Between 1 to 2 years Over 2 years
Short-term borrowings 40,515 $ - $ - $
Notes payable 1,375 - -
Accounts payable 781,870 - -
Other payables 969,282 - -
Less than
1 year
Non-derivative financial liabilities: :
December 31,2016 Between 1 to 2 years Over 2 years
Short-term borrowings 40,336 $ - $ - $
Notes payable 1,642 - -
Accounts payable 1,280,517 - -
Other payables 922,160 - -
Less than
1 year
Non-derivative financial liabilities:
June 30, 2016 Between 1 to 2 years Over 2 years
Short-term borrowings 38,791 $ - $ - $
Notes payable 548 - -
Accounts payable 547,469 - -
Other payables 702,540 - -
Less than 1 year

~37~
iv.The Group does not expect the timing of occurrence of the cash flows estimated through the
maturity date analysis will be significantly earlier, nor expect the actual cash flow amount will be
significantly different.
(3)Fair value information
A. Details of the fair value of the Group’s financial assets and financial liabilities not measured at fair
value are provided in Note 12(2)A.
B. The different levels that the inputs to valuation techniques are used to measure fair value of financial
and non-financial instruments have been defined as follows:
Level 1:Quoted prices (unadjusted) in active markets for identical assets or liabilities that the
entity can access at the measurement date. A market is regarded as active where a market
in which transactions for the asset or liability take place with sufficient frequency and
volume to provide pricing information on an ongoing basis. The fair value of the Group’s
investment in listed stocks, beneficiary certificates and derivative instruments with
quoted market prices is included in Level 1.
Level 2: Inputs other than quoted prices included within Level 1 that are observable
for the asset or liability, either directly or indirectly. The fair value of the Group’s
investment in derivative instruments is included in Level 2.
Level 3: Unobservable inputs for the asset or liability.
C.There were no related information of financial and non-financial instruments measured at fair value
by level on the basis of the nature, characteristics and risks of the assets and liabilities at June
30,2017、December 31,2016 and June 30,2016.
D.For the years ended June 30, 2017 and 2016, there was no transfer into or out from Level 3.
13.SUPPLEMENTARY DISCLOSURES
(1)Significant transactions information
A.Loans to others: Please refer to table 1.
B.Provision of endorsements and guarantees to others: Please refer to table 2.
C.Hold of marketable securities at the end of the period (not including subsidiaries, associates and joint
ventures): Please refer to table 3.
D.Acquisition or sale of the same security with the accumulated cost reaching NT $300 million or
20% of paid-in capital or more: None.
E.Acquisition of real estate reaching NT$300 million or 20% of paid-in capital or more: None.
F.Disposal of real estate reaching NT$300 million or 20% of paid-in capital or more: None.
G.Purchases or sales of goods from or to related parties reaching NT$100 million or
20% of paid-in capital or more: Please refer to table 4.
June 30,2017 : None。
Derivative financial liabilities:
December 31,2016 : None。
Derivative financial liabilities:
June 30,2016 : None。
Derivative financial liabilities:
~38~
H.Receivables from related parties reaching NT$100 million or 20% of paid-in capital
or more: Please refer to table 5.
I.Trading in derivative instruments undertaken during the reporting periods: None.
J.Significant inter-company transactions during the reporting periods: Please refer to table 6.
(2)Information on investees
Names, locations and other information of investee companies (not including investees in Mainland
China):Please refer to table 7.
(3)Information on investments in Mainland China
A. Basic information: Please refer to table 8.
B. Significant transactions, either directly or indirectly through a third area, with
investee companies in the Mainland Area: Please refer to table 9.
14.SEGMENT INFORMATION
(1)General information
In accordance with IFRS No. 8, “Operating Segments”, the Group has determined the operating
segments and reportable operating segments. Operating segments which have met certain quantitative
threshold are disclosed individually or aggregately as reportable operating segments; other segments
which have not met the quantitative threshold are included in the ‘all other segments’.
(2)Measurement of segment information
The Group’s segment profit (loss) is measured with the operating profit (loss) before tax, which is
used as a basis for the Group in assessing the performance of the operating segments.
(3)Reconciliation information for segment profit (loss)
The revenue from external parties reported to the chief operating decision-maker is measured in a
manner consistent with that in the statement of comprehensive income.