Advanced Health and Disaster Aid Network Final Report JHU/APL ...
66
Advanced Health and Disaster Aid Network Final Report JHU/APL NSTD-07-896 Version 1.0 September 30, 2007 Prepared for: National Library of Medicine National Institutes of Health Scalable Information Infrastructure Contract: N01-LM-3-3516 Prepared by: Johns Hopkins University Applied Physics Laboratory 11100 Johns Hopkins Road Laurel, MD 20723-6099
Transcript of Advanced Health and Disaster Aid Network Final Report JHU/APL ...
Advanced Health and Disaster Aid Network Final Report
JHU/APL NSTD-07-896
Version 1.0
September 30, 2007
Prepared for:
National Library of Medicine National Institutes of Health
Scalable Information Infrastructure
Contract: N01-LM-3-3516
Prepared by:
Johns Hopkins University
Applied Physics Laboratory 11100 Johns Hopkins Road Laurel, MD 20723-6099
Advanced Health and Disaster Aid Network: Final Report
Johns Hopkins University Applied Physics Laboratory NSTD-07-896 v1.0 9/30/2007 Page ii
Please send comments to: Dr. David White Principal Investigator Johns Hopkins University Applied Physics Laboratory 11100 Johns Hopkins Road Laurel, MD 20723-6099 Phone: 240-228-5949 E-mail: [email protected] Editor: D. M. White, JHU/APL
Advanced Health and Disaster Aid Network: Final Report
Johns Hopkins University Applied Physics Laboratory NSTD-07-896 v1.0 9/30/2007 Page iii
Advanced Health and Disaster Aid Network
Summary of Salient Results
We successfully demonstrated a testbed incorporating technologies that enable emergency medical service personnel to more efficiently triage, track, and transport patients while sharing real-time patient information and conditions at a disaster scene with the entire emergency response community.
A very effective user-centered-design process was employed to understand users’ work practices, problems, and needs and incorporate them in the system by incrementally building prototypes, conducting demonstrations, and getting feedback at each step in the development.
We developed an infrastructure-independent network including: ad hoc mesh network of wireless sensors, which continuously transfer patients’ triage levels, vital signs, and locations to EMS officer base stations; handheld PDAs for collecting patients demographics and conditions; transfer disaster scene information to a central server via EVDO; and a Web Portal for customized information viewing by the response community.
Tests indicated that:
• Paramedics can retriage/reassess patients more frequently, implying higher quality patient care.
• EMS community can view patient and disaster scene information in real time with improved understanding of the situation.
The surveys also indicate remaining barriers to adopting the technology by first responders. However, higher level EMS officers were enthused with real-time display of patient information instead of waiting for responder reports via radio.
Advanced Health and Disaster Aid Network: Final Report
Johns Hopkins University Applied Physics Laboratory NSTD-07-896 v1.0 9/30/2007 Page iv
Executive Summary
Responding to Mass Casualty Incidents (MCI) poses a significant challenge to emergency response communities. First Responder groups must handle an overwhelming number of casualties, often with limited resources and degraded communication systems. Emergency Medical Service (EMS) officers must coordinate transportation of victims to care facilities often with insufficient information on available beds or the clinical resources required for the situation at hand. Furthermore, Public Health organizations must assess the effect of the incident on community health and the evolving needs of the ongoing response, often with limited ability to monitor the situation. In these chaotic environments, patients are often overlooked for extended periods of time, some are not treated effectively, and some with minor injuries might depart the scene without the awareness of the response team. In general, as a group, the different organizations involved in a large-scale casualty incident collectively are not sufficiently informed about the event to properly manage the situation. As a result present day practice is often subject to time delays, inaccuracies and poor outcomes. The Advanced Health and Disaster Aid Network (AID-N) is a testbed designed to improve communications and provide access to pertinent information for the user community during emergencies. The AID-N user community includes Incident commanders, EMTs / Paramedics, Ambulance personnel, Hospital Emergency Department physicians, nurses, and administrators, Emergency Operations Center staff, and Public Health authorities. The services provided are meant to complement, not replace users’ expertise. Instead they are intended to provide pertinent information, support, and access to resources to aid the users in doing their jobs. In collaboration with EMS, emergency medicine and public health groups in the Washington, DC Metropolitan area, the AID-N project has developed a next generation electronic triage system to improve the effectiveness of victim care during large-scale disasters. The system includes: 1) electronic triage tags, 2) wearable vital sign sensors, 3) robust ad-hoc mesh networking software suitable for small embedded computers with limited memory and computational power, 4) base station laptops with scalable algorithms to manage large numbers of patients, 5) pervasive tracking software to locate patients at all stages of the disaster response process, 6) handheld Personal Digital Assistants (PDA) to provide a lightweight supplement to base stations for first responder and healthcare personnel, and 7) a web portal for the different organizational groups involved in the response effort to be fully aware of the situation in real time. Present day triage and patient monitoring requires emergency responders to manually obtain, sort, and share information on each victim at a disaster scene. We have developed a robust system to triage and monitor disaster victims, record the information, and provide it in real time to each part of the emergency response team in an integrated and intuitive fashion. Our system is designed to monitor a large number of patients, to support caregivers potentially overwhelmed with information through an instinctive interface. The AID-N System provides the capability for multiple first responder disciplines (EMS, Fire, and Police) and multiple health service facilities (hospitals, auxiliary care centers, public health
Advanced Health and Disaster Aid Network: Final Report
Johns Hopkins University Applied Physics Laboratory NSTD-07-896 v1.0 9/30/2007 Page v
departments) from different jurisdictions using different information systems to coordinate their response efforts by sharing real-time information. The AID-N testbed system uses a service-oriented architecture (SOA) that has shared data models of disaster scenarios to support the exchange of data among different user organizations and including heterogeneous systems with legacy databases. The system has three data acquisition subsystems for the first responders to collect patient and incident information at the scene: 1) a mesh network of wearable sensors (VitalMotes) for patients involved in the disaster, 2) a PDA used by first responders at disaster scenes to input data, called the Surveillance and Incident Reporting PDA (SIRP), and 3) a hand-launched autonomous unattended aerial vehicle (AUV), the latter developed under an APL IR&D project. Just as important as the data collection at the scene, we have also developed an information dissemination system and interfaces with three deployed systems: 1) a web-based disaster information portal called the Emergency Response Information Center (ERIC), 2) the ESSENCE syndromic surveillance system used in the National Capital Region, 3) a pre-hospital patient care reporting software system used on ambulances in Arlington County, Virginia (MICHAELS), and 4) a hazardous material reference software system (WISER) developed by the National Library Medicine. . The AID-N system was demonstrated in a simulated mass casualty exercise at Montgomery Blair High School with Montgomery County Fire and Rescue Service on August 5, 2006.
Advanced Health and Disaster Aid Network: Final Report
Johns Hopkins University Applied Physics Laboratory NSTD-L-22646 v1.0 9/30/2007 Page vi
Advanced Health and Disaster Aid Network: Final Report
Table of Contents
Summary of Salient Results ……………………………………………………………………iii Executive Summary …………………………………………………………………………….iv
1. Introduction............................................................................................................................1–1
1.1 Project Sponsor .......................................................................................................1–3
1.2 Project Organization ...............................................................................................1–4
2. Requirements analysis ...........................................................................................................2–8
2.1 Initial User Community Requirements .................................................................2–10 2.1.1 First Responder/Prehospital System and Physician/Hospital Subsystems Requirements ..............................................................................2–11 2.1.2 Emergency Response Information Center Subsystem Requirements ..................................................................................................2–12 2.1.3 Public Health Subsystem Requirements .............................................2–13
3. Testbed system and technology Development.....................................................................3–14
3.1 AID-N Emergency Response System Description ...............................................3–14
3.2 Web Portal: Emergency Response Information Center ........................................3–16 3.2.1 Web Portal Views for EMS Officers ..................................................3–19 3.2.2 Web Portal for Emergency Department..............................................3–23 3.2.3 Web Portal for Public Health..............................................................3–24
3.3 Wearable Electronic Triage Tags and Vital Sign Sensors ....................................3–24
3.4 Software Capabilities ............................................................................................3–27
3.5 Surveillance and Incident Reporting PDA (SIRP)................................................3–32
3.6 Heads Up Display and Camera System ................................................................3–35
3.7 UAV Airplane with Mounted Sensors..................................................................3–37
3.8 Video Teleconferencing Review...........................................................................3–38
3.9 AID-N Project Website and Information Database ..............................................3–38
4. Test and Evaluation..............................................................................................................4–39
4.1 Prototype Reviews ................................................................................................4–40
4.2 T&E Plan ..............................................................................................................4–40
4.3 Independent Component Evaluation by ECRI......................................................4–41
Advanced Health and Disaster Aid Network: Final Report
Johns Hopkins University Applied Physics Laboratory NSTD-07-896 v1.0 9/30/2007 Page vii
4.3.1 HDCS Evaluation................................................................................4–41
4.4 Technology Demonstration – June 23, 2006 ........................................................4–45
4.5 Mass Casualty Exercise – August 5, 2006............................................................4–47
5. Conclusions and Recommendations ....................................................................................5–52
5.1 Recommendations.................................................................................................5–54
6. Acknowledgements..............................................................................................................6–56
7. References............................................................................................................................7–57
List of Tables Table 1-1 The AID-N Organizations ……………………………………………………… 1–6
Table 1-2 JHU/APL AID-N Team ……………………………………………………… 1–7
Table 3-1 Electronic Triage Tag Modes of Operation ……………………………..…… 3–25
Table 3-2 Alert Detection Parameters ………………………………………………….. 3–30
Table 4-1 ECRI HDCS Evaluation …………………………………………………….. 4–42
Table 4-2 June 23, 2006 Demonstrations ……………………………………………… 4–47
Table 4-3 Patient Triage Counts ……………………………………………………..… 4–50
Table 4-4 August 5, 2006 Questionnaire Data ………………………………………… 4–51
List of Figures Figure 1-1 AID-N Organization Chart …………………………………………………… 1–5
Figure 2-1 Mass Casualty Incident Communications …………………………………….2–10
Figure 3-1 AID-N Testbed System Diagram …………………………………………….3–15
Figure 3-2 ERIC Web Portal ……………………………………………………………. 3–17
Figure 3-3 Michaels Prehospital Patient Reporting System …………………………… 3–18
Figure 3-4 Incident Commander Web Portal View ……………………………………. 3–20
Figure 3-5 Additional Incident Command Views: Triage Summary & Scene ………… 3–21
Figure 3-6 Treatment and Triage Office Portal View ………………………………….. 3–22
Figure 3-7 Web Portal View for the Transport Officer ……………………………… 3–23
Figure 3-8 Web portal for emergency departments …………………………………. 3–24
Figure 3-9 Mote Vital Sign Sensors: Pulse Oximeter, BP Cuff, and EKG …………… 3–26
Figure 3-10 MicaZ Mote with SIRF III Chip Set and Patch Antenna ………………… 3–27
Advanced Health and Disaster Aid Network: Final Report
Johns Hopkins University Applied Physics Laboratory NSTD-07-896 v1.0 9/30/2007 Page viii
Figure 3-11 Java Graphical User Interface …………………………………………… 3–29
Figure 3-12 Algorithm for analysis of vital signs data ………………………………… 3–31
Figure 3-13 Indoor Mote Track mapping ……………………………………………… 3–32
Figure 3-14 Sample SIRP Screens …………………………………………………….. 3–35
Figure 3-15 Heads Up Display and Camera Unit ……………………………………… 3–36
Figure 3-16 UAV ……………………………………………………………………….. 3–37 Figure 3-17 Images at Two Resolutions ………………………………………………… 3-37
Figure 4-1 Three Levels of Test and Evaluation ……………………………………….. 4–40
Figure 4-2 June 23, 2006 Technology Demonstration …………………………………. 4–45
Figure 4-3 AID-N Technology Demonstration Brochure ……………………………… 4–46
Figure 4-4 Aug 5, 2006 Mass Casualty Exercise ……………………………………….. 4–49
Advanced Health and Disaster Aid Network: Final Report
Johns Hopkins University Applied Physics Laboratory NSTD-07-896 v1.0 09/30/2007 Page 1–1
1. INTRODUCTION
The Johns Hopkins University Applied Physics Laboratory (JHU/APL) developed the Advanced Health and Disaster Aid Network (AID-N) test bed for the Scalable Information Infrastructure 1 Program under contract N01-LM-3-3516 with the National Library of Medicine (NLM) for the period of performance from October 2003 to September 2007. AID-N is a testbed for technologies that enable emergency medical service personnel to more efficiently triage, track, and transport patients while sharing real-time patient information and conditions at a disaster scene with the entire emergency response community. By integrating technologies such as ad-hoc wireless networks, web portals, electronic triage tags, wearable vital sign sensors, and teleconferencing, AID-N dramatically enhances collaboration between personnel at all levels of the emergency response community. The AID-N approach has great potential for improving today’s emergency response operations, especially in mass casualty situations. The AID-N team is led by JHU/APL and includes the Montgomery County Department of Health and Human Services, Montgomery County Fire and Rescue Service, Suburban Hospital Emergency Department, Johns Hopkins Medical Institutions Department of Medical Informatics, ECRI Institute, OPTIMUS Corporation, and Montgomery Blair High School. Project partnerships and collaborations were also established with Harvard University’s CodeBlue project, University of Virginia, National Library of Medicine’s WISER project 2, 3, and the University of Maryland project on wearable sensors for first responders.
During a mass casualty incident, many injured people must be helped in a quick and efficient manner. An effective triage system establishes the order in which individuals are treated and sent to the hospital. An effective system also allocates limited personnel and medical resources in a manner that helps as many people as possible. At a disaster scene, it is critical that patients are correctly diagnosed, monitored, and located to ensure the preservation of the maximum number of lives. Unfortunately, current operations use paper triage tags, which set a patient’s priority level but don’t help keep track of their condition or location.
In a mass casualty situation, initial triage is the counting and sorting of patients according to their condition. Initial triage is performed most often by first responders. Using paper triage tags a first responder rips the tag to expose the correct color or uses a colored ribbon to attach to each patient. The first responder then calls (via radio) the incident commander and reports the patient count. The commander tallies the number of patients and calls for the necessary number of ambulances.
Paper tags use color codes to identify the severity of patients’ injuries. Patients are either classified as Immediate/Red if they have life threatening injuries, Delayed/Yellow with non-life threatening injuries, Minor/Green with minor injuries, or Deceased/Black if deceased or death is imminent. These tags have many obvious limitations in monitoring patients. They only allow
Advanced Health and Disaster Aid Network: Final Report
Johns Hopkins University Applied Physics Laboratory NSTD-07-896 v1.0 09/30/2007 Page 1–2
responders to change the color to a higher priority level. The tags also provide little room for manually recording essential information during treatment, such as the patients’ vital signs and chief complaints. Furthermore, reading the tags can be difficult because the patient information, recorded under time pressured situations, is frequently illegible.
Paper tags also have limited visual feedback and do not aid in locating a particular patient in a sea of patients with the same triage color. When a commander needs to tally the number of patients triaged under a certain color, the manual count is prone to human error. Finally, paper tags do not distinguish between patients categorized under the same color. Two patients categorized as Immediate (red) have the same priority, even if one patient’s vital signs are much worse than the other.
Upon completion of initial triage, patients are sometimes moved from the triage area to the treatment/waiting area, where they await transportation to a hospital. Secondary triage, performed at this stage, allows an in-depth reassessment of the patient’s condition and is performed in the treatment area as well as during transport to the hospital. Secondary triage also allows capturing the patient’s name, demographics (age, gender), allergies, medications, chief complaint, and a description of the injury. This information is necessary for transportation officers to designate a hospital that is capable of treating the patient’s condition. During secondary triage, the vital signs of the patient, such as the heart rate, blood pressure, and respiration rate, are also assessed. Patients must be reassessed on a regular basis, every five to fifteen minutes, if transportation to a hospital is delayed. For a large number of victims secondary triage is a very time consuming process for the EMS personnel.
The deployed triage system has a significant impact on how the patient care resources are allocated. The system provides critical information to the pre-hospital, hospital, and alternate care sites where resources are constrained and most likely rationed.
To resolve these challenges, AID-N has designed a decentralized electronic triage and sensing system that contains low power embedded devices that efficiently monitors the physiological characteristics of the patients and keeps track of their location. The main contributions of the AID-N electronic triage include:
1. An architecture that allows for more information on the vital signs and location of the patients to be obtained during initial triage.
2. A system that reduces the workload of the responders during secondary triage by allowing patients’ vital status to be gathered wirelessly.
Advanced Health and Disaster Aid Network: Final Report
Johns Hopkins University Applied Physics Laboratory NSTD-07-896 v1.0 09/30/2007 Page 1–3
The overall goal of the AID-N testbed is to use the electronic triage system to more efficiently collect patient and incident information and to distribute this information to the entire response community in real time.
Specific objectives of the project are to: Collect, track and report patient and incident information for large scale emergency
situations Focus on the medical aspects of an emergency response Improve:
• Collaboration among involved organizations • Tracking the location and condition of both patients (victims) and providers • First responder reporting capability • Responder community situational awareness
Build a technology testbed taking advantage of existing technology, products, and prototypes as much as possible.
Develop a system architecture and network system that is scalable to: • All responder and emergency groups • Extended regions
1.1 Project Sponsor
The National Library of Medicine, the AID-N project sponsor, issued solicitation BAA/RFP NLM 02-103/VMS 4 on 6/13/02. The purpose of the solicitation was to demonstrate the application of scalable, network aware, wireless, Geographical Information Systems (GIS), and identification technologies to a networked health related environment. The proposals were to focus on situations that require or greatly benefit from the application of these technologies in health care, medical decision-making, public health, large-scale health emergencies, health education, and biomedical, clinical and health services research. The projects were to involve the use of testbed networks linking hospitals, clinics, the health practitioners' offices, patients' homes, health professional schools, medical libraries, universities, medical research centers and laboratories, and/or public health authorities to demonstrate revolutionary applications in healthcare, health education and medical research. JHU/APL responded to this solicitation with the Advanced Health and Disaster Aid Network final proposal, dated March 13, 2003 and was granted one of the Scalable Information Infrastructure awards 5 with contract N01-LM-3-3516 on September 26, 2003 for $2,936,212. The specified period of performance was September 30, 2003 through September 29, 2006 and was later extended for no additional cost to September 29, 2007. The JHU/APL Principal Investigator is David White, DSc and the NLM Project Officer is Charles Sneiderman, M.D.
Advanced Health and Disaster Aid Network: Final Report
Johns Hopkins University Applied Physics Laboratory NSTD-07-896 v1.0 09/30/2007 Page 1–4
1.2 Project Organization
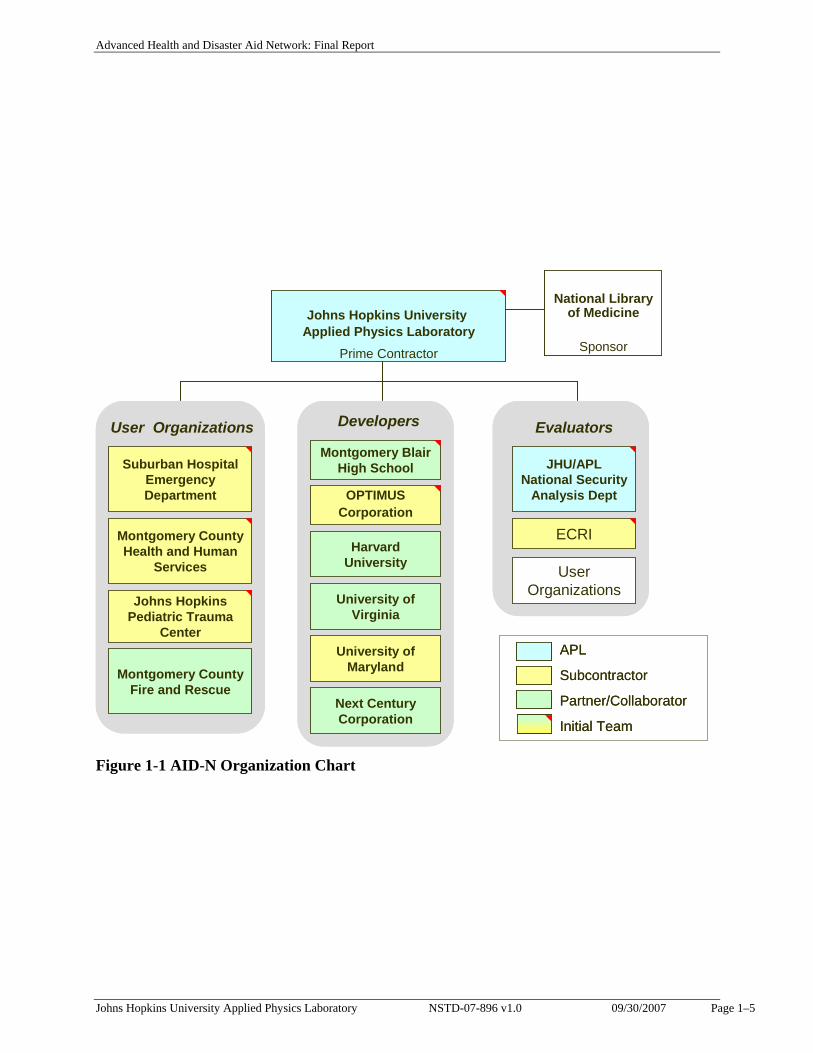
The Johns Hopkins University Applied Physics Laboratory (JHU/APL) was the lead organization and prime contractor for the AID-N project. Dr. David White was the Principal Investigator and Program Manager and Tia Gao, the Project Manager. As shown in Figure 1-1, the initial team organization included five subcontractors and one partner. Three of these subcontractors were from the local emergency medicine user community, namely, Suburban Hospital Emergency Department (Cindy Notobartolo and Patricia Hawes), Montgomery County Department of Health and Human Services (Kathy Hurt-Mullen), and the Johns Hopkins Medical Institutions (Dr. Harold Lehmann). The other two subcontractors were the ECRI Institute (Jonathan Gaev), an independent medical device testing company, and OPTIMUS Corporation (Cliff Andrews), developer of an existing ambulance triage system called Michaels. Montgomery Blair High School (Dr. Glenda Torrence) was a partner with the facilities for conducting field tests and as a significant resource for summer interns owing to their magnet program in science, mathematics, and computer science. All of these organizations are located in the State of Maryland except the ECRI Institute, located in Plymouth Meeting, Pennsylvania. During the project we formed a number of collaborative efforts with additional interested user groups and developers, who became critical members of the team. Referring to Table 1-1, these include collaborations with Harvard University (Matt Welsh, PhD) on the CodeBlue wireless mesh network and mote development; University of Virginia (Leo Selavo, PhD) on circuit board design and development; Montgomery County Department of Homeland Security (Gordon Aoyagi, Director) who approved EMS support and provided scenario guidance; Montgomery County Fire and Rescue (Chief Daniel Blankfeld) who provided and organized all EMS personnel participating in the field test; University of Maryland (Gilmer Blankenship, PhD and David Tahmoush, PhD) on software development; and Marco de Palma, Next Century Corporation and Marti Szczur, National Library of Medicine on the WISER hazmat PDA. We also consulted with a number of valued advisors including Knox Andress, R.N., Christus Schumpert Health System on emergency medicine and concept formulation; Charles ‘Chuck’ Paidas, M.D., University of Southern Florida, Tampa, Director Pediatric Surgery on trauma care and emergency response scenarios; David Aylward and Judith Woodhall, ComCare Alliance on emergency response requirements and data standards; Ron Stickley, Arlington Emergency Medical Services on EMS practices and procedures; and Jerry Overton, Executive Director, Richmond Ambulance Authority on EMS practices and technology insertion. The project was organized as a three phase effort covering requirements analysis, technology development, and test and evaluation. Defining the requirements and evaluating prototypes used a hands-on process with the user community.
Advanced Health and Disaster Aid Network: Final Report
Johns Hopkins University Applied Physics Laboratory NSTD-07-896 v1.0 09/30/2007 Page 1–5
Johns Hopkins University Applied Physics Laboratory
Prime Contractor
JHU/APL National Security
Analysis Dept
ECRIMontgomery County Health and Human
Services
Suburban Hospital Emergency Department
Johns Hopkins Pediatric Trauma
Center
Montgomery Blair High School
APL
Subcontractor
Partner/Collaborator
Initial Team
User Organizations
Montgomery County Fire and Rescue
OPTIMUSCorporation
Harvard University
University of Maryland
University of Virginia
Developers Evaluators
Next Century Corporation
User Organizations
National Library of Medicine
Sponsor
Figure 1-1 AID-N Organization Chart
Advanced Health and Disaster Aid Network: Final Report
Johns Hopkins University Applied Physics Laboratory NSTD-L-22646 v1.0 09/30/2007 Page 1–6
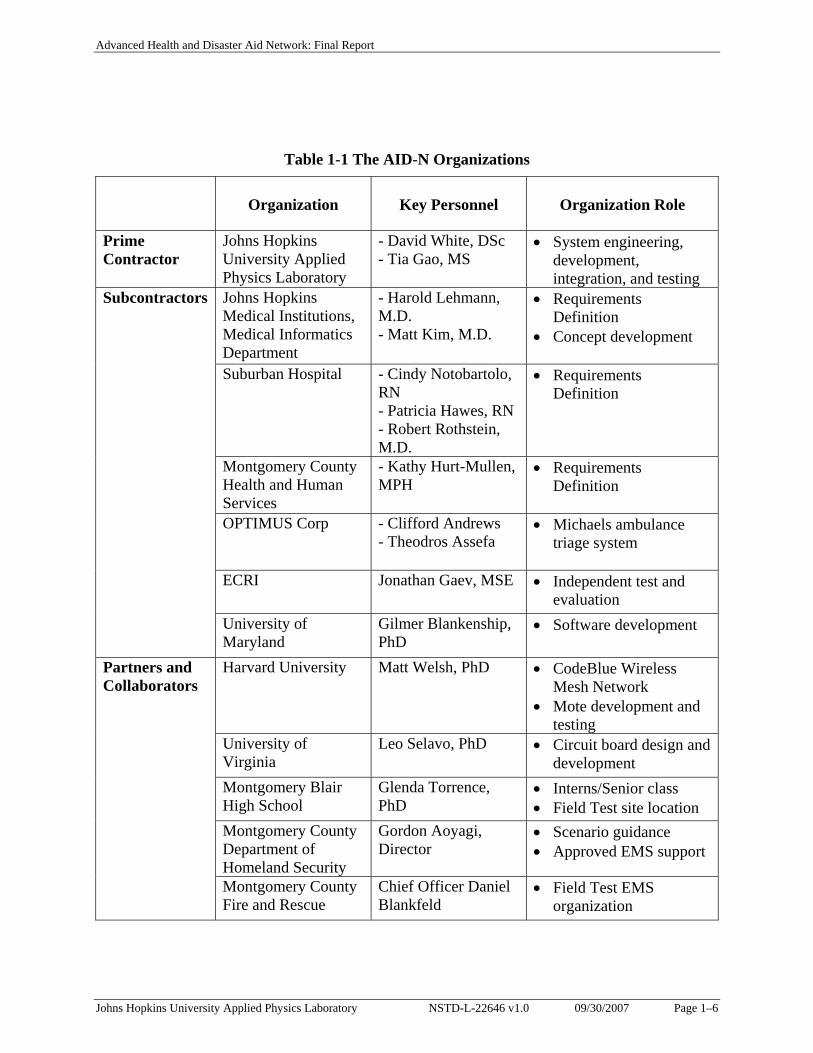
Table 1-1 The AID-N Organizations
Organization
Key Personnel
Organization Role
Prime Contractor
Johns Hopkins University Applied Physics Laboratory
- David White, DSc - Tia Gao, MS
• System engineering, development, integration, and testing
Johns Hopkins Medical Institutions, Medical Informatics Department
- Harold Lehmann, M.D. - Matt Kim, M.D.
• Requirements Definition
• Concept development
Suburban Hospital - Cindy Notobartolo, RN - Patricia Hawes, RN - Robert Rothstein, M.D.
• Requirements Definition
Montgomery County Health and Human Services
- Kathy Hurt-Mullen, MPH
• Requirements Definition
OPTIMUS Corp - Clifford Andrews
- Theodros Assefa • Michaels ambulance
triage system
ECRI Jonathan Gaev, MSE • Independent test and evaluation
Subcontractors
University of Maryland
Gilmer Blankenship, PhD
• Software development
Harvard University Matt Welsh, PhD • CodeBlue Wireless Mesh Network
• Mote development and testing
University of Virginia
Leo Selavo, PhD • Circuit board design and development
Montgomery Blair High School
Glenda Torrence, PhD
• Interns/Senior class • Field Test site location
Montgomery County Department of Homeland Security
Gordon Aoyagi, Director
• Scenario guidance • Approved EMS support
Partners and Collaborators
Montgomery County Fire and Rescue
Chief Officer Daniel Blankfeld
• Field Test EMS organization
Advanced Health and Disaster Aid Network: Final Report
Johns Hopkins University Applied Physics Laboratory NSTD-07-896 v1.0 09/30/2007 Page 1–7
University of Maryland
David Tahmoush • SIRP development
Next Century Corporation
Marco de Palma, Vice President Operations
• WISER hazmat PDA integration
Charles ‘Chuck’ Paidas, M.D.
University of Southern Florida, Tampa, Director Pediatric Surgery
• Trauma care • Emergency response
scenarios
Knox Andress, R.N. Christus Schumpert Health System, Shreveport, LA, ED Nurse, WMD Response Coordinator
• Scenario development • Emergency response
practices
David Aylward, Esq. Judith Woodhall
ComCare Alliance, Director Managing Director
• Emergency response community collaboration
• Data Standards Ron Stickley Lord Fairfax
Emergency Medical Services, Systems Planner
• EMS practices and procedures
Advisors/ Reviewers
Jerry Overton Richmond Ambulance Authority, Executive Director
• EMS practices and procedures
• Technology requirements
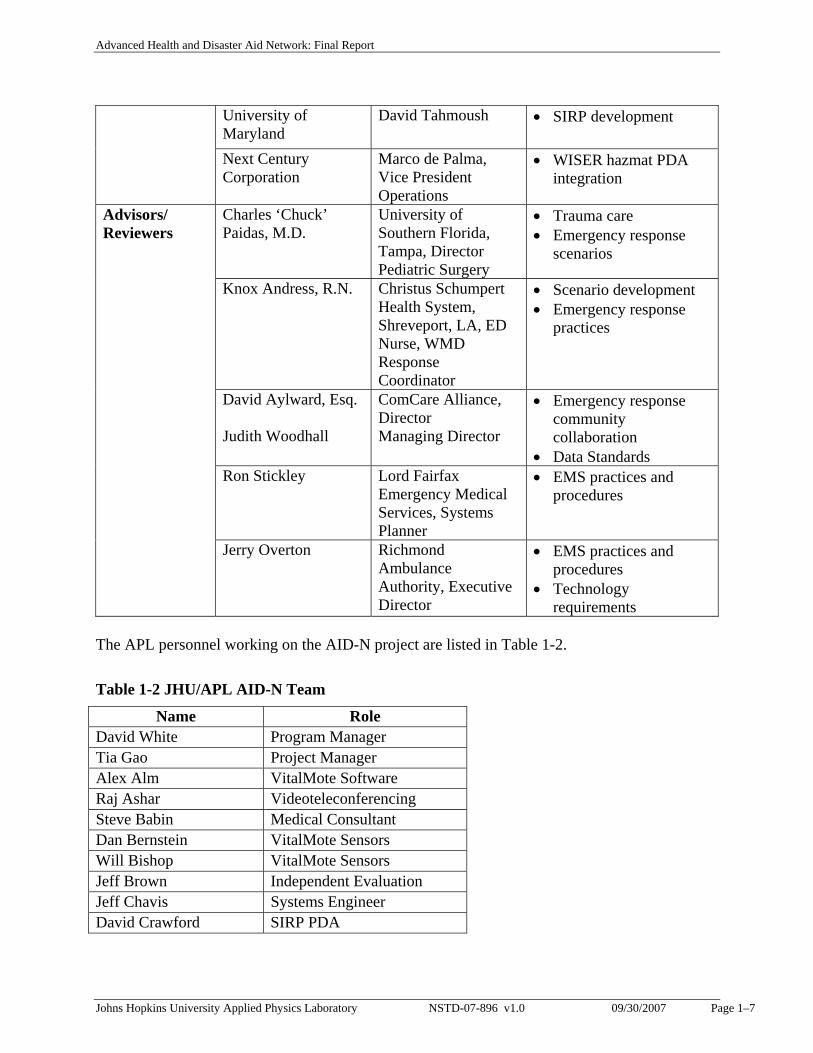
The APL personnel working on the AID-N project are listed in Table 1-2.
Table 1-2 JHU/APL AID-N Team
Name Role David White Program Manager Tia Gao Project Manager Alex Alm VitalMote Software Raj Ashar Videoteleconferencing Steve Babin Medical Consultant Dan Bernstein VitalMote Sensors Will Bishop VitalMote Sensors Jeff Brown Independent Evaluation Jeff Chavis Systems Engineer David Crawford SIRP PDA
Advanced Health and Disaster Aid Network: Final Report
Johns Hopkins University Applied Physics Laboratory NSTD-07-896 v1.0 09/30/2007 Page 2–8
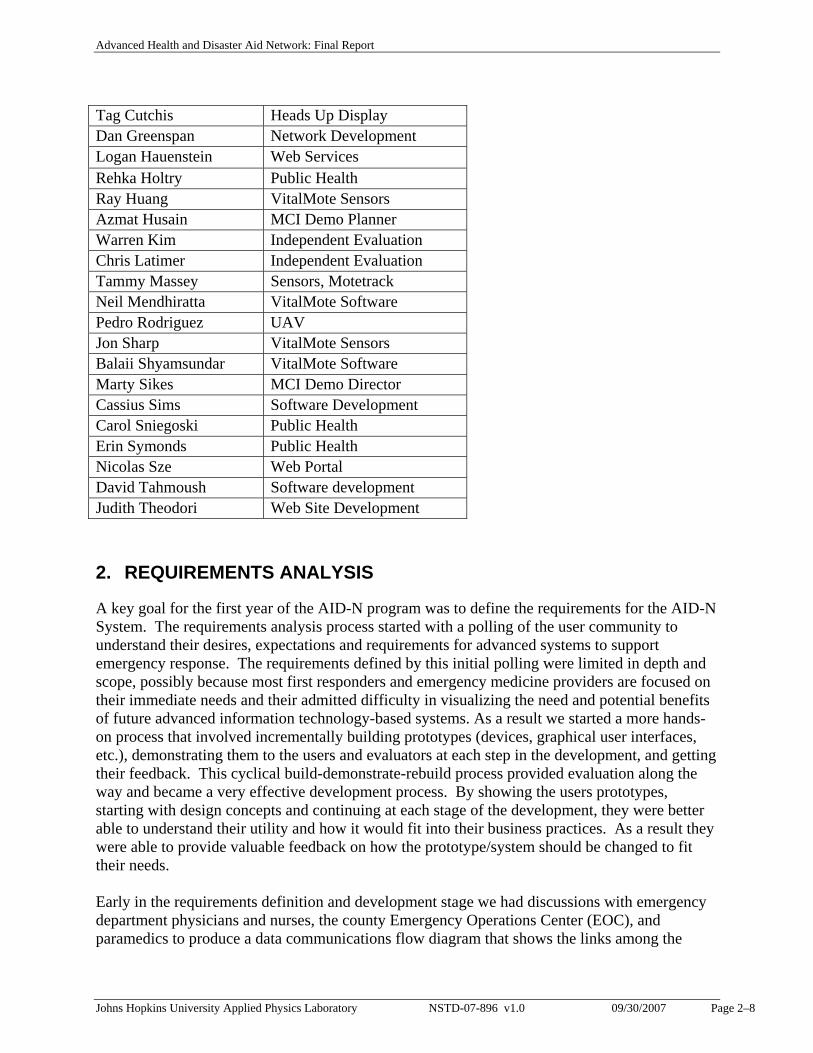
Tag Cutchis Heads Up Display Dan Greenspan Network Development Logan Hauenstein Web Services Rehka Holtry Public Health Ray Huang VitalMote Sensors Azmat Husain MCI Demo Planner Warren Kim Independent Evaluation Chris Latimer Independent Evaluation Tammy Massey Sensors, Motetrack Neil Mendhiratta VitalMote Software Pedro Rodriguez UAV Jon Sharp VitalMote Sensors Balaii Shyamsundar VitalMote Software Marty Sikes MCI Demo Director Cassius Sims Software Development Carol Sniegoski Public Health Erin Symonds Public Health Nicolas Sze Web Portal David Tahmoush Software development Judith Theodori Web Site Development
2. REQUIREMENTS ANALYSIS
A key goal for the first year of the AID-N program was to define the requirements for the AID-N System. The requirements analysis process started with a polling of the user community to understand their desires, expectations and requirements for advanced systems to support emergency response. The requirements defined by this initial polling were limited in depth and scope, possibly because most first responders and emergency medicine providers are focused on their immediate needs and their admitted difficulty in visualizing the need and potential benefits of future advanced information technology-based systems. As a result we started a more hands-on process that involved incrementally building prototypes (devices, graphical user interfaces, etc.), demonstrating them to the users and evaluators at each step in the development, and getting their feedback. This cyclical build-demonstrate-rebuild process provided evaluation along the way and became a very effective development process. By showing the users prototypes, starting with design concepts and continuing at each stage of the development, they were better able to understand their utility and how it would fit into their business practices. As a result they were able to provide valuable feedback on how the prototype/system should be changed to fit their needs. Early in the requirements definition and development stage we had discussions with emergency department physicians and nurses, the county Emergency Operations Center (EOC), and paramedics to produce a data communications flow diagram that shows the links among the
Advanced Health and Disaster Aid Network: Final Report
Johns Hopkins University Applied Physics Laboratory NSTD-07-896 v1.0 09/30/2007 Page 2–9
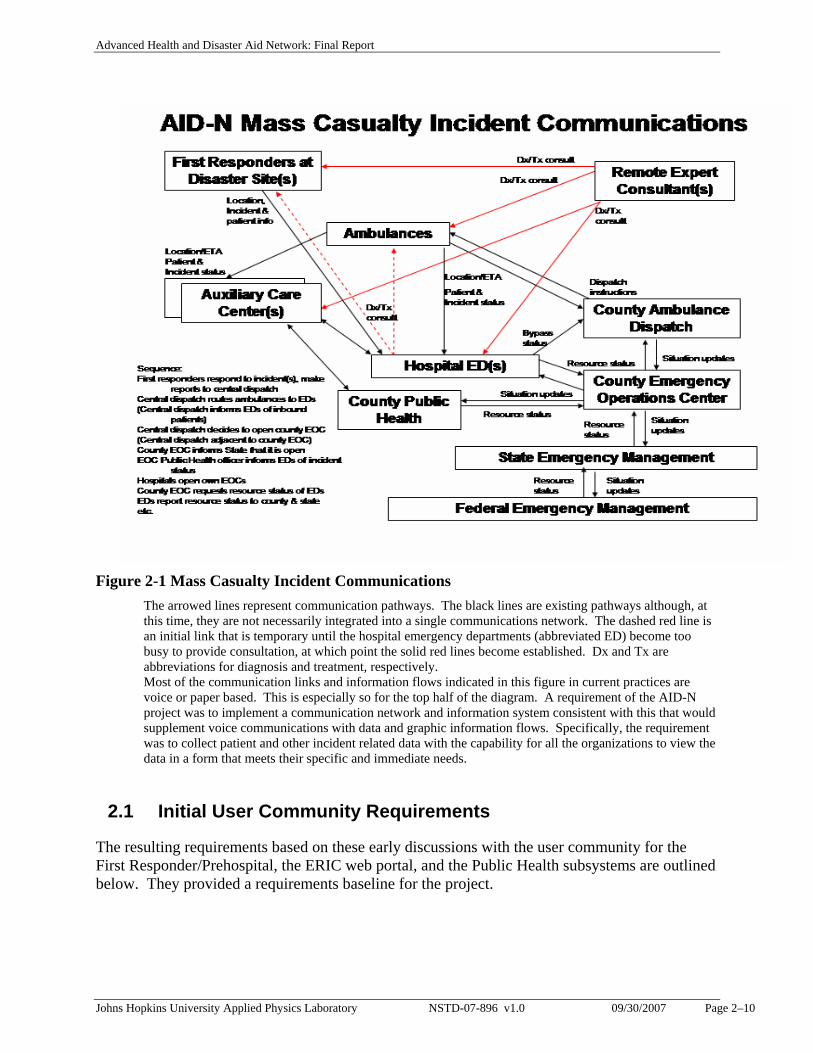
variety of organizations and groups that communicate with each other during emergency situations. Note that the resulting diagram, Figure 2-1, was not intended to be all encompassing. For example, the agencies involved and their communications pathways vary with the type and severity of the mass casualty situation. If it were a chemical spill, then decontamination and cleanup agencies would be involved. If it were a biological cause, then infection control agencies would be involved. 6, 7 The Figure illustrates the current emergency response information pathways in Montgomery County, Maryland pertinent to the AID-N project. At the disaster site, the first responders will make their reports to central dispatch. Central dispatch is operated by the County and informs the hospital emergency departments (EDs) of the incoming patients. Once a significant situation is realized, central dispatch will make a determination whether to open the County Emergency Operations Center (EOC). The County EOC is located adjacent to central dispatch. Once the County EOC opens, personnel there notify the State that they are open, their reasons for opening, and their status. If the incident involves a public health situation, County Public Health is notified, opens its own center, and informs hospital EDs of the situation. In addition, each hospital opens its own EOC in order to coordinate the large numbers of incoming patients. The County EOC will periodically request the resource status of the hospitals. The County will report the incident and resource status to the State Emergency Management. Depending on the patient numbers and geographic extent of the incident, State Emergency Management may contact Federal Emergency Management for assistance.
Advanced Health and Disaster Aid Network: Final Report
Johns Hopkins University Applied Physics Laboratory NSTD-07-896 v1.0 09/30/2007 Page 2–10
Figure 2-1 Mass Casualty Incident Communications
The arrowed lines represent communication pathways. The black lines are existing pathways although, at this time, they are not necessarily integrated into a single communications network. The dashed red line is an initial link that is temporary until the hospital emergency departments (abbreviated ED) become too busy to provide consultation, at which point the solid red lines become established. Dx and Tx are abbreviations for diagnosis and treatment, respectively. Most of the communication links and information flows indicated in this figure in current practices are voice or paper based. This is especially so for the top half of the diagram. A requirement of the AID-N project was to implement a communication network and information system consistent with this that would supplement voice communications with data and graphic information flows. Specifically, the requirement was to collect patient and other incident related data with the capability for all the organizations to view the data in a form that meets their specific and immediate needs.
2.1 Initial User Community Requirements
The resulting requirements based on these early discussions with the user community for the First Responder/Prehospital, the ERIC web portal, and the Public Health subsystems are outlined below. They provided a requirements baseline for the project.
Advanced Health and Disaster Aid Network: Final Report
Johns Hopkins University Applied Physics Laboratory NSTD-07-896 v1.0 09/30/2007 Page 2–11
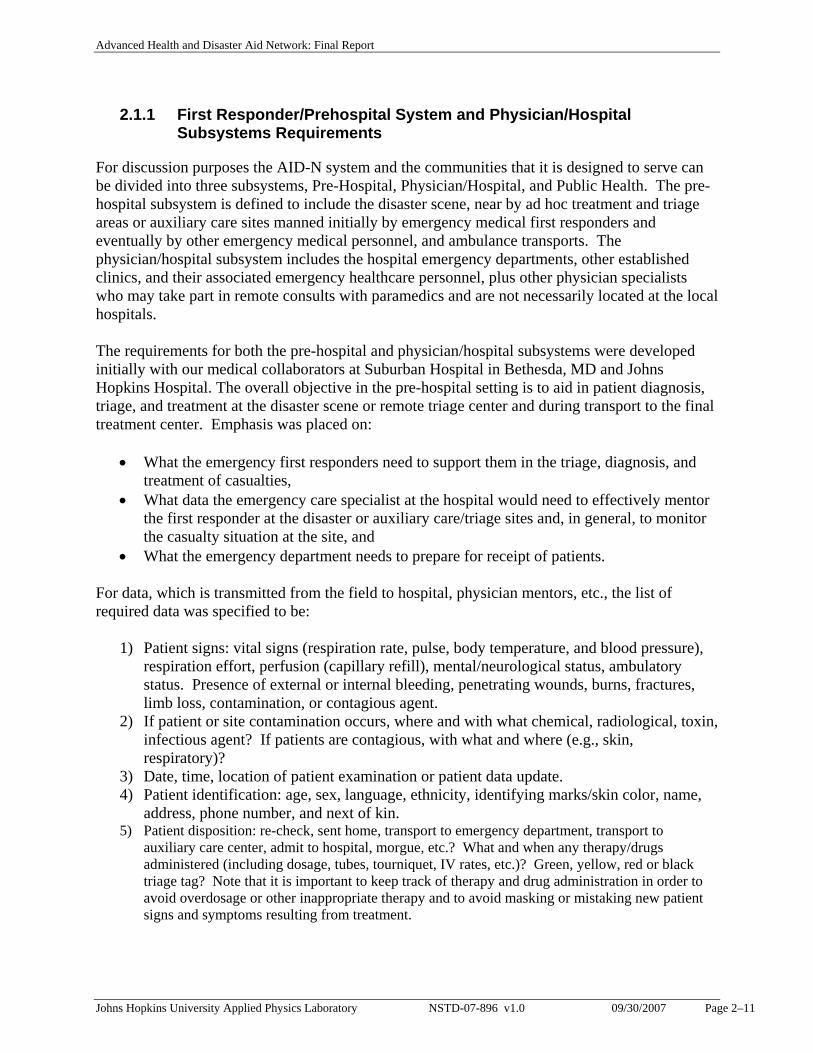
2.1.1 First Responder/Prehospital System and Physician/Hospital Subsystems Requirements
For discussion purposes the AID-N system and the communities that it is designed to serve can be divided into three subsystems, Pre-Hospital, Physician/Hospital, and Public Health. The pre-hospital subsystem is defined to include the disaster scene, near by ad hoc treatment and triage areas or auxiliary care sites manned initially by emergency medical first responders and eventually by other emergency medical personnel, and ambulance transports. The physician/hospital subsystem includes the hospital emergency departments, other established clinics, and their associated emergency healthcare personnel, plus other physician specialists who may take part in remote consults with paramedics and are not necessarily located at the local hospitals. The requirements for both the pre-hospital and physician/hospital subsystems were developed initially with our medical collaborators at Suburban Hospital in Bethesda, MD and Johns Hopkins Hospital. The overall objective in the pre-hospital setting is to aid in patient diagnosis, triage, and treatment at the disaster scene or remote triage center and during transport to the final treatment center. Emphasis was placed on:
• What the emergency first responders need to support them in the triage, diagnosis, and treatment of casualties,
• What data the emergency care specialist at the hospital would need to effectively mentor the first responder at the disaster or auxiliary care/triage sites and, in general, to monitor the casualty situation at the site, and
• What the emergency department needs to prepare for receipt of patients. For data, which is transmitted from the field to hospital, physician mentors, etc., the list of required data was specified to be:
1) Patient signs: vital signs (respiration rate, pulse, body temperature, and blood pressure), respiration effort, perfusion (capillary refill), mental/neurological status, ambulatory status. Presence of external or internal bleeding, penetrating wounds, burns, fractures, limb loss, contamination, or contagious agent.
2) If patient or site contamination occurs, where and with what chemical, radiological, toxin, infectious agent? If patients are contagious, with what and where (e.g., skin, respiratory)?
3) Date, time, location of patient examination or patient data update. 4) Patient identification: age, sex, language, ethnicity, identifying marks/skin color, name,
address, phone number, and next of kin. 5) Patient disposition: re-check, sent home, transport to emergency department, transport to
auxiliary care center, admit to hospital, morgue, etc.? What and when any therapy/drugs administered (including dosage, tubes, tourniquet, IV rates, etc.)? Green, yellow, red or black triage tag? Note that it is important to keep track of therapy and drug administration in order to avoid overdosage or other inappropriate therapy and to avoid masking or mistaking new patient signs and symptoms resulting from treatment.
Advanced Health and Disaster Aid Network: Final Report
Johns Hopkins University Applied Physics Laboratory NSTD-07-896 v1.0 09/30/2007 Page 2–12
6) Patient next of kin contact information. If patient is a child, any information on siblings, parents, adult relatives, guardians
7) Patient underlying conditions: pregnancy, diabetes, asthma, epilepsy, allergies, immunization status, chronic illness, etc.
The data specified to be transmitted in the reverse direction from hospital physicians, mentors, etc., to first responders and emergency medical personnel in the field, includes:
1) Quick testing instructions, if any, to aid in differential diagnosis determination 2) Requests for positioning of the patient for different camera views for video consults 3) Requests for any additional patient information (e.g., history, signs, symptoms) that
might be needed for triage or differential diagnosis 4) Triage and disposition instructions, including where to send the patient (e.g., home,
auxiliary treatment facility, hospital, decontamination, etc.) 5) Treatment instructions, if any
2.1.2 Emergency Response Information Center Subsystem Requirements
The Emergency Response Information Center (ERIC) is an information portal for situational awareness and unified control of the emergency medical response activities of hospital emergency departments, auxiliary care centers, first responders, public health, and disease surveillance activities, and the communications system during a mass casualty situation. The ERIC requirements are to provide:
1) Access to various resource databases, such as the Facility Resource Emergency Database (FRED), an existing hospital resource availability database operated by Maryland Institute for Emergency Medical System (MIEMSS).
2) A real-time directory of services and contacts to permit all other services (and participating organizations) to identify themselves to the collaborative environment. Other users and services will be able to access this directory and identify available information sources, defined information exchange protocols, domain experts and contact information. It is a prerequisite for establishing a common collaborative environment for AID-N. This directory service will include epidemiologists, Emergency Medical Technicians, Hospitals, and other medical and disaster response specialists.
3) Web based access to an existing syndromic surveillance system, ESSENCE (Electronic Surveillance System for the Early Notification of Community-based Epidemics). Information sent to ESSENCE from the AID-N system will include the number and chief complaint, where available, of the victims/patients at a disaster scene and in transport to local hospitals.
4) End-user interface and views, which are configurable by the user providing selection of specific data sets and specific users to collaborate with. Several different views will be available to the portal user, depending on the specific need on how the data should be displayed or analyzed, or whether the data is being accessed from a personal computer or handheld unit.
Advanced Health and Disaster Aid Network: Final Report
Johns Hopkins University Applied Physics Laboratory NSTD-07-896 v1.0 09/30/2007 Page 2–13
2.1.3 Public Health Subsystem Requirements
A primary goal of the AID-N project is to “Develop an advanced collaboration-oriented communication system to coordinate the activities of first line public health and emergency care providers in responding to mass casualty situations caused by terrorist attacks or natural disasters”. 8 As such, the public health subsystem of this project involves developing a thorough understanding of the communications needs of local public health agencies in mass casualty scenarios so as to ensure that these requirements are met by AID-N. Doing so is critical to developing a technologically sophisticated system that is highly applicable. A number of requirements gathering activities were carried out in order to determine current public health roles and their communication and information gathering tools and practices. These meetings and activities included: - Field clinic visits - Montgomery County Emergency Operations Center (EOC) visit
- Montgomery County's Strategic National Stockpile disaster response exercise (May 13, 2004) where we were able to Document inter-agency roles and communications needs in a disaster response tabletop exercise.
- Montgomery County's Mass Vaccination Clinic exercise (June 21, 2004) with the opportunity to observe operations in a public-health-led disaster response
- Montgomery County's Emergency Preparedness and Response team (July 22, 2004 and August 5, 2004) where we discussed public health’s role in emergency response, information and communication needs, current information-gathering and communication technologies, and potential improvements to be supported by AID-N.
- Suburban Hospital staff on hospital perspective on emergency response, including the hospital's use of Facility Resource Emergency Database (FRED), 9 in-hospital resource tracking, and communications with other public health and emergency response entities.
The overall responsibility of the County’s Public Health System is to act as the command and control authority for emergency response to public health threats related to the exposure of a population to biological agents and natural disasters. This includes:
• Determine the cause, spread, and public health threat of the biological agent. • Protect life and reduce health risks • Carry out ongoing disease surveillance • Coordinate the distribution of necessary medical and mental health care • Coordinate the dispersal of health-related information to the public, government officials,
and emergency response authorities • Assess the safety of environments and determine when hazards no longer exist. • Offer laboratory support and expertise on the identification and management of suspected
agents of bioterrorism
Advanced Health and Disaster Aid Network: Final Report
Johns Hopkins University Applied Physics Laboratory NSTD-07-896 v1.0 09/30/2007 Page 3–14
• Under the Bioterrorism Event Incident Command Structure, Public Health acts as Team Leader to both the Operations Team and the Planning Team
The following represent system specifications and functional requirements:
• A system that electronically captures patient information • A method for locating displaced family members • A method for tracking potentially infectious persons • A single communications system that simplifies message transfer process and indicates
priority level • Reliable communications devices and networks • A system that simplifies the process of making updates to the Emergency Operation
Center with regard to resources, needs, etc. by responsible agencies/persons. • Easily accessible real time data to determine critical resource needs • Capability to determine the progress of an Emergency Response in an easy and timely
fashion
3. TESTBED SYSTEM AND TECHNOLOGY DEVELOPMENT
3.1 AID-N Emergency Response System Description
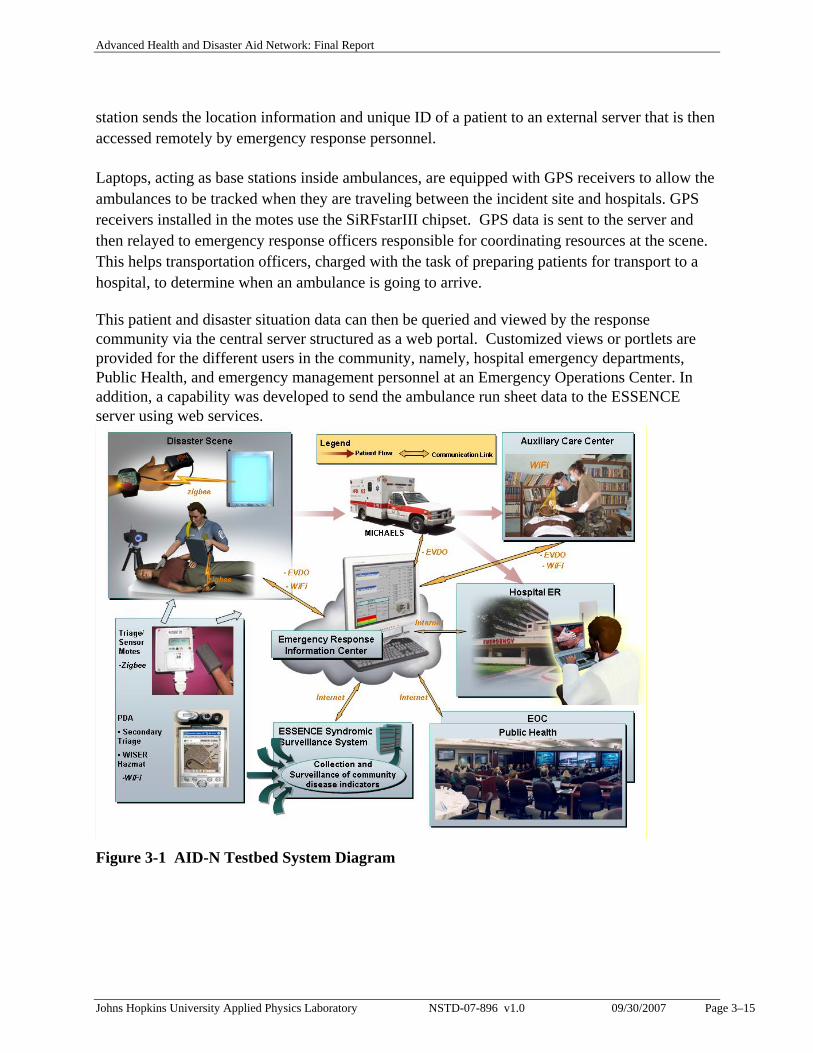
Figure 3-1 is an overview of the AID-N testbed system, the equipment developed, and the scope of the network. Electronic triage tags with built in pulse oximeter and GPS, shown in the bottom right corner, are placed on the wrist of patients at a scene. The patients triage level set by the paramedic, the heart rate and specific oxygen, and the location, all recorded in the electronic tag, are relayed to laptops at the scene via a Zigbee (802.15.4) personal area network (PAN) link. The laptops are manned by the Incident Commander and other EMS officers located at the scene. These laptops in turn send the information to a central server via the Internet using either EVDO broadband cellular links or local area network WiFi (802.11), if available at the scene. The handheld PDAs (called Surveillance Incident Reporting PDA or SIRP) are used by medics and assistants to collect patient chief complaint, record the treatment provided at the scene, and obtain identification information with the aid of a built-in driver-license barcode scanner and camera. Collectively this information establishes a pre-hospital patient record, which is continuously updated until the patient arrives at a care center or is dismissed from the scene under their own cognizance. 10
The location of patients wearing tags is based on either GPS sensors in the electronic triage tags or the proximity of the tags to: 1) handheld PDAs carried by medics, 2) base stations laptops installed inside ambulances coming in and out of the disaster site, 3) laptops stationed at designated zones of the disaster site, and 4) other tags in the wireless mesh network. Each base station and handheld PDA is also equipped with a GPS sensor. When a patient is triaged and their tag is turned on, the nearest base station registers that patient as residing nearby. Each tag contains a unique identification number that specifies a patient within the system. The base
Advanced Health and Disaster Aid Network: Final Report
Johns Hopkins University Applied Physics Laboratory NSTD-07-896 v1.0 09/30/2007 Page 3–15
station sends the location information and unique ID of a patient to an external server that is then accessed remotely by emergency response personnel.
Laptops, acting as base stations inside ambulances, are equipped with GPS receivers to allow the ambulances to be tracked when they are traveling between the incident site and hospitals. GPS receivers installed in the motes use the SiRFstarIII chipset. GPS data is sent to the server and then relayed to emergency response officers responsible for coordinating resources at the scene. This helps transportation officers, charged with the task of preparing patients for transport to a hospital, to determine when an ambulance is going to arrive.
This patient and disaster situation data can then be queried and viewed by the response community via the central server structured as a web portal. Customized views or portlets are provided for the different users in the community, namely, hospital emergency departments, Public Health, and emergency management personnel at an Emergency Operations Center. In addition, a capability was developed to send the ambulance run sheet data to the ESSENCE server using web services.
Figure 3-1 AID-N Testbed System Diagram
Advanced Health and Disaster Aid Network: Final Report
Johns Hopkins University Applied Physics Laboratory NSTD-07-896 v1.0 09/30/2007 Page 3–16
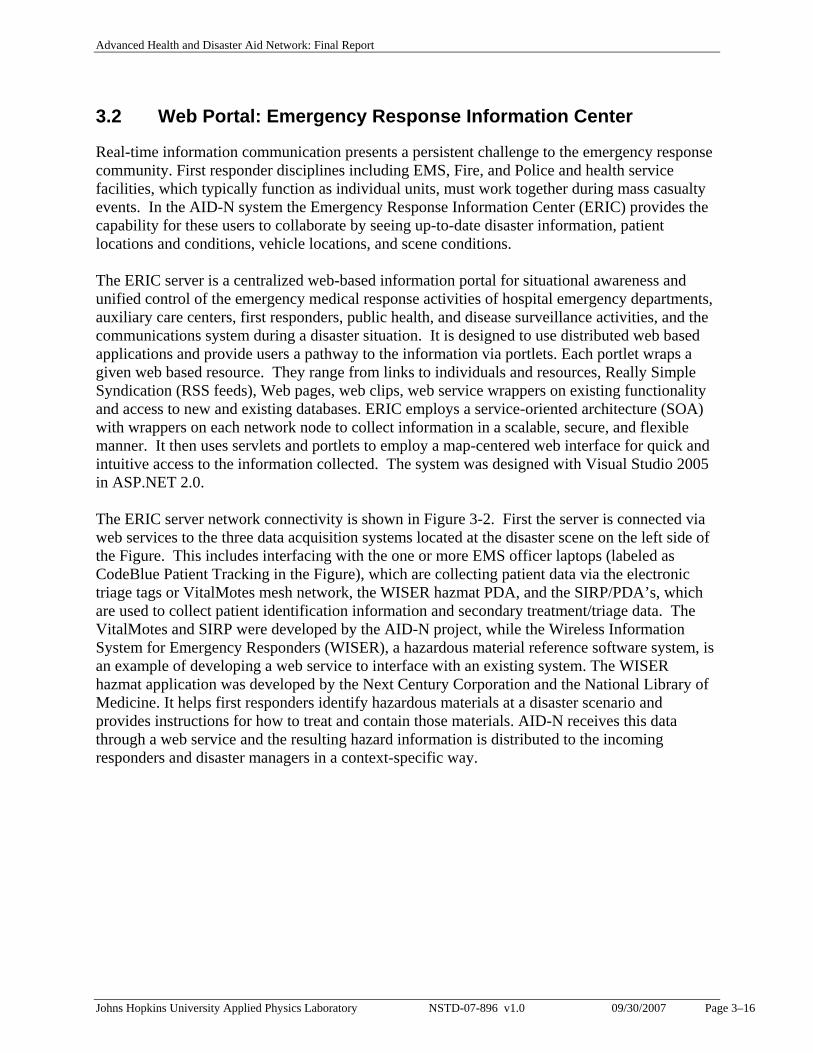
3.2 Web Portal: Emergency Response Information Center
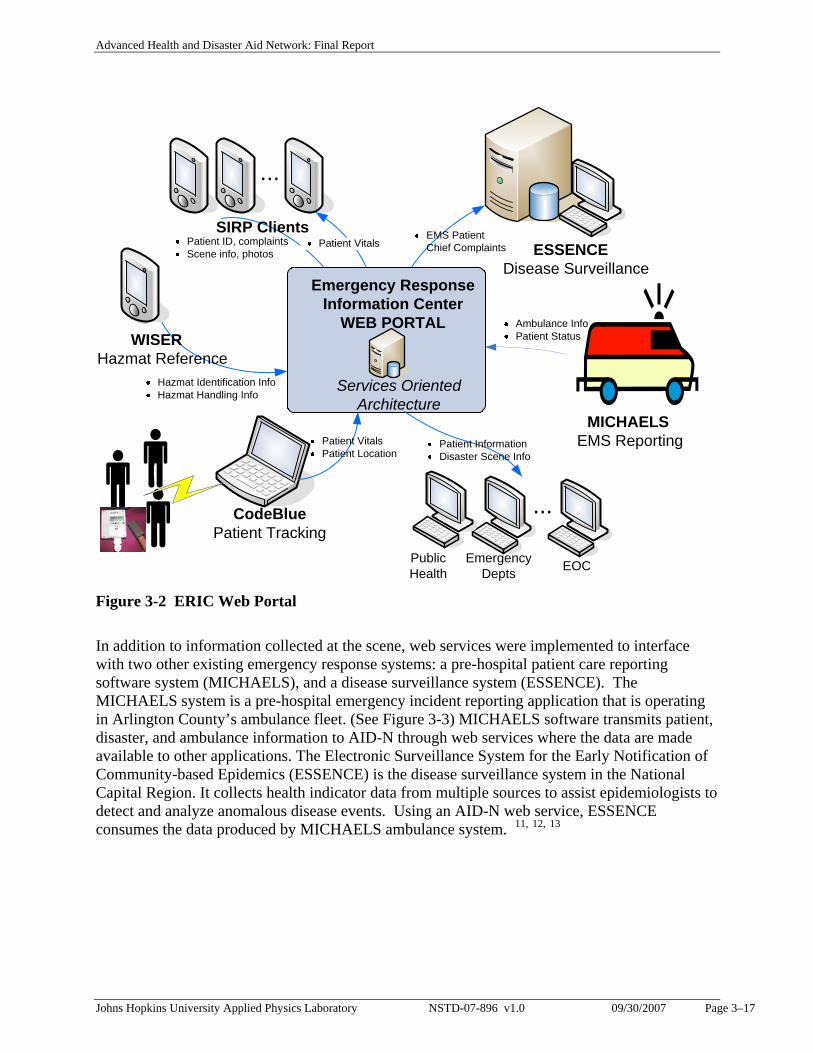
Real-time information communication presents a persistent challenge to the emergency response community. First responder disciplines including EMS, Fire, and Police and health service facilities, which typically function as individual units, must work together during mass casualty events. In the AID-N system the Emergency Response Information Center (ERIC) provides the capability for these users to collaborate by seeing up-to-date disaster information, patient locations and conditions, vehicle locations, and scene conditions. The ERIC server is a centralized web-based information portal for situational awareness and unified control of the emergency medical response activities of hospital emergency departments, auxiliary care centers, first responders, public health, and disease surveillance activities, and the communications system during a disaster situation. It is designed to use distributed web based applications and provide users a pathway to the information via portlets. Each portlet wraps a given web based resource. They range from links to individuals and resources, Really Simple Syndication (RSS feeds), Web pages, web clips, web service wrappers on existing functionality and access to new and existing databases. ERIC employs a service-oriented architecture (SOA) with wrappers on each network node to collect information in a scalable, secure, and flexible manner. It then uses servlets and portlets to employ a map-centered web interface for quick and intuitive access to the information collected. The system was designed with Visual Studio 2005 in ASP.NET 2.0. The ERIC server network connectivity is shown in Figure 3-2. First the server is connected via web services to the three data acquisition systems located at the disaster scene on the left side of the Figure. This includes interfacing with the one or more EMS officer laptops (labeled as CodeBlue Patient Tracking in the Figure), which are collecting patient data via the electronic triage tags or VitalMotes mesh network, the WISER hazmat PDA, and the SIRP/PDA’s, which are used to collect patient identification information and secondary treatment/triage data. The VitalMotes and SIRP were developed by the AID-N project, while the Wireless Information System for Emergency Responders (WISER), a hazardous material reference software system, is an example of developing a web service to interface with an existing system. The WISER hazmat application was developed by the Next Century Corporation and the National Library of Medicine. It helps first responders identify hazardous materials at a disaster scenario and provides instructions for how to treat and contain those materials. AID-N receives this data through a web service and the resulting hazard information is distributed to the incoming responders and disaster managers in a context-specific way.
Advanced Health and Disaster Aid Network: Final Report
Johns Hopkins University Applied Physics Laboratory NSTD-07-896 v1.0 09/30/2007 Page 3–17
ESSENCEDisease Surveillance
MICHAELSEMS Reporting
WISER
Patient Vitals
Emergency Response Information Center
WEB PORTAL
Services Oriented Architecture
SIRP Clients
...
CodeBluePatient Tracking
...
Patient ID, complaintsScene info, photos
EMS Patient Chief Complaints
Hazmat Identification InfoHazmat Handling Info
Hazmat Reference
Patient InformationDisaster Scene Info
Ambulance InfoPatient Status
Patient VitalsPatient Location
Public Health EOCEmergency
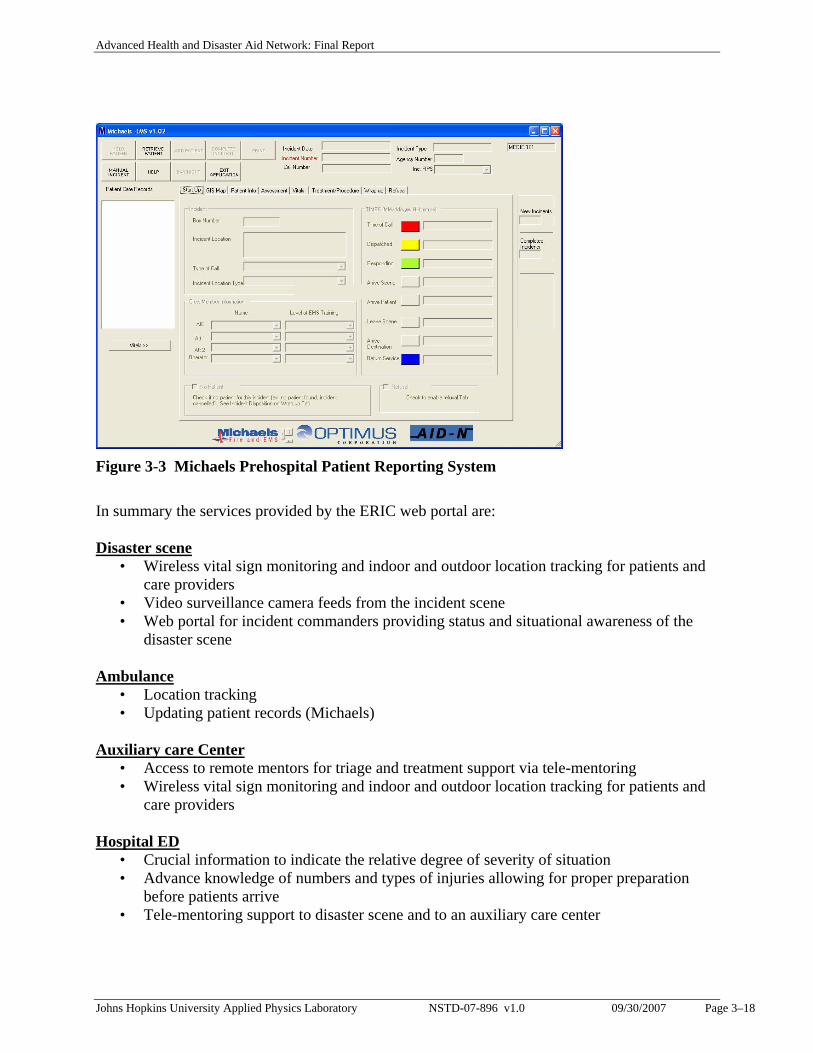
Depts Figure 3-2 ERIC Web Portal In addition to information collected at the scene, web services were implemented to interface with two other existing emergency response systems: a pre-hospital patient care reporting software system (MICHAELS), and a disease surveillance system (ESSENCE). The MICHAELS system is a pre-hospital emergency incident reporting application that is operating in Arlington County’s ambulance fleet. (See Figure 3-3) MICHAELS software transmits patient, disaster, and ambulance information to AID-N through web services where the data are made available to other applications. The Electronic Surveillance System for the Early Notification of Community-based Epidemics (ESSENCE) is the disease surveillance system in the National Capital Region. It collects health indicator data from multiple sources to assist epidemiologists to detect and analyze anomalous disease events. Using an AID-N web service, ESSENCE consumes the data produced by MICHAELS ambulance system. 11, 12, 13
Advanced Health and Disaster Aid Network: Final Report
Johns Hopkins University Applied Physics Laboratory NSTD-07-896 v1.0 09/30/2007 Page 3–18
Figure 3-3 Michaels Prehospital Patient Reporting System In summary the services provided by the ERIC web portal are: Disaster scene
• Wireless vital sign monitoring and indoor and outdoor location tracking for patients and care providers
• Video surveillance camera feeds from the incident scene • Web portal for incident commanders providing status and situational awareness of the
disaster scene Ambulance
• Location tracking • Updating patient records (Michaels)
Auxiliary care Center
• Access to remote mentors for triage and treatment support via tele-mentoring • Wireless vital sign monitoring and indoor and outdoor location tracking for patients and
care providers Hospital ED
• Crucial information to indicate the relative degree of severity of situation • Advance knowledge of numbers and types of injuries allowing for proper preparation
before patients arrive • Tele-mentoring support to disaster scene and to an auxiliary care center
Advanced Health and Disaster Aid Network: Final Report
Johns Hopkins University Applied Physics Laboratory NSTD-07-896 v1.0 09/30/2007 Page 3–19
Public Health & EOC • Web portal for public health providing situational monitoring and awareness • ESSENCE interface for report generation, presentation, and dissemination
Auxiliary Information
• List of active incidents in the region • Start time, current time and elapsed time for the local incident • Weather conditions and alerts • Traffic alerts.
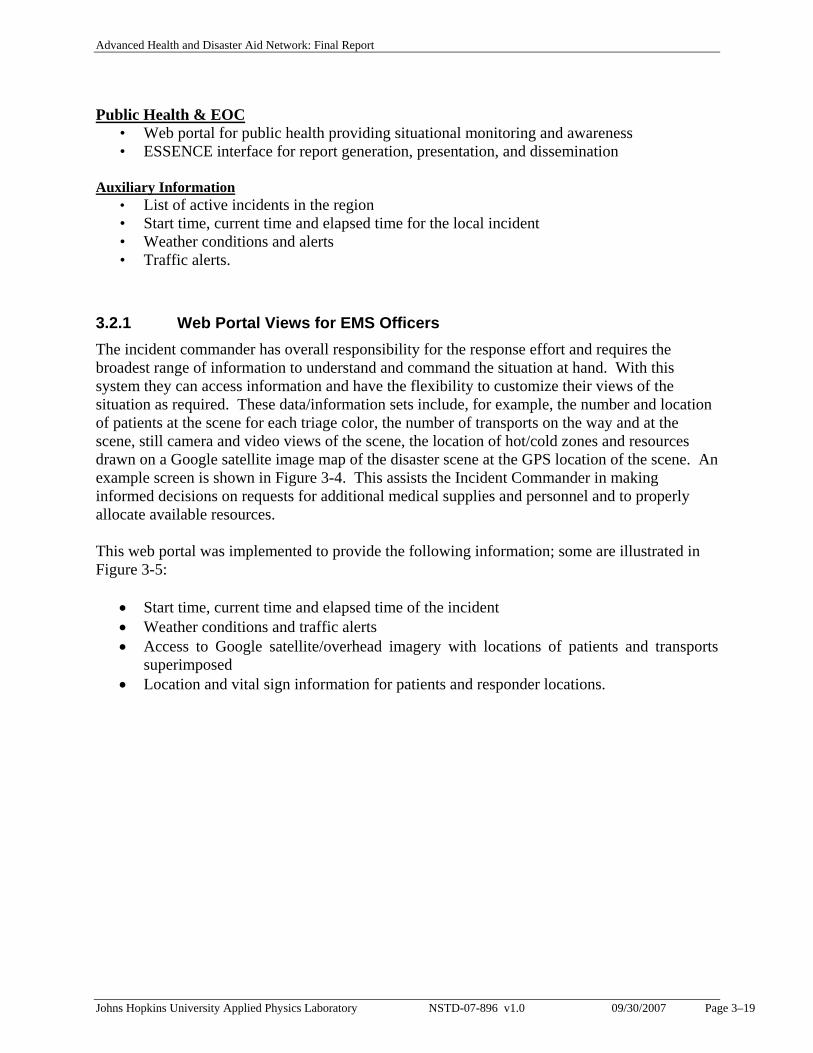
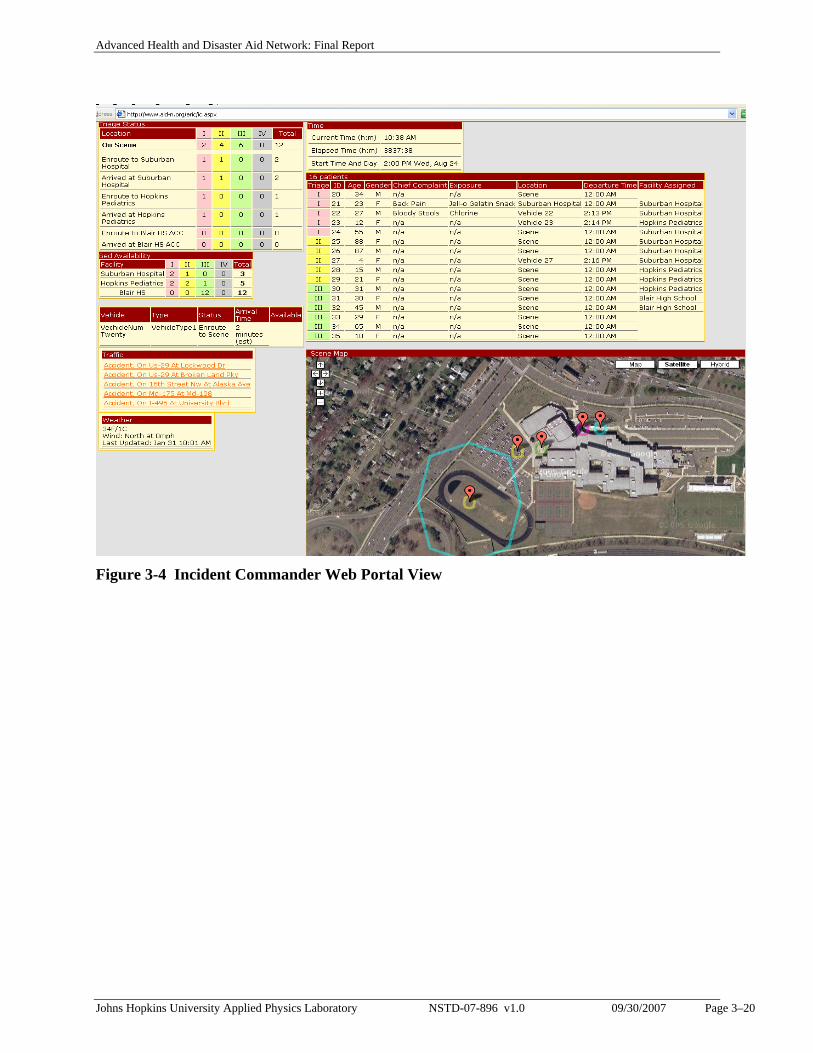
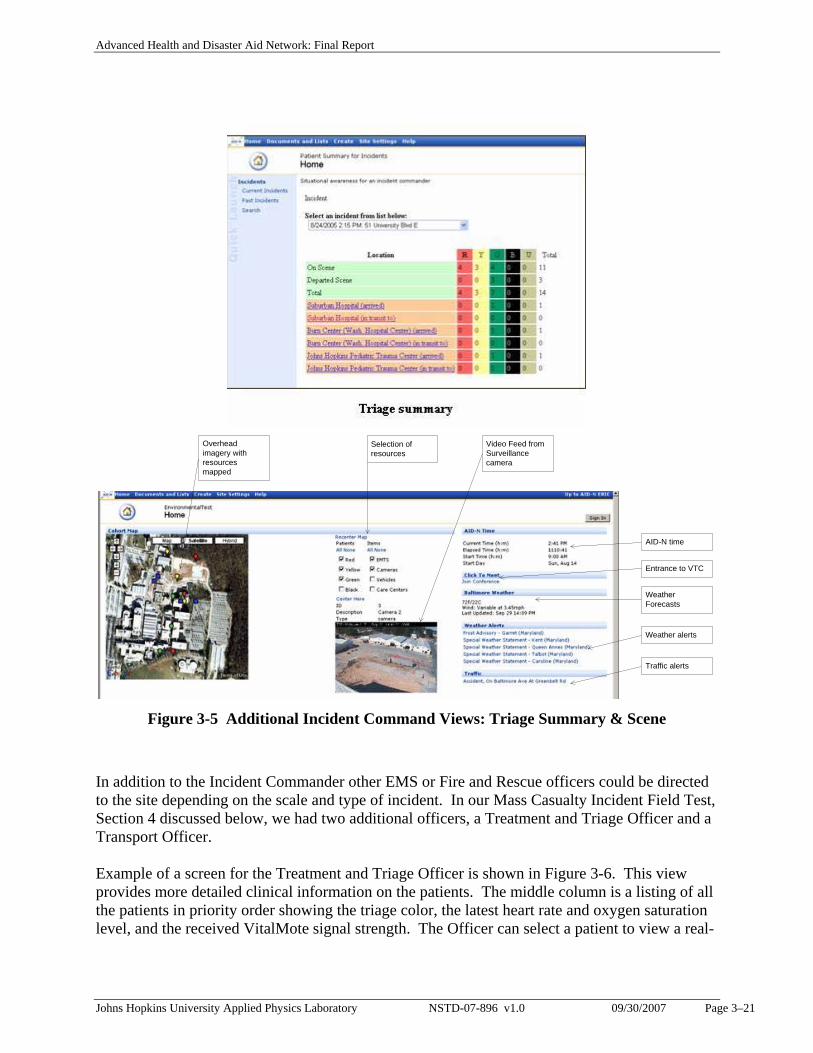
3.2.1 Web Portal Views for EMS Officers The incident commander has overall responsibility for the response effort and requires the broadest range of information to understand and command the situation at hand. With this system they can access information and have the flexibility to customize their views of the situation as required. These data/information sets include, for example, the number and location of patients at the scene for each triage color, the number of transports on the way and at the scene, still camera and video views of the scene, the location of hot/cold zones and resources drawn on a Google satellite image map of the disaster scene at the GPS location of the scene. An example screen is shown in Figure 3-4. This assists the Incident Commander in making informed decisions on requests for additional medical supplies and personnel and to properly allocate available resources. This web portal was implemented to provide the following information; some are illustrated in Figure 3-5:
• Start time, current time and elapsed time of the incident • Weather conditions and traffic alerts • Access to Google satellite/overhead imagery with locations of patients and transports
superimposed • Location and vital sign information for patients and responder locations.
Advanced Health and Disaster Aid Network: Final Report
Johns Hopkins University Applied Physics Laboratory NSTD-07-896 v1.0 09/30/2007 Page 3–20
Figure 3-4 Incident Commander Web Portal View
Advanced Health and Disaster Aid Network: Final Report
Johns Hopkins University Applied Physics Laboratory NSTD-07-896 v1.0 09/30/2007 Page 3–21
Overhead imagery with resources mapped
Video Feed from Surveillance camera
Selection of resources
Entrance to VTC
Weather Forecasts
Weather alerts
Traffic alerts
AID-N time
Figure 3-5 Additional Incident Command Views: Triage Summary & Scene
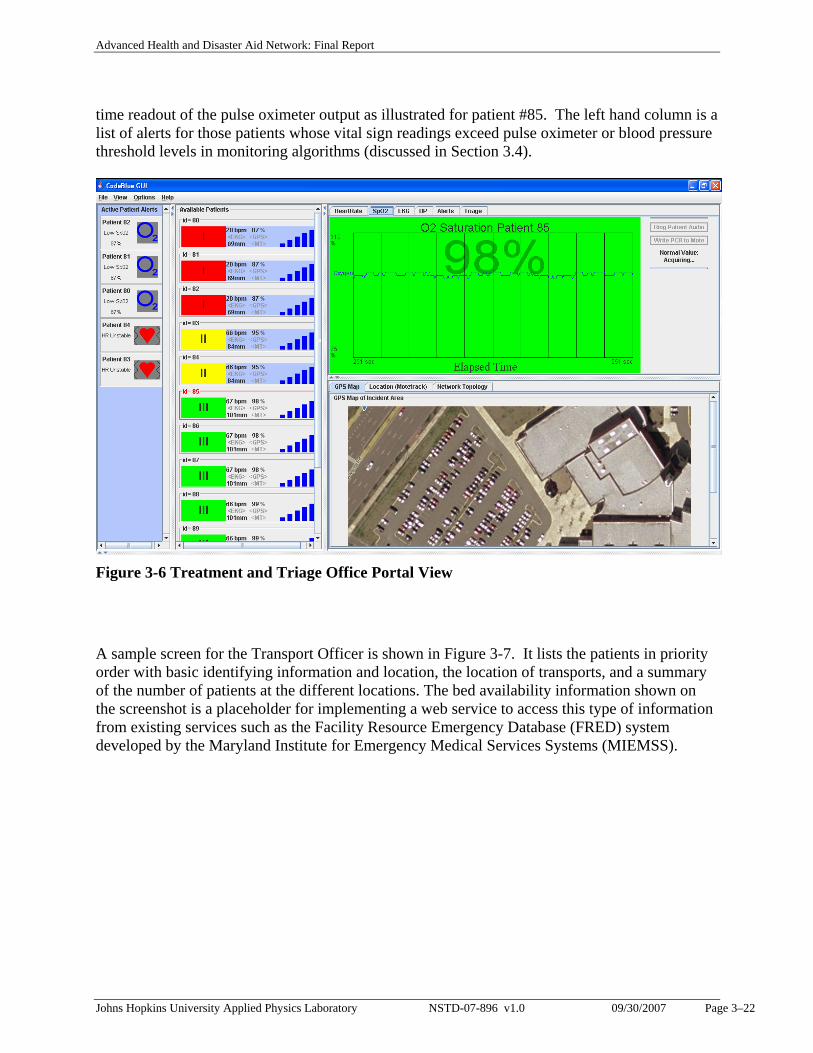
In addition to the Incident Commander other EMS or Fire and Rescue officers could be directed to the site depending on the scale and type of incident. In our Mass Casualty Incident Field Test, Section 4 discussed below, we had two additional officers, a Treatment and Triage Officer and a Transport Officer. Example of a screen for the Treatment and Triage Officer is shown in Figure 3-6. This view provides more detailed clinical information on the patients. The middle column is a listing of all the patients in priority order showing the triage color, the latest heart rate and oxygen saturation level, and the received VitalMote signal strength. The Officer can select a patient to view a real-
Advanced Health and Disaster Aid Network: Final Report
Johns Hopkins University Applied Physics Laboratory NSTD-07-896 v1.0 09/30/2007 Page 3–22
time readout of the pulse oximeter output as illustrated for patient #85. The left hand column is a list of alerts for those patients whose vital sign readings exceed pulse oximeter or blood pressure threshold levels in monitoring algorithms (discussed in Section 3.4).
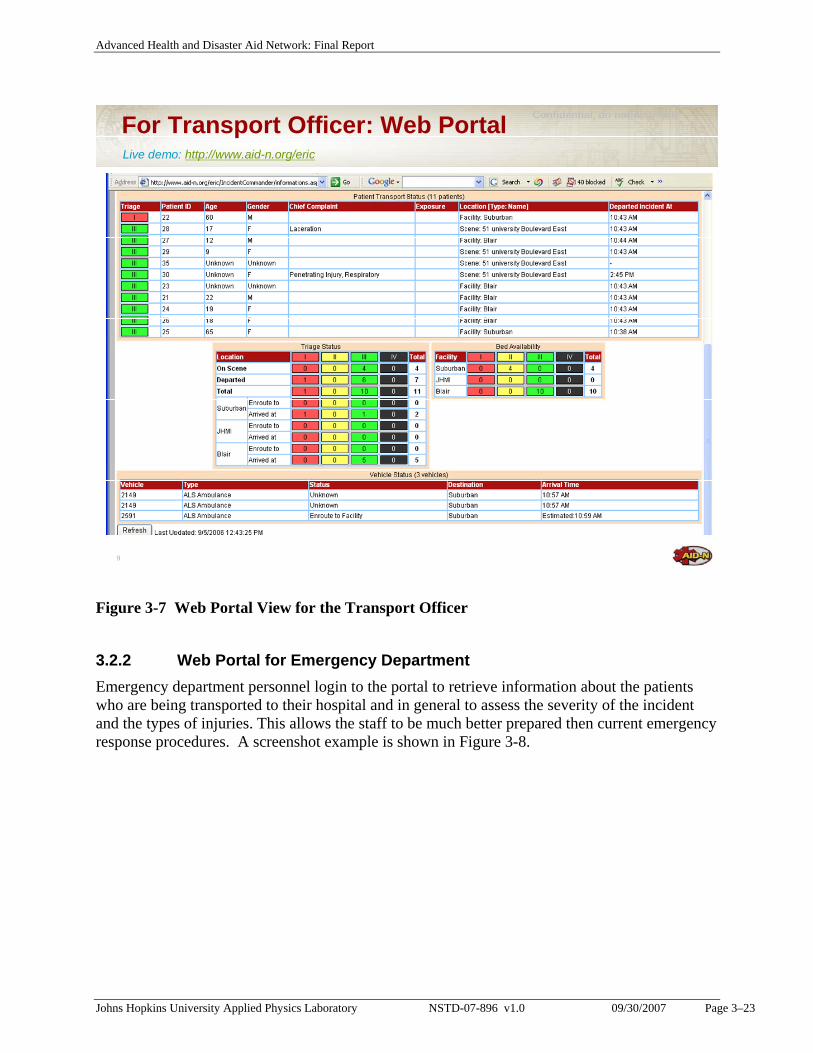
Figure 3-6 Treatment and Triage Office Portal View A sample screen for the Transport Officer is shown in Figure 3-7. It lists the patients in priority order with basic identifying information and location, the location of transports, and a summary of the number of patients at the different locations. The bed availability information shown on the screenshot is a placeholder for implementing a web service to access this type of information from existing services such as the Facility Resource Emergency Database (FRED) system developed by the Maryland Institute for Emergency Medical Services Systems (MIEMSS).
Advanced Health and Disaster Aid Network: Final Report
Johns Hopkins University Applied Physics Laboratory NSTD-07-896 v1.0 09/30/2007 Page 3–23
9
Confidential, do not distributeFor Transport Officer: Web PortalLive demo: http://www.aid-n.org/eric
Figure 3-7 Web Portal View for the Transport Officer
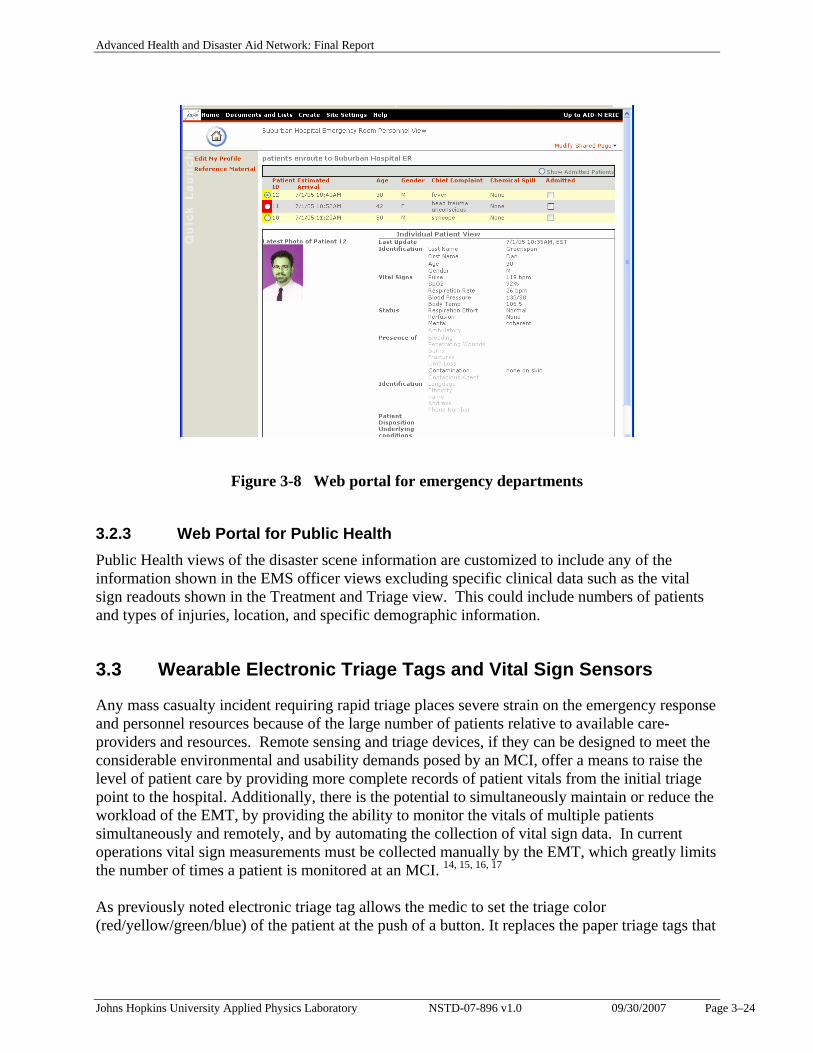
3.2.2 Web Portal for Emergency Department Emergency department personnel login to the portal to retrieve information about the patients who are being transported to their hospital and in general to assess the severity of the incident and the types of injuries. This allows the staff to be much better prepared then current emergency response procedures. A screenshot example is shown in Figure 3-8.
Advanced Health and Disaster Aid Network: Final Report
Johns Hopkins University Applied Physics Laboratory NSTD-07-896 v1.0 09/30/2007 Page 3–24
Figure 3-8 Web portal for emergency departments
3.2.3 Web Portal for Public Health Public Health views of the disaster scene information are customized to include any of the information shown in the EMS officer views excluding specific clinical data such as the vital sign readouts shown in the Treatment and Triage view. This could include numbers of patients and types of injuries, location, and specific demographic information.
3.3 Wearable Electronic Triage Tags and Vital Sign Sensors
Any mass casualty incident requiring rapid triage places severe strain on the emergency response and personnel resources because of the large number of patients relative to available care-providers and resources. Remote sensing and triage devices, if they can be designed to meet the considerable environmental and usability demands posed by an MCI, offer a means to raise the level of patient care by providing more complete records of patient vitals from the initial triage point to the hospital. Additionally, there is the potential to simultaneously maintain or reduce the workload of the EMT, by providing the ability to monitor the vitals of multiple patients simultaneously and remotely, and by automating the collection of vital sign data. In current operations vital sign measurements must be collected manually by the EMT, which greatly limits the number of times a patient is monitored at an MCI. 14, 15, 16, 17 As previously noted electronic triage tag allows the medic to set the triage color (red/yellow/green/blue) of the patient at the push of a button. It replaces the paper triage tags that
Advanced Health and Disaster Aid Network: Final Report
Johns Hopkins University Applied Physics Laboratory NSTD-07-896 v1.0 09/30/2007 Page 3–25
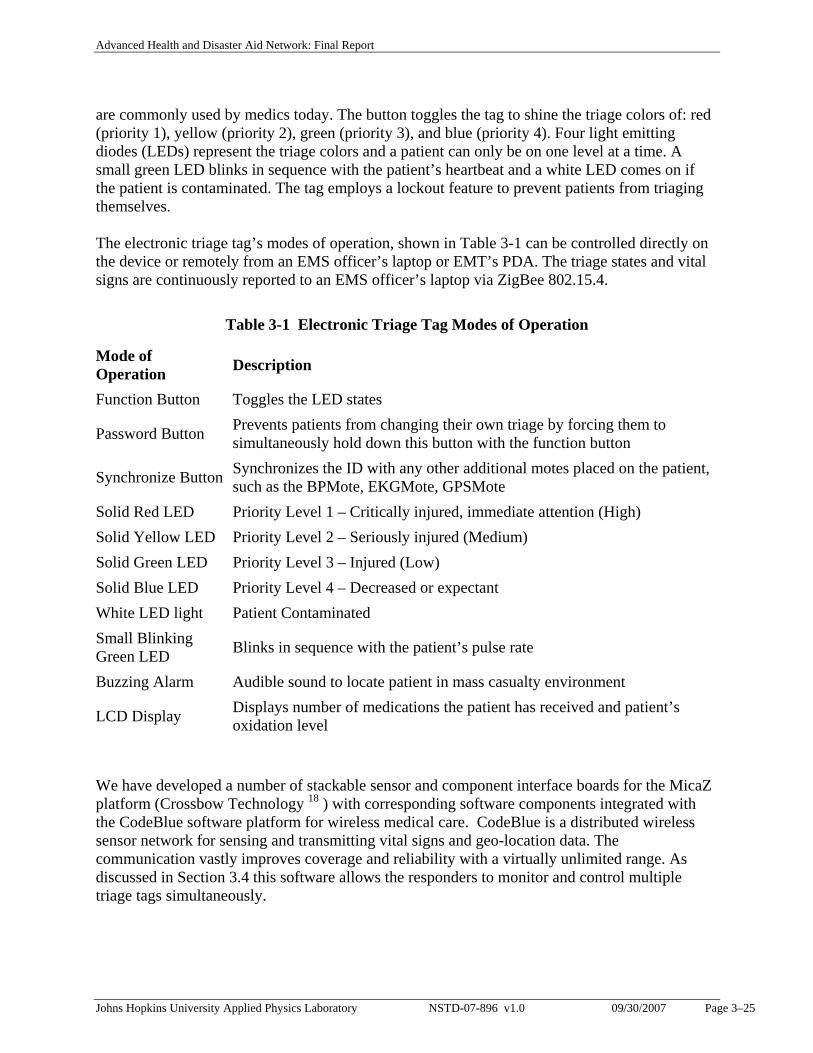
are commonly used by medics today. The button toggles the tag to shine the triage colors of: red (priority 1), yellow (priority 2), green (priority 3), and blue (priority 4). Four light emitting diodes (LEDs) represent the triage colors and a patient can only be on one level at a time. A small green LED blinks in sequence with the patient’s heartbeat and a white LED comes on if the patient is contaminated. The tag employs a lockout feature to prevent patients from triaging themselves. The electronic triage tag’s modes of operation, shown in Table 3-1 can be controlled directly on the device or remotely from an EMS officer’s laptop or EMT’s PDA. The triage states and vital signs are continuously reported to an EMS officer’s laptop via ZigBee 802.15.4.
Table 3-1 Electronic Triage Tag Modes of Operation
Mode of Operation Description
Function Button Toggles the LED states
Password Button Prevents patients from changing their own triage by forcing them to simultaneously hold down this button with the function button
Synchronize Button Synchronizes the ID with any other additional motes placed on the patient, such as the BPMote, EKGMote, GPSMote
Solid Red LED Priority Level 1 – Critically injured, immediate attention (High) Solid Yellow LED Priority Level 2 – Seriously injured (Medium) Solid Green LED Priority Level 3 – Injured (Low) Solid Blue LED Priority Level 4 – Decreased or expectant White LED light Patient Contaminated Small Blinking Green LED Blinks in sequence with the patient’s pulse rate
Buzzing Alarm Audible sound to locate patient in mass casualty environment
LCD Display Displays number of medications the patient has received and patient’s oxidation level
We have developed a number of stackable sensor and component interface boards for the MicaZ platform (Crossbow Technology 18 ) with corresponding software components integrated with the CodeBlue software platform for wireless medical care. CodeBlue is a distributed wireless sensor network for sensing and transmitting vital signs and geo-location data. The communication vastly improves coverage and reliability with a virtually unlimited range. As discussed in Section 3.4 this software allows the responders to monitor and control multiple triage tags simultaneously.
Advanced Health and Disaster Aid Network: Final Report
Johns Hopkins University Applied Physics Laboratory NSTD-07-896 v1.0 09/30/2007 Page 3–26
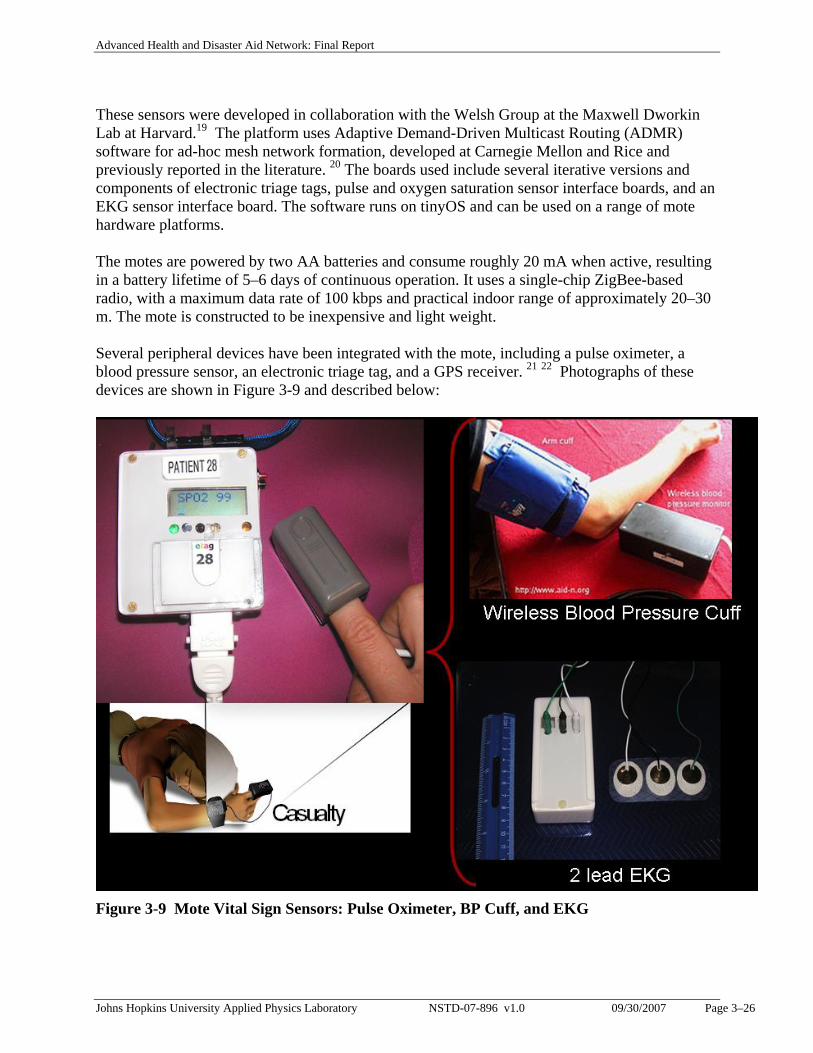
These sensors were developed in collaboration with the Welsh Group at the Maxwell Dworkin Lab at Harvard.19 The platform uses Adaptive Demand-Driven Multicast Routing (ADMR) software for ad-hoc mesh network formation, developed at Carnegie Mellon and Rice and previously reported in the literature. 20 The boards used include several iterative versions and components of electronic triage tags, pulse and oxygen saturation sensor interface boards, and an EKG sensor interface board. The software runs on tinyOS and can be used on a range of mote hardware platforms. The motes are powered by two AA batteries and consume roughly 20 mA when active, resulting in a battery lifetime of 5–6 days of continuous operation. It uses a single-chip ZigBee-based radio, with a maximum data rate of 100 kbps and practical indoor range of approximately 20–30 m. The mote is constructed to be inexpensive and light weight. Several peripheral devices have been integrated with the mote, including a pulse oximeter, a blood pressure sensor, an electronic triage tag, and a GPS receiver. 21 22 Photographs of these devices are shown in Figure 3-9 and described below:
Figure 3-9 Mote Vital Sign Sensors: Pulse Oximeter, BP Cuff, and EKG
Advanced Health and Disaster Aid Network: Final Report
Johns Hopkins University Applied Physics Laboratory NSTD-07-896 v1.0 09/30/2007 Page 3–27
• Pulse oximeter. A Smiths Medical, Inc. Micro Power Oximeter Board (MPOB) is used to
communicate between a finger-clip pulse-oximeter and the MICAz mote. The MPOB allows for measurements of blood oxygen saturation and pulse rate with a range of 30-254 bpm, accurate to within 2 bpm or 2%.
• Electronic triage tag. The electronic triage tag allows the medic to set the triage color (red/yellow/green) of the patient at the push of a button. There are 10 printed circuit boards that can be stacked onto the mote.
• Upper arm blood pressure sensor. An OEM Advantage Mini device from SunTech Medical has been integrated into the hardware suite. This device consists of an upper arm cuff and oscillometry with step deflation to measure blood pressure. The blood pressure sensor board communicates through a TTL serial communication port, but since the MICAz mote does not support direct serial connections, a ribbon cable had to be custom made to allow communication. The device takes measurement ranges from 20-260 mmHg for adults and 20-160 mmHg for pediatrics. We chose this sensor for its suitability for field use as it has been designed to be motion-tolerant, allowing for use in chaotic environments where patients may not be holding still during readings.
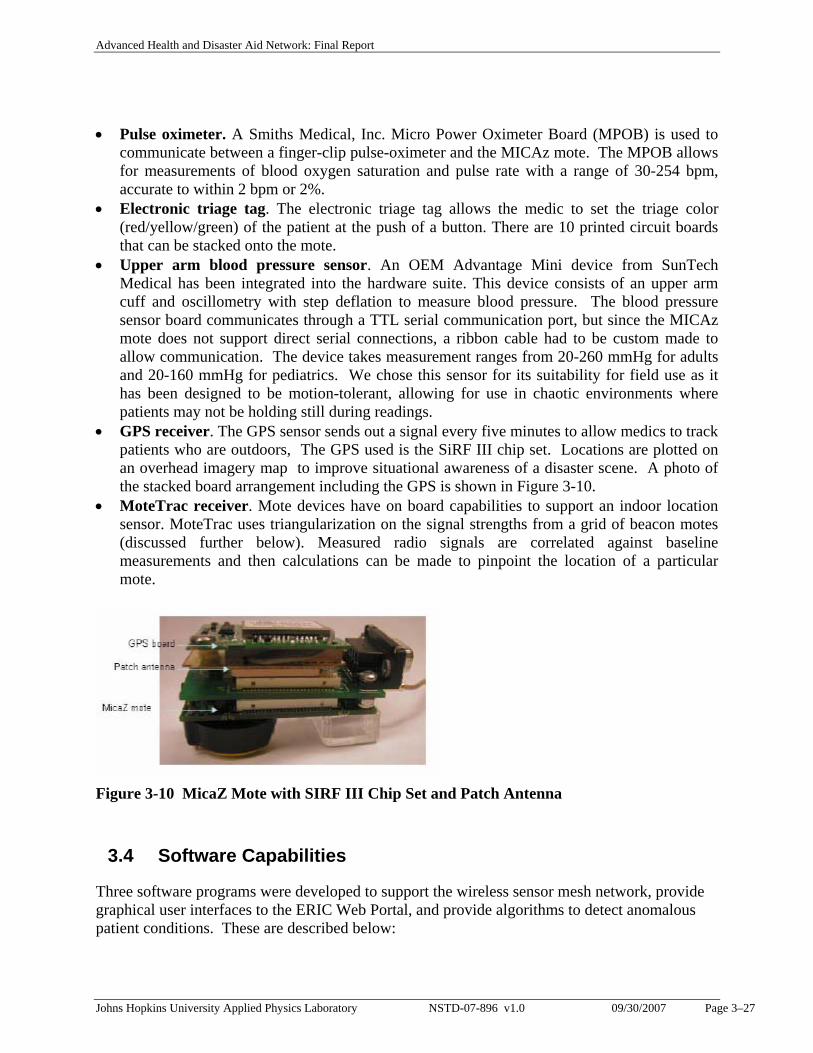
• GPS receiver. The GPS sensor sends out a signal every five minutes to allow medics to track patients who are outdoors, The GPS used is the SiRF III chip set. Locations are plotted on an overhead imagery map to improve situational awareness of a disaster scene. A photo of the stacked board arrangement including the GPS is shown in Figure 3-10.
• MoteTrac receiver. Mote devices have on board capabilities to support an indoor location sensor. MoteTrac uses triangularization on the signal strengths from a grid of beacon motes (discussed further below). Measured radio signals are correlated against baseline measurements and then calculations can be made to pinpoint the location of a particular mote.
Figure 3-10 MicaZ Mote with SIRF III Chip Set and Patch Antenna
3.4 Software Capabilities
Three software programs were developed to support the wireless sensor mesh network, provide graphical user interfaces to the ERIC Web Portal, and provide algorithms to detect anomalous patient conditions. These are described below:
Advanced Health and Disaster Aid Network: Final Report
Johns Hopkins University Applied Physics Laboratory NSTD-07-896 v1.0 09/30/2007 Page 3–28
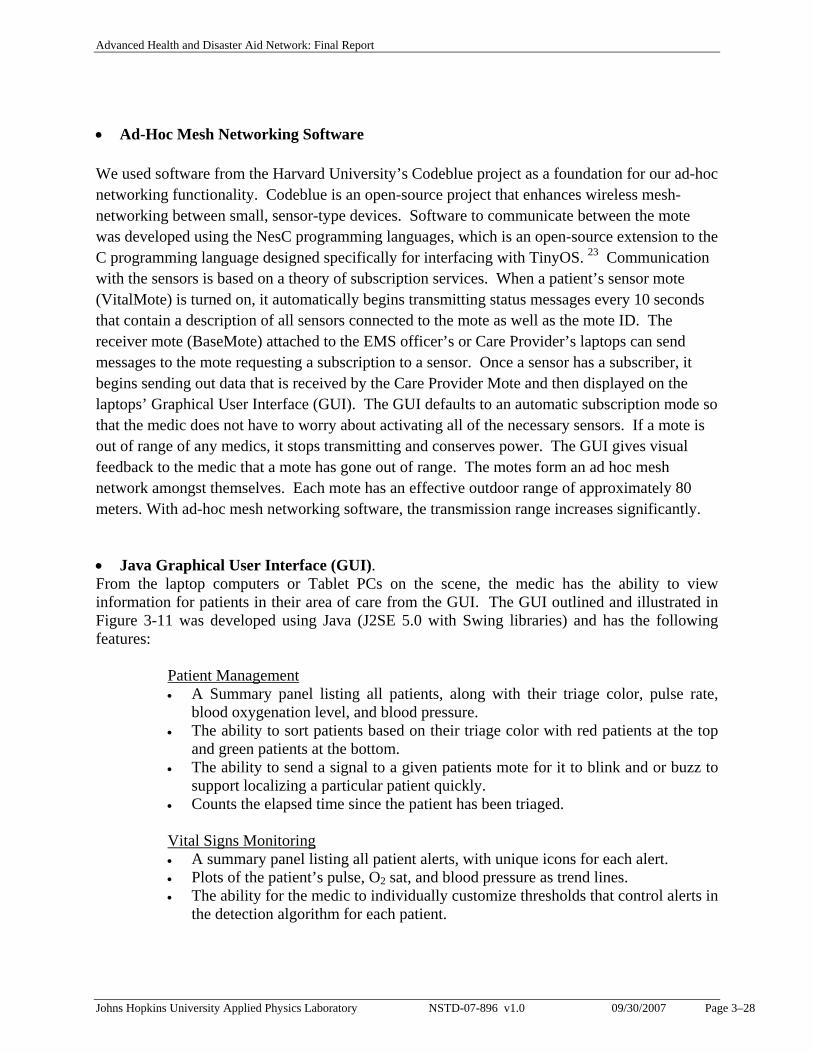
• Ad-Hoc Mesh Networking Software
We used software from the Harvard University’s Codeblue project as a foundation for our ad-hoc networking functionality. Codeblue is an open-source project that enhances wireless mesh-networking between small, sensor-type devices. Software to communicate between the mote was developed using the NesC programming languages, which is an open-source extension to the C programming language designed specifically for interfacing with TinyOS. 23 Communication with the sensors is based on a theory of subscription services. When a patient’s sensor mote (VitalMote) is turned on, it automatically begins transmitting status messages every 10 seconds that contain a description of all sensors connected to the mote as well as the mote ID. The receiver mote (BaseMote) attached to the EMS officer’s or Care Provider’s laptops can send messages to the mote requesting a subscription to a sensor. Once a sensor has a subscriber, it begins sending out data that is received by the Care Provider Mote and then displayed on the laptops’ Graphical User Interface (GUI). The GUI defaults to an automatic subscription mode so that the medic does not have to worry about activating all of the necessary sensors. If a mote is out of range of any medics, it stops transmitting and conserves power. The GUI gives visual feedback to the medic that a mote has gone out of range. The motes form an ad hoc mesh network amongst themselves. Each mote has an effective outdoor range of approximately 80 meters. With ad-hoc mesh networking software, the transmission range increases significantly.
• Java Graphical User Interface (GUI). From the laptop computers or Tablet PCs on the scene, the medic has the ability to view information for patients in their area of care from the GUI. The GUI outlined and illustrated in Figure 3-11 was developed using Java (J2SE 5.0 with Swing libraries) and has the following features:
Patient Management • A Summary panel listing all patients, along with their triage color, pulse rate,
blood oxygenation level, and blood pressure. • The ability to sort patients based on their triage color with red patients at the top
and green patients at the bottom. • The ability to send a signal to a given patients mote for it to blink and or buzz to
support localizing a particular patient quickly. • Counts the elapsed time since the patient has been triaged. Vital Signs Monitoring • A summary panel listing all patient alerts, with unique icons for each alert. • Plots of the patient’s pulse, O2 sat, and blood pressure as trend lines. • The ability for the medic to individually customize thresholds that control alerts in
the detection algorithm for each patient.
Advanced Health and Disaster Aid Network: Final Report
Johns Hopkins University Applied Physics Laboratory NSTD-07-896 v1.0 09/30/2007 Page 3–29
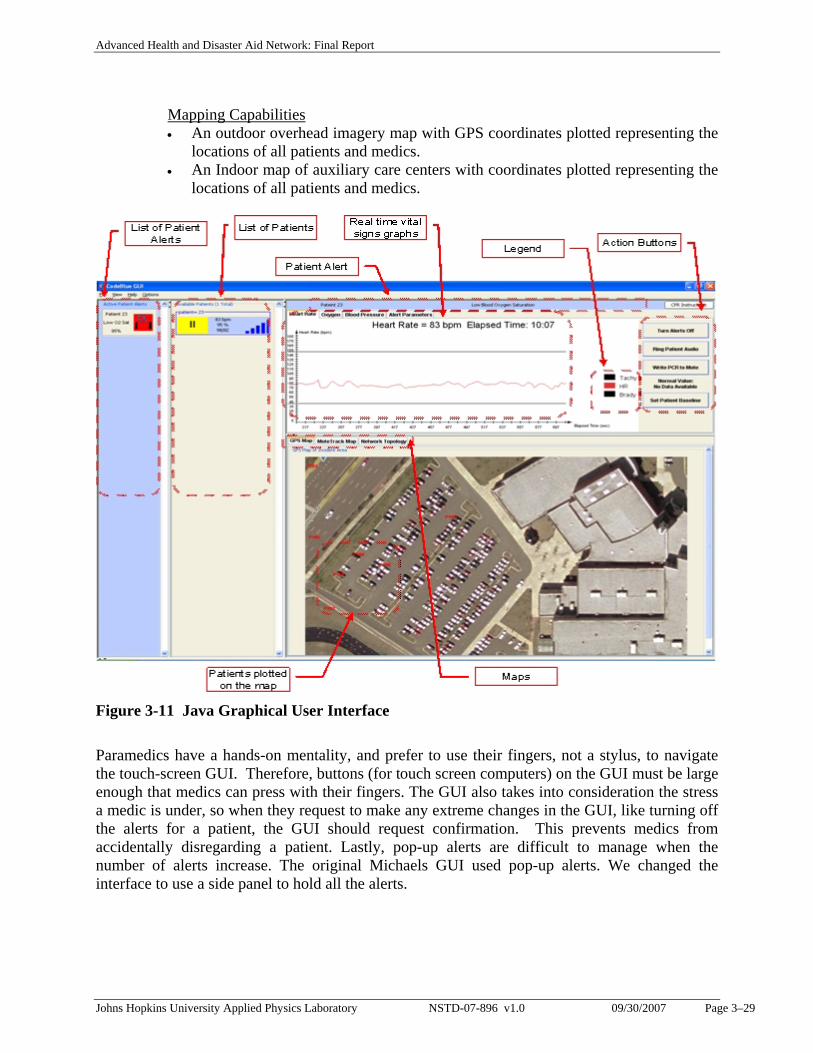
Mapping Capabilities • An outdoor overhead imagery map with GPS coordinates plotted representing the
locations of all patients and medics. • An Indoor map of auxiliary care centers with coordinates plotted representing the
locations of all patients and medics.
Figure 3-11 Java Graphical User Interface
Paramedics have a hands-on mentality, and prefer to use their fingers, not a stylus, to navigate the touch-screen GUI. Therefore, buttons (for touch screen computers) on the GUI must be large enough that medics can press with their fingers. The GUI also takes into consideration the stress a medic is under, so when they request to make any extreme changes in the GUI, like turning off the alerts for a patient, the GUI should request confirmation. This prevents medics from accidentally disregarding a patient. Lastly, pop-up alerts are difficult to manage when the number of alerts increase. The original Michaels GUI used pop-up alerts. We changed the interface to use a side panel to hold all the alerts.
Advanced Health and Disaster Aid Network: Final Report
Johns Hopkins University Applied Physics Laboratory NSTD-07-896 v1.0 09/30/2007 Page 3–30
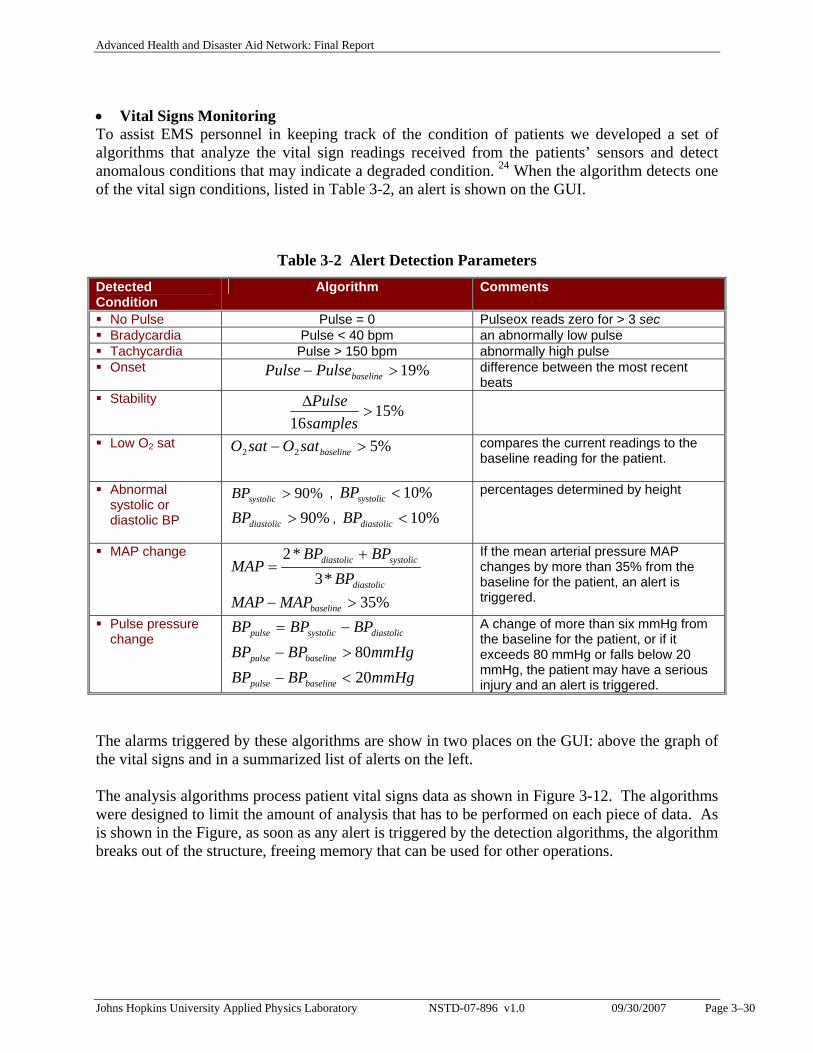
• Vital Signs Monitoring To assist EMS personnel in keeping track of the condition of patients we developed a set of algorithms that analyze the vital sign readings received from the patients’ sensors and detect anomalous conditions that may indicate a degraded condition. 24 When the algorithm detects one of the vital sign conditions, listed in Table 3-2, an alert is shown on the GUI.
Table 3-2 Alert Detection Parameters Detected Condition
Algorithm Comments
No Pulse Pulse = 0 Pulseox reads zero for > 3 sec Bradycardia Pulse < 40 bpm an abnormally low pulse Tachycardia Pulse > 150 bpm abnormally high pulse Onset %19>− baselinePulsePulse difference between the most recent
beats Stability
%1516
>ΔsamplesPulse
Low O2 sat %522 >− baselinesatOsatO compares the current readings to the baseline reading for the patient.
Abnormal systolic or diastolic BP
%90>systolicBP , %10<systolicBP
%90>diastolicBP , %10<diastolicBP
percentages determined by height
MAP change
diastolic
systolicdiastolic
BPBPBP
MAP*3
*2 +=
%35>− baselineMAPMAP
If the mean arterial pressure MAP changes by more than 35% from the baseline for the patient, an alert is triggered.
Pulse pressure change diastolicsystolicpulse BPBPBP −=
mmHgBPBP baselinepulse 80>−
mmHgBPBP baselinepulse 20<−
A change of more than six mmHg from the baseline for the patient, or if it exceeds 80 mmHg or falls below 20 mmHg, the patient may have a serious injury and an alert is triggered.
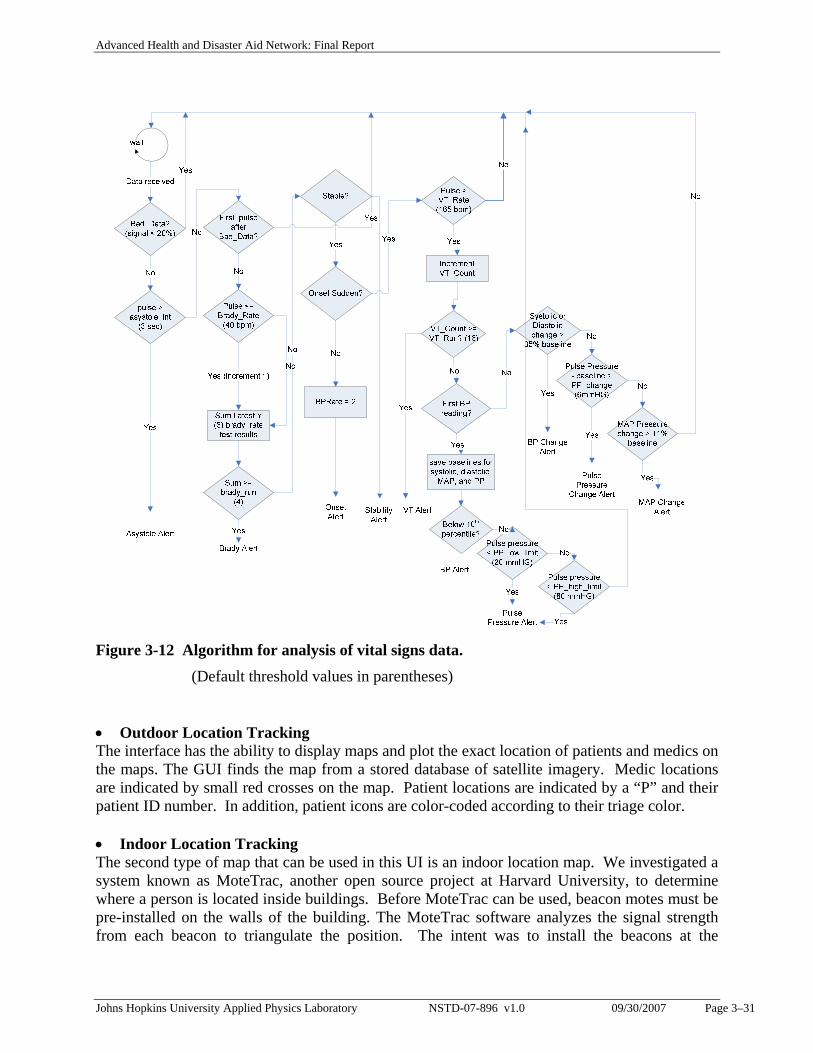
The alarms triggered by these algorithms are show in two places on the GUI: above the graph of the vital signs and in a summarized list of alerts on the left. The analysis algorithms process patient vital signs data as shown in Figure 3-12. The algorithms were designed to limit the amount of analysis that has to be performed on each piece of data. As is shown in the Figure, as soon as any alert is triggered by the detection algorithms, the algorithm breaks out of the structure, freeing memory that can be used for other operations.
Advanced Health and Disaster Aid Network: Final Report
Johns Hopkins University Applied Physics Laboratory NSTD-07-896 v1.0 09/30/2007 Page 3–31
Figure 3-12 Algorithm for analysis of vital signs data. (Default threshold values in parentheses) • Outdoor Location Tracking The interface has the ability to display maps and plot the exact location of patients and medics on the maps. The GUI finds the map from a stored database of satellite imagery. Medic locations are indicated by small red crosses on the map. Patient locations are indicated by a “P” and their patient ID number. In addition, patient icons are color-coded according to their triage color. • Indoor Location Tracking The second type of map that can be used in this UI is an indoor location map. We investigated a system known as MoteTrac, another open source project at Harvard University, to determine where a person is located inside buildings. Before MoteTrac can be used, beacon motes must be pre-installed on the walls of the building. The MoteTrac software analyzes the signal strength from each beacon to triangulate the position. The intent was to install the beacons at the
Advanced Health and Disaster Aid Network: Final Report
Johns Hopkins University Applied Physics Laboratory NSTD-07-896 v1.0 09/30/2007 Page 3–32
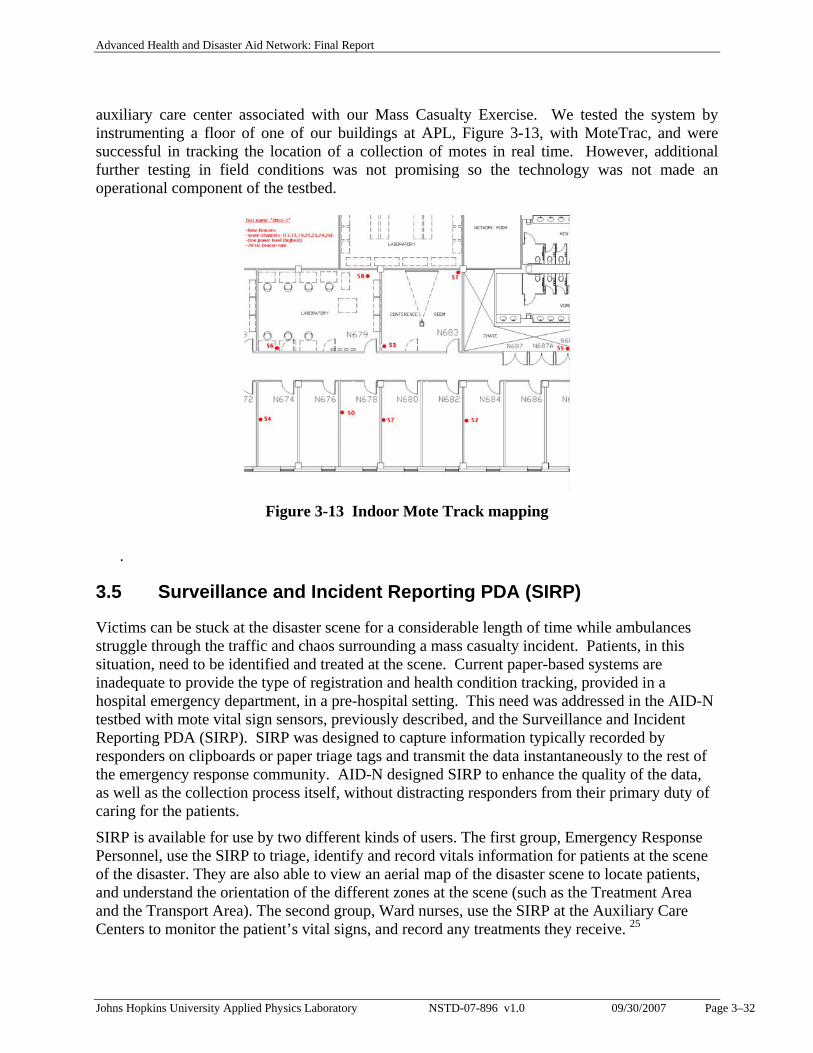
auxiliary care center associated with our Mass Casualty Exercise. We tested the system by instrumenting a floor of one of our buildings at APL, Figure 3-13, with MoteTrac, and were successful in tracking the location of a collection of motes in real time. However, additional further testing in field conditions was not promising so the technology was not made an operational component of the testbed.
Figure 3-13 Indoor Mote Track mapping
.
3.5 Surveillance and Incident Reporting PDA (SIRP)
Victims can be stuck at the disaster scene for a considerable length of time while ambulances struggle through the traffic and chaos surrounding a mass casualty incident. Patients, in this situation, need to be identified and treated at the scene. Current paper-based systems are inadequate to provide the type of registration and health condition tracking, provided in a hospital emergency department, in a pre-hospital setting. This need was addressed in the AID-N testbed with mote vital sign sensors, previously described, and the Surveillance and Incident Reporting PDA (SIRP). SIRP was designed to capture information typically recorded by responders on clipboards or paper triage tags and transmit the data instantaneously to the rest of the emergency response community. AID-N designed SIRP to enhance the quality of the data, as well as the collection process itself, without distracting responders from their primary duty of caring for the patients.
SIRP is available for use by two different kinds of users. The first group, Emergency Response Personnel, use the SIRP to triage, identify and record vitals information for patients at the scene of the disaster. They are also able to view an aerial map of the disaster scene to locate patients, and understand the orientation of the different zones at the scene (such as the Treatment Area and the Transport Area). The second group, Ward nurses, use the SIRP at the Auxiliary Care Centers to monitor the patient’s vital signs, and record any treatments they receive. 25
Advanced Health and Disaster Aid Network: Final Report
Johns Hopkins University Applied Physics Laboratory NSTD-07-896 v1.0 09/30/2007 Page 3–33
Design
The goals for the handheld SIRP PDA were to:
1) Replicate the secondary triage charts used by responders today to make the interface as familiar as possible
2) Take into account the limited text entry capabilities of the PDA, make “smart choices” and automated field population available wherever possible
3) Use GPS receivers to track the location of personnel and patients, as well as to communicate geographical data about the scene to personnel
4) Use integrated cameras to augment charts with visual data about patients
5) Prove the efficacy of a patient-carried medical record in aiding emergency care
6) Provide consistent usability despite likely network connectivity disruptions
Through an iterative design and review process, these goals were rapidly implemented and then refined through user reviews and user observation. We observed paramedics in real response situations through 50 hours of job shadowing in Arlington County, VA, a large county south of Washington DC 26, and we received feedback through demonstrations and surveys at several nearby firehouses.
We developed a web-based version of the software in addition to the heavy-client PDA software in order to allow responders from neighboring jurisdictions to interact with the AID-N system without having to have software pre-installed on a PDA. This “lite” version does not have the full capabilities of the heavy-client, but is available for any PDA or SmartPhone running Pocket IE 2003 or later.
Implementation The primary version of SIRP is the heavy client for full integration with portable devices designed to improve the efficiency of the following first responder tasks.
Secondary Triage The secondary triage forms provide detailed information about a patient’s condition that goes beyond the initial 30 second START procedure. This information is later provided to the nurse when the patient is transported to a hospital. SIRP replicated the charts in a GUI form on the PDA. To meet the goal of speedy text entry, free text areas were replaced with choices which could be selected with a single tap on a radio button or check box. Rather than typing an age, a medic simply taps buttons labeled “infant,” “child,” or “adult.” Similar selections are provided for the patient’s level of consciousness and chief complaint, and a drop down box contained a list of contaminants to choose from if the patient required decontamination.
In order to maintain consistency with the current forms, close attention was paid to terminology, which was especially difficult for two reasons: first because the PDA provides limited screen space for long terms and second because terminology varies from one jurisdiction to another. Taxonomy in healthcare is a science in its own right, so instead of attempting to solve the problem of conflicting and difficult terminology, the system was implemented with an open
Advanced Health and Disaster Aid Network: Final Report
Johns Hopkins University Applied Physics Laboratory NSTD-07-896 v1.0 09/30/2007 Page 3–34
framework to allow the text to be provided from a configuration file or web service so that the client could specify the terms to be used. This also allows the forms to be translated to other languages for international use.
For particular injuries, especially burns and lesions, the physician at the receiving hospital must look at the injury in order to diagnose it and gather the resources to properly treat the patient. Once AID-N allows the physician to learn about incoming patients before they have even left the disaster scene, it becomes enormously valuable to have photos of injuries accompany the patient record. To that end, SIRP includes a camera, integrated with the SIRP software to allow photos to be taken of injuries and automatically uploaded to the server. These photos can also be annotated by the responder to indicate where the injury is and provide a description of the photo.
Patient Identification Patient identification is necessary for hospitals because it allows them to connect with the patient’s family and to ensure that the hospital is reimbursed by the patient’s insurance. If a patient history is included, the information can be used to avoid allergic reactions during treatment and to account for other risks. Unfortunately this information is almost impossible to obtain if the patient cannot provide it directly, and so many organizations have begun to investigate solutions for patient-carried medical records.
To prove the efficacy of these records within the AID-N system, SIRP assumes a particular implementation of a solution – information encoded in a 2-D barcode on the driver’s license – and provides an interface for that solution. With SIRP, providers use a Bluetooth-enabled barcode scanner to rapidly retrieve a patient’s name, age, gender, address, phone number, next of kin contact information, medications, pre-existing conditions, and allergies. In the case where a patient did not have a driver’s license, the information could be entered manually, but it would be time-consuming.
Here again, the integrated camera was used to capture images of each patient’s face for later identification amongst other patients. This could be used by medics assigned to pick up the patient for transport or to find a patient whose vital signs indicated a deteriorating condition. The photo would also be useful for families attempting to locate their loved ones and especially children. Parents could identify their children by a photo and an EMS worker would be able to direct them to the hospital where they were transported. Future work could allow searches based on the features of the image such as hair color, eye color, clothes worn, or by scanning an image of the child and doing facial recognition.
Patient Vital Signs Monitoring SIRP provides a portable means of viewing real-time sensor readings of oxygen saturation, heart rate, and blood pressure over a five minute time span, identified by experts as the most crucial data in cases of trauma. Mapping Incident commanders can use the PDA to plan the spatial organization of the disaster scene and view all resources on scene, and communicate it quickly to the different first responder groups. Treatment Record
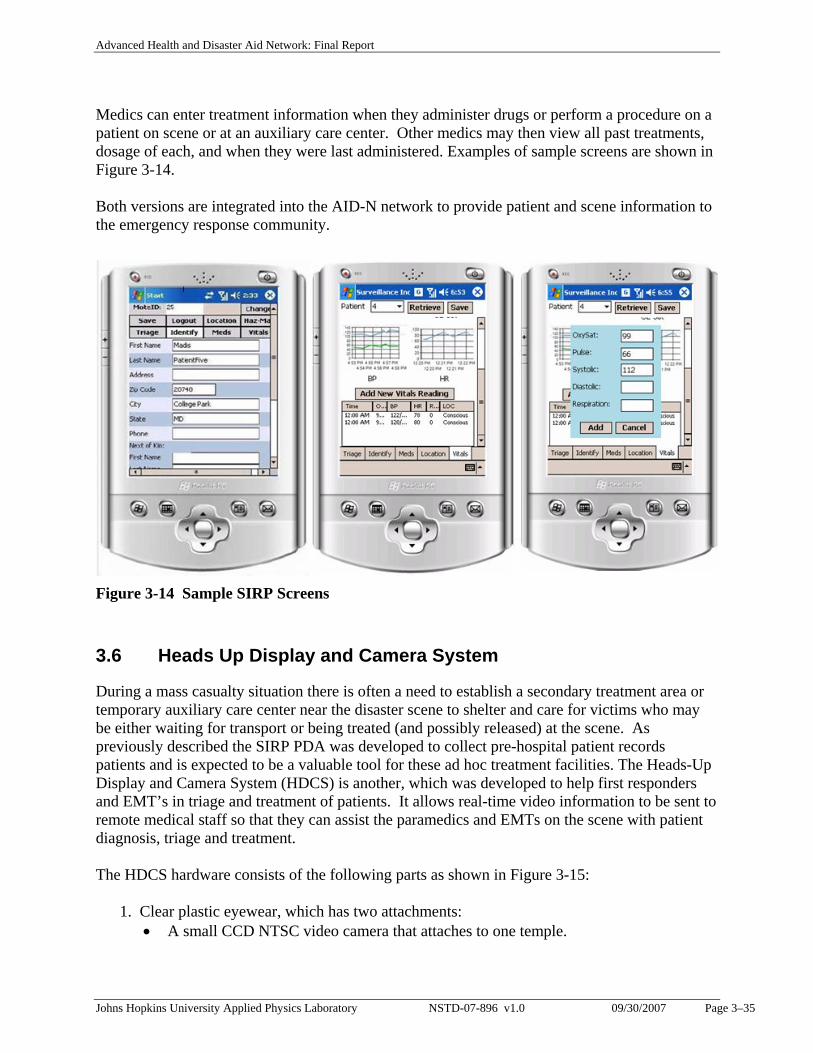
Advanced Health and Disaster Aid Network: Final Report
Johns Hopkins University Applied Physics Laboratory NSTD-07-896 v1.0 09/30/2007 Page 3–35
Medics can enter treatment information when they administer drugs or perform a procedure on a patient on scene or at an auxiliary care center. Other medics may then view all past treatments, dosage of each, and when they were last administered. Examples of sample screens are shown in Figure 3-14. Both versions are integrated into the AID-N network to provide patient and scene information to the emergency response community.
Figure 3-14 Sample SIRP Screens
3.6 Heads Up Display and Camera System
During a mass casualty situation there is often a need to establish a secondary treatment area or temporary auxiliary care center near the disaster scene to shelter and care for victims who may be either waiting for transport or being treated (and possibly released) at the scene. As previously described the SIRP PDA was developed to collect pre-hospital patient records patients and is expected to be a valuable tool for these ad hoc treatment facilities. The Heads-Up Display and Camera System (HDCS) is another, which was developed to help first responders and EMT’s in triage and treatment of patients. It allows real-time video information to be sent to remote medical staff so that they can assist the paramedics and EMTs on the scene with patient diagnosis, triage and treatment. The HDCS hardware consists of the following parts as shown in Figure 3-15:
1. Clear plastic eyewear, which has two attachments: • A small CCD NTSC video camera that attaches to one temple.
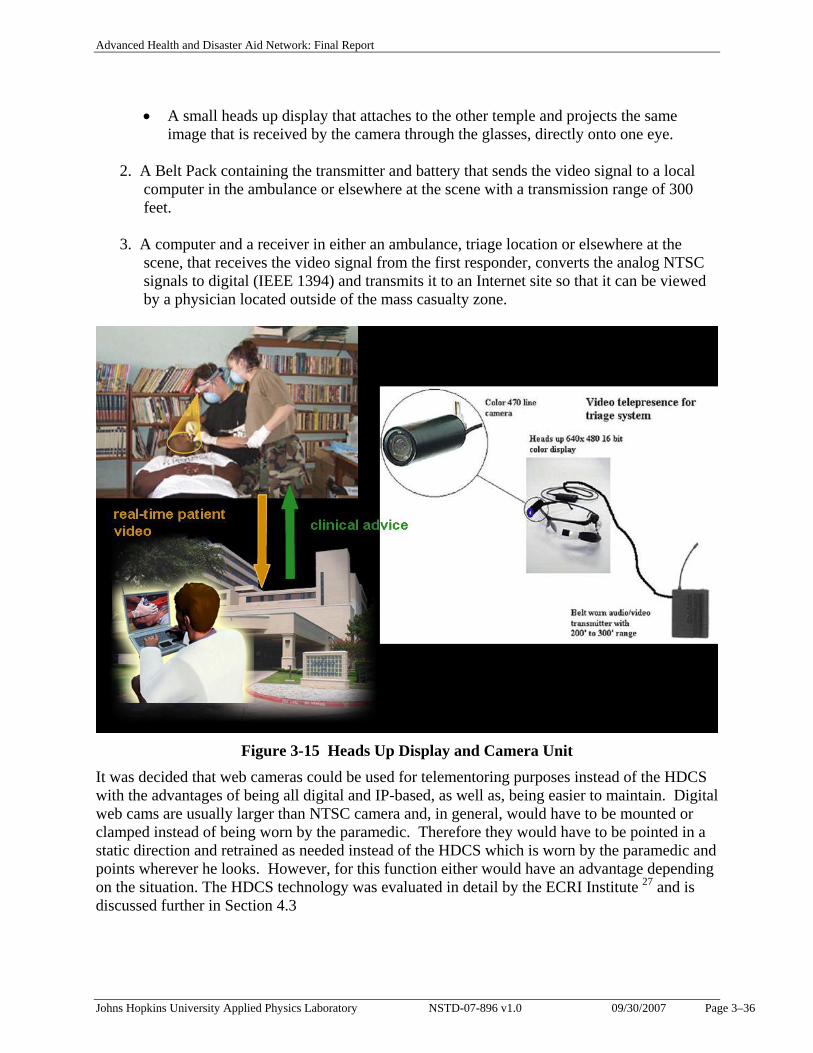
Advanced Health and Disaster Aid Network: Final Report
Johns Hopkins University Applied Physics Laboratory NSTD-07-896 v1.0 09/30/2007 Page 3–36
• A small heads up display that attaches to the other temple and projects the same image that is received by the camera through the glasses, directly onto one eye.
2. A Belt Pack containing the transmitter and battery that sends the video signal to a local computer in the ambulance or elsewhere at the scene with a transmission range of 300 feet.
3. A computer and a receiver in either an ambulance, triage location or elsewhere at the
scene, that receives the video signal from the first responder, converts the analog NTSC signals to digital (IEEE 1394) and transmits it to an Internet site so that it can be viewed by a physician located outside of the mass casualty zone.
Figure 3-15 Heads Up Display and Camera Unit
It was decided that web cameras could be used for telementoring purposes instead of the HDCS with the advantages of being all digital and IP-based, as well as, being easier to maintain. Digital web cams are usually larger than NTSC camera and, in general, would have to be mounted or clamped instead of being worn by the paramedic. Therefore they would have to be pointed in a static direction and retrained as needed instead of the HDCS which is worn by the paramedic and points wherever he looks. However, for this function either would have an advantage depending on the situation. The HDCS technology was evaluated in detail by the ECRI Institute 27 and is discussed further in Section 4.3
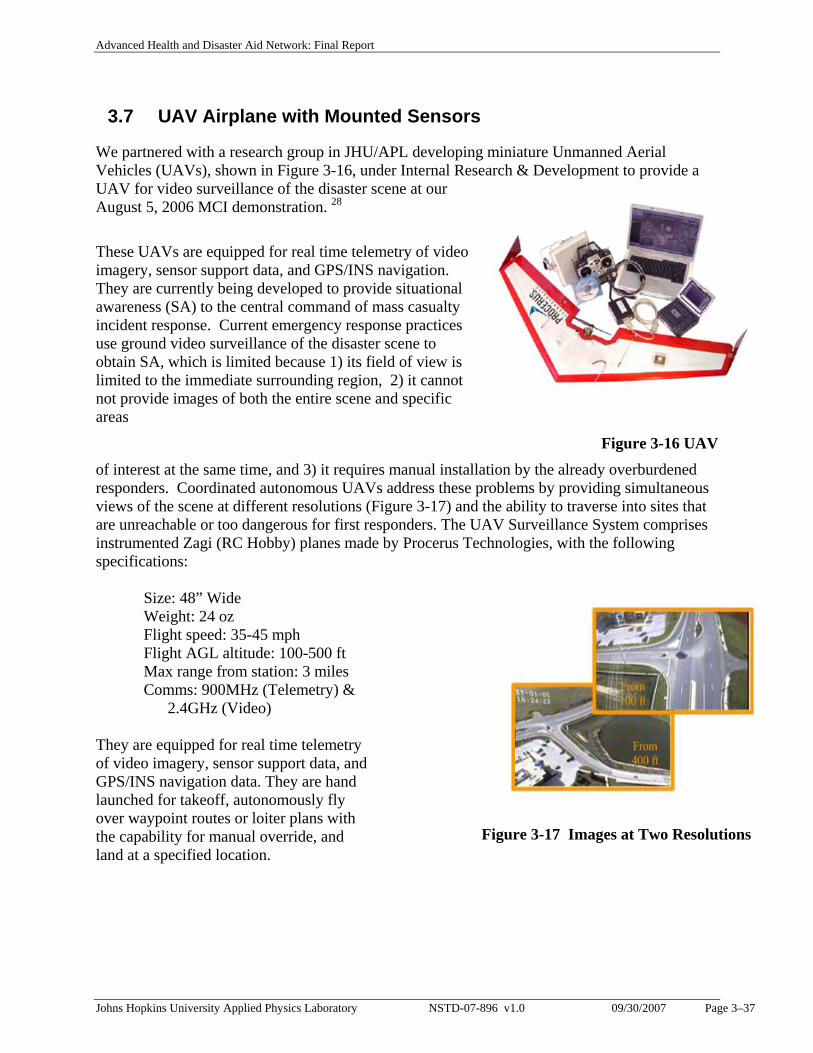
Advanced Health and Disaster Aid Network: Final Report
Johns Hopkins University Applied Physics Laboratory NSTD-07-896 v1.0 09/30/2007 Page 3–37
3.7 UAV Airplane with Mounted Sensors
We partnered with a research group in JHU/APL developing miniature Unmanned Aerial Vehicles (UAVs), shown in Figure 3-16, under Internal Research & Development to provide a UAV for video surveillance of the disaster scene at our August 5, 2006 MCI demonstration. 28
These UAVs are equipped for real time telemetry of video imagery, sensor support data, and GPS/INS navigation. They are currently being developed to provide situational awareness (SA) to the central command of mass casualty incident response. Current emergency response practices use ground video surveillance of the disaster scene to obtain SA, which is limited because 1) its field of view is limited to the immediate surrounding region, 2) it cannot not provide images of both the entire scene and specific areas
Figure 3-16 UAV of interest at the same time, and 3) it requires manual installation by the already overburdened responders. Coordinated autonomous UAVs address these problems by providing simultaneous views of the scene at different resolutions (Figure 3-17) and the ability to traverse into sites that are unreachable or too dangerous for first responders. The UAV Surveillance System comprises instrumented Zagi (RC Hobby) planes made by Procerus Technologies, with the following specifications:
Size: 48” Wide Weight: 24 oz Flight speed: 35-45 mph Flight AGL altitude: 100-500 ft Max range from station: 3 miles Comms: 900MHz (Telemetry) &
2.4GHz (Video)
They are equipped for real time telemetry of video imagery, sensor support data, and GPS/INS navigation data. They are hand launched for takeoff, autonomously fly over waypoint routes or loiter plans with the capability for manual override, and land at a specified location.
Figure 3-17 Images at Two Resolutions
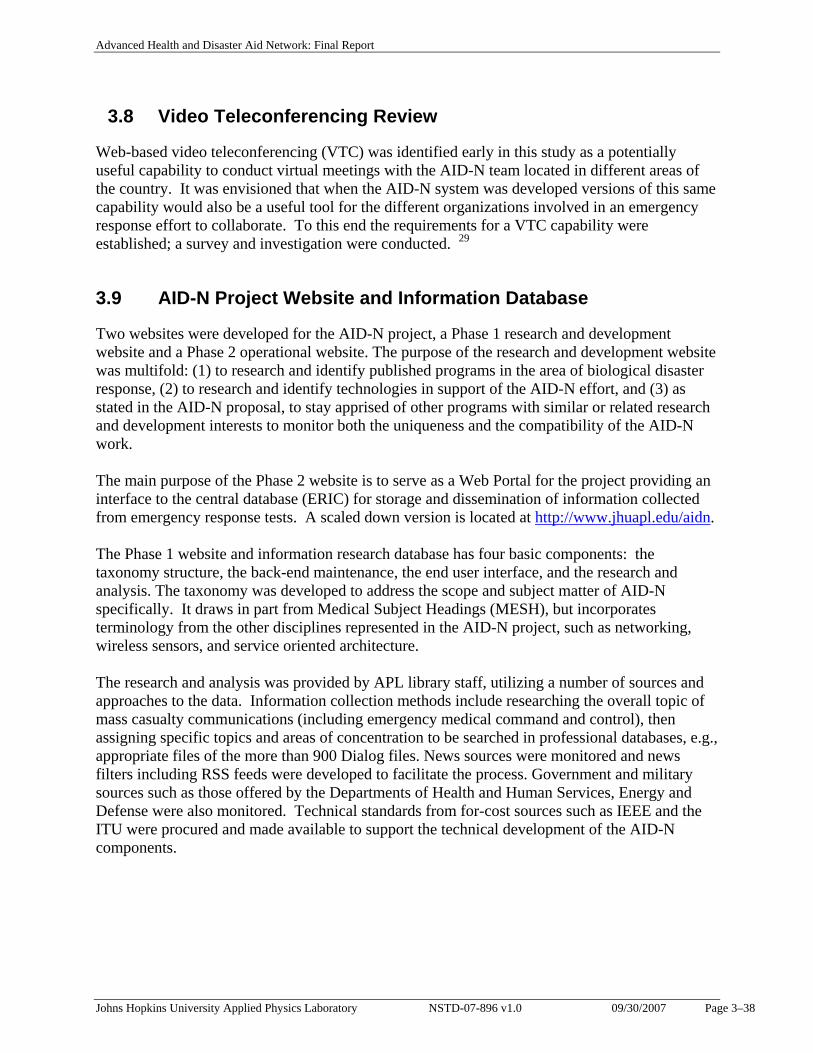
Advanced Health and Disaster Aid Network: Final Report
Johns Hopkins University Applied Physics Laboratory NSTD-07-896 v1.0 09/30/2007 Page 3–38
3.8 Video Teleconferencing Review
Web-based video teleconferencing (VTC) was identified early in this study as a potentially useful capability to conduct virtual meetings with the AID-N team located in different areas of the country. It was envisioned that when the AID-N system was developed versions of this same capability would also be a useful tool for the different organizations involved in an emergency response effort to collaborate. To this end the requirements for a VTC capability were established; a survey and investigation were conducted. 29
3.9 AID-N Project Website and Information Database
Two websites were developed for the AID-N project, a Phase 1 research and development website and a Phase 2 operational website. The purpose of the research and development website was multifold: (1) to research and identify published programs in the area of biological disaster response, (2) to research and identify technologies in support of the AID-N effort, and (3) as stated in the AID-N proposal, to stay apprised of other programs with similar or related research and development interests to monitor both the uniqueness and the compatibility of the AID-N work. The main purpose of the Phase 2 website is to serve as a Web Portal for the project providing an interface to the central database (ERIC) for storage and dissemination of information collected from emergency response tests. A scaled down version is located at http://www.jhuapl.edu/aidn. The Phase 1 website and information research database has four basic components: the taxonomy structure, the back-end maintenance, the end user interface, and the research and analysis. The taxonomy was developed to address the scope and subject matter of AID-N specifically. It draws in part from Medical Subject Headings (MESH), but incorporates terminology from the other disciplines represented in the AID-N project, such as networking, wireless sensors, and service oriented architecture. The research and analysis was provided by APL library staff, utilizing a number of sources and approaches to the data. Information collection methods include researching the overall topic of mass casualty communications (including emergency medical command and control), then assigning specific topics and areas of concentration to be searched in professional databases, e.g., appropriate files of the more than 900 Dialog files. News sources were monitored and news filters including RSS feeds were developed to facilitate the process. Government and military sources such as those offered by the Departments of Health and Human Services, Energy and Defense were also monitored. Technical standards from for-cost sources such as IEEE and the ITU were procured and made available to support the technical development of the AID-N components.
Advanced Health and Disaster Aid Network: Final Report
Johns Hopkins University Applied Physics Laboratory NSTD-07-896 v1.0 09/30/2007 Page 4–39
Sample Listing of Some of the Information Sources Monitored: Dialog databases Army Logistician (and Army medical and C4I websites) Government Computer News GCN Homeland Defense and Security Monitor Inside Washington Publications Jane’s publications (journals, online, and yearbooks) Military Medical/NBC Technology National Defense Medline Homeland security directories READY! The Emergency Preparedness and Response Conference and Exposition Ocean News & Technology The Phase 1 website was in production from November 2003 to August 2006, and was accessible to both internal APL and external site visitors. It included an RSS feed to enable content delivery directly to a subscriber, either on general resources added, or by specific subject interest. There are over 1,000 resources available in the information collection.
4. TEST AND EVALUATION
Test and evaluation of the AID-N testbed was conducted in three levels as illustrated in Figure 4-1. This includes: 1) evaluation by the user community during system development (as described in Section 2), 2) generation of metrics and a test plan for system evaluation by independent evaluators in the APL National Security Analysis Department, and 3) evaluation of specific AID-N devices by the ECRI Institute. These led into and culminated with the final system demonstration and evaluation at the Mass Casualty Incident Field Test on August 5, 2006 that took place at Montgomery Blair High School in Maryland. There were also numerous small scale demonstrations throughout the term of the project to various government organizations and other interested parties plus a full scale technology demonstration to the sponsor and emergency response technology developers on June 23, 2006 at JHU/APL.
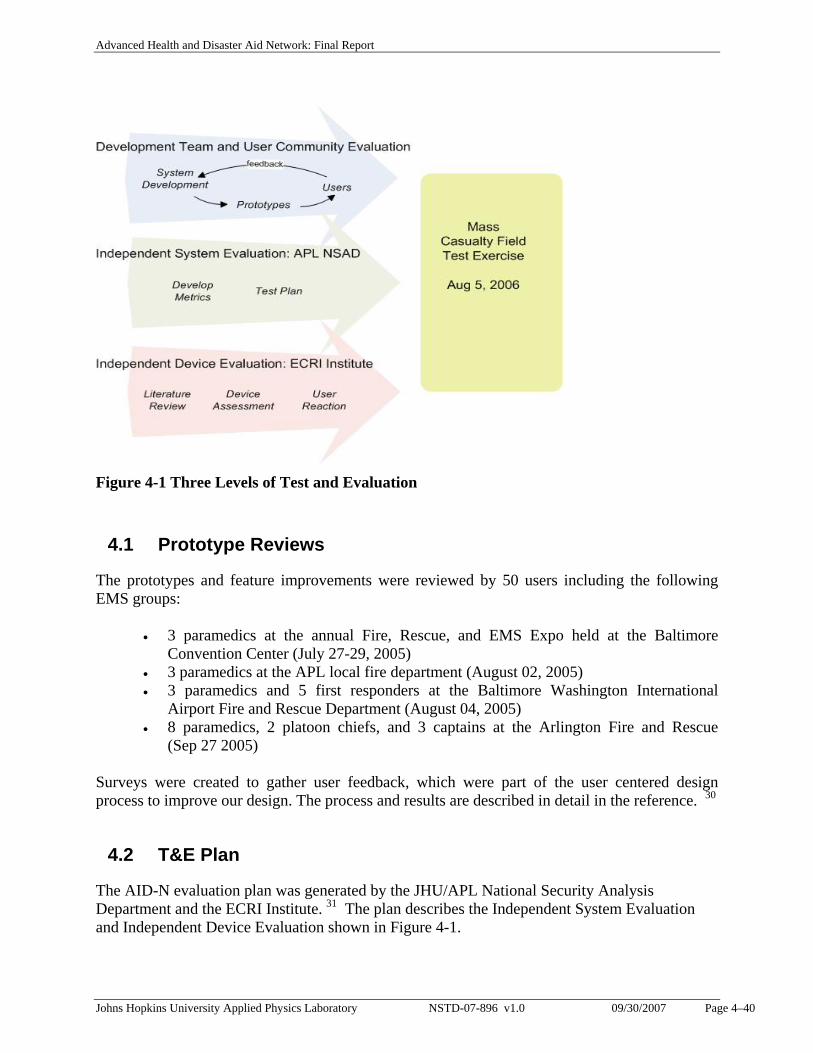
Advanced Health and Disaster Aid Network: Final Report
Johns Hopkins University Applied Physics Laboratory NSTD-07-896 v1.0 09/30/2007 Page 4–40
Figure 4-1 Three Levels of Test and Evaluation
4.1 Prototype Reviews
The prototypes and feature improvements were reviewed by 50 users including the following EMS groups:
• 3 paramedics at the annual Fire, Rescue, and EMS Expo held at the Baltimore Convention Center (July 27-29, 2005)
• 3 paramedics at the APL local fire department (August 02, 2005) • 3 paramedics and 5 first responders at the Baltimore Washington International
Airport Fire and Rescue Department (August 04, 2005) • 8 paramedics, 2 platoon chiefs, and 3 captains at the Arlington Fire and Rescue
(Sep 27 2005) Surveys were created to gather user feedback, which were part of the user centered design process to improve our design. The process and results are described in detail in the reference. 30
4.2 T&E Plan
The AID-N evaluation plan was generated by the JHU/APL National Security Analysis Department and the ECRI Institute. 31 The plan describes the Independent System Evaluation and Independent Device Evaluation shown in Figure 4-1.
Advanced Health and Disaster Aid Network: Final Report
Johns Hopkins University Applied Physics Laboratory NSTD-07-896 v1.0 09/30/2007 Page 4–41
The Independent System Assessment is to evaluate AID-N relative to the support it provides to users in the performance of real-world, critical tasks or functions in an operational setting. The goal of the component-level assessment is to evaluate the performance of the components relative to technical and safety specifications and standards, and to provide a clinical perspective regarding how well the proposed technology addresses a clinical problem. The plan lists the Critical Operation Issues (COIs), Measures of Effectiveness (MOEs), and Measures of Performance (MOPs) that provided the basis for the survey questions used in the Mass Casualty Field Test Exercise.
4.3 Independent Component Evaluation by ECRI
The goal of the independent component-level assessment by ECRI Institute was to evaluate the performance of AID-N components relative to technical and safety specifications and standards, and to provide a clinical perspective regarding how well the proposed technology addresses a clinical problem. Two AID-N components were evaluated by ECRI, the Heads Up Display and Camera System (HDCS) and the Electronic Triage Tag.
4.3.1 HDCS Evaluation
ECRI performed a detailed evaluation 27 of the HDCS addressing the clinical perspective of the device, in terms of the environment, applications, and issues; the technology perspective, in terms of system design, specifications, operation, and performance; and the testing methods and results.
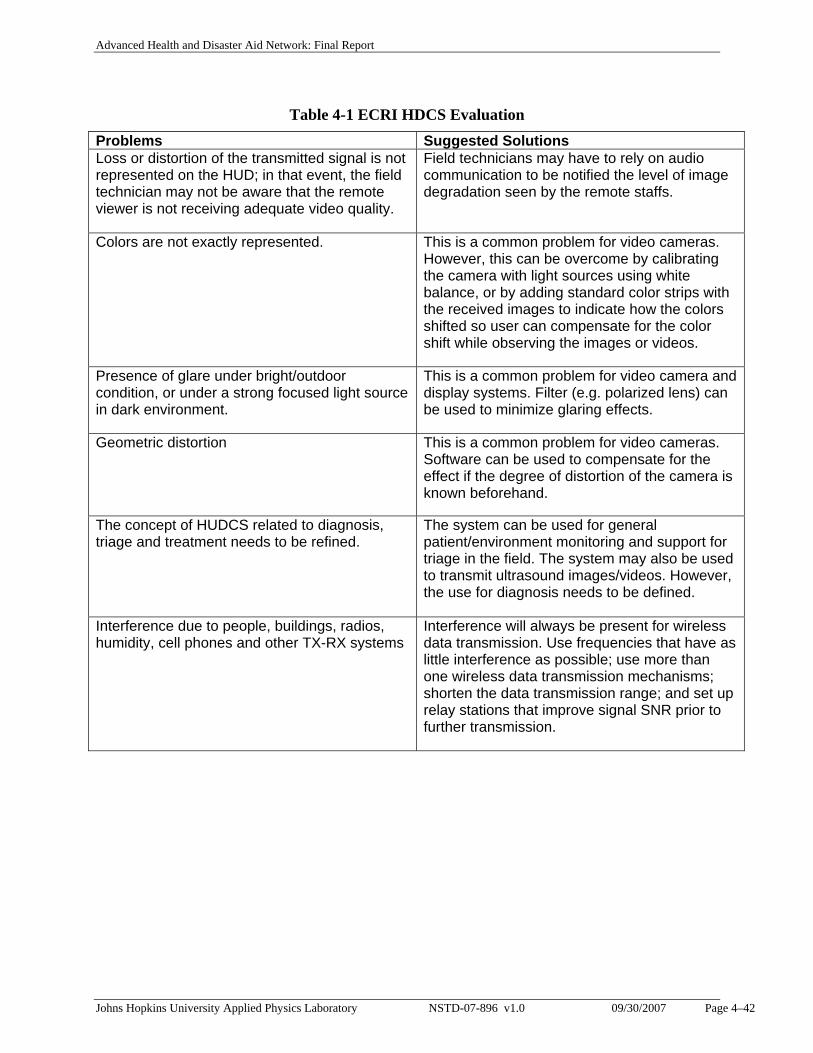
Advanced Health and Disaster Aid Network: Final Report
Johns Hopkins University Applied Physics Laboratory NSTD-07-896 v1.0 09/30/2007 Page 4–42
Table 4-1 ECRI HDCS Evaluation Problems Suggested Solutions Loss or distortion of the transmitted signal is not represented on the HUD; in that event, the field technician may not be aware that the remote viewer is not receiving adequate video quality.
Field technicians may have to rely on audio communication to be notified the level of image degradation seen by the remote staffs.
Colors are not exactly represented. This is a common problem for video cameras. However, this can be overcome by calibrating the camera with light sources using white balance, or by adding standard color strips with the received images to indicate how the colors shifted so user can compensate for the color shift while observing the images or videos.
Presence of glare under bright/outdoor condition, or under a strong focused light source in dark environment.
This is a common problem for video camera and display systems. Filter (e.g. polarized lens) can be used to minimize glaring effects.
Geometric distortion This is a common problem for video cameras. Software can be used to compensate for the effect if the degree of distortion of the camera is known beforehand.
The concept of HUDCS related to diagnosis, triage and treatment needs to be refined.
The system can be used for general patient/environment monitoring and support for triage in the field. The system may also be used to transmit ultrasound images/videos. However, the use for diagnosis needs to be defined.
Interference due to people, buildings, radios, humidity, cell phones and other TX-RX systems
Interference will always be present for wireless data transmission. Use frequencies that have as little interference as possible; use more than one wireless data transmission mechanisms; shorten the data transmission range; and set up relay stations that improve signal SNR prior to further transmission.
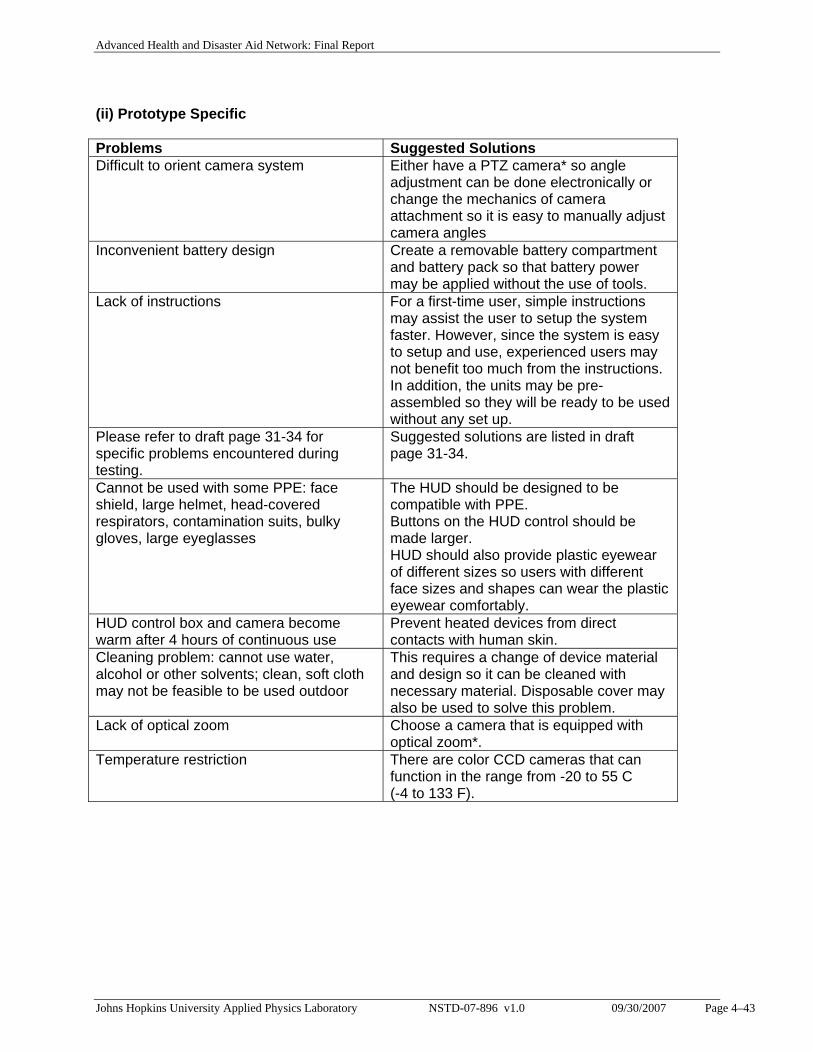
Advanced Health and Disaster Aid Network: Final Report
Johns Hopkins University Applied Physics Laboratory NSTD-07-896 v1.0 09/30/2007 Page 4–43
(ii) Prototype Specific Problems Suggested Solutions Difficult to orient camera system Either have a PTZ camera* so angle
adjustment can be done electronically or change the mechanics of camera attachment so it is easy to manually adjust camera angles
Inconvenient battery design Create a removable battery compartment and battery pack so that battery power may be applied without the use of tools.
Lack of instructions For a first-time user, simple instructions may assist the user to setup the system faster. However, since the system is easy to setup and use, experienced users may not benefit too much from the instructions. In addition, the units may be pre-assembled so they will be ready to be used without any set up.
Please refer to draft page 31-34 for specific problems encountered during testing.
Suggested solutions are listed in draft page 31-34.
Cannot be used with some PPE: face shield, large helmet, head-covered respirators, contamination suits, bulky gloves, large eyeglasses
The HUD should be designed to be compatible with PPE. Buttons on the HUD control should be made larger. HUD should also provide plastic eyewear of different sizes so users with different face sizes and shapes can wear the plastic eyewear comfortably.
HUD control box and camera become warm after 4 hours of continuous use
Prevent heated devices from direct contacts with human skin.
Cleaning problem: cannot use water, alcohol or other solvents; clean, soft cloth may not be feasible to be used outdoor
This requires a change of device material and design so it can be cleaned with necessary material. Disposable cover may also be used to solve this problem.
Lack of optical zoom Choose a camera that is equipped with optical zoom*.
Temperature restriction There are color CCD cameras that can function in the range from -20 to 55 C (-4 to 133 F).
Advanced Health and Disaster Aid Network: Final Report
Johns Hopkins University Applied Physics Laboratory NSTD-07-896 v1.0 09/30/2007 Page 4–44
In summary, there are several studies on using mobile video-teleconference to provide telemedicine consultation in preparation for mass casualty disaster. A system used in these environments must be versatile, small, light, durable, easy to use, and have good data transmission. Although the HDCS examined in this report is a preliminary model, rigorous testing criteria were applied to examine whether the model is feasible for use in mass casualty and better understand what aspects of the model require further improvement. The follow list summarizes the findings of the evaluation and suggestions on product improvement: Human Factors:
The system is easy to use. A better and more convenient power recharge package is necessary. Due to cables and wires involved, loose connections occur quite frequently when exposed
to movement. Image Quality
The camera should be equipped with optical zoom in order to take close up images of patients.
Many of the image distortions such as color change and geometric distortion we observed are common to many cameras commercially available. While we don’t think these are clinically significant qualities that must be corrected for general clinical monitoring, improvement in these area would certainly be beneficial and may extend the use of the system to other functions such as tele-surgery.
Environmental
The system should be able to withstand larger temperature fluctuation. The component should be easier to clean or have some type of cleanable or disposable
cover to protect them from dirt and dust. Components should be fluid-proof. Some environmental scenarios such as radioactive environment could not be tested
within the scope of this project and due to a lack of manufacturer specification on device performance under these environments, further investigation is required.
Data Transmission
We have observed serious interference caused by nearby cell phone or two-way radios. The quality of data transmission could deteriorate and the range could be shortened due
to many factors such as the layout of a room, buildings and people nearby, data transmission interferences such as amateur radio transmitter, two-way radio, cell phone or any other devices that uses the same frequency bandwidth for data transmission.
The data transmission system must be robust and reliable. The followings are some suggestions to improve data transmission:
o Use frequencies that do not have much interference. o Use more than one wireless data transmission mechanisms such as incorporating
wi-fi ability in case of data loss by other means.
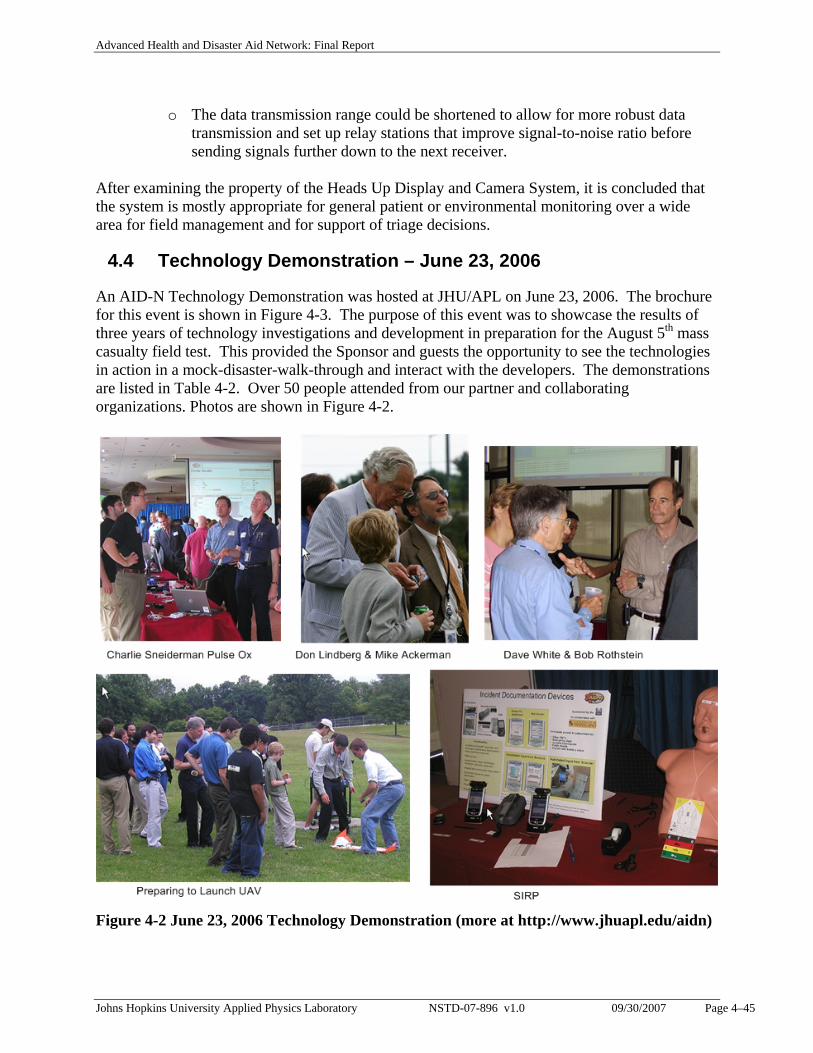
Advanced Health and Disaster Aid Network: Final Report
Johns Hopkins University Applied Physics Laboratory NSTD-07-896 v1.0 09/30/2007 Page 4–45
o The data transmission range could be shortened to allow for more robust data transmission and set up relay stations that improve signal-to-noise ratio before sending signals further down to the next receiver.
After examining the property of the Heads Up Display and Camera System, it is concluded that the system is mostly appropriate for general patient or environmental monitoring over a wide area for field management and for support of triage decisions.
4.4 Technology Demonstration – June 23, 2006
An AID-N Technology Demonstration was hosted at JHU/APL on June 23, 2006. The brochure for this event is shown in Figure 4-3. The purpose of this event was to showcase the results of three years of technology investigations and development in preparation for the August 5th mass casualty field test. This provided the Sponsor and guests the opportunity to see the technologies in action in a mock-disaster-walk-through and interact with the developers. The demonstrations are listed in Table 4-2. Over 50 people attended from our partner and collaborating organizations. Photos are shown in Figure 4-2.
Figure 4-2 June 23, 2006 Technology Demonstration (more at http://www.jhuapl.edu/aidn)
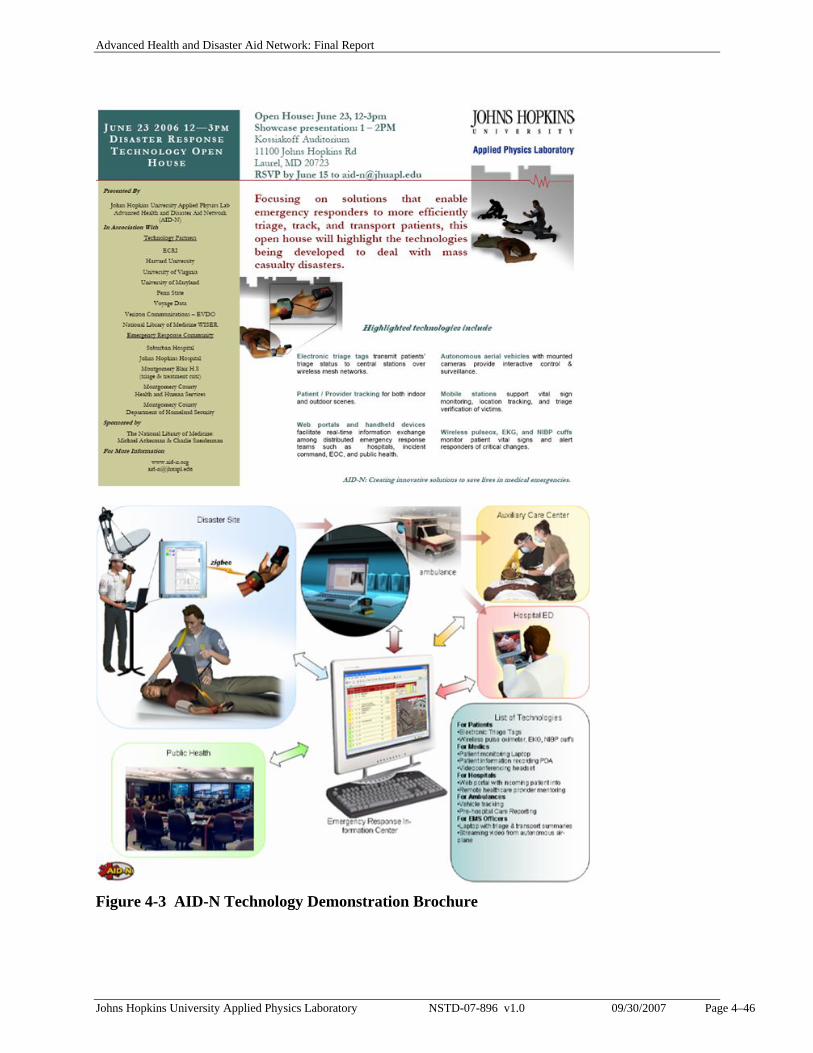
Advanced Health and Disaster Aid Network: Final Report
Johns Hopkins University Applied Physics Laboratory NSTD-07-896 v1.0 09/30/2007 Page 4–46
Figure 4-3 AID-N Technology Demonstration Brochure
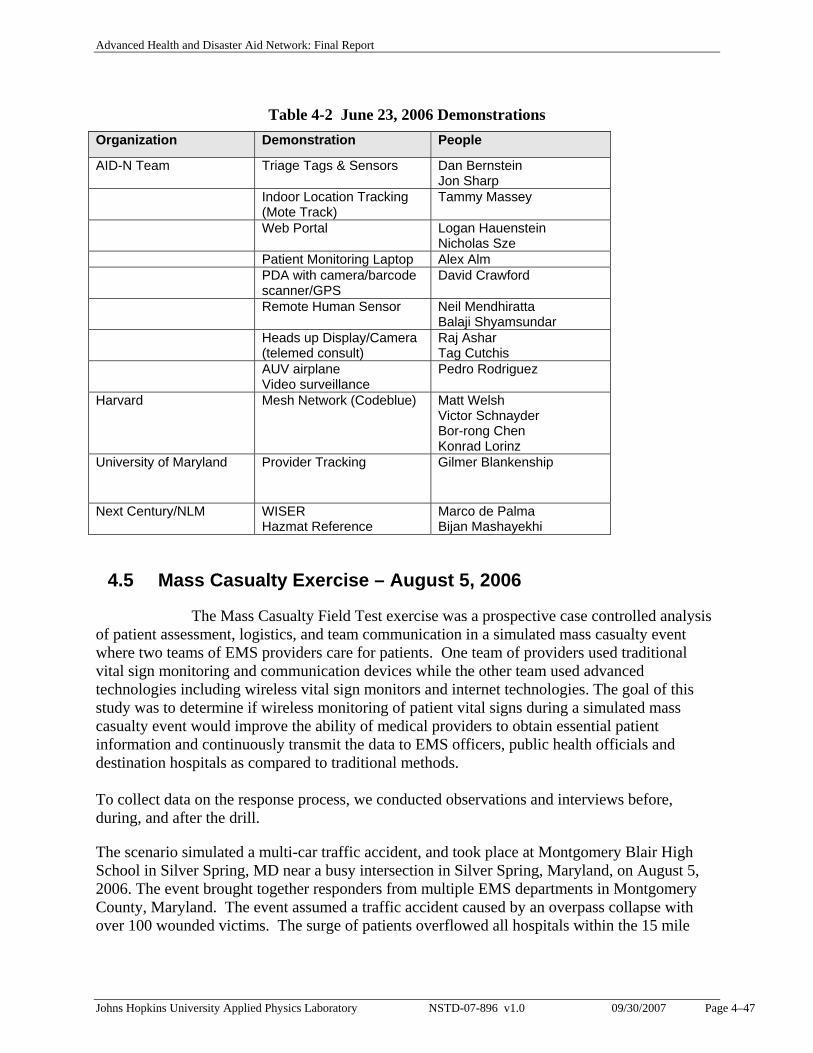
Advanced Health and Disaster Aid Network: Final Report
Johns Hopkins University Applied Physics Laboratory NSTD-07-896 v1.0 09/30/2007 Page 4–47
Table 4-2 June 23, 2006 Demonstrations Organization Demonstration People
AID-N Team Triage Tags & Sensors Dan Bernstein Jon Sharp
Indoor Location Tracking (Mote Track)
Tammy Massey
Web Portal Logan Hauenstein Nicholas Sze
Patient Monitoring Laptop Alex Alm PDA with camera/barcode
scanner/GPS David Crawford
Remote Human Sensor Neil Mendhiratta Balaji Shyamsundar
Heads up Display/Camera (telemed consult)
Raj Ashar Tag Cutchis
AUV airplane Video surveillance
Pedro Rodriguez
Harvard Mesh Network (Codeblue) Matt Welsh Victor Schnayder Bor-rong Chen Konrad Lorinz
University of Maryland Provider Tracking Gilmer Blankenship
Next Century/NLM WISER Hazmat Reference
Marco de Palma Bijan Mashayekhi
4.5 Mass Casualty Exercise – August 5, 2006
The Mass Casualty Field Test exercise was a prospective case controlled analysis of patient assessment, logistics, and team communication in a simulated mass casualty event where two teams of EMS providers care for patients. One team of providers used traditional vital sign monitoring and communication devices while the other team used advanced technologies including wireless vital sign monitors and internet technologies. The goal of this study was to determine if wireless monitoring of patient vital signs during a simulated mass casualty event would improve the ability of medical providers to obtain essential patient information and continuously transmit the data to EMS officers, public health officials and destination hospitals as compared to traditional methods. To collect data on the response process, we conducted observations and interviews before, during, and after the drill.
The scenario simulated a multi-car traffic accident, and took place at Montgomery Blair High School in Silver Spring, MD near a busy intersection in Silver Spring, Maryland, on August 5, 2006. The event brought together responders from multiple EMS departments in Montgomery County, Maryland. The event assumed a traffic accident caused by an overpass collapse with over 100 wounded victims. The surge of patients overflowed all hospitals within the 15 mile
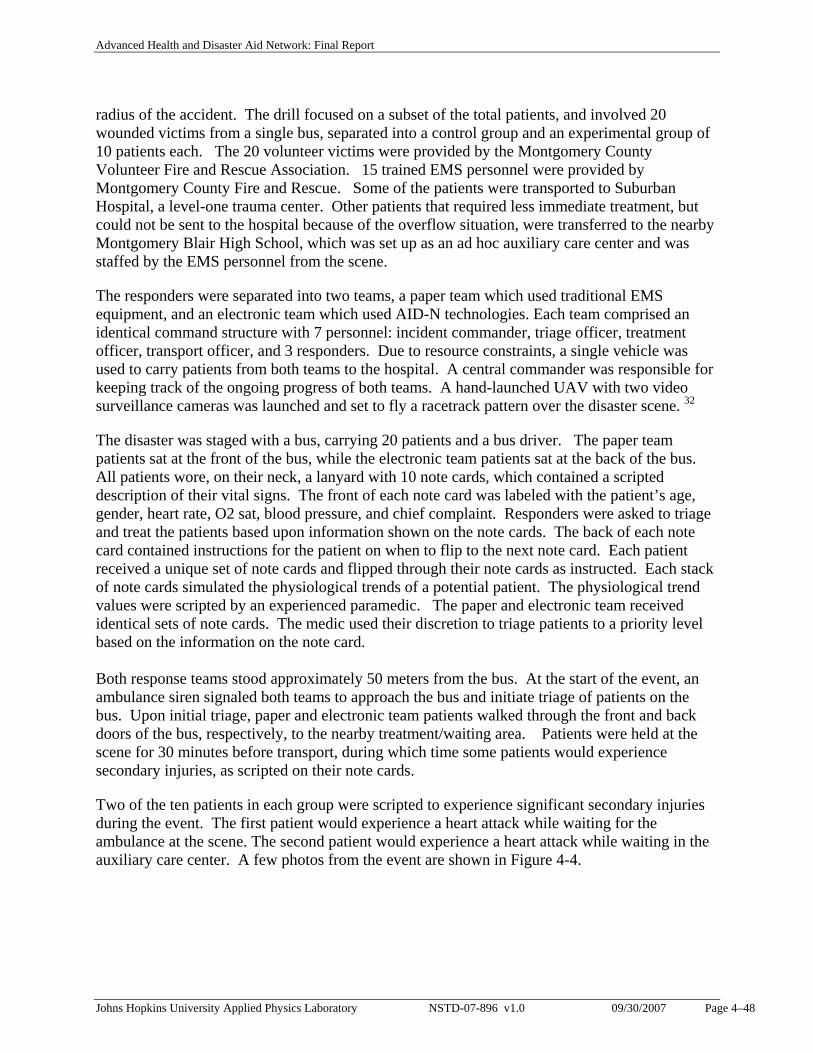
Advanced Health and Disaster Aid Network: Final Report
Johns Hopkins University Applied Physics Laboratory NSTD-07-896 v1.0 09/30/2007 Page 4–48
radius of the accident. The drill focused on a subset of the total patients, and involved 20 wounded victims from a single bus, separated into a control group and an experimental group of 10 patients each. The 20 volunteer victims were provided by the Montgomery County Volunteer Fire and Rescue Association. 15 trained EMS personnel were provided by Montgomery County Fire and Rescue. Some of the patients were transported to Suburban Hospital, a level-one trauma center. Other patients that required less immediate treatment, but could not be sent to the hospital because of the overflow situation, were transferred to the nearby Montgomery Blair High School, which was set up as an ad hoc auxiliary care center and was staffed by the EMS personnel from the scene.
The responders were separated into two teams, a paper team which used traditional EMS equipment, and an electronic team which used AID-N technologies. Each team comprised an identical command structure with 7 personnel: incident commander, triage officer, treatment officer, transport officer, and 3 responders. Due to resource constraints, a single vehicle was used to carry patients from both teams to the hospital. A central commander was responsible for keeping track of the ongoing progress of both teams. A hand-launched UAV with two video surveillance cameras was launched and set to fly a racetrack pattern over the disaster scene. 32
The disaster was staged with a bus, carrying 20 patients and a bus driver. The paper team patients sat at the front of the bus, while the electronic team patients sat at the back of the bus. All patients wore, on their neck, a lanyard with 10 note cards, which contained a scripted description of their vital signs. The front of each note card was labeled with the patient’s age, gender, heart rate, O2 sat, blood pressure, and chief complaint. Responders were asked to triage and treat the patients based upon information shown on the note cards. The back of each note card contained instructions for the patient on when to flip to the next note card. Each patient received a unique set of note cards and flipped through their note cards as instructed. Each stack of note cards simulated the physiological trends of a potential patient. The physiological trend values were scripted by an experienced paramedic. The paper and electronic team received identical sets of note cards. The medic used their discretion to triage patients to a priority level based on the information on the note card. Both response teams stood approximately 50 meters from the bus. At the start of the event, an ambulance siren signaled both teams to approach the bus and initiate triage of patients on the bus. Upon initial triage, paper and electronic team patients walked through the front and back doors of the bus, respectively, to the nearby treatment/waiting area. Patients were held at the scene for 30 minutes before transport, during which time some patients would experience secondary injuries, as scripted on their note cards.
Two of the ten patients in each group were scripted to experience significant secondary injuries during the event. The first patient would experience a heart attack while waiting for the ambulance at the scene. The second patient would experience a heart attack while waiting in the auxiliary care center. A few photos from the event are shown in Figure 4-4.
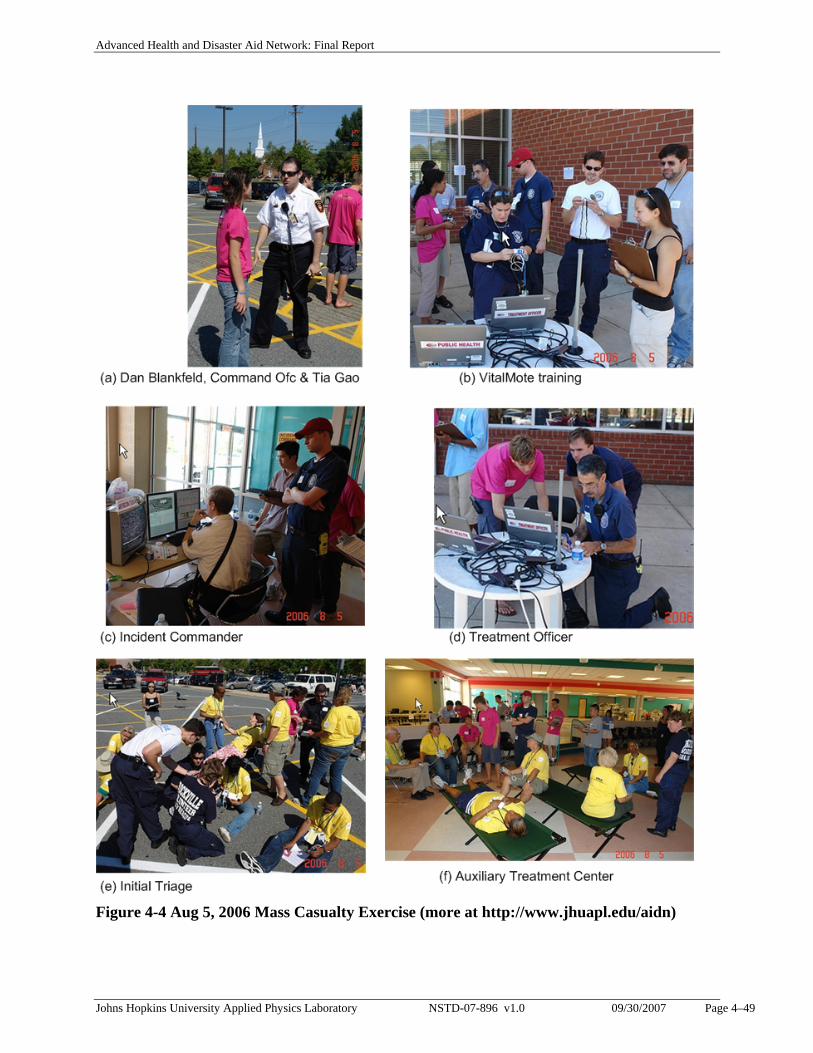
Advanced Health and Disaster Aid Network: Final Report
Johns Hopkins University Applied Physics Laboratory NSTD-07-896 v1.0 09/30/2007 Page 4–49
Figure 4-4 Aug 5, 2006 Mass Casualty Exercise (more at http://www.jhuapl.edu/aidn)
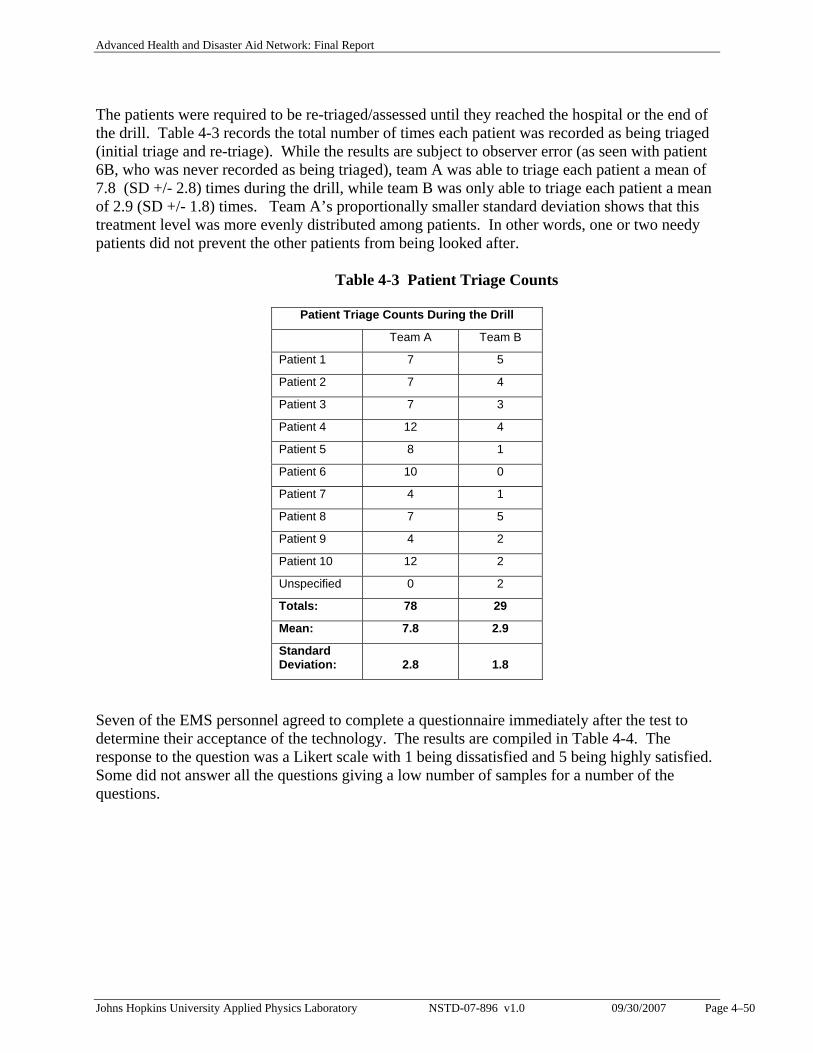
Advanced Health and Disaster Aid Network: Final Report
Johns Hopkins University Applied Physics Laboratory NSTD-07-896 v1.0 09/30/2007 Page 4–50
The patients were required to be re-triaged/assessed until they reached the hospital or the end of the drill. Table 4-3 records the total number of times each patient was recorded as being triaged (initial triage and re-triage). While the results are subject to observer error (as seen with patient 6B, who was never recorded as being triaged), team A was able to triage each patient a mean of 7.8 (SD +/- 2.8) times during the drill, while team B was only able to triage each patient a mean of 2.9 (SD +/- 1.8) times. Team A’s proportionally smaller standard deviation shows that this treatment level was more evenly distributed among patients. In other words, one or two needy patients did not prevent the other patients from being looked after. Table 4-3 Patient Triage Counts Seven of the EMS personnel agreed to complete a questionnaire immediately after the test to determine their acceptance of the technology. The results are compiled in Table 4-4. The response to the question was a Likert scale with 1 being dissatisfied and 5 being highly satisfied. Some did not answer all the questions giving a low number of samples for a number of the questions.
Patient Triage Counts During the Drill
Team A Team B
Patient 1 7 5
Patient 2 7 4
Patient 3 7 3
Patient 4 12 4
Patient 5 8 1
Patient 6 10 0
Patient 7 4 1
Patient 8 7 5
Patient 9 4 2
Patient 10 12 2
Unspecified 0 2
Totals: 78 29
Mean: 7.8 2.9
Standard Deviation: 2.8 1.8
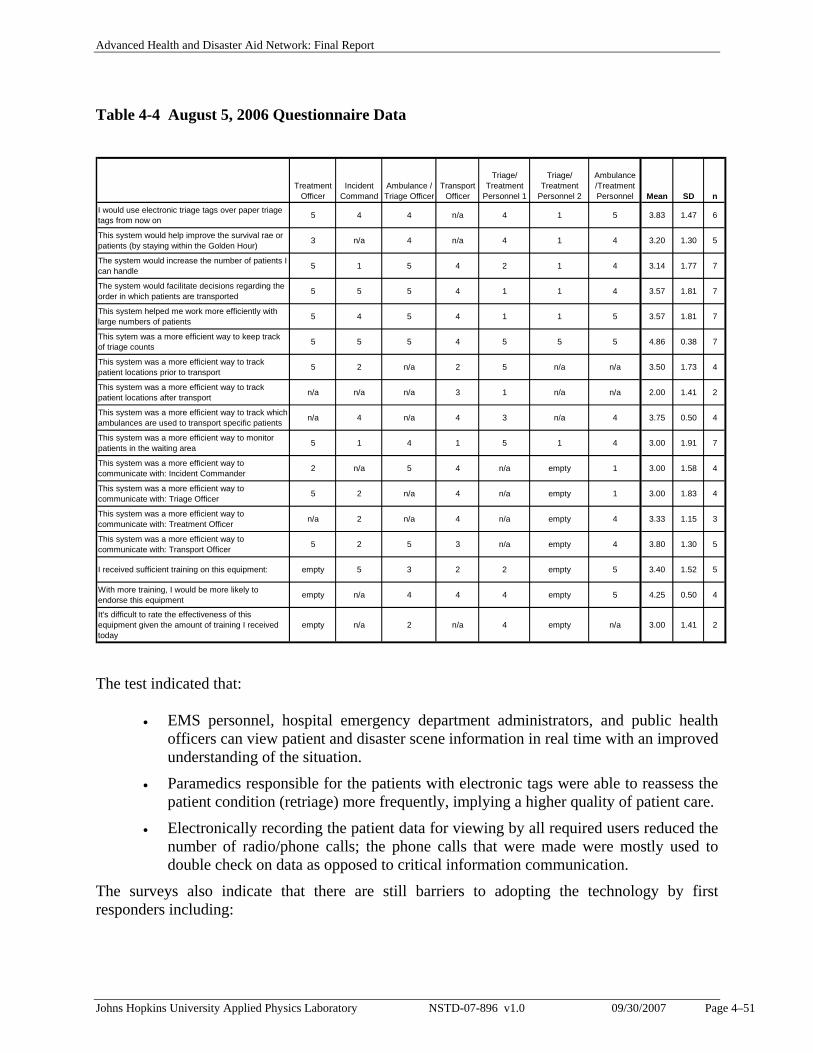
Advanced Health and Disaster Aid Network: Final Report
Johns Hopkins University Applied Physics Laboratory NSTD-07-896 v1.0 09/30/2007 Page 4–51
Table 4-4 August 5, 2006 Questionnaire Data
Treatment Officer
Incident Command
Ambulance / Triage Officer
Transport Officer
Triage/ Treatment
Personnel 1
Triage/ Treatment
Personnel 2
Ambulance /Treatment Personnel Mean SD n
I would use electronic triage tags over paper triage tags from now on 5 4 4 n/a 4 1 5 3.83 1.47 6
This system would help improve the survival rae or patients (by staying within the Golden Hour) 3 n/a 4 n/a 4 1 4 3.20 1.30 5
The system would increase the number of patients I can handle 5 1 5 4 2 1 4 3.14 1.77 7
The system would facilitate decisions regarding the order in which patients are transported 5 5 5 4 1 1 4 3.57 1.81 7
This system helped me work more efficiently with large numbers of patients 5 4 5 4 1 1 5 3.57 1.81 7
This sytem was a more efficient way to keep track of triage counts 5 5 5 4 5 5 5 4.86 0.38 7
This system was a more efficient way to track patient locations prior to transport 5 2 n/a 2 5 n/a n/a 3.50 1.73 4
This system was a more efficient way to track patient locations after transport n/a n/a n/a 3 1 n/a n/a 2.00 1.41 2
This system was a more efficient way to track which ambulances are used to transport specific patients n/a 4 n/a 4 3 n/a 4 3.75 0.50 4
This system was a more efficient way to monitor patients in the waiting area 5 1 4 1 5 1 4 3.00 1.91 7
This system was a more efficient way to communicate with: Incident Commander 2 n/a 5 4 n/a empty 1 3.00 1.58 4
This system was a more efficient way to communicate with: Triage Officer 5 2 n/a 4 n/a empty 1 3.00 1.83 4
This system was a more efficient way to communicate with: Treatment Officer n/a 2 n/a 4 n/a empty 4 3.33 1.15 3
This system was a more efficient way to communicate with: Transport Officer 5 2 5 3 n/a empty 4 3.80 1.30 5
I received sufficient training on this equipment: empty 5 3 2 2 empty 5 3.40 1.52 5
With more training, I would be more likely to endorse this equipment empty n/a 4 4 4 empty 5 4.25 0.50 4
It's difficult to rate the effectiveness of this equipment given the amount of training I received today
empty n/a 2 n/a 4 empty n/a 3.00 1.41 2
The test indicated that:
• EMS personnel, hospital emergency department administrators, and public health officers can view patient and disaster scene information in real time with an improved understanding of the situation.
• Paramedics responsible for the patients with electronic tags were able to reassess the patient condition (retriage) more frequently, implying a higher quality of patient care.
• Electronically recording the patient data for viewing by all required users reduced the number of radio/phone calls; the phone calls that were made were mostly used to double check on data as opposed to critical information communication.
The surveys also indicate that there are still barriers to adopting the technology by first responders including:
Advanced Health and Disaster Aid Network: Final Report
Johns Hopkins University Applied Physics Laboratory NSTD-07-896 v1.0 09/30/2007 Page 5–52
• Limited training: technologies must be used every day if they are to be successfully used in a critical disaster.
• Technologies can provide verification. They can also discover mistakes at a specific point of the disaster response process when the technology data differs from the manually reported data. This is a useful indicator of any mistakes that may happen in the ongoing disaster. However, this introduces a barrier because some responders feel uncomfortable to be watched over by the technology with their actions being double checked.
• Lack of trust in the technology: Responders are not willing, and rightfully so, to accept new technology at face value. They will not fully embrace new technology without extended testing and training and proof that it will improve their efficiency and effectiveness over a broad set of conditions.
• New technologies require new procedures and logistics at least at some level. This will also increase the requirement for training exercises.
5. CONCLUSIONS AND RECOMMENDATIONS
In conclusion, the AID-N Team:
• Has successfully created a system to track patients at a disaster scene and during transport to hospitals in a non-intrusive manner. This system allows first responders, emergency departments, and transportation officers to locate any patient at a MCI at any time.
• Involved the user community in the development and evaluation process from start to finish.
• Successfully demonstrated the feasibility and capability of substantially improving the emergency response and situational awareness of mass casualty incidents using existing network technologies and advanced electronic prototypes. 33
• Demonstrated the capability to conduct realistic emergency response operations involving representatives of the local emergency response community, namely, EMS fire and rescue personnel, emergency department administrators and physicians, and public health officials, all fully informed of the conditions at the scene in real time.
• Created a system for collecting a detailed prehospital patient record from the time a person is first triaged at the site of a disaster to the time they arrive at a hospital emergency department, which includes there identity information, chief complaint, vital signs, and medications/treatment provided.
• Developed the AID-N system to be scalable on the back end to any number of additional emergency response organizations and individuals, such as remote care specialists, Emergency Managers, Computer Aided Dispatch, Transportation Centers, Public Works, etc., up to server limits.
Advanced Health and Disaster Aid Network: Final Report
Johns Hopkins University Applied Physics Laboratory NSTD-07-896 v1.0 09/30/2007 Page 5–53
• The AID-N system is scalable on the front end as well. The AID-N project concentrated on medical sensors for acquisition of clinical data. On the front end the scaling can be extended to include different sensor types, such as environmental and chem/bio sensors, as well as extending the patient sensors to include a larger number of victims spread over larger areas. The expansion is dependent on the realistic number of wireless sensors operating in one or more ad hoc mesh networks (theoretically 65,000 each for ZigBee) and the bandwidth limitations of the personal area (ZigBee), and wide area (EVDO) network communication links. However, these limitations will recede with the expected rapid advances in ad hoc wireless networks at all levels of communication networks.
• Introduced new technology including Vital Motes (patient wireless wearable devices), SIRP (Surveillance and Incident PDAs), Web Portal Emergency Response Information Center, and Services Oriented Architecture (interfacing with existing systems).
• First Responders, who are responsible for stabilizing patients and collecting data, when evaluating the AID-N technology generally appreciated its ability to generate patient status reports and to have these reports available to the emergency departments before they and the patients arrive instead of the current method of writing notes on paper triage tags or clipboards, or orally conveying the information. However, they were not convinced that the improvements were worth carrying, using, or being dependent on more equipment during chaotic disaster situations. Incident Commanders and higher level EMS, on the other hand, who are on the data receiving side instead of the data collection side, were enthused with the prospect of seeing the number, priority, and location of patients in real time rather than waiting for First Responders to report the information by radio or when they have the opportunity to report the information in person.
• In general, personnel at higher levels of management and care providers beyond first responders generally see the value of new technology more readily than first responders and are more willing to entertain change.
• Demonstrated the suitability of the AID-N system to be used as an ad hoc Patient Information System for Auxiliary Care Centers, Temporary Treatment Area, or other impromptu care centers that are setup to serve victims of a Mass Casualty Incident that are stranded because of lack of transport, contamination, etc. In this mode of operation the SIRP handhelds are used by medics or volunteers to collect patient identification, chief complaint, next of kin, etc., which gets transferred to laptop computers via WiFi and to the ERIC central server via WiFi or EVDO connection to the Internet. Similarly, the VitalMotes are used to collect and continuously monitor the vital signs (SpO2, BP, EKG) for patients with degraded conditions.
• Organized a strong development team which included a core of interns (four from Montgomery Blair High School) with excellent skills in software development and advanced web programming. In addition, researchers from Harvard, UVa, UM, and Next Century joined the AID-N team and participated in the test bed development and demonstration on their own funds. Last but not least, the project would not have
Advanced Health and Disaster Aid Network: Final Report
Johns Hopkins University Applied Physics Laboratory NSTD-07-896 v1.0 09/30/2007 Page 5–54
succeeded without the participation of the Montgomery County Fire and Rescue Volunteer Service, as well as, EMS personnel from Fairfax, Arlington, and Baltimore counties. Everyone was gratified to work on a program that addresses a national critical need.
5.1 Recommendations
The current AID-N testbed was developed to a point consistent with demonstration to the user EMS, emergency department, public health community, and the sponsor. For certain, continued research, development, and testing in advanced information technology systems like AID-N are essential to satisfy the oft-stated and largely unmet needs of the emergency response community in mass casualty incidents. This has to be done in two directions that must converge, advancing the technology and advancing the user acceptance. It’s one thing to build advanced systems but unless this is done in concert with the users, from start to finish, it will not be successful. In this regard, we make two recommendations: an Open Emergency Response Technology Mobile Test Facility and investigation of Cell Phone Technology for Personal Health Monitoring. Open Emergency Response Technology Mobile Test Facility. To address the difficulty of inserting new technology into the EMS community we recommend establishing an Open Emergency Response Technology Mobile Test Facility to put advanced technology prototypes and new products into the hands of EMS, fire and rescue, and emergency medicine personnel during training exercises to the advantage of both the user and developer communities. For the user this would provide the EMS community the opportunity to understand the potential benefits of the new technology and at the same time would provide developers the feedback required to insure the equipment meets the users’ needs. This Mobile Test Facility would have the same basic architecture as the AID-N testbed but would emphasize the test and evaluation of existing technologies, including fieldable prototypes, instead of technology development. It would consist of a disaster information collection and a core communication system using, as much as possible, open standards architecture and off the shelf equipment. The information collection system would provide the capability to interface and network with equipment provided by the developer community, which would include a wide range of sensors, cameras, samplers, and other devices for monitoring patients, the environment, and the conditions at a disaster scene. Like the AID-N system this new facility would also have an architecture based on a central server operating as a web portal for storing data acquired during a test as well as allowing monitoring, archiving, and playback of the test. It would also employ a flexible web services system for interfacing with existing disparate systems which may include legacy databases. In addition, this facility would have a robust communication and networking system including radio, cellular, WiFi, WiMax, and a satellite communication terminal. The system would be a portable system deployable anywhere including Fire and Rescue training facilities and training exercises.
Advanced Health and Disaster Aid Network: Final Report
Johns Hopkins University Applied Physics Laboratory NSTD-07-896 v1.0 09/30/2007 Page 5–55
The objectives of a Mobile Test Facility are to:
1. Serve as an independent facility for independent testing of new and existing devices and computer programs for first responders and emergency medicine personnel, provided by any organization or company.
2. Expose the emergency response community to the potential benefits of new technology and obtain their feedback on its utility.
3. Use the facility as a command center during EMS training exercises for data collection, archiving, and report generation.
4. Allow remote experts to participate in the training exercises and independent tests. 5. Have a robust network infrastructure with capability of rapidly interfacing with any
organization and database via web services. 6. Include existing and emerging information and communication standards and publish
interface requirements for organizations to connect devices, subsystems, programs, databases, etc.
7. Include robust data collection and data analysis capability at the outset. 8. Be independent of any local communication infrastructure with capabilities that include:
mobile satellite terminal (internet connection and VoIP), portable WiFi and WiMax access points, ZigBee and BlueTooth receivers.
Cell Phone Technology for Personal Health Monitoring. One disadvantage of the AID-N VitalMote wireless sensors for use as electronic triage tags during mass casualty situations, pointed out by the some of the EMS evaluators, was logistical problems of storing, maintaining, and transporting hundreds of these tags to a disaster scene. Why not use cell phones? Looking ahead we could take advantage of rapid advances in the ubiquitous cell phone combined with emerging developments in biosensors. An example of combining the two is an Exmovere LLC Bluetooth biosensor that fits within a wristwatch. 34 The device collects an individual’s vital signs and automatically alerts caregivers of any abnormal activity by transmitting the alert wirelessly via a Bluetooth-enabled cell phone. We recommend initiation of an investigation into the use of cell phones for patient monitoring and tracking in disaster situations to include the capability to:
1. Securely store a person’s basic medical history information, which can be accessed by First Responders or whenever someone presents themselves to an Emergency Care facility.
2. Include vital sign sensors or other health monitors connected to the cell phone via Bluetooth.
3. Communicate with Incident Command Post at a disaster scene via Instant Messaging (IM) including sending identifying information of the family members or other people with the cell phone owner and their condition/chief complaints.
4. Communicate at least in the region of the disaster area, even during the typical cell phone communication brownout situations that occur during disasters due to network congestion, by using a portable cell phone tower (sometimes referred to a Cell-On-Wheels (COW)) as well as working with cellular providers to reconfigure the traffic patterns to favor the disaster area.
Advanced Health and Disaster Aid Network: Final Report
Johns Hopkins University Applied Physics Laboratory NSTD-07-896 v1.0 09/30/2007 Page 6–56
5. Localize these people via their cell phone GPS. 6. Allow victims to send cell phone photos to the Incident Command Post 7. Conduct IM and local cell phone communications during conditions of high usage
potentially with the aid of a portable cell phone antenna.
6. ACKNOWLEDGEMENTS
Many individuals and organizations have contributed to this project in significant ways. We would first like to thank the APL development team, led by Project Manager Tia Gao, who did an outstanding job in developing an advanced system taking full advantage of the rapid changes in the technology during the term of this project. We would also like the thank the subcontractor organizations for their valuable advice and contributions including Harold Lehmann from Johns Hopkins Medical Institutions, Cindy Notobartolo and Patricia Hawes from Suburban Hospital, Kathy Hurt-Mullen from Montgomery County Health and Human Services, Cliff Andrews from Optimus Corporation, Jonathan Gaev from ECRI Institute, and Gilmer Blankenship from University of Maryland. We are also indebted to Phil Gainous and Glenda Torrence from Montgomery Blair High School for permission to conduct our Mass Casualty Exercise at Blair and for the intelligent and motivated student interns who made major contributions. In this regard I would especially like to thank David Crawford for his insight and significant contributions, who started as a Blair intern but continued during summer breaks and part time work for four years. We are particularly grateful and would like to give special thanks to the following organizations and individuals that gave of their own time to participate and collaborate in this project. We thank the Montgomery County Fire and Rescue Service and the Montgomery County Homeland Security Department for their assistance in conducting the AID-N simulated Mass Casualty Exercise at Montgomery Blair High School on August 5, 2006. This includes Gordon Aoyagi, Director of MC Homeland Security for his interest in the project, assistance in planning the scenario, and approving Fire and Rescue participation. Special thanks and commendation goes to Chief Officer Dan Blankfeld. He was instrumental in organizing and supervising the team of 15 volunteer EMS personnel that participated in the exercise. He actively engaged in meetings with the APL team providing feedback on the AID-N technology and assisted in designing the scenario. The exercise was a great success, which in no small measure was due to the assistance and participation of these individuals. We are also grateful to Leo Selavo at University of Virginia for his expert circuit board design and development contributions. And would also like to thank Marco de Palma from Next Century Corporation and Bijan Mashayehki from National Library of Medicine for their assistance in integration of the WISER hazmat tool into AID-N. Finally, special thanks goes to Matt Welsh and his team at Harvard University for starting us with an initial CodeBlue mote and mesh network capability and continuing to assist and advise us in its development throughout the life of the project including test support at the Mass Casualty Exercise.
Advanced Health and Disaster Aid Network: Final Report
Johns Hopkins University Applied Physics Laboratory NSTD-07-896 v1.0 09/30/2007 Page 7–57
7. REFERENCES
1 http://www.nlm.nih.gov/research/siiawards.html 2 http://wiser.nlm.nih.gov 3 http://nextcentury.com/about_news_archives.html 4 http://grants.nih.gov/grants/guide/notice-files/NOT-LM-02-001.html 5 http://www.nlm.nih.gov/research/siiawards.html 6 “Iterative User-Centered Design of a Next Generation Patient Monitoring System for Emergency Medical Response,” Tia Gao, Matthew Kim, and Alex Alm. Proceedings of the American Medical Informatics Association Annual Symposium (AMIA 2006), Washington, DC, November 2006. 7 “Paramedic Operations Specification as a Launching Point for Mass Casualty Incident-Targeted Engineering Design,” Azmat Husain, Tia Gao, and David White. Proceedings of the American Medical Informatics Association Annual Symposium (AMIA 2006), Washington, DC, November 2006. 8 “Advanced Health and Disaster Aid Network (AID-N),” Volume 1. Technical Proposal AD-24495 JHU/APL, June 13, 2002, rev March 13, 2003. 9 http://miemss.umaryland.edu/IT.htm [Accessed September 2007] 10 “Vital Signs Monitoring and Patient Tracking Over a Wireless Network,” Tia Gao, Logan Hauenstein, Alex Alm, David Crawford, Cassius Sims, Azmat Husain, and David White, Johns Hopkins APL Technical Digest, vol 27, no. 1 (2006). 11 "A Cross-Functional Service Oriented Architecture to Support Real-Time Information Exchange during Mass Casualty Events," L. Hauenstein, T. Gao, D. White. IEEE Engineering Medicine and Biology Society Conference (IEEE EMBS 2006), New York, NY, September 2006. 12 “Service-Oriented Architecture for Disaster Response: Integration of AID-N, MICHAELS, WISER, and ESSENCE,” Logan Hauenstein, Tia Gao, and David White. Proceedings of the American Medical Informatics Association Annual Symposium (AMIA 2006), Washington, DC, November 2006. 13 “OPTIMUS Requirement/System Analysis Michaels Integration with Sensors for Mass Casualty,” T. Assefa, Optimus Corporation Report, May 1, 2005. 14 “Pervasive Patient Tracking,” Tia Gao, et al. Proceedings of the Eighth International Conference on Ubiquitous Computing (UbiComp 2006), Irvine, CA, September 2006. 15 "Vital Signs Monitoring and Patient Tracking Over a Wireless Network," T. Gao, D. Greenspan, M. Welsh, R. Juang, A. Alm. 27th IEEE EMBS Annual International Conference, September 2005. 16 “The Design of a Decentralized Electronic Triage System,” Tammara Massey, Tia Gao, Matt Welsh, and Jonathan Sharp. Proceedings of the American Medical Informatics Association Annual Symposium (AMIA 2006), Washington, DC, November 2006. 17 “Design of an Integrated, Wireless Triage System and Biomedical Devices for Continuous, Real-Time, Automated Patient Monitoring,” Tia Gao, Tammara Massey, Jon Sharp, Will Bishop, Daniel Bernstein, and Alex Alm. Proceedings of the IEEE Medical Devices and Biosensors Conference (IEEE MDBS 2006), Boston, MA, September 2006. 18 MicaZ Datasheet. Crossbow Technology, Inc. http://www.xbow.com/Products/Product_pdf_files/Wireless_pdf/MICAz_Datasheet.pdf. [Accessed September 2007.] 19 “CodeBlue: An Ad Hoc Sensor Network Infrastructure for Emergency Medical Care,” Malan D. Fulford-Jones T. Welsh M. Moulton S., International Workshop on Wearable and Implantable Body Sensor Networks, April 2004.
Advanced Health and Disaster Aid Network: Final Report
Johns Hopkins University Applied Physics Laboratory NSTD-07-896 v1.0 09/30/2007 Page 7–58
20 “Adaptive demand-driven multicast routing in multi-hop wireless ad hoc networks,” J. Jetcheva and D. Johnson. Proceedings of the 2nd ACM International Symposium on Mobile Ad Hoc Networking and Computing, July 2001. 21 “Pervasive Patient Tracking for Mass Casualty Incident Response,” Alex Alm, Tia Gao, and David White. Proceedings of the American Medical Informatics Association Annual Symposium (AMIA 2006), Washington, DC, November 2006. 22 "Next Generation Triage," T. Gao, D. White. IEEE Engineering Medicine and Biology Society Conference (IEEE EMBS 2006), New York, NY, September 2006. 23 http://nescc.sourceforge.net/ [Accessed September 2007.] 24 "Integration of Triage and Biomedical Devices for Continuous, Real-Time, Automated Patient Monitoring," T. Gao, T. Massey, J. Sharp, W. Bishop, D. Bernstein, A. Alm. IEEE Medical Devices and Biosensors Conference (IEEE MDBS 2006), Boston, MA, September 2006. 25 “Information Collection and Dissemination: Toward a portable, real-time information sharing platform for emergency response,” David Crawford, Tia Gao, and David White. Proceedings of the American Medical Informatics Association Annual Symposium (AMIA 2006), Washington, DC, November 2006. 26 “Lessons Learned from Baltimore County Public Safety Mass Casualty Table Top Exercise,” Marvin Sikes and Tia Gao. February 24, 2005. 27 “ECRI Evaluation of a Heads-Up Display and Camera System Used in Mass Casualty Situations: Final Report,” ECRI Institute, July 21, 2005. 28 “An Emergency Response UAV Surveillance System,” Pedro A. Rodriguez, William J. Geckle, MS, Jeffrey D. Barton, MS, John Samsundar, PhD, Tia Gao, Myron Z. Brown, MS, and Sean R. Martin, AMIA Annual Symposium Proceedings, 2006: 1078 29 “Advanced Health and Disaster Aid Network (AID-N) Videoconferencing Evaluation Report,” Raj Ashar, et al., JHU/APL Report, February 15, 2006. 30 “Participatory User Centered Design Techniques for a Large Scale Ad-Hoc Health Information System,” T. Gao, L. Selavo, T. Massey, M. Welsh. Proceedings of HealthNet07, Puerto Rico, June 11, 2007. 31 “Advanced Health and Disaster Aid Network (AID-N) Evaluation Plan,” JHU/APL National Security Analysis Department and ECRI Institute, APL Report JPO-2005-002/NSAD-R-2005-039, September 2005. 32 “An Emergency Response UAV Surveillance System,” Pedro A. Rodriguez, William J. Geckle, MS, Jeffrey D. Barton, MS, John Samsundar, PhD, Tia Gao, Myron Z. Brown, MS, and Sean R. Martin, AMIA Annual Symposium Proceedings, 2006: 1078 33 “Emergency Response Information Technology,” D. White, T. Gao, L. Lenert, P. Oh, G. Blankenship. Proceedings of the American Medical Informatics Association Annual Symposium (AMIA 2006), Washington, DC, November 2006. 34 http://www.eweek.com/article2/0,1759,1991299,00.asp [Accessed September 2007.]