Advanced Airline Sourcing - - Get a Free Blog Here
54
1 Advanced Airline Sourcing Scott Gillespie Managing Partner tClara – Travel Data Made Brighter August 2013 San Diego © 2013 Scott Gillespie
Transcript of Advanced Airline Sourcing - - Get a Free Blog Here
1
Advanced Airline Sourcing
Scott Gillespie Managing Partner tClara – Travel Data Made Brighter August 2013 San Diego
© 2013 Scott Gillespie

2
About Scott Gillespie
Leading expert on travel procurement, data analysis and Managed Travel 2.0
Managing Partner of tClara, an on-demand data analysis shop specializing in the travel category
Author of a U.S. patent covering airline bid analysis
Author, “Gillespie’s Guide to Travel+Procurement”
Founder and CEO of Travel Analytics, the industry’s leading independent travel consultancy (1999-2008)
A.T Kearney’s global expert on travel sourcing (1993-1999)
MBA, University of Chicago
3
Where we’re headed
• Key concepts
• Assessing your supplier landscape
• The impact of the AA-US merger on airfares
• Building good scenarios
• Finding the best negotiating targets
• Analyzing your options
• Avoid these mistakes
• Q&A

4
Revenue Management Illustration
Illustrative 100-seat Aircraft
$50,000
$900
X 30 Seats
$400
X 70 Seats
$55,000
$500
X 100 Seats
$1,500
X 10 Seats
$1,200 X 20 Seats
$700
X 30 Seats
$300 X 40 Seats
$72,000

5
Airfare Inventory Booking Classes – Coach Cabin
Illustrative
Airfare Inventory Classes
High prices help ensure last-minute
availability
Low prices make planned trips more
affordable
Less Flexible
Lower Quality Product
More Flexible
Higher Quality Product
6
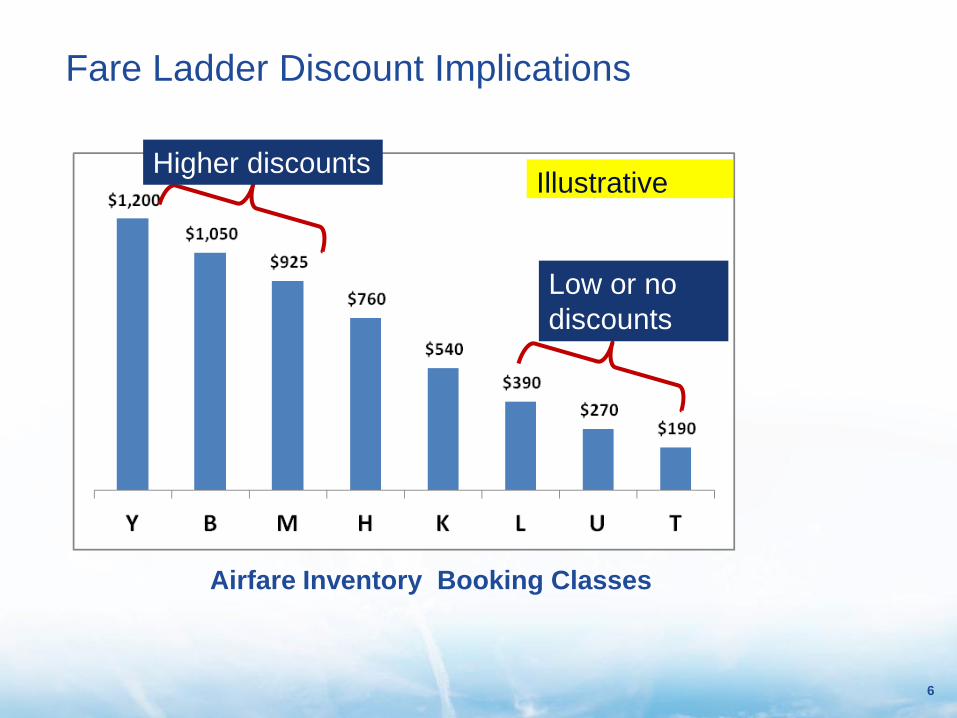
Airfare Inventory Booking Classes
Illustrative
Fare Ladder Discount Implications
Higher discounts
Low or no
discounts

7
Standard Air Sourcing Data Fields Key Field: POS-CP-CR-BC Two Data Fields
Each in-
scope
country
Non-
directional
airport
codes
Trimmed
from fare
basis code.
NOT Cabin
Half a round
trip, regardless
of connections
8
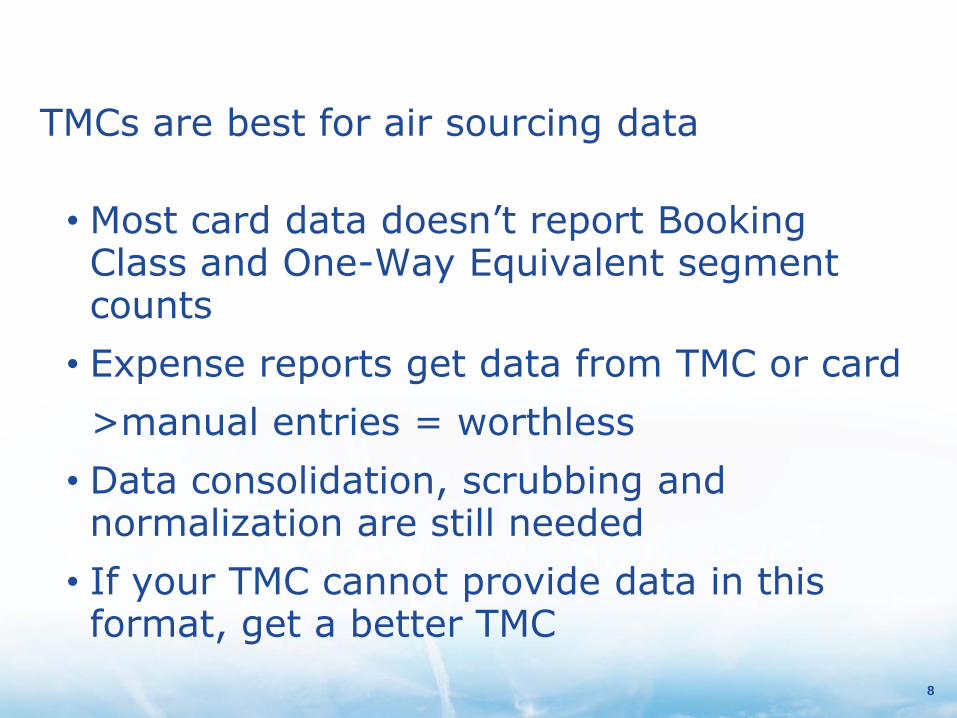
TMCs are best for air sourcing data
• Most card data doesn’t report Booking Class and One-Way Equivalent segment counts
• Expense reports get data from TMC or card
>manual entries = worthless
• Data consolidation, scrubbing and normalization are still needed
• If your TMC cannot provide data in this format, get a better TMC
9
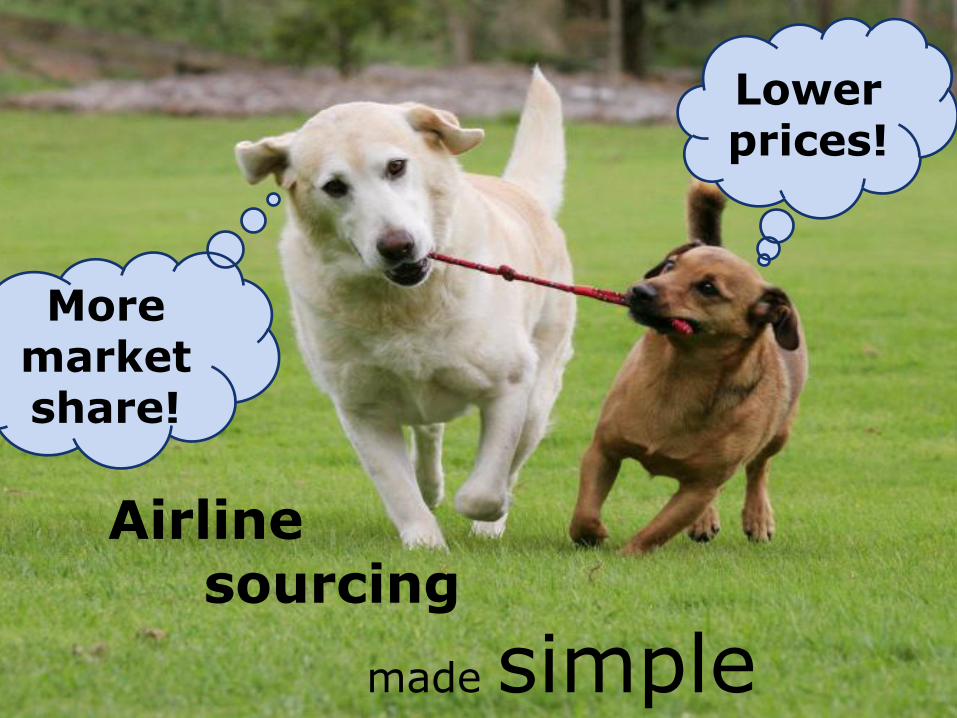
More market share!
Lower prices!
made simple
Airline sourcing

10
Recognize
a good deal
11
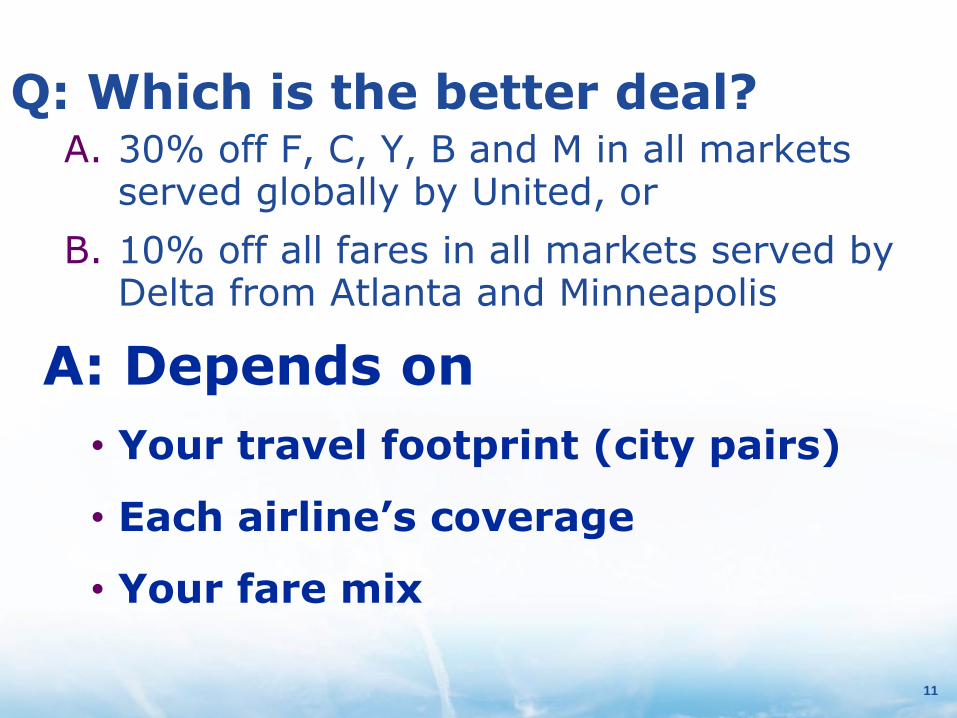
Q: Which is the better deal? A. 30% off F, C, Y, B and M in all markets
served globally by United, or
B. 10% off all fares in all markets served by Delta from Atlanta and Minneapolis
A: Depends on
• Your travel footprint (city pairs)
• Each airline’s coverage
• Your fare mix

12
Fair Market Share (FMS), aka QSI or Quality of Service Index
• Measures neutral capacity, before price or brand loyalty
• Expressed as a percentage of the market, e.g.,
–AA’s FMS in DFW<>JFK is 54% (illustrative)
• Time periods, connections and direction can matter a lot

13
Fair Market Share is the airline’s expected share of seats in a market,
based on seats, schedules and routings
Airport A Airport B
Delta
100 seats a day
United
100 seats a day
Fair Market Share Delta’s FMS = 50%
United’s FMS = 50% (assumes wing-to-wing
schedules)

14
Fair Market Share
Airport A Airport B
Delta
100 seats a day
United
100 seats a day
Delta’s FMS = 40%
United’s FMS = 40%
Southwest = 20%
Connecting Airport
Southwest
100 seats a day
Less weight for connections, and for longer connections

15
Getting FMS: Inputs are City Pairs and their spend
Fair Market
Share (FMS,
aka QSI)
Calculator
Beware – many versions of “Fair”
- include or ignore extra connections?
- JV/Alliance/Interline, or not?
- Define “good” connection?
16
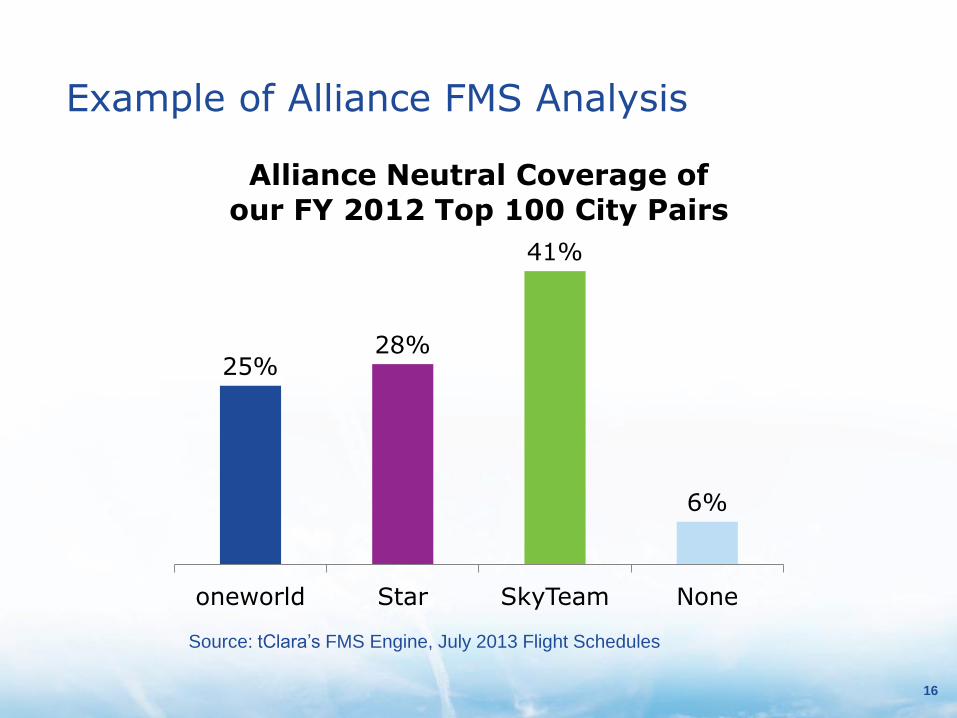
Example of Alliance FMS Analysis
25% 28%
41%
6%
oneworld Star SkyTeam None
Alliance Neutral Coverage of
our FY 2012 Top 100 City Pairs
Source: tClara’s FMS Engine, July 2013 Flight Schedules

17
Scenario Modeling is Critical
•Basis for modern airline sourcing
•Scenarios are “What if” options
•Typically involve Tier 1, 2 and 3 airlines
A.k.a. Primary, Secondary and Tertiary
Can have Co-primaries, co-secondaries, etc.
•Easy to model alliances
•Calculates detailed market shares by carrier and buyer’s savings for each scenario.

18
Primary, or Tier 1
Secondary, or Tier 2
Tertiary, or Tier 3
FMS Determines Airline’s Scenario Status

19
Scenario Examples
•DL as Primary, Star as Secondary
•DL/AF/KL as Primary, Star as Secondary
•DL + AA as Co-Primaries, then Star
•Star as Tier 1, then DL + AA as Tier 2
•Avoid DL: Make FL/AA/UA/US as Tier 1
•Modeling tools test 50-250 scenarios
20
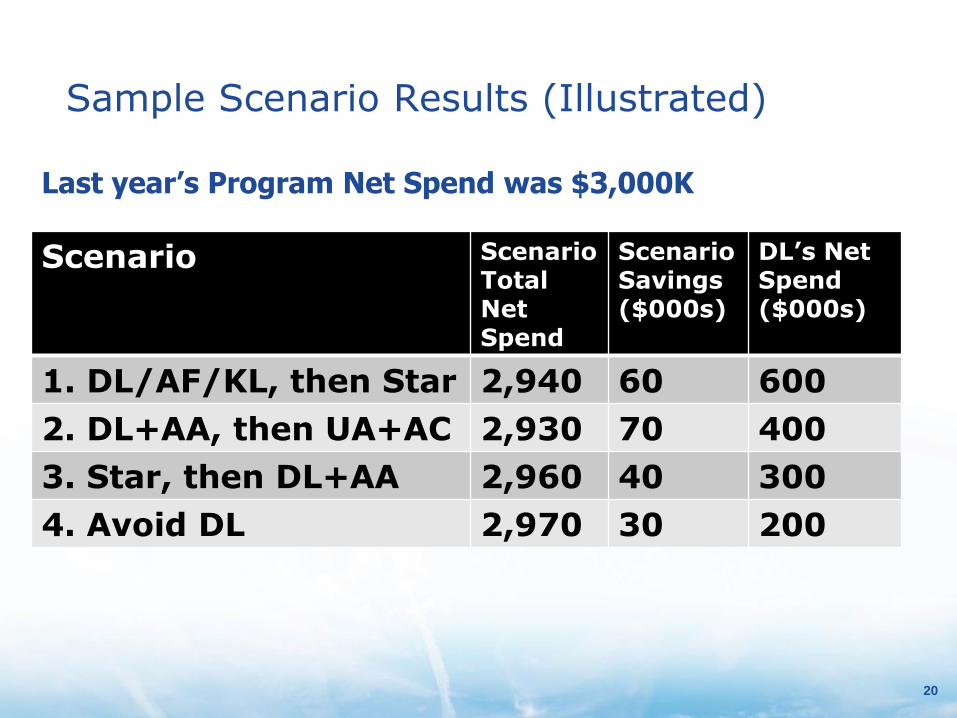
Sample Scenario Results (Illustrated)
Scenario ScenarioTotal Net Spend
Scenario Savings ($000s)
DL’s Net Spend ($000s)
1. DL/AF/KL, then Star 2,940 60 600
2. DL+AA, then UA+AC 2,930 70 400
3. Star, then DL+AA 2,960 40 300
4. Avoid DL 2,970 30 200
Last year’s Program Net Spend was $3,000K

21
Scenario Scenario Total Net Spend
Scenario Savings ($000s)
DL’s Net Spend ($000s)
1. DL/AF/KL, then Star 2,940 60 600
2. DL+AA, then UA+AC 2,930 70 400
3. Star, then DL+AA 2,960 40 300
4. Avoid DL 2,970 30 200
Buyer prefers No. 2
DL JV prefers No. 1
Scenario Implications
“So, Delta, here are your options…”
22
Goals Matter, Too!
• “We’ll give you a 30% discount, so long as you give us 75% market share”
• Two types of goal risk:
• Can you deliver 75%? (Unrealistic?)
• Have you promised more than 25% to any other airline? (Unachievable!).

23
Risky goals need attention
• Compare goal share to
–Historic Share
–Fair Market Share
–Scenario (projected) Share
• Identify overlapping goals (promising more than 100% share in a same market
• Negotiate for achievable goals, or take your risk of a reduced discount
24
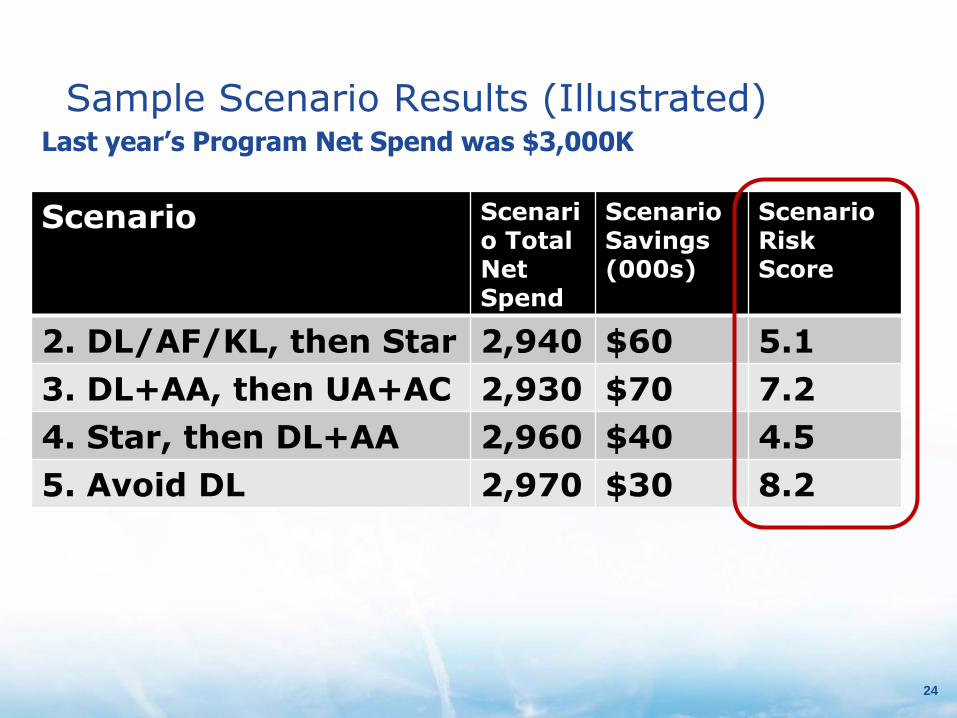
Sample Scenario Results (Illustrated)
Scenario Scenario Total Net Spend
Scenario Savings (000s)
Scenario Risk Score
2. DL/AF/KL, then Star 2,940 $60 5.1
3. DL+AA, then UA+AC 2,930 $70 7.2
4. Star, then DL+AA 2,960 $40 4.5
5. Avoid DL 2,970 $30 8.2
Last year’s Program Net Spend was $3,000K

25
Category (e.g., Air) Sourcing Options Map
<<Reward >> << Loss Savings >>
Risk
High
3 4
5
6
7
2
1
8
= Airline Supplier Scenario

26
Category (e.g., Air) Sourcing Options Map
<<Reward >> << Loss Savings >>
Risk
High
3 4
5
6
7
2
1
8
Apply
Logical
Elimination
= Airline Supplier Scenario

27
Sourcing Options for CEOs
Risk
High
4 6
7 “We recommend Option 6, but if you really want 7…”
= Airline Supplier Scenario
<<Reward >> << Loss Savings >>
28
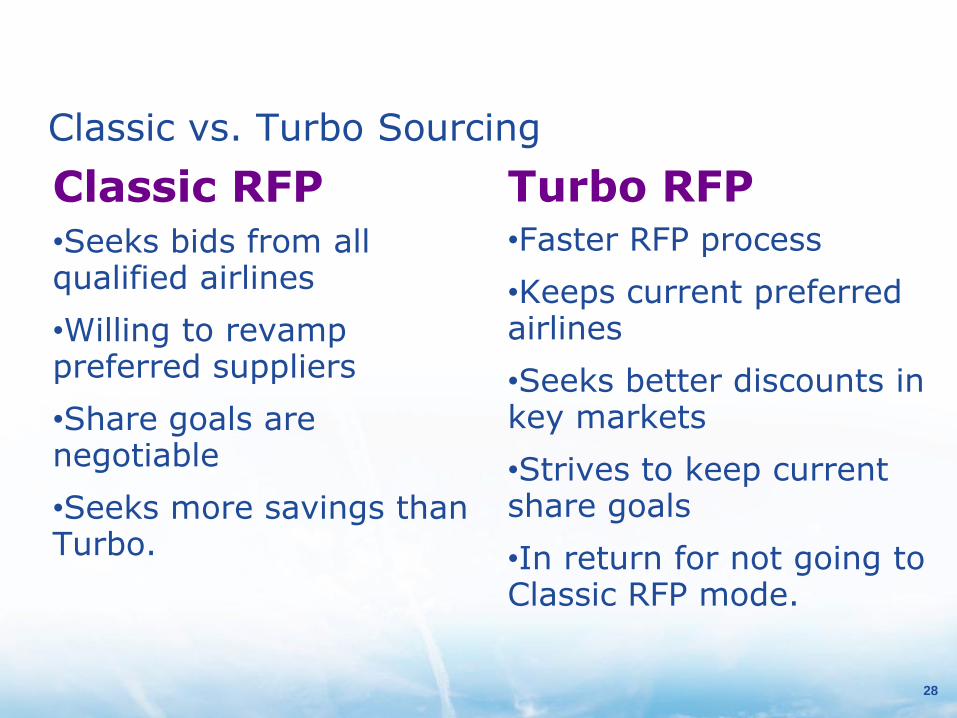
Classic vs. Turbo Sourcing
Turbo RFP •Faster RFP process
•Keeps current preferred airlines
•Seeks better discounts in key markets
•Strives to keep current share goals
•In return for not going to Classic RFP mode.
Classic RFP •Seeks bids from all qualified airlines
•Willing to revamp preferred suppliers
•Share goals are negotiable
•Seeks more savings than Turbo.

29
29
The Surprising Truth About Airline Discounts: Spend Doesn’t Matter
30
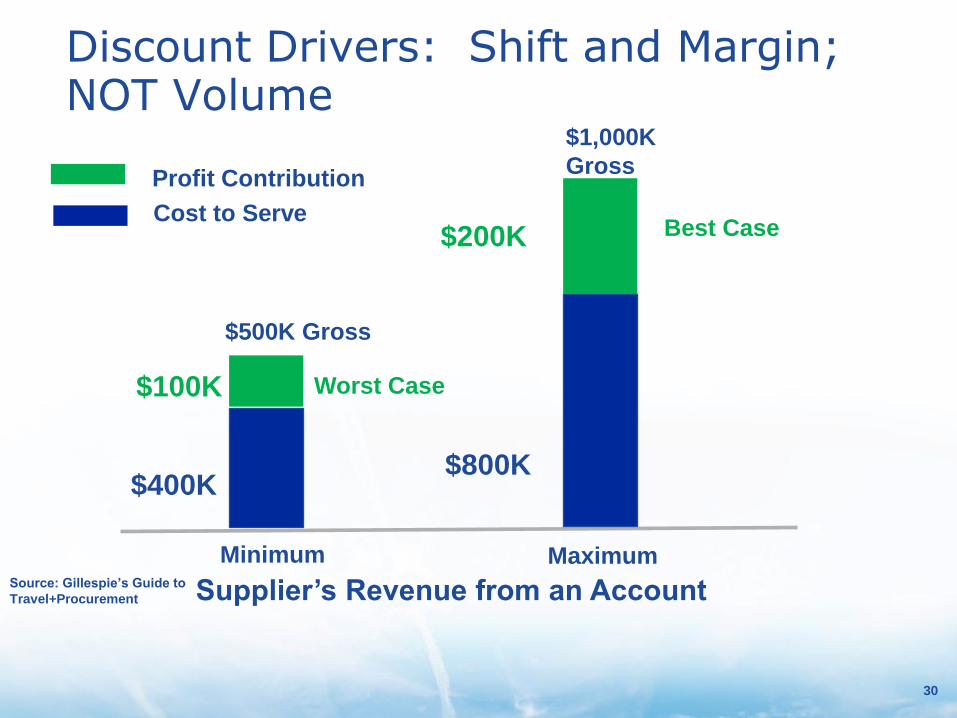
Discount Drivers: Shift and Margin; NOT Volume
Supplier’s Revenue from an Account
Minimum Maximum
$500K Gross
$400K
Profit Contribution
Cost to Serve
$800K
$200K
$1,000K
Gross
$100K Worst Case
Source: Gillespie’s Guide to
Travel+Procurement
Best Case

31
What’s the Maximum Discount?
$800K
$100K
Supplier’s Revenue from an Account
Minimum Maximum
$500K Gross
$400K
$1,000K Gross
Worst Case
$100K Worst Case,
NOT Negotiable
$100K Negotiable
Maximum Discount
$100K Negotiable
$1,000K
Gross
= 10%
Source: Gillespie’s Guide to
Travel+Procurement
Profit Contribution
Cost to Serve
32
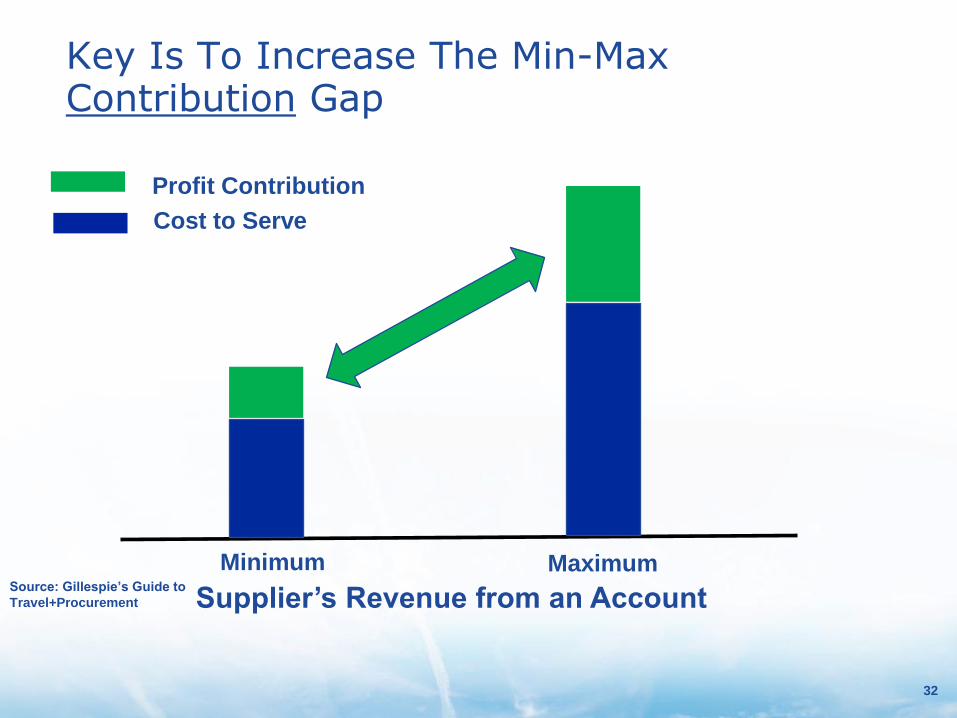
Key Is To Increase The Min-Max Contribution Gap
Supplier’s Revenue from an Account
Minimum Maximum Source: Gillespie’s Guide to
Travel+Procurement
Profit Contribution
Cost to Serve

33
Airfare Inventory Booking Classes
Illustrative
Fare Ladder Discount Implications
Higher discounts
Low or no
discounts

34
Expected Profit Margin and Share Shift, NOT Spend, Drives Discounts
More precisely, the credible threat or promise drives %
Y
Class
Disct.
Curve

35
Expected Profit Margin and Share Shift, NOT Spend, Drives Discounts
More precisely, the credible threat or promise drives %
Y
Class
Disct.
Curve
J
Class
Disct.
Curve
36
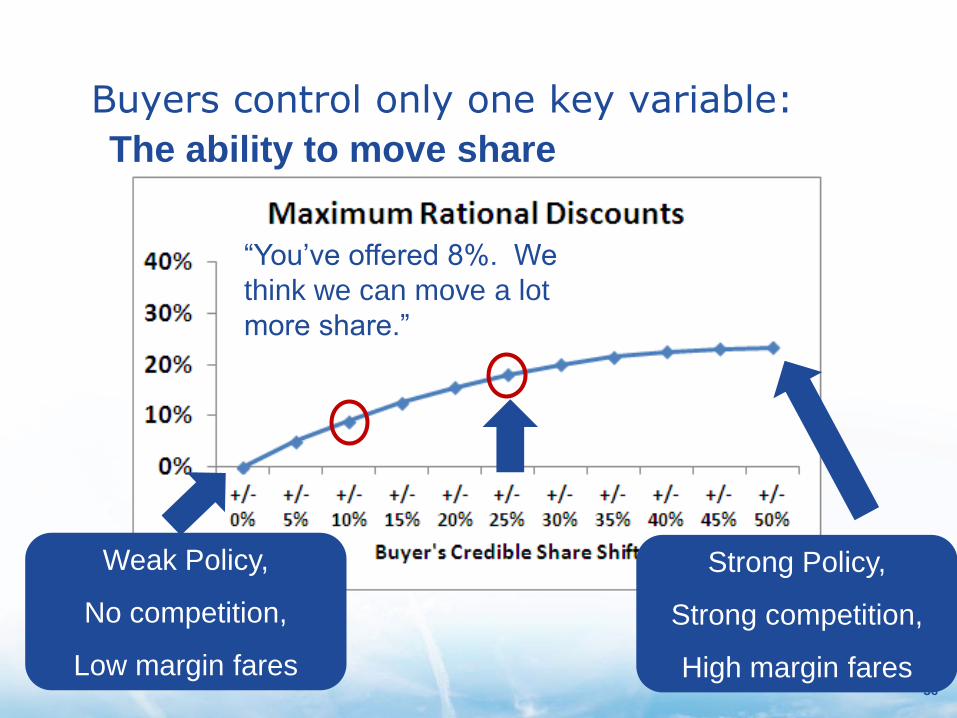
Buyers control only one key variable:
The ability to move share
“You’ve offered 8%. We
think we can move a lot
more share.”
Weak Policy,
No competition,
Low margin fares
Strong Policy,
Strong competition,
High margin fares

37
How will the AA-US merger affect our program?
Oneworld will become our largest alliance by capacity
Pre-merger Post-merger
Analysis of FY12’s top 500 global city pairs using tClara’s July 2013 FMS engine
Illustrative
38
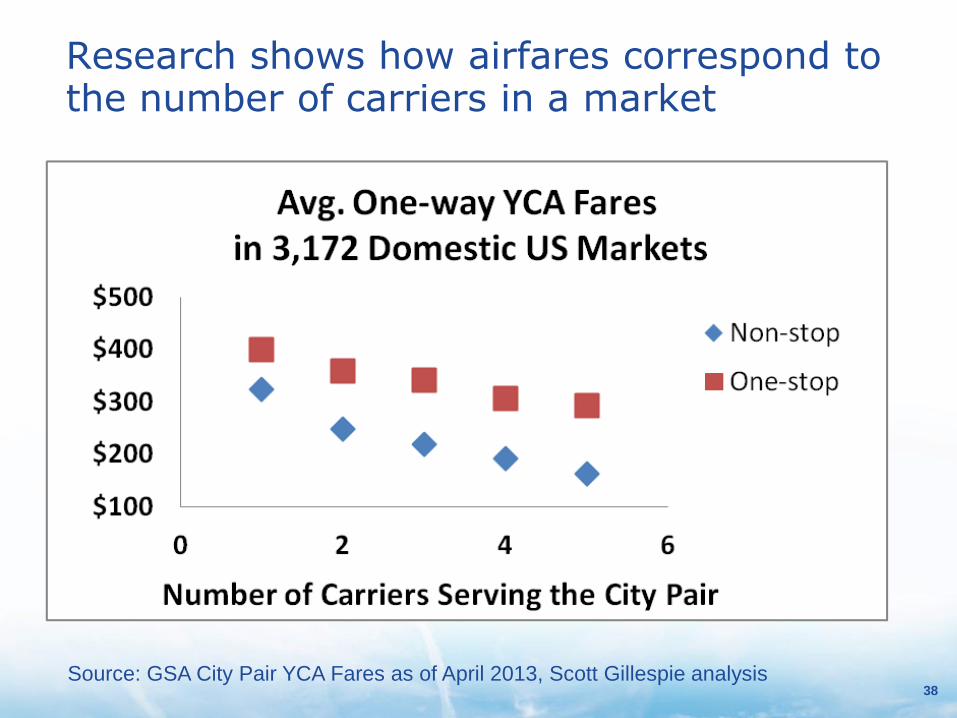
Research shows how airfares correspond to the number of carriers in a market
Source: GSA City Pair YCA Fares as of April 2013, Scott Gillespie analysis

39
Profit margins decline as competition increases
Source: GSA City Pair YCA Fares as of April 2013, Scott Gillespie analysis
40
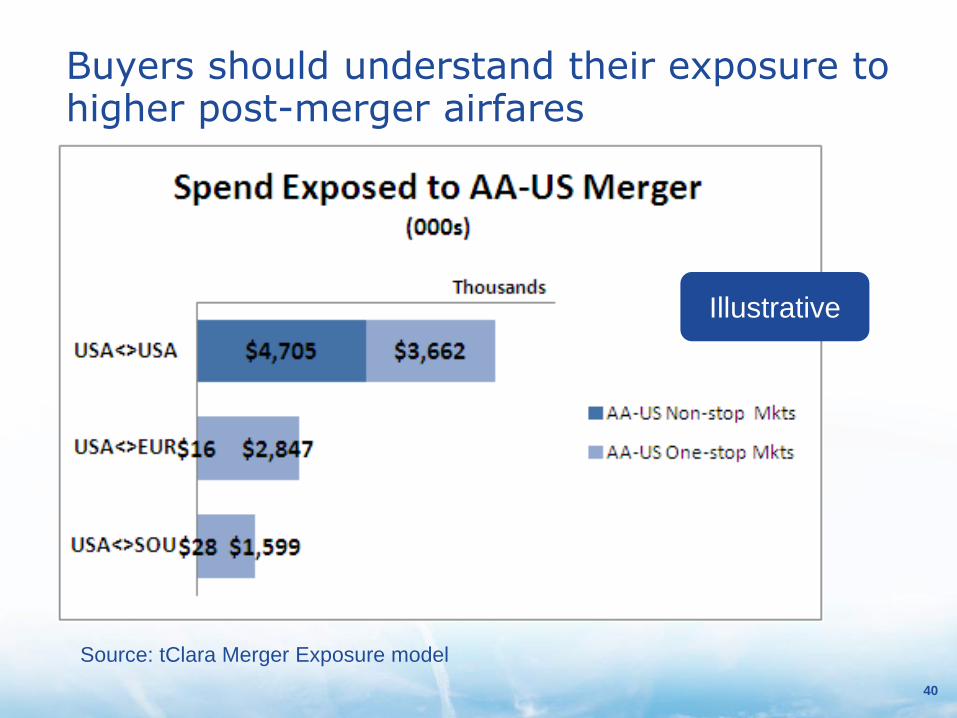
Buyers should understand their exposure to higher post-merger airfares
Illustrative
Source: tClara Merger Exposure model
41
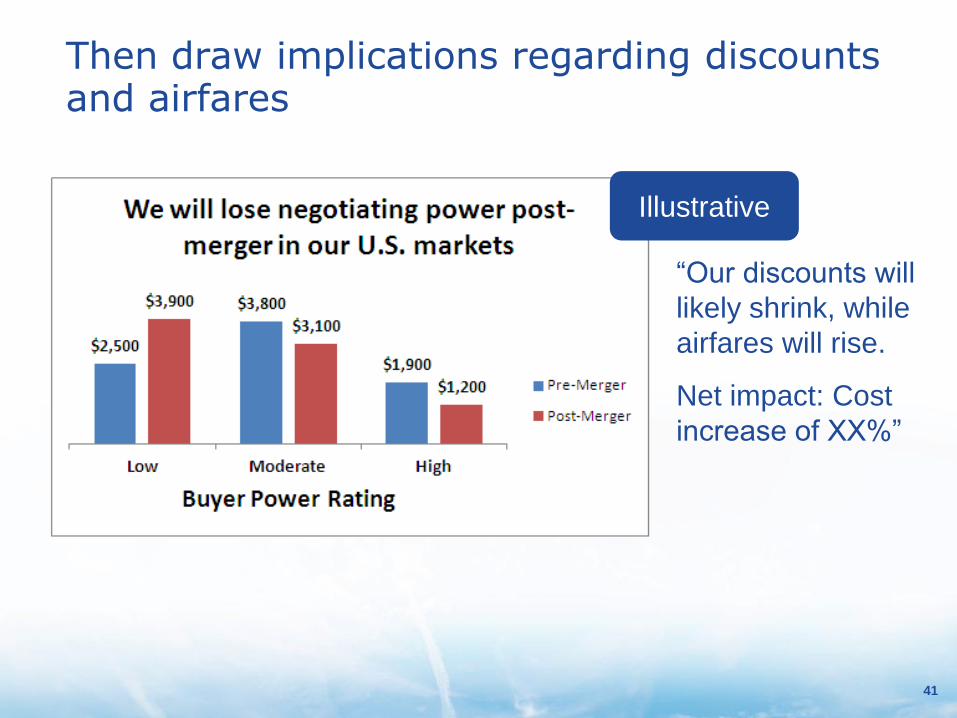
Then draw implications regarding discounts and airfares
“Our discounts will
likely shrink, while
airfares will rise.
Net impact: Cost
increase of XX%”
Illustrative
42
Airline Sourcing Mistakes to Avoid

43
Cramming the RFP process
“Here’s your RFP. You have two weeks to respond”
Should be:
Minimum 3 weeks for single point of sale
Minimum 4 weeks for Alliance bids – more if you need a bid from Air France during the summer

44
Over-estimating the procurement savings potential
“We should be able to save 10% by strategically sourcing our airlines”
Worse – when a consultant says that, especially without looking at your deals
Reality may be far different
Victory might be minimizing the cost increase

45
Wandering around the Land of
Stupid Statistics
Which
Cabin(s)?
Booked how
far in
advance?
Leisure or
Corporate?
$257, +/- ? Includes
taxes?

46
The Value of Benchmarking
• Diverse opinions of benchmarking’s value
• “Pricing comparisons among like-sized corporate contracts provides valuable feedback that can in fact highlight contract improvement opportunities.” Matthew Patterson, CWT Air Solutions, 2010
• “Airline price benchmarks are crap.”
Scott Gillespie, ~2001
Issues include:
– True “apples to apples” comparisons
– Doesn’t reveal share shift basis
– Timing of discounts and their associated jet fuel prices

47
De-coupling discounts from goals
• Some RFPs ask for discounts without their associated goals
–“We’ll talk about goals later”
• Better: “Show us how discounts change in return for more share shift”
48
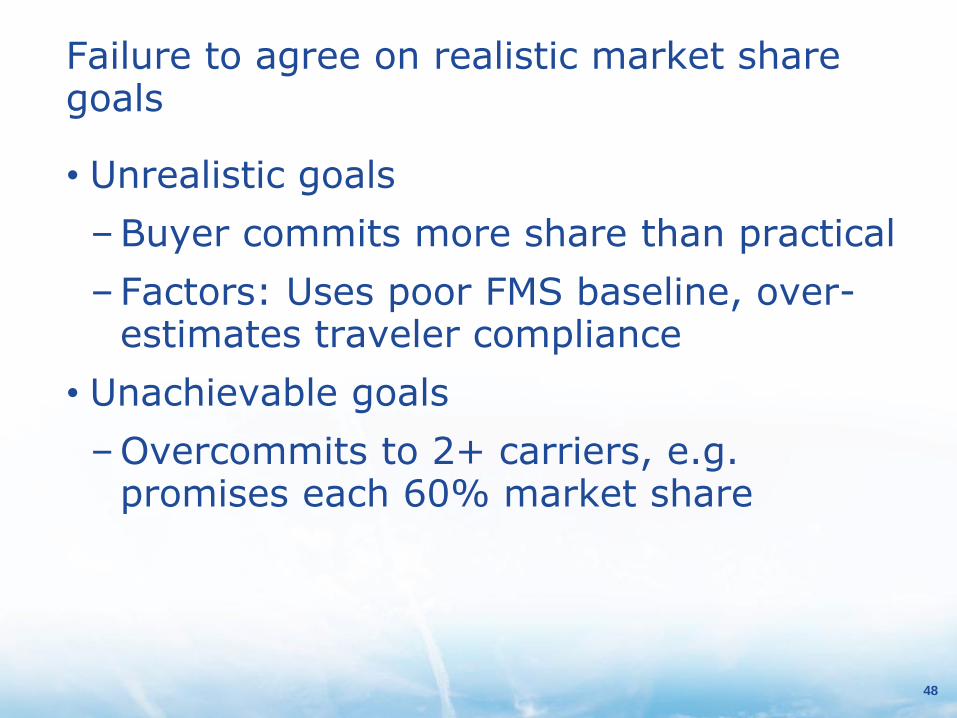
Failure to agree on realistic market share goals
• Unrealistic goals
–Buyer commits more share than practical
–Factors: Uses poor FMS baseline, over-estimates traveler compliance
• Unachievable goals
–Overcommits to 2+ carriers, e.g. promises each 60% market share

49
Fare Mix, Discounts and NER, WAD (Net Effective Rate, a.k.a. Weighted Average Discount)
• Fare mix is key to calculating discounts
• Historic fare mix determines the spend-weighted Net Effective Rate
Share of Spend
Booked Fare Class
Discount Net Eff. Rate
10% J 30% 3.0%
20% Y 20% 4.0%
40% M 15% 6.0%
30% T 0% 0.0%
13.0% Net Effective Rate =

50
Buyer and Airline must use same fare mix
• Airlines may use an “expected” or “new” fare mix
• Impossible to guarantee availability.
Share of Spend
Booked Fare Class
Discount Net Eff. Rate
10% J 30% 3.0%
5% Y 0% 0.0%
55% M 20% 11.0%
30% T 0% 0.0%
14.0% New Net Effective Rate =
13.0% Old Net Effective Rate =
51
51
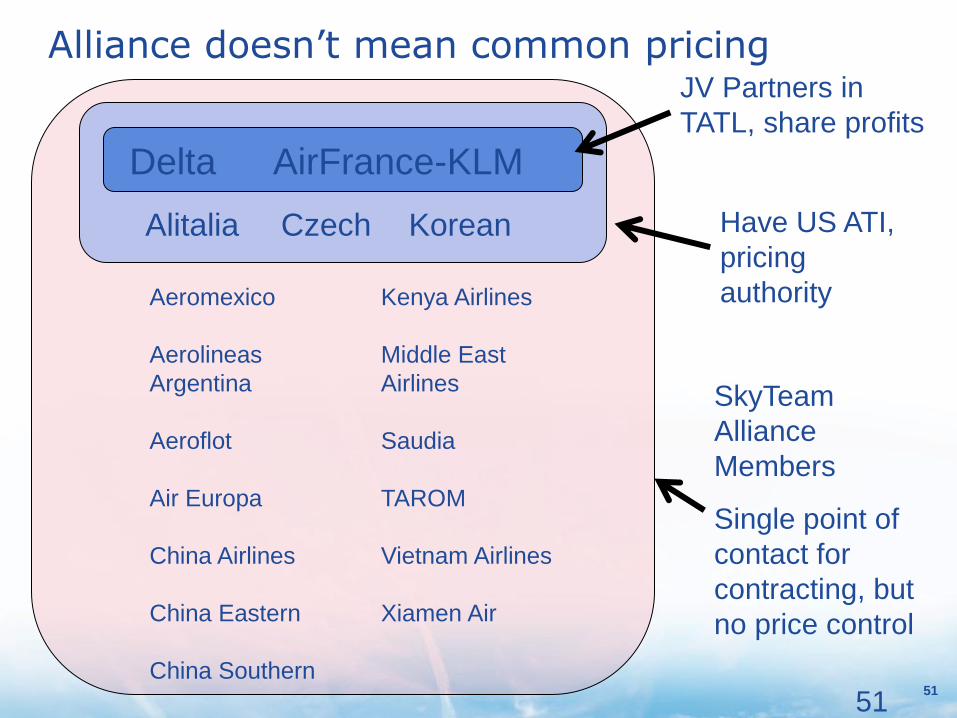
Alliance doesn’t mean common pricing
Delta AirFrance-KLM
Alitalia Czech Korean
Aeromexico
Aerolineas
Argentina
Aeroflot
Air Europa
China Airlines
China Eastern
China Southern
Kenya Airlines
Middle East
Airlines
Saudia
TAROM
Vietnam Airlines
Xiamen Air
JV Partners in
TATL, share profits
Have US ATI,
pricing
authority
SkyTeam
Alliance
Members
Single point of
contact for
contracting, but
no price control
52
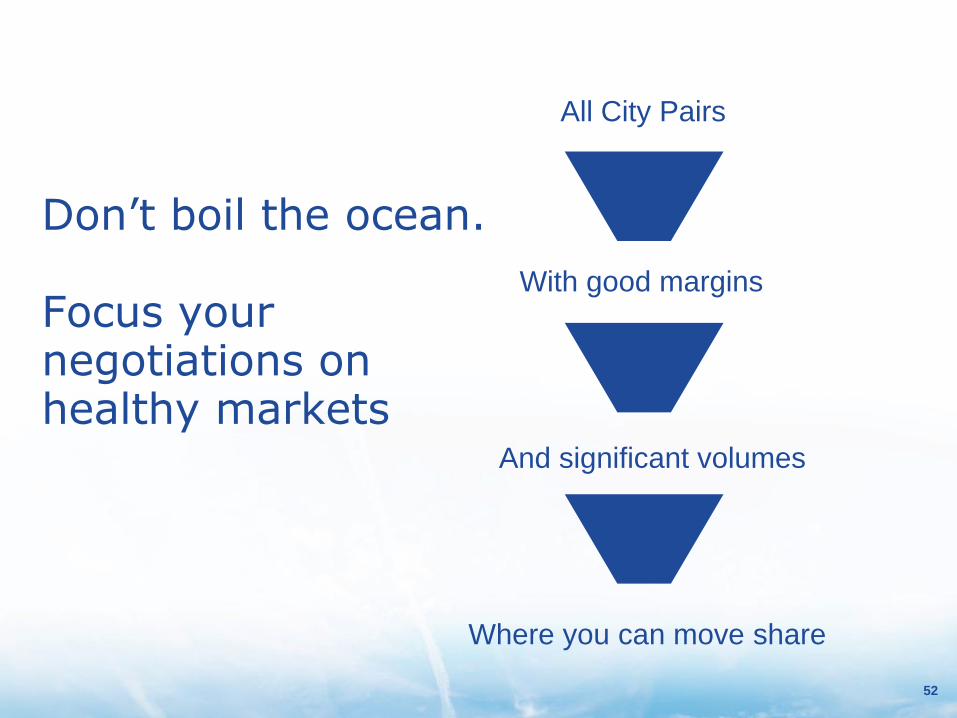
Don’t boil the ocean. Focus your negotiations on healthy markets
All City Pairs
Where you can move share
With good margins
And significant volumes

53
In Summary
• Understand Fair Market Share
• Use scenario modeling
• Use realistic market share goals and option maps
• Spend doesn’t drive discounts – share shift and profit margins drive discounts
• Expect higher airfares and smaller discounts in AA-US non-stop and one-stop markets
• Avoid making typical air sourcing mistakes

54
Thank You!
Scott Gillespie
(O) 440 248 4111
“Gillespie’s Guide to Travel+Procurement”
Active on LinkedIn