advance auto parts 2004_ar
59
READY WITH A WINNING TEAM 2004 Annual Report ®
-
Upload
finance48 -
Category
Economy & Finance
-
view
2.799 -
download
2
Transcript of advance auto parts 2004_ar

READY WITH A WINNING TEAM 2004 Annual Report
®
5673 A IRPO RT ROAD, ROAN O KE, VIRGIN IA 24 012 540.362.4911 www.AdvanceAutoParts.com
®
2004 ANNUAL REPORT®

Advance Auto Parts, Inc. and Subsidiaries
Corporate Information
Board of Directors and Committee Membership:John C. Brouillard (1, 2)
Chief Administrative and Financial Officer, H.E. Butt Grocery CompanyLawrence P. Castellani Chairman and Chief Executive Officer, Advance Auto Parts, Inc.Michael N. Coppola Executive Vice President and Chief Operating Officer, Advance Auto Parts, Inc.Darren R. Jackson (1, 3)
Chief Financial Officer and Executive Vice President, Best Buy Co., Inc.William S. Oglesby (3, 4)
Senior Managing Director, The Blackstone Group, L.P.Gilbert T. Ray (2, 4*)
Retired Partner, O’Melveny & Myers, LLPJohn M. Roth
Principal, Freeman Spogli & Co. (Resigned effective December 17, 2004)
Carlos A. Saladrigas (1*)
Co-founder and Chairman of the Board, Premier American BankWilliam L. Salter (2, 4, 5)
Retired President of the Specialty Retail Division, Sears, Roebuck, and Co.Francesca M. Spinelli (2*)
Senior Vice President, People, PETsMART, Inc.Nicholas F. Taubman(3*)
Retired Chairman and Chief Executive Officer, Advance Auto Parts, Inc.
Committee Membership:1Audit Committee, 2Compensation Committee, 3Finance Committee, 4Nominating and Corporate Governance Committee, 5Lead Director, *Chair
Executive Committee:Lawrence P. CastellaniChairman and Chief Executive Officer (Retiring as CEO effective May 18, 2005)
Jimmie L. WadePresident Michael N. CoppolaExecutive Vice President and Chief Operating OfficerJeffrey T. GrayExecutive Vice President and Chief Financial OfficerPaul W. KlasingExecutive Vice President, Stores David B. MuellerExecutive Vice President, Merchandising and MarketingRobert E. HedrickSenior Vice President, Human Resources (Resigned effective March 31, 2005)
Senior Vice Presidents:Ralph CastanzaSenior Vice President, Store Operations—NortheastConley P. KyleSenior Vice President, Store Operations (Retiring effective May 31, 2005)
Donald L. Lockard, Jr.Senior Vice President, Store Operations—WestEric M. MargolinSenior Vice President, General Counsel and SecretaryC. Roy MartinSenior Vice President, Logistics and ReplenishmentGeoffrey R. McCartySenior Vice President, AdvertisingD. Scott MillerSenior Vice President, Real EstateKurt R. SchumacherSenior Vice President, Store Operations—FloridaS. Lynn StevensSenior Vice President and Chief Information OfficerJoe H. Vaughn, Jr.Senior Vice President, Operations SupportKenneth A. Wirth, Jr.Senior Vice President, Store Operations—Southeast
Stockholder Information:Corporate Offices:5673 Airport Road Roanoke, Virginia 24012 540-362-4911
Internet Site:www.AdvanceAutoParts.com
Annual Meeting:May 18, 2005 at 8:30 a.m. The Hotel Roanoke and Conference Center 110 Shenandoah Avenue, NW Roanoke, Virginia 24016
Registrar and Transfer Agent:Mellon Investor Services, LLC P.O. Box 3315 South Hackensack, New Jersey 07606 1-800-298-6813 TDD for Hearing-Impaired: 1-800-231-5469 Foreign Stockholders: 201-329-8660 TDD Foreign Stockholders: 201-329-8354
Common Stock:Ticker Symbol: AAPListing: New York Stock Exchange
Independent Accountants:Deloitte & Touche, LLP 1750 Tysons Blvd. McLean, Virginia 22102
BOARD OF DIRECTORS:
Pictured from left to right, first row:Michael N. Coppola, William L. Salter
Pictured from left to right, second row: John M. Roth, Gilbert T. Ray, Nicholas F. Taubman, Lawrence P. Castellani, Francesca M. Spinelli
Pictured from left to right, third row: Darren R. Jackson, Carlos A. Saladrigas, John C. Brouillard, William S. Oglesby
des
igne
d b
y cu
rran
& c
onn
ors
, inc
. / w
ww
.cur
ran-
conn
ors
.co
m
0
500
1000
1500
2000
2500
3000
3500
4000
0
50
100
150
200
250
300
350
0
2
4
6
8
10
0
50
100
150
200
0.0
0.5
1.0
1.5
2.0
2.5
0
50
100
150
200
250
300
350
400
7.50
7.75
8.00
8.25
8.50
8.75
9.00
9.25
9.50
0
500
1000
1500
2000
2500
3000
2004 marked another record-setting year for Advance Auto Parts. Once again, our winning team executed on our many customer-focused initiatives and took advan-tage of the automotive aftermarket’s strong industry dynamics to grow sales and build our bottom line.
With over 37,000 Team Members in more than 2,650 stores and facilities across 39 states, Puerto Rico and the Virgin Islands, Advance Auto Parts is ready and positioned for strong future growth by doing what we do best—providing legendary service to our custom-ers!
resultsReady with
On the Cover (Clockwise from far left):1.-Teresa Carpentieri, Marketing Manager, Commercial Sales 2.-Mike Cox, Regional Vice President 3.-Shawn Murray, Creative Director 4.-Stella Carpenter, Manager of Human Resources—Corporate 5.-Matt Jeter, Distribution Center Manager 6.-Joe Sterbank, Regional Vice President 7.-Jill Livesay, Vice President, Controller 8.-Cindy Fain, Merchandise Manager 9.-Guy Broyles, Product Director, Purchasing
1 Source: R.L. Polk & Co.’s National Vehicle Population Profile® (NVPP®), data as of July 1st of each year
2 Source: 2004-2005 Aftermarket Factbook, Automotive Aftermarket Industry Association and raw data supplied by R.L. Polk & Co.’s National Vehicle Population Profile® (NVPP®), data as of July 1st of each year; 2004 total is company estimate based on information supplied by both sources.
†Estimated.
*NOTE: The Company uses non-GAAP measures as an indication of its earn-ings from its core operations and believes it is important to the Company’s stockholders due to the nature and significance of the excluded expenses. Please see our reconciliation of comparable operating income and compa-rable earnings per share included on page 1 of this annual report.
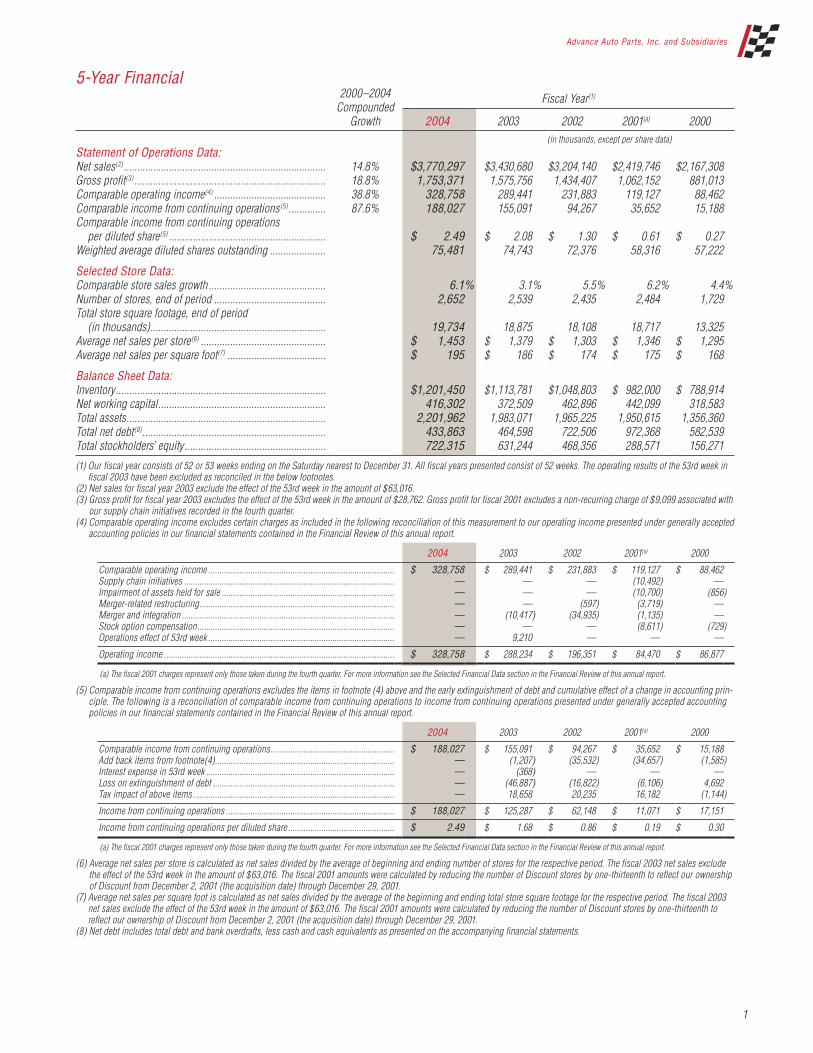
5-Year Financial
2000–2004 Compounded
Growth
Fiscal Year(1)
2004 2003 2002 2001(a) 2000 (in thousands, except per share data)
Statement of Operations Data:Net sales(2) ............................................................................ 14.8% $ 3,770,297 $ 3,430,680 $ 3,204,140 $ 2,419,746 $ 2,167,308Gross profit(3) ........................................................................ 18.8% 1,753,371 1,575,756 1,434,407 1,062,152 881,013Comparable operating income(4) .......................................... 38.8% 328,758 289,441 231,883 119,127 88,462Comparable income from continuing operations(5) .............. 87.6% 188,027 155,091 94,267 35,652 15,188Comparable income from continuing operations
per diluted share(5) ........................................................... $ 2.49 $ 2.08 $ 1.30 $ 0.61 $ 0.27Weighted average diluted shares outstanding ..................... 75,481 74,743 72,376 58,316 57,222
Selected Store Data:Comparable store sales growth ............................................ 6.1% 3.1% 5.5% 6.2% 4.4%Number of stores, end of period .......................................... 2,652 2,539 2,435 2,484 1,729Total store square footage, end of period
(in thousands) .................................................................. 19,734 18,875 18,108 18,717 13,325Average net sales per store(6) ............................................... $ 1,453 $ 1,379 $ 1,303 $ 1,346 $ 1,295Average net sales per square foot(7) ..................................... $ 195 $ 186 $ 174 $ 175 $ 168
Balance Sheet Data:Inventory ............................................................................... $ 1,201,450 $ 1,113,781 $1,048,803 $ 982,000 $ 788,914Net working capital ............................................................... 416,302 372,509 462,896 442,099 318,583Total assets ........................................................................... 2,201,962 1,983,071 1,965,225 1,950,615 1,356,360Total net debt(8) ..................................................................... 433,863 464,598 722,506 972,368 582,539Total stockholders’ equity ..................................................... 722,315 631,244 468,356 288,571 156,271
(1) Our fiscal year consists of 52 or 53 weeks ending on the Saturday nearest to December 31. All fiscal years presented consist of 52 weeks. The operating results of the 53rd week in fiscal 2003 have been excluded as reconciled in the below footnotes.
(2) Net sales for fiscal year 2003 exclude the effect of the 53rd week in the amount of $63,016.(3) Gross profit for fiscal year 2003 excludes the effect of the 53rd week in the amount of $28,762. Gross profit for fiscal 2001 excludes a non-recurring charge of $9,099 associated with
our supply chain initiatives recorded in the fourth quarter.(4) Comparable operating income excludes certain charges as included in the following reconciliation of this measurement to our operating income presented under generally accepted
accounting policies in our financial statements contained in the Financial Review of this annual report.
2004 2003 2002 2001(a) 2000
Comparable operating income .................................................................................... $ 328,758 $ 289,441 $ 231,883 $ 119,127 $ 88,462Supply chain initiatives ............................................................................................... — — — (10,492) —Impairment of assets held for sale .............................................................................. — — — (10,700) (856)Merger-related restructuring ........................................................................................ — — (597) (3,719) —Merger and integration ................................................................................................ — (10,417) (34,935) (1,135) —Stock option compensation ......................................................................................... — — — (8,611) (729)Operations effect of 53rd week .................................................................................... — 9,210 — — —
Operating income ........................................................................................................ $ 328,758 $ 288,234 $ 196,351 $ 84,470 $ 86,877
(a) The fiscal 2001 charges represent only those taken during the fourth quarter. For more information see the Selected Financial Data section in the Financial Review of this annual report.
(5) Comparable income from continuing operations excludes the items in footnote (4) above and the early extinguishment of debt and cumulative effect of a change in accounting prin-ciple. The following is a reconciliation of comparable income from continuing operations to income from continuing operations presented under generally accepted accounting policies in our financial statements contained in the Financial Review of this annual report.
2004 2003 2002 2001(a) 2000
Comparable income from continuing operations ........................................................ $ 188,027 $ 155,091 $ 94,267 $ 35,652 $ 15,188Add back items from footnote(4) ................................................................................. — (1,207) (35,532) (34,657) (1,585)Interest expense in 53rd week ..................................................................................... — (368) — — —Loss on extinguishment of debt .................................................................................. — (46,887) (16,822) (6,106) 4,692Tax impact of above items ........................................................................................... — 18,658 20,235 16,182 (1,144)
Income from continuing operations ............................................................................ $ 188,027 $ 125,287 $ 62,148 $ 11,071 $ 17,151
Income from continuing operations per diluted share ................................................ $ 2.49 $ 1.68 $ 0.86 $ 0.19 $ 0.30
(a) The fiscal 2001 charges represent only those taken during the fourth quarter. For more information see the Selected Financial Data section in the Financial Review of this annual report.
(6) Average net sales per store is calculated as net sales divided by the average of beginning and ending number of stores for the respective period. The fiscal 2003 net sales exclude the effect of the 53rd week in the amount of $63,016. The fiscal 2001 amounts were calculated by reducing the number of Discount stores by one-thirteenth to reflect our ownership of Discount from December 2, 2001 (the acquisition date) through December 29, 2001.
(7) Average net sales per square foot is calculated as net sales divided by the average of the beginning and ending total store square footage for the respective period. The fiscal 2003 net sales exclude the effect of the 53rd week in the amount of $63,016. The fiscal 2001 amounts were calculated by reducing the number of Discount stores by one-thirteenth to reflect our ownership of Discount from December 2, 2001 (the acquisition date) through December 29, 2001.
(8) Net debt includes total debt and bank overdrafts, less cash and cash equivalents as presented on the accompanying financial statements.
1
Advance Auto Parts, Inc. and Subsidiaries

We are serving our do-it-yourself and commercial customers through Category Management, expansion of our store brands, additional commercial programs, and improved supply chain efficiencies. Our new stores are providing our customers with more modern, convenient locations. Our Consumer Education program and investments in the latest technologies are complementing the expert advice of our well-trained team by putting information and state-of-the-art tools at their fingertips.
In 2004, we: Completed more than 210 million customer transactions, growing our sales to $3.8 billion.
Opened 125 new stores, ending the year with a total of 2,652. Expanded our comparable operating margin to 8.7% from 8.4% last year.* Raised our GAAP earnings per share 49% to $2.49 from $1.67 last year. Grew comparable earnings per share from continuing operations 20% to $2.49 from $2.08 last year.*
We produced solid results in 2004, and as we begin 2005 we are committed to getting good at getting better. Our growth is supported by strong industry dynamics, including an aging vehicle population, a rising trend in average miles driven, and a growing percentage of SUVs and light trucks that typically require more expensive replace-ment parts. In addition to these favorable fundamentals, we expect to grow our bottom line and expand our profitability by remaining focused on our objectives, as we continue providing our customers with: Clean, well-run stores—Our exciting, customer-friendly 2010 format is helping us to grow the most modern store base in the industry. In 2005, we will continue converting stores to this format market-by-market and plan to open between 150 and 175 new stores. By the end of 2005, more than 50% of our stores will be operating with this format.The right parts right now—Our customers know that they can count on us to have the parts they need when they need them. We will continue to enhance our supply chain efficiency with the open-ing of our new distribution center located outside of Allentown, Pennsylvania in the spring. Prices that can’t be beat—Advance is proud to be a value leader and we will continue to look for new ways to offer our customers “ready-to-go” low prices on our wide selection of parts, accessories and maintenance items.
People who know their stuff—Motivated by pride, our team’s commit-ment to our Company, our customers, their communities, and each other proves that “The Best Part is our People.” We will continue build-ing opportunities for our team through additional store openings. Strong organizational development and training programs are equip-ping our team with more knowledge and skills to serve our customers better. Our investment in our team is a key driver of our future success.
As previously announced, I will retire as Chief Executive Officer for Advance Auto Parts at our Stockholders Meeting on May 18, 2005. I am extremely grateful to our Team Members, our Board of Directors and our stockholders, who have allowed me the privilege of representing them as CEO for the past five years. I am honored to continue on as Chairman of the Board and look forward to support-ing the management team in the future. We are proud that Mike Coppola, who has served as Executive Vice President and Chief Operating Officer, will assume the role of Chief Executive Officer. Since joining Advance in February 2001, Mike has led numerous initiatives in merchandising, marketing, opera-tions, and supply chain, including the creation of our Company’s marketing plan. We are confident that Mike’s strong character and many years of experience in the retail industry will serve Advance well, as he leads our team to the next level of performance and beyond. Under Mike’s leadership we will continue to focus on raising the sales productivity of our stores, expanding our operating margins, generating strong free cash flow, and increasing our return on invested capital. In conclusion, we would like to thank our customers for your business and our stockholders for your support. We also want to thank our winning team for serving our customers. Your hard work is what makes us a leader in the automotive aftermarket industry. Advance Auto Parts is built on a strong foundation of integrity and commitment to customer service. We believe our future is bright, and we look forward to an exciting 2005 and beyond.
Advance Auto Parts is ready with results. 2004 was another record year for our Company due to our team’s commitment to provide our customers with legendary service and execute on our initiatives.
Above Photo: Executive Committee, pictured from left to right:1.-Bob Hedrick 2.-Dave Mueller 3.-Larry Castellani 4.-Mike Coppola 5.-Jim Wade 6.-Paul Klasing 7.-Jeff Gray
*NOTE: The Company uses non-GAAP measures as an indication of its earnings from its core operations and believes it is important to the Company’s stockholders due to the nature and significance of the excluded expenses. Please see our reconciliation of comparable operating income and comparable earnings per share included on page 1 of this annual report.
Letter to our
stockholders
2
Jim WadePresident
Larry CastellaniChairman and Chief Executive Officer

Advance Auto Parts, Inc. and Subsidiaries
Atendemos a nuestros clientes de los departamentos comercial y “hágalo usted mismo” a través de la gestión por categorías, expansión de las marcas de nuestras tiendas, programas comerciales adicionales y eficiencias mejoradas de la cadena de suministros. Nuestras tiendas nuevas ofrecen a los clientes ubica-ciones más modernas y convenientes. Nuestro programa de educación para clientes y nuestras inversiones en las últimas tecnologías complementan el asesoramiento brindado por nuestro equipo de expertos altamente capacita-dos, poniéndoles la información y las herramientas de vanguardia al alcance de la mano.
En 2004: Completamos mas de 210 millones de transacciones con clientes, lo que
hizo que nuestras ventas aumentaran a $3.8 mil millones. Abrimos 125 tiendas nuevas y terminamos el año con un total de 2,652. Ampliamos nuestro margen operativo comparable, que el año pasado fue
del 8.4%, al 8.7%.* Nuestras ganancias por acción, de acuerdo con los principios contables
GAAP, aumentaron un 49%, de $1.67 el año pasado, a $2.49. Las ganancias por acción comparables obtenidas de las operaciones conti-
nuas aumentaron un 20%, de $2.08 el año pasado, a $2.49.*
En 2004 obtuvimos sólidos resultados, y al comenzar 2005, nos comprome-temos a mejorar y perfeccionarnos. Nuestro crecimiento está apoyado por la fuerte dinámica de la industria, incluidos: la antigüedad cada vez mayor del parque automotor, una tendencia creciente en el promedio de millas conduci-das y un porcentaje en aumento de SUV y camionetas que, por lo general, requieren piezas de reemplazo más caras. Además de estas variables funda-mentales favorables, esperamos aumentar nuestros resultados y ampliar nuestra rentabilidad permaneciendo enfocados en nuestros objetivos, al tiempo que seguimos ofreciendo a nuestros clientes:
Tiendas limpias y bien administradas: Nuestro interesante y atractivo formato 2010 nos ayuda a desarrollar la base de tiendas más moderna de la industria. En 2005, seguiremos migrando nuestras tiendas a ese formato, mer-cado por mercado, y planeamos abrir entre 150 y 175 tiendas nuevas. Para finales de 2005, más del 50% de nuestra tiendas estará operando con este formato.
Las piezas correctas en el momento correcto: Nuestros clientes saben que pueden confiar en nosotros para tener las piezas que necesitan en el momento que las necesitan. Seguiremos mejorando nuestra eficiente cadena de suministros con la apertura del nuevo centro de distribución, ubicado en las afueras de Allentown, Pennsylvania, en la primavera.
Precios que no pueden igualarse: Advance se enorgullece de ser un líder de valor. Seguiremos tratando de encontrar nuevas formas de ofrecer a nuestros clientes la amplia selección de piezas, accesorios y artículos de man-tenimiento “listos para llevar”, a bajo precio.
Personal que conoce su trabajo: Motivado por el orgullo, el compromiso de nuestro equipo para con la Compañía, nuestros clientes, sus comunidades y cada uno de nosotros demuestra que “La mejor pieza es nuestro personal”. Seguiremos creando oportunidades para nuestro equipo con la apertura de tiendas adicionales. El fuerte desarrollo organizativo y los programas de capacitación están dotando a nuestro equipo de más conocimientos y habilidades para servir mejor a nuestros clientes. La inversión en nuestro equipo es el impulsor clave de nuestro éxito futuro.
Como anunciamos anteriormente, me retiraré como Director Ejecutivo de Advance Auto Parts en nuestra Reunión de Accionistas que se celebrará el 18 de mayo de 2005. Les estoy extremadamente agradecido a los miembros de nuestro equipo, a nuestra Junta de Directores y a nuestros accionistas, que me han permitido el privilegio de representarlos como Director Ejecutivo (CEO) en los últimos cinco años. Me siento honrado de poder continuar como Presidente de la Junta de Directores y espero poder respaldar al equipo de gestión en el futuro. Nos enorgullece que Michael Coppola, que se ha desempeñado como Vicepresidente Ejecutivo y Director de Operaciones (COO), asumá el cargo de Director Ejecutivo (CEO). Desde que se incorporó a Advance en febrero de 2001, Mike ha liderado varias iniciativas en comercialización, marketing, opera-ciones y en la cadena de suministros, incluida la creación del plan de marke-ting de nuestra Compañía. Estamos seguros de que la fuerte personalidad de Mike y su vasta experiencia en la industria minorista le servirán a Advance bien para que pueda liderar a nuestro equipo hacia el siguiente nivel de rendimiento y más allá. Bajo la dirección de Mike seguiremos enfocándonos en incrementar la pro-ductividad de ventas de nuestras tiendas, ampliar nuestros márgenes operati-vos, generar un sólido flujo de efectivo de libre disponibilidad y aumentar nuestro retorno sobre el capital invertido. Por último, quisiéramos agradecer a nuestros clientes por elegirnos y a nuestros accionistas por su apoyo. También queremos agradecer a nuestro equipo ganador por brindar servicio a nuestros clientes. Su arduo trabajo es lo que nos convierte en líderes en la industria del posmercado automotor. Advance Auto Parts está forjada sobre una sólida base de integridad y com-promiso con el servicio al cliente. Creemos que tenemos un futuro brillante y encaramos con entusiasmo el 2005 y los años venideros.
Jim Wade Larry CastellaniPresidente Presidente de la Junta de Directores y Director Ejecutivo (CEO)
Advance Auto Parts está lista con los resultados. 2004 fue otro año récord para nuestra Compañía, gracias al compromiso que asumió nuestro equipo para proporcionar a nuestros clientes un servicio legendario y llevar a cabo nuestras iniciativas.
3
*NOTA: La Compañía usa parámetros que no se rigen por los principios contables GAAP como indicación de sus ganancias a partir de las operaciones principales, y considera que esto es importante para los accionistas de la Compañía, debido a la naturaleza y la importancia de los gastos excluidos. Consulte nuestra conciliación de los ingresos operativos comparables y las ganancias por acción comparables incluida en la página 1 de este informe anual.
Carta para nuestros
accionistas

“”
We are proud to provide our customers with the best-looking stores in our industry and our team works hard to maintain our G.O.L.D. (Grand Opening Look Daily) standard seven days a week in every store!
Ralph Castanza, Senior Vice President, Store Operations–Northeast
Increasing Number of Vehicles (in millions)
Increasing Number of Vehicles* (in millions)
Total VehiclesVehicles 6+ Years Old
205
2000
209
2001
214
2002 2003 2004
Comparable Earnings Per Share From Continuing Operations (in dollars)
Comparable Earnings Per Share From Continuing Operations* (in dollars)
2000
$0.27
2001
$0.61
2002
$1.30
2003
$2.08
$2.49
2004
Comparable Income From Continuing Operations* (in millions)
Comparable Income From Continuing Operations (in millions)
2000
$15
2001
$36
2002
$94
2003
$155
$188
2004
Comparable Operating Margins* (in percent)
Comparable Operating Margin (in percent)
2000
4.1%
2001
4.9%
2002
7.2%
2003
8.4%8.7%
2004
Comparable Operating Income* (in millions)
Sales(in millions)
Comparable Operating Income (in millions)
2000
$88
2001
$119
2002
$232
2003
$289
$329
2004
Sales* (in millions)
2000
$2,167
2001
$2,420
2002
$3,204
2003
$3,431
$3,770
20040
500
1000
1500
2000
2500
3000
3500
4000
0
50
100
150
200
250
300
350
0
2
4
6
8
10
0
50
100
150
200
0.0
0.5
1.0
1.5
2.0
2.5
0
50
100
150
200
250
300
350
400
Increasing Average Age of Vehicles**
7.50
7.75
8.00
8.25
8.50
8.75
9.00
9.25
9.50
218
131128126123
224
137
Increasing Average Age of Vehicles (in years)
8.9
2000
9.0
2001
9.0
2002 2003 2004
9.29.3 †
0
500
1000
1500
2000
2500
3000
Number of Stores
1,729
2000
2,484
2001
2,435
2002 2003 2004
2,5392,652
1 2
storesReady with clean, well-run
4
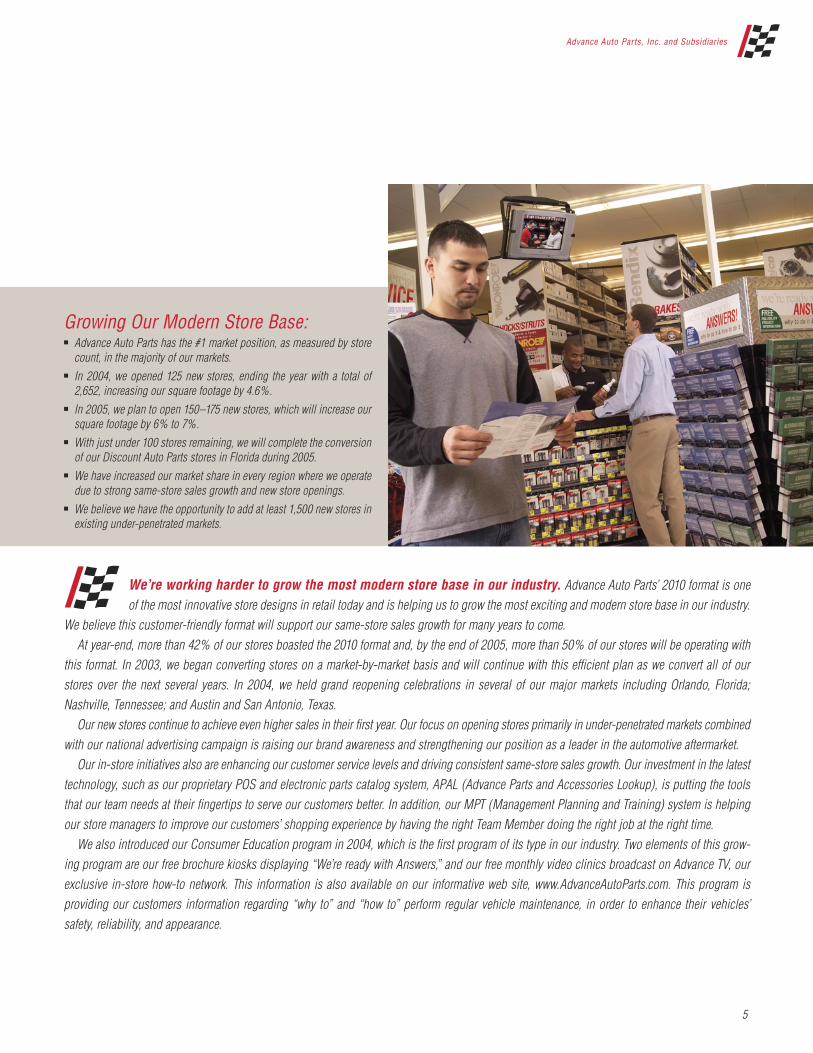
We’re working harder to grow the most modern store base in our industry. Advance Auto Parts’ 2010 format is one of the most innovative store designs in retail today and is helping us to grow the most exciting and modern store base in our industry.
We believe this customer-friendly format will support our same-store sales growth for many years to come. At year-end, more than 42% of our stores boasted the 2010 format and, by the end of 2005, more than 50% of our stores will be operating with this format. In 2003, we began converting stores on a market-by-market basis and will continue with this efficient plan as we convert all of our stores over the next several years. In 2004, we held grand reopening celebrations in several of our major markets including Orlando, Florida; Nashville, Tennessee; and Austin and San Antonio, Texas. Our new stores continue to achieve even higher sales in their first year. Our focus on opening stores primarily in under-penetrated markets combined with our national advertising campaign is raising our brand awareness and strengthening our position as a leader in the automotive aftermarket. Our in-store initiatives also are enhancing our customer service levels and driving consistent same-store sales growth. Our investment in the latest technology, such as our proprietary POS and electronic parts catalog system, APAL (Advance Parts and Accessories Lookup), is putting the tools that our team needs at their fingertips to serve our customers better. In addition, our MPT (Management Planning and Training) system is helping our store managers to improve our customers’ shopping experience by having the right Team Member doing the right job at the right time. We also introduced our Consumer Education program in 2004, which is the first program of its type in our industry. Two elements of this grow-ing program are our free brochure kiosks displaying “We’re ready with Answers,” and our free monthly video clinics broadcast on Advance TV, our exclusive in-store how-to network. This information is also available on our informative web site, www.AdvanceAutoParts.com. This program is providing our customers information regarding “why to” and “how to” perform regular vehicle maintenance, in order to enhance their vehicles’ safety, reliability, and appearance.
5
Advance Auto Parts, Inc. and Subsidiaries
Growing Our Modern Store Base: Advance Auto Parts has the #1 market position, as measured by store
count, in the majority of our markets. In 2004, we opened 125 new stores, ending the year with a total of
2,652, increasing our square footage by 4.6%. In 2005, we plan to open 150–175 new stores, which will increase our
square footage by 6% to 7%. With just under 100 stores remaining, we will complete the conversion
of our Discount Auto Parts stores in Florida during 2005. We have increased our market share in every region where we operate
due to strong same-store sales growth and new store openings. We believe we have the opportunity to add at least 1,500 new stores in
existing under-penetrated markets.

“partsReady with the right
Page 6 Photo:Dennis Schrader, Division Commercial Sales Manager, discusses parts with a commercial customer.
Page 6–7 Photo:Assistant Store Manager Amy Lawrence assists a customer.
Page 7 Photo: Top RightKenneth Ramsey, Assistant Store Manager
”
6
Whether they are do-it-yourselfers or commercial installersproducts and superior availability. Advance Auto Parts customerswhen they need them.
Greg Haan, Vice President—Merchandising

Growing Our Commercial Program: In 2004, we added 320 new commercial programs in our stores. At year-end, 1,945 of our stores, or 73%, contained a commercial program compared
to 64% at the end of 2003. In 2004, we grew our sales to commercial customers to $693 million, a 25.6%
increase compared to 2003. In 2004, we produced a 22.9% comp increase in commercial sales on top of
7.2% in 2003. Sales to commercial customers represent more than 18% of total sales and are
growing. Our investment in our commercial program is paying off and we believe it will
strongly increase our bottom line for many years to come.
We’re working harder to get quality parts to our customers fast. Advance Auto Parts has over 115,000 Stock
Keeping Units (SKUs) available for our customers on a same-day or over-night basis through our sophisticated and flexible supply chain. In 2005, we will further improve the overall efficiency and effectiveness of our supply chain with the opening of our new 650,000-square-foot distribution center (DC) in eastern Pennsylvania. This new DC will increase our service levels to our northeast stores, further optimize transportation costs, and provide us the capacity for future growth. Our custom mix initiative, which offers better market-specific availability for harder-to-find parts, meets the needs of our core do-it-yourself customer while helping us grow our sales to professional installers. With the helpful advice of our dedicated Parts Pros and our fast delivery system, our com-mercial customers can be confident that they will get the right parts that they need quickly. Category Management is enhancing our in-store inventory availability and is now the basis for ongoing improvements in merchandising and store operations. Since 2002, this customer-focused initiative has enhanced our sales and margins and we expect additional benefits from this program for many years to come.
right now
Advance Auto Parts, Inc. and Subsidiaries
7
consumers expect the highest-quality brand nameknow that they can count on us for high-quality parts

“
8
pricesReady with
”Our pricing philosophy has one focus—the best value for our customers. By working hard to ensure that our customers save money, we are strengthening our position as their #1 choice for all of their automotive needs.
Dave Nuckolls, Director, Retail Pricing (pictured above)
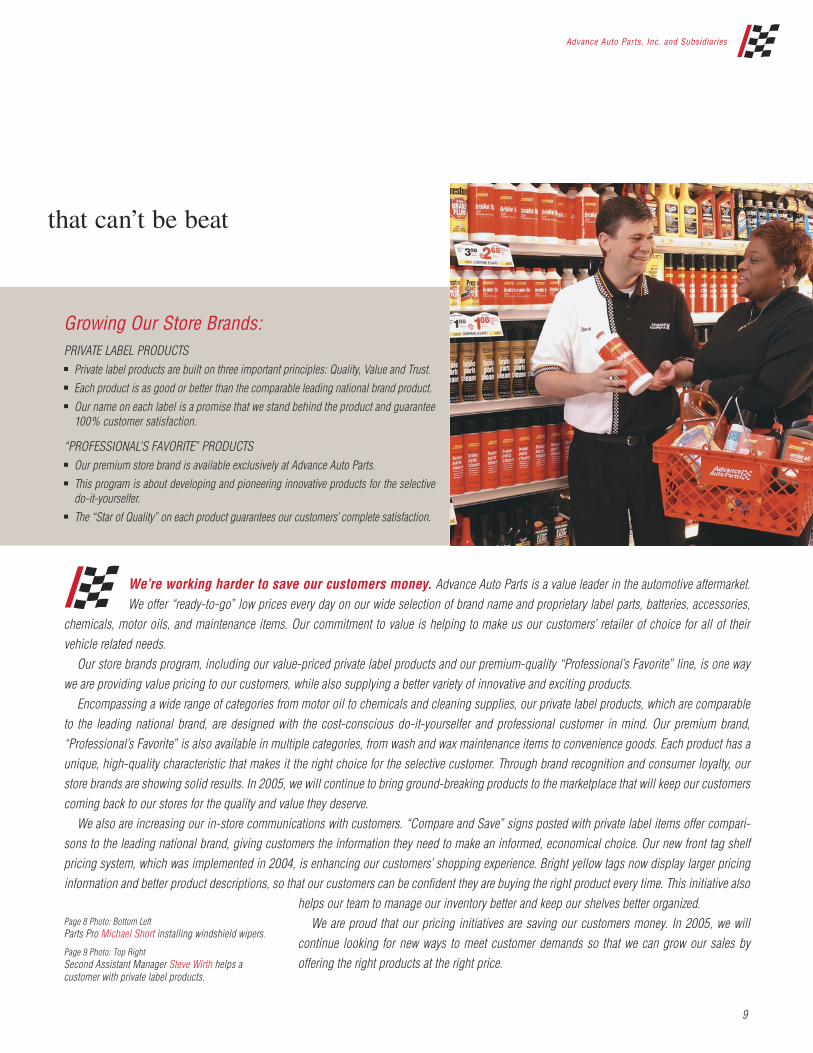
We’re working harder to save our customers money. Advance Auto Parts is a value leader in the automotive aftermarket. We offer “ready-to-go” low prices every day on our wide selection of brand name and proprietary label parts, batteries, accessories,
chemicals, motor oils, and maintenance items. Our commitment to value is helping to make us our customers’ retailer of choice for all of their vehicle related needs. Our store brands program, including our value-priced private label products and our premium-quality “Professional’s Favorite” line, is one way we are providing value pricing to our customers, while also supplying a better variety of innovative and exciting products. Encompassing a wide range of categories from motor oil to chemicals and cleaning supplies, our private label products, which are comparable to the leading national brand, are designed with the cost-conscious do-it-yourselfer and professional customer in mind. Our premium brand, “Professional’s Favorite” is also available in multiple categories, from wash and wax maintenance items to convenience goods. Each product has a unique, high-quality characteristic that makes it the right choice for the selective customer. Through brand recognition and consumer loyalty, our store brands are showing solid results. In 2005, we will continue to bring ground-breaking products to the marketplace that will keep our customers coming back to our stores for the quality and value they deserve. We also are increasing our in-store communications with customers. “Compare and Save” signs posted with private label items offer compari-sons to the leading national brand, giving customers the information they need to make an informed, economical choice. Our new front tag shelf pricing system, which was implemented in 2004, is enhancing our customers’ shopping experience. Bright yellow tags now display larger pricing information and better product descriptions, so that our customers can be confident they are buying the right product every time. This initiative also
helps our team to manage our inventory better and keep our shelves better organized. We are proud that our pricing initiatives are saving our customers money. In 2005, we will continue looking for new ways to meet customer demands so that we can grow our sales by offering the right products at the right price.
that can’t be beat
Growing Our Store Brands:PRIVATE LABEL PRODUCTS Private label products are built on three important principles: Quality, Value and Trust. Each product is as good or better than the comparable leading national brand product. Our name on each label is a promise that we stand behind the product and guarantee
100% customer satisfaction.
“PROFESSIONAL’S FAVORITE” PRODUCTS Our premium store brand is available exclusively at Advance Auto Parts. This program is about developing and pioneering innovative products for the selective
do-it-yourselfer. The “Star of Quality” on each product guarantees our customers’ complete satisfaction.
Page 8 Photo: Bottom LeftParts Pro Michael Short installing windshield wipers.
Page 9 Photo: Top RightSecond Assistant Manager Steve Wirth helps a customer with private label products.
9
Advance Auto Parts, Inc. and Subsidiaries

peopleReady with
“ ”By training and developing our team, we will continue to build on the legendary service for which Advance Auto Parts is known, producing a high-performance workforce that will take our Company into the future.
Doug Bryant, Vice President—Organizational Development and Training
10
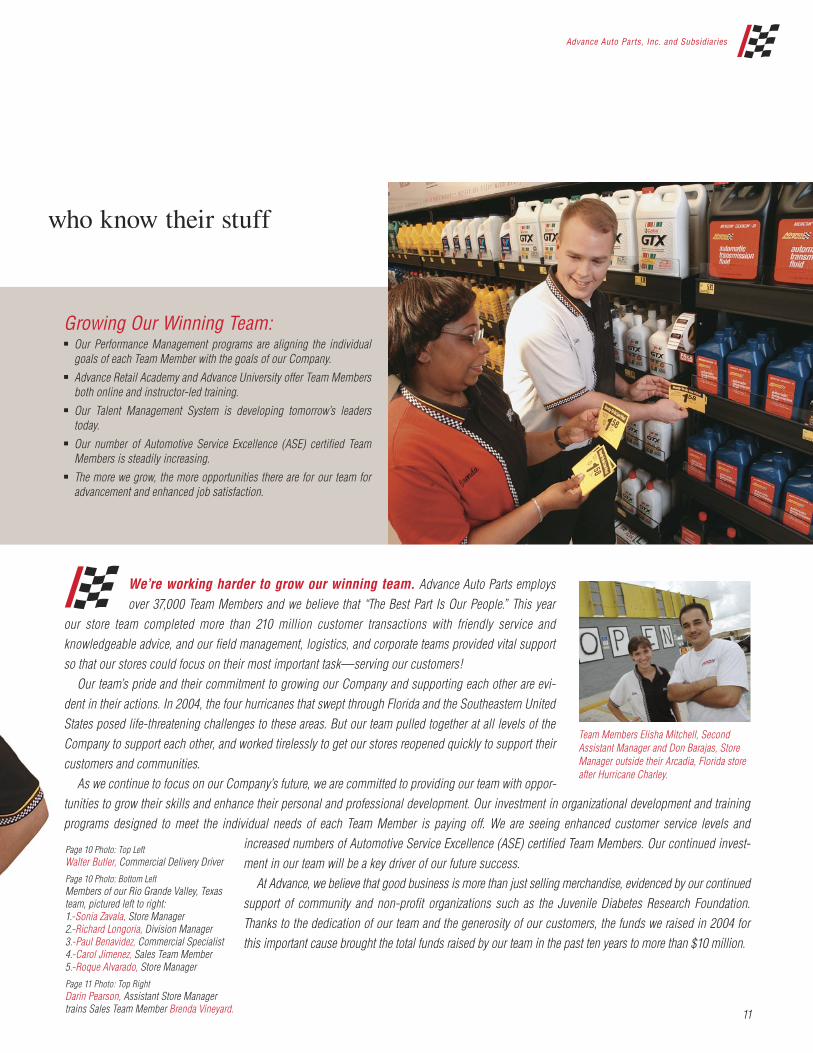
We’re working harder to grow our winning team. Advance Auto Parts employs over 37,000 Team Members and we believe that “The Best Part Is Our People.” This year
our store team completed more than 210 million customer transactions with friendly service and knowledgeable advice, and our field management, logistics, and corporate teams provided vital support so that our stores could focus on their most important task—serving our customers! Our team’s pride and their commitment to growing our Company and supporting each other are evi-dent in their actions. In 2004, the four hurricanes that swept through Florida and the Southeastern United States posed life-threatening challenges to these areas. But our team pulled together at all levels of the Company to support each other, and worked tirelessly to get our stores reopened quickly to support their customers and communities. As we continue to focus on our Company’s future, we are committed to providing our team with oppor-tunities to grow their skills and enhance their personal and professional development. Our investment in organizational development and training programs designed to meet the individual needs of each Team Member is paying off. We are seeing enhanced customer service levels and
increased numbers of Automotive Service Excellence (ASE) certified Team Members. Our continued invest-ment in our team will be a key driver of our future success. At Advance, we believe that good business is more than just selling merchandise, evidenced by our continued support of community and non-profit organizations such as the Juvenile Diabetes Research Foundation. Thanks to the dedication of our team and the generosity of our customers, the funds we raised in 2004 for this important cause brought the total funds raised by our team in the past ten years to more than $10 million.
Page 10 Photo: Top LeftWalter Butler, Commercial Delivery Driver
Page 10 Photo: Bottom Left Members of our Rio Grande Valley, Texas team, pictured left to right: 1.-Sonia Zavala, Store Manager2.-Richard Longoria, Division Manager3.-Paul Benavidez, Commercial Specialist4.-Carol Jimenez, Sales Team Member5.-Roque Alvarado, Store Manager
Page 11 Photo: Top RightDarin Pearson, Assistant Store Manager trains Sales Team Member Brenda Vineyard.
Team Members Elisha Mitchell, Second Assistant Manager and Don Barajas, Store Manager outside their Arcadia, Florida store after Hurricane Charley.
Advance Auto Parts, Inc. and Subsidiaries
11
who know their stuff
Growing Our Winning Team: Our Performance Management programs are aligning the individual
goals of each Team Member with the goals of our Company. Advance Retail Academy and Advance University offer Team Members
both online and instructor-led training. Our Talent Management System is developing tomorrow’s leaders
today. Our number of Automotive Service Excellence (ASE) certified Team
Members is steadily increasing. The more we grow, the more opportunities there are for our team for
advancement and enhanced job satisfaction.

Advance Auto Parts has a rich history of strong, forward-thinking leaders. Our 18 senior executives lead by example with discipline and integrity. With an average of 15 years of industry expertise and 11 years of experience at Advance, their passion for excellence has driven our position as a leader in the automotive aftermarket industry. Their continued commitment to growing our team, our profits, and our presence in the industry will lead our Company to continued growth and future success.
Advance.We’re ready in
12
Advance Auto Parts, Inc. and Subsidiaries
13
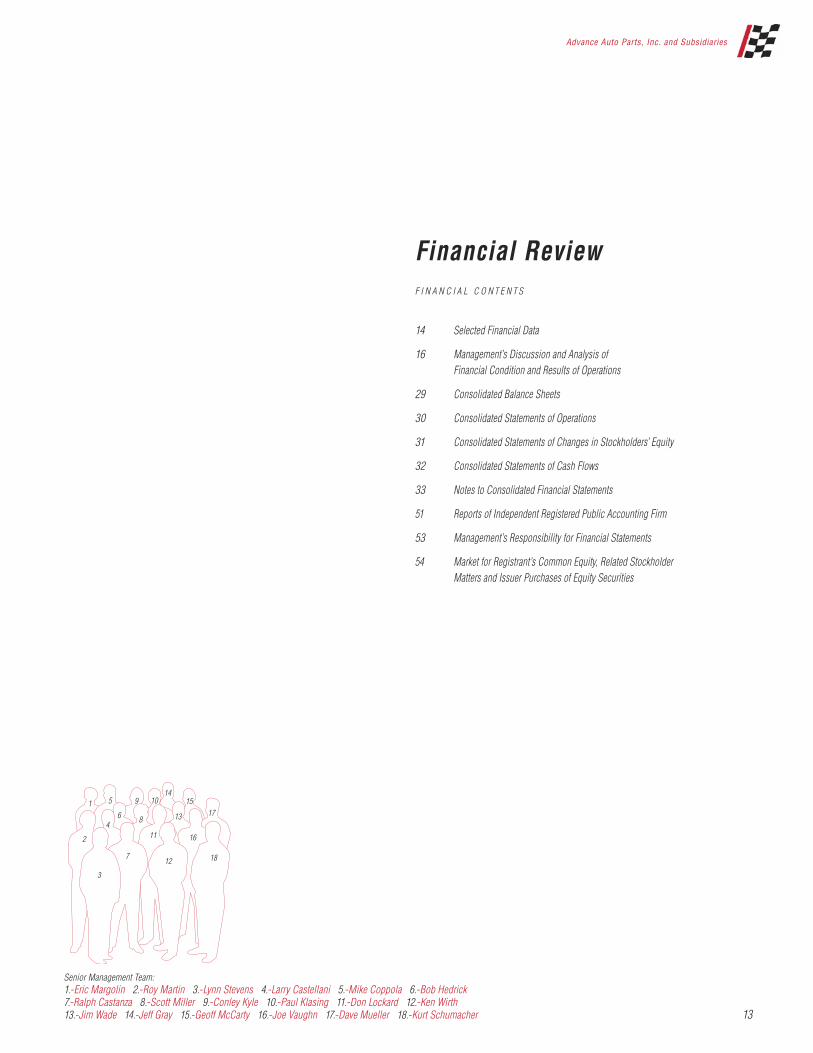
Financial ReviewF I N A N C I A L C O N T E N T S
14 Selected Financial Data
16 Management’s Discussion and Analysis of Financial Condition and Results of Operations
29 Consolidated Balance Sheets
30 Consolidated Statements of Operations
31 Consolidated Statements of Changes in Stockholders’ Equity
32 Consolidated Statements of Cash Flows
33 Notes to Consolidated Financial Statements
51 Reports of Independent Registered Public Accounting Firm
53 Management’s Responsibility for Financial Statements
54 Market for Registrant’s Common Equity, Related Stockholder Matters and Issuer Purchases of Equity Securities
1
2
3
4
5
7
8
9
6
10
11
12 18
16
1715
13
14
Senior Management Team:1.-Eric Margolin 2.-Roy Martin 3.-Lynn Stevens 4.-Larry Castellani 5.-Mike Coppola 6.-Bob Hedrick 7.-Ralph Castanza 8.-Scott Miller 9.-Conley Kyle 10.-Paul Klasing 11.-Don Lockard 12.-Ken Wirth 13.-Jim Wade 14.-Jeff Gray 15.-Geoff McCarty 16.-Joe Vaughn 17.-Dave Mueller 18.-Kurt Schumacher

14
The following table sets forth our selected historical consolidated statement of operations, balance sheet and other oper-ating data. The selected historical consolidated financial and other data at January 1, 2005 and January 3, 2004 and for the three years ended January 1, 2005 have been derived from our audited consolidated financial statements and the related notes included elsewhere in this report. The historical consolidated financial and other data at December 28, 2002, December 29, 2001 and December 30, 2000 and for the years ended December 29, 2001 and December 30, 2000 have been derived from our audited consolidated financial statements and the related notes that have not been included in this report. You should read this data along with “Management’s Discussion and Analysis of Financial Condition and Results of Operations,” and our consolidated financial statements and the related notes included elsewhere in this report.
Fiscal Year(1)(2)
2004 2003 2002 2001 2000
(in thousands, except per share data)
Statement of Operations Data:Net sales .................................................................................................... $3,770,297 $3,493,696 $3,204,140 $2,419,746 $2,167,308Cost of sales .............................................................................................. 2,016,926 1,889,178 1,769,733 1,357,594 1,286,295Supply chain initiatives(3) ......................................................................... — — — 9,099 —
Gross profit ............................................................................................... 1,753,371 1,604,518 1,434,407 1,053,053 881,013Selling, general and administrative expenses(4) ...................................... 1,424,613 1,305,867 1,202,524 938,300 792,551Expenses associated with supply chain initiatives(5) ............................... — — — 1,394 —Impairment of assets held for sale(6) ........................................................ — — — 12,300 856Expenses associated with merger-related restructuring(7) ....................... — — 597 3,719 —Expenses associated with merger and integration(8) ............................... — 10,417 34,935 1,135 —Non-cash stock option compensation expense(9) ..................................... — — — 11,735 729
Operating income ..................................................................................... 328,758 288,234 196,351 84,470 86,877Interest expense ........................................................................................ (20,069) (37,576) (77,081) (61,042) (64,212)(Loss) gain on extinguishment of debt .................................................... (3,230) (47,288) (16,822) (6,106) 4,692Expenses associated with secondary offering ......................................... — — (1,733) — —Other income, net ..................................................................................... 289 341 963 1,033 581
Income from continuing operations before income taxes, (loss) income on discontinued operations and cumulative effect of a change in accounting principle .......................................... 305,748 203,711 101,678 18,355 27,938
Income tax expense .................................................................................. 117,721 78,424 39,530 7,284 10,787
Income from continuing operations before (loss) income on discontinued operations and cumulative effect of a change in accounting principle .......................................... 188,027 125,287 62,148 11,071 17,151
Discontinued operations:(Loss) income from operations of discontinued Wholesale
Distribution Network (including loss on disposal of $2,693 in 2003) ............................................................................................. (63) (572) 4,691 4,040 3,915
(Benefit) provision for income taxes ................................................... (24) (220) 1,820 1,604 1,507
(Loss) income on discontinued operations .............................................. (39) (352) 2,871 2,436 2,408Cumulative effect of a change in accounting principle,
net of $1,360 income taxes .................................................................. — — — (2,065) —
Net income ................................................................................................ $ 187,988 $ 124,935 $ 65,019 $ 11,442 $ 19,559
Income from continuing operations before (loss) income on discontinued operations and cumulative effect of a change in accounting principle per basic share ................................... $ 2.54 $ 1.72 $ 0.89 $ 0.19 $ 0.30
Income from continuing operations before (loss) income on discontinued operations and cumulative effect of a change in accounting principle per diluted share ............................... $ 2.49 $ 1.68 $ 0.86 $ 0.19 $ 0.30
Net income per basic share ...................................................................... $ 2.54 $ 1.71 $ 0.93 $ 0.20 $ 0.35Net income per diluted share ................................................................... $ 2.49 $ 1.67 $ 0.90 $ 0.20 $ 0.34Weighted-average basic shares outstanding(10) ........................................ 73,897 72,999 70,098 57,274 56,592Weighted-average diluted shares outstanding(10) ..................................... 75,481 74,743 72,376 58,316 57,222Cash Flows Provided By (Used In):Operating activities .................................................................................. $ 263,794 $ 355,921 $ 242,996 $ 103,536 $ 103,951Investing activities .................................................................................... (166,822) (85,474) (78,005) (451,008) (64,940)Financing activities .................................................................................. (52,138) (272,845) (169,223) 347,580 (43,579)
(continued)
Selected Financial Data

Advance Auto Parts, Inc. and Subsidiaries
15
Fiscal Year(1)(2)
2004 2003 2002 2001 2000
(in thousands, except per share data and ratios)
Balance Sheet and Other Financial Data:Cash and cash equivalents ............................................................. $ 56,321 $ 11,487 $ 13,885 $ 18,117 $ 18,009Inventory ......................................................................................... $1,201,450 $1,113,781 $1,048,803 $ 982,000 $ 788,914Inventory turnover (11) ...................................................................... 1.74 1.72 1.75 1.72 1.69Inventory per store(12) ..................................................................... $ 453,035 $ 438,669 $ 429,399 $ 392,635 $ 451,281Accounts payable to inventory ratio(13) .......................................... 53.7% 51.0% 44.9% 43.7% 49.2%Net working capital(14) .................................................................... $ 416,302 $ 372,509 $ 462,896 $ 442,099 $ 318,583Capital expenditures(15) ................................................................... $ 179,766 $ 101,177 $ 98,186 $ 63,695 $ 70,566Total assets ..................................................................................... $2,201,962 $1,983,071 $1,965,225 $1,950,615 $1,356,360Total debt ........................................................................................ $ 470,000 $ 445,000 $ 735,522 $ 955,737 $ 586,949Total net debt(16) .............................................................................. $ 433,863 $ 464,598 $ 722,506 $ 972,368 $ 582,539Total stockholders’ equity .............................................................. $ 722,315 $ 631,244 $ 468,356 $ 288,571 $ 156,271Selected Store Data:Comparable store sales growth(17) .................................................. 6.1% 3.1% 5.5% 6.2% 4.4%Number of stores at beginning of year .......................................... 2,539 2,435 2,484 1,729 1,617 New stores .................................................................................. 125 125 110 781 140 Closed stores(18) ........................................................................... (12) (21) (159) (26) (28)Number of stores, end of period .................................................... 2,652 2,539 2,435 2,484 1,729Relocated stores .............................................................................. 34 32 39 18 10Stores with commercial delivery program, end of period ............ 1,945 1,625 1,411 1,370 1,210Total commercial sales, as a percentage of total retail sales ........ 18.4% 15.8% 15.0% 16.8% 16.5%Total store square footage, end of period ...................................... 19,734 18,875 18,108 18,717 13,325Average net sales per store(19) ......................................................... $ 1,453 $ 1,379 $ 1,303 $ 1,346 $ 1,295Average net sales per square foot(20) .............................................. $ 195 $ 186 $ 174 $ 175 $ 168
(1) Our fiscal year consists of 52 or 53 weeks ending on the Saturday nearest to December 31. All fiscal years presented are 52 weeks, with the exception of 2003, which consists of 53 weeks.
(2) The statement of operations data for each of the years presented reflects the operating results of the wholesale segment as discontinued operations. (3) Represents restocking and handling fees associated with the return of inventory as a result of our supply chain initiatives. (4) Selling, general and administrative expenses exclude certain charges disclosed separately and discussed in notes (5), (6), (7), (8), and (9) below. (5) Represents costs of relocating certain equipment held at facilities closed as a result of our supply chain initiatives. (6) Represents the devaluation of certain property held for sale, including the $1.6 million charge taken in the first quarter of 2001 and a $10.7 million charge taken in
the fourth quarter of 2001. (7) Represents expenses related primarily to lease costs associated with 27 Advance Auto Parts stores identified to be closed at December 29, 2001 as a result of the
Discount acquisition. (8) Represents certain expenses related to, among other things, overlapping administrative functions and store conversions as a result of the Discount acquisition. (9) Represents non-cash compensation expense related to stock options granted to certain of our team members, including a charge of $8.6 million in the fourth quarter
of 2001 related to variable provisions of our stock option plans that were in place when we were a private company and eliminated in 2001.(10) Shares outstanding for each of the years presented gives effect to a 2 for 1 stock split effectuated by us in the form of a 100% stock dividend distributed on
January 2, 2004.(11) Inventory turnover is calculated as cost of sales divided by the average of beginning and ending inventories. The fiscal 2003 cost of sales excludes the effect of the
53rd week in the amount of $34.3 million. The fiscal 2001 amounts were calculated by reducing the Discount inventory balances by one-thirteenth to reflect our ownership of that inventory from December 2, 2001 (the acquisition date) through December 29, 2001.
(12) Inventory per store calculated as ending inventory divided by ending store count. Ending inventory used in this calculation excludes certain inventory related to the wholesale segment with the exception of fiscal 2003 and fiscal 2004.
(13) Accounts payable to inventory ratio is calculated as ending accounts payable divided by ending inventory. Beginning in fiscal 2004, as a result of our new vendor financing program, we aggregate financed vendor accounts payable with ending accounts payable to calculate our accounts payable to inventory ratio.
(14) Net working capital is calculated by subtracting current liabilities from current assets.(15) Capital expenditures for 2001 exclude $34.1 million for our November 2001 purchase of Discount’s Gallman, Mississippi distribution facility from the lessor in
connection with the Discount acquisition.(16) Net debt includes total debt and bank overdrafts, less cash and cash equivalents.(17) Comparable store sales is calculated based on the change in net sales starting once a store has been open for 13 complete accounting periods (each period
represents four weeks). Relocations are included in comparable store sales from the original date of opening. Stores acquired in the Discount acquisition are included in the comparable sales calculation beginning in December 2002, which was 13 complete accounting periods after the acquisition date of November 28, 2001. We do not include net sales from the 35 Western Auto retail stores in our comparable store calculation as a result of their unique product offerings, including automotive service and tires. In 2003, the comparable store sales calculation included sales from our 53rd week compared to our first week of operation in 2003 (the comparable calendar week). In 2004, as a result of the 53rd week in 2003, the comparable store sales calculation excludes week one of sales from 2003.
(18) Closed stores in 2002 include 133 Discount and Advance stores closed as part of the integration of Discount.(19) Average net sales per store is calculated as net sales divided by the average of beginning and ending number of stores for the respective period. The fiscal 2003
net sales exclude the effect of the 53rd week in the amount of $63.0 million. The fiscal 2001 amounts were calculated by reducing the number of Discount stores by one-thirteenth to reflect our ownership of Discount from December 2, 2001 (the acquisition date) through December 29, 2001.
(20) Average net sales per square foot is calculated as net sales divided by the average of the beginning and ending total store square footage for the respective period. The fiscal 2003 net sales exclude the effect of the 53rd week in the amount of $63.0 million. The fiscal 2001 amounts were calculated by reducing the number of Discount stores by one-thirteenth to reflect our ownership of Discount from December 2, 2001 (the acquisition date) through December 29, 2001.

16
The following discussion and analysis of financial con-dition and results of operations should be read in conjunc-tion with “Selected Financial Data,” our consolidated historical financial statements and the notes to those state-ments that appear elsewhere in this report. Our discussion contains forward-looking statements based upon current expectations that involve risks and uncertainties, such as our plans, objectives, expectations and intentions. Actual results and the timing of events could differ materially from those anticipated in these forward-looking state-ments as a result of a number of factors, including those set forth under “Forward-Looking Statements” elsewhere in this report and “Risk Factors” found in our Form 10-K filed on March 17, 2005 with the Securities and Exchange Commission. Our fiscal year ends on the Saturday nearest December 31 of each year. Our first quarter consists of 16 weeks, and the other three quarters consist of 12 weeks, with the exception of the fourth quarter fiscal 2003, which con-sisted of 13 weeks due to our 53-week fiscal year in 2003.
Introduction We primarily operate within the United States automo-tive aftermarket industry, which includes replacement parts (excluding tires), accessories, maintenance items, batteries and automotive chemicals for cars and light trucks (pickup trucks, vans, minivans and sport utility vehicles). We currently are the second largest specialty retailer of auto-motive parts, accessories and maintenance items to “do-it-yourself,” or DIY, customers in the United States, based on store count and sales. Our operations are conducted in one operating segment. We were formed in 1929 and operated as a retailer of general merchandise until the 1980s. During the 1980s, we sharpened our focus to target sales of automotive parts and accessories to DIY customers. From the 1980s to the present, we have grown significantly as a result of strong compara-ble store sales growth, new store openings and strategic acquisitions, including our 1998 Western Auto Supply Company acquisition and our 2001 acquisition of Discount Auto Parts, or Discount. Additionally, in 1996, we began to aggressively expand our sales to “do-it-for-me,” or DIFM, customers by implementing a commercial delivery program. At January 1, 2005, we operated 2,617 stores throughout 39 states in the Northeastern, Southeastern and Midwestern regions of the United States. These stores operated under the “Advance Auto Parts” trade name except for certain stores in the state of Florida, which operated under the “Advance Discount Auto Parts” or “Discount Auto Parts” trade names. These stores offered automotive replacement
parts, accessories and maintenance items, with no signifi-cant concentration in any specific product area. In addition, we operated 35 stores under the “Western Auto” trade name, located primarily in Puerto Rico and the Virgin Islands, which offer automotive tires and service in addition to automotive parts, accessories and maintenance items. The following table sets forth the number of new, closed and relocated stores and stores with commercial delivery programs during fiscal 2004, 2003 and 2002. We lease approximately 80% of our stores.
Fiscal Year
2004 2003 2002
Number of stores at beginning of year ................................................ 2,539 2,435 2,484
New stores ............................................. 125 125 110Closed stores .......................................... (12) (21) (159)
Number of stores, end of period ........... 2,652 2,539 2,435
Relocated stores ..................................... 34 32 39
Stores with commercial delivery programs ............................................ 1,945 1,625 1,411
We anticipate adding approximately 150 to 175 new stores during 2005 primarily through new store openings and selective acquisitions.
Management Overview In 2004, we produced solid growth in our sales and earnings and ended the year with strong sales momentum during the fourth quarter. We believe this momentum con-firms that our initiatives are working and further makes us believe we are very well positioned for 2005 and beyond. In addition, our industry dynamics continue to become more positive each year. The average age of vehicles con-tinues to increase and is now over nine years old. Currently, over 60% of actively driven vehicles are at least six years old and are beginning to enter the period when parts begin to fail. The cost of replacement parts for these vehicles are higher due to the technological changes in recent models and the shift from cars to light trucks and sport utility vehicles. Beyond the positive fundamentals of our indus-try, the implementation of our initiatives remains on sched-ule. Our specific focus is to drive higher sales per store and thereby leverage our fixed expenses. The initiatives for driving this sales growth include:• Continued execution of our category management
program;• Ongoing implementation of our 2010 store remodeling
program;
Management’s Discussion and Analysis of Financial Condition and Results of Operations
Advance Auto Parts, Inc. and Subsidiaries
17
• Consistent growth and execution of our commercial delivery program;
• Enhanced advertising and focus on serving the customer;• Training and development of our team members; and• Investing in technology and innovative store systems.
In addition, we are focused on optimizing our overall expenses at all levels of the organization as well as con-tinuing to execute our supply chain initiatives to better optimize our distribution costs and make our logistics net-work operate more efficiently and more productively. The following table highlights certain operating results and key metrics for 2004, 2003 and 2002:
Fiscal Year
2004 2003(1) 2002
Total net sales (in thousands) ............... $3,770,297 $3,493,696 $3,204,140
Comparable store sales growth ....................... 6.1% 3.1% 5.5%
DIY comparable store sales growth .............. 2.8% 2.4% 5.6%
DIFM comparable store sales growth .............. 22.9% 7.2% 5.0%
Average net sales per store (in thousands) ...... $ 1,453 $ 1,379 $ 1,303
Inventory per store (in thousands) ............... $ 453,035 $ 438,669 $ 429,399
Inventory turnover ........ 1.74 1.72 1.75Gross margins ............... 46.5% 45.9% 44.8%Operating margins ........ 8.7% 8.3% 6.1%
Note: These metrics should be reviewed along with the footnotes to the table setting forth our selected store data in Item 6. “Selected Financial Data” located elsewhere in this report. The footnotes contain descriptions regarding the calcu-lation of these metrics.(1) All financial metrics for 2003 include the 53rd week, except the average net
sales per store and inventory turnover metrics.
Key 2004 Events The following key events occurred during 2004 and reflect opportunities that will support our strategic initia-tives discussed above:• Our board of directors authorized a $200 million stock
repurchase program during the third quarter of 2004. This program allows us to repurchase outstanding shares of our common stock at prices that we believe are attrac-tive with confidence of our ability to produce strong operating results in the future. As of January 1, 2005, we had repurchased a total of 3.7 million shares at an aggre-gate cost of $146.2 million.
• We entered into a vendor financing program during the first quarter of 2004 allowing us to extend our payment terms on certain merchandise purchases. This program
will allow us to leverage our working capital and utilize existing cash flow to fund our strategic initiatives and cap-ital requirements.• During 2004, we purchased a new Northeast distribution
center in Pennsylvania. This facility is planned to begin servicing our expanding store base in the Northeast region of the United States during the first quarter of 2005.
• We completed the refinancing of our senior credit facility during the fourth quarter of 2004. Our amended senior credit facility provided for an additional $100 million for stock buybacks under our stock repurchase program.
Discontinued Operations Prior to 2004, we operated a second segment for our wholesale business. On December 19, 2003, we discontin-ued the supplying of merchandise to our wholesale distri-bution network, or Wholesale. Wholesale consisted of independently owned and operated dealer locations, for which we supplied merchandise inventory and certain ser-vices. Due to the wide variety of products supplied to the dealers and the reduced concentration of stores spread over a wide geographic area, it had become difficult to serve these dealers effectively. This component of our business operated in the wholesale segment and excluding certain allocated and team member benefit expenses of $2.4 mil-lion and $3.3 million for fiscal years 2003 and 2002, rep-resented the entire results of operations previously reported in that segment. We have classified these operating results as discontinued operations in the accompanying consoli-dated statements of operations for the fiscal years ended January 3, 2004 and December 28, 2002 to reflect this decision. For the fiscal year ended January 1, 2005, the operating results related to the discontinued wholesale business were minimal as a result of recognizing an esti-mate of exit costs in fiscal 2003.
Critical Accounting Policies Our financial statements have been prepared in accor-dance with accounting policies generally accepted in the United States of America. Our discussion and analysis of the financial condition and results of operations are based on these financial statements. The preparation of these financial statements requires the application of accounting policies in addition to certain estimates and judgments by our management. Our estimates and judgments are based on currently available information, historical results and other assumptions we believe are reasonable. Actual results could differ from these estimates. The preparation of our financial statements included the following significant estimates.

18
Vendor Incentives We receive incentives in the form of reductions to amounts owed and/or payments from vendors related to cooperative advertising allowances, volume rebates and other promotional consideration. We account for vendor incentives in accordance with Emerging Issues Task Force, or EITF, No. 02-16, “Accounting by a Customer (Including a Reseller) for Certain Consideration Received from a Vendor.” Many of the incentives are provided under long-term agreements (terms in excess of one year), while others are negotiated on an annual basis. Certain vendors require us to use cooperative advertising allowances exclu-sively for advertising. We define these allowances as restricted cooperative advertising allowances and recog-nize them as a reduction to selling, general and adminis-trative expenses as incremental advertising expenditures are incurred. The remaining cooperative advertising allow-ances not restricted by our vendors and volume rebates are earned based on inventory purchases and recorded as a reduction to inventory and recognized through cost of sales as the inventory is sold. We recognize certain other promotional incentives earned under long-term supply agreements as a reduction to cost of sales. These incentives are recognized based on the cumulative purchases as a percentage of total estimated purchases over the life of the agreement. The estimate of total purchases are highly sensitive to market demand for that product and could positively or negatively impact our cost of sales if actual purchases or results from any year differ from our estimates; however, incentives earned over the life of the agreement would be the same. Incentives associated with short-term agreements are recognized as a reduction to cost of sales over the course of the annual agreements. Amounts received or receivable from vendors that are not yet earned are reflected as deferred revenue. Management’s estimate of the portion of deferred revenue that will be realized within one year of the balance sheet date is included in other current liabilities. Earned amounts that are receivable from vendors are included in accounts receivable except for that portion expected to be received after one year, which is included in other assets.
Inventory Reserves We establish reserves for inventory shrink, as an increase to our cost of sales, for our stores and distribution centers based on our extensive and frequent cycle counting program. Our estimates of these shrink reserves depend on the accuracy of the program, which is dependent on compliance rates of our facilities and the execution of
the required procedures. We evaluate the accuracy of this program on an ongoing basis and believe it provides rea-sonable assurance for the established reserves. Reserves for potentially excess and obsolete inventories are recorded as well based on current inventory levels of discontinued product and historical analysis of the liquida-tion of discontinued inventory below cost. The nature of our inventory is such that the risk of obsolescence is mini-mal and excess inventory has historically been returned to our vendors for credit. We provide reserves where less than full credit will be received for such returns and where we anticipate that items will be sold at retail prices that are less than recorded cost. We develop these estimates based on the determination of return privileges with ven-dors, the level of credit provided by the vendor and man-agement’s estimate of the discounts to recorded cost, if any, required by market conditions. Future changes by vendors in their policies or willingness to accept returns of excess inventory could require us to revise our estimates of required reserves for excess and obsolete inventory and result in a negative impact on our consolidated statements of operations.
Warranty Reserves Our vendors are primarily responsible for warranty claims. We are responsible for merchandise and services sold under warranty which are not covered by vendor war-ranties (primarily batteries and roadside assistance). We record a reserve for future warranty claims as an increase in our cost of sales based on current sales of the warranted products and historical claim experience. If claims expe-rience differs from historical levels, revisions in our esti-mates may be required, which could have an impact on our consolidated statements of operations.
Self-Insured Reserves We are self-insured for general and automobile liability, workers’ compensation and the health care claims of our team members, although we maintain stop-loss coverage with third-party insurers to limit our total liability expo-sure. A reserve for liabilities associated with these losses is established for claims filed and claims incurred but not yet reported based upon our estimate of ultimate cost, which we calculate using analyses of historical data, demographic and severity factors and valuations provided by third-party actuaries. Management monitors new claims and claim development as well as negative trends related to the claims incurred but not reported in order to assess the adequacy of our insurance reserves. On a periodic basis, we also review our assumptions with our third-party actuaries.
Management’s Discussion and Analysis of Financial Condition and Results of Operations (continued)

Advance Auto Parts, Inc. and Subsidiaries
19
While we do not expect the amounts ultimately paid to dif-fer significantly from our estimates, our self-insurance reserves and corresponding selling, general and admin-istrative expenses could be affected if future claim expe-rience differs significantly from historical trends and actuarial assumptions.
Leases and Leasehold Improvements We lease certain store locations, distribution centers, office space, equipment and vehicles. We account for our leases under the provisions of SFAS No. 13, “Accounting for Leases,” and subsequent amendments which require that leases be evaluated and classified as operating leases or capital leases for financial reporting purposes. Certain leases contain rent escalation clauses, which are recorded on a straight-line basis over the initial term of the lease with the difference between the rent paid and the straight-line rent recorded as a deferred rent liability. Lease incen-tive payments received from landlords are recorded as deferred rent liabilities and are amortized on a straight-line basis over the lease term as a reduction in rent. In addition, leasehold improvements associated with these operating leases are amortized over the shorter of their economic lives or the respective lease terms. The term of each lease is generally the initial term of the lease unless external economic factors were to exist such that renewals poten-tially provided for in the lease are reasonably assured to be exercised. In those instances the renewal period would be included in the lease term for purposes of establishing an amortization period and determining if such lease quali-fied as a capital or operating lease.
Closed Store Liabilities We recognize a reserve for future obligations at the time we close a leased store location. The reserve includes the present value of the remaining lease obligations and management’s estimate of future costs for common area maintenance and taxes, offset by the present value of management’s estimate of potential subleases and lease buyouts. These estimates are based on current market conditions and our experience of obtaining subleases or buyouts on similar properties. However, our inability to enter into the subleases or obtain buyouts due to a change in the economy or prevailing real estate markets for these properties within the estimated time frame may result in increases or decreases to these reserves and could impact our selling, general and administrative expenses, as well as our consolidated statements of operations and cash flows.
Components of Statement of Operations
Net Sales Net sales consist primarily of comparable store sales, new store net sales, service sales (offered only in the Western Auto retail locations) and finance charges on installment sales. We calculate comparable store sales based on the change in net sales starting once a store has been opened for 13 complete accounting periods. We include relocations in comparable store sales from the original date of opening. We exclude net sales from the 35 Western Auto retail stores from our comparable store sales as a result of their unique product offerings, includ-ing automotive service and tires. Our fiscal year ends on the Saturday closest to December 31 and consists of 52 or 53 weeks. Our 2004 fiscal year began on January 4, 2004 and consisted of 52 weeks, while our 2003 fiscal year began on December 29, 2002 and consisted of 53 weeks. The extra week of operations in fiscal 2003 results in our fiscal 2004 consisting of non-comparable calendar weeks to fiscal 2003. To create a meaningful comparable store sales measure for fiscal 2004, we have compared the calendar weeks of fiscal 2004 to the corresponding calendar weeks of fiscal 2003. Accordingly, our calculation of comparable stores sales for fiscal 2004 excludes week one of operations from fiscal 2003.
Cost of Sales Our cost of sales consists of merchandise costs, net of incentives under vendor programs, inventory shrinkage and warehouse and distribution expenses. Gross profit as a percentage of net sales may be affected by variations in our product mix, price changes in response to competitive factors and fluctuations in merchandise costs and vendor programs. We seek to avoid fluctuation in merchandise costs and instability of supply by entering into long-term purchasing agreements with vendors when we believe it is advantageous.
Selling, General and Administrative Expenses Selling, general and administrative expenses consist of store payroll, store occupancy (including rent), net adver-tising expenses, other store expenses and general and administrative expenses, including salaries and related benefits of corporate team members, administrative office expenses, data processing, professional expenses and other related expenses including expenses associated with merger and integration.

20
Results of Operations The following table sets forth certain of our operating data expressed as a percentage of net sales for the periods indicated.
Fiscal Year Ended
January 1, 2005
January 3, 2004
December 28, 2002
Net sales ....................................................................................................................................................... 100.0% 100.0% 100.0%Cost of sales ................................................................................................................................................. 53.5 54.1 55.2
Gross profit .............................................................................................................................................. 46.5 45.9 44.8Selling, general and administrative expenses ............................................................................................ 37.8 37.3 37.6Expenses associated with merger and integration ..................................................................................... — 0.3 1.1Expenses associated with merger related restructuring ............................................................................. — — 0.0
Operating income .................................................................................................................................... 8.7 8.3 6.1Interest expense ........................................................................................................................................... (0.5) (1.1) (2.4)Loss on extinguishment of debt .................................................................................................................. (0.1) (1.4) (0.5)Expenses associated with secondary offering ............................................................................................ — — (0.1)Other income, net ........................................................................................................................................ 0.0 0.0 0.0Income tax expense ..................................................................................................................................... 3.1 2.2 1.2
Income from continuing operations before discontinued operations .................................................... 5.0 3.6 1.9Discontinued operations: (Loss) income from operations of discontinued wholesale distribution network ................................. (0.0) (0.0) 0.1 (Benefit) provision for income taxes ...................................................................................................... (0.0) (0.0) 0.0
(Loss) income on discontinued operations ............................................................................................. (0.0) (0.0) 0.1
Net income ............................................................................................................................................... 5.0% 3.6% 2.0%
Management’s Discussion and Analysis of Financial Condition and Results of Operations (continued)
Fiscal 2004 Compared to Fiscal 2003 Net sales for 2004 were $3,770.3 million, an increase of $276.6 million, or 7.9%, over net sales for 2003. Excluding the effect of the 53rd week for 2003 our net sales increased $339.6 million, or 9.9%, over net sales for 2003. The net sales increase was due to an increase in the comparable store sales of 6.1% and contributions from our 125 new stores opened within the last year. The comparable store sales increase was driven by increases in both customer traffic and average ticket sales. Overall, we believe our 2010 store format, category management and enhanced nationwide advertising program drove our growth in net sales. In addition, we believe our DIFM sales have increased as a result of the continued execution of our commercial delivery programs in our existing markets and our continued focus on a high level of service to our DIFM customers. Gross profit for 2004 was $1,753.4 million, or 46.5% of net sales, as compared to $1,604.5 million, or 45.9% of net sales, in 2003. The increase in gross profit as a percentage of sales reflects continued benefits realized from our cate-gory management initiatives and reduced inventory shrink-age. In 2005, we anticipate our gross profit to continue to
improve as a result of the benefits realized from our cate-gory management initiatives, including the expansion of our private label brand and proprietary brands, and the continued execution of our supply chain initiatives. Selling, general and administrative expenses increased to $1,424.6 million, or 37.8% of net sales, for 2004, from $1,316.3 million, or 37.6% of net sales, for 2003. The increase in selling, general and administrative expenses as a percentage of net sales in 2004 was primarily a result of increased expenses associated with our self-insurance pro-grams, including the increased costs required to close claims below our stop-loss limits and increased medical costs for covered team members due to inflation in the health care sector. Selling, general and administrative expenses for 2003 included $10.4 million in merger and integration expenses related to the integration of Discount. These integration expenses were related to, among other things, overlapping administrative functions and store con-version expenses. Excluding the merger and integration expenses from 2003, selling, general and administrative expenses were 37.3% of net sales.

Advance Auto Parts, Inc. and Subsidiaries
21
Interest expense for 2004 was $20.1 million, or 0.5% of net sales, as compared to $37.6 million, or 1.1% of net sales, in 2003. The decrease in interest expense is a result of lower overall interest rates resulting primarily from our redemption of our outstanding senior subordinated notes and senior discount debentures in the first quarter of fiscal 2003. Additionally, the decrease is a result of lower aver-age outstanding debt levels on our senior credit facility throughout fiscal 2004 as compared to fiscal 2003. Income tax expense for 2004 was $117.7 million, as compared to $78.4 million for 2003. This increase in income tax expense primarily reflects our higher earnings. Our effective income tax rate was 38.5% for both 2004 and 2003. We recorded net income of $188.0 million, or $2.49 per diluted share for 2004, as compared to $124.9 million, or $1.67 per diluted share for 2003. As a percentage of sales, net income for 2004 was 5.0%, as compared to 3.6% for 2003. Our net income for 2003 included the effect of expenses associated with merger and integration and loss on extinguishment of debt of $35.5 million, or $0.47 per diluted share.
Fiscal 2003 Compared to Fiscal 2002 Net sales for 2003 were $3,493.7 million, an increase of $289.6 million, or 9.0%, over net sales for 2002. Excluding the effect of the 53rd week our net sales increased $226.6 million, or 7.1%, over net sales for 2002. The net sales increase was due to an increase in the comparable store sales of 3.1%, driven by increases in both customer traffic and average ticket sales, and contributions from the 125 new stores opened within the last year. Increases in both our DIY and DIFM businesses contributed to the compa-rable store sales increase. Gross profit for 2003 was $1,604.5 million, or 45.9% of net sales, as compared to $1,434.4 million, or 44.8% of net sales, in 2002. The increase in gross profit as a percentage of sales reflects continued benefits realized from our cate-gory management initiatives and improved efficiencies in our logistics network. Selling, general and administrative expenses, including merger and integration costs of $10.4 million in 2003, increased to $1,316.3 million, or 37.6% of net sales, for 2003, from $1,238.1 million, or 38.7% of net sales, for 2002. In 2002, merger and integration costs were $35.5 million. The decrease in selling, general and administra-tive expenses as a percentage of net sales is primarily a
result of a decrease in merger and integration expenses related to the integration of Discount. These integration expenses are related to, among other things, overlapping administrative functions and store conversion expenses. The decline in merger and integration costs was anticipated as we approached the completion of the Discount integra-tion. Excluding the impact of the merger and integration costs, the decline in selling, general and administrative expenses as a percentage of net sales is a result of leverag-ing our fixed costs as a result of the impact of the 53rd week of operations in the fourth quarter of 2003. Interest expense for 2003 was $37.6 million, or 1.1% of net sales, as compared to $77.1 million, or 2.4% of net sales, in 2002. The decrease in interest expense is a result of lower overall interest rates resulting primarily from our redemption of our outstanding senior subordinated notes and senior discount debentures in first quarter 2003. Additionally, the decrease is a result of overall lower debt levels in 2003 as compared to 2002. Income tax expense for 2003 was $78.4 million, as com-pared to $39.5 million for 2002. Our effective income tax rate decreased to 38.5% for 2003, as compared to 38.8% for 2002. The decrease in our effective tax rate was pri-marily due to increases in pre-tax income, which reduced the impact of certain permanent differences on the effec-tive rate. During 2003, we recorded $47.3 million in a loss on extinguishment of debt. This loss reflects the write-off of deferred loan costs and premiums paid to redeem our senior subordinated notes and senior discount debentures during the first quarter of fiscal 2003, and also includes the related financing costs associated with amending our senior credit facility to finance this redemption. Addition-ally, this loss includes the ratable portion of deferred loan costs associated with the partial repayment of our term loans during fiscal 2003. We recorded net income of $124.9 million, or $1.67 per diluted share for 2003, as compared to $65.0 million, or $0.90 per diluted share for 2002. As a percentage of sales, net income for 2003 was 3.6%, as compared to 2.0% for 2002. The effect of the expenses associated with merger and integration and loss on extinguishment of debt on net income was $35.5 million, or $0.47 per diluted share for 2003 and $32.0 million, or $0.44 per diluted share for 2002. These per share amounts reflect the two-for-one stock split declared in 2003.

22
Management’s Discussion and Analysis of Financial Condition and Results of Operations (continued)
Quarterly Financial Results (unaudited) (in thousands, except per share data)
16 Weeks Ended
4/24/2004
12 Weeks Ended
7/17/2004
12 Weeks Ended
10/9/2004
12 Weeks Ended
1/1/2005
16 Weeks Ended
4/19/2003
12 Weeks Ended
7/12/2003
12 Weeks Ended
10/4/2003
13 Weeks Ended
1/3/2004
Net sales ............................................. $1,122,918 $908,412 $890,161 $848,806 $1,005,968 $827,348 $839,101 $821,279Gross profit ........................................ 520,898 422,302 416,515 393,656 463,989 379,474 386,928 374,127Net income ......................................... $ 51,291 $ 53,235 $ 51,393 $ 32,069 $ 5,041 $ 43,458 $ 45,164 $ 31,272
Net income per share: Basic ............................................... $ 0.69 $ 0.71 $ 0.69 $ 0.44 $ 0.07 $ 0.60 $ 0.61 $ 0.42 Diluted ........................................... $ 0.68 $ 0.70 $ 0.68 $ 0.43 $ 0.07 $ 0.58 $ 0.60 $ 0.41
Liquidity and Capital Resources
Overview of Liquidity Our primary cash requirements include the purchase of inventory, capital expenditures, repurchasing shares under our stock repurchase program and contractual obligations. We have financed these requirements primarily through a combination of cash generated from operations and bor-rowings under our senior credit facility. At January 1, 2005, our cash balance was $56.3 million, an increase of $44.8 million compared to 2003. Our cash balance increased primarily due to our increased earnings in 2004, as well as a decrease in cash used to repay or redeem indebtedness compared to 2003. In 2003, we used available funds combined with borrowings under our senior credit facility to redeem our senior discount debentures and senior subordinated notes. At January 1, 2005, we had outstanding indebtedness consisting of borrowings of $470.0 million under our senior credit facility, an increase of $25.0 million from 2003. Additionally, we had $38.8 million in letters of credit outstanding, which reduced our availability under the revolving credit facility to $161.2 million. Our availability under our revolving credit facility increased by $38.8 million from $122.4 at the end of fiscal 2003 due to the increase in our revolving credit facility from $160.0 million to $200.0 million. This increase resulted from the refinancing of our senior credit facility, which gives us additional funds for our primary cash requirements.
Capital Expenditures Our primary capital requirements have been the funding of our continued store expansion program, including new store openings and store acquisitions, store relocations and remodels, inventory requirements, the construction and upgrading of distribution centers, the development and implementation of proprietary information systems and our strategic acquisitions.
Our capital expenditures were $179.8 million in 2004. These amounts included costs of $50.0 million for the con-struction and preparation of our northeastern distribution center and additional amounts related to new store open-ings, the upgrade of our information systems, remodels and relocations of existing stores, including our continued physical conversion of stores acquired in the Discount acquisition to our Advance Auto Parts store format. In 2005, we anticipate that our capital expenditures will be approximately $180.0 million to $200.0 million. Our new stores, if leased, require capital expenditures of approximately $160,000 per store and an inventory invest-ment of approximately $170,000 per store, net of vendor payables. A portion of the inventory investment is held at a distribution facility. Pre-opening expenses, consisting primarily of store set-up costs and training of new store team members, average approximately $20,000 per store and are expensed when incurred. Our future capital requirements will depend on the num-ber of new stores we open or acquire and the timing of those openings or acquisitions within a given year. We opened 125 new stores each year during 2004 and 2003. We anticipate adding approximately 150 to 175 new stores during 2005 primarily through new store openings and selective acquisitions.
Vendor Financing Program Historically, we have negotiated extended payment terms from suppliers that help finance inventory growth, and we believe that we will be able to continue financing much of our inventory growth through such extended payment terms. During the first quarter of fiscal 2004, we entered into a short-term financing program with a bank, allowing us to extend our payment terms on certain merchandise purchases. Under this program, we issue negotiable instru-ments to our vendors in lieu of a cash payment. Each vendor is able to present the instrument to the bank for

Advance Auto Parts, Inc. and Subsidiaries
23
payment at an agreed upon discount rate. At January 1, 2005, $56.9 million was payable to the bank by us under this program. This program will allow us to further reduce our working capital invested in current inventory levels and finance future inventory growth. Additionally, our new senior credit facility allows us to increase our capacity under this program from $100 million to $150 million during 2005.
Stock Repurchase Program During the third quarter of fiscal 2004, our Board of Directors authorized a stock repurchase program of up to $200.0 million of our common stock plus related expenses. The program will allow us to repurchase our common stock on the open market or in privately negotiated trans-actions from time to time in accordance with the require-ments of the Securities and Exchange Commission. As of January 1, 2005, we had repurchased a total of 3.7 million shares of common stock at an aggregate cost of $146.2 million, or $39.52 per share. At January 1, 2005, we had $53.8 million, excluding related expenses, available for future stock repurchases under the stock repurchase pro-gram. As of March 9, 2005, we had repurchased an addi-tional 1.0 million shares of common stock at an aggregate cost of $43.0 million.
Deferred Compensation and Postretirement Plans We maintain two deferred compensation plans. Our ongoing plan was established in 2003 as an unqualified deferred compensation plan established for certain of our key team members. This plan provides for a minimum and maximum deferral percentage of the team member base salary and bonus, as determined by our Retirement Plan Committee. We fund the plan liability by remitting the team member’s deferral to a Rabbi Trust where these defer-rals are invested in trading securities. Accordingly, all gains and losses on these underlying investments are held in the Rabbi Trust to fund the deferred compensation lia-bility. At January 1, 2005, the liability related to this plan was $1.8 million, all of which is current. We also maintain an unfunded deferred compensation plan established prior to the 1998 Western merger for certain key team members of Western. The plan was frozen at the date of the Western merger. At January 1, 2005, the total liability for the Western plan was $1.6 million, of which $0.3 million is recorded as a current liability. The classification for the Western deferred compensation plan is determined by pay-ment terms elected by plan participants, which can be changed upon 12 months’ notice.
We provide certain health care and life insurance bene-fits for eligible retired team members through our post-retirement plan. At January 1, 2005, our accrued benefit cost related to this plan was $17.4 million. The plan has no assets and is funded on a cash basis as benefits are paid/incurred. The discount rate that we utilize for determining our postretirement benefit obligation is actuarially deter-mined. The discount rate utilized at January 1, 2005 and January 4, 2004 was 5.75% and 6.25%, respectively. We reserve the right to change or terminate the benefits or contributions at any time. We also continue to evaluate ways in which we can better manage these benefits and control costs. Any changes in the plan or revisions to assumptions that affect the amount of expected future benefits may have a significant impact on the amount of the reported obligation and annual expense. Effective sec-ond quarter of fiscal 2004, we amended the Plan to exclude outpatient prescription drug benefits to Medicare-eligible retirees effective January 1, 2006. Due to this negative plan amendment, our accumulated postretirement benefit obligation was reduced by $7.6 million, resulting in an unrecognized negative prior service cost in the same amount. The unrecognized negative prior service cost is being amortized over the estimated remaining life expec-tancy of the plan participants of 13 years.
Analysis of Cash Flows
Fiscal Year
2004 2003 2002
(in millions)
Cash flows from operating activities ..................................... $ 263.7 $ 355.9 $ 243.0
Cash flows from investing activities ..................................... (166.8) (85.5) (78.0)
Cash flows from financing activities ..................................... (52.1) (272.8) (169.2)
Net increase (decrease) in cash and cash equivalents .................. $ 44.8 $ (2.4) $ (4.2)
Operating Activities For fiscal 2004, net cash provided by operating activi-ties decreased $92.2 million to $263.7 million. Significant components of this decrease consisted of:• a $63.1 million increase in earnings from fiscal 2003;• a $47.2 million reduction in deferred income tax pro-
vision, primarily reflective of (1) the reduction in oper-ating loss carryforwards from prior years and (2) the impact of the loss on extinguishment of debt from fiscal 2003;

24
• a $22.8 million increase in inventory growth; and• a $77.9 million decrease in cash flow from accounts pay-
able, excluding the impact of our vendor financing pro-gram which began in fiscal 2004.
For fiscal 2003, net cash provided by operating activities increased $112.9 million to $355.9 million. Significant components of this increase consisted of:• a $59.9 million increase in earnings primarily due to a
reduction in merger and integration expenses and increased operating margins; and
• a $47.3 million loss on extinguishment of debt in fiscal 2003 compared to a $16.8 million loss on extinguish-ment of debt in fiscal 2002.
Investing Activities For fiscal 2004, net cash used in investing activities increased by $81.3 million to $166.8 million. The pri-mary increase in cash used in investing activities relates to an increase in capital expenditures of $50.0 million for the construction and preparation of our northeastern distri-bution center. For fiscal 2003, net cash used in investing activities increased by $7.5 million to $85.5 million. Significant components of this increase consisted of:• a $17.7 million reduction in proceeds received on the
disposal of assets; and• a decrease in cash used for acquisition purposes com-
pared to 2002 when $13.2 million was used to acquire certain assets of Trak Auto Parts, Inc.
Financing Activities For fiscal 2004, net cash used in financing activities decreased by $220.7 million to $52.1 million, primarily due to a cash outflow of $406.4 million during fiscal 2003 for the early redemption of our senior discount debentures and senior subordinated notes. Cash used for financing activities in fiscal 2004 consisted primarily of:• $146.4 million used to repurchase shares of our common
stock under our stock repurchase program;• a $56.9 million cash inflow associated with inventory
purchased under our vendor financing program;• a $25.0 million increase in net borrowings as a result
of $105.0 million in principal prepayments on our previ-ous senior credit facility prior to scheduled maturity, off-set by borrowings from our amended senior credit facility; and
• $20.5 million in proceeds from team member exercises of stock options.
For fiscal 2003, net cash used in financing activities increased by $103.6 million to $272.8 million. Significant components of this increase consisted of:• a $70.9 million increase in net borrowings, which is
reflective of the redemption of our senior discount debentures and senior subordinated notes using proceeds from our senior credit facility;
• $88.7 million in proceeds from an equity offering dur-ing fiscal 2002;
• a $64.1 million cash inflow from the fluctuation of bank overdrafts from fiscal 2002; and
• $38.3 million paid in debt-related costs in connection with the above redemption.
Management’s Discussion and Analysis of Financial Condition and Results of Operations (continued)
Contractual Obligations Our future contractual obligations related to long-term debt and operating leases at January 1, 2005 were as follows:
Contractual Obligations(1) TotalFiscal 2005
Fiscal 2006
Fiscal 2007
Fiscal 2008
Fiscal 2009 Thereafter
(in thousands)
Long-term debt ............................................ $ 470,000 $ 31,700 $ 24,525 $ 40,200 $ 63,375 $ 52,700 $257,500Operating leases .......................................... $1,322,000 $188,355 $167,618 $152,057 $134,357 $113,551 $566,062
$1,792,000 $220,055 $192,143 $192,257 $197,732 $166,251 $823,562
Other long-term liabilities(2) ........................ $ 80,222 $ — $ — $ — $ — $ — $ —
(1) We currently do not have minimum purchase commitments under our vendor supply agreements.(2) Primarily includes employee benefits accruals, restructuring and closed store liabilities and deferred income taxes for which no contractual payment schedule exists.
Long-Term Debt
Senior Credit Facility On November 3, 2004, we entered into a new amended and restated $670 million senior credit facility. The new senior facility provides for a $200.0 million tranche A term loan and a $170.0 million tranche B term loan. Proceeds
from these term loans were used to refinance our tranche D and E term loans and revolver under our previous facil-ity. Additionally, the new senior credit facility provides for a $100.0 million delayed draw term loan, which is avail-able exclusively for stock buybacks under our stock repur-chase program, and a $200.0 million revolving facility, or the revolver (which provides for the issuance of letters of

Advance Auto Parts, Inc. and Subsidiaries
25
credit with a sub limit of $70.0 million). In conjunction with this refinancing, we wrote off deferred financing costs related to the previous term loans in accordance with EITF Issue No. 96-19, “Debtor’s Accounting for a Modifica-tion or Exchange of Debt Instruments.” The write-off of these costs combined with additional costs required to establish the new facility resulted in a loss on extinguish-ment of debt of $2.8 million in the accompanying consoli-dated statements of operations for the year ended January 1, 2005. Earlier during fiscal 2004, we made $105.0 million of repayments on our previous senior credit facility prior to their scheduled maturity. In conjunction with these partial repayments, we wrote off $0.4 million, which is also clas-sified as a loss on extinguishment of debt in the accompa-nying consolidated statements of operations for the year ended January 1, 2005. At January 1, 2005, our senior credit facility consisted of (1) a tranche A term loan facility with a balance of $200.0 million, a tranche B term loan facility with a bal-ance of $170.0 million, a delayed draw term loan with a balance of $100.0 million and (2) a $200.0 million revolv-ing credit facility (including a letter of credit sub facility) (of which $161.2 million was available as a result of $38.8 million in letters of credit outstanding). The senior credit facility is jointly and severally guaranteed by all of our domestic subsidiaries (including Discount and its subsid-iaries) and is secured by all of our assets and the assets of our existing and future domestic subsidiaries (including Discount and its subsidiaries). The tranche A term loan currently requires scheduled repayments of $7.5 million on March 31, 2005 and quar-terly thereafter through December 31, 2006, $10.0 million on March 31, 2007 and quarterly thereafter through December 31, 2007, $12.5 million on March 31, 2008 and quarterly thereafter through June 30, 2009 and $25.0 mil-lion due at maturity on September 30, 2009. The tranche B term loan currently requires scheduled repayments of $0.4 million on March 31, 2005 and quarterly thereafter, with a final payment of $160.7 million due at maturity on September 30, 2010. The delayed draw term loan currently requires scheduled repayments of 0.25% of the aggregate principal amount outstanding on March 31, 2006 and quar-terly thereafter, with a final payment due at maturity on September 30, 2010. The revolver expires on September 30, 2009. The interest rates on the tranche A and B term loans, the delayed draw term loan and the revolver are based, at our option, on an adjusted LIBOR rate, plus a margin, or an alternate base rate, plus a margin. The initial margin for the tranche A term loan and revolver is 1.50% and 0.50% per annum for the adjusted LIBOR and alternate base rate borrowings, respectively. The initial margin for the
tranche B term loan and the delayed draw term loan is 1.75% and 0.75% per annum for the adjusted LIBOR and alternate base rate borrowings, respectively. Additionally, a commitment fee of 0.375% per annum is charged on the unused portion of the tranche A term loan and revolver, payable in arrears. A commitment fee of 1.75% per annum is charged on the unused portion of the delayed draw term loan, payable in arrears. As of January 1, 2005, we had two interest rate swap agreements outstanding on an aggregate of $125 million of debt under our credit facility. The first swap allows us to fix our LIBOR rate at 2.269% on $75.0 million of variable rate debt. The first swap has a term of 36 months and expires in the first quarter of fiscal 2006. The second swap allows us to fix our LIBOR rate at 1.79% on $50.0 million of variable rate debt. The second swap has a term of 24 months and expires in the first quarter of fiscal 2005. Subsequent to January 1, 2005 and in an effort to man-age our future interest rate risk, we entered into the follow-ing three new interest rate swap agreements on an aggregate of $175 million of debt under our senior credit facility:• The first swap, beginning in March 2005, allows us to
fix our total interest rate at 4.153% on $50 million of our debt for a term of 48 months;
• The second swap, beginning in March 2005, allows us to fix our total interest rate at 4.255% on $75 million of our debt for a term of 60 months; and
• The third swap, beginning in March 2006, allows us to fix our total interest rate at 4.6125% on $50 million of our debt for a term of 54 months.
The senior credit facility is secured by a first priority lien on substantially all, subject to certain exceptions, of our assets and the assets of our existing domestic sub-sidiaries and will be secured by the properties and assets of our future domestic subsidiaries. The senior credit facil-ity contains covenants restricting the ability of us and our subsidiaries to, among other things, (1) declare divi-dends or redeem or repurchase capital stock, (2) prepay, redeem or purchase debt, (3) incur liens or engage in sale-leaseback transactions, (4) make loans and investments, (5) incur additional debt (including hedging arrangements), (6) engage in certain mergers, acquisitions and asset sales, (7) engage in transactions with affiliates, (8) change the nature of our business and the business conducted by our subsidiaries and (9) change our passive holding company status. We are also required to comply with financial cov-enants with respect to a maximum leverage ratio, a mini-mum interest coverage ratio, a minimum current assets to funded senior debt ratio, a maximum senior leverage ratio and limits on capital expenditures. We were in compliance with the above covenants at January 1, 2005.
26
Credit Ratings At January 1, 2005, we had a credit rating on our senior credit facility from Standard & Poor’s of BB+ and a credit rating of Ba2 from Moody’s Investor Service. The current pricing grid used to determine our borrowing rates under our senior credit facility is based on such credit ratings. If these credit ratings decline, our interest expense may increase. Conversely, if these credit ratings increase, our interest expense may decrease.
Seasonality Our business is somewhat seasonal in nature, with the highest sales occurring in the spring and summer months. In addition, our business can be affected by weather conditions. While unusually heavy precipitation tends to soften sales as elective maintenance is deferred during such periods, extremely hot or cold weather tends to enhance sales by causing automotive parts to fail.
Recent Accounting Pronouncements In April 2002, the FASB issued SFAS No. 145, “Rescission of FASB Statements No. 4, 44 and 64, Amendment of FASB Statement No. 13 and Technical Corrections.” As a result of rescinding FASB Statement No. 4, “Reporting Gains Losses from Extinguishment of Debt,” gains and losses from extinguishment of debt should be classified as extraordinary items only if they meet the criteria in APB Opinion No. 30, “Reporting the Results of Operations—Reporting the Effects of Disposal of a Segment of a Business, and Extraordinary, Unusual and Infrequently Occurring Events and Transactions.” This statement also amends FASB Statement No. 13, “Accounting for Leases,” to eliminate an inconsistency between the required accounting for sale-leaseback transactions and the required accounting for certain lease modifications that have economic effects that are similar to sale-leaseback transactions. Additional amendments include changes to other existing authoritative pronouncements to make vari-ous technical corrections, clarify meanings or describe their applicability under changed conditions. We adopted SFAS No. 145 during the first quarter of fiscal 2003. For the fiscal years ended 2004, 2003 and 2002, we recorded losses on the extinguishment of debt of $3,230, $47,288 and $16,822, respectively.
In July 2003 (as subsequently updated in November 2003), the FASB released Emerging Issues Task Force, or EITF, Issue No. 03-10, “Application of Issue No. 02-16 by Resellers to Sales Incentives Offered to Customers by Manufacturers.” This EITF addresses whether a reseller should account for consideration received from a vendor that is a reimbursement by the vendor for honoring the vendor’s sales incentives offered directly to consumers in accordance with the guidance in EITF Issue No. 02-16. For purposes of this Issue, the “vendor’s sales incentive offered directly to consumers” is limited to a vendor’s incentive (i) that can be tendered by a consumer at resellers that accept manufacturer’s incentives in partial (or full) of the price charged by the reseller for the vendor’s product, (ii) for which the reseller receives a direct reimbursement from the vendor (or a clearinghouse authorized by the vendor) based on the face amount of the incentive, (iii) for which the terms of reimbursement to the reseller for the vendor’s sales incentive offered to the consumer must not be influenced by or negotiated in conjunction with any other incentive arrangements between the vendor and the reseller but, rather may only be determined by the terms of the incentive offered to consumers and (iv) whereby the reseller is subject to an agency relationship with the ven-dor, whether expressed or implied, in the sales incentive transaction between the vendor and the consumer. The consensus is that sales incentives that meet all of such criteria are not subject to the guidance in Issue No. 02-16. The release is effective for fiscal periods beginning after November 25, 2003. We adopted this release during the first quarter of fiscal 2004 with no impact on our financial position or results of operations. In May 2004, the FASB issued FASB Staff Position, or FSP, 106-2, “Accounting and Disclosure Requirements Related to the Medicare Prescription Drug, Improvement and Modernization Act of 2003.” FSP 106-2 addresses the appropriate accounting and disclosure requirements for companies that sponsor a postretirement health care plan that provides prescription drug benefits. The new guidance was deemed necessary as a result of the 2003 Medicare prescription law which includes a federal sub-sidy for qualifying companies. The effective date of FSP 106-2 is the first interim or annual period beginning after June 15, 2004. We completed a negative plan amendment to eliminate outpatient prescription drug benefits from our postretirement plan effective in the second quarter of fiscal 2004; therefore, the adoption of FSP 106-2 had no impact on our financial position, results of operations or related footnote disclosure.
Management’s Discussion and Analysis of Financial Condition and Results of Operations (continued)
Advance Auto Parts, Inc. and Subsidiaries
27
In November 2004, the FASB issued SFAS No. 151, “Inventory Costs.” The new statement amends Accounting Research Bulletin No. 43, Chapter 4, “Inventory Pricing,” to clarify the accounting for abnormal amounts of idle facility expense, freight, handling costs and wasted mate-rial. This statement requires that those items be recognized as current-period charges and requires that allocation of fixed production overheads to the cost of conversion be based on the normal capacity of the production facilities. This statement is effective for fiscal years beginning after June 15, 2005. We do not expect the adoption of this state-ment to have a material impact on our financial condition or results of operations. In December 2004, the FASB issued SFAS No. 123 (revised 2004), “Share-Based Payment,” or SFAS No. 123R. SFAS No. 123R replaces SFAS No. 123, “Accounting for Stock-Based Compensation” and supersedes APB Opinion No. 25, “Accounting for Stock Issued to Employees,” and subsequently issued stock option related guidance. This statement establishes standards for the accounting for transactions in which an entity exchanges its equity instru-ments for goods or services, primarily on accounting for transactions in which an entity obtains employee services in share-based payment transactions. It also addresses transactions in which an entity incurs liabilities in exchange for goods or services that are based on the fair value of the entity’s equity instruments or that may be settled by the issuance of those equity instruments. Entities will be required to measure the cost of employee services received in exchange for an award of equity instruments based on the grant-date fair value of the award (with limited excep-tions). That cost will be recognized over the period during which an employee is required to provide service in exchange for the award (usually the vesting period). The grant-date fair value of employee share options and similar instruments will be estimated using option-pricing models. If an equity award is modified after the grant date, incre-mental compensation cost will be recognized in an amount equal to the excess of the fair value of the modified award over the fair value of the original award immediately before the modification. We are required to apply SFAS No. 123R to all awards granted, modified or settled as of the beginning of the first interim or annual reporting period that begins after June 15, 2005. We are also required to use either the modified- prospective method or modified-retrospective method. Under the modified-prospective method, we must recog-nize compensation cost for all awards subsequent to adopt-ing the standard and for the unvested portion of previously granted awards outstanding upon adoption. Under the modified-retrospective method, we must restate our previ-ously issued financial statements to recognize the amounts
we previously calculated and reported on a pro forma basis, as if the prior standard had been adopted. Under both methods, we are permitted to use either the straight line or an accelerated method to amortize the cost as an expense for awards with graded vesting. The standard permits and encourages early adoption. We have commenced our analysis of the impact of SFAS No. 123R, but have not yet decided: (1) whether we elect to early adopt, (2) if we elect to early adopt, what date we would do so, (3) whether we will use the modified-prospective or modified-retrospective method, and (4) whether we will elect to use straight-line or an accelerated method. Accordingly, we have not determined the impact that the adoption of SFAS No. 123R will have on our finan-cial position or results of operations.
Quantitative and Qualitative Disclosures About Market Risks We are exposed to cash flow risk due to changes in interest rates with respect to our long-term debt. Our long-term debt currently consists of borrowings under a senior credit facility and is primarily vulnerable to movements in the LIBOR rate. While we cannot predict the impact inter-est rate movements will have on our debt, exposure to rate changes is managed through the use of hedging activities. Our future exposure to interest rate risk increased during 2004 due to the expiration of our $150.0 million zero-cost collar during November 2004. In March 2003, we entered into two interest rate swap agreements on an aggregate of $125 million of our debt under our credit facility. The first swap allows us to fix our LIBOR rate at 2.269% on $75.0 million of variable rate debt for a term of 36 months, expiring in the first quarter of fiscal 2006. The second swap allows us to fix our LIBOR rate at 1.79% on $50.0 million of variable rate debt for a term of 24 months, expiring in the first quarter of fiscal 2005. Subsequent to January 1, 2005 and in an effort to man-age our future interest rate risk, we entered into the follow-ing three new interest rate swap agreements on an aggregate of $175 million of debt under our senior credit facility. The detail for the individual swaps is as follows:• The first swap, beginning in March 2005, allows us to
fix our total interest rate at 4.153% on $50 million of our debt for a term of 48 months;
• The second swap, beginning in March 2005, allows us to fix our total interest rate at 4.255% on $75 million of our debt for a term of 60 months; and
• The third swap, beginning in March 2006, allows us to fix our total interest rate at 4.6125% on $50 million of our debt for a term of 54 months.

28
Management’s Discussion and Analysis of Financial Condition and Results of Operations (continued)
The table below presents principal cash flows and related weighted-average interest rates on our long-term debt out-standing at January 1, 2005, by expected maturity dates. Additionally, the table includes the notional amounts of our debt hedged and the impact of the anticipated average pay and receive rates of our interest rate swaps through their maturity dates. Expected maturity dates approximate contract terms. Weighted-average variable rates are based on implied forward rates in the yield curve at January 1, 2005, as adjusted by the limitations of the swap agreement. The impact of our three interest rate swap agreements entered into in March 2005 are not reflected in the table below. Implied forward rates should not be considered a predictor of actual future interest rates.
Fiscal 2005
Fiscal 2006
Fiscal 2007
Fiscal 2008
Fiscal 2009 Thereafter Total
Fair Market Liability
(dollars in thousands)
Long-term debt: Variable rate ............................... $31,700 $24,525 $40,200 $63,375 $52,700 $257,500 $470,000 — Weighted-average interest rate ... 4.7% 5.4% 5.7% 6.1% 6.4% 6.7% 5.8% —Interest rate swap: Variable to fixed ......................... $125,000 $75,000 $ — $ — $ — $ — $125,000 $814 Average pay rate ......................... — — — — — — — — Average receive rate ................... 0.5% 0.3% — — — — 0.5% —
Forward-Looking Statements Certain statements in this report are “forward-looking statements” within the meaning of Section 27A of the Securities Act of 1933 and Section 21E of the Securities Exchange Act of 1934, which are usually identified by the use of words such as “will,” “anticipates,” “believes,” “estimates,” “expects,” “projects,” “forecasts,” “plans,” “intends,” “should” or similar expressions. We intend those forward-looking statements to be covered by the safe har-bor provisions for forward-looking statements contained in the Private Securities Litigation Reform Act of 1995 and are included in this statement for purposes of complying with these safe harbor provisions. These forward-looking statements reflect current views about our plans, strategies and prospects, which are based on the information currently available and on current assumptions. Although we believe that our plans, intentions and expectations as reflected in or suggested by those forward-looking statements are reasonable, we can give no assur-ance that the plans, intentions or expectations will be achieved. Listed below and discussed elsewhere in this report are some important risks, uncertainties and contin-gencies which could cause our actual results, performance or achievements to be materially different from the forward-looking statements made in this report. These risks, uncer-tainties and contingencies include, but are not limited to, the following:• the implementation of our business strategies and goals;• our ability to expand our business;
• integration of any future acquisitions;• a decrease in overall demand for our products;• the occurrence of natural disasters and/or extended peri-
ods of inclement weather;• deterioration in general economic conditions;• our ability to attract and retain qualified team members;• competitive pricing and other competitive pressures;• our relationships with our vendors;• our involvement as a defendant in litigation or incurrence
of judgments, fines or legal costs;• adherence to the restrictions and covenants imposed
under our credit facility; and• other statements that are not of historical fact made
throughout this report, including in the sections entitled “Management’s Discussion and Analysis of Financial Condition and Results of Operations” and “Risk Factors” found in our Form 10-K filed on March 17, 2005 with the Securities and Exchange Commission.
We assume no obligations to update publicly any forward- looking statements, whether as a result of new information, future events or otherwise. In evaluating forward-looking statements, you should consider these risks and uncertain-ties, together with the other risks described from time to time in our other reports and documents filed with the Securities and Exchange Commission, and you should not place undue reliance on those statements.

Advance Auto Parts, Inc. and Subsidiaries
29
January 1, 2005
January 3, 2004
(in thousands, except per share data)
AssetsCurrent assets: Cash and cash equivalents ....................................................................................................................... $ 56,321 $ 11,487 Receivables, net ....................................................................................................................................... 101,969 84,799 Inventories, net ........................................................................................................................................ 1,201,450 1,113,781 Other current assets ................................................................................................................................. 17,687 16,387
Total current assets .......................................................................................................................... 1,377,427 1,226,454Property and equipment, net of accumulated depreciation of $474,820 and $395,027 ................................ 786,212 712,702Assets held for sale ...................................................................................................................................... 18,298 20,191Other assets, net .......................................................................................................................................... 20,025 23,724
$2,201,962 $1,983,071
Liabilities and Stockholders’ EquityCurrent liabilities: Bank overdrafts ....................................................................................................................................... $ 20,184 $ 31,085 Current portion of long-term debt ........................................................................................................... 31,700 22,220 Financed vendor accounts payable .......................................................................................................... 56,896 — Accounts payable ..................................................................................................................................... 587,948 568,275 Accrued expenses .................................................................................................................................... 198,479 173,818 Other current liabilities ........................................................................................................................... 65,918 58,547
Total current liabilities .................................................................................................................... 961,125 853,945
Long-term debt ............................................................................................................................................. 438,300 422,780
Other long-term liabilities ............................................................................................................................ 80,222 75,102
Commitments and contingenciesStockholders’ equity: Preferred stock, nonvoting, $0.0001 par value, 10,000 shares authorized; no shares issued
or outstanding ...................................................................................................................................... — — Common stock, voting, $0.0001 par value, 200,000 shares authorized; 75,945 shares issued
and 72,245 outstanding in 2004 and 73,884 issued and outstanding in 2003 ................................... 8 7 Additional paid-in capital ........................................................................................................................ 695,215 647,106 Treasury stock, at cost, 3,700 shares ....................................................................................................... (146,370) — Accumulated other comprehensive gain (loss) ....................................................................................... 814 (529) Retained earnings (accumulated deficit) ................................................................................................ 172,648 (15,340)
Total stockholders’ equity ............................................................................................................... 722,315 631,244
$2,201,962 $1,983,071
The accompanying notes to consolidated financial statements are an integral part of these statements.
Consolidated Balance SheetsJanuary 1, 2005 and January 3, 2004
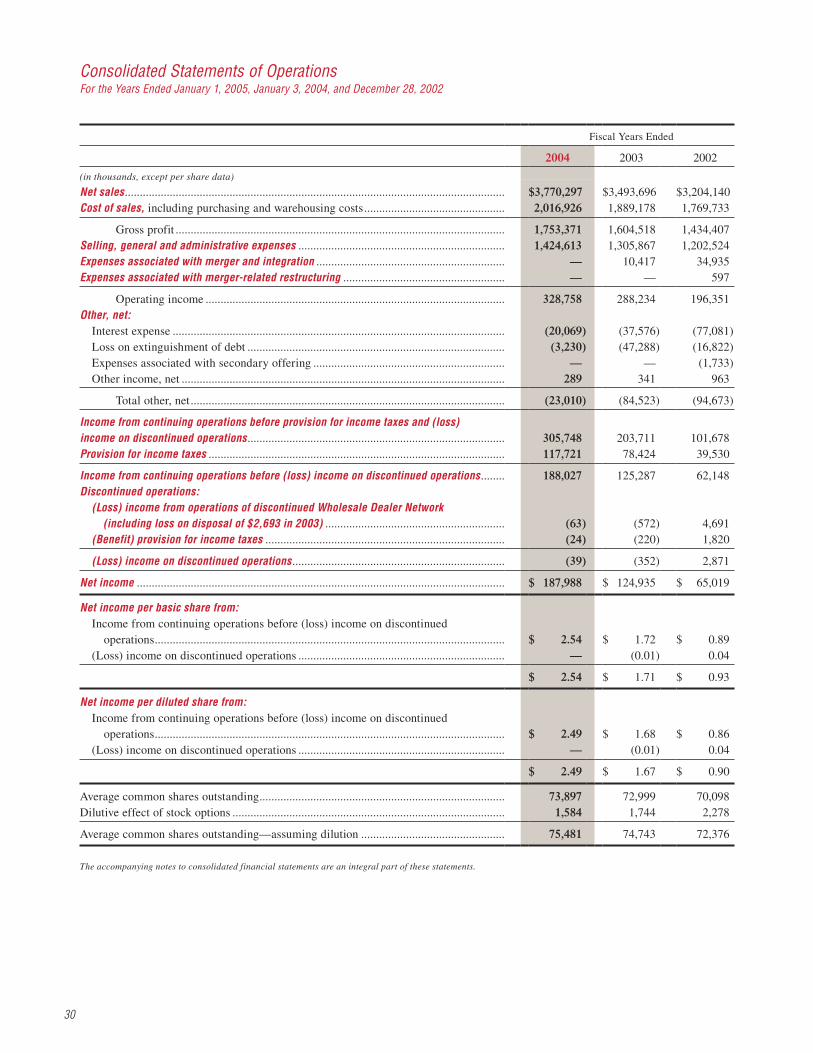
30
Fiscal Years Ended
2004 2003 2002
(in thousands, except per share data)
Net sales ............................................................................................................................... $3,770,297 $3,493,696 $3,204,140Cost of sales, including purchasing and warehousing costs ............................................... 2,016,926 1,889,178 1,769,733
Gross profit .............................................................................................................. 1,753,371 1,604,518 1,434,407Selling, general and administrative expenses ..................................................................... 1,424,613 1,305,867 1,202,524Expenses associated with merger and integration ............................................................... — 10,417 34,935Expenses associated with merger-related restructuring ...................................................... — — 597
Operating income .................................................................................................... 328,758 288,234 196,351Other, net: Interest expense ............................................................................................................... (20,069) (37,576) (77,081) Loss on extinguishment of debt ...................................................................................... (3,230) (47,288) (16,822) Expenses associated with secondary offering ................................................................ — — (1,733) Other income, net ............................................................................................................ 289 341 963
Total other, net ......................................................................................................... (23,010) (84,523) (94,673)
Income from continuing operations before provision for income taxes and (loss) income on discontinued operations ...................................................................................... 305,748 203,711 101,678Provision for income taxes ................................................................................................... 117,721 78,424 39,530
Income from continuing operations before (loss) income on discontinued operations ........ 188,027 125,287 62,148Discontinued operations: (Loss) income from operations of discontinued Wholesale Dealer Network
(including loss on disposal of $2,693 in 2003) ............................................................ (63) (572) 4,691 (Benefit) provision for income taxes ................................................................................ (24) (220) 1,820
(Loss) income on discontinued operations ....................................................................... (39) (352) 2,871
Net income ........................................................................................................................... $ 187,988 $ 124,935 $ 65,019
Net income per basic share from: Income from continuing operations before (loss) income on discontinued
operations ..................................................................................................................... $ 2.54 $ 1.72 $ 0.89 (Loss) income on discontinued operations ..................................................................... — (0.01) 0.04
$ 2.54 $ 1.71 $ 0.93
Net income per diluted share from: Income from continuing operations before (loss) income on discontinued
operations ..................................................................................................................... $ 2.49 $ 1.68 $ 0.86 (Loss) income on discontinued operations ..................................................................... — (0.01) 0.04
$ 2.49 $ 1.67 $ 0.90
Average common shares outstanding .................................................................................. 73,897 72,999 70,098Dilutive effect of stock options ........................................................................................... 1,584 1,744 2,278
Average common shares outstanding—assuming dilution ................................................ 75,481 74,743 72,376
The accompanying notes to consolidated financial statements are an integral part of these statements.
Consolidated Statements of OperationsFor the Years Ended January 1, 2005, January 3, 2004, and December 28, 2002
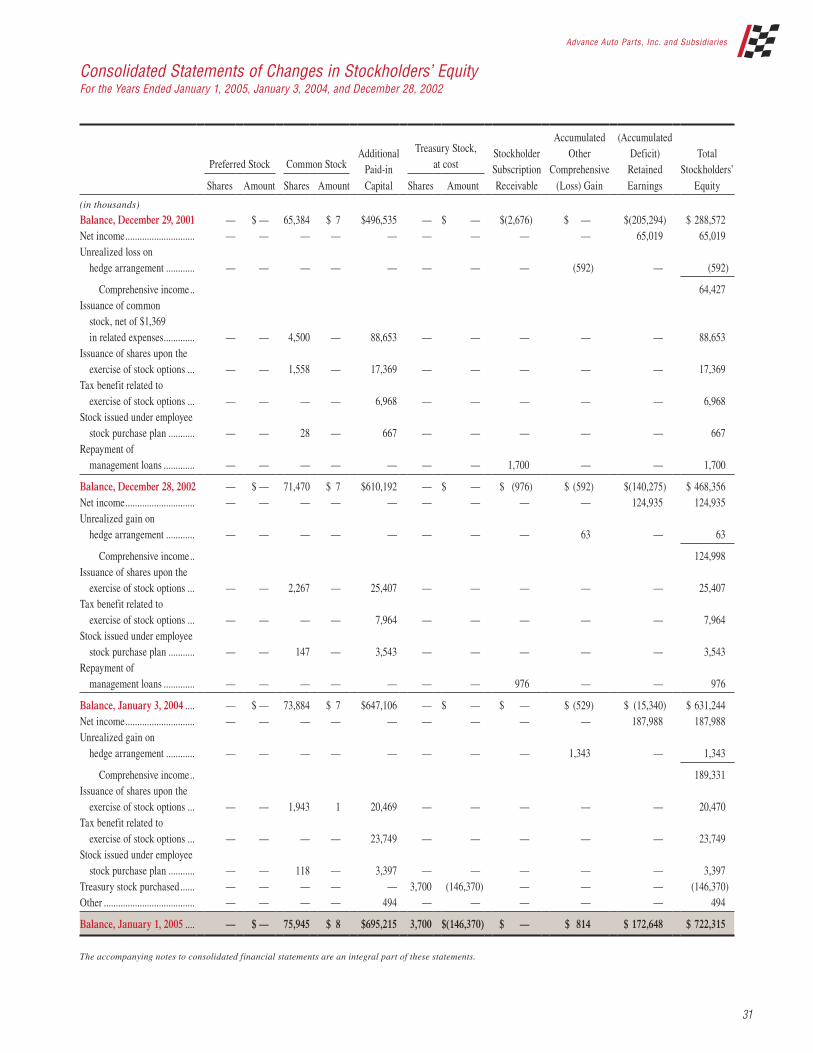
Advance Auto Parts, Inc. and Subsidiaries
31
Preferred Stock Common StockAdditional
Paid-in
Treasury Stock, at cost
Stockholder Subscription
Accumulated Other
Comprehensive
(Accumulated Deficit)
Retained Total
Stockholders’Shares Amount Shares Amount Capital Shares Amount Receivable (Loss) Gain Earnings Equity
(in thousands)
Balance, December 29, 2001 — $ — 65,384 $ 7 $496,535 — $ — $(2,676) $ — $(205,294) $ 288,572Net income ............................. — — — — — — — — — 65,019 65,019Unrealized loss on hedge arrangement ............ — — — — — — — — (592) — (592)
Comprehensive income .. 64,427Issuance of common stock, net of $1,369
in related expenses ............. — — 4,500 — 88,653 — — — — — 88,653Issuance of shares upon the exercise of stock options ... — — 1,558 — 17,369 — — — — — 17,369Tax benefit related to exercise of stock options ... — — — — 6,968 — — — — — 6,968Stock issued under employee stock purchase plan ........... — — 28 — 667 — — — — — 667Repayment of management loans ............. — — — — — — — 1,700 — — 1,700
Balance, December 28, 2002 — $ — 71,470 $ 7 $610,192 — $ — $ (976) $ (592) $(140,275) $ 468,356Net income ............................. — — — — — — — — — 124,935 124,935Unrealized gain on hedge arrangement ............ — — — — — — — — 63 — 63
Comprehensive income .. 124,998Issuance of shares upon the exercise of stock options ... — — 2,267 — 25,407 — — — — — 25,407Tax benefit related to exercise of stock options ... — — — — 7,964 — — — — — 7,964Stock issued under employee stock purchase plan ........... — — 147 — 3,543 — — — — — 3,543Repayment of management loans ............. — — — — — — — 976 — — 976
Balance, January 3, 2004 .... — $ — 73,884 $ 7 $647,106 — $ — $ — $ (529) $ (15,340) $ 631,244Net income ............................. — — — — — — — — — 187,988 187,988Unrealized gain on hedge arrangement ............ — — — — — — — — 1,343 — 1,343
Comprehensive income .. 189,331Issuance of shares upon the exercise of stock options ... — — 1,943 1 20,469 — — — — — 20,470Tax benefit related to exercise of stock options ... — — — — 23,749 — — — — — 23,749Stock issued under employee stock purchase plan ........... — — 118 — 3,397 — — — — — 3,397Treasury stock purchased ...... — — — — — 3,700 (146,370) — — — (146,370)Other ...................................... — — — — 494 — — — — — 494
Balance, January 1, 2005 .... — $ — 75,945 $ 8 $695,215 3,700 $(146,370) $ — $ 814 $ 172,648 $ 722,315
The accompanying notes to consolidated financial statements are an integral part of these statements.
Consolidated Statements of Changes in Stockholders’ EquityFor the Years Ended January 1, 2005, January 3, 2004, and December 28, 2002

32
Fiscal Years Ended
2004 2003 2002
(in thousands)
Cash flows from operating activities: Net income ........................................................................................................................... $ 187,988 $ 124,935 $ 65,019 Adjustments to reconcile net income to net cash provided by operating activities: Depreciation and amortization ........................................................................................ 104,877 100,737 94,090 Amortization of deferred debt issuance costs ................................................................. 1,082 1,470 3,536 Amortization of bond discount ....................................................................................... — 3,640 13,076 Non-cash equity compensation ....................................................................................... 3,891 3,543 667 Loss (gain) on disposal of property and equipment, net ................................................ 447 793 (1,838) Provision for deferred income taxes ............................................................................... 6,508 53,742 51,426 Tax benefit related to exercise of stock options .............................................................. 23,749 7,964 6,968 Loss on extinguishment of debt ...................................................................................... 3,230 47,288 16,822 Net (increase) decrease in: Receivables, net ........................................................................................................... (15,945) 17,775 (6,610) Inventories, net ............................................................................................................ (87,669) (64,893) (69,481) Other assets .................................................................................................................. 1,750 (7,216) (9,824) Net increase (decrease) in: Accounts payable ......................................................................................................... 19,673 97,535 41,699 Accrued expenses ........................................................................................................ 12,581 (27,985) 34,110 Other liabilities ............................................................................................................ 1,632 (3,407) 3,336
Net cash provided by operating activities ............................................................... 263,794 355,921 242,996
Cash flows from investing activities: Purchases of property and equipment ................................................................................. (179,766) (101,177) (98,186) Acquisitions, net of cash acquired ...................................................................................... — — (13,176) Proceeds from sales of property and equipment ................................................................ 12,944 15,703 33,357
Net cash used in investing activities ....................................................................... (166,822) (85,474) (78,005)
Cash flows from financing activities: (Decrease) increase in bank overdrafts .............................................................................. (10,901) 30,216 (33,879) Increase in financed vendor accounts payable ................................................................... 56,896 — — Early extinguishment of debt .............................................................................................. (105,000) (647,462) (464,991) Borrowings under credit facilities ....................................................................................... 256,500 452,600 308,100 Payments on credit facilities ............................................................................................... (126,500) (99,300) (66,400) Repayment of industrial development revenue bonds ........................................................ — — (10,000) Payment of debt-related costs .............................................................................................. (3,509) (38,330) (10,955) Repayment of management loans ........................................................................................ — 976 1,700 Proceeds from issuance of common stock, net of related expenses .................................. — — 88,658 Proceeds from exercise of stock options ............................................................................. 20,470 25,407 17,369 Repurchase of common stock ............................................................................................. (146,370) — — Increase in borrowings secured by trade receivables ......................................................... 6,276 3,048 1,175
Net cash used in financing activities ...................................................................... (52,138) (272,845) (169,223)
Net increase (decrease) in cash and cash equivalents ............................................................ 44,834 (2,398) (4,232)Cash and cash equivalents, beginning of period ..................................................................... 11,487 13,885 18,117
Cash and cash equivalents, end of period ............................................................................... $ 56,321 $ 11,487 $ 13,885
Supplemental cash flow information: Interest paid ......................................................................................................................... $ 15,616 $ 33,904 $ 60,081 Income tax (payments) refunds, net .................................................................................... (86,051) (10,126) 2,910Non-cash transactions: Accrued purchases of property and equipment .................................................................. 21,479 9,324 15,818 Unrealized gain (loss) on hedge arrangements .................................................................. 1,343 63 (592) Accounts and note receivable upon disposal of property and equipment .......................... 1,225 — 925
The accompanying notes to consolidated financial statements are an integral part of these statements.
Consolidated Statements of Cash FlowsFor the Years Ended January 1, 2005, January 3, 2004, and December 28, 2002

Advance Auto Parts, Inc. and Subsidiaries
33
1. Organization and Description of Business Advance Auto Parts, Inc. (“Advance”) conducts all of its operations through its wholly owned subsidiary, Advance Stores Company, Incorporated and its subsidiaries (“Stores”). Advance and Stores (collectively, the “Company”) operate 2,652 stores within the United States, Puerto Rico and the Virgin Islands. The Company operates 2,617 stores throughout 39 states in the Northeastern, Southeastern and Midwestern regions of the United States. These stores operate under the “Advance Auto Parts” trade name except for certain stores in the state of Florida which operate under the “Advance Discount Auto Parts” or “Discount Auto Parts” trade names. These stores offer automotive replace-ment parts, accessories and maintenance items, with no significant concentration in any specific area. In addition, the Company operates 35 stores under the “Western Auto” trade name, located primarily in Puerto Rico and the Virgin Islands, which offer tires and service in addition to automotive parts, accessories and maintenance items.
2. Summary of Significant Accounting Policies
Accounting Period The Company’s fiscal year ends on the Saturday nearest the end of December, which results in an extra week every six years. Accordingly, fiscal 2003 includes 53 weeks of operations. All other fiscal years presented include 52 weeks of operations.
Principles of Consolidation The consolidated financial statements include the accounts of the Company and its wholly owned subsidiaries. All sig-nificant intercompany balances and transactions have been eliminated in consolidation.
Use of Estimates The preparation of financial statements in conformity with accounting principles generally accepted in the United States of America requires management to make estimates and assumptions that affect the reported amounts of assets and liabilities and the disclosure of contingent assets and liabilities at the date of the financial statements and the reported amounts of revenues and expenses during the reporting period. Actual results could differ from those estimates.
Cash, Cash Equivalents and Bank Overdrafts Cash and cash equivalents consist of cash in banks and money market funds. Bank overdrafts include net outstand-ing checks not yet presented to a bank for settlement.
Vendor Incentives The Company receives incentives in the form of reduc-tions to amounts owed and/or payments from vendors related to cooperative advertising allowances, volume rebates and other promotional consideration. The Company
accounts for vendor incentives in accordance with Emerg-ing Issues Task Force, or EITF, No. 02-16, “Accounting by a Customer (Including a Reseller) for Certain Consideration Received from a Vendor.” Many of the incentives are under long-term agreements (terms in excess of one year), while others are negotiated on an annual basis. Certain vendors require the Company to use cooperative advertising allow-ances exclusively for advertising. The Company defines these allowances as restricted cooperative advertising allowances and recognizes them as a reduction to selling, general and administrative expenses as incremental adver-tising expenditures are incurred. The remaining coopera-tive advertising allowances not restricted by the Company’s vendors and volume rebates are earned based on inventory purchases and recorded as a reduction to inventory and recognized through cost of sales as the inventory is sold. The Company recognizes other promotional incentives earned under long-term agreements as a reduction to cost of sales. These incentives are recognized based on the cumulative purchases as a percentage of total estimated purchases over the life of the agreement. The Company’s margins could be impacted positively or negatively if actual purchases or results from any one-year differ from its estimates, however the impact over the life of the agree-ment would be the same. Short-term incentives (terms less than one year) are recognized as a reduction to cost of sales over the course of the annual agreements and are not recorded as reductions to inventory. Amounts received or receivable from vendors that are not yet earned are reflected as deferred revenue in the accompanying consolidated balance sheets. Management’s estimate of the portion of deferred revenue that will be realized within one year of the balance sheet date has been included in other current liabilities in the accompanying consolidated balance sheets. Total deferred revenue is $17,000 and $19,524 at January 1, 2005 and January 3, 2004, respectively. Earned amounts that are receivable from vendors are included in receivables, net on the accom-panying consolidated balance sheets, except for that por-tion expected to be received after one year, which is included in other assets, net on the accompanying consoli-dated balance sheets.
Preopening Expenses Preopening expenses, which consist primarily of payroll and occupancy costs, are expensed as incurred.
Advertising Costs The Company expenses advertising costs as incurred in accordance with the American Institute of Certified Public Accountant’s Statement of Position, or SOP, 93-7, “Reporting on Advertising Costs.” Gross advertising expense incurred was approximately $86,821, $75,870 and $69,637 in fiscal 2004, 2003 and 2002, respectively.
Notes to Consolidated Financial StatementsFor the Years Ended January 1, 2005, January 3, 2004, and December 28, 2002 (in thousands, except per share data)

34
Notes to Consolidated Financial Statements (continued)For the Years Ended January 1, 2005, January 3, 2004, and December 28, 2002 (in thousands, except per share data)
Merger and Integration Costs As a result of the Discount Auto Parts (“Discount”) acquisition in 2001, the Company incurred costs related to, among other things, overlapping administrative functions and store conversions, all of which have been expensed as incurred. These costs are presented as expenses associated with the merger and integration in the accompanying state-ments of operations. For the fiscal years ended January 3, 2004 and December 28, 2002, the Company incurred $10,417 and $35,532, respectively, of merger and integration and merger-related restructuring expenses.
Warranty Costs The Company’s vendors are primarily responsible for warranty claims. Warranty costs relating to merchandise and services sold under warranty, which are not covered by vendors’ warranties, are estimated based on the Company’s historical experience and are recorded in the period the product is sold. The Company has applied the disclosure requirements of Financial Accounting Standards Board, or FASB, Interpretation No. 45, “Guarantor’s Accounting and Disclosure Requirements for Guarantees, Including the Indirect Guarantees of Indebtedness of Others” as they relate to warranties. The following table presents changes in our defective and warranty reserves.
January 1, 2005
January 3, 2004
December 28, 2002
Defective and warranty reserve, beginning of period .................... $ 15,578 $ 15,620 $ 21,587
Reserves established(1) .. 13,071 13,755 11,632Reserves utilized .......... (17,689) (13,797) (16,015)Other adjustments(2) ...... — — (1,584)
Defective and warranty reserve, end of period ............. $ 10,960 $ 15,578 $ 15,620
(1) Reserves at January 3, 2004 include $1,656 of reserves established for the transition of the discontinued operations of the wholesale dealer network, of which $1,605 was utilized during 2004.
(2) Represents subsequent adjustments to the Company’s original purchase price allocation from the acquisition of Discount. These adjustments were the result of obtaining additional information related to the estimated costs of outstand-ing warranties and have been allocated proportionately to our non-current assets, primarily property and equipment. These adjustments had no direct impact on the statement of operations, but reduced the depreciable base of the associated non-current assets.
Revenue Recognition and Trade Receivables The Company recognizes merchandise revenue at the point of sale to customers. Service revenue is recognized upon performance of the service. The Company establishes reserves for returns and allowances at the time of sale
based on current sales levels and historical return rates. The majority of sales are made for cash; however, the Company extends credit to certain commercial customers through a third-party provider of private label credit cards. Receivables under the private label credit card program are transferred to the third-party provider on a limited recourse basis. The Company provides an allowance for doubtful accounts on receivables sold with recourse based upon factors related to credit risk of specific customers, his-torical trends and other information. This arrangement is accounted for as a secured borrowing. Receivables and the related secured borrowings under the private label credit card were $26,898 and $20,623 at January 1, 2005 and January 3, 2004, respectively, and are included in accounts receivable and other current liabilities, respectively, in the accompanying consolidated balance sheets.
Earnings Per Share of Common Stock Basic earnings per share of common stock has been computed based on the weighted-average number of com-mon shares outstanding during the period. Diluted earn-ings per share of common stock reflects the increase in the weighted-average number of common shares outstand-ing assuming the exercise of outstanding stock options, calculated on the treasury stock method. There were 340, 59 and 116 antidilutive options for the fiscal years ended January 1, 2005, January 3, 2004 and December 28, 2002, respectively.
Stock Split On October 29, 2003, the Company’s Board of Directors declared a two-for-one stock split of the Company’s common stock, effected as a 100% stock dividend. The dividend was distributed on January 2, 2004 to holders of record as of December 11, 2003 and began trading on a post-split basis on January 5, 2004. All share and per share amounts in the accompanying consolidated financial statements have been restated to reflect the effects of the stock split.
Stock-Based Compensation The Company has stock-based compensation plans including fixed stock option plans, deferred stock units and an employee stock purchase plan. As permitted under Statement of Financial Accounting Standard, or SFAS, No. 123, “Accounting for Stock-Based Compensation,” the Company accounts for its stock options using the intrinsic value method prescribed in Accounting Principles Board, or APB, Opinion No. 25, “Accounting for Stock Issued to Employees,” or APB No. 25. Under APB No. 25, com-pensation cost for stock options is measured as the excess,

Advance Auto Parts, Inc. and Subsidiaries
35
if any, of the market price of the Company’s common stock at the measurement date over the exercise price. Accordingly, the Company has not recognized compensa-tion expense on the issuance of its fixed options because the exercise price equaled the fair market value of the underlying stock on the grant date. In addition, the Company has not recognized compensation expense for its employee stock purchase plan since it is intended to be a plan that qualifies under Section 423 of the Internal Revenue Code of 1986, as amended. The issuance of deferred stock units results in compensation expense as discussed in the Equity Compensation footnote (Note 19). As required by SFAS No. 148, “Accounting for Stock-Based Compensation—Transition and Disclosure an amendment of FASB Statement No. 123,” the following table reflects the impact on net income and earnings per share as if the Company had adopted the fair method of recognizing stock-based compensation costs as prescribed by SFAS No. 123.
2004 2003 2002
Net income, as reported .......... $187,988 $124,935 $65,019Add: Total stock-based
employee compensation expense included in reported net income, net of related tax effects ................ 304 — —
Deduct: Total stock-based employee compensation expense determined under fair value based method for all awards, net of related tax effects ............................ (5,977) (4,636) (1,894)
Pro forma net income .............. $182,315 $120,299 $63,125
Net income per share: Basic, as reported ................ $ 2.54 $ 1.71 $ 0.93 Basic, pro forma .................. 2.47 1.65 0.90 Diluted, as reported ............. 2.49 1.67 0.90 Diluted, pro forma ............... 2.41 1.61 0.87
The fair value of each stock option was estimated on the date of the grant using the Black-Scholes option-pricing model with the following weighted-average assumptions:
2004 2003 2002
Risk-free interest rate ......................... 3.3% 3.1% 4.4%Expected dividend yield ..................... — — —Expected stock price volatility .......... 34.3% 41.0% 17.0%Expected life of stock options ............ 4 years 4 years 4 years
The weighted-average fair value of stock options granted during fiscal 2004, 2003 and 2002 used in computing pro forma compensation expense was $12.42, $7.61 and $8.20 per share, respectively.
Financed Vendor Accounts Payable During the first quarter on fiscal 2004, the Company entered a short-term financing program with a bank allow-ing it to extend its payment terms on certain merchandise purchases. Under this program, the Company issues negotiable instruments to vendors in lieu of a cash pay-ment. The vendor presents the instrument to the bank for payment at an agreed upon discount rate. The Company records this discount given by the vendor to the value of its inventory upon the Company’s issuance of the negotiable instrument and accretes this discount to the resulting short-term payable to the bank through interest expense over the extended term. At January 1, 2005, $56,896 was payable to the bank by the Company under this program and is included in the accompanying condensed consolidated balance sheets as Financed Vendor Accounts Payable.
Lease Accounting The Company leases certain store locations, distribution centers, office space, equipment and vehicles, some of which are with related parties. Initial terms for facility leases are typically 10 to 15 years, followed by additional terms containing renewal options at 5-year intervals, and may include rent escalation clauses. The total amount of the minimum rent is expensed on a straight-line basis over the initial term of the lease unless external economic fac-tors exist such that renewals are reasonably assured, in which case the Company would include the renewal period in its amortization period. In those instances the renewal period would be included in the lease term for purposes of establishing an amortization period and determining if such lease qualified as a capital or operating lease. In addi-tion to minimum fixed rentals, some leases provide for contingent facility rentals. Contingent facility rentals are determined on the basis of a percentage of sales in excess of stipulated minimums for certain store facilities as defined in the individual lease agreements. Most of the leases provide that the Company pay taxes, maintenance, insurance and certain other expenses applicable to the leased premises and include options to renew. Management expects that, in the normal course of business, leases that expire will be renewed or replaced by other leases.

36
Hedge Activities In March 2003 the Company entered into two interest rate swap agreements to limit its cash flow risk on an aggregate of $125,000 of its variable rate debt. The first swap allows the Company to fix its LIBOR rate at 2.269% on $75,000 of debt for a term of 36 months, expiring the first quarter of fiscal 2006. The second swap allows the Company to fix its LIBOR rate at 1.79% on an addi-tional $50,000 of debt for a term of 24 months, expiring the first quarter of fiscal 2005. In September 2002, the Company entered into a hedge agreement in the form of a zero-cost collar, which protects the Company from interest rate fluctuations in the LIBOR rate on $150,000 of its variable rate debt under its senior credit facility. The collar consists of an interest rate ceiling at 4.5% and an interest rate floor of 1.56% for a term of 24 months. Under this hedge, the Company will continue to pay interest at prevailing rates plus any spread, as defined by the Company’s credit facility, but will be reim-bursed for any amounts paid on the LIBOR rate in excess of the ceiling. Conversely, the Company will be required to pay the financial institution that originated the collar if the LIBOR rate is less than the floor. The collar expired during November 2004. In accordance with SFAS No. 133, “Accounting for Derivative Instruments and Hedging Activities,” the fair value of the hedge arrangement is recorded as an asset or liability in the accompanying consolidated balance sheets at January 3, 2004. The Company has adopted the “matched terms” accounting method as provided by Derivative Implementation Group, or DIG, Issue No. G20, “Assessing and Measuring the Effectiveness of a Purchased Option Used in a Cash Flow Hedge” for the zero-cost collar, and DIG Issue No. 9, “Assuming No Ineffectiveness When Critical Terms of the Hedging Instrument and the Hedge Transaction Match in a Cash Flow Hedge” for the interest rate swaps. Accordingly, the Company has matched the critical terms of each hedge instrument to the hedged debt and used the anticipated terminal value of zero to assume the hedges have no ineffectiveness. In addition, the Company will record all adjustments to the fair value of the hedge instruments in accumulated other comprehen-sive income (loss) through the maturity date of the appli-cable hedge arrangement. The fair value at January 1, 2005 was an unrecognized gain of $814 on the swaps. Any amounts received or paid under these hedges will be recorded in the statements of operations as earned or
incurred. Comprehensive income for the fiscal years ended January 1, 2005 and January 3, 2004 is as follows:
January 1, 2005
January 3, 2004
Net income ................................................. $187,988 $124,935Unrealized gain on hedge arrangements ......................................... 1,343 63
Comprehensive income ............................. $189,331 $124,998
Based on the estimated current and future fair values of the hedge arrangements at January 1, 2005, the Company estimates amounts currently included in accumulated other comprehensive income that will be reclassified to earnings in the next 12 months will consist of a gain of $627 associ-ated with the interest rate swaps. Subsequent to January 1, 2005, the Company entered into three interest rate swap agreements on an aggregate of $175 million of debt under its senior credit facility. The first swap, beginning in March 2005, provides for the Company to fix its total interest rate at 4.153% on $50 million of debt for a term of 48 months. The second swap, beginning in March 2005, provides for the Company to fix its total interest rate at 4.255% on $75 million of debt for a term of 60 months. The third swap, beginning in March 2006, provides for the Company to fix its total interest rate at 4.6125% on $50 million of debt for a term of 54 months.
Segment Reporting The Company operates in one business segment as defined by the provisions of SFAS No. 131, “Disclosures About Segments of an Enterprise and Related Information,” which defines how operating segments are determined and requires disclosures about products, services, major customers and geographic areas. Prior to the Company’s discontinuance of the Wholesale Distribution Network in fiscal 2003 (Note 3), the Company operated in two busi-ness segments.
Recent Accounting Pronouncements In April 2002, the FASB issued SFAS No. 145, “Rescis-sion of FASB Statements No. 4, 44 and 64, Amendment of FASB Statement No. 13 and Technical Corrections.” As a result of rescinding FASB Statement No. 4, “Reporting Gains Losses from Extinguishment of Debt,” gains and losses from extinguishment of debt should be classified as extraordinary items only if they meet the criteria in APB Opinion No. 30, “Reporting the Results of Operations—Reporting the Effects of Disposal of a Segment of a
Notes to Consolidated Financial Statements (continued)For the Years Ended January 1, 2005, January 3, 2004, and December 28, 2002 (in thousands, except per share data)
Advance Auto Parts, Inc. and Subsidiaries
37
Business, and Extraordinary, Unusual and Infrequently Occurring Events and Transactions.” This statement also amends FASB Statement No. 13, “Accounting for Leases,” to eliminate an inconsistency between the required accounting for sale-leaseback transactions and the required accounting for certain lease modifications that have eco-nomic effects that are similar to sale-leaseback transac-tions. Additional amendments include changes to other existing authoritative pronouncements to make various technical corrections, clarify meanings or describe their applicability under changed conditions. The Company adopted SFAS No. 145 during the first quarter of fiscal 2003. For the fiscal years ended 2004, 2003 and 2002, the Company recorded losses on the extinguishment of debt of $3,230, $47,288 and $16,822, respectively. In July 2003 (as subsequently updated in November 2003), the FASB released Emerging Issues Task Force, or EITF, Issue No. 03-10, “Application of Issue No. 02-16 by Resellers to Sales Incentives Offered to Customers by Manufacturers.” This EITF addresses whether a reseller should account for consideration received from a vendor that is a reimbursement by the vendor for honoring the vendor’s sales incentives offered directly to consumers in accordance with the guidance in EITF Issue No. 02-16. For purposes of this Issue, the “vendor’s sales incentive offered directly to consumers” is limited to a vendor’s incentive (i) that can be tendered by a consumer at resellers that accept manufacturer’s incentives in partial (or full) of the price charged by the reseller for the vendor’s product, (ii) for which the reseller receives a direct reimbursement from the vendor (or a clearinghouse authorized by the ven-dor) based on the face amount of the incentive, (iii) for which the terms of reimbursement to the reseller for the vendor’s sales incentive offered to the consumer must not be influenced by or negotiated in conjunction with any other incentive arrangements between the vendor and the reseller but, rather may only be determined by the terms of the incentive offered to consumers and (iv) whereby the reseller is subject to an agency relationship with the ven-dor, whether expressed or implied, in the sales incentive transaction between the vendor and the consumer. The consensus is that sales incentives that meet all of such criteria are not subject to the guidance in EITF Issue No. 02-16. The release is effective for fiscal periods begin-ning after November 25, 2003. The Company adopted this release during the first quarter of fiscal 2004 with no impact on its financial position or results of operations.
In May 2004, the FASB issued FASB Staff Position, or FSP, 106-2, “Accounting and Disclosure Requirements Related to the Medicare Prescription Drug, Improvement and Modernization Act of 2003.” FSP 106-2 addresses the appropriate accounting and disclosure requirements for companies that sponsor a postretirement health care plan that provides prescription drug benefits. The new guidance was deemed necessary as a result of the 2003 Medicare prescription law which includes a federal subsidy for quali-fying companies. The effective date of FSP 106-2 is the first interim or annual period beginning after June 15, 2004. The Company completed a negative plan amend-ment to eliminate outpatient prescription drug benefits from its postretirement plan effective in the second quarter of fiscal 2004; therefore, the adoption of FSP 106-2 had no impact on its financial position, results of operations or related footnote disclosure. In November 2004, the FASB issued SFAS No. 151, “Inventory Costs.” The new statement amends Accounting Research Bulletin No. 43, Chapter 4, “Inventory Pricing,” to clarify the accounting for abnormal amounts of idle facility expense, freight, handling costs and wasted mate-rial. This statement requires that those items be recognized as current-period charges and requires that allocation of fixed production overheads to the cost of conversion be based on the normal capacity of the production facilities. This statement is effective for fiscal years beginning after June 15, 2005. The Company does not expect the adoption of this statement to have a material impact on its financial condition or results of operations. In December 2004, the FASB issued SFAS No. 123 (revised 2004), “Share-Based Payment,” or SFAS No. 123R. SFAS No. 123R replaces SFAS No. 123, “Accounting for Stock-Based Compensation” and supersedes APB Opinion No. 25, “Accounting for Stock Issued to Employees,” and subsequently issued stock option-related guidance. This statement establishes standards for the accounting for transactions in which an entity exchanges its equity instru-ments for goods or services, primarily on accounting for transactions in which an entity obtains employee services in share-based payment transactions. It also addresses transactions in which an entity incurs liabilities in exchange for goods or services that are based on the fair value of the entity’s equity instruments or that may be settled by the issuance of those equity instruments. Entities will be required to measure the cost of employee services received in exchange for an award of equity instruments based on
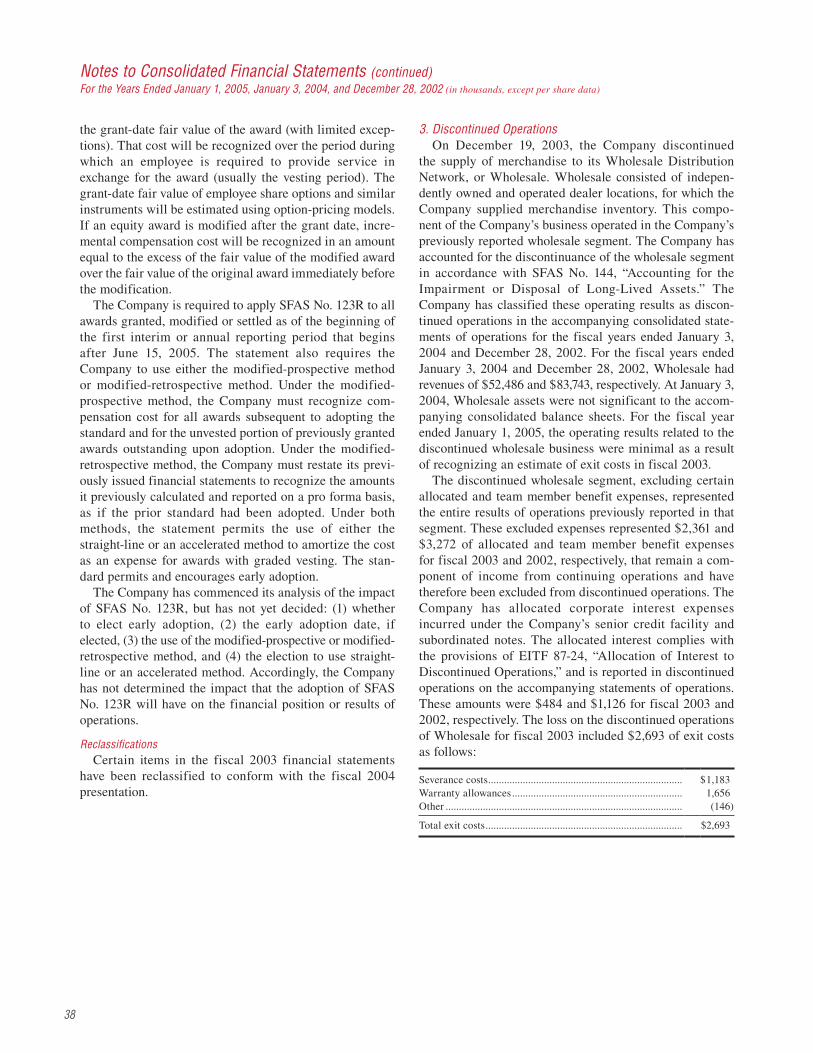
38
the grant-date fair value of the award (with limited excep-tions). That cost will be recognized over the period during which an employee is required to provide service in exchange for the award (usually the vesting period). The grant-date fair value of employee share options and similar instruments will be estimated using option-pricing models. If an equity award is modified after the grant date, incre-mental compensation cost will be recognized in an amount equal to the excess of the fair value of the modified award over the fair value of the original award immediately before the modification. The Company is required to apply SFAS No. 123R to all awards granted, modified or settled as of the beginning of the first interim or annual reporting period that begins after June 15, 2005. The statement also requires the Company to use either the modified-prospective method or modified-retrospective method. Under the modified-prospective method, the Company must recognize com-pensation cost for all awards subsequent to adopting the standard and for the unvested portion of previously granted awards outstanding upon adoption. Under the modified-retrospective method, the Company must restate its previ-ously issued financial statements to recognize the amounts it previously calculated and reported on a pro forma basis, as if the prior standard had been adopted. Under both methods, the statement permits the use of either the straight-line or an accelerated method to amortize the cost as an expense for awards with graded vesting. The stan-dard permits and encourages early adoption. The Company has commenced its analysis of the impact of SFAS No. 123R, but has not yet decided: (1) whether to elect early adoption, (2) the early adoption date, if elected, (3) the use of the modified-prospective or modified-retrospective method, and (4) the election to use straight-line or an accelerated method. Accordingly, the Company has not determined the impact that the adoption of SFAS No. 123R will have on the financial position or results of operations.
Reclassifications Certain items in the fiscal 2003 financial statements have been reclassified to conform with the fiscal 2004 presentation.
3. Discontinued Operations On December 19, 2003, the Company discontinued the supply of merchandise to its Wholesale Distribution Network, or Wholesale. Wholesale consisted of indepen-dently owned and operated dealer locations, for which the Company supplied merchandise inventory. This compo-nent of the Company’s business operated in the Company’s previously reported wholesale segment. The Company has accounted for the discontinuance of the wholesale segment in accordance with SFAS No. 144, “Accounting for the Impairment or Disposal of Long-Lived Assets.” The Company has classified these operating results as discon-tinued operations in the accompanying consolidated state-ments of operations for the fiscal years ended January 3, 2004 and December 28, 2002. For the fiscal years ended January 3, 2004 and December 28, 2002, Wholesale had revenues of $52,486 and $83,743, respectively. At January 3, 2004, Wholesale assets were not significant to the accom-panying consolidated balance sheets. For the fiscal year ended January 1, 2005, the operating results related to the discontinued wholesale business were minimal as a result of recognizing an estimate of exit costs in fiscal 2003. The discontinued wholesale segment, excluding certain allocated and team member benefit expenses, represented the entire results of operations previously reported in that segment. These excluded expenses represented $2,361 and $3,272 of allocated and team member benefit expenses for fiscal 2003 and 2002, respectively, that remain a com-ponent of income from continuing operations and have therefore been excluded from discontinued operations. The Company has allocated corporate interest expenses incurred under the Company’s senior credit facility and subordinated notes. The allocated interest complies with the provisions of EITF 87-24, “Allocation of Interest to Discontinued Operations,” and is reported in discontinued operations on the accompanying statements of operations. These amounts were $484 and $1,126 for fiscal 2003 and 2002, respectively. The loss on the discontinued operations of Wholesale for fiscal 2003 included $2,693 of exit costs as follows:
Severance costs ......................................................................... $ 1,183Warranty allowances ................................................................ 1,656Other ......................................................................................... (146)
Total exit costs .......................................................................... $2,693
Notes to Consolidated Financial Statements (continued)For the Years Ended January 1, 2005, January 3, 2004, and December 28, 2002 (in thousands, except per share data)
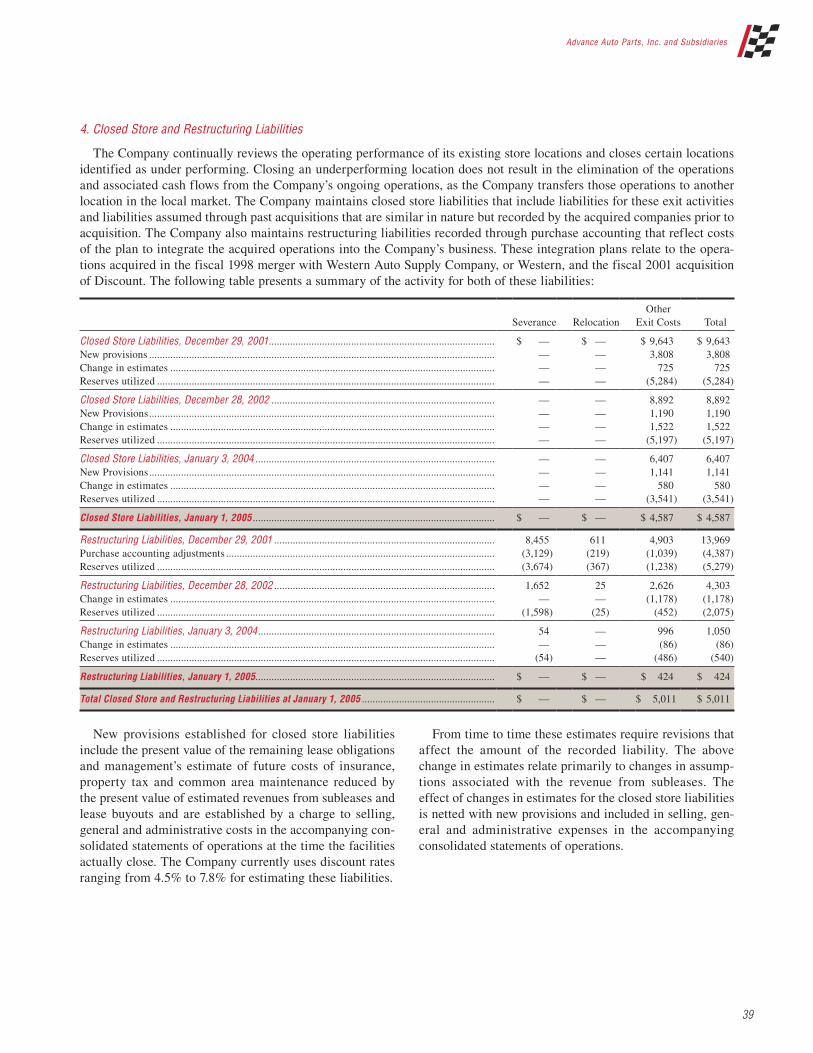
Advance Auto Parts, Inc. and Subsidiaries
39
4. Closed Store and Restructuring Liabilities
The Company continually reviews the operating performance of its existing store locations and closes certain locations identified as under performing. Closing an underperforming location does not result in the elimination of the operations and associated cash flows from the Company’s ongoing operations, as the Company transfers those operations to another location in the local market. The Company maintains closed store liabilities that include liabilities for these exit activities and liabilities assumed through past acquisitions that are similar in nature but recorded by the acquired companies prior to acquisition. The Company also maintains restructuring liabilities recorded through purchase accounting that reflect costs of the plan to integrate the acquired operations into the Company’s business. These integration plans relate to the opera-tions acquired in the fiscal 1998 merger with Western Auto Supply Company, or Western, and the fiscal 2001 acquisition of Discount. The following table presents a summary of the activity for both of these liabilities:
Severance RelocationOther
Exit Costs Total
Closed Store Liabilities, December 29, 2001 ..................................................................................... $ — $ — $ 9,643 $ 9,643New provisions .................................................................................................................................. — — 3,808 3,808Change in estimates .......................................................................................................................... — — 725 725Reserves utilized ............................................................................................................................... — — (5,284) (5,284)
Closed Store Liabilities, December 28, 2002 .................................................................................... — — 8,892 8,892New Provisions .................................................................................................................................. — — 1,190 1,190Change in estimates .......................................................................................................................... — — 1,522 1,522Reserves utilized ............................................................................................................................... — — (5,197) (5,197)
Closed Store Liabilities, January 3, 2004 .......................................................................................... — — 6,407 6,407New Provisions .................................................................................................................................. — — 1,141 1,141Change in estimates .......................................................................................................................... — — 580 580Reserves utilized ............................................................................................................................... — — (3,541) (3,541)
Closed Store Liabilities, January 1, 2005 ........................................................................................... $ — $ — $ 4,587 $ 4,587
Restructuring Liabilities, December 29, 2001 ................................................................................... 8,455 611 4,903 13,969Purchase accounting adjustments ..................................................................................................... (3,129) (219) (1,039) (4,387)Reserves utilized ............................................................................................................................... (3,674) (367) (1,238) (5,279)
Restructuring Liabilities, December 28, 2002 ................................................................................... 1,652 25 2,626 4,303Change in estimates .......................................................................................................................... — — (1,178) (1,178)Reserves utilized ............................................................................................................................... (1,598) (25) (452) (2,075)
Restructuring Liabilities, January 3, 2004 ......................................................................................... 54 — 996 1,050Change in estimates .......................................................................................................................... — — (86) (86)Reserves utilized ............................................................................................................................... (54) — (486) (540)
Restructuring Liabilities, January 1, 2005 .......................................................................................... $ — $ — $ 424 $ 424
Total Closed Store and Restructuring Liabilities at January 1, 2005 .................................................. $ — $ — $ 5,011 $ 5,011
New provisions established for closed store liabilities include the present value of the remaining lease obligations and management’s estimate of future costs of insurance, property tax and common area maintenance reduced by the present value of estimated revenues from subleases and lease buyouts and are established by a charge to selling, general and administrative costs in the accompanying con-solidated statements of operations at the time the facilities actually close. The Company currently uses discount rates ranging from 4.5% to 7.8% for estimating these liabilities.
From time to time these estimates require revisions that affect the amount of the recorded liability. The above change in estimates relate primarily to changes in assump-tions associated with the revenue from subleases. The effect of changes in estimates for the closed store liabilities is netted with new provisions and included in selling, gen-eral and administrative expenses in the accompanying consolidated statements of operations.
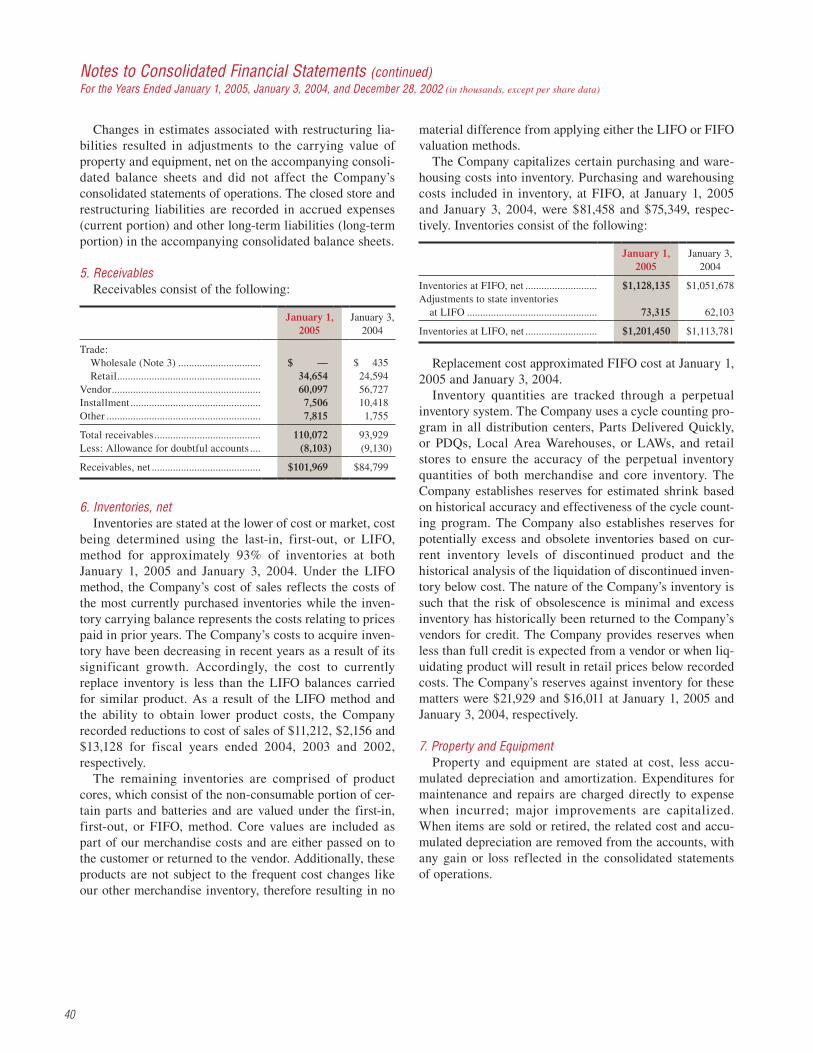
40
Changes in estimates associated with restructuring lia-bilities resulted in adjustments to the carrying value of property and equipment, net on the accompanying consoli-dated balance sheets and did not affect the Company’s consolidated statements of operations. The closed store and restructuring liabilities are recorded in accrued expenses (current portion) and other long-term liabilities (long-term portion) in the accompanying consolidated balance sheets.
5. Receivables Receivables consist of the following:
January 1, 2005
January 3, 2004
Trade: Wholesale (Note 3) ............................... $ — $ 435 Retail ...................................................... 34,654 24,594Vendor ........................................................ 60,097 56,727Installment ................................................. 7,506 10,418Other .......................................................... 7,815 1,755
Total receivables ........................................ 110,072 93,929Less: Allowance for doubtful accounts .... (8,103) (9,130)
Receivables, net ......................................... $101,969 $84,799
6. Inventories, net Inventories are stated at the lower of cost or market, cost being determined using the last-in, first-out, or LIFO, method for approximately 93% of inventories at both January 1, 2005 and January 3, 2004. Under the LIFO method, the Company’s cost of sales reflects the costs of the most currently purchased inventories while the inven-tory carrying balance represents the costs relating to prices paid in prior years. The Company’s costs to acquire inven-tory have been decreasing in recent years as a result of its significant growth. Accordingly, the cost to currently replace inventory is less than the LIFO balances carried for similar product. As a result of the LIFO method and the ability to obtain lower product costs, the Company recorded reductions to cost of sales of $11,212, $2,156 and $13,128 for fiscal years ended 2004, 2003 and 2002, respectively. The remaining inventories are comprised of product cores, which consist of the non-consumable portion of cer-tain parts and batteries and are valued under the first-in, first-out, or FIFO, method. Core values are included as part of our merchandise costs and are either passed on to the customer or returned to the vendor. Additionally, these products are not subject to the frequent cost changes like our other merchandise inventory, therefore resulting in no
material difference from applying either the LIFO or FIFO valuation methods. The Company capitalizes certain purchasing and ware-housing costs into inventory. Purchasing and warehousing costs included in inventory, at FIFO, at January 1, 2005 and January 3, 2004, were $81,458 and $75,349, respec-tively. Inventories consist of the following:
January 1, 2005
January 3, 2004
Inventories at FIFO, net ........................... $1,128,135 $1,051,678Adjustments to state inventories at LIFO ................................................. 73,315 62,103
Inventories at LIFO, net ........................... $1,201,450 $1,113,781
Replacement cost approximated FIFO cost at January 1, 2005 and January 3, 2004. Inventory quantities are tracked through a perpetual inventory system. The Company uses a cycle counting pro-gram in all distribution centers, Parts Delivered Quickly, or PDQs, Local Area Warehouses, or LAWs, and retail stores to ensure the accuracy of the perpetual inventory quantities of both merchandise and core inventory. The Company establishes reserves for estimated shrink based on historical accuracy and effectiveness of the cycle count-ing program. The Company also establishes reserves for potentially excess and obsolete inventories based on cur-rent inventory levels of discontinued product and the historical analysis of the liquidation of discontinued inven-tory below cost. The nature of the Company’s inventory is such that the risk of obsolescence is minimal and excess inventory has historically been returned to the Company’s vendors for credit. The Company provides reserves when less than full credit is expected from a vendor or when liq-uidating product will result in retail prices below recorded costs. The Company’s reserves against inventory for these matters were $21,929 and $16,011 at January 1, 2005 and January 3, 2004, respectively.
7. Property and Equipment Property and equipment are stated at cost, less accu-mulated depreciation and amortization. Expenditures for maintenance and repairs are charged directly to expense when incurred; major improvements are capitalized. When items are sold or retired, the related cost and accu-mulated depreciation are removed from the accounts, with any gain or loss reflected in the consolidated statements of operations.
Notes to Consolidated Financial Statements (continued)For the Years Ended January 1, 2005, January 3, 2004, and December 28, 2002 (in thousands, except per share data)

Advance Auto Parts, Inc. and Subsidiaries
41
Depreciation of land improvements, buildings, furniture, fixtures and equipment, and vehicles is provided over the estimated useful lives, which range from 2 to 40 years, of the respective assets using the straight-line method. Amortization of building and leasehold improvements is provided over the shorter of the original useful lives of the respective assets or the term of the lease using the straight-line method. The term of the lease is generally the initial term of the lease unless external economic factors exist such that renewals are reasonably assured, in which case the renewal period would be included in the lease term for purposes of establishing an amortization period. At January 1, 2005, construction in progress primarily con-sisted of construction-related costs for the Company’s new Northeast distribution center. Depreciation and amortiza-tion expense was $104,877, $100,737 and $94,090 for the fiscal years ended 2004, 2003 and 2002, respectively. Property and equipment consists of the following:
Original Useful Lives
January 1, 2005
January 3, 2004
Land and land improvements ............ 0–10 years $ 187,624 $ 177,088
Buildings ........................ 40 years 240,447 214,919Building and leasehold
improvements ............ 10–40 years 133,415 110,974Furniture, fixtures
and equipment ........... 3–12 years 632,312 553,759Vehicles .......................... 2–10 years 32,963 36,338Construction
in progress ................. 29,936 10,420Other .............................. 4,335 4,231
1,261,032 1,107,729Less: Accumulated
depreciation and amortization ............... (474,820) (395,027)
Property and equipment, net ........... $ 786,212 $ 712,702
The Company capitalized approximately $4,625, $5,423 and $2,888 incurred for the development of internal use computer software in accordance with the American Institute of Certified Public Accountant’s Statement of Position 98-1, “Accounting for the Cost of Computer Software Developed or Obtained for Internal Use” during fiscal 2004, fiscal 2003 and fiscal 2002, respectively. These costs are included in the furniture, fixtures and equipment category above and are depreciated on the straight-line method over three to seven years.
8. Assets Held for Sale The Company applies SFAS No. 144, “Accounting for the Impairment or Disposal of Long-Lived Assets,” which requires that long-lived assets and certain identifiable intangible assets to be disposed of be reported at the lower of the carrying amount or the fair market value less sel-ling costs. At January 1, 2005 and January 3, 2004, the Company’s assets held for sale were $18,298 and $20,191, respectively, primarily consisting of closed stores as a result of the Discount integration and two closed distribu-tion centers.
9. Other Assets As of January 1, 2005 and January 3, 2004, other assets include deferred debt issuance costs of $3,297 and $3,987, respectively (net of accumulated amortization of $1,935 and $1,793, respectively), relating to the Company’s senior credit facility. Such costs are being amortized over the term of the related debt. In November 2004, the Company wrote off $1,090 in deferred debt issuance costs included in other assets as a result of refinancing its senior credit facility. In April 2003, the Company redeemed all of its outstanding senior subordinated notes and senior discount debentures. Accordingly, the Company wrote off $9,822 in deferred debt issuance cost included in other assets.
10. Accrued Expenses Accrued expenses consist of the following:
January 1, 2005
January 3, 2004
Payroll and related benefits ....................... $ 81,305 $ 67,788Warranty .................................................... 10,960 15,578Other .......................................................... 106,214 90,452
Total accrued expenses ............................. $198,479 $173,818
11. Other Long-term Liabilities Other long-term liabilities consist of the following:
January 1, 2005
January 3, 2004
Employee benefits ..................................... $18,658 $19,162Restructuring and closed store liabilities ....................................... 3,122 4,684Deferred income taxes .............................. 43,636 39,525Other .......................................................... 14,806 11,731
Total other long-term liabilities ................ $80,222 $75,102
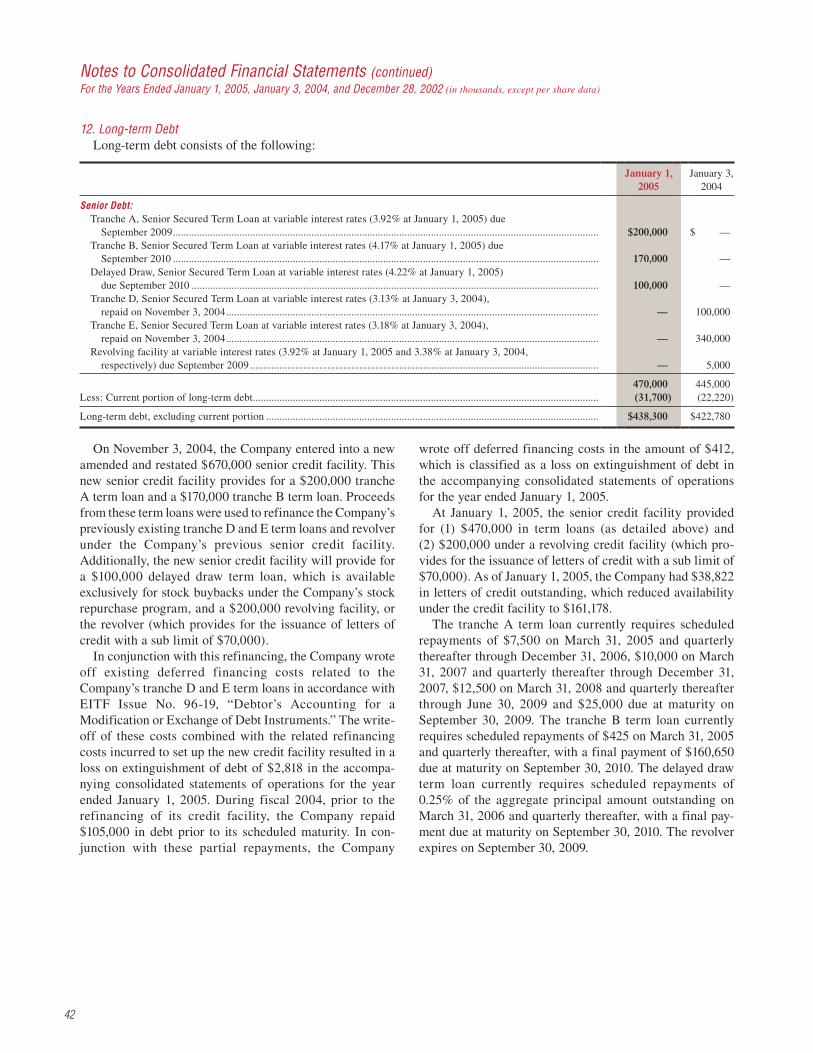
42
Notes to Consolidated Financial Statements (continued)For the Years Ended January 1, 2005, January 3, 2004, and December 28, 2002 (in thousands, except per share data)
12. Long-term Debt Long-term debt consists of the following:
January 1, 2005
January 3, 2004
Senior Debt: Tranche A, Senior Secured Term Loan at variable interest rates (3.92% at January 1, 2005) due
September 2009 ................................................................................................................................................................ $200,000 $ — Tranche B, Senior Secured Term Loan at variable interest rates (4.17% at January 1, 2005) due
September 2010 ................................................................................................................................................................ 170,000 — Delayed Draw, Senior Secured Term Loan at variable interest rates (4.22% at January 1, 2005)
due September 2010 ......................................................................................................................................................... 100,000 — Tranche D, Senior Secured Term Loan at variable interest rates (3.13% at January 3, 2004),
repaid on November 3, 2004 ............................................................................................................................................ — 100,000 Tranche E, Senior Secured Term Loan at variable interest rates (3.18% at January 3, 2004),
repaid on November 3, 2004 ............................................................................................................................................ — 340,000 Revolving facility at variable interest rates (3.92% at January 1, 2005 and 3.38% at January 3, 2004,
respectively) due September 2009 ................................................................................................................................... — 5,000
470,000 445,000Less: Current portion of long-term debt .................................................................................................................................. (31,700) (22,220)
Long-term debt, excluding current portion ............................................................................................................................. $438,300 $422,780
On November 3, 2004, the Company entered into a new amended and restated $670,000 senior credit facility. This new senior credit facility provides for a $200,000 tranche A term loan and a $170,000 tranche B term loan. Proceeds from these term loans were used to refinance the Company’s previously existing tranche D and E term loans and revolver under the Company’s previous senior credit facility. Additionally, the new senior credit facility will provide for a $100,000 delayed draw term loan, which is available exclusively for stock buybacks under the Company’s stock repurchase program, and a $200,000 revolving facility, or the revolver (which provides for the issuance of letters of credit with a sub limit of $70,000). In conjunction with this refinancing, the Company wrote off existing deferred financing costs related to the Company’s tranche D and E term loans in accordance with EITF Issue No. 96-19, “Debtor’s Accounting for a Modification or Exchange of Debt Instruments.” The write-off of these costs combined with the related refinancing costs incurred to set up the new credit facility resulted in a loss on extinguishment of debt of $2,818 in the accompa-nying consolidated statements of operations for the year ended January 1, 2005. During fiscal 2004, prior to the refinancing of its credit facility, the Company repaid $105,000 in debt prior to its scheduled maturity. In con-junction with these partial repayments, the Company
wrote off deferred financing costs in the amount of $412, which is classified as a loss on extinguishment of debt in the accompanying consolidated statements of operations for the year ended January 1, 2005. At January 1, 2005, the senior credit facility provided for (1) $470,000 in term loans (as detailed above) and (2) $200,000 under a revolving credit facility (which pro-vides for the issuance of letters of credit with a sub limit of $70,000). As of January 1, 2005, the Company had $38,822 in letters of credit outstanding, which reduced availability under the credit facility to $161,178. The tranche A term loan currently requires scheduled repayments of $7,500 on March 31, 2005 and quarterly thereafter through December 31, 2006, $10,000 on March 31, 2007 and quarterly thereafter through December 31, 2007, $12,500 on March 31, 2008 and quarterly thereafter through June 30, 2009 and $25,000 due at maturity on September 30, 2009. The tranche B term loan currently requires scheduled repayments of $425 on March 31, 2005 and quarterly thereafter, with a final payment of $160,650 due at maturity on September 30, 2010. The delayed draw term loan currently requires scheduled repayments of 0.25% of the aggregate principal amount outstanding on March 31, 2006 and quarterly thereafter, with a final pay-ment due at maturity on September 30, 2010. The revolver expires on September 30, 2009.
Advance Auto Parts, Inc. and Subsidiaries
43
The interest rates on the tranche A and B term loans, the delayed term loan and the revolver are based, at the Company’s option, on an adjusted LIBOR rate, plus a mar-gin, or an alternate base rate, plus a margin. The initial margin for the tranche A term loan and revolver is 1.50% and 0.50% per annum for the adjusted LIBOR and alter-nate base rate borrowings, respectively. The initial margin for the tranche B loan and the delayed draw term loan is 1.75% and 0.75% per annum for the adjusted LIBOR and alternative base rate borrowings, respectively. Additionally, a commitment fee of 0.375% per annum will be charged on the unused portion of the tranche A term loan and revolver, payable in arrears. A commitment fee of 1.75% per annum will be charged on the unused portion of the delayed draw term loan, payable in arrears. Borrowings under the senior credit facility are required to be prepaid, subject to certain exceptions, with (1) 50% of the Excess Cash Flow (as defined in the senior credit facility) unless the Company’s Senior Leverage Ratio (as defined in the senior credit facility) at the end of any fiscal year is less than or equal to 1.00 to 1.00, in which case 25% of Excess Cash Flow for such fiscal year will be required to be repaid, (2) 100% of the net cash proceeds of all asset sales or other dispositions of property by the Company and its subsidiaries, subject to certain exceptions (including exceptions for reinvestment of certain asset sale proceeds within 270 days of such sale and certain sale-leaseback transactions), and (3) 100% of the net proceeds of certain issuances of debt or equity by the Company and its subsidiaries. Voluntary prepayments and voluntary reductions of the unutilized portion of the revolver are permitted in whole or in part, at the Company’s option, in minimum principal amounts specified in the senior credit facility, without pre-mium or penalty, subject to reimbursement of the lenders’ redeployment costs in the case of a prepayment of adjusted LIBOR borrowings other than on the last day of the rele-vant interest period. Voluntary prepayments will (1) gener-ally be allocated among the facilities on a pro rata basis (based on the then outstanding principal amount of the loans under each facility) and (2) within each such facility, be applied to the installments under the amortization schedule within the following 12 months under such facil-ity until eliminated. All remaining amounts of prepay-ments will be applied pro rata to the remaining amortization payments under such facility. The senior credit facility also provides for customary events of default, including non-payment defaults, covenant defaults and cross-defaults to the Company’s other material indebtedness.
The senior credit facility is guaranteed by the Company and by each of its existing domestic subsidiaries and will be guaranteed by all future domestic subsidiaries. The facility is secured by a first priority lien on substantially all, subject to certain exceptions, of the Advance Stores’ properties and assets and the properties and assets of its existing domestic subsidiaries and will be secured by the properties and assets of its future domestic subsidiaries. The senior credit facility contains covenants restricting the ability of the Company and its subsidiaries to, among other things, (1) declare dividends or redeem or repurchase capi-tal stock, (2) prepay, redeem or purchase debt, (3) incur liens or engage in sale-leaseback transactions, (4) make loans and investments, (5) incur additional debt (including hedging arrangements), (6) engage in certain mergers, acquisitions and asset sales, (7) engage in transactions with affiliates, (8) change the nature of the Company’s business and the business conducted by its subsidiaries and (9) change the holding company status of the Company. The Company is required to comply with financial covenants with respect to a maximum leverage ratio, a minimum interest coverage ratio, a minimum current assets to funded senior debt ratio, a maximum senior leverage ratio and maximum limits on capital expenditures. During fiscal 2003, the Company completed the redemp-tion of its outstanding senior subordinated notes and senior discount debentures. Incremental facilities were added to fund the redemption in the form of a tranche A-1 term loan facility of $75,000 and tranche C-1 term loan facility of $275,000. In conjunction with this redemption and overall partial repayment of $54,433, the Company wrote off deferred financing costs. The write-off of these costs com-bined with the accretion of the discounts and related pre-miums paid on the repurchase of the senior subordinated notes and senior discount debentures resulted in a loss on extinguishment of debt of $46,887 in the accompanying consolidated statements of operations for the year ended January 3, 2004. During the remainder of fiscal 2003, the Company repaid $236,089 of its term loans under the senior credit facility. In conjunction with this partial repayment, the Company wrote off additional deferred financing costs in the amount of $401, which is classified as a loss on extin-guishment of debt in the accompanying consolidated state-ments of operations for the year ended January 3, 2004. Additionally, in December 2003, the Company refinanced the remaining portion of its tranche A, A-1, C and C-1 term loan facilities under the previous senior credit facility by amending and restating the credit facility to add a

44
new $100,000 tranche D term loan facility and $340,000 tranche E term loan facility. The borrowings under the tranche D term loan facility and tranche E term loan facil-ity were used to replace the tranche A, A-1, C and C-1 term loan facilities. During fiscal 2002, the Company repaid a portion of its tranche A and tranche B term loan facilities. Subsequently, it also refinanced the remaining portion of its tranche B term loan facility under its previous senior credit facility by amending and restating the credit facility to add a new $250,000 tranche C term loan facility. The borrow-ings under the tranche C term loan facility were used to refinance the tranche B term loan facility. In conjunc-tion with the extinguishment of this debt, the Company wrote off deferred financing costs in accordance with EITF No. 96-19. The write-off of these costs is classified as a loss on extinguishment of debt of $8,542 in the accom-panying consolidated statements of operations. During fiscal 2002, the Company also repurchased and retired a portion of its senior subordinated notes and senior discount debentures. The premiums paid and the write-off of the related deferred financing costs are classified as a loss on extinguishment of debt of $8,280 in the accompa-nying statements of operations. As of January 1, 2005, the Company was in compliance with the covenants of the senior credit facility. Substantially all of the net assets of the Company’s subsidiaries are restricted at January 1, 2005. At January 1, 2005, the aggregate future annual maturi-ties of long-term debt are as follows:
2005 ........................................................................................ $ 31,7002006 ........................................................................................ 24,5252007 ........................................................................................ 40,2002008 ........................................................................................ 63,3752009 ........................................................................................ 52,700Thereafter ............................................................................... 257,500
$470,000
13. Stock Repurchase Program During the third quarter of fiscal 2004, the Company’s Board of Directors authorized a stock repurchase program of up to $200,000 of the Company’s common stock plus related expenses. The program will allow the Company to repurchase its common stock on the open market or in privately negotiated transactions from time to time in accordance with the requirements of the Securities and Exchange Commission. As of January 1, 2005, the Company has repurchased a total of 3,700 shares of com-mon stock at an aggregate cost of $146,222, or $39.52 per share. At January 1, 2005, the Company had $53,778, excluding related expenses, available for stock repurchases under the stock repurchase program.
14. Income Taxes The provision (benefit) for income taxes from continu-ing operations for fiscal 2004, fiscal 2003 and fiscal 2002 consists of the following:
Current Deferred Total
2004 Federal ........................... $102,171 $ 1,318 $103,489 State ................................ 9,042 5,190 14,232
$111,213 $ 6,508 $117,721
2003 Federal ............................ $ 23,759 $44,820 $ 68,579 State ................................ 923 8,922 9,845
$ 24,682 $53,742 $ 78,424
2002 Federal ............................ $ (11,958) $44,740 $ 32,782 State ................................ 62 6,686 6,748
$ (11,896) $51,426 $ 39,530
The provision (benefit) for income taxes from continu-ing operations differed from the amount computed by applying the federal statutory income tax rate due to:
2004 2003 2002
Income from continuing operations at statutory U.S. federal income tax rate ........... $107,012 $71,298 $35,587
State income taxes, net of federal income tax benefit ..... 9,251 6,399 4,386
Non-deductible interest and other expenses ........................ 745 1,263 914
Valuation allowance ................... 236 (1,002) 241Other, net .................................... 477 466 (1,598)
$117,721 $78,424 $39,530
During the years ended January 1, 2005, January 3, 2004 and December 28, 2002, the Company had a (loss) income from operations of the discontinued Wholesale Dealer Network of $(63), $(572) and $4,691, respectively. The Company recorded an income tax (benefit) expense of $(24), $(220) and $1,820 related to these discontinued operations for the years ended January 1, 2005, January 3, 2004 and December 28, 2002, respectively. Deferred income taxes are recognized for the tax conse-quences in future years of differences between the tax bases of assets and liabilities and their financial reporting amounts at each period-end, based on enacted tax laws and statutory income tax rates applicable to the periods in which the differences are expected to affect taxable income. Deferred income taxes reflect the net income tax effect of temporary differences between the bases of assets and liabilities for financial reporting purposes and for
Notes to Consolidated Financial Statements (continued)For the Years Ended January 1, 2005, January 3, 2004, and December 28, 2002 (in thousands, except per share data)

Advance Auto Parts, Inc. and Subsidiaries
45
income tax reporting purposes. Net deferred income tax balances are comprised of the following:
January 1, 2005
January 3, 2004
Deferred income tax assets ....................... $ 40,009 $ 38,441Valuation allowance .................................. (1,029) (793)Deferred income tax liabilities ................. (108,277) (100,989)
Net deferred income tax liabilities ........... $ (69,297) $ (63,341)
At January 1, 2005 and January 3, 2004, the Company has cumulative net deferred income tax liabilities of $69,297 and $63,341, respectively. The gross deferred income tax assets also include state net operating loss carryforwards, or NOLs, and state tax credit carryforwards of approximately $3,720 and $6,695, respectively. These NOLs and state tax credit carryforwards may be used to reduce future taxable income and expire periodically through fiscal year 2024. The Company believes it will realize these tax benefits through a combination of the reversal of temporary differences, projected future taxable income during the NOL carryforward periods and avail-able tax planning strategies. Due to uncertainties related to the realization of certain deferred tax assets for NOLs in various jurisdictions, the Company recorded a valuation allowance of $1,029 as of January 1, 2005 and $793 as of January 3, 2004. The amount of deferred income tax assets realizable, however, could change in the near future if esti-mates of future taxable income are changed. Temporary differences which give rise to significant deferred income tax assets (liabilities) are as follows:
January 1, 2005
January 3, 2004
Current deferred income tax liabilities Inventory differences ............................ $(57,127) $(51,604) Accrued medical and workers’
compensation ..................................... 13,701 6,755 Accrued expenses not currently
deductible for tax ............................... 15,194 17,466 Net operating loss carryforwards ......... 2,152 3,567 Tax credit carryforwards ....................... 419 —
Total current deferred income tax liabilities ...................................... $(25,661) $(23,816)
Long-term deferred income tax liabilities Property and equipment ........................ (52,605) (47,318) Postretirement benefit obligation .......... 6,975 6,931 Net operating loss carryforwards ......... 1,568 3,128 Tax credit carryforwards ....................... — 594 Valuation allowance .............................. (1,029) (793) Other, net ............................................... 1,455 (2,067)
Total long-term deferred income tax liabilities ...................................... $(43,636) $(39,525)
These amounts are recorded in other current assets, other current liabilities, other assets and other long-term liabilities in the accompanying consolidated balance sheets, as appropriate. The Company currently has certain years that are open to audit by the Internal Revenue Service. In addition, the Company has certain years that are open for audit by vari-ous state and foreign jurisdictions for income taxes and sales, use and excise taxes. In management’s opinion, any amounts assessed will not have a material effect on the Company’s financial position or results of operations.
15. Lease Commitments The Company leases certain store locations, distribution centers, office space, equipment and vehicles, some of which are with related parties. Initial terms for facility leases are typically 10 to 15 years, followed by additional terms containing renewal options at 5-year intervals, and may include rent escalation clauses. The total amount of the minimum rent is expensed on a straight-line basis over the initial term of the lease unless external economic fac-tors exist such that renewals are reasonably assured, in which case the Company would include the renewal period in its amortization period. In addition to minimum fixed rentals, some leases provide for contingent facility rentals. Contingent facility rentals are determined on the basis of a percentage of sales in excess of stipulated minimums for certain store facilities as defined in the individual lease agreements. Most of the leases provide that the Company pays taxes, maintenance, insurance and certain other expenses applicable to the leased premises and include options to renew. Management expects that, in the normal course of business, leases that expire will be renewed or replaced by other leases. At January 1, 2005, future minimum lease payments due under non-cancelable operating leases with lease terms ranging from one year through the year 2024 are as follows:
Other(a)
Related Parties(a) Total
2005 ........................................ $ 185,576 $ 2,779 $ 188,3552006 ........................................ 165,274 2,344 167,6182007 ........................................ 150,037 2,020 152,0572008 ........................................ 132,420 1,937 134,3572009 ........................................ 111,898 1,653 113,551Thereafter ............................... 562,348 3,714 566,062
$1,307,553 $14,447 $1,322,000
(a) The Other and Related Parties columns include stores closed as a result of the Company’s restructuring plans.

46
Notes to Consolidated Financial Statements (continued)For the Years Ended January 1, 2005, January 3, 2004, and December 28, 2002 (in thousands, except per share data)
At January 1, 2005 and January 3, 2004, future minimum sub-lease income to be received under non-cancelable operating leases is $8,413 and $9,487, respectively. Net rent expense for fiscal 2004, fiscal 2003 and fiscal 2002 was as follows:
2004 2003 2002
Minimum facility rentals ...... $169,449 $154,461 $140,929Contingent facility rentals ..... 1,201 1,395 1,059Equipment rentals .................. 5,128 5,117 6,112Vehicle rentals ....................... 6,007 7,104 6,419
181,785 168,077 154,519Less: Sub-lease income ......... (3,171) (3,223) (3,250)
$178,614 $164,854 $151,269
Rental payments to related parties of approximately $3,044 in fiscal 2004, $3,011 in fiscal 2003 and $3,168 in fiscal 2002 are included in net rent expense for open stores. Rent expense associated with closed locations is included in other selling, general and administrative expenses.
16. Installment Sales Program A subsidiary of the Company maintains an in-house finance program, which offers financing to retail custom-ers. Finance charges of $2,257, $3,380 and $3,901 on the installment sales program are included in net sales in the accompanying consolidated statements of operations for the fiscal years ended January 1, 2005, January 3, 2004 and December 28, 2002, respectively. The cost of adminis-tering the installment sales program is included in selling, general and administrative expenses.
17. Contingencies In the case of all known contingencies, the Company accrues for an obligation, including estimated legal costs, when it is probable and the amount is reasonably estimable. As facts concerning contingencies become known to the Company, the Company reassesses its position with respect to accrued liabilities and other potential exposures. Estimates that are particularly sensitive to future change include tax and legal matters, which are subject to change as events evolve and as additional information becomes available during the administrative and litigation process. The Company’s Western Auto subsidiary, together with other defendants, including automobile manufacturers, automotive parts manufacturers and other retailers, has been named as a defendant in lawsuits alleging injury as a result of exposure to asbestos-containing products. The Company and some of its subsidiaries also have been
named as defendants in many of these lawsuits. The plain-tiffs have alleged that these products were manufactured, distributed and/or sold by the various defendants. To date, these products have included brake and clutch parts and roofing materials. Many of the cases pending against the Company or its subsidiaries are in the early stages of liti-gation. The damages claimed against the defendants in some of these proceedings are substantial. Additionally, some of the automotive parts manufacturers named as defendants in these lawsuits have declared bankruptcy, which will limit plaintiffs’ ability to recover monetary damages from those defendants. The Company believes that it has valid defenses against these claims. The Company also believes that most of these claims are at least partially covered by insurance. Based on discovery to date, the Company does not believe the cases currently pending will have a material adverse effect on it. However, if the Company was to incur an adverse verdict in one or more of these claims and was ordered to pay damages that were not covered by insurance, these claims could have a material adverse affect on its operating results, financial position and liquidity. If the number of claims filed against the Company or any of its subsidiaries alleging injury as a result of exposure to asbestos-containing products increases substantially, the costs associated with concluding these claims, including damages resulting from any adverse ver-dicts, could have a material adverse effect on its operating results, financial position and liquidity in future periods. The Company is also involved in various other claims and lawsuits arising in the normal course of business. The damages claimed against the Company in some of these proceedings are substantial. Although the final outcome of these legal matters cannot be determined, based on the facts presently known, it is management’s opinion that the final outcome of such claims and lawsuits will not have a material adverse effect on the Company’s financial posi-tion or results of operations. The Company is self-insured for general and automobile liability, workers’ compensation and the health care claims of its team members, although the Company maintains stop- loss coverage with third-party insurers to limit its total liability exposure. Liabilities associated with these losses are calculated for claims filed and claims incurred but not yet reported at the Company’s estimate of their ultimate cost based upon analyses of historical data, demographic and severity factors and valuations provided by third-party actuaries. Management monitors new claims and claim development as well as negative trends related to the claims
Advance Auto Parts, Inc. and Subsidiaries
47
incurred but not reported in order to assess the adequacy of the Company’s insurance reserves. On a periodic basis, the Company also reviews its assumptions with the Company’s third-party actuaries. While the Company does not expect the amounts ultimately paid to differ signifi-cantly from its estimates, the self-insurance reserves could be affected if future claim experience differs significantly from the historical trends and the actuarial assumptions. The Company accrues for tax contingencies when it is probable that a liability to a taxing authority has been incurred and the amount of the contingency can be reason-ably estimated, based on past experience. The Company’s tax contingency reserve is adjusted for changes in circum-stances and additional uncertainties, such as significant amendments to existing tax law, both legislated and con-cluded through the various jurisdictions’ tax court systems. At January 1, 2005, the Company had a tax contingency reserve of $7,576. It is the opinion of the Company’s management that the possibility is remote that costs in excess of those reserved for will have a material adverse impact on the Company’s financial position or results of operations. The Company has entered into employment agreements with certain team members that provide severance pay benefits under certain circumstances after a change in control of the Company or upon termination of the team member by the Company. The maximum contingent liabil-ity under these employment agreements is approximately $2,491 and $2,408 at January 1, 2005 and January 3, 2004 of which nothing has been accrued, respectively.
18. Benefit Plans
401(k) Plan The Company maintains a defined contribution team member benefit plan, which covers substantially all team members after one year of service and have attained the age of twenty-one. The plan allows for team member salary deferrals, which are matched at the Company’s discretion. Company contributions were $6,752, $6,398 and $6,930 in fiscal 2004, fiscal 2003 and fiscal 2002, respectively. The Company also maintains a profit sharing plan cov-ering Western team members that was frozen prior to the Western merger on November 2, 1998. This plan covered all full-time team members who had completed one year of service and had attained the age of twenty-one.
Deferred Compensation During the third quarter of fiscal 2003, the Company established an unqualified deferred compensation plan for
certain team members. The Company has accounted for the unqualified deferred compensation plan in accordance with EITF 97-14, “Accounting for Deferred Compensation Arrangements Where Amounts Earned Are Held in a Rabbi Trust and Invested.” The liability related to the former Discount deferred compensation plan, which was termi-nated in May 2002, was merged into the new plan. This plan provides for a minimum and maximum deferral percentage of the team members base salary and bonus, as determined by the Retirement Plan Committee. The Company establishes and maintains a deferred compen-sation liability for this plan. The Company funds this lia-bility by remitting the team member’s deferral to a Rabbi Trust where these deferrals are invested in trading securi-ties. Accordingly, all gains and losses on these underlying investments, which are held in the Rabbi Trust to fund the deferred compensation liability, are recognized in the Company’s consolidated statements of operations. At January 1, 2005 and January 3, 2004 these liabilities were $1,840 and $1,011, respectively. The Company maintains an unfunded deferred compen-sation plan established for certain key team members of Western prior to the fiscal 1998 Western merger. The Company assumed the plan liability of $15,253 through the Western merger. The plan was frozen at the date of the Western merger. As of January 1, 2005 and January 3, 2004, $1,598 and $2,409, respectively, was accrued for these plans with the current portion included in accrued expenses and the long-term portion in other long-term lia-bilities in the accompanying consolidated balance sheets.
Postretirement Plan The Company provides certain health care and life insur-ance benefits for eligible retired team members through a postretirement plan, or the Plan. These benefits are subject to deductibles, co-payment provisions and other limita-tions. The Plan has no assets and is funded on a cash basis as benefits are paid. During the second quarter of fiscal 2004, the Company amended the Plan to exclude outpatient prescription drug benefits to Medicare-eligible retirees effective January 1, 2006. Due to this negative plan amend-ment, the Company’s accumulated postretirement benefit obligation was reduced by $7,557, resulting in an unrec-ognized negative prior service cost in the same amount. The unrecognized negative prior service cost is being amortized over the estimated remaining life expectancy of the plan participants of 13 years as allowed under SFAS No. 106, “Employers Accounting for Postretirement Benefits Other Than Pensions.”

48
Notes to Consolidated Financial Statements (continued)For the Years Ended January 1, 2005, January 3, 2004, and December 28, 2002 (in thousands, except per share data)
Other financial information related to the Plan was determined by the Company’s independent actuaries. The measurement date used by the actuaries was October 31 of each fiscal year. The following provides a reconciliation of the accrued benefit obligation included in other long-term liabilities in the accompanying consolidated balance sheets, recorded and the funded status of the Plan as of January 1, 2005 and January 3, 2004:
2004 2003
Change in benefit obligation: Benefit obligation at beginning
of the year .............................................. $22,750 $23,002 Service cost ................................................ 2 5 Interest cost ................................................ 1,004 1,485 Benefits paid .............................................. (1,239) (3,336) Plan amendment ........................................ (7,557) — Actuarial (gain) loss .................................. (335) 1,594
Benefit obligation at end of the year ......... 14,625 22,750
Change in plan assets: Fair value of plan assets at beginning
of the year .............................................. — — Employer contributions ............................. 1,239 3,336 Participant contributions ........................... 2,485 1,779 Benefits paid .............................................. (3,724) (5,115)
Fair value of plan assets at end of year .... — —
Reconciliation of funded status: Funded status ............................................. (14,625) (22,750) Unrecognized transition obligation .......... — 9 Unrecognized prior service cost ............... (7,112) — Unrecognized actuarial loss ...................... 4,371 5,362
Accrued postretirement benefit cost ............. $(17,366) $(17,379)
Net periodic postretirement benefit cost is as follows:
2004 2003 2002
Service cost .......................................... $ 2 $ 5 $ 473Interest cost .......................................... 1,004 1,485 1,239Amortization of the transition obligation ......................................... — 1 58Amortization of the prior service cost ...................................... (436) — —Amortization of recognized net losses (gains) ............................. 250 146 (89)
$ 820 $1,637 $1,681
The health care cost trend rate was assumed to be 14.0% for 2005, 12.5% for 2006, 11.5% for 2007, 10.0% for 2008, 9.5% for 2009, 8.5% for 2010 and 5.0% to 8.0% for 2011 and thereafter. If the health care cost were increased 1% for all future years the accumulated post-retirement benefit obligation would have increased by $1,247 as of January 1, 2005. The effect of this change on the combined service and interest cost would have been an
increase of $102 for 2004. If the health care cost were decreased 1% for all future years the accumulated post-retirement benefit obligation would have decreased by $1,318 as of January 1, 2005. The effect of this change on the combined service and interest cost would have been a decrease of $121 for 2004. The postretirement benefit obligation and net periodic postretirement benefit cost were computed using the fol-lowing weighted-average discount rates as determined by the Company’s actuaries for each applicable year:
2004 2003
Weighted-average discount rate .............................. 5.75% 6.25%
The Company expects plan contributions to completely offset benefits paid. The following table summarizes the Company’s expected benefit payments (net of retiree con-tributions) to be paid for each of the following fiscal years:
Amount
2005........................................................................................... $1,3402006........................................................................................... 1,0502007........................................................................................... 1,1452008........................................................................................... 1,1602009........................................................................................... 1,1912010–2014................................................................................. 5,101
The Company reserves the right to change or terminate the benefits or contributions at any time. The Company also continues to evaluate ways in which it can better man-age these benefits and control costs. Any changes in the Plan or revisions to assumptions that affect the amount of expected future benefits may have a significant impact on the amount of the reported obligation, annual expense and projected benefit payments.
19. Equity Compensation During fiscal 2004, the Company established the Advance Auto Parts, Inc. 2004 Long-Term Incentive Plan, or the LTIP, which was approved at its 2004 Annual Meeting of Stockholders. The LTIP was created to enable the Company to continue to attract and retain team mem-bers of exceptional managerial talent upon whom, in large measure, its sustained progress, growth and profitability depends. The LTIP replaces the Company’s previous senior executive stock option plan and executive stock option plan. The stock options that remained available for future grant under these predecessor plans became available under the LTIP and thus no stock options will be available for grant under those plans. The stock options authorized to be granted are non-qualified stock options and terminate on the seventh anniversary of the grant date. Additionally,

Advance Auto Parts, Inc. and Subsidiaries
49
the stock options vest over a three-year period in equal installments beginning on the first anniversary grant date. In addition to stock options, the Company also has the ability to offer additional types of equity incentives as allowed under the LTIP. Accordingly, during fiscal 2004, the Company created the Advance Auto Parts, Inc. Deferred Stock Unit Plan for Non-Employee Directors and Selected Executives, or the DSU Plan. The DSU Plan pro-vides for the annual grant of deferred stock units, or DSUs, to the Company’s Board of Directors as allowed under the LTIP. Each DSU is equivalent to one share of common stock of the Company. The DSUs are immediately vested upon issuance since the DSU Plan provides for the Board members to receive their equivalent shares at any point upon departure from the Board. The Company granted six DSUs in fiscal 2004 at a weighted average fair value of $41.57. For fiscal 2004, the Company recognized a total of $494, on a pre-tax basis, in compensation expense related to the issuance of DSUs. Additionally, the DSU Plan pro-vides for the deferral of compensation as earned in the
form of an annual retainer for Board members and wages for certain highly compensated employees of the Company. These DSUs are payable to the participants at a future date or over a specified time period as elected by the partici-pants in accordance with the DSU Plan. Shares authorized for grant under the LTIP are 5,747 at January 1, 2005. Subsequent to January 1, 2005, the Company granted 1,298 stock options at an exercise price of $50.06. As a result of the recapitalization in fiscal 1998, an existing stockholder received stock options, referred to as other options, to purchase up to 1,000 shares of common stock. The stock options are fully vested, nonforfeitable and provided for a $5.00 per share exercise price, increasing $1.00 per share annually, through the expiration date of April 2005. The fair value of these options, as determined at the grant date, were included in the recapitalization in fiscal 1998 as consideration paid to the existing stock-holder. The other options were completely exercised dur-ing fiscal 2003.
Total option activity for the last three fiscal years was as follows:
2004 2003 2002
PlanNumber of Shares
Weighted-Average Exercise Price
Number of Shares
Weighted-Average Exercise Price
Number of Shares
Weighted-Average Exercise Price
Fixed Price OptionsOutstanding at beginning of year ............. 5,411 $15.05 5,536 $13.13 6,056 $11.24Granted ...................................................... 1,352 39.13 1,252 21.78 1,104 21.13Exercised ................................................... (1,942) 10.54 (1,274) 12.89 (1,556) 11.17Forfeited ..................................................... (261) 22.39 (103) 21.16 (68) 21.16
Outstanding at end of year ........................ 4,560 $23.68 5,411 $15.05 5,536 $13.13
Other OptionsOutstanding at beginning of year ............. — $ — 1,000 $ 9.00 1,000 $ 8.00Exercised ................................................... — — (1,000) 9.00 — —
Outstanding at end of year ........................ — $ — — $ — 1,000 $ 9.00
For each of the Company’s option grants during fiscal years 2004, 2003 and 2002, the Company granted options at prices consistent with the market price of its stock on each respective grant date. Information related to the Company’s options by range of exercise prices is as follows:
Number of Shares
Outstanding
Weighted-Average Exercise Price of
Outstanding Shares
Weighted-Average Remaining Contractual
Life of Outstanding Shares (in years)
Number of Shares
Exercisable
Weighted Price of Exercise Price of
Exercisable Shares
$ 5.00–$ 9.99................................................... 164 $ 8.45 1.9 164 $ 8.45$10.00–$19.99................................................... 1,231 12.01 2.5 1,220 11.94$20.00–$29.99................................................... 1,742 20.89 4.6 793 21.23$30.00–$39.99................................................... 1,375 38.86 6.1 38 37.06$40.00–$49.99................................................... 48 41.71 6.6 — —
4,560 $23.68 4.4 2,215 $15.44

50
Notes to Consolidated Financial Statements (continued)For the Years Ended January 1, 2005, January 3, 2004, and December 28, 2002 (in thousands, except per share data)
As permitted under SFAS No. 123, “Accounting for Stock-Based Compensation,” the Company accounts for its stock options using the intrinsic value method prescribed in Accounting Principles Board Opinion No. 25, “Account-ing for Stock Issued to Employees,” or APB No. 25. Under APB No. 25, compensation cost for stock options is mea-sured as the excess, if any, of the market price of the Company’s common stock at the measurement date over the exercise price. Accordingly, the Company has not rec-ognized compensation expense on the issuance of its stock options because the exercise price equaled the fair market value of the underlying stock on the grant date. No com-pensation expense was required for the fiscal years ended January 1, 2005, January 3, 2004 and December 28, 2002. During fiscal 2002, the Company established an employee stock purchase plan. The plan is intended to qualify as an employee stock purchase plan under Section 423 of the Internal Revenue Code of 1986, as amended. In May 2002, the Company registered 700 shares with
the Securities and Exchange Commission to be issued under the plan. All eligible team members may purchase common stock at 85% of fair market value (determined quarterly) through payroll deductions. There are annual limitations on team member purchases of either $25,000 per team member or 10% of compensation, whichever is less. Under the plan, team members purchased 118, 147 and 28 shares in fiscal years 2004, 2003 and 2002, respectively.
20. Fair Value of Financial Instruments The carrying amount of cash and cash equivalents, receivables, bank overdrafts, accounts payable, borrowings secured by receivables and current portion of long-term debt approximates fair value because of the short maturity of those instruments. The carrying amount for variable rate long-term debt approximates fair value for similar issues available to the Company. There was no fixed rate long-term debt outstanding at January 1, 2005 or January 3, 2004.
21. Quarterly Financial Data (unaudited) The following table summarizes quarterly financial data for fiscal years 2004 and 2003:
2004(1) First Second Third Fourth
(16 weeks) (12 weeks) (12 weeks) (12 weeks)
Net sales .................................................................................................................................... $1,122,918 $908,412 $890,161 $848,806Gross profit ............................................................................................................................... 520,898 422,302 416,515 393,656Income from continuing operations ......................................................................................... 51,343 53,229 51,399 32,056(Loss) income on discontinued operations .............................................................................. (52) 6 (6) 13Net income ................................................................................................................................ 51,291 53,235 51,393 32,069Basic income per share: Net income ............................................................................................................................ 0.69 0.71 0.69 0.44Diluted income per share: Net income ............................................................................................................................ 0.68 0.70 0.68 0.43
2003(1) First Second Third Fourth
(16 weeks) (12 weeks) (12 weeks) (13 weeks)
Net sales .................................................................................................................................... $ 1,005,968 $ 827,348 $ 839,101 $ 821,279Gross profit ............................................................................................................................... 463,989 379,474 386,928 374,127Income from continuing operations ......................................................................................... 3,968 43,291 44,745 33,283Income (loss) on discontinued operations ............................................................................... 1,073 167 419 (2,011)Net income ................................................................................................................................ 5,041 43,458 45,164 31,272Basic income per share: Net income ............................................................................................................................ 0.07 0.60 0.61 0.42Diluted income per share: Net income ............................................................................................................................ 0.07 0.58 0.60 0.41
Note: Quarterly and year-to-date computations of per share amounts are made independently. Therefore, the sum of per share amounts for the quarters may not agree with per share amounts for the year.(1) The results of operations for the four quarters of fiscal 2004 and fiscal 2003 reflect the reclassification of the Wholesale operating results as discontinued
operations.

Advance Auto Parts, Inc. and Subsidiaries
51
To the Board of Directors and Stockholders ofAdvance Auto Parts, Inc. and SubsidiariesRoanoke, Virginia
We have audited the accompanying consolidated balance sheets of Advance Auto Parts, Inc. and subsidiaries (the Company) as of January 1, 2005 and January 3, 2004, and the related consolidated statements of operations, stockholders’ equity, and cash flows for each of the three years in the period ended January 1, 2005. These financial statements are the responsibility of the Company’s management. Our responsibility is to express an opinion on the financial statements based on our audits. We conducted our audits in accordance with the standards of the Public Company Accounting Oversight Board (United States). Those standards require that we plan and perform the audit to obtain reasonable assurance about whether the financial statements are free of material misstatement. An audit includes examining, on a test basis, evidence supporting the amounts and disclosures in the financial statements. An audit also includes assessing the accounting principles used and significant estimates made by management, as well as evaluating the overall financial statement presentation. We believe that our audits provide a reasonable basis for our opinion. In our opinion, such consolidated financial statements present fairly, in all material respects, the financial position of Advance Auto Parts, Inc. and subsidiaries as of January 1, 2005 and January 3, 2004, and the results of their operations and their cash flows for each of the three years in the period ended January 1, 2005, in conformity with accounting principles generally accepted in the United States of America. We have also audited, in accordance with the standards of the Public Company Accounting Oversight Board (United States), the effectiveness of the Company’s internal control over financial reporting as of January 1, 2005, based on the criteria established in Internal Control—Integrated Framework issued by the Committee of Sponsoring Organizations of the Treadway Commission and our report dated March 14, 2005 expressed an unqualified opinion on management’s assessment of the effectiveness of the Company’s internal control over financial reporting and an unqualified opinion on the effectiveness of the Company’s internal control over financial reporting.
McLean, VirginiaMarch 14, 2005
Report of Independent Registered Public Accounting Firm

52
To the Board of Directors and Stockholders ofAdvance Auto Parts, Inc. and SubsidiariesRoanoke, Virginia
We have audited management’s assessment, included in the accompanying Management’s Report on Internal Control Over Financial Reporting, that Advance Auto Parts, Inc. and subsidiaries (the Company) maintained effective internal control over financial reporting as of January 1, 2005, based on criteria established in Internal Control—Integrated Framework issued by the Committee of Sponsoring Organizations of the Treadway Commission. The Company’s manage-ment is responsible for maintaining effective internal control over financial reporting and for its assessment of the effec-tiveness of internal control over financial reporting. Our responsibility is to express an opinion on management’s assessment and an opinion on the effectiveness of the Company’s internal control over financial reporting based on our audit. We conducted our audit in accordance with the standards of the Public Company Accounting Oversight Board (United States). Those standards require that we plan and perform the audit to obtain reasonable assurance about whether effective internal control over financial reporting was maintained in all material respects. Our audit included obtaining an understanding of internal control over financial reporting, evaluating management’s assessment, testing and evaluating the design and operating effectiveness of internal control, and performing such other procedures as we considered necessary in the circumstances. We believe that our audit provides a reasonable basis for our opinions. A company’s internal control over financial reporting is a process designed by, or under the supervision of, the com-pany’s principal executive and principal financial officers, or persons performing similar functions, and effected by the company’s board of directors, management, and other personnel to provide reasonable assurance regarding the reliability of financial reporting and the preparation of financial statements for external purposes in accordance with generally accepted accounting principles. A company’s internal control over financial reporting includes those policies and proce-dures that (1) pertain to the maintenance of records that, in reasonable detail, accurately and fairly reflect the transactions and dispositions of the assets of the company; (2) provide reasonable assurance that transactions are recorded as necessary to permit preparation of financial statements in accordance with generally accepted accounting principles, and that receipts and expenditures of the company are being made only in accordance with authorizations of management and directors of the company; and (3) provide reasonable assurance regarding prevention or timely detection of unauthorized acquisition, use, or disposition of the company’s assets that could have a material effect on the financial statements. Because of the inherent limitations of internal control over financial reporting, including the possibility of collusion or improper management override of controls, material misstatements due to error or fraud may not be prevented or detected on a timely basis. Also, projections of any evaluation of the effectiveness of the internal control over financial reporting to future periods are subject to the risk that the controls may become inadequate because of changes in conditions, or that the degree of compliance with the policies or procedures may deteriorate. In our opinion, management’s assessment that the Company maintained effective internal control over financial report-ing as of January 1, 2005, is fairly stated, in all material respects, based on the criteria established in Internal Control—Integrated Framework issued by the Committee of Sponsoring Organizations of the Treadway Commission. Also in our opinion, the Company maintained, in all material respects, effective internal control over financial reporting as of January 1, 2005, based on the criteria established in Internal Control—Integrated Framework issued by the Committee of Sponsoring Organizations of the Treadway Commission. We have also audited, in accordance with the standards of the Public Company Accounting Oversight Board (United States), the consolidated balance sheets of Advance Auto Parts, Inc. and subsidiaries as of January 1, 2005 and January 3, 2004, and the related consolidated statements of operations, stockholders’ equity, and cash flows for each of the three years in the period ended January 1, 2005 and our report dated March 14, 2005 expressed an unqualified opinion on those financial statements.
McLean, VirginiaMarch 14, 2005
Report of Independent Registered Public Accounting Firm

Advance Auto Parts, Inc. and Subsidiaries
53
The consolidated financial statements and related financial information presented in this Annual Report have been prepared with integrity, consistency and objectivity and are the responsibility of the management of Advance Auto Parts, Inc. (the Company). The consolidated financial statements have been prepared in accordance with accounting principles generally accepted in the United States of America and, as such, include amounts based on management’s best estimates and judgments. Management is also responsible for establishing and maintaining adequate internal control over financial reporting. The Company’s internal control over financial reporting is a process designed under the supervision of the Company’s princi-pal executive officer and principal financial officer to provide reasonable assurance regarding the reliability of financial reporting and the preparation of the Company’s financial statements for external purposes in accordance with accounting principles generally accepted in the United States of America. The Company’s internal control over financial reporting includes policies and procedures that (1) pertain to the mainte-nance of records that, in reasonable detail, accurately and fairly reflect the transactions and dispositions of the assets of the Company; (2) provide reasonable assurance that transactions are recorded as necessary to permit preparation of financial statements in accordance with generally accepted accounting principles, and that receipts and expenditures of the Company are being made only in accordance with authorizations of management and directors of the Company; and (3) provide reasonable assurance regarding prevention or timely detection of unauthorized acquisition, use, or disposition of the Company’s assets that could have a material effect on the financial statements. Because of the inherent limitations of internal control over financial reporting, including the possibility of collusion or improper management override of controls, material misstatements due to error or fraud may not be prevented or detected on a timely basis. Also, projections of any evaluation of the effectiveness of the internal control over financial reporting to future periods are subject to the risk that the controls may become inadequate because of changes in conditions, or that the degree of compliance with the policies or procedures may deteriorate. The Company’s financial statements and management’s assertion about the effectiveness of the Company’s controls over financial reporting have been audited by the independent accounting firm Deloitte & Touche LLP, which was given unre-stricted access to financial records and related data, including minutes of all meetings of the Board of Directors and com-mittees of the Board of Directors. The Company believes that all representations made to the independent auditors during their audit were valid and appropriate. The Audit Committee of the Board of Directors, consisting solely of outside directors, has the responsibility of monitor-ing and reviewing the Company’s systems of internal control, accounting practices, financial reporting and audits to assess whether their quality, integrity and objectivity are sufficient to protect stockholders’ investments. Both the Company’s independent auditors and the internal auditors have free access to the Audit Committee.
Lawrence P. Castellani Jeffrey T. GrayChairman of the Board and Chief Executive Officer Executive Vice President and Chief Financial Officer
Management’s Responsibility for Financial Statements

54
Market for Registrant’s Common Equity, Related Stockholder Matters and Issuer Purchases of Equity Securities
Stockholders may obtain free of charge a copy of the Company’s Annual Report on Form 10-K as filed with the Securities and Exchange Commission by writing to the Investor Relations Department, P.O. Box 2710, Roanoke, Virginia 24001 or by accessing the Company’s website at www.AdvanceAutoParts.com.
SEC Form 10-K
Our common stock is listed on the New York Stock Exchange, or NYSE, under the symbol “AAP.” The table below sets forth, for the fiscal periods indicated, the high and low sale prices per share for our common stock, as reported by the NYSE.
High Low
Fiscal Year Ended January 1, 2005Fourth Quarter ........................................................... $43.75 $33.42Third Quarter ............................................................ $37.94 $33.02Second Quarter .......................................................... $46.17 $37.24First Quarter .............................................................. $44.41 $38.17
Fiscal Year Ended January 3, 2004Fourth Quarter ........................................................... $41.83 $36.43Third Quarter ............................................................ $37.60 $31.93Second Quarter .......................................................... $32.16 $23.78First Quarter .............................................................. $25.13 $18.50
The closing price of our common stock on March 9, 2005 was $50.57. The table gives effect to our two-for-one
stock split effectuated in the form of a 100% stock divi-dend distributed on January 2, 2004, as trading began on a post-split basis on January 5, 2004. At March 9, 2005, there were 439 holders of record of our common stock. We have not declared or paid cash dividends on our common stock in the last two years. We anticipate that we will retain all of our earnings in the foreseeable future to finance the expansion of our business and, therefore, do not anticipate paying any dividends on our common stock. In addition, our amended senior credit facility contains restrictions on the amount of cash dividends or other dis-tributions we may declare and pay on our capital stock. Any payments of dividends in the future will be at the discretion of our Board of Directors and will depend upon our results of operations, earnings, capital requirements, contractual restrictions contained in our amended senior credit facility, or other agreements, and other factors deemed relevant by our Board of Directors.
The following table sets forth information with respect to repurchases of our common stock for the quarter ended January 1, 2005 (amounts in thousands, except per share amounts):
Period
Total Number of Shares Purchased
Average Price Paid per Share
Total Number of Shares Purchased as Part of Publicly Announced Plans or Programs(1)
Maximum Dollar Value that May Yet Be
Purchased Under the Plans or Programs(1)(2)
October 10, 2004 to November 6, 2004 .................................... — — — $150,059November 7, 2004 to December 4, 2004 ................................... 1,348 $41.72 1,348 93,826December 5, 2004 to January 1, 2005 ....................................... 959 41.73 959 53,778
Total ............................................................................................ 2,307 $41.72 2,307 $ 53,778
(1) All of the above repurchases were made on the open market at prevailing market rates plus related expenses under our stock repurchase program, which was autho-rized by our Board of Directors and publicly announced on August 11, 2004, for a maximum of $200 million in common stock and which expires on August 10, 2005.
(2) The maximum dollar value yet to be purchased under our stock repurchase program excludes related expenses paid on previous purchases or anticipated expenses on future purchases.
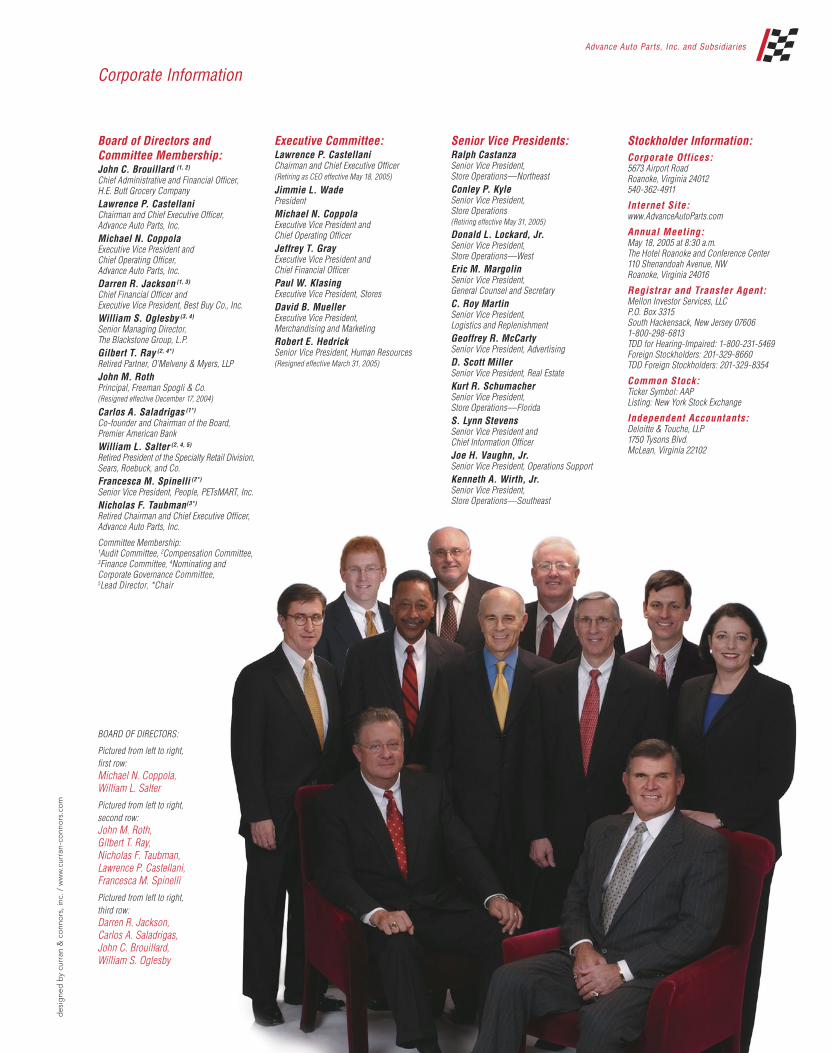
Advance Auto Parts, Inc. and Subsidiaries
Corporate Information
Board of Directors and Committee Membership:John C. Brouillard (1, 2)
Chief Administrative and Financial Officer, H.E. Butt Grocery CompanyLawrence P. Castellani Chairman and Chief Executive Officer, Advance Auto Parts, Inc.Michael N. Coppola Executive Vice President and Chief Operating Officer, Advance Auto Parts, Inc.Darren R. Jackson (1, 3)
Chief Financial Officer and Executive Vice President, Best Buy Co., Inc.William S. Oglesby (3, 4)
Senior Managing Director, The Blackstone Group, L.P.Gilbert T. Ray (2, 4*)
Retired Partner, O’Melveny & Myers, LLPJohn M. Roth
Principal, Freeman Spogli & Co. (Resigned effective December 17, 2004)
Carlos A. Saladrigas (1*)
Co-founder and Chairman of the Board, Premier American BankWilliam L. Salter (2, 4, 5)
Retired President of the Specialty Retail Division, Sears, Roebuck, and Co.Francesca M. Spinelli (2*)
Senior Vice President, People, PETsMART, Inc.Nicholas F. Taubman(3*)
Retired Chairman and Chief Executive Officer, Advance Auto Parts, Inc.
Committee Membership:1Audit Committee, 2Compensation Committee, 3Finance Committee, 4Nominating and Corporate Governance Committee, 5Lead Director, *Chair
Executive Committee:Lawrence P. CastellaniChairman and Chief Executive Officer (Retiring as CEO effective May 18, 2005)
Jimmie L. WadePresident Michael N. CoppolaExecutive Vice President and Chief Operating OfficerJeffrey T. GrayExecutive Vice President and Chief Financial OfficerPaul W. KlasingExecutive Vice President, Stores David B. MuellerExecutive Vice President, Merchandising and MarketingRobert E. HedrickSenior Vice President, Human Resources (Resigned effective March 31, 2005)
Senior Vice Presidents:Ralph CastanzaSenior Vice President, Store Operations—NortheastConley P. KyleSenior Vice President, Store Operations (Retiring effective May 31, 2005)
Donald L. Lockard, Jr.Senior Vice President, Store Operations—WestEric M. MargolinSenior Vice President, General Counsel and SecretaryC. Roy MartinSenior Vice President, Logistics and ReplenishmentGeoffrey R. McCartySenior Vice President, AdvertisingD. Scott MillerSenior Vice President, Real EstateKurt R. SchumacherSenior Vice President, Store Operations—FloridaS. Lynn StevensSenior Vice President and Chief Information OfficerJoe H. Vaughn, Jr.Senior Vice President, Operations SupportKenneth A. Wirth, Jr.Senior Vice President, Store Operations—Southeast
Stockholder Information:Corporate Offices:5673 Airport Road Roanoke, Virginia 24012 540-362-4911
Internet Site:www.AdvanceAutoParts.com
Annual Meeting:May 18, 2005 at 8:30 a.m. The Hotel Roanoke and Conference Center 110 Shenandoah Avenue, NW Roanoke, Virginia 24016
Registrar and Transfer Agent:Mellon Investor Services, LLC P.O. Box 3315 South Hackensack, New Jersey 07606 1-800-298-6813 TDD for Hearing-Impaired: 1-800-231-5469 Foreign Stockholders: 201-329-8660 TDD Foreign Stockholders: 201-329-8354
Common Stock:Ticker Symbol: AAPListing: New York Stock Exchange
Independent Accountants:Deloitte & Touche, LLP 1750 Tysons Blvd. McLean, Virginia 22102
BOARD OF DIRECTORS:
Pictured from left to right, first row:Michael N. Coppola, William L. Salter
Pictured from left to right, second row: John M. Roth, Gilbert T. Ray, Nicholas F. Taubman, Lawrence P. Castellani, Francesca M. Spinelli
Pictured from left to right, third row: Darren R. Jackson, Carlos A. Saladrigas, John C. Brouillard, William S. Oglesby
des
igne
d b
y cu
rran
& c
onn
ors
, inc
. / w
ww
.cur
ran-
conn
ors
.co
m
0
500
1000
1500
2000
2500
3000
3500
4000
0
50
100
150
200
250
300
350
0
2
4
6
8
10
0
50
100
150
200
0.0
0.5
1.0
1.5
2.0
2.5
0
50
100
150
200
250
300
350
400
7.50
7.75
8.00
8.25
8.50
8.75
9.00
9.25
9.50
0
500
1000
1500
2000
2500
3000
2004 marked another record-setting year for Advance Auto Parts. Once again, our winning team executed on our many customer-focused initiatives and took advan-tage of the automotive aftermarket’s strong industry dynamics to grow sales and build our bottom line.
With over 37,000 Team Members in more than 2,650 stores and facilities across 39 states, Puerto Rico and the Virgin Islands, Advance Auto Parts is ready and positioned for strong future growth by doing what we do best—providing legendary service to our custom-ers!
resultsReady with
On the Cover (Clockwise from far left):1.-Teresa Carpentieri, Marketing Manager, Commercial Sales 2.-Mike Cox, Regional Vice President 3.-Shawn Murray, Creative Director 4.-Stella Carpenter, Manager of Human Resources—Corporate 5.-Matt Jeter, Distribution Center Manager 6.-Joe Sterbank, Regional Vice President 7.-Jill Livesay, Vice President, Controller 8.-Cindy Fain, Merchandise Manager 9.-Guy Broyles, Product Director, Purchasing
1 Source: R.L. Polk & Co.’s National Vehicle Population Profile® (NVPP®), data as of July 1st of each year
2 Source: 2004-2005 Aftermarket Factbook, Automotive Aftermarket Industry Association and raw data supplied by R.L. Polk & Co.’s National Vehicle Population Profile® (NVPP®), data as of July 1st of each year; 2004 total is company estimate based on information supplied by both sources.
†Estimated.
*NOTE: The Company uses non-GAAP measures as an indication of its earn-ings from its core operations and believes it is important to the Company’s stockholders due to the nature and significance of the excluded expenses. Please see our reconciliation of comparable operating income and compa-rable earnings per share included on page 1 of this annual report.
READY WITH A WINNING TEAM 2004 Annual Report
®
5673 A IRPO RT ROAD, ROAN O KE, VIRGIN IA 24 012 540.362.4911 www.AdvanceAutoParts.com
®
2004 ANNUAL REPORT®

Advance Auto Parts, Inc. and Subsidiaries
Supplement to 2004 Annual Report Management’s Report on Internal Control over Financial Reporting
Management of Advance Auto Parts, Inc. and its subsidiaries (the Company) is responsible for establishing and maintaining adequate internal control over financial reporting. The Company’s internal control over financial reporting is a process designed under the supervision of the Company’s principal executive officer and principal financial officer to provide reasonable assurance regarding the reliability of financial reporting and the preparation of the Company’s financial statements for external purposes in accordance with accounting principles generally accepted in the United States of America.
Our internal control over financial reporting includes policies and procedures that (1) pertain to the maintenance of records that, in reasonable detail, accurately and fairly reflect the transactions and dispositions of the assets of the Company; (2) provide reasonable assurance that transactions are recorded as necessary to permit preparation of financial statements in accordance with generally accepted accounting principles, and that receipts and expenditures of the Company are being made only in accordance with authorizations of management and directors of the Company; and (3) provide reasonable assurance regarding prevention or timely detection of unauthorized acquisition, use, or disposition of the Company’s assets that could have a material effect on the financial statements.
As of January 1, 2005, management assessed the effectiveness of the Company’s internal control over financial reporting based on the criteria established in Internal Control – Integrated Framework issued by the Committee of Sponsoring Organizations of the Treadway Commission (COSO). Based on this assessment, management has determined that the Company’s internal control over financial reporting as of January 1, 2005 is effective. Because of the inherent limitations of internal control over financial reporting, including the possibility of collusion or improper management override of controls, material misstatements due to error or fraud may not be prevented or detected on a timely basis. Also, projections of any evaluation of the effectiveness of the internal control over financial reporting to future periods are subject to the risk that the controls may become inadequate because of changes in conditions, or that the degree of compliance with the policies or procedures may deteriorate.
Deloitte & Touche LLP, the Company’s independent registered public accounting firm who audited the Company’s consolidated financial statements, has issued a report on management’s assessment of the Company’s internal control over financial reporting as of January 1, 2005 and is included in the accompanying 2004 Annual Report.