ADV measurements of flow field around bridge abutment ... · CGU HS Committee on River Ice...
15
CGU HS Committee on River Ice Processes and the Environment 17 th Workshop on River Ice Edmonton, Alberta, July 21 - 24, 2013 ADV measurements of flow field around bridge abutment under ice cover Peng Wu 1 , Faye Hirshfield 2 , Jueyi Sui 3 1 Univerisity of Northern British Columbia, 3333 University Way, Prince George, BC, V2N 4Z9 [email protected] 2 Univerisity of Northern British Columbia, 3333 University Way, Prince George, BC, V2N 4Z9 [email protected] 3 Univerisity of Northern British Columbia, 3333 University Way, Prince George, BC, V2N 4Z9 [email protected] Based on a series of large scale flume experiments, the flow field in the scour hole around a round bridge abutment under ice cover was measured by using a 10MHz Acoustic Doppler Velocimeter (ADV). During flume experiments three non-uniform sediments were tested under conditions of open channel, smooth ice cover, and rough ice cover. The contour of the scour hole around the abutment was plotted using Surfer 10 software. Results show that, in open channel, the maximum scour depth is located at the upstream abutment surface at a 50 degree angle from the flume wall. Under ice covered flow the maximum scour depth is located at a 40 degree angle from the flume wall. Measurements of the flow field in the scour hole under ice cover show highly turbulent flow characteristics. 3D velocity components under ice cover were plotted and compared with open channel velocity. Analysis on the velocity components in three directions were also presented in the paper.
-
Upload
duongduong -
Category
Documents
-
view
213 -
download
0
Transcript of ADV measurements of flow field around bridge abutment ... · CGU HS Committee on River Ice...

CGU HS Committee on River Ice Processes and the Environment 17th Workshop on River Ice Edmonton, Alberta, July 21 - 24, 2013
ADV measurements of flow field around bridge abutment under ice cover
Peng Wu1, Faye Hirshfield2, Jueyi Sui3
1Univerisity of Northern British Columbia, 3333 University Way, Prince George, BC, V2N 4Z9 [email protected]
2Univerisity of Northern British Columbia, 3333 University Way, Prince George, BC, V2N 4Z9
3Univerisity of Northern British Columbia, 3333 University Way, Prince George, BC, V2N 4Z9 [email protected]
Based on a series of large scale flume experiments, the flow field in the scour hole around a round bridge abutment under ice cover was measured by using a 10MHz Acoustic Doppler Velocimeter (ADV). During flume experiments three non-uniform sediments were tested under conditions of open channel, smooth ice cover, and rough ice cover. The contour of the scour hole around the abutment was plotted using Surfer 10 software. Results show that, in open channel, the maximum scour depth is located at the upstream abutment surface at a 50 degree angle from the flume wall. Under ice covered flow the maximum scour depth is located at a 40 degree angle from the flume wall. Measurements of the flow field in the scour hole under ice cover show highly turbulent flow characteristics. 3D velocity components under ice cover were plotted and compared with open channel velocity. Analysis on the velocity components in three directions were also presented in the paper.

1. Introduction
Local scour is caused by the three dimensional turbulent flow around bridge foundations transporting sediment downstream. Local scour around bridge abutments or piers has been an interesting topic for a long time. As mentioned by Melville (1992), 6 of 10 bridge failures that occurred in New Zealand during Cyclone Bola were related to local scour around bridge foundations. Luigia et al. (2012) indicated that approximately 50 to 60 bridges fail on average each year in the US. The Federal Highway Administration has estimated that over 60% of bridge collapses in the US are from local scour (NCHRP, 2011). Bridge foundations should be designed to withstand the effects of scour. Estimation of the scour depth at bridge foundations is a problem that has perplexed designers for many years. Improving the understanding of local scour is important for engineers responsible for the design of bridge foundations. In cold regions of the northern hemisphere, ice cover is an issue as it can stay up to 6 months on some rivers. Ice cover can lead to problems such as ice jamming, flooding, restricting the generation of hydro-power, block river navigation and affect the ecosystem balance (Hicks, 2009). Numerous researchers have contributed work on ice related hydrology and hydraulic problems (Beltaos, 2000; Prowse, 2001; Ettema and Daly, 2004; Wang, 2008; Sui et al., 2009). Ice cover can significantly change the flow field and impact sediment transport in natural rivers. Lau and Krishnappan (1985) along with Ettema et al. (2000) developed methods for estimating the sediment transport under ice cover. Sui et al. (2000) derived relationships between suspended sediment concentration and riverbed deformation under ice cover at the Hequ Reach of the Yellow River. Turcotte et al. (2011) reviewed the sediment transport process in ice affected rivers by documenting a range of unique ice and sediment transport process. Considerable advances have been made concerning ice forces on bridges (Brown, 2000) and dams as reported by Morse and Hicks (2005). However, little research has been conducted regarding the local scour around bridge foundations under ice cover. Only a few studies can be found on the local scour under ice cover (Ackermann et al. 2002, Hains and Zabilansky, 2004; Sui et al. 2010). To date, there is still no research that measures the flow field in the scour hole around bridge abutments under ice cover. To fill this gap, a series of large scale flume experiments were conducted in 2012 at the Quesnel River Research Centre (QRRC), Likely, British Columbia. The following are the objectives of this study: a. Compare the flow field measured by ADV in open channel and ice cover around the semi-circular abutment. b. Compare the scour depth around the bridge abutment at different locations.
2. Methodology
A series of experiments were conducted in a large scale flume that was 40m long, 2m wide and 1.3m deep. The outdoor flume is located at QRRC. The slope of the flume bottom is 0.2%. A holding tank was made in the upstream portion of the flume with a volume of 90m3 in order to keep a constant discharge rate in the experimental zone. Two valves were connected to the

holding tank for the purpose of changing the flow velocity. From the holding tank, water traveled over a rectangular weir to flow dissipaters in the experimental zone. One sand box was created in the flume with depth of 30cm. Figure 1 shows the setup of abutment and ice cover in the Flume. Since ice cover is the main focus of this study, two types of ice cover were used in this research, namely smooth cover and rough cover. A smooth ice cover was created from Styrofoam. A rough ice cover was created by attaching small cubes of the Styrofoam to the underside of the smooth ice cover. The small cubes have a dimension of 2.5cm ×2.5cm × 2.5cm, with a spacing distance of 3.5cm from each other. Meanwhile, three different non-uniform sediments were used in the study. The D50 of the three sediments were 0.58cm, 0.50cm and 0.47cm. One round abutment with the diameter of 20cm was made from plexiglass. The dimensions of the abutment and coordinate system can be found in Figure 2. In front of the sand box, a SonTek IQ was installed to measure the approaching flow velocity, water depth and temperature. A staff gauge was also installed in the sand box for depth measurement. A 10 MHz SonTek ADV was used to measure the flow field in the vicinity of the abutment. At the end of each experiment the ADV was placed in the scour hole and profile velocity measurements were taken at equal intervals. Each measurement was taken over a 20 second period and the instantaneous velocity was calculated. For ice cover conditions a flap was cut out of the Styrofoam that would allow for the ADV to be inserted into the scour hole and measure the flow field. The signal-to-noise ratio (SNR) and the correlation (COR) values were reviewed according to manufacturer recommendations (Wahl, 2000). According to the manufacturer, the SNR is a function of turbidity, the amount of particulate matter in the flow. The correlation is a measure of scatter in velocity within the sampling period. The following standard was used here: SNR > 15 db, and COR >70%. The WinADV software program developed by the Bureau of Reclamation’s Water Resources Research Laboratory was used to filter the ADV data from poor quality or erroneous data based on the SNR and COR values. Table 1 summarizes the experimental conditions and presents preliminary results for each flume run. At the end of each experiment, photos were taken of the scour hole around the bridge abutment. The scour hole profiles were plotted by using the Surfer 10, Golden Software. Figure 3 shows the typical scour profile under open channel, smooth cover and rough cover. To make sure conditions during each experiment were constant, the following steps were strictly followed in the experimental study. (1) Before each experiment, the abutment model was leveled and fixed in the sand box to make sure the abutment was vertical to the flume bottom. On the outside surface of the abutment, different measuring lines have been drawn for the purpose of measuring scour depth. A total of 13 measuring lines (P ~ Q) were made for the round abutment (Figure 2). (2) At the beginning of each experiment, the flume was slowly filled with water by adjusting the valves in the holding tank. A template was made to cover the scour zone from initial scouring. After the required water depth was reached, the valves were adjusted to the desired flow rate in the flume and the template was then removed to start the experiment. The duration of scour

experiments was 24 hours; enough for the equilibrium scour depth to be reached from the authors’ observation.
3. Results and Discussion
3.1 Scouring process and contours From our observation, the scour started form the toe area of the abutment. In the first two hours, one large scour hole has already been formed. With the development of scour hole, a secondary scour hole was observed at the downstream surface of the abutment. However, the location of the scour hole is independent on the covered condition. The scour profiles from the measuring points (A ~ K) are different under ice cover compare to that in open channel. Under rough ice cover, the scour area is large compared to that under smooth cover. (Note that the approaching velocity under open channel conditions is larger than that under ice covered channel conditions). It is our understanding that, with the increase in ice roughness, there is a time lag in shear stress upstream of the abutment. This time lag causes the location of maximum scour depth to vary with channel cover. Following four observations are noted. (1) The maximum scour depth is typically located at the abutment corner, which is 50 degrees from the flume wall. Under open channel conditions, the maximum scour is located between C and D, while under ice cover the maximum scour is located between B and C. Figure 4 shows the location of the maximum scour depth around the bridge abutment. Additionally, under rough ice cover, the maximum scour depth closes to B. From our understanding, with the increase in ice roughness, we can make the assumption that in the upstream of the abutment, the time lag of shear stress caused by the ice cover impacts location of maximum scour depth. (2) As the scour hole develops more sediment moves downstream. In open channel conditions, a fine sediment ridge is observed from J to Q. In ice covered conditions a fine sediment ridge is observed from J and K. Based upon visual observation, the ridge has a greater length under rough ice cover compared to that under smooth ice cover. Based upon visual observation, the start point of the fine sediment ridge migrates further downstream with the increase in roughness of ice cover. (3) Two scour holes can be observed along the abutment. One hole is located in the upstream surface of the abutment, while the hole is located between measuring points F to I. Meanwhile, along the abutment, F is the separate line of two scour holes. Under ice covers, the elevation at F is close to the original channel bed. (4) Based upon visual observation, the time required to reach maximum scour depth under ice cover is longer than that under open channel conditions. In open channels, the scour hole develops quickly within the first 3 hours. While under ice cover, due to the increased cover resistance, the scouring time is longer than that in open channels. Additionally, with the increase in ice roughness, the scouring process under rough cover is longer than that under smooth ice cover.

During the scouring process, a primary vortex was observed upstream of the abutment. As mentioned by Dey and Barbhuiya (2005), the horseshoe vortex is the main reason for scouring. Under ice cover, several small horseshoe vortexes can be detected in the scour hole. The horseshoe vortex exhibited a clock wise direction and some horizontal vortexes were also observed. 3.2 Velocity distribution under ice cover As reported by Sui et al. (2010), due to the increased wetted perimeter of flow caused by ice cover, the composite resistance increased correspondingly. The upper portion of the flow is mainly affected by the ice cover, while the lower portion is mainly influenced by the channel bed. The maximum velocity locates between the cover and channel bed. However, in the vicinity of the abutment, inside the scour hole, the flow field has never been studied. The velocity profile around the entire abutment was measured in the present study. Figure 5 shows the instantaneous velocity measured along the abutment from points A to K under open, smooth cover and rough ice cover channels. The following findings have been observed. (1) Ice cover imposes an extra downwards force on the flow which creates a higher velocity component in the Z direction. This is reflected in our velocity measurements. The velocity values in the Z direction under smooth and rough cover are larger than those under open channel. From points A to I, for open channel, the velocity component in Z direction is the smallest compared to the X and Y component at the same elevation. (2) Due to the boundary layer from the flume wall, small downward vortexes are generated on the downstream side of the abutment. This is indicated by the fact that J and K are the only two locations that have a large Z direction velocity component under open channel conditions. Additionally, fine sediment ridges were also located close to this area. (3) It was observed that, under ice conditions, in the upstream side of the abutment, the primary vortex moves downwards, while in the downstream side of the abutment, the vortex moves upwards. Under ice covered condition from points A to F, all the measured velocity components in Z direction have negative value; however, from G to H, the velocity components in Z direction have positive values. (4) In the upstream of the abutment, velocity component in X direction is mostly positive, while the Y component has the tread from positive to negative. At points C to E, the Y direction velocity is very small. In other words, the Y direction velocity component decreases along the abutment in the upstream surface till the maximum scour depth. Thus, we make the conclusion that Y direction velocity contributes less to the maximum scour depth compared to the velocity component in the X and Z direction. (5) In open channels, the maximum scour depth is located between C and D. Under ice cover, the maximum scour depth is located between B and C. In open channels, the X direction velocity contributes the most to scour hole development. While under ice covered conditions, the Z direction velocity component has the largest impact on scour development.

(6) With the increase in ice cover roughness, the gradient of velocity in all the three directions decreases. (7) No scour hole was observed in the downstream side of the abutment under ice cover. However, from I to K, velocity components were highly turbulent compared to that of open channel.
4. Conclusion
Local scour around bridge abutments under ice cover was studied through flume experiments during 2012. It was found that, in open channels, the maximum scour depth is located at the upstream surface of the abutment, 50 degree from the flume wall, while under ice cover, the maximum scour depth is located 40 degree from the flume wall. Also, a sediment ridge is formed downstream of the abutment. The ridge has a greater length under rough ice cover compared to that under smooth ice cover. The start point of the fine sediment ridge migrates further downstream with the increase in roughness of ice cover. By using an ADV, the scour hole flow field at different locations and elevations was measured. Compared to open channel flow, the velocity component in Z direction contributes the most to scour hole development under ice cover. In addition, the direction of the primary vortex changes from upwards at the upstream side to downwards at the downstream side of the abutment. Acknowledgments This work is supported by NSERC and UNBC Research Project Award. Physical experiments were conducted at Quesnel River Research Center (QRRC), Likely, BC. We gratefully acknowledge the help provided by the staff and students, Anja Orester, Alex Koiter, Ben Anderson. References Ackermann N L, Shen H T, Olsson P, 2002. Local scour around circular piers under ice covers.
Proceeding of the 16th IAHR International Symposium on Ice, International Association of Hydraulic Engineering Research, Dunedin, New Zealand.
Beltaos S, 2000. Advances in river ice hydrology. Hydrological Processes. Vol. 14, pp. 1613-1625.
Brown T G, 2000. Ice loads on the piers of Confederation Bridge, Canada. Structural Engineer, Vol. 78, pp. 18-23.
Dey S, Barbhuiya A K, 2005. Turbulent flow field in a scour hole at a semicircular abutment. Canadian Journal of Civil Engineering, Vol. 32, pp. 213-232.
Ettema R, Braileanu, F, Muste M, 2000. Method for estimating sediment transport in ice covered channels. Journal of Cold Regions Engineering, Vol. 14, No. 3, pp. 130-144.
Ettema R, Daly S F, 2004. Sediment transport under ice. ERDC/CRREL TR-04-20. Cold regions research and Engineering Laboratory, US Army Corps of Engineers.

Hains D, Zabilansky L, 2004. Laboratory test of scour under ice: Data and preliminary results. ERDC/CRREL TR-04-09. Cold regions research and Engineering Laboratory, US Army Corps of Engineers.
Hicks F, 2009. An overview of river ice problems: CRIPE 07 guest editorial Cold regions Science and Technology, 55: pp. 175-185.
Lau Y L, Krishnappan B G, 1985. Sediment transport under ice cover. Journal of Hydraulic Engineering, ASCE, 111(6), pp. 934-950.
Luigia B, Paolo P, Giuliano D B, 2012. Bridge pier scour: a review of process, measurements and estimates. Environmental Engineering and Management Journal, Vol. 11 (5).
Melville B W, 1992. Local scour at bridge abutments, Journal of Hydraulic Engineering. ASCE, Vol. 118, No. 4, pp. 615-631.
Morse B, Hicks F, 2005. Advances in river ice hydrology 1999-2003. Hydrological Processes, Vol. 19, pp. 247-263.
NCHRP Web-only Document 181, 2011. Evaluation of Bridge-Scour Research: Abutment and Contraction Scour Processes and Prediction. NCHRP Project 24-27(02).
Prowse T D, 2001. River-Ice ecology: Part A. Hydrologic, geomorphic and water-quality aspects. Journal of Cold Regions Engineering, Vol. 15, pp. 1-16.
Sui J, Wang D, Karney B, 2000. Suspended sediment concentration and deformation of riverbed an a frazil jammed reach. Canadian Journal of Civil Engineering, Vol. 27, 1120-1129.
Sui J, Faruque M A A, Balanchandar R, 2009. Local scour caused by submerged square jets under model ice cover. Journal of Hydraulic Engineering, Vol. 135, No. 4, pp. 316-319.
Sui J, Wang J, He Y, Krol F, 2010. Velocity profile and incipient motion of frazil particles under ice cover. International Journal of Sediment Research, Vol. 25, No. 1, pp. 39-51.
SonTek, 2001, Acoustic Doppler Velocimeter (ADV) principles of operation, SonTek ADV technical manual, SonTek, San Diego.
Turcotte B, Morse B, Bergeron N E, Roy A G, 2011. Sediment transport in ice affected rivers. Journal of Hydrology, Vol. 409, pp. 561-577.
Wahl T L, 2000, Analyzing data using WinADV. Joint Conference on water resources engineering and water resources planning and management, Minneapolis, Minnesota, pp. 1-10.
Wang J, Sui J, Karney B, 2008. Incipient motion of non-cohesive sediment under ice cover – an experimental study. Journal of Hydrodynamics, Vol. 20, No. 1, pp. 177-124.

Table 1. The maximum scour depth under different conditions.
Cover condition
D50 (mm)
D16 (mm)
D84 (mm)
Water depth (m)
Average velocity
(m/s)
Maximum scour depth
(cm)
Open channel
0.58 0.28 1.91 0.07 0.21 0.0 0.58 0.28 1.91 0.19 0.23 5.5 0.58 0.28 1.91 0.07 0.26 2.7 0.50 0.26 1.66 0.07 0.21 3.5 0.50 0.26 1.66 0.19 0.23 7.0 0.50 0.26 1.66 0.07 0.26 6.0 0.47 0.23 0.82 0.07 0.21 0.0 0.47 0.23 0.82 0.19 0.23 15.0 0.47 0.23 0.82 0.07 0.26 15.0
Smooth cover
0.58 0.28 1.91 0.07 0.23 2.3 0.58 0.28 1.91 0.19 0.20 3.2 0.58 0.28 1.91 0.07 0.20 1.0 0.50 0.26 1.66 0.07 0.23 6.5 0.50 0.26 1.66 0.19 0.20 6.0 0.50 0.26 1.66 0.07 0.20 2.5 0.47 0.23 0.82 0.07 0.23 13.5 0.47 0.23 0.82 0.19 0.20 12.0 0.47 0.23 0.82 0.07 0.20 3.0
Rough cover
0.58 0.28 1.91 0.07 0.20 2.2 0.58 0.28 1.91 0.19 0.20 3.5 0.58 0.28 1.91 0.07 0.22 4.7 0.50 0.26 1.66 0.07 0.20 4.0 0.50 0.26 1.66 0.19 0.20 7.5 0.50 0.26 1.66 0.07 0.22 9.0 0.47 0.23 0.82 0.07 0.20 4.0 0.47 0.23 0.82 0.19 0.20 17.0 0.47 0.23 0.82 0.07 0.22 13.7

Figure 1. Experimental setup.
Figure 2. Abutment dimension and coordinate system.

Figure 3. Contours of scour hole under open channel, smooth cover, and rough cover.

Figure 4. The scour profile along the round abutment under different conditions.

Point A
Point B
Point C

Point D
Point E
Point F
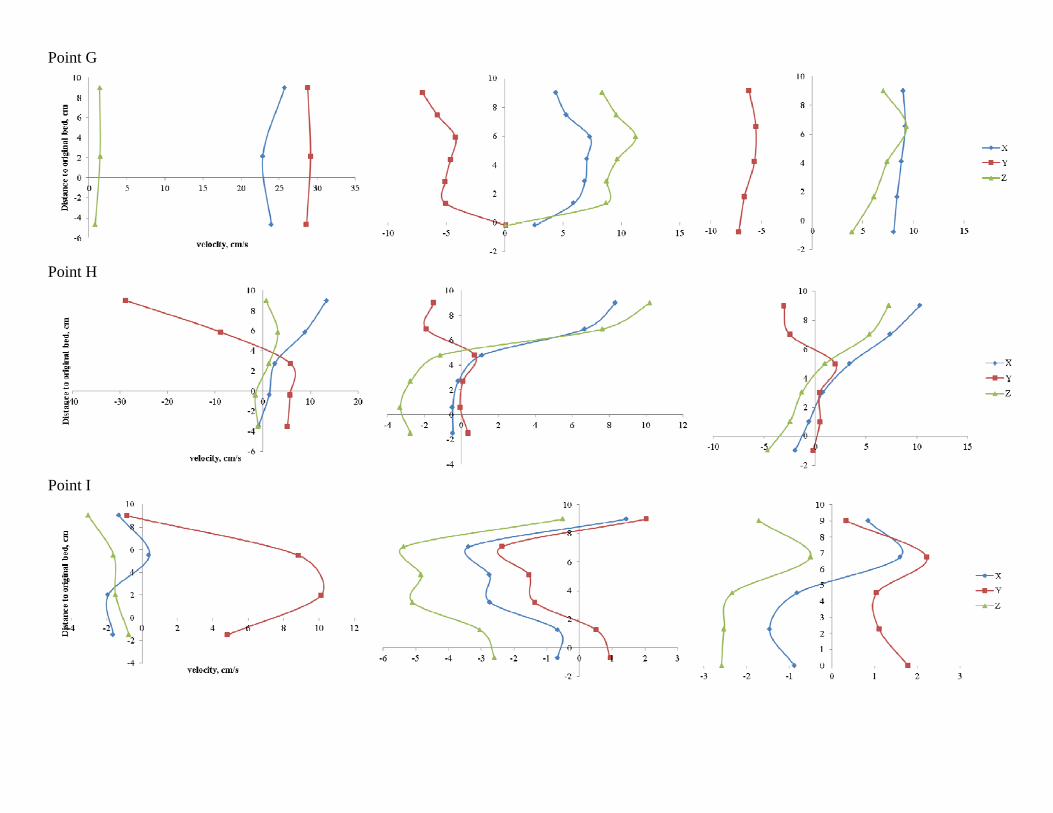
Point G
Point H
Point I

Point J
Point K
Figure 5. The velocity distribution along the abutment under different conditions: open channel (Left), smooth cover (Middle), rough cover (right).