Adults are surrounded by graphic/visual information. Not ... Literacy... · • Editorial cartoons...
9
Adults are surrounded by graphic/visual information. Not only charts, tables and graphs but also photographs, advertisements, diagrams, and editorial cartoons. Adults encounter information provided through graphics at home, in the car on the way to work, and in the workplace. Adults make decisions based on this graphic input of data in their daily lives and in the workplace. Today, more than ever, graphic/visual literacy is an essential skill. On the GED® Social Studies Test, students may encounter the following types of graphic-based material: Graphs (line, bar, circle, scatter plots, histograms) • Tables and charts • Maps • Editorial cartoons • Photographs Below is an example of what students may encounter on the Social Studies Test. In previous modules, we discussed the many ways that data may be displayed graphically. We are now going to look more closely at a few of those types of graphics and begin to explore strategies for interpreting photographs, editorial cartoons, and maps using inference strategies.
Transcript of Adults are surrounded by graphic/visual information. Not ... Literacy... · • Editorial cartoons...
Adults are surrounded by graphic/visual information. Not only charts, tables and graphs but also photographs, advertisements, diagrams, and editorial cartoons. Adults encounter information provided through graphics at home, in the car on the way to work, and in the workplace. Adults make decisions based on this graphic input of data in their daily lives and in the workplace. Today, more than ever, graphic/visual literacy is an essential skill.
On the GED® Social Studies Test, students may encounter the following types of graphic-based material:
Graphs (line, bar, circle, scatter plots, histograms)
• Tables and charts • Maps • Editorial cartoons • Photographs
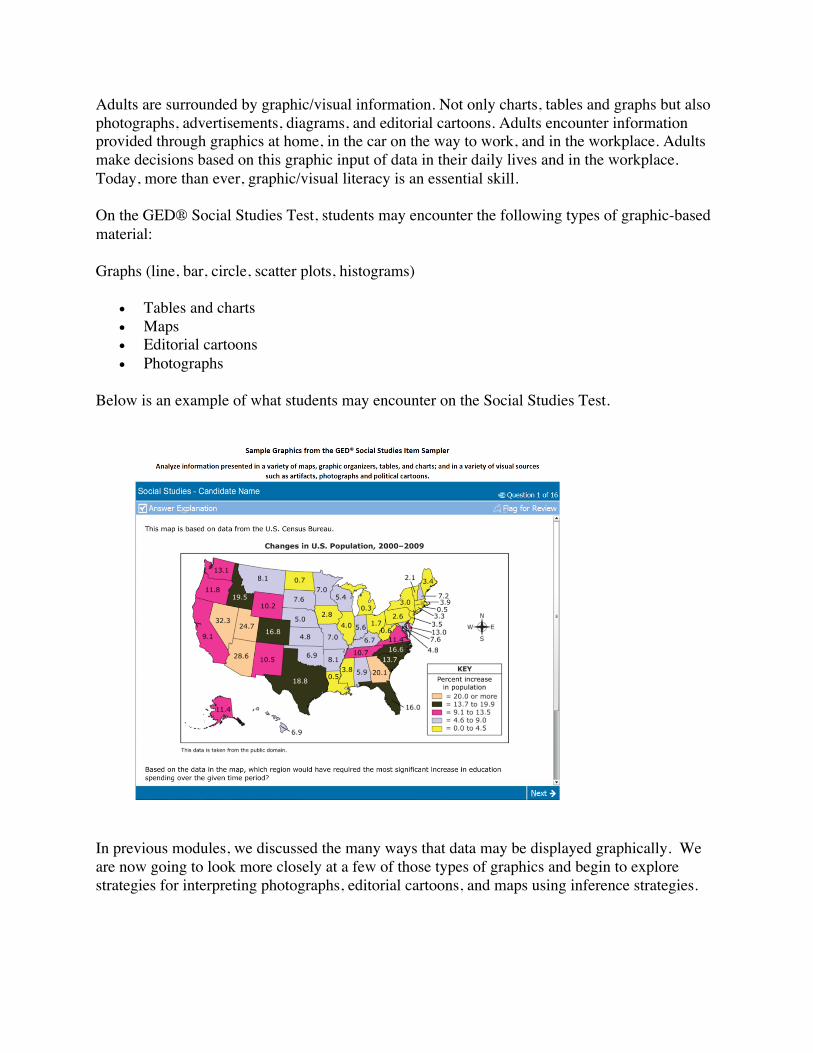
Below is an example of what students may encounter on the Social Studies Test.
In previous modules, we discussed the many ways that data may be displayed graphically. We are now going to look more closely at a few of those types of graphics and begin to explore strategies for interpreting photographs, editorial cartoons, and maps using inference strategies.
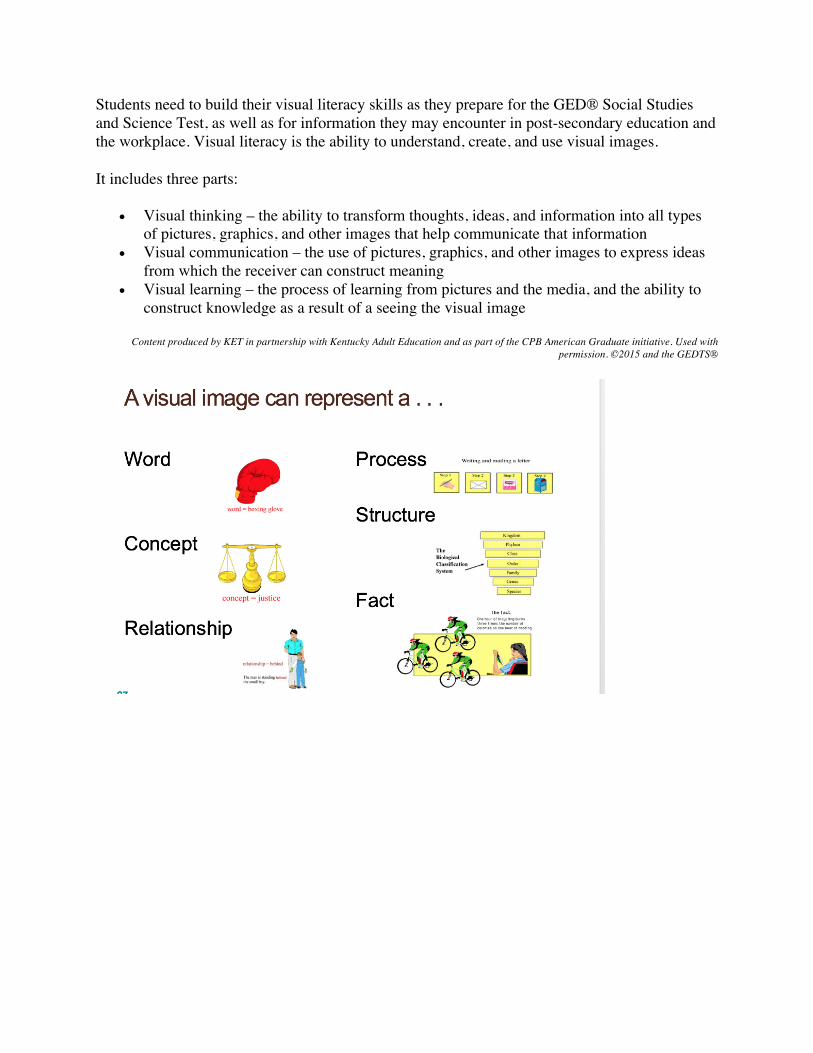
Students need to build their visual literacy skills as they prepare for the GED® Social Studies and Science Test, as well as for information they may encounter in post-secondary education and the workplace. Visual literacy is the ability to understand, create, and use visual images.
It includes three parts:
• Visual thinking – the ability to transform thoughts, ideas, and information into all types of pictures, graphics, and other images that help communicate that information
• Visual communication – the use of pictures, graphics, and other images to express ideas from which the receiver can construct meaning
• Visual learning – the process of learning from pictures and the media, and the ability to construct knowledge as a result of a seeing the visual image
Content produced by KET in partnership with Kentucky Adult Education and as part of the CPB American Graduate initiative. Used with permission. ©2015 and the GEDTS®
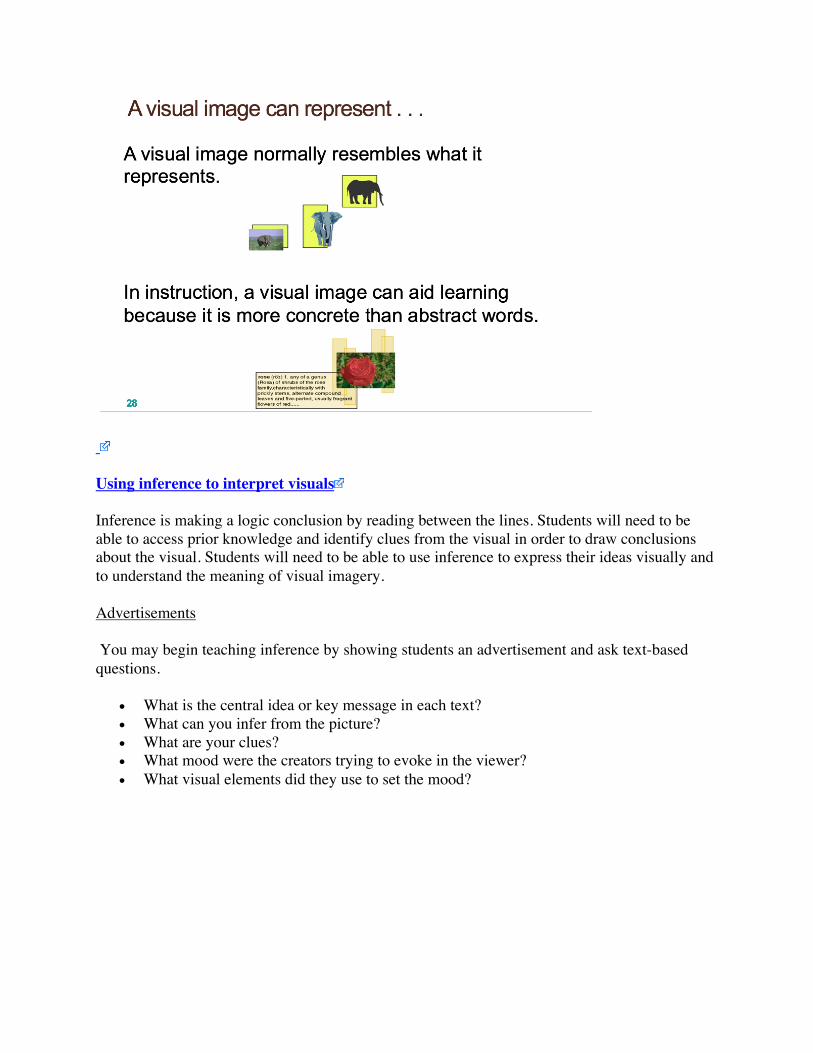
Using inference to interpret visuals
Inference is making a logic conclusion by reading between the lines. Students will need to be able to access prior knowledge and identify clues from the visual in order to draw conclusions about the visual. Students will need to be able to use inference to express their ideas visually and to understand the meaning of visual imagery.
Advertisements
You may begin teaching inference by showing students an advertisement and ask text-based questions.
• What is the central idea or key message in each text? • What can you infer from the picture? • What are your clues? • What mood were the creators trying to evoke in the viewer? • What visual elements did they use to set the mood?
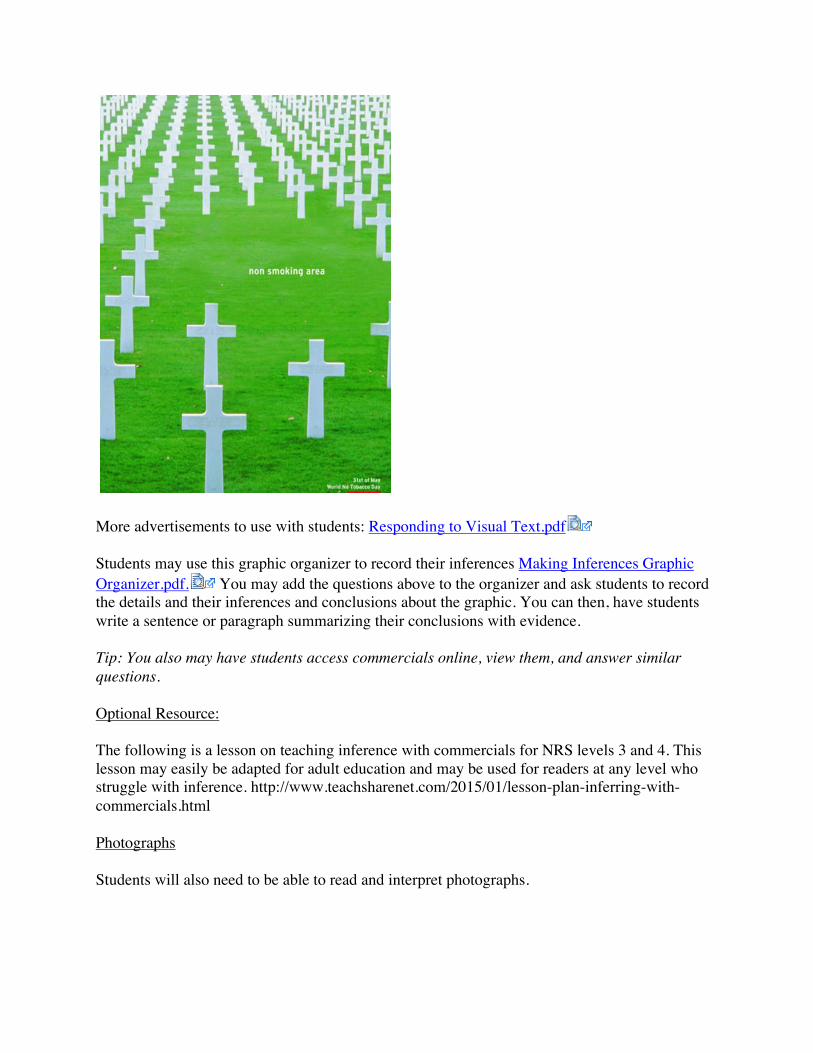
More advertisements to use with students: Responding to Visual Text.pdf
Students may use this graphic organizer to record their inferences Making Inferences Graphic Organizer.pdf. You may add the questions above to the organizer and ask students to record the details and their inferences and conclusions about the graphic. You can then, have students write a sentence or paragraph summarizing their conclusions with evidence.
Tip: You also may have students access commercials online, view them, and answer similar questions.
Optional Resource:
The following is a lesson on teaching inference with commercials for NRS levels 3 and 4. This lesson may easily be adapted for adult education and may be used for readers at any level who struggle with inference. http://www.teachsharenet.com/2015/01/lesson-plan-inferring-with-commercials.html
Photographs
Students will also need to be able to read and interpret photographs.

http://www.pbs.org/kenburns/civil-war/photo-gallery/
Begin by showing students by showing a photo and ask text-based questions.
• What is the story behind the picture? • What do you believe happened? • When was the photo taken? • What do you think happened just before the photo was taken? • What do you think will happen next? • What message is the photographer trying to convey? • What are your clues for the answers above?
Tip: You can differentiate these questions based on the level of your students. It is best to contextualize this strategy within a close reading or social studies lesson.
Other questions may include:
• What do you observe in this picture? • What does it remind you of? • What is photographer’s purpose? • What inferences can you make based on the details in the picture?
Political Cartoons and Comics
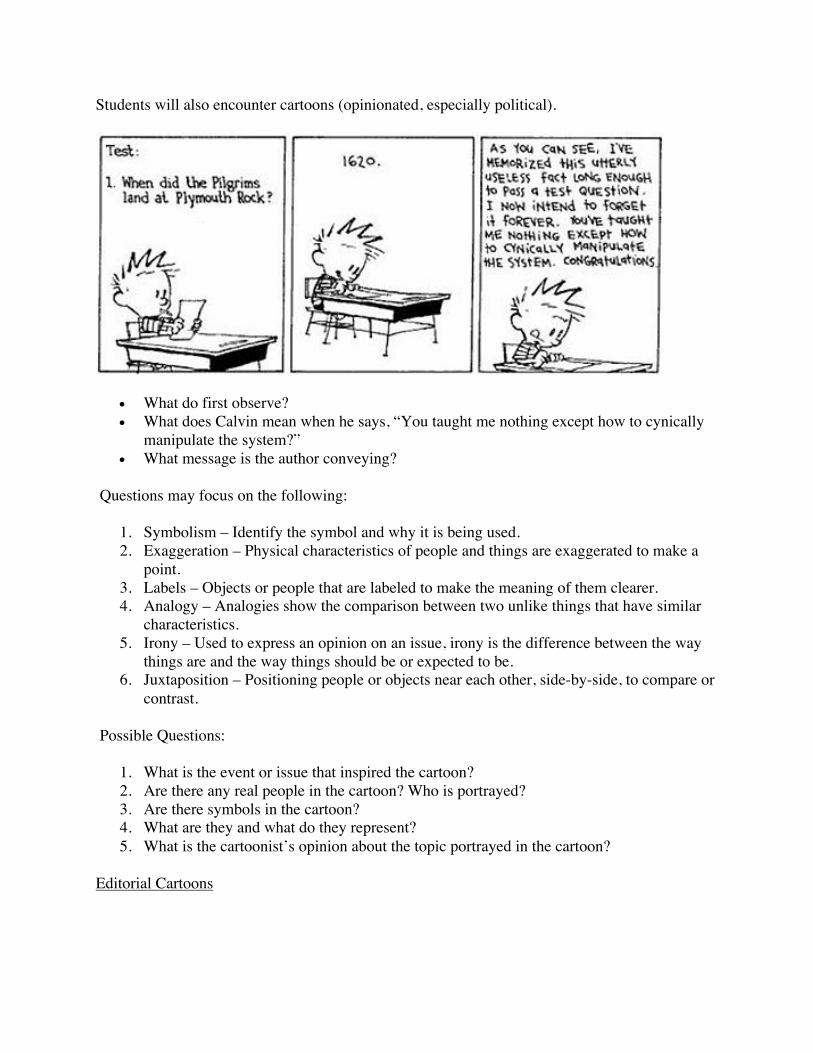
Students will also encounter cartoons (opinionated, especially political).
• What do first observe? • What does Calvin mean when he says, “You taught me nothing except how to cynically
manipulate the system?” • What message is the author conveying?
Questions may focus on the following:
1. Symbolism – Identify the symbol and why it is being used. 2. Exaggeration – Physical characteristics of people and things are exaggerated to make a
point. 3. Labels – Objects or people that are labeled to make the meaning of them clearer. 4. Analogy – Analogies show the comparison between two unlike things that have similar
characteristics. 5. Irony – Used to express an opinion on an issue, irony is the difference between the way
things are and the way things should be or expected to be. 6. Juxtaposition – Positioning people or objects near each other, side-by-side, to compare or
contrast.
Possible Questions:
1. What is the event or issue that inspired the cartoon? 2. Are there any real people in the cartoon? Who is portrayed? 3. Are there symbols in the cartoon? 4. What are they and what do they represent? 5. What is the cartoonist’s opinion about the topic portrayed in the cartoon?
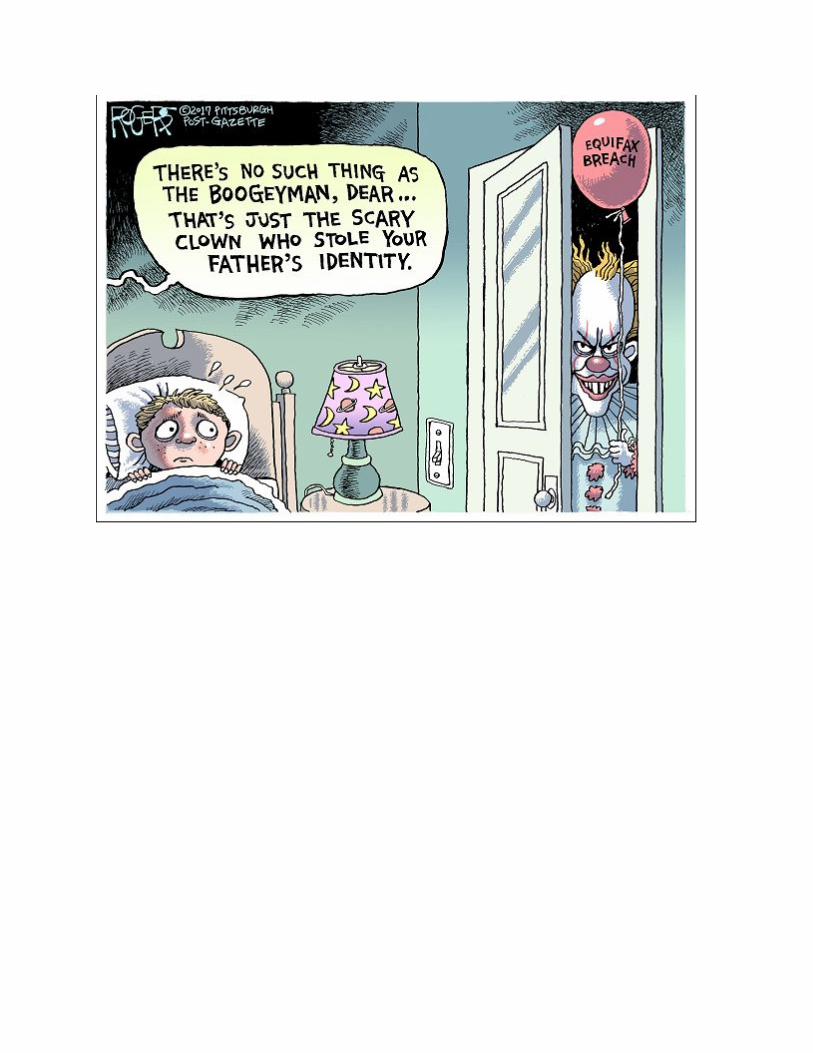
Editorial Cartoons
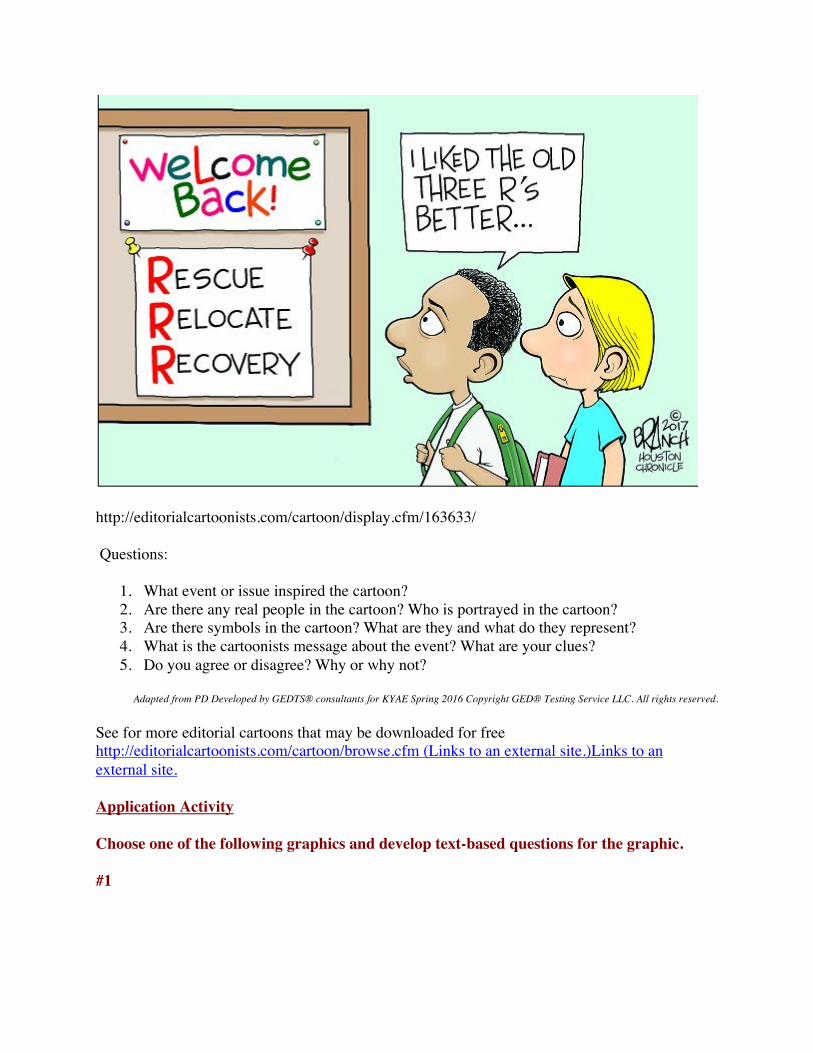
http://editorialcartoonists.com/cartoon/display.cfm/163633/
Questions:
1. What event or issue inspired the cartoon? 2. Are there any real people in the cartoon? Who is portrayed in the cartoon? 3. Are there symbols in the cartoon? What are they and what do they represent? 4. What is the cartoonists message about the event? What are your clues? 5. Do you agree or disagree? Why or why not?
Adapted from PD Developed by GEDTS® consultants for KYAE Spring 2016 Copyright GED® Testing Service LLC. All rights reserved.
See for more editorial cartoons that may be downloaded for free http://editorialcartoonists.com/cartoon/browse.cfm (Links to an external site.)Links to an external site.
Application Activity
Choose one of the following graphics and develop text-based questions for the graphic.
#1
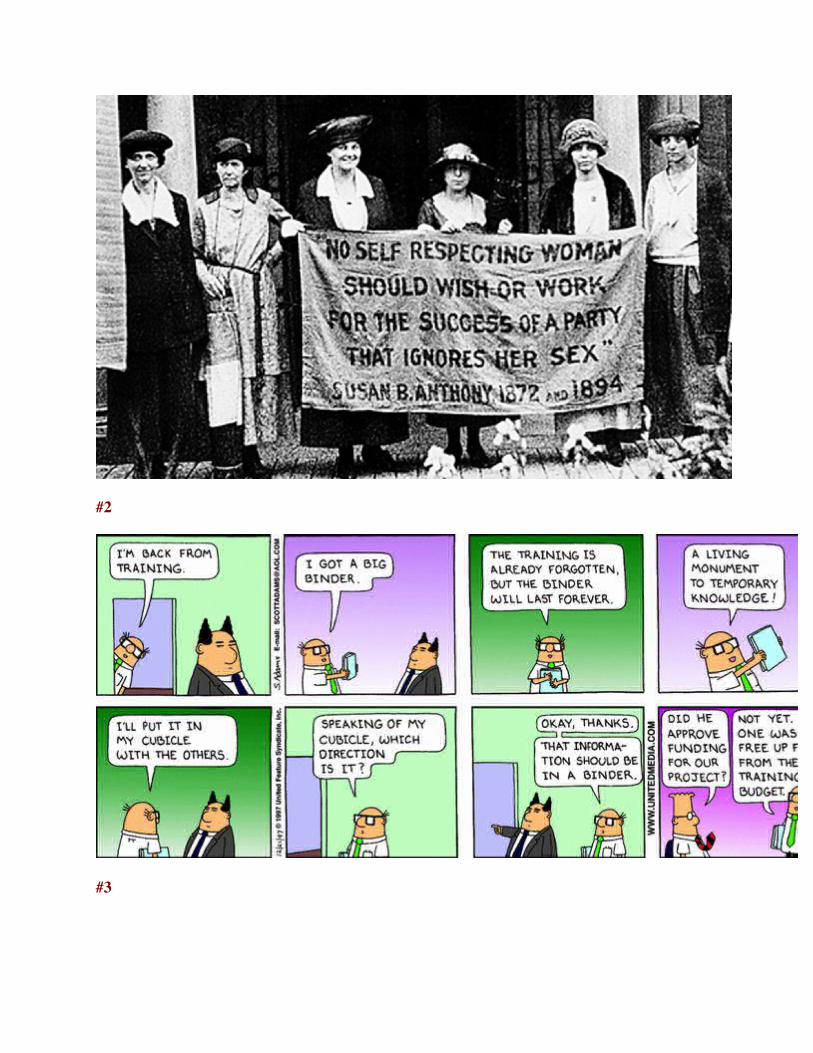
#2
#3