Adult Social Services Scrutiny Performance Panel...Mar 08, 2017 · Peter Black (Convener), Yvonne...
79
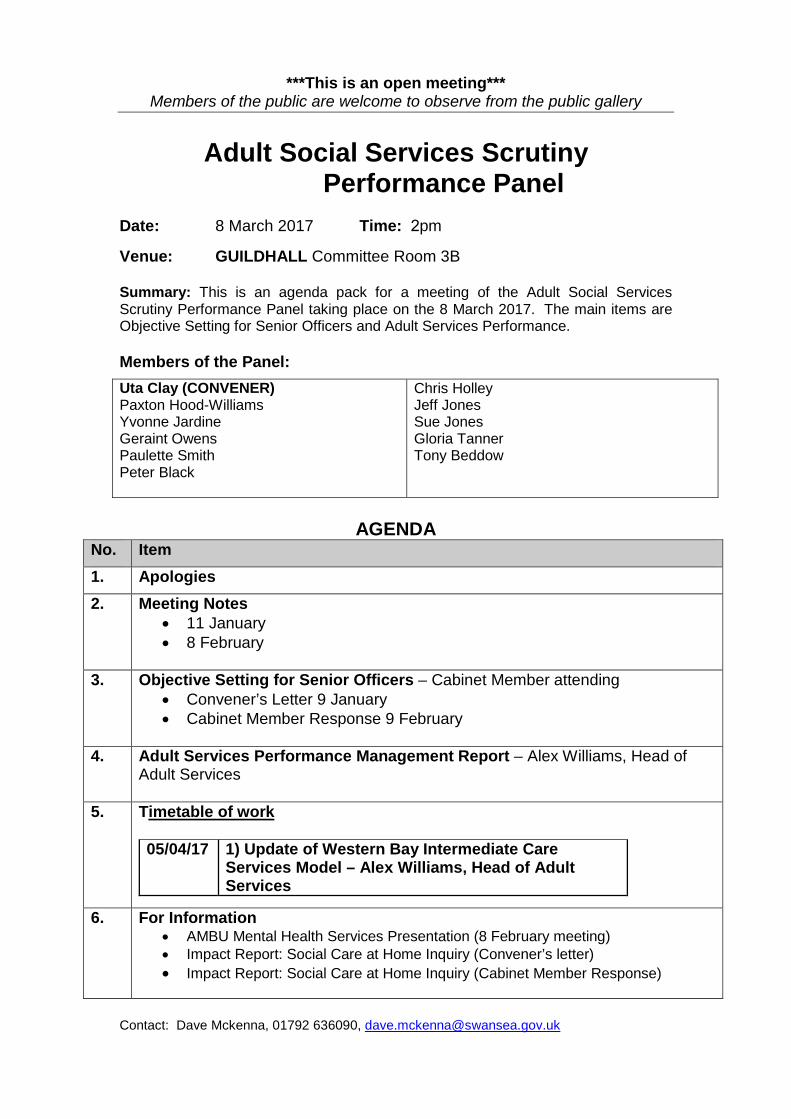
***This is an open meeting*** Members of the public are welcome to observe from the public gallery Adult Social Services Scrutiny Performance Panel Date: Venue: 8 March 2017 Time: 2pm GUILDHALL Committee Room 3B Summary: This is an agenda pack for a meeting of the Adult Social Services Scrutiny Performance Panel taking place on the 8 March 2017. The main items are Objective Setting for Senior Officers and Adult Services Performance. Members of the Panel: Uta Clay (CONVENER) Paxton Hood-Williams Yvonne Jardine Geraint Owens Paulette Smith Peter Black Chris Holley Jeff Jones Sue Jones Gloria Tanner Tony Beddow AGENDA No. Item 1. Apologies 2. Meeting Notes • 11 January • 8 February 3. Objective Setting for Senior Officers – Cabinet Member attending • Convener’s Letter 9 January • Cabinet Member Response 9 February 4. Adult Services Performance Management Report – Alex Williams, Head of Adult Services 5. Timetable of work 05/04/17 1) Update of Western Bay Intermediate Care Services Model – Alex Williams, Head of Adult Services 6. For Information • AMBU Mental Health Services Presentation (8 February meeting) • Impact Report: Social Care at Home Inquiry (Convener’s letter) • Impact Report: Social Care at Home Inquiry (Cabinet Member Response) Contact: Dave Mckenna, 01792 636090, [email protected]
Transcript of Adult Social Services Scrutiny Performance Panel...Mar 08, 2017 · Peter Black (Convener), Yvonne...
***This is an open meeting*** Members of the public are welcome to observe from the public gallery
Adult Social Services Scrutiny Performance Panel
Date:
Venue:
8 March 2017 Time: 2pm
GUILDHALL Committee Room 3B
Summary: This is an agenda pack for a meeting of the Adult Social Services Scrutiny Performance Panel taking place on the 8 March 2017. The main items are Objective Setting for Senior Officers and Adult Services Performance.
Members of the Panel: Uta Clay (CONVENER) Paxton Hood-Williams Yvonne Jardine Geraint Owens Paulette Smith Peter Black
Chris Holley Jeff Jones Sue Jones Gloria Tanner Tony Beddow
AGENDA No. Item 1. Apologies2. Meeting Notes
• 11 January• 8 February
3. Objective Setting for Senior Officers – Cabinet Member attending• Convener’s Letter 9 January• Cabinet Member Response 9 February
4. Adult Services Performance Management Report – Alex Williams, Head ofAdult Services
5. Timetable of work
05/04/17 1) Update of Western Bay Intermediate Care Services Model – Alex Williams, Head of Adult Services
6. For Information• AMBU Mental Health Services Presentation (8 February meeting)• Impact Report: Social Care at Home Inquiry (Convener’s letter)• Impact Report: Social Care at Home Inquiry (Cabinet Member Response)
Contact: Dave Mckenna, 01792 636090, [email protected]

1
Adult Services Panel Meeting January 11 2017 Notes
These are the notes and actions form the Adult Services Scrutiny Panel meeting held on 11 January at 4pm.
Attendance: Peter Black (Convener), Yvonne Jardine, Paulette Smith, Chris Holley, Jeff Jones, Sue Jones, Tony Beddow, Delyth Davies, Alex Williams, Mark Campisi
Summary – actions and what was agreed
ACTIONS • Contact Cabinet Member for Housing to request performance data on
disabled facilities grants and delays in transfers of care due to DFGs – DD to action
• Pathway map for Local Primary Mental Health Support Services – AlexWilliams to provide
• 400 referrals to primary care – panel wants more information on the detailbehind this figure - Alex Williams to provide
• The panel would like responses to the following questions – Mark Campisi toprovide responses
o Of the 400 monthly referrals how many of these are accepted and whatis this expressed as a percentage?
o How many of the “do not attend” figures are referrals?o What is the rate of “do not attend”?
• Invite Alex Williams to the additional panel meeting arranged for 6 Februaryto scrutinise the Adult Services draft budget and feed into the budgetconsultation.
WHAT THE PANEL AGREED • To hold an additional panel meeting on 6 February to scrutinise the Adult
Services draft budget and feed into the budget consultation. • The panel agreed a number of questions during the meeting that would be
relevant for the meeting in February with ABMU o in providing primary care interventions what information is used to
determine what a person needs o One to one interventions: What happens to the patient during the 2
year waiting time? o Group work – how effective is group work, what are the sizes of the
groups and has there been an increase in the size of the groups?
Item 2
2
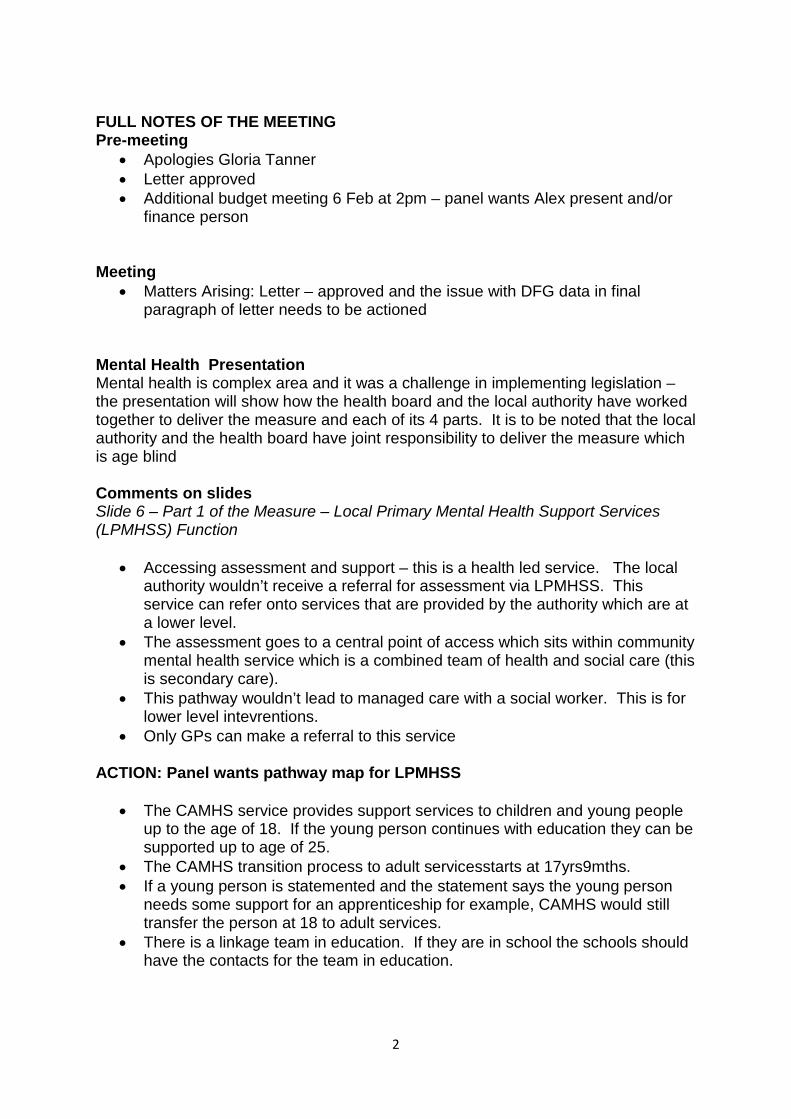
FULL NOTES OF THE MEETING Pre-meeting
• Apologies Gloria Tanner• Letter approved• Additional budget meeting 6 Feb at 2pm – panel wants Alex present and/or
finance person
Meeting • Matters Arising: Letter – approved and the issue with DFG data in final
paragraph of letter needs to be actioned
Mental Health Presentation Mental health is complex area and it was a challenge in implementing legislation – the presentation will show how the health board and the local authority have worked together to deliver the measure and each of its 4 parts. It is to be noted that the local authority and the health board have joint responsibility to deliver the measure which is age blind
Comments on slides Slide 6 – Part 1 of the Measure – Local Primary Mental Health Support Services (LPMHSS) Function
• Accessing assessment and support – this is a health led service. The localauthority wouldn’t receive a referral for assessment via LPMHSS. Thisservice can refer onto services that are provided by the authority which are ata lower level.
• The assessment goes to a central point of access which sits within communitymental health service which is a combined team of health and social care (thisis secondary care).
• This pathway wouldn’t lead to managed care with a social worker. This is forlower level intevrentions.
• Only GPs can make a referral to this service
ACTION: Panel wants pathway map for LPMHSS
• The CAMHS service provides support services to children and young peopleup to the age of 18. If the young person continues with education they can besupported up to age of 25.
• The CAMHS transition process to adult servicesstarts at 17yrs9mths.• If a young person is statemented and the statement says the young person
needs some support for an apprenticeship for example, CAMHS would stilltransfer the person at 18 to adult services.
• There is a linkage team in education. If they are in school the schools shouldhave the contacts for the team in education.

3
• 5th bullet – this service provides support and guidance to GPs and primarycare practices.
• Benefit of measure: Dedicated resources and staffing to primary care to helpprevent people from escalating and to help step down.
• This is the same model across the health board area.
Slide 7 • LPMHSS sits between the local authority and GPs
Slide 8 • Interventions are structured and time limited• Question for ABMU: in providing primary care interventions what
information is used to determine what a person needs
Slide 9 • The targets within primary care are set by Welsh Government• ACTION: 400 referrals a month – The panel wants more detail on the this
figure• The 3922 patients receiving a service under Psychiatrusts Primary Care Clinic
are those who have been referred and accepted. This is just one service.• Secondary care is providing services for primary care.• Primary care doesn’t have any psychiatry support.• Did not attend (DNA) rates – GPs are going to say that service user has to
refer themselves to the service which will give the person the impetus toattend.
• ACTION:MARK TO PROVIDE THE FOLLOWING:o Q)Of the 400 monthly referrals how many of these are accepted
and what is this expressed as a percentage? o How many of the DNAs are refererrals?o How many referrals for those who DNAo What is rate of DNA?
• Q) ONE TO ONE INTERVENTIONS: Do you think the local authority should have any role in saying to the health board and/or Welsh Government that the authority is not happy with 2 year waiting time for one to one interventions? A) Officers do not think that this is the role of the Council/Cabinet. Individualwards councillors may wish to make representations on behalf of constituents but it’s not the role of Council/Cabinet.
• Question for ABMU:What happens to the patient during the 2 year waiting time? Group work – how effective is group work, what are the sizes of the groups and has there been an increase in the size of the groups?
Slide 10 – Part 2 of the Measure • Secondary care is the specialist care and includes out patients and health and
social care co-ordinate services provided to this group of individuals.

4
• Care plan is a legal document – one exists for every service user insecondary care the plan is reviewed annually.
• The statutory timescale for completion of a care plan is 28 days• The Care co-ordinator is any professional person and it normally rests with
social workers, psychiatric nurses, occupational therapists and psychologists• Substance misuse - where it is a factor it will be included in the care plan.
However, there is a range of substance misuse services in Swansea andthere is a single route for access into these support services.
Slide 11 – Secondary Care – Community Mental health Teams (CMHT) • Support services for older people with Alzheimers is not included in mental
health services its included in older peoples mental health team.• Q) How is risk to individuals managed? Risk management of the
individual is part of the care planning process. It’s a contingency plan set out in the care plan. CMHTs will have regular case conferences to discuss key individuals who present a risk at that time to ensure case managers can address issues. Part of the care plan is about monitoring the individual and identifying triggers for relapse and these are passed onto relevant agencies who ar ein contact with the service user.
• Q) Is there a professional who manages each case? Yes, service user will have a care co-ordinator who will be a registered professional.
• The CMHTs work to the “Recovery Model” – this takes service users view ofwhat their priorities are and how the service user and professional can workwith them to get to that position. It includes things like includes familysupport, social networks, education, it takes account of everything.
• Q) The panel asked what the optimum case load was? – officers said there was no accurate data on case loads at the moment.
Slide 12 – Referral Pathways into Secondary Mental Health Services • Anyone can refer into secondary mental health services, including the family
and self referrals. All go to a single point of access.• The different routes into these mental health can be confusing and this is
being addressed through a single point of access and triage system.
Slide 13 – Secondary Care • 24 hour provision to access support• Assertive Outreach Team – this was developed because some people were
very complex and risky and needed to be assertively dealt with. The teampro-actively engages the service users to prevent deterioration. This teamhas low case loads.
Slide 14 – Secondary Care – CMHT Volume • People needing secondary care numbers have been static.• Local primary Mental Health Service has kept the mental health population
stable• Suicide rates have remained static across the time period in the table on this
slide
5
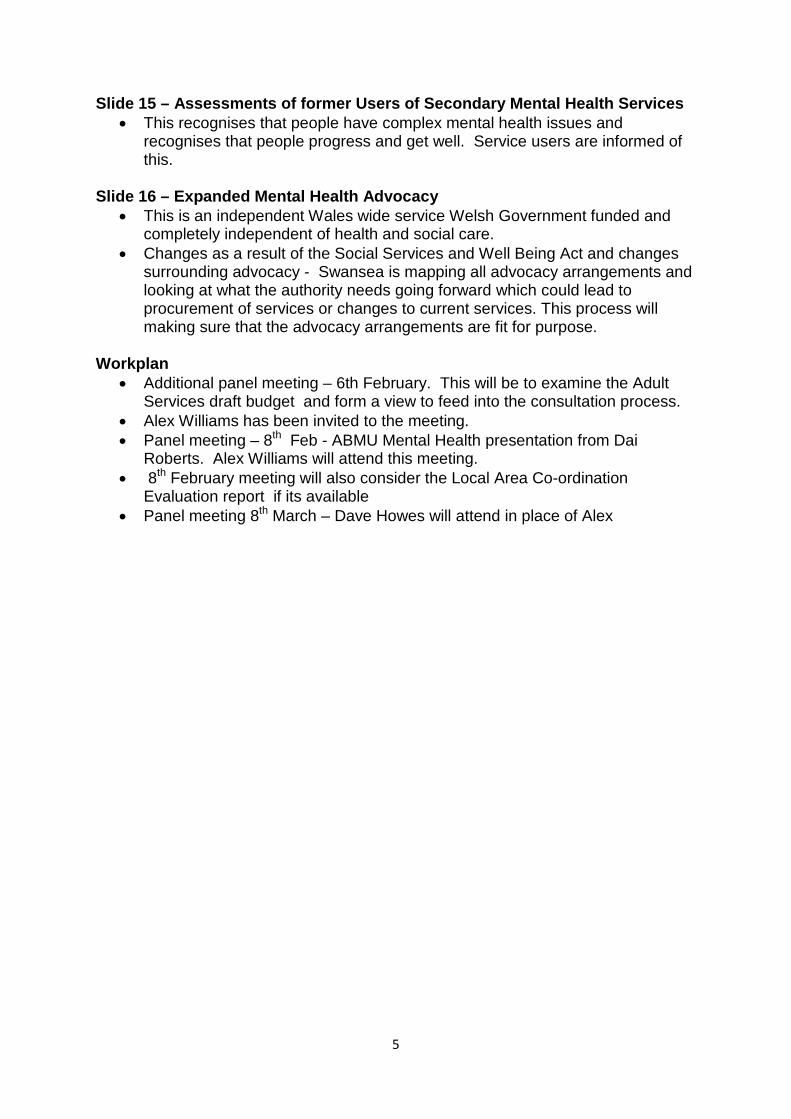
Slide 15 – Assessments of former Users of Secondary Mental Health Services • This recognises that people have complex mental health issues and
recognises that people progress and get well. Service users are informed ofthis.
Slide 16 – Expanded Mental Health Advocacy • This is an independent Wales wide service Welsh Government funded and
completely independent of health and social care.• Changes as a result of the Social Services and Well Being Act and changes
surrounding advocacy - Swansea is mapping all advocacy arrangements andlooking at what the authority needs going forward which could lead toprocurement of services or changes to current services. This process willmaking sure that the advocacy arrangements are fit for purpose.
Workplan • Additional panel meeting – 6th February. This will be to examine the Adult
Services draft budget and form a view to feed into the consultation process.• Alex Williams has been invited to the meeting.• Panel meeting – 8th Feb - ABMU Mental Health presentation from Dai
Roberts. Alex Williams will attend this meeting.• 8th February meeting will also consider the Local Area Co-ordination
Evaluation report if its available • Panel meeting 8th March – Dave Howes will attend in place of Alex

Adult Services Scrutiny Performance Panel Meeting Notes 8 February 2017
Attendees Peter Black (Convener), Uta Clay, Paxton Hood-Williams, Yvonne Jardine, Chris Holley, Jeff Jones, Sue Jones, Tony Beddow (co-optee)
SUMMARY
Agreed • Add ‘Review of Social Services Charges (Community Alarm) to workplan
Actions • Actions from January meeting to be checked / delivered• Presentation slides to be circulated to Panel• Dai Roberts to provide a briefing note covering the work of the strategic
commissioning group• Dai Roberts to provide details of suicides following redundancies• Dai Roberts to provide information about Gwalia specialist unit in Tumble• Dai Roberts to provide breakdown of 2 year one to one intervention waiting
times figures• Dai Roberts to share performance scorecard with Panel• Objective setting (8 March Meeting) – need to check this item with Steve
Rees
AGENDA ITEMS
Apologies • None
Notes of Meeting 11 January 2017 • Actions from January meeting to be checked / delivered
Presentation: Mental Health – ABMU Health Board Attending: Dai Roberts (ABMU), Malcolm Jones (ABMU), Mark Campesi (CCS)
Discussion points (see presentation slides)
• Mental health service has £100m turnover – does not include CAMHS• Services for Mental health / learning disability services are locality based• Veteran services are a day service for trauma based in Orchard Street• ‘Part One service’ relates to Social Services Act – requires creation of primary
mental health services• Treatment (of MT??) is 88% currently (80% required)• Monthly fluctuation in demand probably linked to GP referrals• Performance reports are provided quarterly• Everyone in secondary care has a care plan – drawn up with service user,
supported by Mental Health team• There is an audit team that monitors the care plans

• There are a range of opportunities to access the teams – we offer follow upsfor those who don’t turn up
• 100% of service users receive care plans – this is not reflected in selfreporting by service users
• Unknown whether there is a higher prevalence of mental health issues amongpeople with learning difficulties (general population figure is one in four)
• A new mental health strategy is being produced next year with fullengagement of service users
• Mental health and community support teams are co-located in multidisciplinary teams
• Co-location benefits the public as information can be shared betweenprofessionals more rapidly
• Strategic commissioning group for western bay area helps us to manage themarket
• Six month pilot in Bridgend has been set up to help reduce waiting times• Urgent treatment is provided promptly• Costs of pathways are split between health and council• Dai Roberts to provide a briefing note covering the work of the strategic
commissioning group• Homelessness nurse only operates in Swansea – not NPT or Bridgend• In terms of dual diagnosis legal highs are a particular issue for the under 25s
and alcohol for the over 40s• Transition link to CAMHS is critical – we are working on a protocol to make
the transition more robust• The loss rate from CAMHS is not known• We are concerned about the quality of some CAMHS provison and looking at
the potential of different models• Some areas have higher incidences of mental health issues – poor housing,
education, family break up etc all linked• Care plans cover the transition from CAMHS• There are opportunities to modernise the service for older people• The level of learning difficulty in-patient beds is too high compared with other
areas – commissioning board is working on this• Demand for talking therapy is high and can mean long waiting times• Making links to employer occupational health services is a challenge• Dai Roberts to provide details of suicides following redundancies• Numbers of longer term hospital residents is significantly lower than used to
be• Dai Roberts to provide breakdown of 2 year one to one intervention waiting
times figures• Dai Roberts to provide information about Gwalia specialist unit in Tumble• The service has a scorecard with dozens of performance indicators• Dai Roberts to share performance scorecard with Panel
Workplan • Objective setting (8 March Meeting) – need to check this item with Steve
Rees• Add ‘Review of Social Services Charges (Community Alarm) to workplan
Overview & Scrutiny / Trosolwg a chraffu
City and County of Swansea / Dinas a Sir Abertawe Civic Centre, Swansea, SA1 3SN / Canolfan Ddinesig, Abertawe, SA1 3SN
C I T Y A N D C O U N T Y O F S W A N S E A———————————————————————————————————————————————
Dinas A Sir Abertawe
Dear Councillor Stewart and Councillor Lloyd,
As you may know the Scrutiny Panel overseeing Adult Social Care has spent considerable time seeking to understand the budgetary and performance information currently available to the Council, and to relate these to the corporate processes by which the objectives of key people are set and monitored in these areas. Good progress is being made and the Panel has arranged for its meeting on 8th March to explore in depth how performance management processes operate in both setting and then monitoring key objectives.
We seek your help to identify an officer or officers to invite to the March meeting to help us understand how the performance management / objectives setting processes in adult social care operate.
We think Panel members could gain a good insight into the performance linkages operating between the Cabinet / Council, the Chief Executive, the Director of People, senior Adult Social Care officers, and any other officers in other departments who might need to be involved if the following "givens" were taken as exemplary aims for the performance management process to take on board. I stress these hypothetical examples are chosen simply to help us understand how the different political and managerial levels would respond to the issues raised; they do not foreshadow any emerging proposals from the Panel.
Councillors R. Stewart, Leader of the Council and C. Lloyd, Cabinet Member, Transformation & Performance
Civic Centre Oystermouth Road SWANSEA SA1 3SN
Please ask for: Gofynnwch am:
Overview & Scrutiny
Direct Line: Llinell Uniongyrochol:
01792 637491
e-Mail e-Bost:
Our Ref Ein Cyf:
Adult Services/05
Your Ref Eich Cyf:
Date Dyddiad:
11/01/2017
Summary: This is a letter from the Adult Services Scrutiny Performance Panel to The Leader of the Council and Cabinet Member for Transformation and Performance. It is about the linkages between the budget and performance management objectives.
Item 3

Overview & Scrutiny / Trosolwg a chraffu
City and County of Swansea / Dinas a Sir Abertawe Civic Centre, Swansea, SA1 3SN / Canolfan Ddinesig, Abertawe, SA1 3SN
Given 1. Cabinet decides that budgetary pressures and forecasting data, require activity levels in adult social care to be adjusted in the following ways during 17/18 when compared with 16/17 outturn: a) the numbers receiving domiciliary care from in house services shouldincrease by 15% b) the numbers getting domiciliary care from external providers shouldreduced by 10% c) the numbers supported by the local authority in residential care settingsshould be held at the level supported in 2015/16.
Given 2. Cabinet decides that it needs by September 2017, (for implementing in 18/19 if agreed) costed proposals setting out how the intake team and all hospital based social care staff could move to either a Wednesday to Sunday service or to a six day per week service including Saturday, in order to begin the process of providing a service covering the week end.
Given 3. In respect of delivering a) housing adaptations and b) re-housing hospitalised Swansea residents who are ready for discharge but cannot return to their own homes, Cabinet wishes to achieve a target time of four weeks from notification of the need for housing action to the actual provision of those services.
Yours sincerely
UTA CLAY CONVENERADULT SERVICES SCRUTINY PANEL
CLLR [email protected]


Item No. 4
Report of the Cabinet Member for Adults and Vulnerable People
Adult Services Scrutiny Performance Panel – 8th March 2017
ADULT SERVICES PERFORMANCE FRAMEWORK
Purpose • The purpose of this report is to present the AdultServices Performance Framework.
Content • The Performance Framework is designed to monitorperformance across Adult Services.
• This is the second time that such a report has beenpresented to the Adult Services ScrutinyPerformance Panel. The report has been developedon the basis of the feedback provided by the Paneland there is now a summary page towards thebeginning of the report which highlights key areasthat Members may be interested in within the report.
• However, monitoring performance in this way is stillvery much work in progress and there are severalareas for future development towards the end of thereport.
• The report demonstrates the areas of business thatare performing well and less well, and is designed tobe an operational tool to help continually improveservice quality and delivery.
• Similarly to the Performance Framework that Childand Family has developed over the years, it isanticipated that the Framework will be an evolvingdocument.
Councillors are being asked to
• Consider the Report
Lead Councillor(s)
Cabinet Member for Adults and Vulnerable People
Lead Officer(s) Alex Williams, Head of Adult Services
Report Author Alex Williams [email protected] 01792 636249

Final
Version Status: Final 1 Version Date: 1 March 2017
ADULT SERVICES SUMMARY MANAGEMENT INFORMATION REPORT
JANUARY 2017
Adult Services Challenge Session Reports Prepared by
Performance Coordinators:
Compiled by Performance and Information Manager
John Grenfell
Contents
Version Status: Final 2 Version Date: 1 March 2017
Contents Summary of Expectations, Standards & Performance ........................................ 3
Common Access Point (CAP) ............................................................................... 5
Local Area Co-ordination .................................................................................. 10
Delayed Transfers of Care ................................................................................. 11
Waiting for Package of Care in Hospital ............................................................ 14
Assessment and Care Management ................................................................. 16
Integrated Social Care and Health Services ....................................................... 17
Assessment and Care Management: Mental Health ......................................... 24
Community Re-ablement .................................................................................. 26
Residential Reablement .................................................................................... 30
Residential / Nursing Care for Older People ..................................................... 33
Temporary Admissions to Residential / Nursing Care ....................................... 35
Long-Term Domiciliary Care ............................................................................. 39
Day Services for Older People ........................................................................... 43
Safeguarding Vulnerable Adults ....................................................................... 44
Deprivation of Liberty Safeguards (DoLS) ......................................................... 48
Planned Future Developments to this Report ................................................... 50
Appendix A: Performance Indicators ................................................................ 51
Appendix B: Performance Indicators: Numerators and Denominators ............. 53

Key Expectations, Standards & Performance
Version Status: Final 3 Version Date: 1 March 2017
Summary of Expectations, Standards & Performance Throughout this report, each series of information is prefaced by a brief summary
of any national or local performance indicators and performance against those.
For subjects where there are no indicators or indicators that do not assist the
reader to evaluate performance, we have provided some commentary to assist the
reader.
Additional commentary is provided throughout the text.
Common Access Point (CAP) We continue to deal with a large volume of requests for support via the Common
Access Point (p.6). We have been successful in improving the number of people
being dealt with at the CAP by means of information, advice and assistance (p.7).
We have been trialling a Multi-Disciplinary Team (MDT) approach to triaging
incoming requests for support (p.8). We believe that the MDT approach is helping
to prevent unnecessary assessments and we would like to improve its coverage.
We will need to improve our recording arrangements for Third Sector Broker
activities to develop stronger intelligence on our use of the third sector to support
the population (p.8).
Local Area Co-ordination (LAC) Gaps in recent recordings mean that we will need to work with the LAC Team to
ensure that they are recording their activities accurately. Our performance team
will assist with this in the coming months (p.10).
Delayed Transfers of Care We have been able to support our NHS Hospital colleagues this winter by
continuing to focus on ensuring the pathway home from hospital is as speedy as
possible and social care related delays are minimised (p.11).
We continue to meet the performance target set for this financial year (p.11).
Assessment and Care Management We are aware that enquiry-handling, assessment and care management practice
across the department is in need of some refreshment and renewal. In particular,
we need to review our approach to assessment to ensure it fits with the Social
Services and Well-Being Act, and that we can ensure that we have effective
reviewing arrangements to help people to remain independent. We will be
developing a practice framework for social work during 2017/18 and we will be
carrying out a range of data cleansing and analysis activities at the same time.
Integrated Health and Social Care Services
Activity continues to be sustained (pp. 18-22)and most teams are achieving better
than an average of 30 days for completing assessments of need (p. 22)
Mental Health
The service continues to provide assessment for those requiring mental health
support (pp. 24-25)
Community Reablement: The service has met both locally –set targets against new national performance
indicators (p.26).
There have been some improvements in the effectiveness of the community
reablement service during the year (p. 28-29) but the evidence is incomplete.
More work is needed to ensure that all outcomes are recorded correctly by the
teams.
Residential Reablement There has been sustained improvement in the effectiveness of the residential
reablement service since it strengthened its acceptance criteria in Autumn 2015
(p.30, p.32)
Permanent Residential / Nursing Care While we have been able to reduce further the number of people who are
supported in residential care at a point in time (p.33), we continue to see
admissions running at a higher level than we would like (p.34). We have therefore
introduced a Panel to test and challenge decisions made about new and
temporary placements into residential and nursing care, and will need to monitor
whether these arrangements help to reduce admissions overall.
Temporary Placements to Residential / Nursing Care We have started to explore this area of work and an initial analysis is presented
here (pp. 35-38). Through the Panel arrangements, temporary placements can
now only be made for a maximum of two weeks.
Key Expectations, Standards & Performance
Version Status: Final 4 Version Date: 1 March 2017
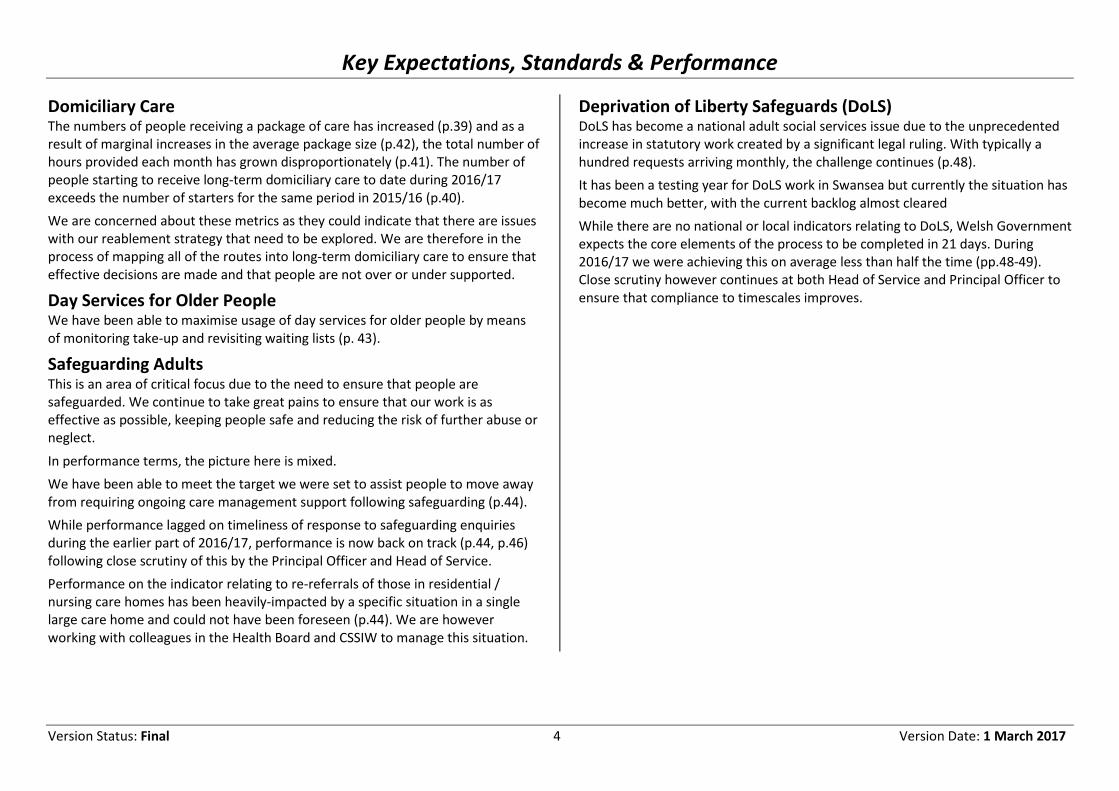
Domiciliary Care The numbers of people receiving a package of care has increased (p.39) and as a
result of marginal increases in the average package size (p.42), the total number of
hours provided each month has grown disproportionately (p.41). The number of
people starting to receive long-term domiciliary care to date during 2016/17
exceeds the number of starters for the same period in 2015/16 (p.40).
We are concerned about these metrics as they could indicate that there are issues
with our reablement strategy that need to be explored. We are therefore in the
process of mapping all of the routes into long-term domiciliary care to ensure that
effective decisions are made and that people are not over or under supported.
Day Services for Older People We have been able to maximise usage of day services for older people by means
of monitoring take-up and revisiting waiting lists (p. 43).
Safeguarding Adults This is an area of critical focus due to the need to ensure that people are
safeguarded. We continue to take great pains to ensure that our work is as
effective as possible, keeping people safe and reducing the risk of further abuse or
neglect.
In performance terms, the picture here is mixed.
We have been able to meet the target we were set to assist people to move away
from requiring ongoing care management support following safeguarding (p.44).
While performance lagged on timeliness of response to safeguarding enquiries
during the earlier part of 2016/17, performance is now back on track (p.44, p.46)
following close scrutiny of this by the Principal Officer and Head of Service.
Performance on the indicator relating to re-referrals of those in residential /
nursing care homes has been heavily-impacted by a specific situation in a single
large care home and could not have been foreseen (p.44). We are however
working with colleagues in the Health Board and CSSIW to manage this situation.
Deprivation of Liberty Safeguards (DoLS) DoLS has become a national adult social services issue due to the unprecedented
increase in statutory work created by a significant legal ruling. With typically a
hundred requests arriving monthly, the challenge continues (p.48).
It has been a testing year for DoLS work in Swansea but currently the situation has
become much better, with the current backlog almost cleared
While there are no national or local indicators relating to DoLS, Welsh Government
expects the core elements of the process to be completed in 21 days. During
2016/17 we were achieving this on average less than half the time (pp.48-49).
Close scrutiny however continues at both Head of Service and Principal Officer to
ensure that compliance to timescales improves.
Common Access Point (CAP)
Version Status: Final 5 Version Date: 1 March 2017
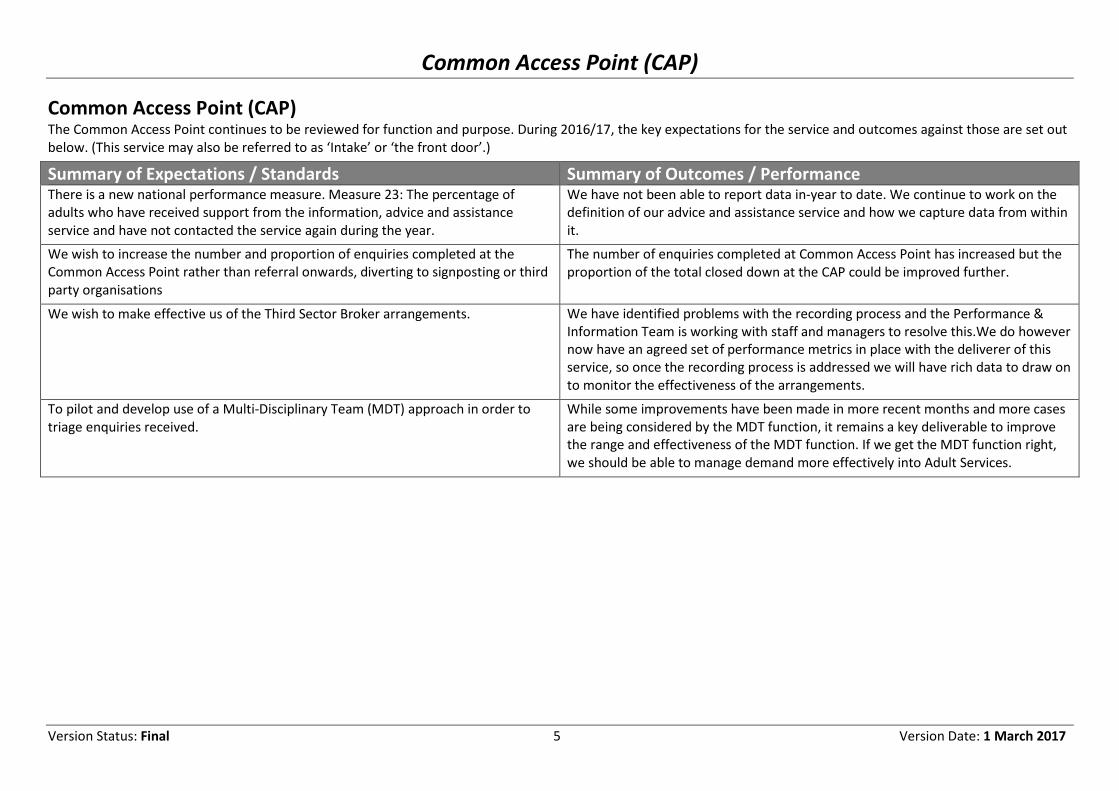
Common Access Point (CAP) The Common Access Point continues to be reviewed for function and purpose. During 2016/17, the key expectations for the service and outcomes against those are set out
below. (This service may also be referred to as ‘Intake’ or ‘the front door’.)
Summary of Expectations / Standards Summary of Outcomes / Performance There is a new national performance measure. Measure 23: The percentage of
adults who have received support from the information, advice and assistance
service and have not contacted the service again during the year.
We have not been able to report data in-year to date. We continue to work on the
definition of our advice and assistance service and how we capture data from within
it.
We wish to increase the number and proportion of enquiries completed at the
Common Access Point rather than referral onwards, diverting to signposting or third
party organisations
The number of enquiries completed at Common Access Point has increased but the
proportion of the total closed down at the CAP could be improved further.
We wish to make effective us of the Third Sector Broker arrangements. We have identified problems with the recording process and the Performance &
Information Team is working with staff and managers to resolve this.We do however
now have an agreed set of performance metrics in place with the deliverer of this
service, so once the recording process is addressed we will have rich data to draw on
to monitor the effectiveness of the arrangements.
To pilot and develop use of a Multi-Disciplinary Team (MDT) approach in order to
triage enquiries received.
While some improvements have been made in more recent months and more cases
are being considered by the MDT function, it remains a key deliverable to improve
the range and effectiveness of the MDT function. If we get the MDT function right,
we should be able to manage demand more effectively into Adult Services.

Common Access Point (CAP)
Version Status: Final 6 Version Date: 1 March 2017
1206,
11.2%
9526,
88.8%
Enquiries Processed Via Common
Access Point 2016-17
Complete at Common Access Point
Enquiries transferred from Common Access Point
Volume of Demand To date during 2016/17, 89% of enquiries were processed via the CAP are passed through to other teams. 11% of enquiries are completed at CAP.
989936 908
847939
992 997 983
826
1,109
138
119111
108
104
141 14399
120
123
500
600
700
800
900
1000
1100
1200
1300
Apr-16 May-16 Jun-16 Jul-16 Aug-16 Sep-16 Oct-16 Nov-16 Dec-16 Jan-17
Enquiries Processed Via Common Access Point 2016-17
Enquiries transferred from Common Access Point Complete at Common Access Point
What is working well? What are we worried about? What are we going to do? The number of enquiries appears to be relatively
constant, suggesting relative stability in the amount of
work coming through.
September and October saw larger numbers of
enquiries dealt with at CAP,
Over time we would like to see higher numbers dealt
with at CAP but this will be dependent on development
of effective universal and community services to
signpost to as well as development of the overall
information, advice and assistance offer across the
Council.
Continue to work with Team Manager to improve
recording of activity within CAP.
January 2017 saw considerably higher numbers of
enquiries processed.
Staff within CAP have identified a large number of
enquiries created at the request of members of staff
within the Hub Teams.
This is being investigated as a potential process issue: It
appears agreed rules for use of Paris are not being
followed.

Common Access Point (CAP)
Version Status: Final 7 Version Date: 1 March 2017
820,
68.3%
380,
31.7%
Enquires Completed at Common
Access Point 2016-17
ADVICE/INFORMATION SIGNPOSTED
Apr-16May-
16Jun-16 Jul-16 Aug-16 Sep-16 Oct-16
Nov-
16Dec-16 Jan-17
SIGNPOSTED 36 31 21 29 32 51 44 44 23 40
ADVICE/INFORMATION 89 72 72 78 70 90 99 76 80 94
8972 72 78 70
90 9976 80
94
36
31 2129
32
5144
4423
40
0
20
40
60
80
100
120
140
160Enquiries Completed
at Common Access
Point 2016-17
Enquiries Completed at the Common Access Point To date during 2016/17, over two-thirds of enquiries completed at CAP were for information / advice only. 32% were signposted. There were an additional 6 enquiries
during the first few months of the year that are not reported as those function have since been relocated away from CAP.
What is working well? What are we worried about? What are we going to do? The number of enquiries completed at intake appears
to be relatively constant, suggesting relative stability in
the amount of work coming through.
We are aware of issues in recording the complexity of
working with preventative services (Local Area Co-
ordination, Independent Living). There is a need to
clarify what is ‘signposting’.
The Performance Team will be monitoring the
information being recorded and we will be making
recommendations to CAP Team Manager.
DFG requests are no longer completed in CAP and are
passed directly into the Integrated Community Hubs for
appropriate assessment.
Not applicable. No further action required.

Common Access Point (CAP)
Version Status: Final 8 Version Date: 1 March 2017
Destination of Enquiries Initiated at the Common Access Point
Enquiries Processed Via Common
Access Point 2016-17Apr-16 May-16 Jun-16 Jul-16 Aug-16 Sep-16 Oct-16 Nov-16 Dec-16 Jan-17 2016-17 % of total
Complete at Common Access Point 138 119 111 108 104 141 143 99 120 123 1,206 11.2%
Integrated community health teams 343 415 424 388 419 476 395 417 371 501 4,149 38.7%
Safeguarding 284 225 199 184 268 247 273 256 213 233 2,382 22.2%
Social Work teams 240 237 227 214 201 203 202 195 145 278 2,142 20.0%
MDT 110 46 52 54 50 58 125 111 89 89 784 7.3%
Third Sector Broker 12 13 6 4 - 5 2 4 6 7 59 0.5%
EDT - - - 2 - 1 - - 1 - 4 0.0%
Secure Estate - - - 1 1 2 - - 1 1 6 0.1%
Total Referrals Completed 1,127 1,055 1,019 955 1,043 1,133 1,140 1,082 946 1,232 10,732 100%
Note: we continue to work on ways of summarising this data and as such there is a lack of complete alignment with the later data provided on referrals. Note also that this
data refers to enquiries and not the number of individuals to whom an enquiry relates. In practice, the way we work can result in multiple enquiries for an individual.
‘Integrated community health teams’ refers to OTs, physios and
specialist NHS community health disciplines provided within the
Hubs. The 4,149 break down roughly as 1,500 OT enquiries, 800
physio enquiries, 1,800 specialist community health and the
remainder additional specialist referrals. During 2016/17 to
January 2017, they received 38.7% of enquiries received at CAP.
‘Social work teams’ refers to social work services provided
within the Hubs. They received 20% of enquiries received at the
CAP. A small number of learning disability referrals (dozens)
may also be included here.
22.2% of referrals related to safeguarding and were distributed
appropriately across all teams.
1,206
4,149
2,382 2,142
784
59 4 6 -
500
1,000
1,500
2,000
2,500
3,000
3,500
4,000
4,500
Complete at
Common
Access Point
Integrated
community
health teams
Safeguarding Social Work
teams
MDT Third Sector
Broker
EDT Secure Estate
Destination of Enquiry at Common Access Point
April 2016 - January 2017

Common Access Point (CAP)
Version Status: Final 9 Version Date: 1 March 2017
What is working well? What are we worried about? What are we going to do? Increased referrals to the Multi-Disciplinary Team
(MDT) arrangement from October onwards. The MDT
carries out proportionate triage in order to divert or
establish need for further assessment
The MDT arrangements have taken some time to
develop and has not been staffed consistently.
New arrangements have been proposed to strengthen
the MDT approach.
Assistant Team Manager carrying out quality assurance
checks on a sample of referrals to establish whether
they were handled / recorded correctly.
The anticipated high number of safeguarding referrals
was processed due to the anniversary of the relevant
court judgment that drove up DOLS referrals.
There was an increased number of safeguarding
referrals in the period August – October but this did not
continue. This was due to specific issues relating to a
particular residential home; a pro-active plan is in place
with CSSIW and the Health Board to address these
issues.
No further action required.
We are able to record 3rd
sector broker referrals if the
relevant Paris process is followed.
Third sector broker referrals have resumed in
September 2016
Nil return for August reflects absence of 3rd
sector
broker.
Performance management staff are working with the
service to develop appropriate recording processes to
support Third Sector Broker activity.

Prevention & Early Intervention
Version Status: Final 10 Version Date: 1 March 2017
Local Area Co-ordination (LAC)
Summary of Expectations / Standards Summary of Outcomes / Performance Local performance indicator SUSC5 sets a target of 35 new introductions to the
service each quarter
This target has been met for each quarter. The Performance & Information Team has
identified some recording issues in recent months which will be addressed.
Requests for Local Area Co-ordination and Main Presenting Issues
126
48
36
29
13
12
9
51
Isolation
Mental Health
Not known / required
Needs Advice
Older Age
Physical Difficulties
Financial Issues
Other
0 20 40 60 80 100 120 140
Main Presenting Issues - Local Area Co-ordination
(July 2015 - January 2017)
15
12
27
20
15
16
13
20 19
11
18
21
14
21
28
31
4
6
13
0
5
10
15
20
25
30
35
Jul 1
5
Au
g 1
5
Sep
15
Oct 1
5
No
v 15
De
c 15
Jan
16
Feb
16
Ma
r 16
Ap
r 16
Ma
y 16
Jun
16
Jul 1
6
Au
g 1
6
Sep
16
Oct 1
6
No
v 16
De
c 16
Jan
17
Introductions to Local Area Coordination July 2015 -
January 2017
‘Other’ includes categories of less than 10 introduction reasons in the period, including Child and Family, Housing, Carer, Community Tension, Drug and Alcohol, Learning
Difficulties, Benefits, Dementia, Social Contacts, Domestic Violence and Employment.
What is working well? What are we worried about? What are we going to do? There is a basic database in operation to capture
information about the people who come forward or are
referred to the team.
There is a need for further development of the
recording process and system. The reduced number of
recorded introductions in Q3 and beyond appears to be
a recording problem.
A plan will be prepared to make the necessary changes
to working practice and systems.
Delayed Transfers of Care
Version Status: Final 11 Version Date: 1 March 2017
Delayed Transfers of Care
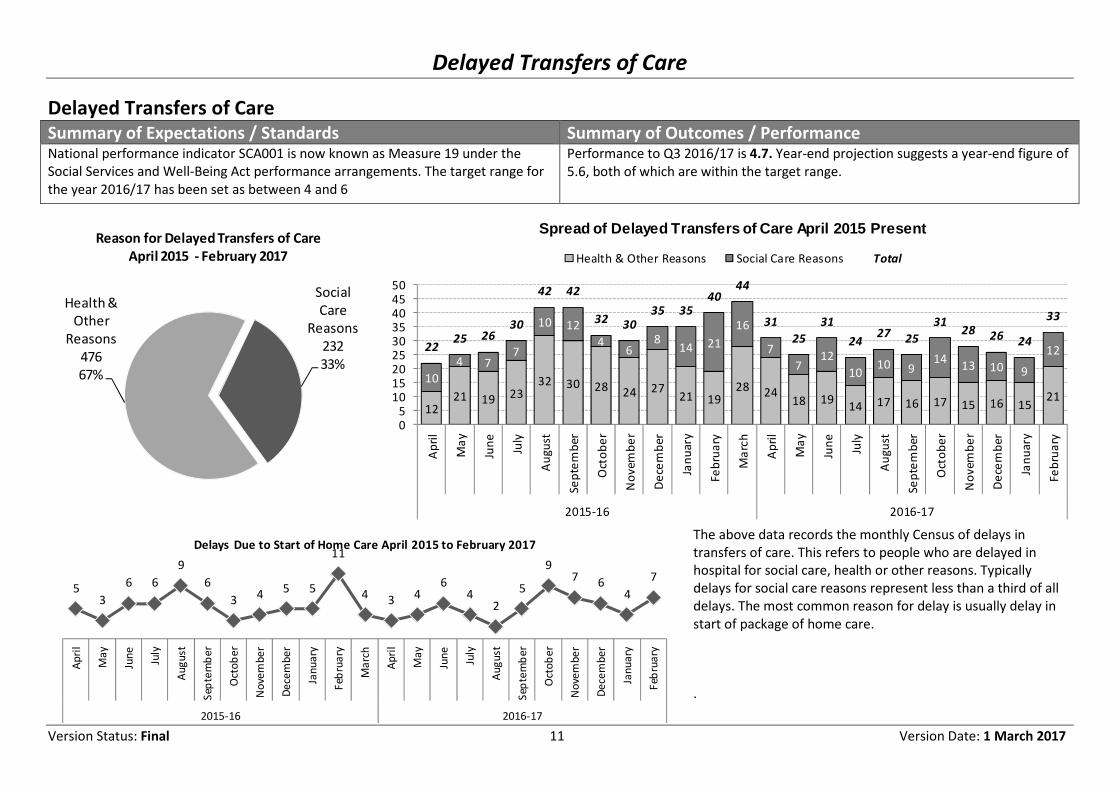
Summary of Expectations / Standards Summary of Outcomes / Performance National performance indicator SCA001 is now known as Measure 19 under the
Social Services and Well-Being Act performance arrangements. The target range for
the year 2016/17 has been set as between 4 and 6
Performance to Q3 2016/17 is 4.7. Year-end projection suggests a year-end figure of
5.6, both of which are within the target range.
The above data records the monthly Census of delays in
transfers of care. This refers to people who are delayed in
hospital for social care, health or other reasons. Typically
delays for social care reasons represent less than a third of all
delays. The most common reason for delay is usually delay in
start of package of home care.
.
1221 19 23
32 30 28 24 2721 19
28 2418 19
14 17 16 17 15 16 1521
10
4 77
10 12
46
814 21
16
7
712
1010 9
1413 10 9
122225 26
30
42 42
32 3035 35
4044
31
25
31
2427 25
3128 26 24
33
05
101520253035404550
Ap
ril
Ma
y
Jun
e
July
Au
gu
st
Se
pte
mb
er
Oct
ob
er
No
ve
mb
er
De
cem
be
r
Jan
ua
ry
Fe
bru
ary
Ma
rch
Ap
ril
Ma
y
Jun
e
July
Au
gu
st
Se
pte
mb
er
Oct
ob
er
No
ve
mb
er
De
cem
be
r
Jan
ua
ry
Fe
bru
ary
2015-16 2016-17
Spread of Delayed Transfers of Care April 2015 Present
Health & Other Reasons Social Care Reasons Total
Health &
Other
Reasons
476
67%
Social
Care
Reasons
232
33%
Reason for Delayed Transfers of Care
April 2015 - February 2017
53
6 6
9
6
3 45 5
11
4 3 46
42
5
97 6
4
7
Ap
ril
Ma
y
Jun
e
July
Au
gu
st
Sep
tem
be
r
Oct
ob
er
No
vem
be
r
De
cem
be
r
Jan
ua
ry
Feb
rua
ry
Ma
rch
Ap
ril
Ma
y
Jun
e
July
Au
gu
st
Sep
tem
be
r
Oct
ob
er
No
vem
be
r
De
cem
be
r
Jan
ua
ry
Feb
rua
ry
2015-16 2016-17
Delays Due to Start of Home Care April 2015 to February 2017

Delayed Transfers of Care
Version Status: Final 12 Version Date: 1 March 2017
Reasons for Delay and Associated Monthly Averages
The above data shows that of the 232 delays for social care reasons recorded at
Census day since April 2015, the most common reason delays in arranging an
appropriate package of care to support a person in their own home with 132 (or 57%). There is an average of 5.7 delays a month for this reason. Around 12% of delays
relate to delays in arranging for residential / nursing placements to be made, with an average of 1.2 for this reason each month.
Delays due to incomplete assessment are infrequent, with only 5 recorded in 20 months. Typically an average of 1.2 people a month are delayed for reasons of incomplete
admissions to residential care and a further average 1 person delayed for social care funding reasons (not necessarily for residential care).
See also the section below ‘Waiting for Package of Care in Hospital’.
Awaiting
completion of
assessment
5
2%
Housing-related
16
7%
Home adaptation
/ equipment
24
10%
Home Care
Provision
132
57%
Residential /
Nursing Care
27
12%
Capacity issues
6
3%
Funding Issues
22
9%
Main Social Care Delay Reasons
(April 2015 - February 2017)
0.2
0.7
1.0
5.7
1.2
0.3
1.0
- 1.0 2.0 3.0 4.0 5.0 6.0 7.0
Awaiting completion of assessment
Housing-related
Home adaptation / equipment
Home Care Provision
Residential / Nursing Care
Capacity issues
Funding Issues
Average Social Care Delays per Month by Delay Reason
(April 2015 - February 2017)
Delayed Transfers of Care
Version Status: Final 13 Version Date: 1 March 2017
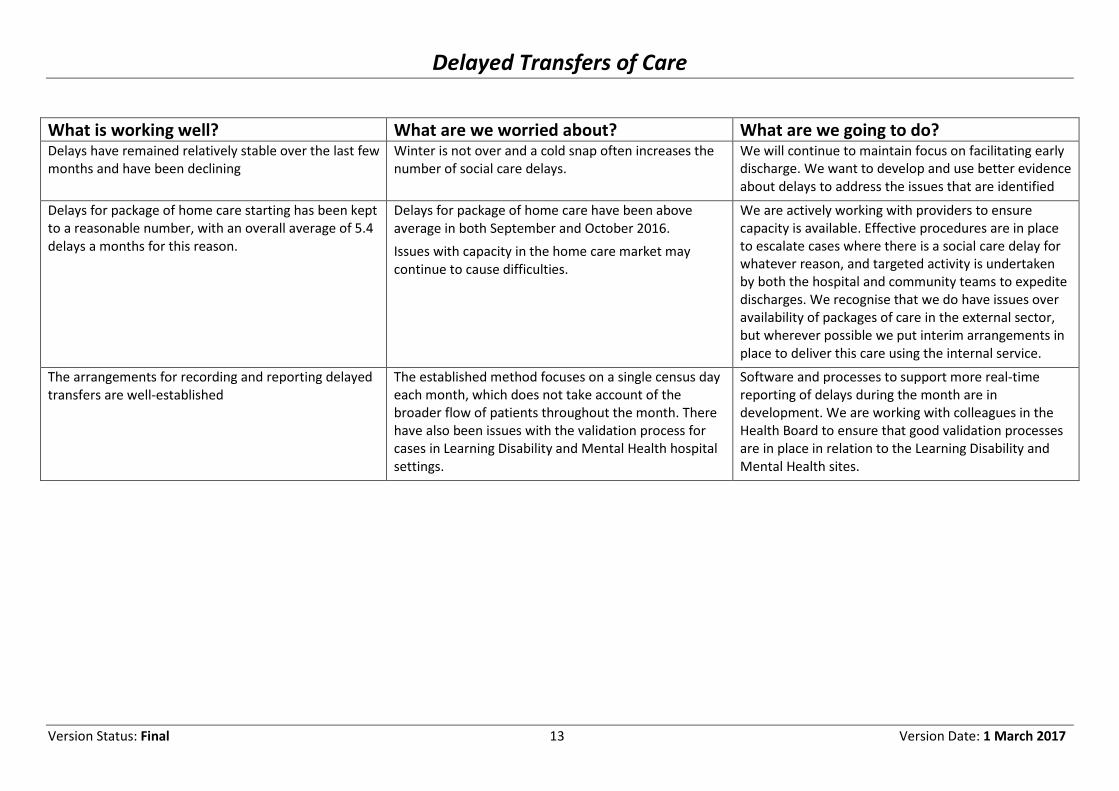
What is working well? What are we worried about? What are we going to do? Delays have remained relatively stable over the last few
months and have been declining
Winter is not over and a cold snap often increases the
number of social care delays.
We will continue to maintain focus on facilitating early
discharge. We want to develop and use better evidence
about delays to address the issues that are identified
Delays for package of home care starting has been kept
to a reasonable number, with an overall average of 5.4
delays a months for this reason.
Delays for package of home care have been above
average in both September and October 2016.
Issues with capacity in the home care market may
continue to cause difficulties.
We are actively working with providers to ensure
capacity is available. Effective procedures are in place
to escalate cases where there is a social care delay for
whatever reason, and targeted activity is undertaken
by both the hospital and community teams to expedite
discharges. We recognise that we do have issues over
availability of packages of care in the external sector,
but wherever possible we put interim arrangements in
place to deliver this care using the internal service.
The arrangements for recording and reporting delayed
transfers are well-established
The established method focuses on a single census day
each month, which does not take account of the
broader flow of patients throughout the month. There
have also been issues with the validation process for
cases in Learning Disability and Mental Health hospital
settings.
Software and processes to support more real-time
reporting of delays during the month are in
development. We are working with colleagues in the
Health Board to ensure that good validation processes
are in place in relation to the Learning Disability and
Mental Health sites.

Delayed Transfers of Care
Version Status: Final 14 Version Date: 1 March 2017
Waiting for Package of Care in Hospital The Team Leader of the Hospital Social Work service has been gathering
data throughout 2016 and we reproduce some of this data.
The reader should be aware of the following significant cautions in
reading this information:-
• It has been difficult to obtain all the data due to the need to create both
more effective systems and enhanced administrative capacity to
maintain the data collection in a fast-moving environment. As such
there is no complete record of all activity for the period.
• The data shown here therefore provides a sample of the data available
but it is not known how representative this sample is.
• The data is related to the delayed transfers of care information but is
not based on the same criteria because it includes preparations for
people not yet medically fit. As such the numbers of people awaiting a
POC in this data is larger and should not be directly cross-referenced
with DToC figures.
It should also be noted that the same person can be included in more than
one column while awaiting care (see next page for delay length data). The
graph to the left shows the numbers of people discharged in the same
week as the above delays were recorded.
The numbers of delays cancelled illustrate another issue that is not obvious
in the context of delayed transfers, which is that of relapse: considerable
work can be expended on arranging a package of care for a person who
then subsequently becomes more unwell and whose discharge is then
cancelled.
Together the graphs on these pages show some changes over time, such as
improvements to the flow through community reablement since late
Spring 2016, and improvements in numbers discharged per week since
Summer 2016.
1713 12 11
19 1721 19
13
23
138
1517
12
21 5
1
2 4
5
2
4
3
3230
24
32
24
18
23 24
18
25
17
11
0
5
10
15
20
25
30
35
Sampled Awaiting Package of Care (POC) in Hospital
Awaiting Long-term Package Awaiting Community Reablement
Total waiting POC
6
19
31
16 17
8 9 813
1915
1
1
2
3 3
6 3 0
1
0
0
0
5
10
15
20
25
30
35
Discharged Discharge Cancelled

Delayed Transfers of Care
Version Status: Final 15 Version Date: 1 March 2017
How long are people waiting
in hospital for a package of
care? The chart opposite shows how long
people have been waiting for a
package of care to be arranged.
On most occasions, more than half of
those waiting have been waiting for
under two weeks.
In some months there have been
instances where people have been
waiting over four weeks. It is possible
that some of these have previously
had a discharge cancelled.
What is working well? What are we worried about? What are we going to do? Overall total number of delays appears to be dropping over time.
Improvements to flow into community reablement have taken place,
reducing delays for that reason. Significant work has also been undertaken
to put interim arrangements in place using internal services if support
from the external sector is not readily available.
Structural issues and provider failure
within the market have and can
continue to cause fluctuations in
response times.
Cabinet will be considering the outcome of the
Domiciliary Care Commissioning Review at its
meeting of 20th
April, which will include a
recommendation to recommission external
provision.
11
Dece
mber
2015
08
Janua
ry
2016
05
Febru
ary
2016
25
Marc
h
2016
21
April
2016
27
May
2016
02
June
2016
22
July
2016
09
Septe
mber
2016
07
Octo
ber
2016
17
Nove
mber
2016
24
Nove
mber
2016
Over 4 Weeks 4 6 2 2 5 7 5 8 1 6 5 2
3-4 Weeks 1 9 2 4 0 1 2 2 4 1 0 1
2-3 Weeks 6 5 8 2 2 3 1 1 2 5 1 0
1-2 Weeks 5 0 13 10 16 6 8 7 5 7 2 5
Waiting less than a Week 12 12 5 6 9 7 2 1 6 6 9 3
All Waiting 28 32 30 24 32 24 18 19 18 25 17 11
12 12
5 69
7
2 1
6 69
3
5
0 13 10
16
6
87
57 2
5
4
6 2
2
5
7
5 8
1
6
5
2
28
32
30
24
32
24
1819
18
25
17
11
0
5
10
15
20
25
30
35Over 4 Weeks
3-4 Weeks
2-3 Weeks
1-2 Weeks
Waiting less than a
Week
All Waiting
Assessment & Care Management
Version Status: Final 16 Version Date: 1 March 2017
Assessment and Care Management All the data provided here comes from Paris and various elements of terminology have been translated in order to assist in explaining how the data is being represented.
Safeguarding referrals and assessments are dealt with in a later section of this document.
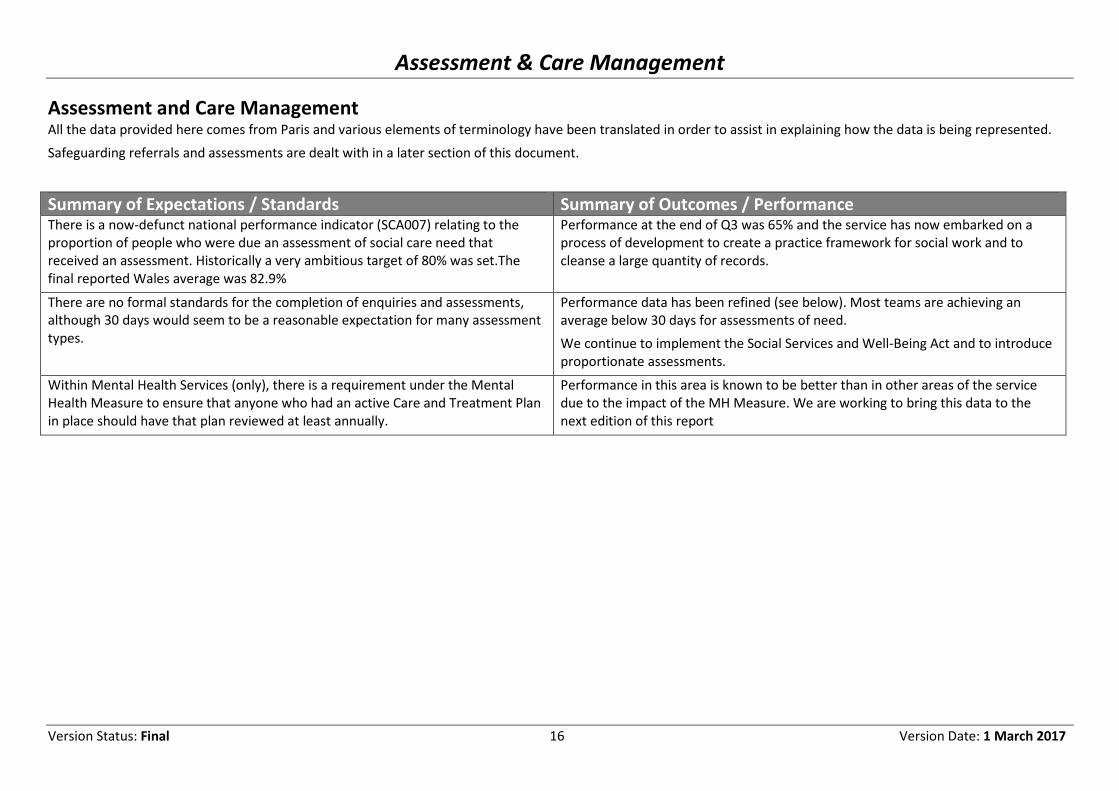
Summary of Expectations / Standards Summary of Outcomes / Performance There is a now-defunct national performance indicator (SCA007) relating to the
proportion of people who were due an assessment of social care need that
received an assessment. Historically a very ambitious target of 80% was set.The
final reported Wales average was 82.9%
Performance at the end of Q3 was 65% and the service has now embarked on a
process of development to create a practice framework for social work and to
cleanse a large quantity of records.
There are no formal standards for the completion of enquiries and assessments,
although 30 days would seem to be a reasonable expectation for many assessment
types.
Performance data has been refined (see below). Most teams are achieving an
average below 30 days for assessments of need.
We continue to implement the Social Services and Well-Being Act and to introduce
proportionate assessments.
Within Mental Health Services (only), there is a requirement under the Mental
Health Measure to ensure that anyone who had an active Care and Treatment Plan
in place should have that plan reviewed at least annually.
Performance in this area is known to be better than in other areas of the service
due to the impact of the MH Measure. We are working to bring this data to the
next edition of this report

Assessment & Care Management: Integrated Services
Version Status: Final 17 Version Date: 1 March 2017
Integrated Social Care and Health Services Teams In order to make reporting of the data meaningful, we have grouped the 30 Paris
general and specialist teams together into specific groups for the purpose of
reporting. Principal Officers are provided with team-level data on a monthly basis.
Teams included in this section are:
• Central / North / West Hubs includes the three social work Hub teams with a
range of OT and physiotherapy staff, including both local authority and NHS
workers.
• Specialist Practitioners refers to community health specialist services e.g.
continence. They also work across the Central / North / West hubs.
• Sensory Services relates to specialist sensory and younger adults workers
• Hospital Team refers to the social work teams at Morriston and Singleton
Hospitals
• The Care Homes Quality Team is a social work team that works with those
living in residential and nursing care
• The Older People’s Mental Health Team is the social work team working
directly with those older people experiencing dementia and requiring
specialist social work support.
• Service Provision Teams groups referrals or requests for specific service(s) to
all areas of service provision, but notably brokerage for domiciliary care and
the community reablement service (aka DCAS).
• Sensory Services relates to specialist social work support for people with visual
or hearing impairment.
Types of Enquiries With over 50 enquiry types reflecting the range of support provided to the
community, we have classified the enquiry types to help make sense of the data
and to allow for meaningful comparison.
• MDT / Advice / Info are enquiries that are dealt with as part of the multi-
disciplinary screening process that has been piloted during the year. Note that
many of these are dealt with at the Common Access Point.
• Care Management Input enquiries relate to requests for initial, review or
specialist assessment by a social worker, including ‘proportional assessment’
under the new Act formerly known locally as ‘integrated assessment’. Also
included are enquiries requesting joint assessment or to support discharge
from hospital.
• OT Input and Physio Input refer respectively to requests for OT or
physiotherapy assessment, review or other input. The OT service includes staff
employed by both social services and the NHS. Physiotherapy is exclusively
provided by the NHS via the Hubs.
• Specialist NHS Input refers to enquiries to the community health specialisms
such as incontinence which are delivered area-wide.
• Service Requests refers most commonly to enquiries relating to domiciliary
care and community reablement but other services are also included e.g.
respite. These enquiries only rarely relate to brand new requests for support
and most enquiries relate to package adjustments etc.
• Other Enquiry Types includes specialist technical sensory impairment
enquiries, requests for AMHP assessments and a small number of enquiries
relating to more specialist services e.g. substance misuse.
Enquiries / Assessments and People The tables and charts below reflect counts and proportions of enquiries and
people. This is an important distinction since over time individual people
commonly accrue enquiry events of different types. For the period since April
2015, for example, the average number of referrals for each person who has been
referred is 2.
All references below distinguish between people and enquiries and assessments
Assessment & Care Management: Integrated Services
Version Status: Final 18 Version Date: 1 March 2017
2,131 2,265 1,896 1,778
1,410
391 141
1,039
497
-
500
1,000
1,500
2,000
2,500
Number of People by Enquiry Team
April 2016 - January 2017
647
3,075
2,518
1,353
2,115
3,707
448
- 500
1,000 1,500 2,000 2,500 3,000 3,500 4,000
Number of People by Enquiry Type
April 2016 - January 2017
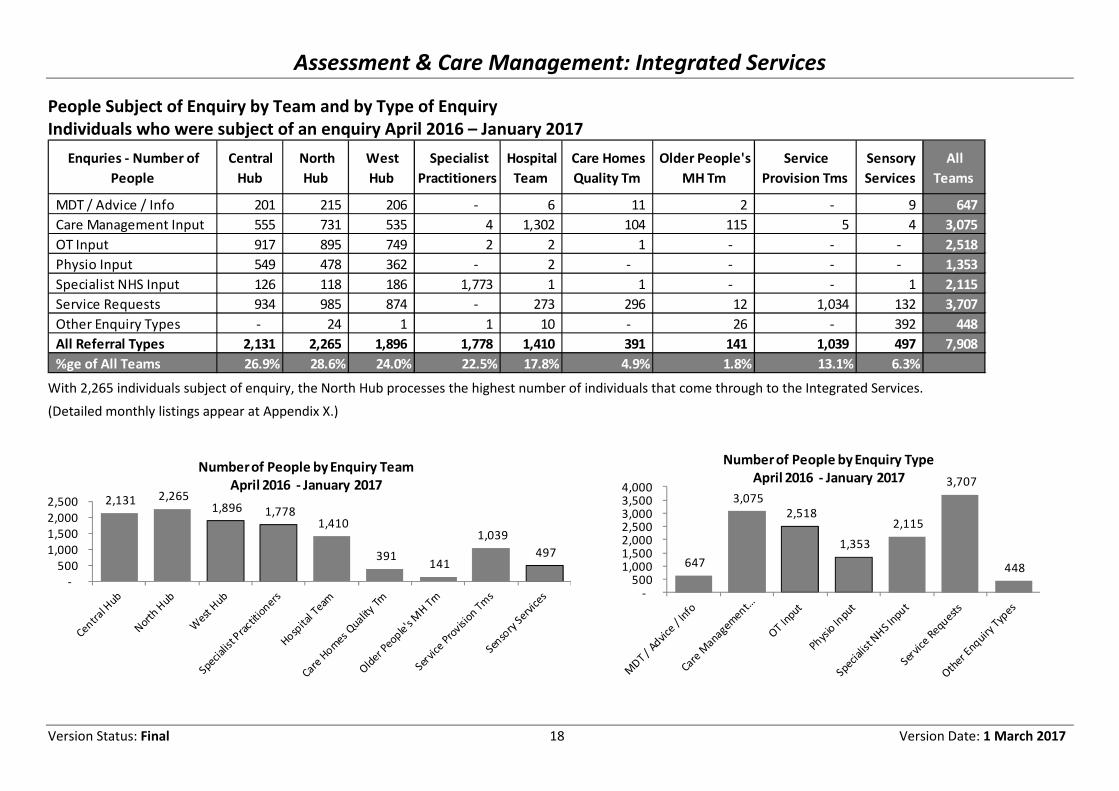
People Subject of Enquiry by Team and by Type of Enquiry
Individuals who were subject of an enquiry April 2016 – January 2017
Enquries - Number of
People
Central
Hub
North
Hub
West
Hub
Specialist
Practitioners
Hospital
Team
Care Homes
Quality Tm
Older People's
MH Tm
Service
Provision Tms
Sensory
Services
All
Teams
MDT / Advice / Info 201 215 206 - 6 11 2 - 9 647
Care Management Input 555 731 535 4 1,302 104 115 5 4 3,075
OT Input 917 895 749 2 2 1 - - - 2,518
Physio Input 549 478 362 - 2 - - - - 1,353
Specialist NHS Input 126 118 186 1,773 1 1 - - 1 2,115
Service Requests 934 985 874 - 273 296 12 1,034 132 3,707
Other Enquiry Types - 24 1 1 10 - 26 - 392 448
All Referral Types 2,131 2,265 1,896 1,778 1,410 391 141 1,039 497 7,908
%ge of All Teams 26.9% 28.6% 24.0% 22.5% 17.8% 4.9% 1.8% 13.1% 6.3%
With 2,265 individuals subject of enquiry, the North Hub processes the highest number of individuals that come through to the Integrated Services.
(Detailed monthly listings appear at Appendix X.)

Assessment & Care Management: Integrated Services
Version Status: Final 19 Version Date: 1 March 2017
Number of Enquiries by Team and Type of Inquiry April 2016 – January 2017 Many service users receive more than one enquiry type in a period of time. Compared to the 7,908 individuals who were the subject of an enquiry in 2016/17 so far, 17,531
enquiries were logged, an average of 2.2 enquiries per person.
Enquiry Team Number of
Enquiries
%ge of all
Enquiries
Central Hub 3,748 21.4%
North Hub 4,005 22.8%
West Hub 3,345 19.1%
Specialist Practitioners 2,021 11.5%
Hospital Team 1,890 10.8%
Care Homes Quality Team 465 2.7%
Older People's Mental Health Team 165 0.9%
Service Provision Teams 1,279 7.3%
Sensory Services 613 3.5%
All Services 17,531 100%
The most common enquiry type (32%) relate to enquiries relate to service provision such as home care or community re-ablement. OT / Physio together account for 25½%
of enquiries, with enquiries about care management input represent 21% of enquiries.
What is working well? What are we worried about? What are we going to do? There continues to be a consistent number of
enquiries so population demand does not
seem to have increased significantly.
Continuing demographic pressure could
escalate the number of enquiries.
Work carried out on the Population Assessment will be used to model future
population need.
The distribution of enquiries across the hubs
is now relatively even.
At present we are working towards a
clearer picture of what typical activity
looks like.
Performance staff and managers are working together to look in more detail at
this topic. We need to revisit the configuration of the Hub teams following
integration to make sure we have allocated resources effectively. The
performance information will be vital to be able to help us do this.
The hospital team is now handling between
typically 150 and 170 referrals each month.
Periodically reduced numbers coming
through the hospital team with no
consistent pattern.
Continue to monitor and take action where necessary.
We believe there is a consistent level of
recording enquiries across the service.
Performance staff will work more closely with Paris staff in order to interpret
spikes or troughs in data.
Type of Enquiry Number of
Enquiries
%ge of all
Enquiries
MDT / Advice / Info 726 4.1%
Care Management Input 3,760 21.4%
OT Input 2,938 16.8%
Physio Input 1,520 8.7%
Specialist NHS Input 2,473 14.1%
Service Requests 5,589 31.9%
Other Enquiry Types 525 3.0%
All Enquiry Types 17,531 100%
Assessment & Care Management: Integrated Services
Version Status: Final 20 Version Date: 1 March 2017
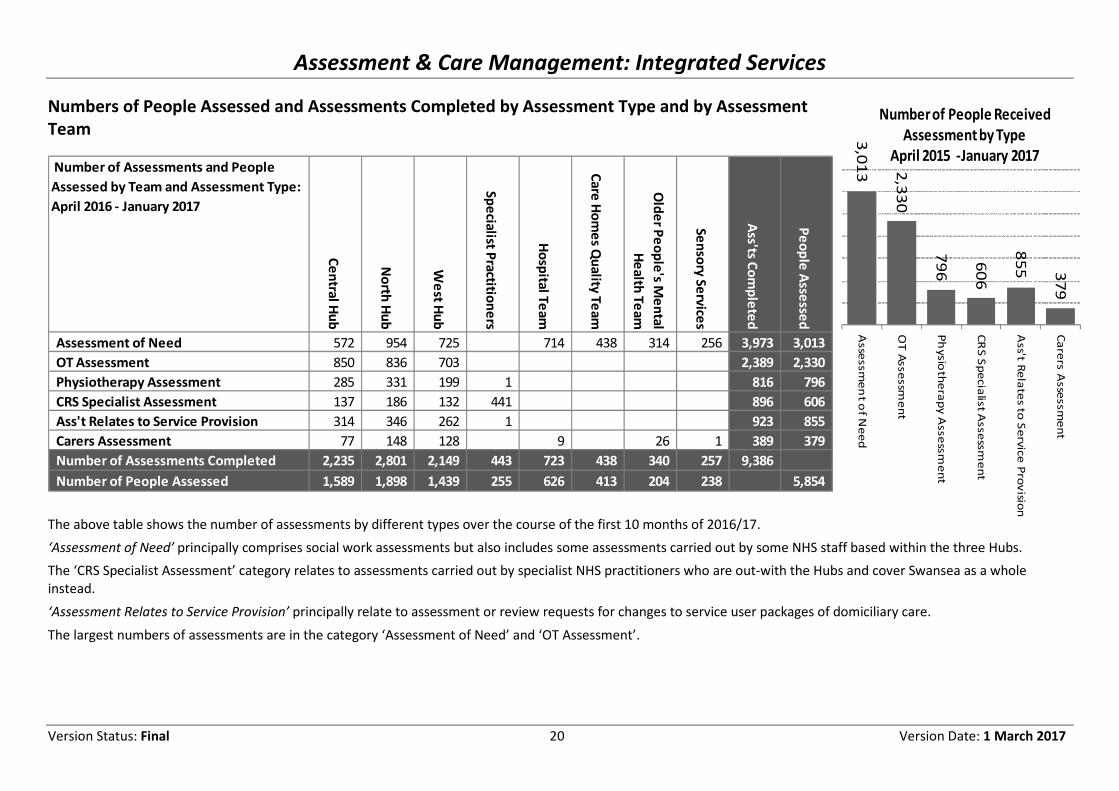
Numbers of People Assessed and Assessments Completed by Assessment Type and by Assessment
Team
The above table shows the number of assessments by different types over the course of the first 10 months of 2016/17.
‘Assessment of Need’ principally comprises social work assessments but also includes some assessments carried out by some NHS staff based within the three Hubs.
The ‘CRS Specialist Assessment’ category relates to assessments carried out by specialist NHS practitioners who are out-with the Hubs and cover Swansea as a whole
instead.
‘Assessment Relates to Service Provision’ principally relate to assessment or review requests for changes to service user packages of domiciliary care.
The largest numbers of assessments are in the category ‘Assessment of Need’ and ‘OT Assessment’.
Number of Assessments and People
Assessed by Team and Assessment Type:
April 2016 - January 2017
Ce
ntra
l Hu
b
No
rth H
ub
We
st Hu
b
Sp
ecia
list Pra
ctition
ers
Ho
spita
l Te
am
Ca
re H
om
es Q
ua
lity T
ea
m
Old
er P
eo
ple
's Me
nta
l
He
alth
Te
am
Se
nso
ry S
erv
ices
Ass'ts C
om
ple
ted
Pe
op
le A
ssesse
d
Assessment of Need 572 954 725 714 438 314 256 3,973 3,013
OT Assessment 850 836 703 2,389 2,330
Physiotherapy Assessment 285 331 199 1 816 796
CRS Specialist Assessment 137 186 132 441 896 606
Ass't Relates to Service Provision 314 346 262 1 923 855
Carers Assessment 77 148 128 9 26 1 389 379
Number of Assessments Completed 2,235 2,801 2,149 443 723 438 340 257 9,386
Number of People Assessed 1,589 1,898 1,439 255 626 413 204 238 5,854
3,0
13 2,3
30
79
6
60
6
85
5 37
9
Asse
ssm
en
t of N
ee
d
OT
Asse
ssm
en
t
Ph
ysio
the
rap
y A
sse
ssm
en
t
CR
S S
pe
cia
list A
sse
ssm
en
t
Ass't R
ela
tes to
Se
rvic
e P
rov
ision
Ca
rers
Asse
ssm
en
t
Number of People Received
Assessment by Type
April 2015 -January 2017

Assessment & Care Management: Integrated Services
Version Status: Final 21 Version Date: 1 March 2017
Disribution of Assessments by Type and Over Time
42% of completed assessments are for assessments of need, which mostly comprise Overview Assessments and Review Assessments. Assessments for Occupational
Therapy and Physiotherapy together account for 34% of all completed assessments. Assessments of need and OT / Physio assessments represent 3 out of 4 completed
assessments.
The dotted line in the graph above shows the total number of individuals who were assessed. The total number never exceeds the cumulative number of assessment types
due to the fact that some people may receive multiple assessment types during any given period of time.
Apr May Jun Jul Aug Sep Oct Nov Dec Jan
Carers Assessment 48 33 59 42 30 38 30 49 33 27
Ass't Relates to Service Provision 74 86 68 81 81 94 93 110 104 132
CRS Specialist Assessment 58 38 78 90 91 103 103 114 103 118
Physiotherapy Assessment 104 76 93 91 92 78 59 72 57 94
OT Assessment 226 231 238 256 234 232 248 307 208 209
Assessment of Need 328 386 443 425 373 360 439 436 378 408
Number of People Assessed 739 739 847 859 794 779 842 954 769 839
0
200
400
600
800
1000
1200Carers Assessment
Ass't Relates to Service
Provision
CRS Specialist
Assessment
Physiotherapy
Assessment
OT Assessment
Assessment of Need
Number of People
Assessed Ass essment
of Need,
3,973 , 42%
OT
Assessment,
2,389 , 25%
Phys iothera
py
Assessment,
816 , 9%
CRS
Specialist
As sessment,
896 , 10%
As s 't
Relates to
Service
Provis ion,
923 , 10%
Carers
Assessment,
389 , 4%
Other,
1,205 , 13%
Number & Percentage of Assessments by
Type
April 2016 - January 2017
Assessment & Care Management: Integrated Services
Version Status: Final 22 Version Date: 1 March 2017
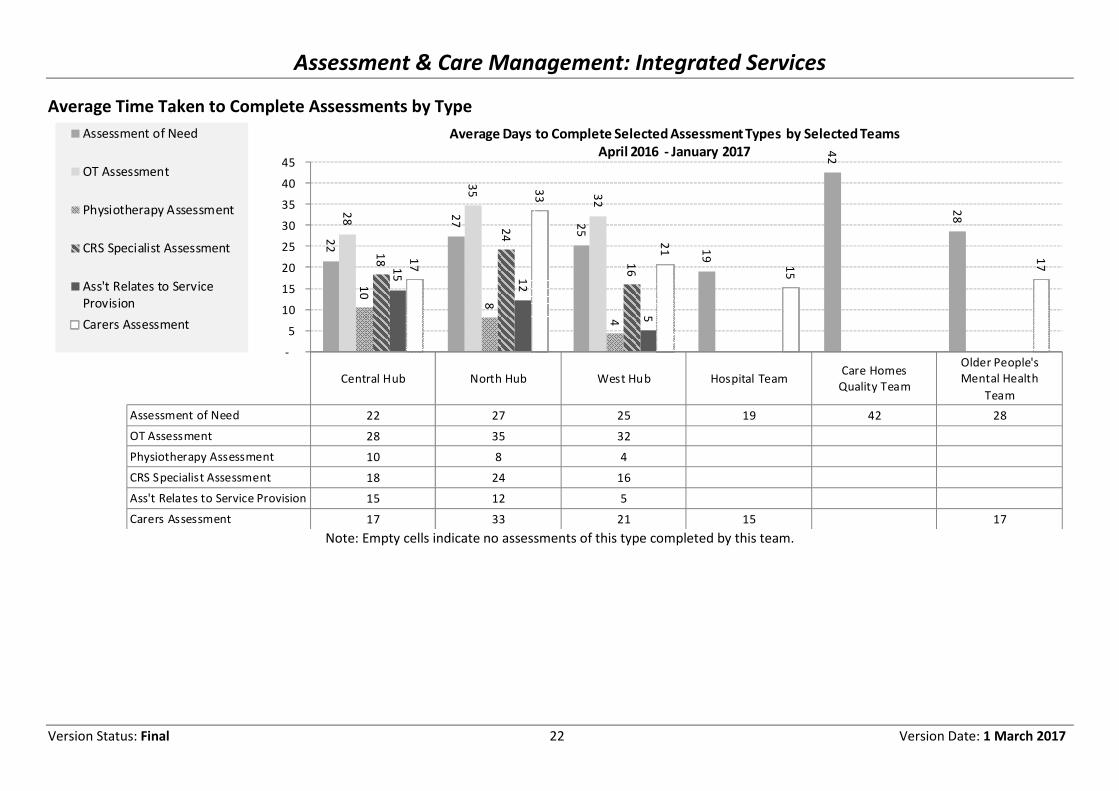
Average Time Taken to Complete Assessments by Type
Central Hub North Hub West Hub Hospital TeamCare Homes
Quality Team
Older People's
Mental Health
Team
Assessment of Need 22 27 25 19 42 28
OT Assessment 28 35 32
Physiotherapy Assessment 10 8 4
CRS Specialist Assessment 18 24 16
Ass't Relates to Service Provision 15 12 5
Carers Assessment 17 33 21 15 17
22
27
25
19
42
28
28
35
32
10
8
4
18
24
16
15
12
5
17
33
21
15
17
-
5
10
15
20
25
30
35
40
45
Average Days to Complete Selected Assessment Types by Selected Teams
April 2016 - January 2017
Assessment of Need
OT Assessment
Physiotherapy Assessment
CRS Specialist Assessment
Ass't Relates to Service
Provision
Carers Assessment
Note: Empty cells indicate no assessments of this type completed by this team.

Assessment & Care Management: Integrated Services
Version Status: Final 23 Version Date: 1 March 2017
What is working well? What are we worried about? What are we going to do? A reasonably consistent amount of assessment activity
continues to take place.
We are aware of current difficulties with accurately
reporting numbers of new assessments/ re-
assessments and reviews.
Performance staff and managers are working together
to look in more detail at this topic.
The range of health and social care disciplines is now
fully integrated within the Hubs, as can be seen by the
range of assessments carried out.
The service will continue to work closely with the
Common Access point in order to improve the MDT
function (see earlier section).
Typically assessments of need are completed within 30
days by the Hubs
Assessments of need that are carried out in CHQT and
the sensory team are higher than 30 days.
Social work practice will be examined as part of the
development of a practice framework.
Physio assessments are carried out swiftly by the Hubs.
OT assessments take slightly longer than assessments
of need to complete.
Previous data had suggested OT / Physiotherapy
assessments were taking considerably longer than
assessments of need. This is now known to be false: the
error was caused by the incorrect inclusion of an
interaction type ‘OT Evaluation and Outcome’, which
are programmed to occur following an assessment
proper.
The shortage of OTs and Physiotherapists is not limited
to Swansea, and we will continue to seek to recruit
appropriately-qualified people.
Caseloads & Reviews At this stage, information on these subjects is not completely reliable across most work areas and as such we are working towards being able to present more reliable
information as it becomes available.
In the context of the introduction of the Social Services and Well-Being Act, there is a need for a substantial piece of work to establish the exact size of the client base and
the nature of the reviewing task. The Principal Officer leads are in the process of working on this area to ensure that we have the intelligence to understand caseloads and
therefore effectively deploy resources.

Assessment & Care Management: Mental Health
Version Status: Final 24 Version Date: 1 March 2017
Assessment and Care Management: Mental Health Number of People Assessed by Assessment Type
Types of Assessment Recovery Plans are carried out for people who may have
a mental health problem that needs to be managed
under the terms of the Mental Health Measure passed
by the Welsh Assembly.
If a person is deemed to require care co-ordination
under the terms of the Measure, a Care and Treatment
Plan is carried out and reviewed at periodic intervals.
An Associate Mental Health Professional (AMHP)
assessment is carried out where a person with a mental
health problem may need to be admitted to hospital for
care and treatment.
The dotted line shows the total number of individuals
who were assessed. The total number never exceeds the
cumulative number of assessment types due to the fact
that some people may receive multiple assessment
types during any given period of time. This will be
particularly the case for those who receive a Recovery
Plan which identifies the need for care co-ordination and
a subsequent Care & Treatment Plan.
204177
226
158 163 173 182 171 156 160
93
98
169
10550
117121
111 141 139
1721
31
30
18
2620
3323 26
13
6
4
2 5 1 2
0
50
100
150
200
250
300
350
400
450
500
2016/17
Nu
mb
er
of
Pe
op
le A
sse
sse
d b
y A
sse
ssm
en
t T
yp
e
Mental Health Care & Treatment Plan Mental Health Recovery Assessment
MH AMPH Assessment Carers Assessment
Number of People assessed

Assessment & Care Management: Mental Health
Version Status: Final 25 Version Date: 1 March 2017
People with Active Care & Treatment Plan
1,2
91
1,2
94
1,3
04
1,3
05
1,3
01
1,3
02
1,3
04
1,3
11
1,3
12
1,3
26
1100
1150
1200
1250
1300
1350
Ap
r
Ma
y
Jun
Jul
Au
g
Se
p
Oct
No
v
De
c
Jan
2016/17
Clients with Active Care & Treatment Plan
April 2016 to Present
The ‘caseload’ for the mental health service is relatively-well defined since the Mental Health Measure stipulates a mental health client should have an active Care and
Treatment Plan.
The overall caseload for the mental health service has remained relatively stable over the last year (up 2.7%), as has the number of individual workers who are carrying a
caseload (up 4.8%). As there are some workers who do not employed full-time, mathematically dividing the number of clients by the number of workers gives only a rough
estimate of average caseload. Although this method provided a steady average of roughly 21 -22,
What is working well? What are we worried about? What are we going to do? The Mental Health Measure has supported the routine
management of information to enable reporting of
caseloads
Sometimes resource issues arise when staff are
required to undertake training in order to carry out
AMHPS. The training is substantial and lasts for most of
a year.
We are going to look in more detail at issues that affect
available resource.
62 61 60 59
59
63 6
1
63
64
65
40
45
50
55
60
65
70
Ap
r
Ma
y
Jun
Jul
Au
g
Se
p
Oct
No
v
De
c
Jan
2016/17
Workers Care-Coordinating Clients with Active Care
& Treatment Plan
April 2016 to Present

Community Reablement
Version Status: Final 26 Version Date: 1 March 2017
Community Re-ablement
Summary of Expectations / Standards Summary of Outcomes / Performance The purpose of the community reablement service is to improve the ability of people to remain
independent with less or no ongoing managed care, thereby reducing the overall total burden on
managed care services.
There is mixed evidence on how effective the service has been
in reducing the total burden on the managed care system.
There are two national performance indicators measuring the effectiveness of community reablement.
These are brand new indicators and there continue to be national debates as to the final national
definition of the indicator calculation method.
Staff are engaged in discussion with peers across Wales and
contributing positively to a meaningful definition.
Measure 20a: The percentage of adults who completed a period of reablement and have a reduced
package of care and support 6 months later. Locally a target of 50% was set.
Target has been met. Cumulative performance to the end of Q3
was 66.2%.
Measure 20b) The percentage of adults who completed a period of reablement and have no package of
care and support 6 months later. Locally a target of 25% was set.
Target has been met. Cumulative performance to the end of Q3
was 27.7%.
People Receiving Community Reablement
181
249
156
0
50
100
150
200
250
300
Dec 14 Dec 15 Dec 16
Number of People Receiving
Community Reablement at Month
End
18
3
18
1
18
7
17
8
16
4
19
9
19
2
19
0
18
1
18
7
21
3
25
9
28
7
29
3 26
4
25
4
28
7
27
7
27
8
26
5 24
9
24
3 22
3
24
8 22
1
21
1 18
4
18
7
18
3
20
7 17
5
18
1 15
6
0
50
100
150
200
250
300
350
Ap
r-1
4
Ma
y-1
4
Jun
-14
Jul-
14
Au
g-1
4
Se
p-1
4
Oct
-14
No
v-1
4
De
c-1
4
Jan
-15
Fe
b-1
5
Ma
r-1
5
Ap
r-1
5
Ma
y-1
5
Jun
-15
Jul-
15
Au
g-1
5
Se
p-1
5
Oct
-15
No
v-1
5
De
c-1
5
Jan
-16
Fe
b-1
6
Ma
r-1
6
Ap
r-1
6
Ma
y-1
6
Jun
-16
Jul-
16
Au
g-1
6
Se
p-1
6
Oct
-16
No
v-1
6
De
c-1
6
Number of People Receiving Community Reablement at Month End
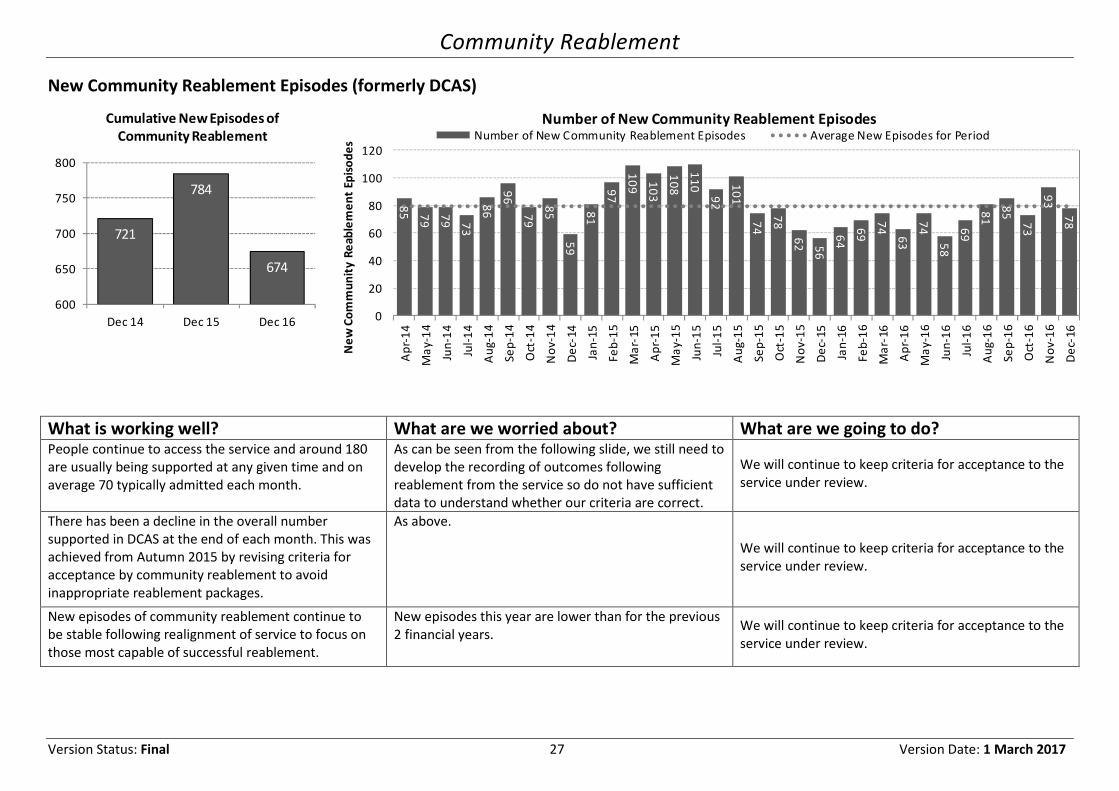
Community Reablement
Version Status: Final 27 Version Date: 1 March 2017
721
784
674
600
650
700
750
800
Dec 14 Dec 15 Dec 16
Cumulative New Episodes of
Community Reablement
New Community Reablement Episodes (formerly DCAS)
What is working well? What are we worried about? What are we going to do? People continue to access the service and around 180
are usually being supported at any given time and on
average 70 typically admitted each month.
As can be seen from the following slide, we still need to
develop the recording of outcomes following
reablement from the service so do not have sufficient
data to understand whether our criteria are correct.
We will continue to keep criteria for acceptance to the
service under review.
There has been a decline in the overall number
supported in DCAS at the end of each month. This was
achieved from Autumn 2015 by revising criteria for
acceptance by community reablement to avoid
inappropriate reablement packages.
As above.
We will continue to keep criteria for acceptance to the
service under review.
New episodes of community reablement continue to
be stable following realignment of service to focus on
those most capable of successful reablement.
New episodes this year are lower than for the previous
2 financial years. We will continue to keep criteria for acceptance to the
service under review.
85 7
9
79 7
3
86
96
79
85
59
81
97
10
9 10
3
10
8
11
0
92
10
1
74
78
62 5
6
64
69
74
63
74
58
69
81
85
73
93
78
0
20
40
60
80
100
120
Ap
r-1
4
Ma
y-1
4
Jun
-14
Jul-
14
Au
g-1
4
Se
p-1
4
Oct
-14
No
v-1
4
De
c-1
4
Jan
-15
Fe
b-1
5
Ma
r-1
5
Ap
r-1
5
Ma
y-1
5
Jun
-15
Jul-
15
Au
g-1
5
Se
p-1
5
Oct
-15
No
v-1
5
De
c-1
5
Jan
-16
Fe
b-1
6
Ma
r-1
6
Ap
r-1
6
Ma
y-1
6
Jun
-16
Jul-
16
Au
g-1
6
Se
p-1
6
Oct
-16
No
v-1
6
De
c-1
6
Ne
w C
om
mu
nit
y R
ea
ble
me
nt
Ep
iso
de
s
Number of New Community Reablement EpisodesNumber of New Community Reablement Episodes Average New Episodes for Period

Community Reablement
Version Status: Final 28 Version Date: 1 March 2017
Effectiveness of Community Reablement
Positive numbers in graph / table on the previous page reflect desired outcome of community reablement, which is to reduce or eliminate the amount of managed care
that people will require on an ongoing basis. The minus numbers reflect other outcomes, but these will of course be appropriate to the needs of the individual.
-40
-30
-20
-10
0
10
20
30
40
April
2015
May
2015
June
2015July 2015
August
2015
Septemb
er 2015
October
2015
Novembe
r 2015
Decembe
r 2015
January
2016
February
2016
March
2016
April
2016
May
2016
June
2016July 2016
August
2016
Septemb
er 2016
October
2016
Novembe
r 2016
Decembe
r 2016
Other -1 -1 -4 -3 -6 -5 -4 -5 -6 -4 -7 -2 -1 0 0 -1 0 -4 -1 -4 -3
Care Home or Hospital -5 -4 -8 -11 -3 -5 -11 -9 -5 -5 -1 -1 0 -6 -2 -5 -2 -1 0 -2 -2
Same or increased care -13 -23 -21 -16 -11 -10 -6 -14 -2 -3 -3 0 -11 -11 -3 -9 -5 -4 -6 -2 -1
Reduced Care 1 12 14 12 2 5 3 6 2 3 2 3 4 1 5 0 1 1 3 0 0
No care 7 12 16 8 10 12 13 14 16 13 18 11 10 12 24 21 21 14 22 20 15
Destination on Discharge from Community Re-ablement
No care Reduced Care Same or increased care Care Home or Hospital Other
53 59 64 65 64 70 71 73 7387
113
61
123
62
5869
6050 53
75
340
20
40
60
80
100
120
140
Ap
r-1
5
Ma
y-1
5
Jun
-15
Jul-
15
Au
g-1
5
Se
p-1
5
Oct
-15
No
v-1
5
De
c-1
5
Jan
-16
Fe
b-1
6
Ma
r-1
6
Ap
r-1
6
Ma
y-1
6
Jun
-16
Jul-
16
Au
g-1
6
Se
p-1
6
Oct
-16
No
v-1
6
De
c-1
6
Nu
mb
er
of
Da
ys
Average Number of Days Receiving Community Reablement for those
Leaving - 2015 to Present
No care,
309, 43%
Reduced
Care, 80,
11%
Same or
increased
care, -174, -
23%
Care Home
or Hospital,
-88, -12%
Other, -62,
-9%
Community Reablement Discharge
Destination
April 2015 - December 2016

Community Reablement
Version Status: Final 29 Version Date: 1 March 2017
What is working well? What are we worried about? What are we going to do? There has been an increase in the proportion of people
who are leaving service to reduced care package or no
care.
Data is not complete due to a variety of factors. We
have also detected a range of errors in recording.
We are working to an improvement plan to foster
improvement in recording accurately. This is essential
to monitor the effectiveness of the service.
There has been a reduction in the numbers of people
leaving community reablement and going into hospital
or residential / nursing care.
We will continue to divert people away from care in
care homes or hospital where appropriate in line with
people’s desired outcomes.
There has been a reduction in the average length of
stay, reflecting improvements in the through-flow of
service users into other services.
We know that stay lengths can increase due to
pressures within the service, in terms of securing long-
term care.
Maintain focus on effective commissioning
arrangements and workflow processes for domiciliary
care.

Residential Reablement
Version Status: Final 30 Version Date: 1 March 2017
Residential Reablement
Summary of Expectations / Standards Summary of Outcomes / Performance The purpose of the residential reablement service is to avoid further escalation in a person’s care needs
and to avoid their admission to hospital or to a care home. Where successful, the ability of people to
remain independent with less or no ongoing managed care reduces the overall total burden on managed
care services.
There is good evidence the service has become effective in
preventing admissions over the last 2 years.
There is a local PI relating the the service: AS4 - Percentage of clients returning home following
residential reablement. For 2016/17, the target was set at 58% returning home.
This target has been met. Cumulative performance is 67%
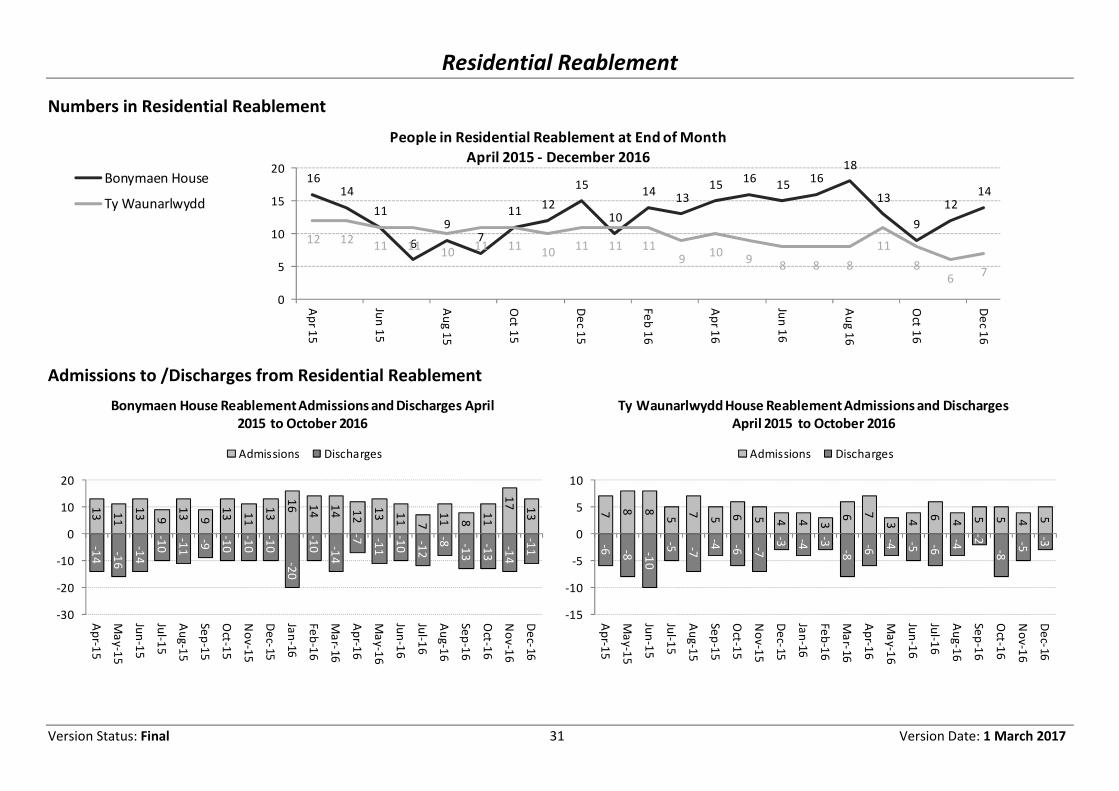
Residential Reablement
Version Status: Final 31 Version Date: 1 March 2017
Numbers in Residential Reablement
1614
11
6
97
1112
15
10
1413
1516
1516
18
13
9
1214
12 1211 11
1011 11
1011 11 11
910
98 8 8
11
86
7
0
5
10
15
20
Ap
r 15
Jun
15
Au
g 1
5
Oct 1
5
De
c 15
Fe
b 1
6
Ap
r 16
Jun
16
Au
g 1
6
Oct 1
6
De
c 16
People in Residential Reablement at End of Month
April 2015 - December 2016
Bonymaen House
Ty Waunarlwydd
Admissions to /Discharges from Residential Reablement
13 11
13 9
13 9
13 11
13
16 14
14 12
13 11 7
11 8
11
17 1
3
-14 -16
-14
-10
-11
-9
-10
-10
-10
-20
-10 -1
4
-7 -11
-10 -12
-8 -13
-13
-14
-11
-30
-20
-10
0
10
20
Ap
r-15
Ma
y-1
5
Jun
-15
Jul-1
5
Au
g-1
5
Se
p-1
5
Oct-1
5
No
v-1
5
De
c-15
Jan
-16
Fe
b-1
6
Ma
r-16
Ap
r-16
Ma
y-1
6
Jun
-16
Jul-1
6
Au
g-1
6
Se
p-1
6
Oct-1
6
No
v-1
6
De
c-16
Bonymaen House Reablement Admissions and Discharges April
2015 to October 2016
Admissions Discharges
7 8 8
5 7 5 6 5 4 4 3
6 7
3 4 6 4 5 5 4 5
-6 -8 -10
-5 -7
-4 -6 -7
-3 -4
-3
-8
-6
-4 -5 -6
-4
-2
-8
-5
-3
-15
-10
-5
0
5
10
Ap
r-15
Ma
y-1
5
Jun
-15
Jul-1
5
Au
g-1
5
Se
p-1
5
Oct-1
5
No
v-1
5
De
c-15
Jan
-16
Fe
b-1
6
Ma
r-16
Ap
r-16
Ma
y-1
6
Jun
-16
Jul-1
6
Au
g-1
6
Se
p-1
6
Oct-1
6
No
v-1
6
De
c-16
Ty Waunarlwydd House Reablement Admissions and Discharges
April 2015 to October 2016
Admissions Discharges
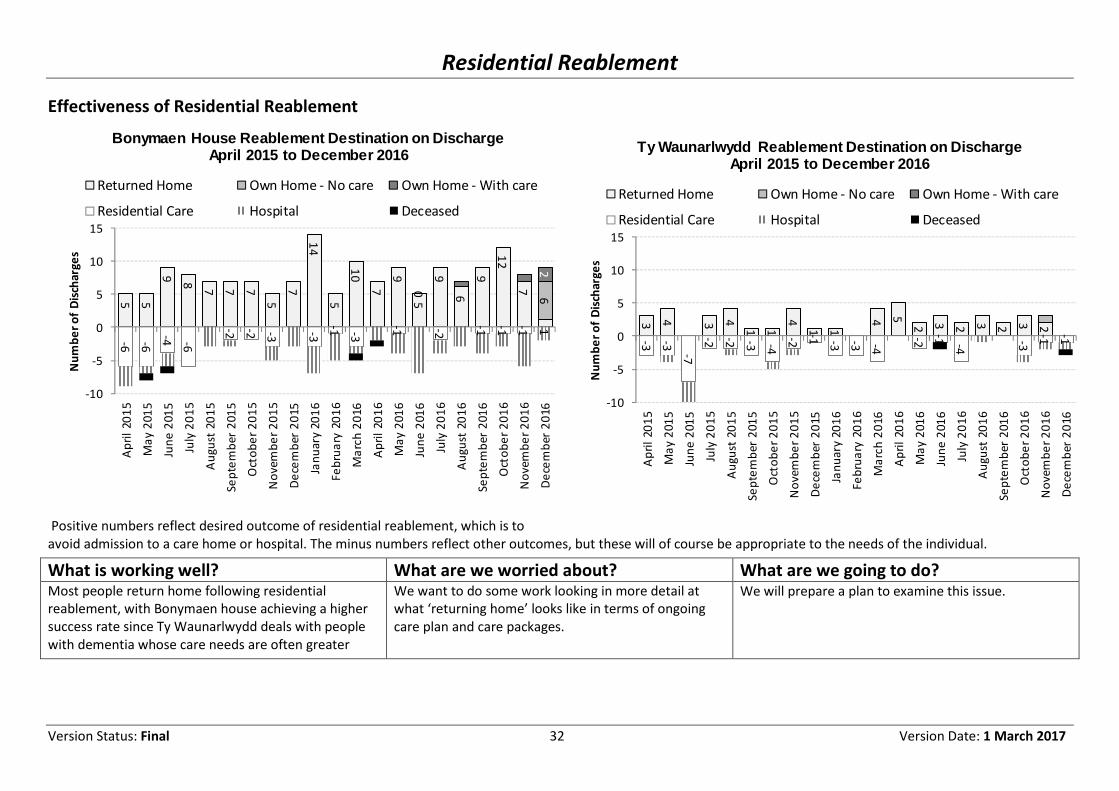
Residential Reablement
Version Status: Final 32 Version Date: 1 March 2017
Effectiveness of Residential Reablement
Positive numbers reflect desired outcome of residential reablement, which is to
avoid admission to a care home or hospital. The minus numbers reflect other outcomes, but these will of course be appropriate to the needs of the individual.
What is working well? What are we worried about? What are we going to do? Most people return home following residential
reablement, with Bonymaen house achieving a higher
success rate since Ty Waunarlwydd deals with people
with dementia whose care needs are often greater
We want to do some work looking in more detail at
what ‘returning home’ looks like in terms of ongoing
care plan and care packages.
We will prepare a plan to examine this issue.
5 5
9
8
7 7 7
5
7
14
5
10
7
9
5
9
6
9
12
7
16
2
-6 - 6
-4 -6
-2 -2 -3 -3
-1 -3
-1
0
-2
-1 -1 -1
-10
-5
0
5
10
15
Ap
ril
20
15
Ma
y 2
01
5
Jun
e 2
01
5
July
20
15
Au
gu
st 2
01
5
Se
pte
mb
er
20
15
Oct
ob
er
20
15
No
ve
mb
er
20
15
De
cem
be
r 2
01
5
Jan
ua
ry 2
01
6
Fe
bru
ary
20
16
Ma
rch
20
16
Ap
ril
20
16
Ma
y 2
01
6
Jun
e 2
01
6
July
20
16
Au
gu
st 2
01
6
Se
pte
mb
er
20
16
Oct
ob
er
20
16
No
ve
mb
er
20
16
De
cem
be
r 2
01
6
Nu
mb
er
of
Dis
cha
rge
s
Bonymaen House Reablement Destination on Discharge April 2015 to December 2016
Returned Home Own Home - No care Own Home - With care
Residential Care Hospital Deceased
3 4 3 4
1 1
4
1 1
4 5
2 3 2 3 2 3 2
-3 -3
-7
-2 -2 -3 -4
-2
-1 -3 -3 -4
-2
-1
-4
-3
-1 -1
-10
-5
0
5
10
15
Ap
ril
20
15
Ma
y 2
01
5
Jun
e 2
01
5
July
20
15
Au
gu
st 2
01
5
Se
pte
mb
er
20
15
Oct
ob
er
20
15
No
ve
mb
er
20
15
De
cem
be
r 2
01
5
Jan
ua
ry 2
01
6
Fe
bru
ary
20
16
Ma
rch
20
16
Ap
ril
20
16
Ma
y 2
01
6
Jun
e 2
01
6
July
20
16
Au
gu
st 2
01
6
Se
pte
mb
er
20
16
Oct
ob
er
20
16
No
ve
mb
er
20
16
De
cem
be
r 2
01
6
Nu
mb
er
of
Dis
cha
rge
s
Ty Waunarlwydd Reablement Destination on Discharge April 2015 to December 2016
Returned Home Own Home - No care Own Home - With care
Residential Care Hospital Deceased
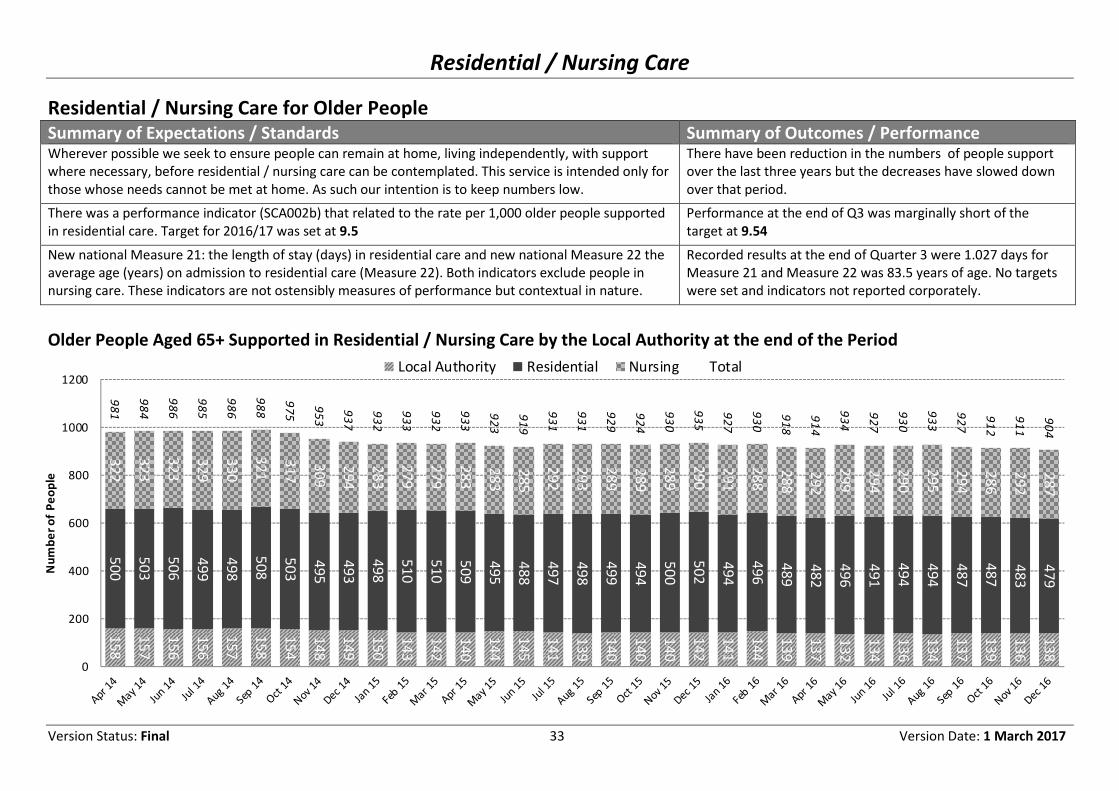
Residential / Nursing Care
Version Status: Final 33 Version Date: 1 March 2017
Residential / Nursing Care for Older People
Summary of Expectations / Standards Summary of Outcomes / Performance Wherever possible we seek to ensure people can remain at home, living independently, with support
where necessary, before residential / nursing care can be contemplated. This service is intended only for
those whose needs cannot be met at home. As such our intention is to keep numbers low.
There have been reduction in the numbers of people support
over the last three years but the decreases have slowed down
over that period.
There was a performance indicator (SCA002b) that related to the rate per 1,000 older people supported
in residential care. Target for 2016/17 was set at 9.5
Performance at the end of Q3 was marginally short of the
target at 9.54
New national Measure 21: the length of stay (days) in residential care and new national Measure 22 the
average age (years) on admission to residential care (Measure 22). Both indicators exclude people in
nursing care. These indicators are not ostensibly measures of performance but contextual in nature.
Recorded results at the end of Quarter 3 were 1.027 days for
Measure 21 and Measure 22 was 83.5 years of age. No targets
were set and indicators not reported corporately.
Older People Aged 65+ Supported in Residential / Nursing Care by the Local Authority at the end of the Period
15
8
15
7
15
6
15
6
15
7
15
8
15
4
14
8
14
9
15
0
14
3
14
2
14
0
14
4
14
5
14
1
13
9
14
0
14
0
14
0
14
2
14
1
14
4
13
9
13
7
13
2
13
4
13
6
13
4
13
7
13
9
13
6
13
8
50
0
50
3
50
6
49
9
49
8
50
8
50
3
49
5
49
3
49
8
51
0
51
0
50
9
49
5
48
8
49
7
49
8
49
9
49
4
50
0
50
2
49
4
49
6
48
9
48
2
49
6
49
1
49
4
49
4
48
7
48
7
48
3
47
9
32
2
32
3
32
3
32
9
33
0
32
1
31
7
30
9
29
4
28
3
27
9
27
9
28
3
28
3
28
5
29
2
29
3
28
9
28
9
28
9
29
0
29
1
28
8
28
8
29
2
29
9
29
4
29
0
29
5
29
4
28
6
29
2
28
7
98
1
98
4
98
6
98
5
98
6
98
8
97
5
95
3
93
7
93
2
93
3
93
2
93
3
92
3
91
9
93
1
93
1
92
9
92
4
93
0
93
5
92
7
93
0
91
8
91
4
93
4
92
7
93
0
93
3
92
7
91
2
91
1
90
4
0
200
400
600
800
1000
1200
Nu
mb
er
of
Pe
op
le
Local Authority Residential Nursing Total

Residential / Nursing Care
Version Status: Final 34 Version Date: 1 March 2017
293
312 313
280
300
320
2014 2015 2016
Nu
mb
er
of
Dis
char
ges Cumulative Discharges from
Residential / Nursing Care
Admissions to and Discharges from Residential / Nursing Care
The number of older people aged 65+ supported
in residential / nursing care by social services
has declined in the last two years (previous page). Maintaining the reduced figures is dependent on effective control over admissions and a consistent flow of discharges.
What is working well? What are we worried about? What are we going to do? The number supported has decreased from higher
levels prior to October 2014.
We have not reduced numbers to the level anticipated
in the Western Bay business case for intermediate
care and we are still making above-average use of
residential care compared to other Welsh councils.
We have re-established processes to strengthen the
rigour of acceptance of potential residents to care
homes. There is a Panel now in place which challenges
decisions surrounding new and temporary placements.
We will need to monitor whether these arrangements
help reduce the propensity to use of long-term
placements.
Discharges have been high this calendar year helping to
maintain downwards pressure on the overall number of
people supported in residential / nursing care.
For 6 of the 9 months of the calendar year so far
admissions have been higher than the average of 30
for the entire period. Ultimately this will push the
average admission number upwards.
We have re-established processes to strengthen the
rigour of acceptance of potential residents to care
homes, as outlined above.
223289 292
0
200
400
2014 2015 2016Nu
mb
er
of
Ad
mis
sio
ns
Cumulative New Admissions to
Residential / Nursing Care
30 2
4
15
31 2
5
26
27 2
1
24
32
40 37 3
3 26
34 32
24
36 33
33
38
27
35
41 3
5
45
28
37 3
2
36
28
32
19
-31
-26
-21
-32
-25
-31
-42
-44
-41
-37
-39
-40
-36
-37
-41
-21
-28
-44
-40
-30
-35
-37
-35
-51
-44
-31
-34
-41
-33
-40
-37
-34
-19
-60
-40
-20
0
20
40
60
Ap
r 1
4
Ma
y 1
4
Jun
14
Jul
14
Au
g 1
4
Se
p 1
4
Oct
14
No
v 1
4
De
c 1
4
Jan
15
Fe
b 1
5
Ma
r 1
5
Ap
r 1
5
Ma
y 1
5
Jun
15
Jul
15
Au
g 1
5
Se
p 1
5
Oct
15
No
v 1
5
De
c 1
5
Jan
16
Fe
b 1
6
Ma
r 1
6
Ap
r 1
6
Ma
y 1
6
Jun
16
Jul
16
Au
g 1
6
Se
p 1
6
Oct
16
No
v 1
6
De
c 1
6
Nu
mb
er
of
Ad
mis
sio
n /
Dis
cha
rge
s
Number of Admissions and Discharges - Residential and Nursing Care April 2014 onwards
Admissions Discharges

Residential / Nursing Care
Version Status: Final 35 Version Date: 1 March 2017
Temporary Admissions to Residential / Nursing Care A temporary admission can be for a variety of reasons, the most common being trial periods to allow a person to establish whether they would like to consider a permanent
placement and where the authority will need to carry out a financial assessment to determine whether the law requires that the person should pay for their care. Such
stays tend to be relatively brief, typically between 40 and 60 days.
We have recently started to examine this information in the context of understanding overall levels of demand for residential / nursing care.
Summary of Expectations / Standards Summary of Outcomes / Performance Given the risk of a temporary placements becoming permanent placements, we think
that the number of such placements should be kept as low as possible.
Cumulative admissions to temporary care in 2016/17 have been lower than in the
previous financial year but look set to increase.
We will keep this area under review in order to define reasonable expectations. No additional outcomes defined as yet.
Number of People in Temporary Residential / Nursing Placements at the end of the Month
19
27
25
28
26
28
21
15
17
18
22 2
1
22
27 2
6 25
25
26
23
23
31
34
25 2
4
26
18
31
29 2
8
18
22
19
21
0
5
10
15
20
25
30
35
40
Numbers in Temporary Placement At Month End
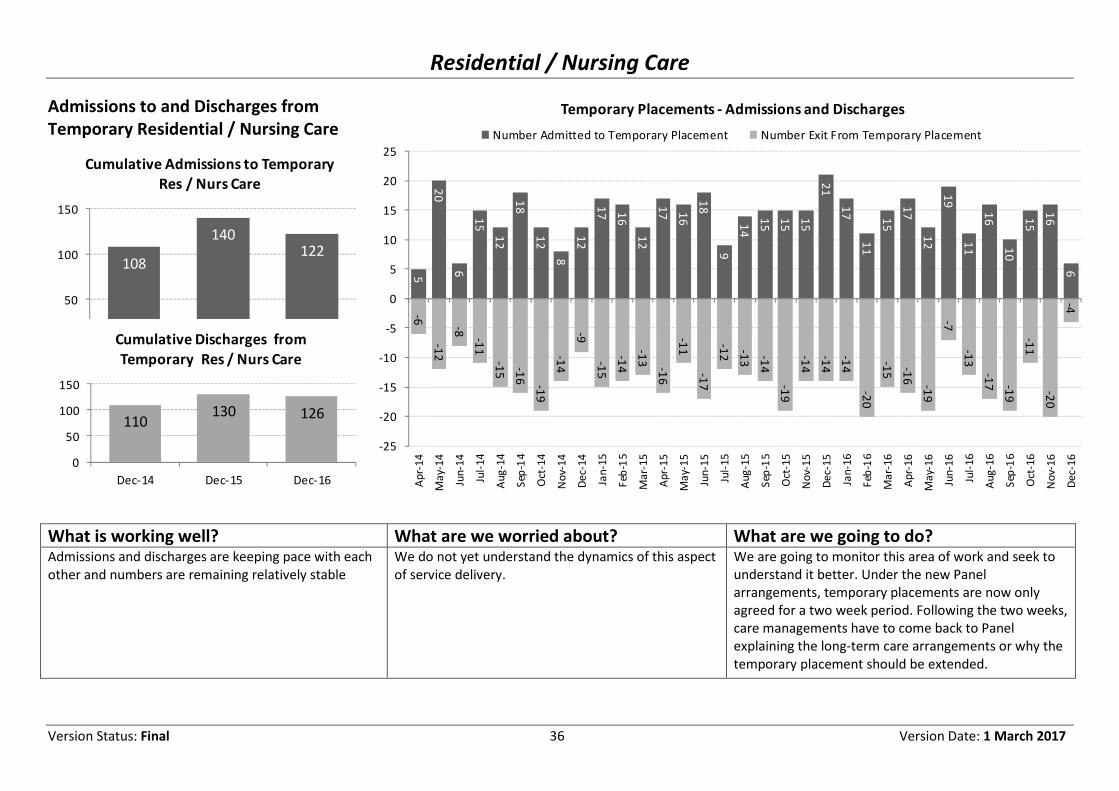
Residential / Nursing Care
Version Status: Final 36 Version Date: 1 March 2017
5
20
6
15
12
18
12
8
12
17 1
6
12
17 1
6
18
9
14
15
15
15
21
17
11
15
17
12
19
11
16
10
15
16
6
-6
-12
-8
-11
-15 -1
6
-19
-14
-9
-15
-14
-13
-16
-11
-17
-12 -1
3 -14
-19
-14
-14
-14
-20
-15 -1
6
-19
-7
-13
-17 -1
9
-11
-20
-4
-25
-20
-15
-10
-5
0
5
10
15
20
25
Ap
r-1
4
Ma
y-1
4
Jun
-14
Jul-
14
Au
g-1
4
Sep
-14
Oct
-14
No
v-1
4
De
c-1
4
Jan
-15
Feb
-15
Ma
r-1
5
Ap
r-1
5
Ma
y-1
5
Jun
-15
Jul-
15
Au
g-1
5
Sep
-15
Oct
-15
No
v-1
5
De
c-1
5
Jan
-16
Feb
-16
Ma
r-1
6
Ap
r-1
6
Ma
y-1
6
Jun
-16
Jul-
16
Au
g-1
6
Sep
-16
Oct
-16
No
v-1
6
De
c-1
6
Temporary Placements - Admissions and Discharges
Number Admitted to Temporary Placement Number Exit From Temporary Placement
Admissions to and Discharges from
Temporary Residential / Nursing Care
What is working well? What are we worried about? What are we going to do? Admissions and discharges are keeping pace with each
other and numbers are remaining relatively stable
We do not yet understand the dynamics of this aspect
of service delivery.
We are going to monitor this area of work and seek to
understand it better. Under the new Panel
arrangements, temporary placements are now only
agreed for a two week period. Following the two weeks,
care managements have to come back to Panel
explaining the long-term care arrangements or why the
temporary placement should be extended.
108
140122
0
50
100
150
Dec-14 Dec-15 Dec-16
Cumulative Admissions to Temporary
Res / Nurs Care
110130 126
0
50
100
150
Dec-14 Dec-15 Dec-16
Cumulative Discharges from
Temporary Res / Nurs Care

Residential / Nursing Care
Version Status: Final 37 Version Date: 1 March 2017
Destination on Discharge from Temporary Residential / Nursing
Placements The chart opposite shows the destination of people who have ceased to be in a
temporary placement.
The largest group representing 39½% of discharges since April 2016 is into a
permanent placement. A further 5.4% are ‘pending FACS approval’ and are likely to
turn into a permanent placement. Just 1.6% of discharges are to self-funded care.
This means that just under 45% of those who are admitted to temporary
placements are likely to represent an ongoing cost to the local authority.
Of the discharges to the community, accounting for 29.5% of discharges, many are
likely to require ongoing care and we will examine the relevant records to test this.
8½% of people sadly die whilst in the temporary placement. Work is needed to
establish whether temporary placements were appropriate, particularly where the
length of stay is very short, as many are.
Only 3 people (2.3%) were discharged to hospital from a temporary placement,
compared to 11 (9.7%) in the same period to December during 2015/16. Nobody
has been discharged to a CHC placement in 2016/17.
Discharge to
Health / CHC, 3,
2.3%
Discharges
(community), 38,
29.5%
Deceased, 11,
8.5%
Pending FACS
Approval, 7, 5.4%
Placed, 51, 39.5%
Self-funding, 2,
1.6%
Misc, 17, 13.2%
Oth
er,
23
, 1
7.8
%
Temporary Placements: Discharge Destination April - December
2016
Residential / Nursing Care
Version Status: Final 38 Version Date: 1 March 2017
What is working well? What are we worried about? What are we going to do? We have good quality
information about the
destination of people who
leave a temporary placement.
Inappropriate use of temporary placements can result in increased
local authority expenditure should not be undertaken lightly. This is
particularly following the change in charging arrangements as a result
of the Social Services and Wellbeing Act whereby temporary
placements can now only be charged at a maximum of £60 per week
for the first 8 weeks.
We need to ensure that admissions to temporary placements
are only made when necessary due to the escalating risk to
local authority budgets that they represent.
We have good quality
information about the start and
end of a period of temporary
placement
We will develop better length of stay profiles for those in
temporary placements.
The very low level of discharges to Continuing Health Care (CHC)
funded placements is illustrative of wider issues of whether the
Health Board is appropriately funding Swansea citizens. This pattern is
echoed across Western Bay.
We will continue to engage with the LHB on achieving equitable
distribution of CHC funding across Western Bay. We are also
relooking at our strategy in relation to how we negotiate the
funding of new placements to make sure that the Health Board
funds legitimate health needs.
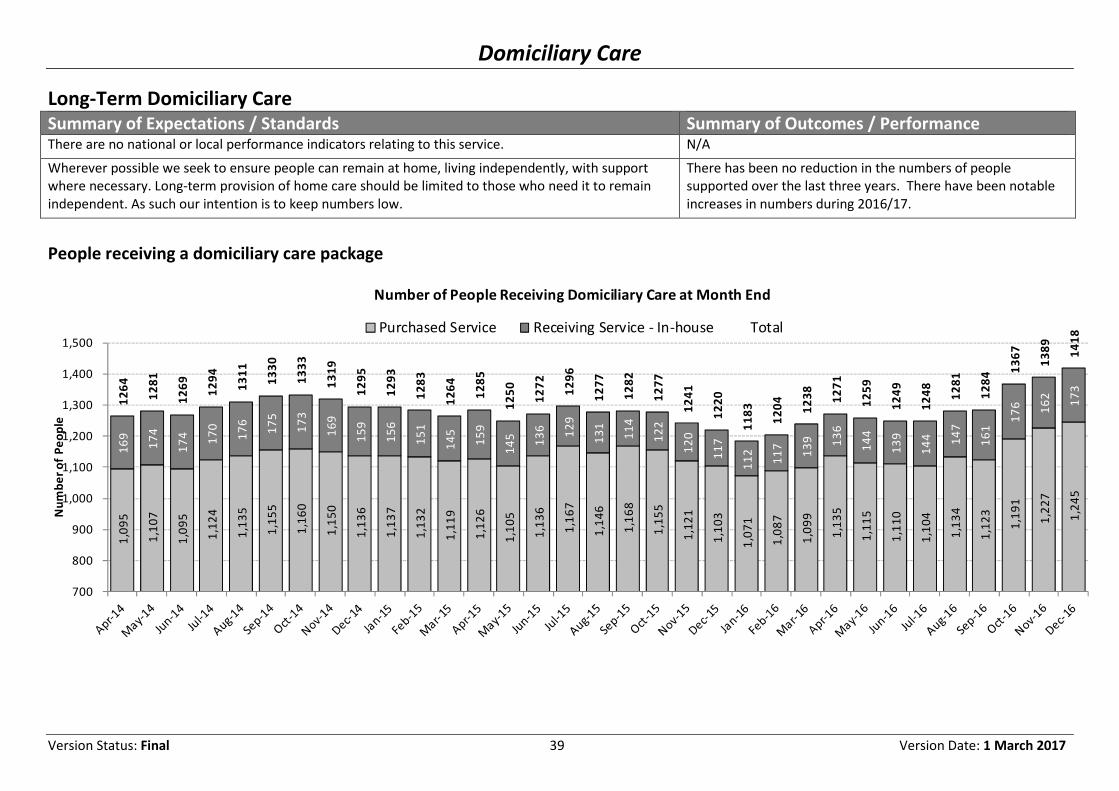
Domiciliary Care
Version Status: Final 39 Version Date: 1 March 2017
Long-Term Domiciliary Care
Summary of Expectations / Standards Summary of Outcomes / Performance There are no national or local performance indicators relating to this service. N/A
Wherever possible we seek to ensure people can remain at home, living independently, with support
where necessary. Long-term provision of home care should be limited to those who need it to remain
independent. As such our intention is to keep numbers low.
There has been no reduction in the numbers of people
supported over the last three years. There have been notable
increases in numbers during 2016/17.
People receiving a domiciliary care package
1,0
95
1,1
07
1,0
95
1,1
24
1,1
35
1,1
55
1,1
60
1,1
50
1,1
36
1,1
37
1,1
32
1,1
19
1,1
26
1,1
05
1,1
36
1,1
67
1,1
46
1,1
68
1,1
55
1,1
21
1,1
03
1,0
71
1,0
87
1,0
99
1,1
35
1,1
15
1,1
10
1,1
04
1,1
34
1,1
23
1,1
91
1,2
27
1,2
45
16
9
17
4
17
4 17
0
17
6
17
5
17
3
16
9
15
9
15
6
15
1
14
5
15
9
14
5 13
6 12
9
13
1
11
4
12
2
12
0
11
7
11
2
11
7
13
9 13
6
14
4
13
9
14
4 14
7
16
1
17
6 16
2
17
3
12
64
12
81
12
69
12
94
13
11
13
30
13
33
13
19
12
95
12
93
12
83
12
64
12
85
12
50
12
72
12
96
12
77
12
82
12
77
12
41
12
20
11
83
12
04
12
38
12
71
12
59
12
49
12
48
12
81
12
84 1
36
7
13
89
14
18
700
800
900
1,000
1,100
1,200
1,300
1,400
1,500
Nu
mb
er
of
Pe
op
le
Number of People Receiving Domiciliary Care at Month End
Purchased Service Receiving Service - In-house Total

Domiciliary Care
Version Status: Final 40 Version Date: 1 March 2017
60
55
46
51
61
44
48
62
38
53
44
56
35
36
68
65
41
53
38
39
26
33
59
47
68
41
62
42
63
36
51
51
24
7 13
9
10
12
9 3
6
6
11
7
10
22
8
9
5
13
9
22 15
11
6
25
27
24
33
12
19
21
36
30 2
3
26
0
10
20
30
40
50
60
70
80
90
100
Ap
r-1
4
Ma
y-1
4
Jun
-14
Jul-
14
Au
g-1
4
Se
p-1
4
Oct
-14
No
v-1
4
De
c-1
4
Jan
-15
Fe
b-1
5
Ma
r-1
5
Ap
r-1
5
Ma
y-1
5
Jun
-15
Jul-
15
Au
g-1
5
Se
p-1
5
Oct
-15
No
v-1
5
De
c-1
5
Jan
-16
Fe
b-1
6
Ma
r-1
6
Ap
r-1
6
Ma
y-1
6
Jun
-16
Jul-
16
Au
g-1
6
Se
p-1
6
Oct
-16
No
v-1
6
De
c-1
6
Nu
mb
er
of
Pe
op
le
Number of People Starting to Receive Domiciliary Care
Starters in-house Starters Purchased Service
540 515 662
-
200
400
600
800
2014 2015 2016
Nu
mb
er
of
Sta
rts
Cumulative Starts - In House and Purchased
Domiciliary Care
People starting to receive a domiciliary
care package
What is working well? What are we worried about? What are we going to do? Some reductions in overall number of service users
have been achieved from time to time but have not
been sustained.
Anecdotally, there have been some improvements in
the flow of service users into the service, although data
needs to be sought to confirm this.
The number of people receiving a long-term home care package
from either an independent provider or the council’s own
service has continued to remain at high levels and the overall
number of hours delivered is continuing to increase month on
month. We are supporting higher levels of domiciliary care in
the community than we have ever supported before.
Conversely, numbers were projected to reduce within the
Western Bay business model for intermediate care.
We need to scrutinise the routes into long-
term domiciliary care to ensure that
appropriate decisions are put in place before
agreeing new or increased packages of care.
Work is commencing to map this and then
ensure appropriate test and challenge
arrangements are in place.

Domiciliary Care
Version Status: Final 41 Version Date: 1 March 2017
What is working well? What are we worried about? What are we going to do? Anecdotally, there have been some improvements in
the flow of service users into the service, although data
needs to be sought to confirm this.
The overall number of new starters has gone up during the
course of 2016 and new starts exceed new starts in the previous
2 financial years. Historically, there were panel arrangements in
place to agree all new and reviewed packages of care. These
arrangements were removed on moving to the Integrated Hubs
to improve flow through the system as they were perceived as
bureaucratic. However, it would appear that removing this layer
of decision making has led to more people being supported
than ever before.
As above.
Anecdotally, there have been some improvements in
the flow of service users into the service. Data should
be sought to confirm this.
The overall number of new starters has gone up during the
course of 2016 and new starts exceed new starts in the previous
2 financial years.
A Commissioning Review is underway within
this area of service.
The number of new starters for the in-house service since
February 2016 has increased
We will look into this issue more closely.
Monthly Home Care Hours Provided
56
,11
3
57
,98
3
56
,62
5
58
,97
7
59
,52
7
58
,40
0
60
,59
4
58
,50
7
59
,92
8
60
,07
8
54
,72
5
60
,57
0
58
,57
8
58
,91
2
58
,84
9
62
,62
7
62
,31
7
60
,59
6
62
,39
8
59
,80
6
59
,79
3
58
,06
3
56
,05
3
60
,32
9
59
,25
2
60
,49
9
57
,49
5
58
,83
0
60
,76
4
61
,70
1
64
,87
8
65
,44
3
62
,89
5
5,7
31
5,7
82
5,5
96
5,5
83
5,7
17
5,5
92
5,5
83
5,3
17
5,3
73
5,2
97
4,6
75
5,0
92
5,7
68
5,9
72
5,6
32
5,5
63
5,5
06
5,2
21
6,0
90
6,8
11
7,3
11
7,3
14 6,3
17
7,1
61
8,4
22
9,1
13 7
,98
0
7,9
28
7,8
01
7,4
11
8,1
34
7,8
40 8,0
63
61
,84
3
63
,76
5
62
,22
1
64
,56
0
65
,24
4
63
,99
2
66
,17
7
63
,82
4
65
,30
2
65
,37
5 5
9,4
00
65
,66
2
64
,34
6
64
,88
5
64
,48
1
68
,19
0
67
,82
3
65
,81
7
68
,48
8
66
,61
7
67
,10
4
65
,37
7
62
,37
0
67
,49
0
67
,67
5
69
,61
2
65
,47
5
66
,75
8
68
,56
6
69
,11
2
73
,01
2
73
,28
3
70
,95
9
40,000
45,000
50,000
55,000
60,000
65,000
70,000
75,000
Ap
r 1
4
May
14
Jun
14
Jul 14
Au
g 1
4
Se
p 1
4
Oct
14
No
v 14
Dec
14
Jan 1
5
Fe
b 1
5
Mar
15
Ap
r 1
5
May
15
Jun
15
Jul 15
Au
g 1
5
Se
p 1
5
Oct
15
No
v 15
Dec
15
Jan 1
6
Fe
b 1
6
Mar
16
Ap
r 1
6
May
16
Jun
16
Jul 16
Au
g 1
6
Se
p 1
6
Oct
16
No
v 16
Dec
16
Nu
mb
er
of
Ho
urs
Total Hours of Care Provided to All Clients
Hours - Purchased Service Hours - In-house Total Monthly Home Care Hours Provided

Domiciliary Care
Version Status: Final 42 Version Date: 1 March 2017
51 52 51 52 52 51 52 51 53 53 48
54 52 53 52 54 54 52 54 53 54 54 51 55 52 54 52 53 53 51 52 50 51
34 33 32 33 32 32 32 31 34 34 31 35 36
41 41 43 42 46
50 57
62 65
54 52
62 63 57 55 53
46 46 48 47
-
20
40
60
80
Average Monthly Hours of Home Care Provided by Provider Type
Average Monthly Hours -Purchased Average Monthly Hours - In-house
Average Monthly Carer Hours Provided per Client
What is working well? What are we worried about? What are we going to do? A large number of hours of home care are being
provided independently or from the local authority,
which means that delayed transfers of care are at a
minimum and people are actively being supported to
remain independent at home.
Number of hours delivered has resumed the high levels
seen last autumn and subsequently the number of
hours delivered has continued to increase.
Work is underway to review all long-term packages of
care to ensure they continue to meet need. We also
need to scrutinise the routes into long-term domiciliary
care to ensure that appropriate decisions are put in
place before agreeing new or increased packages of
care. Work is commencing to map this and then ensure
appropriate test and challenge arrangements are in
place.
Sustainability of independent providers can result in
the local authority needing to absorb additional care
hours
A Commissioning Review is underway within this area
of service, and the outcome of the consultation will go
to Cabinet on 20th
April. This will include a
recommendation to recommission the external service
on a patch based approach which will help to
strengthen the sustainability of the external sector.
Work is also underway to support the external sector
with recruitment and retention of staff to help
strengthen the sector.
Purchased service has maintained a steady average
care package size.
There appears to be some considerable growth in the
size of the average in-house package.
We will look more closely at the data for hours of care
provided by the in-house service.

Day Services – Older People
Version Status: Final 43 Version Date: 1 March 2017
Day Services for Older People Resource Utilisation of Day Services for Older People
The charts show that there has been some variation in the
take-up and usage of day services for older people. Abergelli
(which focuses on older people with a learning disability) and
Norton Lodge are achieving high percentages of attendance.
The Hollies and Rose Cross have significant capacity which had
been unallocated. St John’s and Ty Waunarlwydd show a more typical profile with around 80% of capacity allocated and around 65% of capacity attended over the period,
improving on p .
What is working well? What are we worried about? What are we going to do? We have newly-established consistent recording and
reporting methods across these services.
There is some variation between services in terms of
resource utilisation.
Work is underway to look at various issues of capacity
and allocation. There have been improvements since
the last report.
Abergelli Norton Lodge St Johns
Ty
Waunarlwyd
d
The Hollies Rose Cross
Not allocated 372 178 392 500 540 1250
Allocated Unattended 433 297 502 366 235 257
Allocated Attended 3325 1977 1793 1594 405 973
Total Capacity 4134 2500 2670 2460 1180 2480
4,134
2,5002,670
2,460
1,180
2,480
0
500
1000
1500
2000
2500
3000
3500
4000
4500
Att
en
da
nce
Da
ys
Day Services Older People: July to December 2016
Allocated Attended Allocated Unattended Not allocated Total Capacity
0%
10%
20%
30%
40%
50%
60%
70%
80%
90%
100%
Att
en
da
nce
Da
ys
Allocated Attended Allocated Unattended
Not allocated

Safeguarding & Deprivation of Liberty Safeguards (DoLS)
Version Status: Final 44 Version Date: 1 March 2017
Safeguarding Vulnerable Adults There are a number of national and local performance indicators relating to safeguarding. All of these are new and therefore baselines are still being set for targets and, in
some cases, definitions. The performance measures focus on issues of the timeliness of response to safeguarding referrals and the most vulnerable people in residential /
nursing care.
Summary of Expectations / Standards Summary of Outcomes / Performance Effective safeguarding procedures are dependent on effective enquiries being made.
Local Indicator AS5: The percentage of individuals for whom an adult protection referral has been
completed where the subject has an active care and support plan at the end of period. A local
target has been set to achieve lower than 85% reflecting a desire to allow former safeguarding
clients to maintain independence without ongoing managed care.
Slightly lower performance in quarter 1 will affect the whole-year
performance on this indicator. Nonetheless, to end of January the
target is being met at 84.1%.
Local Indicator AS6: Number of adult clients receiving residential / nursing care where the service
provider is subject to escalating concerns protocol. It is preferable for this number to be as low as
possible at any time but no target has been set since 0 would be the preferred result.
At the end of December 2016, there was one home under the
Escalating Concerns protocol, with 12 adult social services clients
resident at that time. At the end of January 2017, there were no
homes under the Escalating Concerns protocol.
Local Indicator AS7: The percentage of safeguarding referrals relating to people in residential /
nursing care homes where the individual had been the subject of a previous safeguarding referral.
A local target has been set to achieve lower than 20% reflecting a desire to ensure that once
issues have been dealt with by providers, future safeguarding concerns would be reduced.
Currently to the end of Q3, performance was 34.8%. We have thus far
not met this in any quarter. The target and it may in fact need to be
adjusted because it may not be possible to achieve it.
Local Indicator AS8: Percentage of adult protection referrals to Adult Services where decision is
taken within 24 hours. A local target has been set to achieve higher than 80% reflecting a desire to
ensure that matters are dealt with promptly but recognising that there will once always be
occasions where decisions cannot be taken within a day.
Currently performance on this indicator is below target at 61.4%.
Staff are being reminded to ensure they respond as promptly as is
prompt and safe for the circumstances. Performance improved
considerably after Q2.
National Indicator: Measure 18: The percentage of adult protection enquiries completed within 7
days. . A local target has been set to achieve higher than 95% reflecting a desire to ensure that
matters are dealt with as promptly as possible but recognising that there will once always be
occasions where decisions cannot be taken even within a week.
Currently performance on this indicator is below target at 86%. Staff
are being reminded to ensure they respond as promptly as is prompt
and safe for the circumstances. Performance was poor in Q1 but for
Q2 and Q3 combined, performance was 94%.
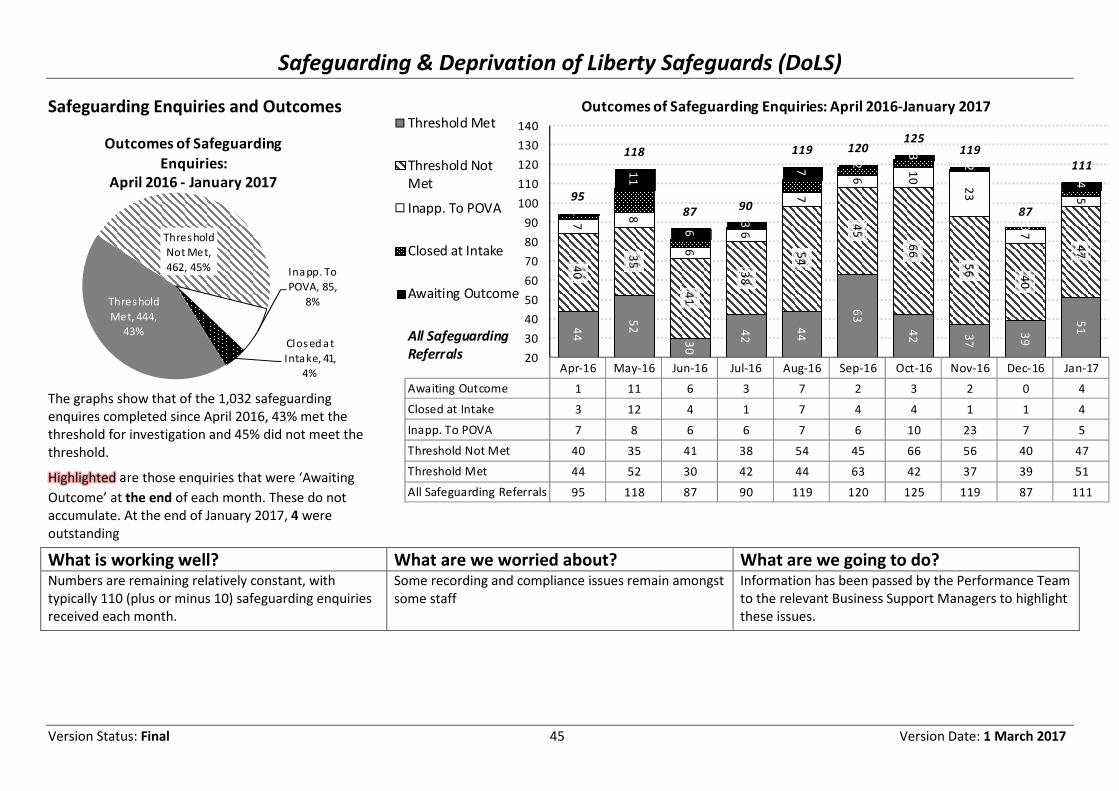
Safeguarding & Deprivation of Liberty Safeguards (DoLS)
Version Status: Final 45 Version Date: 1 March 2017
Safeguarding Enquiries and Outcomes
The graphs show that of the 1,032 safeguarding
enquires completed since April 2016, 43% met the
threshold for investigation and 45% did not meet the
threshold.
are those enquiries that were ‘Awaiting Highlighted
Outcome’ at the end of each month. These do not
accumulate. At the end of January 2017, 4 were
outstanding
What is working well? What are we worried about? What are we going to do? Numbers are remaining relatively constant, with
typically 110 (plus or minus 10) safeguarding enquiries
received each month.
Some recording and compliance issues remain amongst
some staff
Information has been passed by the Performance Team
to the relevant Business Support Managers to highlight
these issues.
Threshold
Met, 444,
43%
Threshold
Not Met,
462, 45% Inapp. To
POVA, 85,
8%
Clos ed at
Intake, 41,
4%
Outcomes of Safeguarding
Enquiries:
April 2016 - January 2017
Apr-16 May-16 Jun-16 Jul-16 Aug-16 Sep-16 Oct-16 Nov-16 Dec-16 Jan-17
Awaiting Outcome 1 11 6 3 7 2 3 2 0 4
Closed at Intake 3 12 4 1 7 4 4 1 1 4
Inapp. To POVA 7 8 6 6 7 6 10 23 7 5
Threshold Not Met 40 35 41 38 54 45 66 56 40 47
Threshold Met 44 52 30 42 44 63 42 37 39 51
All Safeguarding Referrals 95 118 87 90 119 120 125 119 87 111
44
52
30
42
44
63
42 37
39
51
40
35
41
38
54
45
66
56 4
0
47
7
8
6
6
7
6
10
23
7
5
1
11
6
3
7
2
3
2
0
4
95
118
87 90
119 120125
119
87
111
20
30
40
50
60
70
80
90
100
110
120
130
140
Outcomes of Safeguarding Enquiries: April 2016-January 2017 Threshold Met
Threshold Not
Met
Inapp. To POVA
Closed at Intake
Awaiting Outcome
All Safeguarding
Referrals
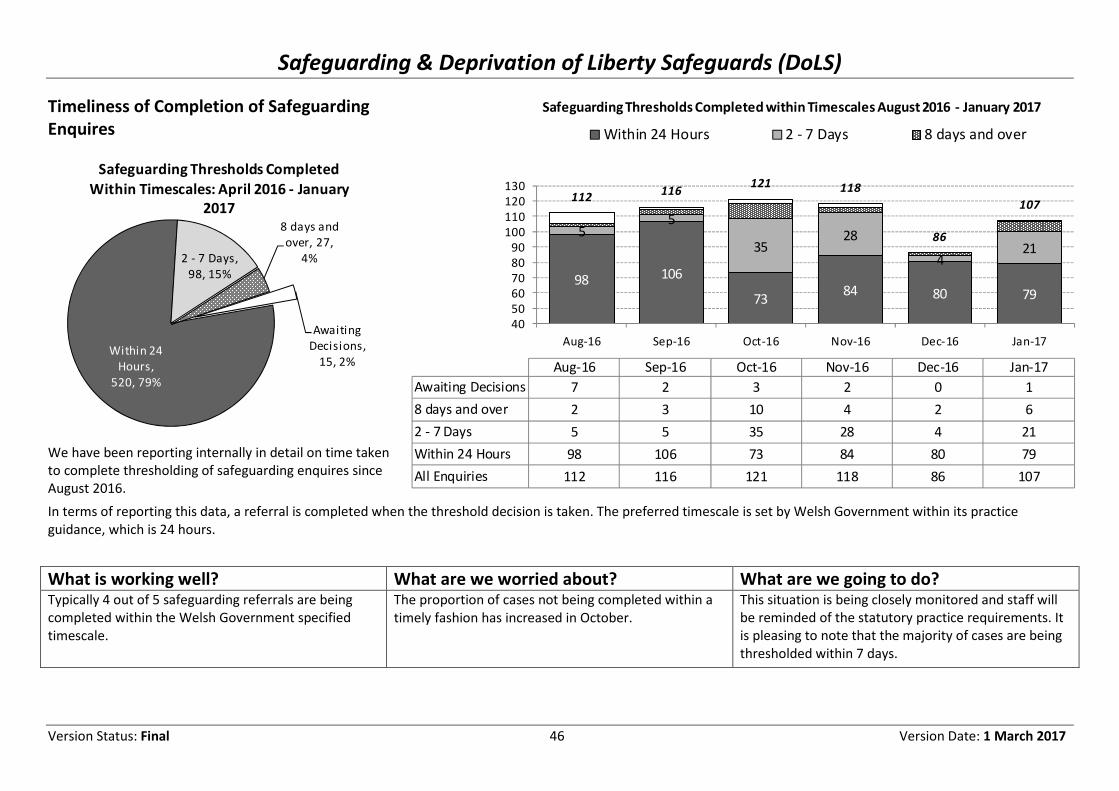
Safeguarding & Deprivation of Liberty Safeguards (DoLS)
Version Status: Final 46 Version Date: 1 March 2017
Within 24
Hours,
520, 79%
2 - 7 Days,
98, 15%
8 days and
over, 27,
4%
Awaiting
Decisions,
15, 2%
Safeguarding Thresholds Completed
Within Timescales: April 2016 - January
2017
Timeliness of Completion of Safeguarding
Enquires
We have been reporting internally in detail on time taken
to complete thresholding of safeguarding enquires since
August 2016.
In terms of reporting this data, a referral is completed when the threshold decision is taken. The preferred timescale is set by Welsh Government within its practice
guidance, which is 24 hours.
What is working well? What are we worried about? What are we going to do? Typically 4 out of 5 safeguarding referrals are being
completed within the Welsh Government specified
timescale.
The proportion of cases not being completed within a
timely fashion has increased in October.
This situation is being closely monitored and staff will
be reminded of the statutory practice requirements. It
is pleasing to note that the majority of cases are being
thresholded within 7 days.
98 106
7384 80 79
55
3528
421
112116
121 118
86
107
40
50
60
70
80
90
100
110
120
130
Aug-16 Sep-16 Oct-16 Nov-16 Dec-16 Jan-17
Aug-16 Sep-16 Oct-16 Nov-16 Dec-16 Jan-17
Awaiting Decisions 7 2 3 2 0 1
8 days and over 2 3 10 4 2 6
2 - 7 Days 5 5 35 28 4 21
Within 24 Hours 98 106 73 84 80 79
All Enquiries 112 116 121 118 86 107
Safeguarding Thresholds Completed within Timescales August 2016 - January 2017
Within 24 Hours 2 - 7 Days 8 days and over
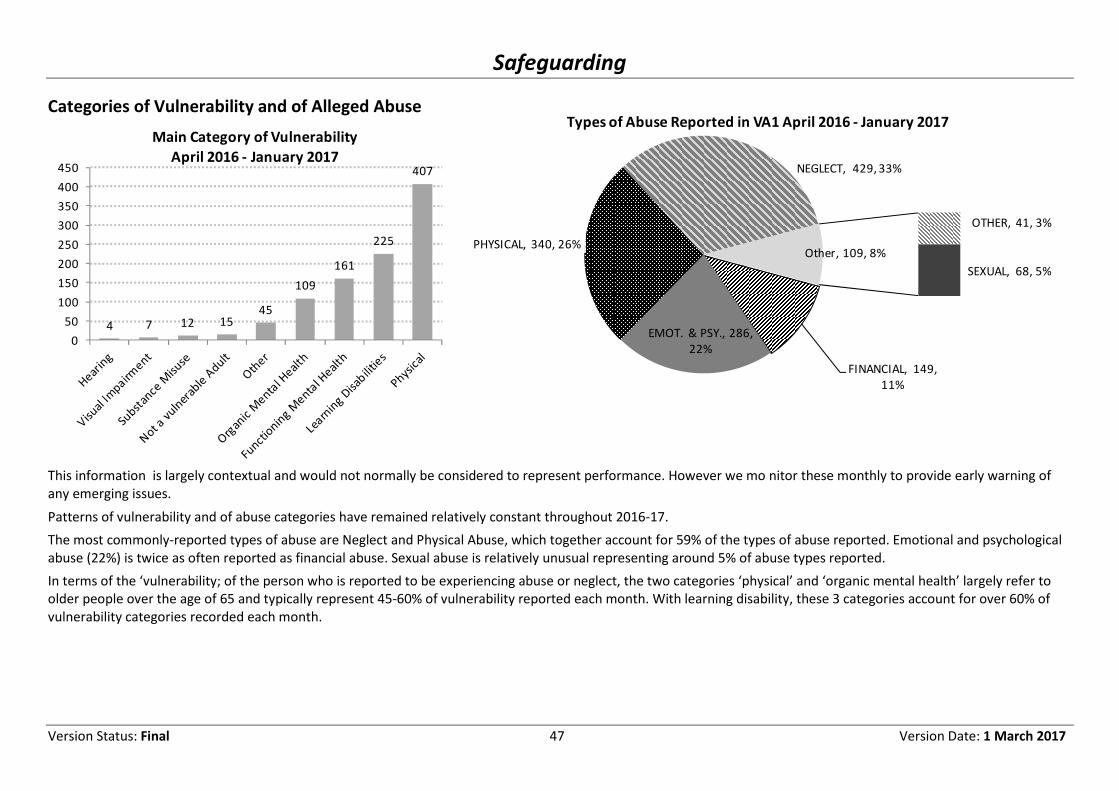
Safeguarding
Version Status: Final 47 Version Date: 1 March 2017
Categories of Vulnerability and of Alleged Abuse
4 7 12 1545
109
161
225
407
0
50
100
150
200
250
300
350
400
450
Main Category of Vulnerability
April 2016 - January 2017
This information is largely contextual and would not normally be considered to represent performance. However we mo nitor these monthly to provide early warning of
any emerging issues.
Patterns of vulnerability and of abuse categories have remained relatively constant throughout 2016-17.
The most commonly-reported types of abuse are Neglect and Physical Abuse, which together account for 59% of the types of abuse reported. Emotional and psychological
abuse (22%) is twice as often reported as financial abuse. Sexual abuse is relatively unusual representing around 5% of abuse types reported.
In terms of the ‘vulnerability; of the person who is reported to be experiencing abuse or neglect, the two categories ‘physical’ and ‘organic mental health’ largely refer to
older people over the age of 65 and typically represent 45-60% of vulnerability reported each month. With learning disability, these 3 categories account for over 60% of
vulnerability categories recorded each month.
OTHER, 41, 3%
SEXUAL, 68, 5%
FINANCIAL, 149,
11%
EMOT. & PSY., 286,
22%
PHYSICAL, 340, 26%
NEGLECT, 429, 33%
Other, 109, 8%
Types of Abuse Reported in VA1 April 2016 - January 2017
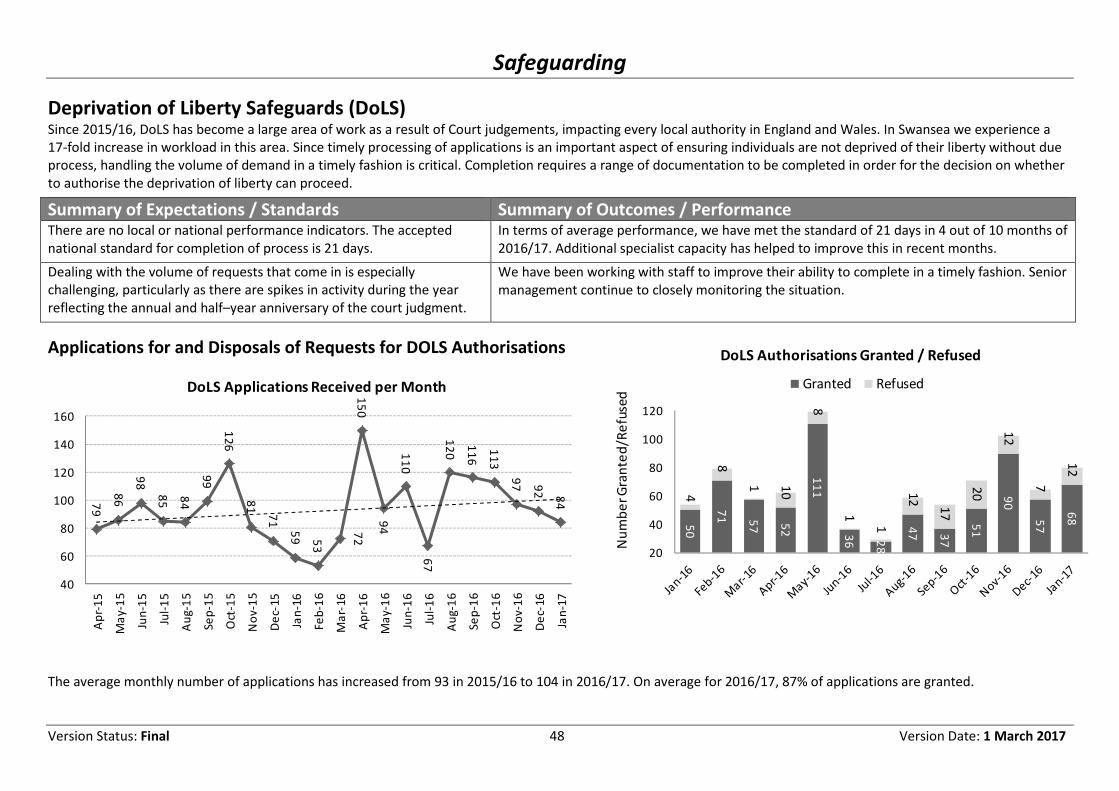
Safeguarding
Version Status: Final 48 Version Date: 1 March 2017
50
71 5
7 52
11
1
36 28
47 3
7
51
90
57
68
4
8
1 10
8
1
1
12
17
20
12
7
12
20
40
60
80
100
120
Nu
mb
er
Gra
nte
d/R
efu
sed
DoLS Authorisations Granted / Refused
Granted Refused
Deprivation of Liberty Safeguards (DoLS) Since 2015/16, DoLS has become a large area of work as a result of Court judgements, impacting every local authority in England and Wales. In Swansea we experience a
17-fold increase in workload in this area. Since timely processing of applications is an important aspect of ensuring individuals are not deprived of their liberty without due
process, handling the volume of demand in a timely fashion is critical. Completion requires a range of documentation to be completed in order for the decision on whether
to authorise the deprivation of liberty can proceed.
Summary of Expectations / Standards Summary of Outcomes / Performance There are no local or national performance indicators. The accepted
national standard for completion of process is 21 days.
In terms of average performance, we have met the standard of 21 days in 4 out of 10 months of
2016/17. Additional specialist capacity has helped to improve this in recent months.
Dealing with the volume of requests that come in is especially
challenging, particularly as there are spikes in activity during the year
reflecting the annual and half–year anniversary of the court judgment.
We have been working with staff to improve their ability to complete in a timely fashion. Senior
management continue to closely monitoring the situation.
Applications for and Disposals of Requests for DOLS Authorisations
The average monthly number of applications has increased from 93 in 2015/16 to 104 in 2016/17. On average for 2016/17, 87% of applications are granted.
79
86
98
85 84
99
12
6
81
71
59 5
3
72
15
0
94
11
0
67
12
0
11
6
11
3
97 9
2 84
40
60
80
100
120
140
160
Ap
r-1
5
Ma
y-1
5
Jun
-15
Jul-
15
Au
g-1
5
Se
p-1
5
Oct
-15
No
v-1
5
De
c-1
5
Jan
-16
Fe
b-1
6
Ma
r-1
6
Ap
r-1
6
Ma
y-1
6
Jun
-16
Jul-
16
Au
g-1
6
Se
p-1
6
Oct
-16
No
v-1
6
De
c-1
6
Jan
-17
DoLS Applications Received per Month

Safeguarding
Version Status: Final 49 Version Date: 1 March 2017
Processing DoLS Applications
76
10687
75
10191
83102
130
4440
90
140
Outstanding BIA Assessments At Month End
4
11 12 1316
3
8 73
7
1
0
5
10
15
20
Outstanding Doctors' Assessments At Month End
4 6 104
11 8
21 2331
4738
58
47
2130 26
35 35
2012 15
25
0
20
40
60
Nu
mb
er
of
da
ys
Average Time Taken In Days From Allocation To Signatory To Awarding DoLS
What is working well? What are we worried about? What are we going to do? Applications have been fairly constant since August
2016
The number of authorisations has not kept pace with
the number of applications.
Dedicated resource has been introduced to deal with
the number of authorisations that need to be
completed.
Following senior management intervention,
outstanding Best Interests and Doctor’s Assessments
have been brought under control.
We will want to seek to avoid further bottlenecks in the
process leading to a backlog accruing.
There are some additional issues relating to case
allocation which are being dealt with. A longer term
plan is also being developed to look at how we can
effectively manage normal flow.
Introduction of dedicated resource to deal with the
number of authorisations has improved timeliness.
There is continued pressure from existing
authorisations requiring review
Continue to monitor the situation very closely.

Planned Future Developments to this Report
Version Status: Final 50 Version Date: 1 March 2017
Planned Future Developments to this Report The following have been identified as subject matter that we wish to develop
capability of providing accurate, reliable and meaningful information.
Assessment & Care Management Caseloads & reviews is a topic that we will be working on throughout 2017, across
mental health, learning disability and integrated services.
Mental Health referrals will be added to the next report, as well as performance
on reviewing those with an active Care and Treatment Plan..
Learning Disability referrals and assessments will be delivered before the Summer
2017.
Well-Being and Prevention Services The Local Area Co-ordination (LAC) service will be developing additional metrics
during 2017.
We will be developing appropriate metrics for other related services.
Service provision Older People:
• Utilisation of local authority residential care – capacity and occupancy
Learning Disability:
• Numbers in residential / nursing plus supported living
• Utilisation of day services: allocation / attendance
• Respite Services
Mental Health
• Numbers in residential / nursing plus supported living
• Numbers in day services
Direct Payments
• Specific data items to be confirmed
Carers
• Specific data items to be confirmed
Safeguarding POVA:
• Outstanding work
• Provider issues summary
DoLS:
• We will continue to consider further metrics
Human Resources This section of the report will be developed over time to incorporate material on
human resources issues. Topics currently being considered include:-
• Sickness
• Agency Staff

Planned Future Developments to this Report
Version Status: Final 51 Version Date: 1 March 2017
Appendix A: Performance Indicators The following pages list the most recent recorded performance on each of the performance indicators that are currently used within social services.
New Social Services and Well-Being Act Statutory Measures
Performance Results for 2016-17
Q3 Data as at 8 February 2017Period Numerator*
Denomina
tor *
Swansea
2016/17
Wales
Average
2015/16
Swansea
Target
2016/17**
Desired
direction
of travel
StatusDistance
from Target
Measure 18: The percentage of adult protection enquiries
completed within 7 days Q1-3 2016/17 811 943 86.00 95 ↑ R -9.5%
Measure 19: Delayed transfers per 1,000 people aged 75+ (Was
SCA001)Q1-3 2016/17 92 21,619 4.26 4.87 6 ↓ G -29.1%
Measure 20a: The percentage of adults who completed a period
of reablement and have a reduced package of care and support 6
months later
Q1-3 2016/17 315 476 66.18 50 ↑ G 32.4%
Measure 20b: The percentage of adults who completed a period
of reablement and have no package of care and support 6 months
later
Q1-3 2016/17 132 476 27.73 25 ↑ G 10.9%
Measure 21: The average length of time older people (aged 65 or
over) are supported in residential care homes Q1-3 2016/17 1,404,360 1,368 1,026.58 1000 ↓ A 2.7%
Measure 22: Average age of adults entering residential care
homes Q1-3 2016/17 15,438 185 83.45 84 ↑ A -0.7%
Existing Non-Statutory Local Measures
Performance Results for 2016-17
Q3 Data as at 8 February 2017Period Numerator*
Denomina
tor*
Swansea
2016/17
Wales
Average
2015/16
Swansea
Target
2016/17 †
Desired
direction
of travel
StatusDistance
from Target
SSA1 - The MEDIAN number of working days between initial
enquiry and completion of the care plan, including specialist
assessments
Q1-3 2016/17 16 1 15.98 — 18.50 Down G -13.6%
AS4 - Percentage of clients returning home following RESIDENTIAL
reablementQ1-3 2016/17 89 132 67.42 — 58.00 Down G 16.2%
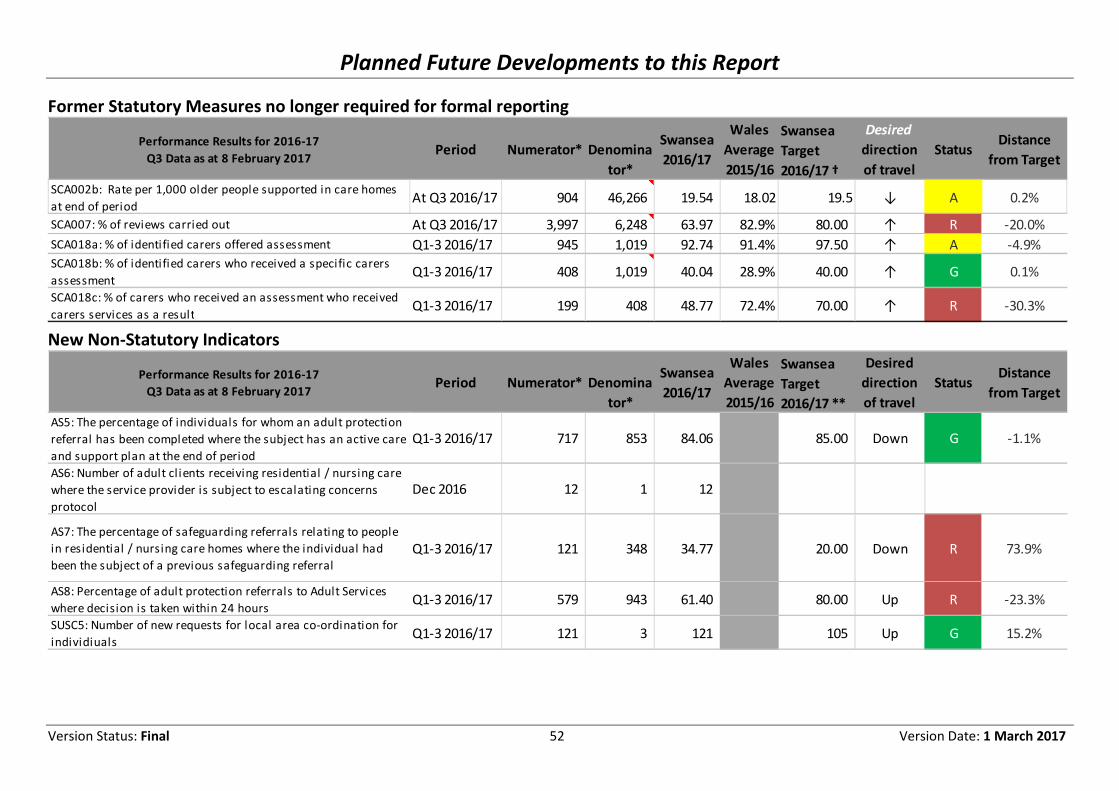
Planned Future Developments to this Report
Version Status: Final 52 Version Date: 1 March 2017
Former Statutory Measures no longer required for formal reporting
Performance Results for 2016-17
Q3 Data as at 8 February 2017Period Numerator* Denomina
tor*
Swansea
2016/17
Wales
Average
2015/16
Swansea
Target
2016/17 †
Desired
direction
of travel
StatusDistance
from Target
SCA002b: Rate per 1,000 older people supported in care homes
at end of periodAt Q3 2016/17 904 46,266 19.54 18.02 19.5 ↓ A 0.2%
SCA007: % of reviews carried out At Q3 2016/17 3,997 6,248 63.97 82.9% 80.00 ↑ R -20.0%
SCA018a: % of identified carers offered assessment Q1-3 2016/17 945 1,019 92.74 91.4% 97.50 ↑ A -4.9%
SCA018b: % of identified carers who received a specific carers
assessmentQ1-3 2016/17 408 1,019 40.04 28.9% 40.00 ↑ G 0.1%
SCA018c: % of carers who received an assessment who received
carers services as a resultQ1-3 2016/17 199 408 48.77 72.4% 70.00 ↑ R -30.3%
New Non-Statutory Indicators
Performance Results for 2016-17
Q3 Data as at 8 February 2017Period Numerator* Denomina
tor*
Swansea
2016/17
Wales
Average
2015/16
Swansea
Target
2016/17 **
Desired
direction
of travel
StatusDistance
from Target
AS5: The percentage of individuals for whom an adult protection
referral has been completed where the subject has an active care
and support plan at the end of period
Q1-3 2016/17 717 853 84.06 85.00 Down G -1.1%
AS6: Number of adult cl ients receiving residential / nursing care
where the service provider is subject to escalating concerns
protocol
Dec 2016 12 1 12 - Down #DIV/0! #DIV/0!
AS7: The percentage of safeguarding referrals relating to people
in residential / nursing care homes where the individual had
been the subject of a previous safeguarding referral
Q1-3 2016/17 121 348 34.77 20.00 Down R 73.9%
AS8: Percentage of adult protection referrals to Adult Services
where decision is taken within 24 hours Q1-3 2016/17 579 943 61.40 80.00 Up R -23.3%
SUSC5: Number of new requests for local area co-ordination for
individiualsQ1-3 2016/17 121 3 121 105 Up G 15.2%
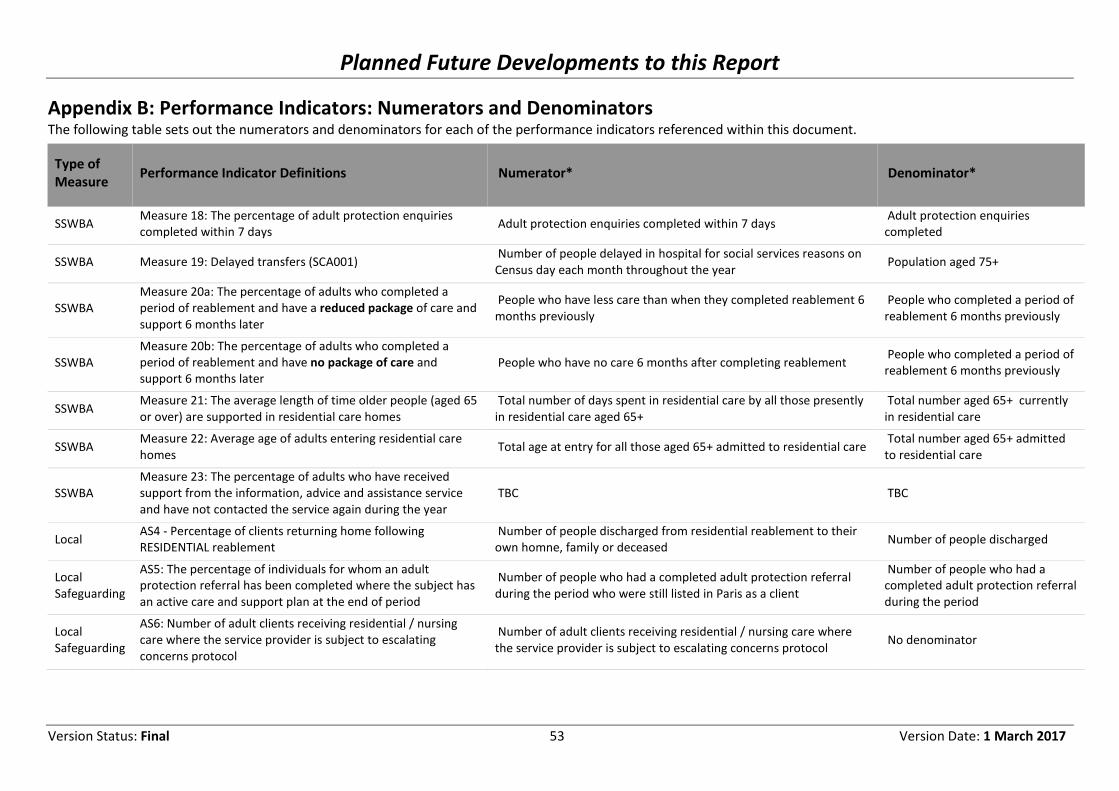
Planned Future Developments to this Report
Version Status: Final 53 Version Date: 1 March 2017
Appendix B: Performance Indicators: Numerators and Denominators The following table sets out the numerators and denominators for each of the performance indicators referenced within this document.
Type of
Measure Performance Indicator Definitions Numerator* Denominator*
SSWBA Measure 18: The percentage of adult protection enquiries
completed within 7 days Adult protection enquiries completed within 7 days
Adult protection enquiries
completed
SSWBA Measure 19: Delayed transfers (SCA001) Number of people delayed in hospital for social services reasons on
Census day each month throughout the year Population aged 75+
SSWBA
Measure 20a: The percentage of adults who completed a
period of reablement and have a reduced package of care and
support 6 months later
People who have less care than when they completed reablement 6
months previously
People who completed a period of
reablement 6 months previously
SSWBA
Measure 20b: The percentage of adults who completed a
period of reablement and have no package of care and
support 6 months later People who have no care 6 months after completing reablement
People who completed a period of
reablement 6 months previously
SSWBA Measure 21: The average length of time older people (aged 65
or over) are supported in residential care homes
Total number of days spent in residential care by all those presently
in residential care aged 65+
Total number aged 65+ currently
in residential care
SSWBA Measure 22: Average age of adults entering residential care
homes Total age at entry for all those aged 65+ admitted to residential care
Total number aged 65+ admitted
to residential care
SSWBA
Measure 23: The percentage of adults who have received
support from the information, advice and assistance service
and have not contacted the service again during the year TBC TBC
Local AS4 - Percentage of clients returning home following
RESIDENTIAL reablement Number of people discharged from residential reablement to their
own homne, family or deceased Number of people discharged
Local
Safeguarding
AS5: The percentage of individuals for whom an adult
protection referral has been completed where the subject has
an active care and support plan at the end of period
Number of people who had a completed adult protection referral
during the period who were still listed in Paris as a client
Number of people who had a
completed adult protection referral
during the period
Local
Safeguarding
AS6: Number of adult clients receiving residential / nursing
care where the service provider is subject to escalating
concerns protocol
Number of adult clients receiving residential / nursing care where
the service provider is subject to escalating concerns protocol No denominator
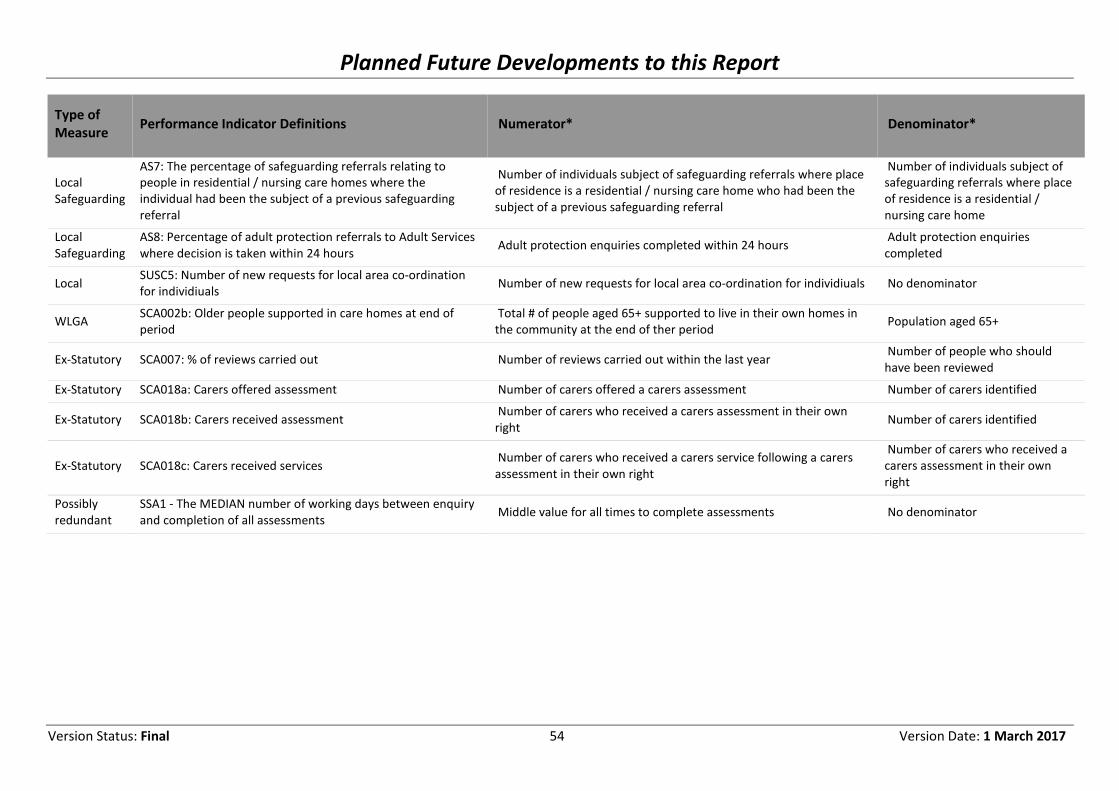
Planned Future Developments to this Report
Version Status: Final 54 Version Date: 1 March 2017
Type of
Measure Performance Indicator Definitions Numerator* Denominator*
Local
Safeguarding
AS7: The percentage of safeguarding referrals relating to
people in residential / nursing care homes where the
individual had been the subject of a previous safeguarding
referral
Number of individuals subject of safeguarding referrals where place
of residence is a residential / nursing care home who had been the
subject of a previous safeguarding referral
Number of individuals subject of
safeguarding referrals where place
of residence is a residential /
nursing care home
Local
Safeguarding
AS8: Percentage of adult protection referrals to Adult Services
where decision is taken within 24 hours Adult protection enquiries completed within 24 hours
Adult protection enquiries
completed
Local SUSC5: Number of new requests for local area co-ordination
for individiuals Number of new requests for local area co-ordination for individiuals No denominator
WLGA SCA002b: Older people supported in care homes at end of
period Total # of people aged 65+ supported to live in their own homes in
the community at the end of ther period Population aged 65+
Ex-Statutory SCA007: % of reviews carried out Number of reviews carried out within the last year Number of people who should
have been reviewed
Ex-Statutory SCA018a: Carers offered assessment Number of carers offered a carers assessment Number of carers identified
Ex-Statutory SCA018b: Carers received assessment Number of carers who received a carers assessment in their own
right Number of carers identified
Ex-Statutory SCA018c: Carers received services Number of carers who received a carers service following a carers
assessment in their own right
Number of carers who received a
carers assessment in their own
right
Possibly
redundant
SSA1 - The MEDIAN number of working days between enquiry
and completion of all assessments Middle value for all times to complete assessments No denominator

01/03/2017
1
Presentation to
Adult Social Services
Scrutiny & Performance Panel
ABMU HEALTH BOARD
Dai Roberts, Service Director MH & LD
Malcolm Jones, Locality Manager - Swansea
ABMU Health Board
� Mental Health & Learning Disabilities Delivery Unit set up in August 2015
� Comprises x 4 Localities, x 3 based in Local Authority areas, and SpecialistServices.
� Swansea Locality comprises :-
� Older People’s wards Cefn Coed Hospital
� Adult Wards Cefn Coed
� X 3 CMHT’s Adult
� X 4 CMHT’s Older People
� X 1 Crisis Team
� Recovery Unit Adult
� LPMHSS
� Learning Disabilities Community Teams
� CDAT
� Veterans
� Perinatal Services
� Eating Disorders
Item 6

01/03/2017
2
ABMU Health Board
What has been the impact of the Measure on Primary Mental Health Support Services?
� The implementation of Part 1 of Mental Health Measure, in partnership with LA’s
and the creation of Local Primary Mental Health Support Services.
� The services work alongside primary and has been seen to improve access to Part 1
service.
� Referrals to Local Primary Mental Health Support Services
0
200
400
600
800
1000
Apr May Jun Jul Aug Sep Oct Nov Dec Jan Feb Mar
2015/16
2016/17
ABMU Health Board
Satisfaction Surveys
Care and Treatment Planning Questionnaire
LPMHSS Experience of Service Questionnaire
.
61%
39%
0
0
I think the help I received will help me
cope better
Stronglyagree
Agree65%
30%
5%0
Overall I think I benefited from receiving this
service Stronglyagree
Agree
Neitheragree ordisagree
78%
17%
4% 0
I would recommend this service to other people
Stronglyagree
Agree
100%
Do you have a CTP?
Yes
No
Don't know83%
17%
Have you received copy of CTP?
Yes
No 67%
16%
17%
Did you feel Involved in CTP development?
Yes
No

01/03/2017
3
ABMU Health Board
The interface between Mental Health Primary Care Services and Social
Services.
� There is already integration of services
� Well established pathways support between Mental Health & Social
Services
� Can integration be improved further?
� Strategic commissioning group is an opportunity
� Work ongoing to align strategies
ABMU Health Board
Have there been any shifts in mental health in the Locality and the
causes of mental ill health?
� Increased incidences of dual diagnosis
� Dual diagnosis plan been adapted and implemented
� Homelessness nurse funded to support homeless community
� Veteran’s services, funding provided from WG
� “Legal” highs are a growing issue

01/03/2017
4
ABMU Health Board
� How do service users access and receive treatment for mental ill
health?
� Access to services has previously has been complicated
� Single point of access being developed; based on mental health
triage model
� Swansea SPOA pilot commenced in October 2016
� Initial findings are positive, ease of access and ownership of
referrals.
ABMU Health Board
How has the provision of primary mental health services expanded since the introduction of the Measure?
� LPMHSS introduced in 2012, from WG funding
� LPMHSS provides the following type of services
� Assessment
� 1:1 intervention
� Range of group interventions
� Further funding from WG expanding the team, providing moretherapy, expanding Tier O services
Overview & Scrutiny / Trosolwg a chraffu
City and County of Swansea / Dinas a Sir Abertawe Civic Centre, Swansea, SA1 3SN / Canolfan Ddinesig, Abertawe, SA1 3SN
C I T Y A N D C O U N T Y O F S W A N S E A———————————————————————————————————————————————
Dinas A Sir Abertawe
Dear Councillor Harris,
Impact Report: Scrutiny Inquiry – Social Care at Home
The panel would like to thank you and your officers for attending the panel meeting, presenting the impact report and answering our questions. Overall the panel was pleased with the progress that has been made in implementing the recommendations of the scrutiny inquiry.
Implementation of the recommendations We felt that the inquiry’s recommendations have had a real impact on the delivery of social care at home. We were pleased to see that of the 21 recommendations that were agreed by Cabinet, all have been completed.
What has changed since the inquiry The panel was pleased to see that the following things have changed since the report was presented to Cabinet
• Re-design of the Adult Services Model• A commissioning review of domiciliary care services for older people• Re-structure of the adult Services Intake Team• Introduction and expansion of Local Area Co-ordination• A better understanding of the underlying issues contributing to delays
in sourcing packages of care
Councillor Jane Harris Cabinet Member, Adults & Vulnerable People
Civic Centre Oystermouth Road SWANSEA SA1 3SN
Please ask for: Gofynnwch am:
Overview & Scrutiny
Direct Line: Llinell Uniongyrochol:
01792 637491
e-Mail e-Bost:
Our Ref Ein Cyf:
Adult Services/04
Your Ref Eich Cyf:
Date Dyddiad:
10/01/2017
Summary: This is a letter from the Adult Services Scrutiny Performance Panel to The Cabinet Member for Services for Adults and Vulnerable People following the meeting of the Panel on 14 December 2016. The panel examined the impact of the social care at home scrutiny inquiry which concluded in September 2014
ITEM 2A

Overview & Scrutiny / Trosolwg a chraffu
City and County of Swansea / Dinas a Sir Abertawe Civic Centre, Swansea, SA1 3SN / Canolfan Ddinesig, Abertawe, SA1 3SN
Impact of the inquiry The panel was pleased to learn that the inquiry had provided useful research and evidence which helped inform the service design for the adult services model and delivery options for the 3 commissioning reviews.
Finally, we were pleased that the inquiry had improved awareness and understanding of a complex topics amongst officers and councillors and had helped to promote constructive debate within the commissioning review process.
The panel considers the monitoring on this inquiry to be completed.
We have highlighted a number of issues in this letter which we agreed we would like to bring to your attention.
1. We would like you to consider providing an end date for thecommissioning reviews for day services and residential services whichwere highlighted as action already being undertaken inrecommendation 4.
2. Recommendation 10 – the panel was pleased that invitations forstakeholder workshops were sent to chairs of the relevant scrutinypanels and to all relevant scrutiny councillors
3. Recommendation 12 – the panel welcomed the development of aworking group with unions to develop a Swansea version of the Unisonethical charter.
4. Recommendation 13 – this was not agreed and did concern the panelhowever officers explained that rates were set on a provider byprovider basis and that the authority ensures it pays the minimum wageto providers. We did express our concerns regarding market failureespecially in the domiciliary care market and were informed about the“provider performance protocol” that providers operate under if theauthority is not satisfied with performance of the provider.
5. Recommendation 14 - the panel would like to request that you andyour officers consider the exclusivity of zero hour contracts as part ofthe ethical charter development work.
6. Recommendation 18 – the panel would like to request thatperformance information regarding the provision of basic items by thehealth board (eg, incontinence items) be added to the Adult ServicesPerformance Monitoring Report.
7. Recommendation 20 – the panel would like to request that data on thedelays in care pathways is added to the monthly performance report,specifically information on what type of cases are delayed and thereasons for the delay.
For your information the panel agreed to contact Fiona Broxton to thank her for all the work that had gone into the action plan and implementing the recommendations.

Overview & Scrutiny / Trosolwg a chraffu
City and County of Swansea / Dinas a Sir Abertawe Civic Centre, Swansea, SA1 3SN / Canolfan Ddinesig, Abertawe, SA1 3SN
The panel also agreed that it would contact the head of Housing and cabinet member for housing to request performance data on DFGs and delays in transfers of care as a result of delays in the DFG process.
Your Response We welcome your comments on any matter raised in this letter but we would specifically welcome your comments on points 1, 5, 8 and 7 above. The panel would be grateful for your response by 1 February 2017.
Yours sincerely
UTA CLAY CONVENERADULT SERVICES SCRUTINY PANEL
CLLR [email protected]