ADSL Dynamic Interoperability Testing
24
- 1 - Technical Report TR-029 ADSL Dynamic Interoperability Testing February 2000 ©2000 Digital Subscriber Line Forum. All Rights Reserved. DSL Forum technical reports may be copied, downloaded, stored on a server or otherwise re-distributed in their entirety only. Notwithstanding anything to the contrary, the DSL Forum makes no representation or warranty, expressed or implied, concerning this publication, its contents or the completeness, accuracy, or applicability of any information contained in this publication. No liability of any kind shall be assumed by the DSL Forum as a result of reliance upon any information contained in this publication. The DSL Forum does not assume any responsibility to update or correct any information in this publication. The receipt or any use of this document or its contents does not in any way create by implication or otherwise any express or implied license or right to or under any patent, copyright, trademark or trade secret rights which are or may be associated with the ideas, techniques, concepts or expressions contained herein.
Transcript of ADSL Dynamic Interoperability Testing

- 1 -
Technical Report TR-029
ADSL Dynamic Interoperability Testing
February 2000
©2000 Digital Subscriber Line Forum. All Rights Reserved. DSL Forum technical reports may be copied, downloaded, stored on a server or otherwise re-distributed in their entirety only. Notwithstanding anything to the contrary, the DSL Forum makes no representation or warranty, expressed or implied, concerning this publication, its contents or the completeness, accuracy, or applicability of any information contained in this publication. No liability of any kind shall be assumed by the DSL Forum as a result of reliance upon any information contained in this publication. The DSL Forum does not assume any responsibility to update or correct any information in this publication. The receipt or any use of this document or its contents does not in any way create by implication or otherwise any express or implied license or right to or under any patent, copyright, trademark or trade secret rights which are or may be associated with the ideas, techniques, concepts or expressions contained herein.
- 2 -
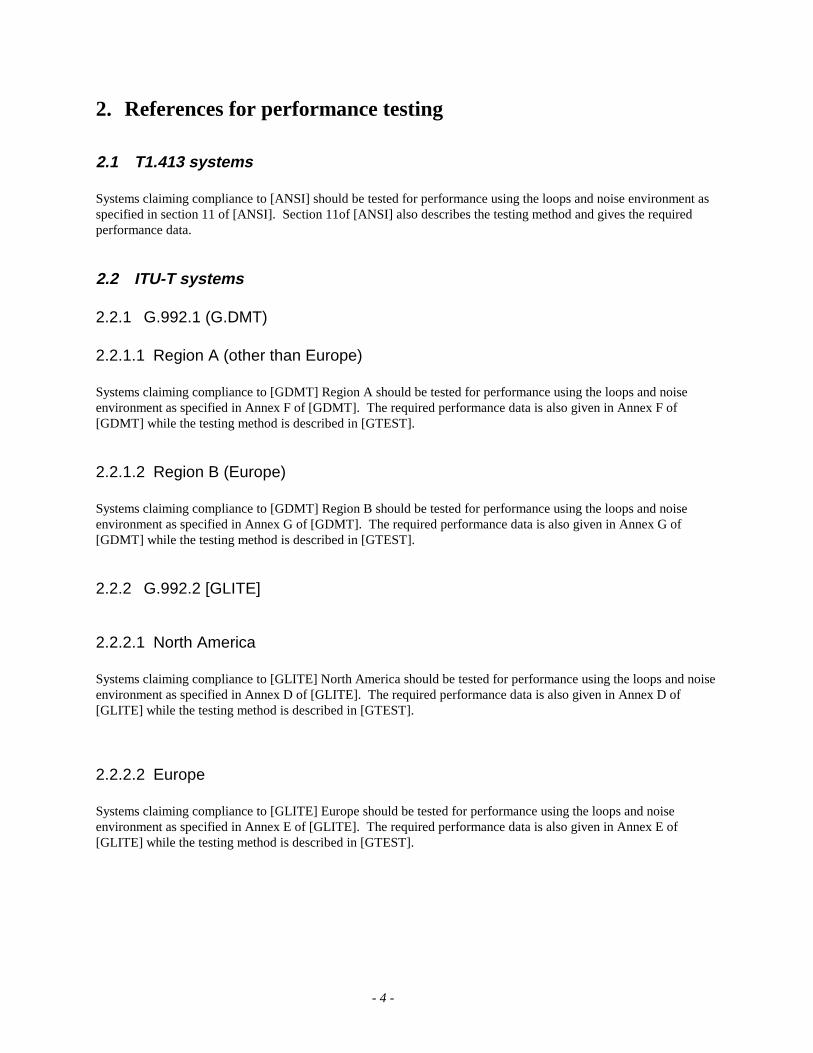
Table of contents
1. INTRODUCTION 3
2. REFERENCES FOR PERFORMANCE TESTING 4
2.1 T1.413 systems 4
2.2 ITU-T systems 4 2.2.1 G.992.1 (G.DMT) 4 2.2.2 G.992.2 [GLITE] 4
3. TEST SETUP 5
4. TEST SUITES 5
4.1 Parameters 5
4.2 Sample test suite description format 5
4.3 Test Suite for T1.413-1998 5
4.4 Test Suite for ITU G.992.1 6
4.5 Test Suite for ITU G.992.2 7
5. TEST CASES 7
5.1 Sample test case description format 7
5.2 Loop reach with external crosstalk and noise 8
5.3 Capacity on Standard loops with external crosstalk and noise 9
5.4 BER with external crosstalk and noise 9
5.5 Capacity on loop with bridged taps under external crosstalk and noise conditions 9
6. REFERENCES 10
ANNEX A : BIT ERROR RATIO TESTING OF ATM BASED ADSL SYSTEMS 11
A.1 General description of BER testing 11
A.2 Description 11
A.3 Test Requirements 12 A.3.1 External BER test requirements 12

- 3 -
ANNEX B : A METHOD TO PERFORM ATM BASED BIT ERROR RATIO TESTS WITHOUT EXTERNAL BER TOOLS 14
B.1 Requirements of an internal BER tool 14 B.1.1 Traffic Generator 14 B.1.2 Traffic Analyzer 14
B.2 Measurement results 16
ANNEX C : REFERENCE TEST SETUP FOR ATM BASED ADSL SYSTEMS 17
C.1 Introduction 17
C.2 Description 17 C.2.1 Cabling 19 C.2.2 Cable simulator 20 C.2.3 Noise generators 22 C.2.4 BER test equipment 23
C.3 Conclusion 23
7. LIST OF FIGURES 24
1. Introduction This document describes ADSL dynamic interoperability test suites and test cases. An ATU-C and an ATU-R are dynamically interoperable if they implement a common and compatible set of features, functions and options and can demonstrate satisfactory mutual communication in a real network architecture environment as performance test conditions are varied and exercised. "Compatible" means that there are no conflicting requirements that will prevent the ADSL system from achieving interoperability. Dynamic interoperability testing is often referred to as performance testing in ADSL and other telecommunication standards. Systems can be tested for performance both on standard loops and on a set of additional loops. The procedures for each test case record which features from the referenced standards are used. Section 4 differentiates those test groups required for Dynamic Interoperability testing from those using non standard loops or conditions. Results from test groups using non standard loops or conditions can be used for characterization of Dynamic Interoperability. Annex A: provides information on how to do bit error ratio testing in an ATM based ADSL environment. Annex B: provides information on a method to perform ATM based BER testing without external BER tools. Annex C: provides a reference test setup for ATM based ADSL systems.
- 4 -
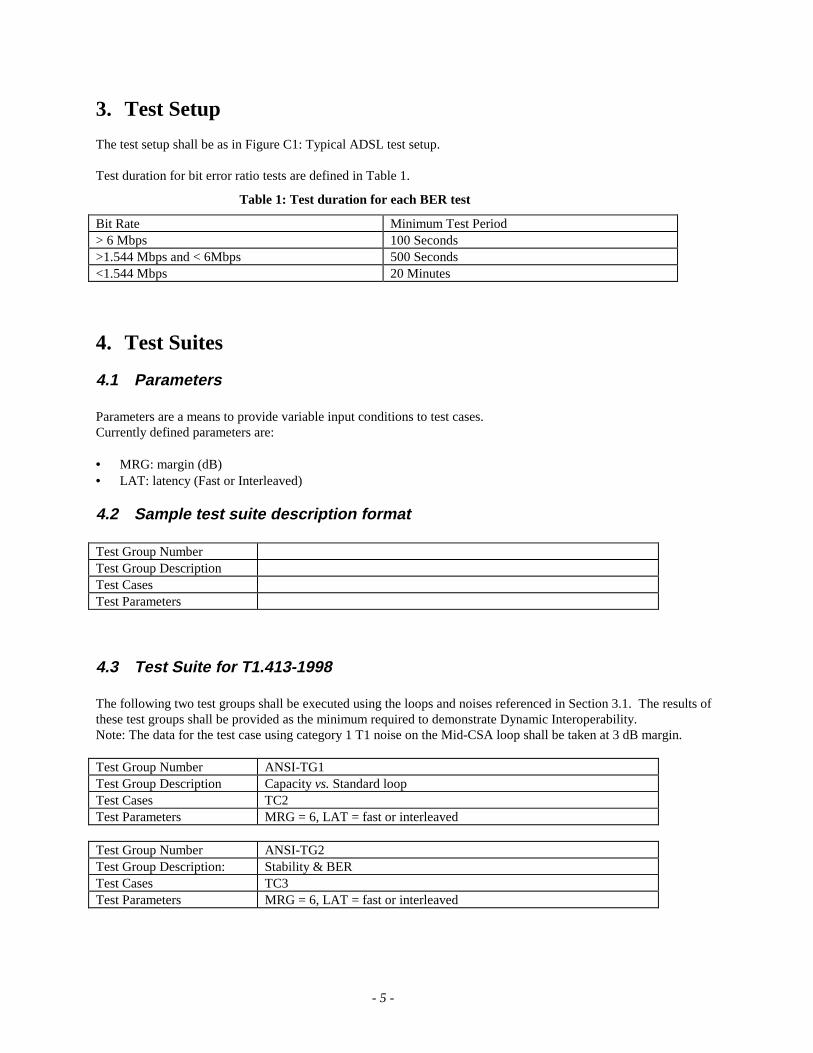
2. References for performance testing
2.1 T1.413 systems Systems claiming compliance to [ANSI] should be tested for performance using the loops and noise environment as specified in section 11 of [ANSI]. Section 11of [ANSI] also describes the testing method and gives the required performance data.
2.2 ITU-T systems
2.2.1 G.992.1 (G.DMT)
2.2.1.1 Region A (other than Europe) Systems claiming compliance to [GDMT] Region A should be tested for performance using the loops and noise environment as specified in Annex F of [GDMT]. The required performance data is also given in Annex F of [GDMT] while the testing method is described in [GTEST].
2.2.1.2 Region B (Europe) Systems claiming compliance to [GDMT] Region B should be tested for performance using the loops and noise environment as specified in Annex G of [GDMT]. The required performance data is also given in Annex G of [GDMT] while the testing method is described in [GTEST].
2.2.2 G.992.2 [GLITE]
2.2.2.1 North America Systems claiming compliance to [GLITE] North America should be tested for performance using the loops and noise environment as specified in Annex D of [GLITE]. The required performance data is also given in Annex D of [GLITE] while the testing method is described in [GTEST].
2.2.2.2 Europe Systems claiming compliance to [GLITE] Europe should be tested for performance using the loops and noise environment as specified in Annex E of [GLITE]. The required performance data is also given in Annex E of [GLITE] while the testing method is described in [GTEST].
- 5 -
3. Test Setup The test setup shall be as in Figure C1: Typical ADSL test setup. Test duration for bit error ratio tests are defined in Table 1.
Table 1: Test duration for each BER test
Bit Rate Minimum Test Period > 6 Mbps 100 Seconds >1.544 Mbps and < 6Mbps 500 Seconds <1.544 Mbps 20 Minutes
4. Test Suites
4.1 Parameters Parameters are a means to provide variable input conditions to test cases. Currently defined parameters are: • MRG: margin (dB) • LAT: latency (Fast or Interleaved)
4.2 Sample test suite description format Test Group Number Test Group Description Test Cases Test Parameters
4.3 Test Suite for T1.413-1998 The following two test groups shall be executed using the loops and noises referenced in Section 3.1. The results of these test groups shall be provided as the minimum required to demonstrate Dynamic Interoperability. Note: The data for the test case using category 1 T1 noise on the Mid-CSA loop shall be taken at 3 dB margin. Test Group Number ANSI-TG1 Test Group Description Capacity vs. Standard loop Test Cases TC2 Test Parameters MRG = 6, LAT = fast or interleaved Test Group Number ANSI-TG2 Test Group Description: Stability & BER Test Cases TC3 Test Parameters MRG = 6, LAT = fast or interleaved

- 6 -
The following test group provides additional performance information, using loops and noises appropriate to the two test cases as referenced in section 6.2 (TC1) and section 6.5 (TC4). The results of these test groups may be provided to broaden the scope of the demonstrated Dynamic Interoperability. Test Group Number ANSI-TG3 Test Group Description Capacity vs. non-standard loops Test Cases TC1, TC4 Test Parameters MRG = 6, LAT = fast or interleaved
4.4 Test Suite for ITU G.992.1 The following two test groups shall be executed using loops and noises as referenced in section 3.2.1.1 or 3.2.1.2. The results of these test groups shall be provided as the minimum required to demonstrate Dynamic Interoperability. Note: The data for the test case using category 1 T1 noise on the Mid-CSA loop shall be taken at 3 dB margin. Test Group Number G.992.1-TG1 Test Group Description Capacity vs. Standard loop Test Cases TC2 Test Parameters MRG = 6, LAT = fast or interleaved G.992.1-TG2 Test Group Description: Stability & BER Test Cases: TC3 Test Parameters MRG = 6, LAT = fast or interleaved The following test group provides additional performance information, using loops and noises appropriate to the two test cases as referenced in section 6.2 (TC1) and section 6.5 (TC4), to broaden the scope of the demonstrated Dynamic Interoperability. Test Group Number G.992.1-TG3 Test Group Description Capacity vs non-standard loops Test Cases TC1, TC4 Test Parameters MRG = 6, LAT = fast or interleaved

- 7 -
4.5 Test Suite for ITU G.992.2 The following two test groups shall be executed using loops and noises as referenced in section 3.2.2.1 or 3.2.2.2. The results of these test groups shall be provided as the minimum required to demonstrate Dynamic Interoperability. Test Group Number G.992.2-TG1 Test Group Description Capacity vs. Standard loop Test Cases TC2 Test Parameters MRG = 4, LAT = interleaved Test Group Number G.992.2-TG2 Test Group Description Stability & BER Test Cases TC3 Test Parameters MRG = 4, LAT = interleaved The following test group provides additional performance information, using loops and noises appropriate to the two test cases as referenced in section 6.2 (TC1) and section 6.5 (TC4). The results of these test groups may be provided to broaden the scope of the demonstrated Dynamic Interoperability. Test Group Number G.992.2-TG3 Test Group Description Capacity vs. non-standard loops Test Cases TC1, TC4 Test Parameters MRG = 4, LAT = interleaved
5. Test Cases
5.1 Sample test case description format Test Case Number Test Case Name Test Purpose
Input Parameters
Test Procedure and Setup
Success Criteria
Results

- 8 -
5.2 Loop reach with external crosstalk and noise Test Case Number TC1 Test Case Description: loop_xtalk_reach Test Purpose Determine capacity vs. reach of a system on a variable length 26 AWG
loop. Input Parameters MRG, LAT Test Procedure and Setup For each noise model defined in Table 2:
1. Set line simulator to 0 kft 2. Inject noise 3. Initialize modems using ‘LAT’ latency path with ‘MRG’ dB margin 4. Note negotiated framing mode and Trellis coding option 5. Note Downstream and Upstream Net Data Rate 6. Disconnect 7. Increase line simulator length by 1 kft 8. Repeat steps 1-7 9. When maximum reach has been obtained, repeat steps 1-8 with
another noise type.
Success Criteria Showtime reached with good data transport (i.e., no CRC superframe errors, no LOS or LOF failures).
Results Table/graph of capacity vs. distance and noise type for the same framing mode and Trellis option.
Table 2: Noise types used for test cases TC1 & TC2
Noise types for TC1 and TC2
White noise @ -140 dBm/Hz (agwn) 24 DSL + agwn 24 HDSL + agwn 5 T1 adjacent binder + agwn 1 T1 same binder + agwn

- 9 -
5.3 Capacity on Standard loops with external crosstalk and noise Test Case Number TC2 Test Case Name loop_xtalk_cap Test Purpose Determine capacity of a system on standard loops and crosstalk noises. Input Parameters MRG, LAT Test Procedure and Setup For each loop/noise model as defined in the appropriate standard:
1. Set line simulator to first standard loop 2. Inject the corresponding standard noise 3. Initialize modems using ‘LAT’ latency path with ‘MRG’ dB margin 4. Note negotiated framing mode and Trellis option 5. Note Downstream and Upstream Net Data Rate 6. Repeat step 1-6 for other standard loop and noise.
Success Criteria Showtime reached with good data transport (i.e., no CRC superframe errors, no LOS or LOF failures).
Results Table of Net Data Rate vs. standard loop and noise type for same framing mode and Trellis option.
5.4 BER with external crosstalk and noise Test Case Number TC3 Test Name: loop_xtalk_ber Test Purpose Determine BER of a system under different loops and crosstalk noises Input Parameters MRG, LAT Test Procedure and Setup For each loop/noise model as defined in the appropriate standard:
1. Initialize modems using ‘LAT’ latency path with ‘MRG’ dB Margin 2. Increase the noise by ‘MRG’ dB 3. Measure BER 4. Disconnect.
Success Criteria BER <= 1e-7 and CLR <= 4e-6 for a sufficiently long period (Table 1). Results Pass/Fail
5.5 Capacity on loop with bridged taps under external crosstalk and noise conditions
A 1997 Subscriber Loop Characteristics Study from Telcordia (formerly Bellcore) based on a survey of loops from a large operator has shown that bridged taps are quite prevalent. Approximately 75% of all loops in some served areas have some type of bridged tap, and approximately 33% of all loops have bridged taps of between 250 and 500 feet. It has been shown that such short bridged taps may have a significant effect on the performance of ADSL systems. The set of test loops that should be used to demonstrate Dynamic Interoperability in the presence of short bridged taps is given in Table 3: Bridged Tap Test Loops. The addition of a 750 foot 26 AWG bridged tap to a 26AWG test loop may be used to measure the performance

- 10 -
degradation in the upstream direction. The 9 kft, 12 kft, 15 kft straight 26 AWG gauge loops without bridged taps that may be used as reference, are covered by TC1. To reduce the number of test cases, these loops shall be tested with the “-140 dBm/Hz white noise” model. Test Case Number TC4 Test Case Name loop_tap_xtalk_cap Test Purpose Determine capacity of a system on loops containing short bridged taps Input Parameters MRG, LAT Test Procedure and Setup For each bridged tap loop configuration defined in Table 3:
1. Set bridged tap length to the first tap length in Table 3, column 2 2. Inject –140 dBm/Hz white noise 3. Initialize modem using ‘LAT’ latency path with ‘MRG’ dB margin 4. Note negotiated framing mode and Trellis coding option 5. Note Downstream and Upstream Net Data Rate 6. Disconnect 7. Set line simulator to next bridged tap length 8. Repeat steps 2-6 for all tap lengths in Table 3, column 2 9. Repeat steps 2-7 for next loop length in Table 3, column 1.
Success Criteria Showtime reached with good data transport (i.e., no CRC superframe errors, no LOS or LOF failures)
Results Table of Net Data Rate vs. loop and tap length and noise type for same framing mode and Trellis option
Table 3: Bridged Tap Test Loops
26AWG loop length 26AWG tap length @ ATU-R 9 kft 250, 300, 350, 750 12 kft 350, 400, 450, 750 15 kft 350, 400, 450, 750
6. References [ANSI] Committee T1 – Telecommunications T1.413-1998. [GDMT] International Telecommunication Union, Telecom standardization sector ITU-T G.992.1. [GLITE] International Telecommunication Union, Telecom standardization sector ITU-T G.992.2. [GTEST] International Telecommunication Union, Telecom standardization sector ITU-T G.996.1.
- 11 -
ANNEX A : Bit Error Ratio testing of ATM based ADSL systems
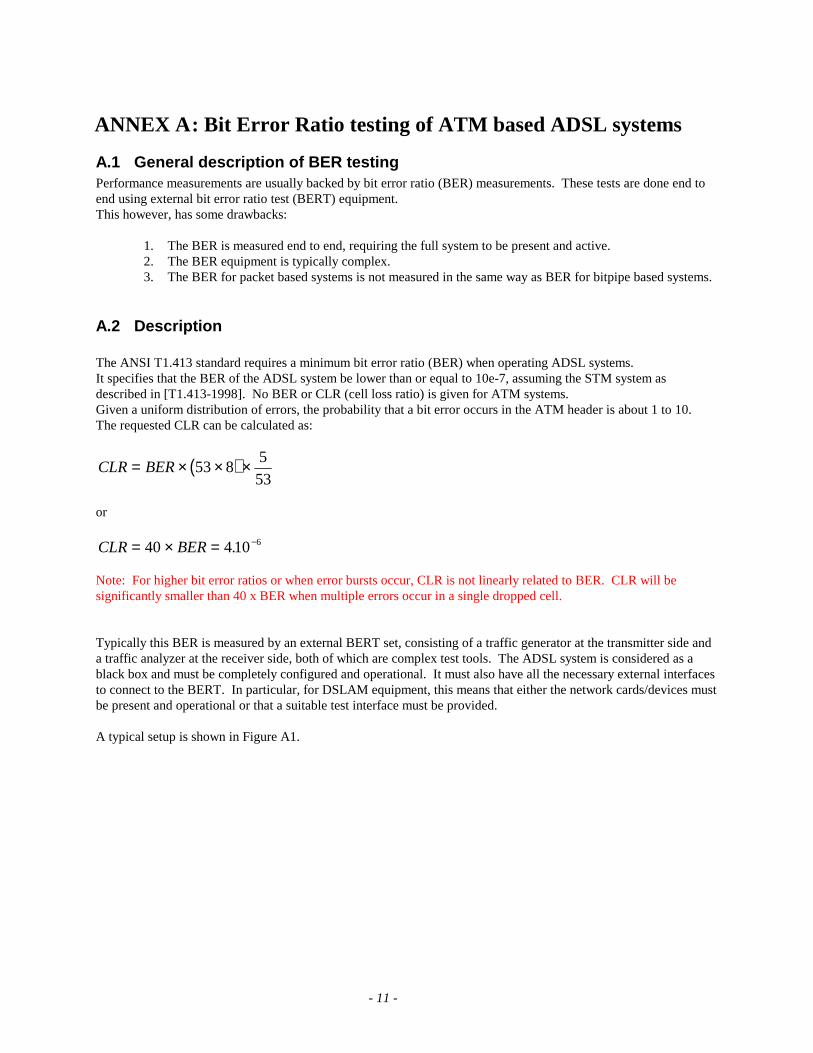
A.1 General description of BER testing Performance measurements are usually backed by bit error ratio (BER) measurements. These tests are done end to end using external bit error ratio test (BERT) equipment. This however, has some drawbacks:
1. The BER is measured end to end, requiring the full system to be present and active. 2. The BER equipment is typically complex. 3. The BER for packet based systems is not measured in the same way as BER for bitpipe based systems.
A.2 Description The ANSI T1.413 standard requires a minimum bit error ratio (BER) when operating ADSL systems. It specifies that the BER of the ADSL system be lower than or equal to 10e-7, assuming the STM system as described in [T1.413-1998]. No BER or CLR (cell loss ratio) is given for ATM systems. Given a uniform distribution of errors, the probability that a bit error occurs in the ATM header is about 1 to 10. The requested CLR can be calculated as:
( )CLR BER= × × ×53 85
53
or
CLR BER= × = −40 410 6. Note: For higher bit error ratios or when error bursts occur, CLR is not linearly related to BER. CLR will be significantly smaller than 40 x BER when multiple errors occur in a single dropped cell. Typically this BER is measured by an external BERT set, consisting of a traffic generator at the transmitter side and a traffic analyzer at the receiver side, both of which are complex test tools. The ADSL system is considered as a black box and must be completely configured and operational. It must also have all the necessary external interfaces to connect to the BERT. In particular, for DSLAM equipment, this means that either the network cards/devices must be present and operational or that a suitable test interface must be provided. A typical setup is shown in Figure A1.
- 12 -
Line simulator
ATU-C
LPF
ATU-R
LPF
STP-5x ft
DSLAM
OC3-c orSTM1
Noise Generator
Hi-Z coupling cctHi-Z coupling cct
Noise Generator
STP-5x ft
STP-5x ft
To PSTNTo Phone
BERTTX-DownRX-UP
ATM
BERT
TX-Up
RX-Down
User interface
ATM, Ethernet,...
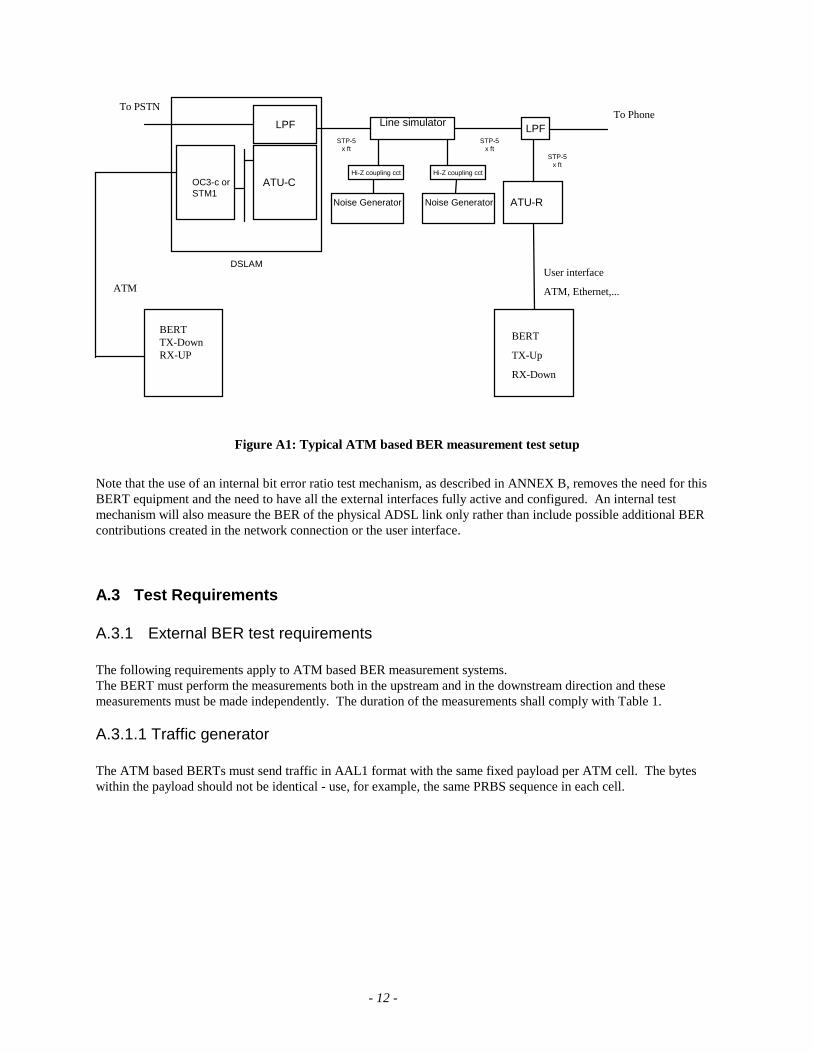
Figure A1: Typical ATM based BER measurement test setup
Note that the use of an internal bit error ratio test mechanism, as described in ANNEX B, removes the need for this BERT equipment and the need to have all the external interfaces fully active and configured. An internal test mechanism will also measure the BER of the physical ADSL link only rather than include possible additional BER contributions created in the network connection or the user interface.
A.3 Test Requirements
A.3.1 External BER test requirements The following requirements apply to ATM based BER measurement systems. The BERT must perform the measurements both in the upstream and in the downstream direction and these measurements must be made independently. The duration of the measurements shall comply with Table 1.
A.3.1.1 Traffic generator The ATM based BERTs must send traffic in AAL1 format with the same fixed payload per ATM cell. The bytes within the payload should not be identical - use, for example, the same PRBS sequence in each cell.

- 13 -
A.3.1.2 Traffic analyzer Three types of BER measurements are taken: 1) BER-bitpipe The BER measured over an ADSL system considers that system to be a bit-pipe (as does [ANSI]), and not a cell-pipe (ATM cells). Thus a consequence of measuring BER-bitpipe over an ATM system is that discarded ATM cells, and bit errors in the discarded ATM cells, are not taken into account. The 47 byte payloads in the AAL1 cells are checked against the inserted content (which, because it is the same for all cells, renders the BER transparent to cell losses). Each wrong bit is counted and the total is divided by the number of checked bits.
BER-bitpipeErrored-bits
Rx-cellsmeasured seconds
measured seconds
=× ×
∑∑
( )
( )47 8
2) CLR: Cell Loss Ratio When a bit error occurs in the header of an ATM cell, the complete cell is discarded. The traffic analyzer checks the sequence number in the first byte of the AAL1 payload, and counts the number of cells which are missing. The CLR is equal to this number divided by the total number of received cells.
CLRLost-cells
Rx-cellsmeasured seconds
=∑∑
( )
( )measured seconds
3) BER-application This is the BER measured over the ADSL system, but as seen from the application, assuming AAL0. This means that when an ATM cell is lost, its whole payload of 48x8 bits is counted in the BER as 48x8 bits in error.
BER-bitpipe Rx-bits CLR Rx-cells
Rx-bitsmeasured seconds measured seconds
measured seconds
≅×
+ × × ×
∑ ∑
∑( ) ( )
( )
48 8BER-application
The BER-application is thus approximately equal to the BER-bitpipe plus the CLR. BER-application BER-bitpipe CLR≅ +

- 14 -
ANNEX B : A method to perform ATM based Bit Error Ratio tests without external BER tools
In ANNEX A, a generic description of BER testing is given. This section describes an internal BER measurement tool that performs a similar function. This internal tool is able to measure:
1. BER-bitpipe 2. Cell Loss Ratio 3. BER-application
The use of an internal bit error ratio test mechanism removes the need for BERT equipment and the need for having all the external interfaces fully active and configured. Such use will also measure the BER of the physical ADSL link only rather than include the possible additional BER contributions created in the network connection or the user interface.
B.1 Requirements of an internal BER tool An internal BER tool must be able to make the same measurements as the external BER tool, namely the BER-bitpipe, the CLR and the BER-application. Some dedicated hardware counters are needed to store and count BER results, and some software to start/stop the BER test, process the results and to pass the results to an external PC or terminal. The measurements are based on idle cells, which means that the built-in functionality is placed at the ATM-TC layer. The measurement durations given in Table 1 should be scaled to reflect the relative percentages of idle cells to user traffic in the payload.
B.1.1 Traffic Generator The ATM cells suited for BER measurements are the idle or unassigned cells. The BER generator is thus best placed at the idle cell insertion circuit before HEC generation and before cell payload scrambling. Figure B1 shows the position of the generator in the ATM-TC layer. The 48 byte payload of each idle cell shall be the same fixed pattern, known at the receiver. The traffic generator can be the same as the idle cell generator. When no user traffic is present, all payload cells will be idle cells and measurement durations with the internal BER tool will match those with an external BERT (Table 1).
B.1.2 Traffic Analyzer The receiver shall check the payload of the idle cells for bit errors, and the counts of errored bits and idle cells shall be on a per-second basis. The average BER shall be taken over the appropriate measurement time (scaled from Table 1 to reflect the dependence on the transmission of idle cells) and updated on a per second basis. When the traffic generator is enabled the BER receiver can be started or stopped at any time. No communication with the transmitter is needed. 1) BER-bitpipe The BER-bitpipe shall only be measured on correctly received idle cells over the total measurement time. This will eliminate bit errors due to cell losses. The BER-bitpipe is expressed as a BER on a per second basis (i.e., the average BER is calculated over the total measurement time using a one second update rate).

- 15 -
2) CLR: Cell Loss Ratio All total cell counts and lost cell counts are performed over the total measurement time. The total cell count is done before executing the HEC check. Lost cells are counted when an incorrect HEC is seen. Incorrect HECs are never corrected. 3) BER-application The BER-application is approximately given by the sum of the BER-bitpipe and the CLR. Figure B1 shows the position of the BER tool in the ATM TC-Layer.
HEC check
BER-test measurement
Byte based TClayer. TransmitDirection
Byte Based TCLayer. ReceiveDirection
Cell TX Interfaceand cell buffer
Cell RX interfaceand cell buffer
BER-test generator Idle/unassignedcell insert
Idle/Unassigned cellextract
HEC generation
Cell payload scrambling
Cell Payload descramling Cell delineation
Active Cell count
Cell discard Count
Invalid HEC count
Total Cell Count
TX PATH RX PATH
Figure B1: BER tool position in the ATM TC layer

- 16 -
B.2 Measurement results Measurements were performed on an ADSL system to prove the internal concept. The ADSL link was started under white noise conditions and filled with 50% of ATM traffic from an external BERT, leaving 50% of the link as idle cells that were used by the internal BER tool. Then the external white noise was increased to the point where bit errors started to appear. Both the external and the internal BER tool yielded the same results for BER-bitpipe, CLR and BER-application measurements. The major advantage of the internal tool is its ability to function even when normal user traffic is being transported. It will automatically take up the remaining idle cells to do the BER measurement. Even at high link utilization some idle cells will be sent. Over a long enough measurement period, this will give a good estimate of the overall bit error ratio for the system. The internal tool can be used to monitor multiple lines even without the use of external BER tools. An internal tool can be implemented with limited additional HW and SW overhead, and is thus a good addition to test the quality of the ADSL connection. If the traffic generator circuit also performs idle cell insertion, then no change at all is needed in the transmitter.
- 17 -
ANNEX C : Reference test setup for ATM based ADSL systems
C.1 Introduction Performance measurements are being made in many parts of the world, however it can be difficult to compare results due to differences in the test setups used. This section proposes a reference test setup that can be used for ADSL Dynamic Interoperability testing. It will also discuss some of the problems that can be encountered while testing Dynamic Interoperability, problems such as line simulator quality, injection of Xtalk or noise. This section is also intended to be a guide to putting together an ADSL Dynamic Interoperability measurement setup.
C.2 Description The proposed test setup consists of the following equipment:
1. Line simulator 2. Noise generator 3. High impedance coupling boxes 4. ATU-R 5. ATU-C (inside DSLAM) 6. Traffic generator and bit error ratio tester 7. Cabling connecting the various equipment 8. Test setup controller 9. Lowpass filters 10. POTS equipment.
Figure C1 shows this (typical) performance measurement setup.
- 18 -
Line simulator
ATU-C
LPF
ATU-R
LPF
STP-5x ft
DSLAM
OC3-c orSTM1
Noise Generator
Hi-Z coupling cctHi-Z coupling cct
Noise Generator
STP-5x ft
STP-5x ft
To PSTNTo Phone
BERTTX-DownRX-UP
ATM
BERT
TX-Up
RX-Down
User interface
ATM, Ethernet,...
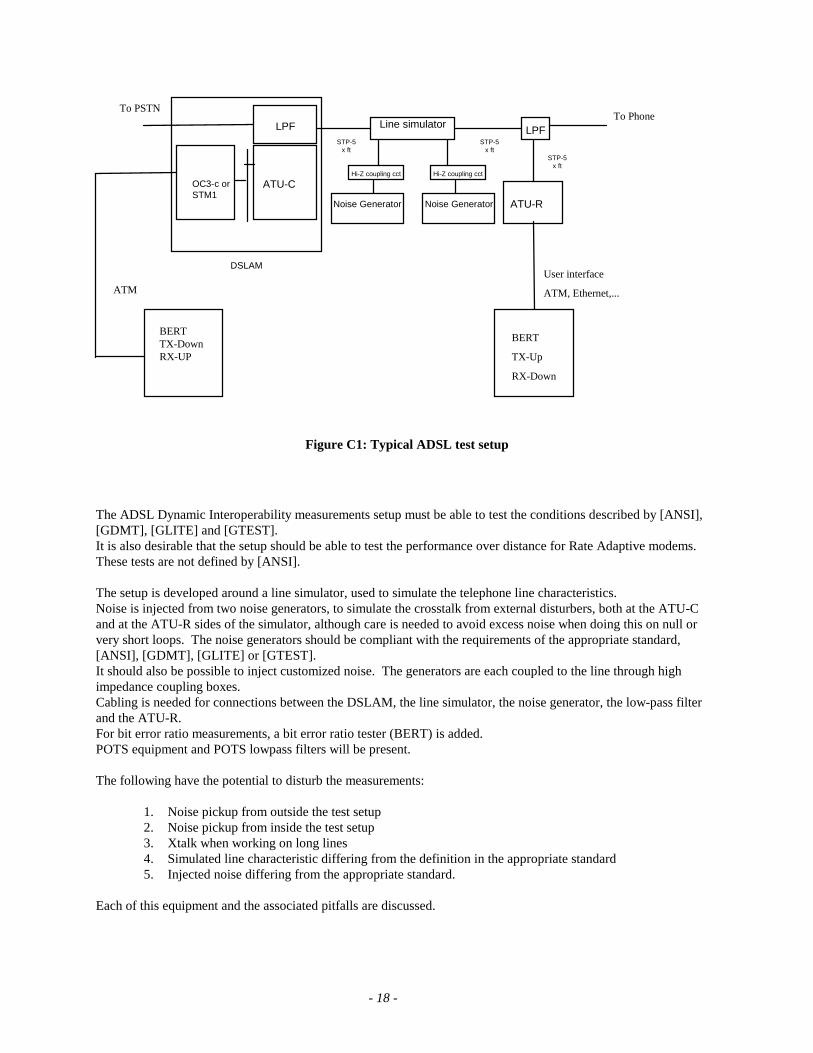
Figure C1: Typical ADSL test setup
The ADSL Dynamic Interoperability measurements setup must be able to test the conditions described by [ANSI], [GDMT], [GLITE] and [GTEST]. It is also desirable that the setup should be able to test the performance over distance for Rate Adaptive modems. These tests are not defined by [ANSI]. The setup is developed around a line simulator, used to simulate the telephone line characteristics. Noise is injected from two noise generators, to simulate the crosstalk from external disturbers, both at the ATU-C and at the ATU-R sides of the simulator, although care is needed to avoid excess noise when doing this on null or very short loops. The noise generators should be compliant with the requirements of the appropriate standard, [ANSI], [GDMT], [GLITE] or [GTEST]. It should also be possible to inject customized noise. The generators are each coupled to the line through high impedance coupling boxes. Cabling is needed for connections between the DSLAM, the line simulator, the noise generator, the low-pass filter and the ATU-R. For bit error ratio measurements, a bit error ratio tester (BERT) is added. POTS equipment and POTS lowpass filters will be present. The following have the potential to disturb the measurements:
1. Noise pickup from outside the test setup 2. Noise pickup from inside the test setup 3. Xtalk when working on long lines 4. Simulated line characteristic differing from the definition in the appropriate standard 5. Injected noise differing from the appropriate standard.
Each of this equipment and the associated pitfalls are discussed.

- 19 -
C.2.1 Cabling Cabling is needed to connect between the DSLAM (ATU-C), the line simulator, the noise generators, the low-pass filter, the ATU-R and other equipment. Care must be taken to ensure that no significant noise is picked up by this cabling, so keep the wiring short. Examples of recommended cabling are 26 or 24 AWG cat5 UPT or STP. With typically short cabling (e.g., 5 to 10 ft) the choice among these options should not influence the measurements. Shielded twisted pair (STP) is only required when there is high EMI in the vicinity (typically from engines, air conditioning units) or if longer cables are required from the DSLAM. A setup in a large operational lab where many other projects are under test, should be considered as a high-noise environment. If STP cabling is used then take care to connect the shielding in a proper way: connect the shield to the line simulator ground only (one-sided grounding). A badly connected shield can make the performance worse. In case of doubt, use the unshielded twisted pair (UTP). Computer screens and power supplies radiate in the frequency bands used by ADSL. These devices should be placed away from the setup or, if possible, be switched off. The ATU-R, the ATU-C and their cabling should be physically separated, since, when testing on long lines, crosstalk can occur between the cabling of each end. Generally, for simulator attenuations of 70 dB and greater, special care must be taken with the cabling to avoid crosstalk. A trellis coded system only needs about 9 dB of SNR to transport 2 bits. Given a Tx PSD of -40 dBm/Hz this in fact means that simulator attenuation up to 91 dB need to be supported by the measurement setup. Noise pickup in the cabling should be avoided.
- 20 -
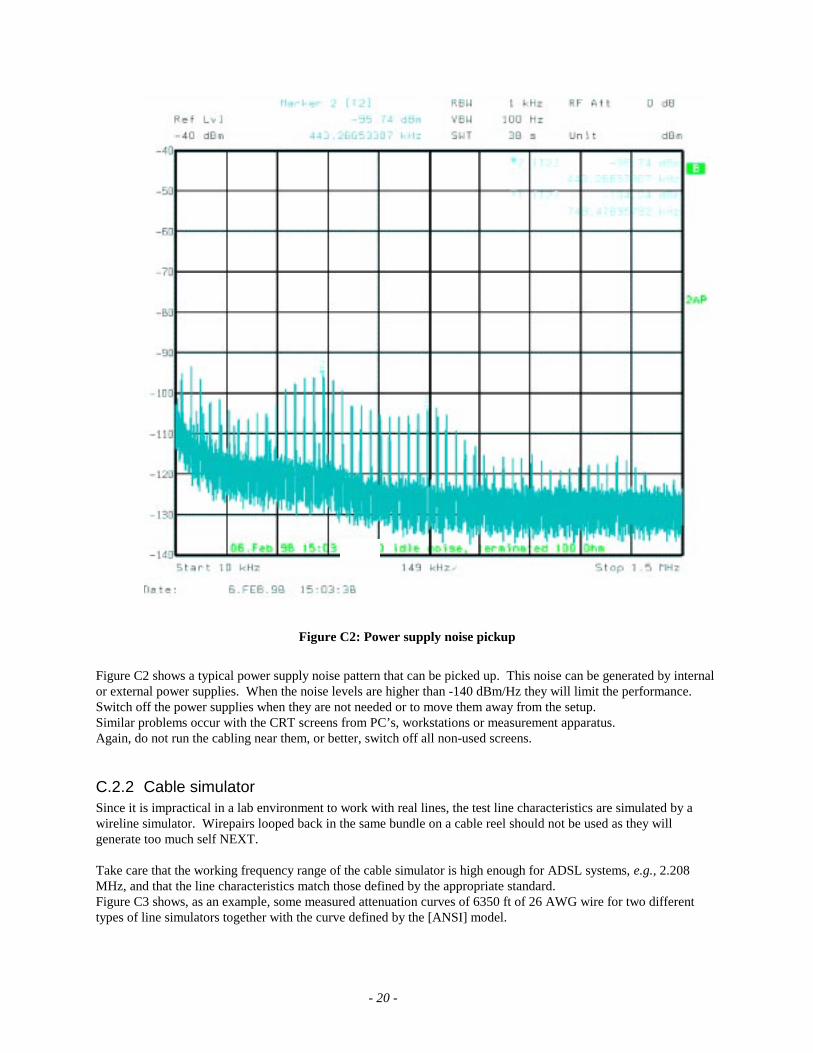
Figure C2: Power supply noise pickup
Figure C2 shows a typical power supply noise pattern that can be picked up. This noise can be generated by internal or external power supplies. When the noise levels are higher than -140 dBm/Hz they will limit the performance. Switch off the power supplies when they are not needed or to move them away from the setup. Similar problems occur with the CRT screens from PC’s, workstations or measurement apparatus. Again, do not run the cabling near them, or better, switch off all non-used screens.
C.2.2 Cable simulator Since it is impractical in a lab environment to work with real lines, the test line characteristics are simulated by a wireline simulator. Wirepairs looped back in the same bundle on a cable reel should not be used as they will generate too much self NEXT. Take care that the working frequency range of the cable simulator is high enough for ADSL systems, e.g., 2.208 MHz, and that the line characteristics match those defined by the appropriate standard. Figure C3 shows, as an example, some measured attenuation curves of 6350 ft of 26 AWG wire for two different types of line simulators together with the curve defined by the [ANSI] model.

- 21 -
Figure C3: Attenuation curves 6.35 kft 26 AWG compared to ANSI
Make sure that the line simulator can handle the POTS DC feed and speech signals. A line simulator that can emulate different loops eliminates the need for multiple simulators. Loops with variable line length can be used to test Dynamic Interoperability versus distance e.g., 26 and 24 AWG loops using line lengths that can be incremented in steps of between 50 ft and 1 kft. The noise floor of the line simulator must be lower than -140 dBm/Hz (preferably in the order of -150 dBm/Hz) to avoid degrading the measurements.

- 22 -
att 12 kft 26awg
-100
-90
-80
-70
-60
-50
-40
-30
-20
-10
0
1 40 79 118 157 196 235 274 313 352 391
Figure C4: Attenuation and Xtalk at 12 kft 26 AWG
When cable attenuations exceed 70 dB or more, crosstalk inside the cable simulator will start to become noticable. This Xtalk distorts the simulated cable transfer characteristic by acting as a secondary signal path. The effect is most visible when low levels of external noise are being used (e.g., no noise or -140 dBm/Hzagwn) and will show as ripple in the channeltransfer characteristic. Figure C4 shows the attenuation of a 12 kft 26 AWG loop. Ripples created by self NEXT are starting to appear at the highly attenuated higher frequencies. On longer lines, this self next can be limited by using two line simulators in series with each having only moderate attenuation. By using shorter simulated lengths, the attenuation between input and output of each simulator is lower and having the two simulators in series gives a physical separation, both lowering the self next.
C.2.3 Noise generators The noise generators are used to inject simulated noise pattern on the wireline to simulate real world conditions. [ANSI] has defined the noise types to be used e.g., HDSL, DSL, T1, ADSL. Also, noise types for use in Europe have been defined by ETSI, e.g., ETSI A, ETSI B noise. The same is done for impulsive noise types. Other noise types, which are customer definable (e.g., ISDN 2B1Q, ISDN 4B3T, HDSL E1, G.992.2 [GLITE]), exist. The noise generator must be very flexible to support all these different noise types.

- 23 -
Noise should be inserted at both sides, mimicking real world behavior (the modems are used with down- & up-stream channels). Single ended noise injection might give too optimistic a result, although care is needed to avoid excess noise power on a null loop or any other loop with low attenuation. The performance and reach could be limited by either the upstream or downstream depending on the noise type. Also the initialization, which is bi-directional, will be affected by this noise through, for example, equalization or loop timing. ADSL systems are built for operation in a white noise environment, at levels of -140 dBm/Hz. A ‘no noise’ measurement is only suited for academic or design verification purposes. Therefore one should always add at least the -140 dBm/Hz white background noise. A programmable arbitrary waveform generator (ARB) can be used as the noise generator. The noise pattern can be calculated off-line with a mathematics program and then loaded into the generator. The ARB should possess the following characteristics:
1. 12-bit resolution: to be able to accurately model the dynamics of the noise. 2. Sampling rate higher than 4.416 MHz: sufficiently high to also model the higher lobes of T1 noise 3. Number of points in the pattern equal or greater than 64k: to get sufficient resolution. 4. Output voltage at least 5V peak for margin testing. 5. Must be able to support a crestfactor = 5
Most ARBs are single output devices. Considering that noise must be injected at both sides and that for some tests impulsive noise is needed, one should consider getting a 4-channel generator. Since the impulsive noise patterns are defined with a sample rate of 6.25 MHz (160 ns), it is convenient to use the same sample rate for the noise patterns. The noise waveform injected onto the line is formed by contiguously looping through the noise pattern stored in the ARB. Assuming a pattern sample size of 64k (i.e., 65536), the noise waveform will exhibit a line spectrum of 6.25e6/65536 = 95.4 Hz. That gives 4312.5/95.4 = 45.2 spectral lines within each bin of the ADSL spectrum. This is a sufficiently large number to allow this noise pattern to act as white noise. An anti-mirroring lowpass filter can be used (e.g., with a 5 MHz cut-off frequency) to reject higher frequency mirrors of the generated spectrum. The noise waveform is coupled to the line through a high impedance coupling circuit, similar to the one specified in [ANSI]. This circuit is adapted to terminate the 50 Ohms output of the generator and uses a 1to4 transformer to increase. This range is needed for doing margin tests. The insertion flatness of the coupling box should be better than 0.1 dB from 10 kHz to 2.208 MHz. Noise characteristics should be calibrated using the circuit proposed by [ANSI]. This has to be done very carefully since a miscalibration of only one dB could reduce the capacity by one bit per carrier for each carrier, resulting in a loss of 800 kb/s (e.g., 200 tones x 1 bit x 4 kHz = 800 kb/s)!
C.2.4 BER test equipment In an ATM based environment, the BERT needs a network interface (e.g., STM-1, OC-3 or other) and a user interface (e.g., ATM forum 25 Mb/s) for doing the bi-directional (duplex) BER measurements. It must be able to measure the BER of the bitpipe (BER-bitpipe), the cell loss ratio (CLR) and the application bit error ratio (BER-application ~ BER+CLR). Other features may include measurement of cell delay and cell jitter. Ethernet protocol tests are performed with a Protocol analyzer.
C.3 Conclusion A good test setup can be assembled if care is taken and requirements are well understood. All related equipment for noise injection, cabling and cable characteristics should be configured with care. The impact of Xtalk and noise pickup becomes an important factor for the highly sensitive ADSL systems.
- 24 -
7. List of figures
Figure A1: Typical ATM based BER measurement test setup ___________________________ 12 Figure B1: BER tool position in the ATM TC layer ___________________________________ 15 Figure C1: Typical ADSL test setup _______________________________________________ 18 Figure C2: Power supply noise pickup_____________________________________________ 20 Figure C3: Attenuation curves 6.35 kft 26 AWG compared to ANSI ______________________ 21 Figure C4: Attenuation and Xtalk at 12 kft 26 AWG __________________________________ 22