ADOPTED BUDGET -...
72
NASSAU COUNTY NEW YORK EDWARD P. MANGANO COUNTY EXECUTIVE ADOPTED BUDGET ADOPTED MULTI-YEAR FINANCIAL PLAN FISCAL 2012-2015 OCTOBER 2011
-
Upload
nguyenkhuong -
Category
Documents
-
view
215 -
download
0
Transcript of ADOPTED BUDGET -...

NASSAU COUNTY
NEW YORK
EDWARD P. MANGANO
COUNTY EXECUTIVE
ADOPTED BUDGETADOPTED MULTI-YEAR
FINANCIAL PLAN
FISCAL 2012-2015
OCTOBER 2011

FISCAL 2012–2015 MULTI-YEAR FINANCIAL
TABLE OF CONTENTS
I. EXECUTIVE SUMMARY 1
II. FUND AND DEPARTMENTAL DETAIL 7
III. APPENDICES 53
A. MULTI-YEAR FINANCIAL PLAN BASELINE INFLATORS
B. BORROWING SCHEDULE
C. DEBT SERVICE BASELINE
D. NASSAU COMMUNITY COLLEGE FINANCIAL PLAN UPDATE
E. NASSAU HEALTH CARE CORPORATION FINANCIAL PLAN UPDATE
F. SEWER & STORM WATER RESOURCE DISTRICT FINANCIAL PLAN


EXECUTIVE SUMMARY


FISCAL 2012–2015 MULTI-YEAR FINANCIAL
1
OVERVIEW
The Multi-Year Financial Plan (“MYP”) is used to guide decision making and long-term planning. Given
the current economic conditions, the County will continue to place increased emphasis on identifying cost
saving measures, practice strict fiscal discipline, and implement strategies that ensure long-term fiscal
stability.
On January 1, 2010, Edward P. Mangano was sworn in as County Executive of a government that spent
too much, taxed too high and reformed too little. Accordingly, Nassau faced a projected $310 million
deficit for 2012 resulting from unaffordable labor contracts, coupled with a broken assessment system and
a stagnant economy that have collectively created a fiscal storm.
During the 2012 Budget Adoption process, agreement was reached with the Nassau County Interim
Finance Authority (“NIFA”) to achieve structural balance in 2015. The County will remain in budgetary
balance, the historical reporting mechanism, for the first three years of the 2012 – 2015 MYP despite
unprecedented increases in employee pension and health insurance costs. Transitional financing for
various working capital items (e.g., tax certiorari settlements, termination pay and other judgments and
settlements) will be utilized at decreasing levels over the life of the plan to enable the County to achieve
structural balance in 2015. The table below outlines the schedule for working capital borrowings in the
MYP.
2011 2012 2013 2014 2015 Total
Tax Certiorari Settlements $95.0 $85.0 $75.0 $50.0 $0.0 $305.0
Other Judgments and Settlements $25.0 $21.7 $12.1 $6.2 $0.0 $65.0
Termination Pay $80.0 $80.0
Total $200.0 $106.7 $87.1 $56.2 $0.0 $450.0
Dollars in millions
Scheduled MYP Working Capital Borrowings
In addition, the County will reduce its labor force to the lowest headcount in Nassau County’s history,
7,400 positions, in order to achieve labor savings of $150 million in 2012.
As noted by Grant Thornton LLP, a financial advisory firm retained by NIFA, the inherited collective
bargaining agreements “provide for an unsustainable level of compensation and benefits.” Grant
Thornton has called for major changes to the current labor agreements including “across the board
contribution by employees for health and retirement benefits” and “across the board reductions to paid
leave.” Since assuming office, County Executive Mangano has called on labor unions for concessions to
address these rapidly escalating costs; however, to date, the unions have not offered the requisite
concessions necessary to bring the County’s total compensation costs down to the level needed to achieve
structural balance.
Absent these labor concessions, the 2012 budget will substantially reduce the County’s workforce
through layoffs and attrition. The benefits received by the workforce place an unacceptable burden on

FISCAL 2012–2015 MULTI-YEAR FINANCIAL
2
Nassau County taxpayers. Benefits received by union employees exceed benefits offered by similar
municipalities. Examples include:
Contractual Overtime – The Nassau County Police Department is the only major police
department in the United States that has contractual guaranteed minimum staffing by
precinct. An inefficient use of resources results in significantly more overtime than is
necessary. The current minimum manning agreement necessitates calling officers in on
overtime even when straight-time police are available.
Health Insurance – Currently, the County’s union employees do not contribute to the cost
of health care. New York State recently reached an agreement with its CSEA employees,
whereby employees contribute 31% to the cost of family health insurance coverage and
16% for individual coverage. Consistent with the private sector and other governments,
union employees in Nassau must contribute to their health insurance costs.
As stated in the Grant Thornton report, “The average public safety employee is entitled to
61 days of annual paid leave.” This exceeds both government and private sector industry
standards.
As stated in the Grant Thornton report, “The average CSEA employee is entitled to 44
days of annual paid leave.” This also exceeds both government and private sector
industry standards.
These union employee benefits exceed those of the private sector and other government
employees in different jurisdictions. In order for Nassau County to achieve structural balance, the
benefits received by union employees need to align with the revenues that the County receives.

FISCAL 2012–2015 MULTI-YEAR FINANCIAL
3
Table 1: 2012-15 Pre-Gap Closing Analysis
(Dollars)
E/R OBJ 2012 ADOPTED 2013 ADOPTED 2014 ADOPTED 2015 ADOPTED
EXP AA - SALARIES, WAGES & FEES 686,673,715 718,413,435 721,325,306 729,379,157
AB - FRINGE BENEFITS 481,416,054 557,297,524 530,953,291 569,265,498
AC - WORKERS COMPENSATION 30,399,332 31,280,913 32,188,059 33,121,513
BB - EQUIPMENT 1,481,429 1,527,499 1,574,904 1,623,685
DD - GENERAL EXPENSES 30,310,790 30,119,937 30,270,392 30,674,530
DE - CONTRACTUAL SERVICES 213,612,365 217,643,566 222,492,641 228,150,699
DF - UTILITY COSTS 37,624,375 37,593,018 37,881,421 38,285,576
DG - VAR DIRECT EXPENSES 5,000,000 5,000,000 5,000,000 5,000,000
FF - INTEREST 93,863,296 103,656,097 112,043,911 118,086,942
GA - LOCAL GOVT ASST PROGRAM 62,852,361 64,704,079 66,609,498 68,570,173
GG - PRINCIPAL 69,011,202 80,045,186 84,350,624 94,941,557
HC - NHC ASSN EXP - NASSAU HEALTH CARE ASSN 13,000,000 13,000,000 13,000,000 -
HD - DEBT SERVICE CHARGEBACKS 345,015,740 367,042,619 364,759,562 359,035,373
HF - INTER-DEPARTMENTAL CHARGES 155,436,060 155,436,060 155,436,060 155,436,060
HH - INTERFD CHGS - INTERFUND CHARGES 19,332,746 18,184,980 25,242,167 25,499,897
MM - MASS TRANSPORTATION 42,217,100 43,177,862 44,231,337 45,384,706
NA - NCIFA EXPENDITURES 2,025,000 1,600,000 1,675,000 1,750,000
OO - OTHER EXPENSE 385,837,230 383,615,371 356,341,833 314,581,270
PP - EARLY INTERVENTION/SPECIAL EDUCATION 172,975,000 177,254,250 181,652,778 186,174,070
SS - RECIPIENT GRANTS 74,645,000 76,511,125 78,423,903 80,384,501
TT - PURCHASED SERVICES 57,944,683 58,813,853 60,284,200 61,188,463
WW - EMERGENCY VENDOR PAYMENTS 64,396,824 66,972,697 68,981,878 70,361,515
XX - MEDICAID 248,838,445 251,838,445 254,838,445 257,838,445
EXP Total 3,293,908,747 3,460,728,516 3,449,557,207 3,474,733,630
REV BA - INT PENALTY ON TAX 28,500,000 28,500,000 28,500,000 28,500,000
BC - PERMITS & LICENSES 12,029,332 12,029,332 12,029,332 12,029,332
BD - FINES & FORFEITS 51,249,708 51,249,708 51,249,708 51,249,708
BE - INVEST INCOME 3,626,400 10,626,400 17,626,400 24,626,400
BF - RENTS & RECOVERIES 16,894,401 14,894,401 14,894,401 14,894,401
BG - REVENUE OFFSET TO EXPENSE 21,984,354 21,984,354 35,484,354 42,284,354
BH - DEPT REVENUES 171,941,513 177,724,764 179,233,514 181,456,236
BI - CAP BACKCHARGES 9,887,864 10,233,939 10,592,127 10,962,852
BJ - INTERDEPT REVENUES 155,436,060 155,436,060 155,436,060 155,436,060
BO - PAY LIEU TAX - PAYMENT IN LIEU OF TAXES 8,661,865 8,661,865 8,661,865 8,661,865
BQ - D/S FROM CAP - DEBT SERVICE FROM CAPITAL 103,138,378 86,226,711 60,239,521 2,436,000
BV - DEBT SERVICE CHARGEBACK REVENUE 345,015,739 367,042,619 364,759,562 359,035,373
BW - INTERFD CHGS - INTERFUND CHARGES REVENUE 74,139,205 76,899,899 87,544,250 90,552,011
FA - FEDERAL AID - REIMBURSEMENT OF EXPENSES 165,063,957 167,014,317 168,663,997 170,000,237
SA - STATE AID - REIMBURSEMENT OF EXPENSES 234,814,429 238,082,797 241,271,910 244,377,547
TA - SALES TAX CO - SALES TAX COUNTYWIDE 970,802,675 998,955,953 1,027,925,675 1,057,735,520
TB - PART COUNTY - SALES TAX PART COUNTY 85,385,709 87,861,895 90,409,890 93,031,776
TL - PROPERTY TAX 804,331,558 804,331,558 804,331,558 804,331,558
TO - OTB 5% TAX 3,229,600 2,906,433 2,615,791 2,615,791
TX - SPECIAL TAXS - SPECIAL TAXES 27,776,000 27,776,000 27,776,000 27,776,000
REV Total 3,293,908,747 3,348,439,004 3,389,245,915 3,381,993,021
Projected Base Line Gap - (112,289,512) (60,311,293) (92,740,608)
MAJOR FUNDS

FISCAL 2012–2015 MULTI-YEAR FINANCIAL
4
Table 2: 2012-15 Gap Closing Plan (Major Funds)
(Dollars in millions)
2012 Plan 2013 Plan 2014 Plan 2015 Plan
Current Baseline Gap (w/ 2012 Proposed Actions Carried Forward) - (112.3) (60.3) (92.7)
Surplus Land Sales 5.0 5.0 5.0
Value of New Construction 3.0 6.0 9.0
New Recurring Initiatives 15.0
NYS Actions
Elimination of MTA Station Maintenance 29.0 30.0 31.0
Red Light Camera Phase II 12.0 9.0 7.0
LIE Ticket Surcharge 5.0 5.0 5.0
Public Private Partnership (Sewer System) 75.0 40.0
Public Private Partnership (Estimated savings from debt defeasance) 21.9
Gap Closing Actions 129.0 95.0 93.9
Surplus/ (Deficit) 16.7 34.7 1.2
Discussion of Gap Closing Actions
Project Description - Nassau County Sewer System P3
Building on its successes in partnering with private entities for its bus transportation and inmate health
care services, Nassau County is evaluating a public-private partnership transaction (the “P3 Transaction”)
involving the assets of the County’s sewer system (the “System”). The System is responsible for the
collection, treatment, and disposal of sewage in a large area of the County, with a current customer base
of approximately 1.0 million.
A P3 Transaction may consist of (a) the concession, lease, or other similar arrangement involving the
System, including but not limited to a public-private partnership, or (b) the sale, transfer, or other
disposition involving all or any portion of the System.
Under any P3 Transaction, the County would receive an upfront payment from a private investor as
compensation for transferring operations of the System to that investor. In return, the investor will collect
all charges for System usage as well as assume responsibility for all System operations, maintenance and
capital expenditures. However, the County, or another appropriate State entity, will continue to ensure
that all regulatory standards are met.
To serve as either an operator of or bidder for a P3 Transaction of the System, private operators and
investors will need to meet the County’s qualifications. The County plans to select a private operator to
direct the day-to-day operations of the System under the P3 Transaction prior to identifying the private
investor who will fund the upfront payment to the County.
The P3 Transaction will increase service efficiencies, ensure a high ongoing quality of service for all
County residents who use the System, and accomplish a number of the County’s key financial objectives.
.

FISCAL 2012–2015 MULTI-YEAR FINANCIAL
5
Other MYP Expense Initiatives
The County continues to explore options to achieve expense reductions. All future years of the Multi-
Year Financial Plan include the continuation of the NIFA imposed wage freeze. This condition may
change if the unions engage in negotiations and offer concessions, or if there is a significant economic
recovery.
The County also will continue its Assessment Reforms, which will produce savings in the Plan. The
County has approximately $1.1 billion of outstanding debt used to pay for successful property assessment
challenges. Consequently, County Executive Mangano has made reducing this liability a priority. The
MYP includes projected savings and reduced levels of borrowing from the elimination of the County
guarantee, which causes the County to refund property taxes that it never received, but were received by
school districts, towns, and special districts. The savings estimates increase as successful challenges shift
from before to after the effective date of the elimination of the guarantee. Additionally, the County plans
to ask the State for legislation that prohibits property owners from filing challenges for properties whose
assessments are within 15% of fair market value.
The County also intends pursuing efficiencies and savings through strategic sourcing and Enterprise
Resource Planning (“ERP”) implementation.
The MTA recently levied an onerous payroll tax on Nassau County employers. This costs the County
approximately $3 million annually and impacts businesses in Nassau County by approximately $100
million. The County will be seeking New York State Legislation to eliminate Long Island Railroad
station maintenance payments, to help offset this burdensome tax.
Other MYP Revenue Initiatives
The County also continues to explore ways to maximize revenue. Going forward, the County will pursue
New York State legislation to add red light cameras to an additional 50 intersections. It will also pursue
State legislation seeking reimbursement for the cost of patrolling New York State highways in Nassau
County.
In addition, the future years of the MYP include projected revenues from additional sales of surplus
County land and estimated property taxes from new construction.
MYP Contingencies
As a secondary contingency to the Public Private Partnership, the Mangano Administration would
propose the following actions:
Further Workforce Reduction - $60 million
Should the unions choose not to work with the Administration in realigning the labor agreements to
produce the required level of savings, a further reduction of the workforce would be necessary. This
would result in the additional layoff of 600 employees at a savings of $60 million.

FISCAL 2012–2015 MULTI-YEAR FINANCIAL
6
Furloughs - $60 million
The County would move to transition to a four-day work week for those employees not working in vital
health and public safety areas.

FUND AND DEPARTMENTAL DETAIL


FISCAL 2012–2015 MULTI-YEAR FINANCIAL
7
E/R OBJ 2012 ADOPTED 2013 ADOPTED 2014 ADOPTED 2015 ADOPTED
EXP AA - SALARIES, WAGES & FEES 686,673,715 718,413,435 721,325,306 729,379,157
AB - FRINGE BENEFITS 481,416,054 557,297,524 530,953,291 569,265,498
AC - WORKERS COMPENSATION 30,399,332 31,280,913 32,188,059 33,121,513
BB - EQUIPMENT 1,481,429 1,527,499 1,574,904 1,623,685
DD - GENERAL EXPENSES 30,310,790 30,119,937 30,270,392 30,674,530
DE - CONTRACTUAL SERVICES 213,612,365 217,643,566 222,492,641 228,150,699
DF - UTILITY COSTS 37,624,375 37,593,018 37,881,421 38,285,576
DG - VAR DIRECT EXPENSES 5,000,000 5,000,000 5,000,000 5,000,000
FF - INTEREST 93,863,296 103,656,097 112,043,911 118,086,942
GA - LOCAL GOVT ASST PROGRAM 62,852,361 64,704,079 66,609,498 68,570,173
GG - PRINCIPAL 69,011,202 80,045,186 84,350,624 94,941,557
HC - NHC ASSN EXP - NASSAU HEALTH CARE ASSN 13,000,000 13,000,000 13,000,000 -
HD - DEBT SERVICE CHARGEBACKS 345,015,740 367,042,619 364,759,562 359,035,373
HF - INTER-DEPARTMENTAL CHARGES 155,436,060 155,436,060 155,436,060 155,436,060
HH - INTERFD CHGS - INTERFUND CHARGES 19,332,746 18,184,980 25,242,167 25,499,897
MM - MASS TRANSPORTATION 42,217,100 43,177,862 44,231,337 45,384,706
NA - NCIFA EXPENDITURES 2,025,000 1,600,000 1,675,000 1,750,000
OO - OTHER EXPENSE 385,837,230 383,615,371 356,341,833 314,581,270
PP - EARLY INTERVENTION/SPECIAL EDUCATION 172,975,000 177,254,250 181,652,778 186,174,070
SS - RECIPIENT GRANTS 74,645,000 76,511,125 78,423,903 80,384,501
TT - PURCHASED SERVICES 57,944,683 58,813,853 60,284,200 61,188,463
WW - EMERGENCY VENDOR PAYMENTS 64,396,824 66,972,697 68,981,878 70,361,515
XX - MEDICAID 248,838,445 251,838,445 254,838,445 257,838,445
EXP Total 3,293,908,747 3,460,728,516 3,449,557,207 3,474,733,630
REV BA - INT PENALTY ON TAX 28,500,000 28,500,000 28,500,000 28,500,000
BC - PERMITS & LICENSES 12,029,332 12,029,332 12,029,332 12,029,332
BD - FINES & FORFEITS 51,249,708 51,249,708 51,249,708 51,249,708
BE - INVEST INCOME 3,626,400 10,626,400 17,626,400 24,626,400
BF - RENTS & RECOVERIES 16,894,401 14,894,401 14,894,401 14,894,401
BG - REVENUE OFFSET TO EXPENSE 21,984,354 21,984,354 35,484,354 42,284,354
BH - DEPT REVENUES 171,941,513 177,724,764 179,233,514 181,456,236
BI - CAP BACKCHARGES 9,887,864 10,233,939 10,592,127 10,962,852
BJ - INTERDEPT REVENUES 155,436,060 155,436,060 155,436,060 155,436,060
BO - PAY LIEU TAX - PAYMENT IN LIEU OF TAXES 8,661,865 8,661,865 8,661,865 8,661,865
BQ - D/S FROM CAP - DEBT SERVICE FROM CAPITAL 103,138,378 86,226,711 60,239,521 2,436,000
BV - DEBT SERVICE CHARGEBACK REVENUE 345,015,739 367,042,619 364,759,562 359,035,373
BW - INTERFD CHGS - INTERFUND CHARGES REVENUE 74,139,205 76,899,899 87,544,250 90,552,011
FA - FEDERAL AID - REIMBURSEMENT OF EXPENSES 165,063,957 167,014,317 168,663,997 170,000,237
SA - STATE AID - REIMBURSEMENT OF EXPENSES 234,814,429 238,082,797 241,271,910 244,377,547
TA - SALES TAX CO - SALES TAX COUNTYWIDE 970,802,675 998,955,953 1,027,925,675 1,057,735,520
TB - PART COUNTY - SALES TAX PART COUNTY 85,385,709 87,861,895 90,409,890 93,031,776
TL - PROPERTY TAX 804,331,558 804,331,558 804,331,558 804,331,558
TO - OTB 5% TAX 3,229,600 2,906,433 2,615,791 2,615,791
TX - SPECIAL TAXS - SPECIAL TAXES 27,776,000 27,776,000 27,776,000 27,776,000
REV Total 3,293,908,747 3,348,439,004 3,389,245,915 3,381,993,021
Projected Base Line Gap - (112,289,512) (60,311,293) (92,740,608)
MAJOR FUNDS

FISCAL 2012–2015 MULTI-YEAR FINANCIAL
8
E/R OBJ 2012 ADOPTED 2013 ADOPTED 2014 ADOPTED 2015 ADOPTED
EXP FF - INTEREST 93,863,296 103,656,097 112,043,911 118,086,942
GG - PRINCIPAL 69,011,202 80,045,186 84,350,624 94,941,557
OO - OTHER EXPENSE 222,219,146 222,287,701 212,140,178 192,328,056
EXP Total 385,093,644 405,988,984 408,534,713 405,356,555
REV BQ - D/S FROM CAP - DEBT SERVICE FROM CAPITAL 6,438,378 1,398,378 2,640,000 2,436,000
BV - DEBT SERVICE CHARGEBACK REVENUE 345,015,739 367,042,619 364,759,562 359,035,373
BW - INTERFD CHGS - INTERFUND CHARGES REVENUE 28,476,219 32,384,679 35,971,843 38,721,874
FA - FEDERAL AID - REIMBURSEMENT OF EXPENSES 5,163,308 5,163,308 5,163,308 5,163,308
REV Total 385,093,644 405,988,984 408,534,713 405,356,555
DEBT SERVICE FUND

FISCAL 2012–2015 MULTI-YEAR FINANCIAL
9
E/R OBJ 2012 ADOPTED 2013 ADOPTED 2014 ADOPTED 2015 ADOPTED
EXP AA - SALARIES, WAGES & FEES 9,678,789 10,091,987 10,270,197 10,301,785
AB - FRINGE BENEFITS 4,676,084 5,365,514 5,081,974 5,551,523
BB - EQUIPMENT 26,600 27,403 28,230 29,080
DD - GENERAL EXPENSES 76,700 80,595 84,602 88,726
DE - CONTRACTUAL SERVICES 4,275,100 4,399,455 4,527,416 4,659,088
HD - DEBT SERVICE CHARGEBACKS 338,713 314,875 296,523 271,597
HF - INTER-DEPARTMENTAL CHARGES 2,655,373 2,655,373 2,655,373 2,655,373
EXP Total 21,727,359 22,935,202 22,944,316 23,557,173
REV BE - INVEST INCOME 6,200 6,200 6,200 6,200
BG - REVENUE OFFSET TO EXPENSE 28,700 28,700 28,700 28,700
BH - DEPT REVENUES 6,147,300 6,147,300 6,147,300 6,147,300
BW - INTERFD CHGS - INTERFUND CHARGES REVENUE 104,600 104,600 104,600 104,600
SA - STATE AID - REIMBURSEMENT OF EXPENSES 190,000 190,000 190,000 190,000
TL - PROPERTY TAX 15,250,559 15,250,559 15,250,559 15,250,559
REV Total 21,727,359 21,727,359 21,727,359 21,727,359
FIRE COMMISSION FUND

FISCAL 2012–2015 MULTI-YEAR FINANCIAL
10
E/R OBJ 2012 ADOPTED 2013 ADOPTED 2014 ADOPTED 2015 ADOPTED
EXP AA - SALARIES, WAGES & FEES 210,050,204 221,762,580 216,929,305 222,017,772
AB - FRINGE BENEFITS 120,142,218 144,180,991 135,415,234 142,160,278
AC - WORKERS COMPENSATION 7,264,619 7,475,293 7,692,076 7,915,147
BB - EQUIPMENT 152,052 156,462 160,999 165,668
DD - GENERAL EXPENSES 3,824,750 3,450,118 3,211,872 3,072,565
DE - CONTRACTUAL SERVICES 834,900 860,852 887,557 915,036
DF - UTILITY COSTS 1,239,200 1,132,139 1,064,869 1,023,587
HD - DEBT SERVICE CHARGEBACKS 1,733,051 1,736,191 1,824,699 1,818,509
HF - INTER-DEPARTMENTAL CHARGES 22,464,774 22,464,774 22,464,774 22,464,774
OO - OTHER EXPENSE 16,461,616 16,537,794 16,615,875 16,695,909
EXP Total 384,167,384 419,757,194 406,267,262 418,249,244
REV BC - PERMITS & LICENSES 2,828,500 2,828,500 2,828,500 2,828,500
BD - FINES & FORFEITS 1,750,000 1,750,000 1,750,000 1,750,000
BE - INVEST INCOME 271,400 271,400 271,400 271,400
BF - RENTS & RECOVERIES 200,000 200,000 200,000 200,000
BG - REVENUE OFFSET TO EXPENSE 1,460,000 1,460,000 1,460,000 1,460,000
BH - DEPT REVENUES 4,911,700 4,911,700 4,911,700 4,911,700
BJ - INTERDEPT REVENUES 354,257 354,257 354,257 354,257
BQ - D/S FROM CAP - DEBT SERVICE FROM CAPITAL 2,407,000 1,644,783 842,951 -
TL - PROPERTY TAX 369,984,527 369,984,527 369,984,527 369,984,527
REV Total 384,167,384 383,405,167 382,603,335 381,760,384
POLICE DISTRICT FUND

FISCAL 2012–2015 MULTI-YEAR FINANCIAL
11
E/R OBJ 2012 ADOPTED 2013 ADOPTED 2014 ADOPTED 2015 ADOPTED
EXP AA - SALARIES, WAGES & FEES 192,749,792 200,901,621 201,046,098 202,749,723
AB - FRINGE BENEFITS 113,339,660 134,201,895 127,709,503 135,386,735
AC - WORKERS COMPENSATION 3,519,778 3,621,852 3,726,885 3,834,965
BB - EQUIPMENT 228,000 234,933 242,068 249,409
DD - GENERAL EXPENSES 3,168,320 3,015,380 2,942,148 2,927,276
DE - CONTRACTUAL SERVICES 7,202,000 7,453,954 7,713,215 7,979,994
DF - UTILITY COSTS 2,457,800 2,482,378 2,507,202 2,532,274
HD - DEBT SERVICE CHARGEBACKS 10,708,488 10,215,775 10,291,785 10,171,590
HF - INTER-DEPARTMENTAL CHARGES 24,251,608 24,251,608 24,251,608 24,251,608
OO - OTHER EXPENSE 11,861,202 11,905,452 11,950,808 11,997,298
EXP Total 369,486,648 398,284,848 392,381,319 402,080,872
REV BC - PERMITS & LICENSES 900,000 900,000 900,000 900,000
BE - INVEST INCOME 17,300 17,300 17,300 17,300
BG - REVENUE OFFSET TO EXPENSE 1,996,200 1,996,200 1,996,200 1,996,200
BH - DEPT REVENUES 24,632,500 29,632,500 29,632,500 29,632,500
BI - CAP BACKCHARGES 1,812,400 1,875,834 1,941,488 2,009,440
BJ - INTERDEPT REVENUES 13,338,458 13,338,458 13,338,458 13,338,458
BQ - D/S FROM CAP - DEBT SERVICE FROM CAPITAL 1,222,000 835,033 427,955 -
BW - INTERFD CHGS - INTERFUND CHARGES REVENUE 356,000 356,000 356,000 356,000
FA - FEDERAL AID - REIMBURSEMENT OF EXPENSES 1,664,600 1,664,600 1,664,600 1,664,600
SA - STATE AID - REIMBURSEMENT OF EXPENSES 589,000 589,000 589,000 589,000
TL - PROPERTY TAX 299,057,190 299,057,190 299,057,190 299,057,190
TX - SPECIAL TAXS - SPECIAL TAXES 23,901,000 23,901,000 23,901,000 23,901,000
REV Total 369,486,648 374,163,115 373,821,691 373,461,688
POLICE HEADQUARTERS FUND

FISCAL 2012–2015 MULTI-YEAR FINANCIAL
12
E/R OBJ 2012 ADOPTED 2013 ADOPTED 2014 ADOPTED 2015 ADOPTED
EXP AA - SALARIES, WAGES & FEES 274,194,930 285,657,247 293,079,705 294,309,877
AB - FRINGE BENEFITS 243,258,092 273,549,124 262,746,579 286,166,962
AC - WORKERS COMPENSATION 19,614,935 20,183,768 20,769,097 21,371,401
BB - EQUIPMENT 1,074,777 1,108,701 1,143,608 1,179,527
DD - GENERAL EXPENSES 23,241,020 23,573,844 24,031,769 24,585,963
DE - CONTRACTUAL SERVICES 201,300,365 204,929,305 209,364,454 214,596,581
DF - UTILITY COSTS 33,927,375 33,978,501 34,309,350 34,729,715
DG - VAR DIRECT EXPENSES 5,000,000 5,000,000 5,000,000 5,000,000
GA - LOCAL GOVT ASST PROGRAM 62,852,361 64,704,079 66,609,498 68,570,173
HC - NHC ASSN EXP - NASSAU HEALTH CARE ASSN 13,000,000 13,000,000 13,000,000 -
HD - DEBT SERVICE CHARGEBACKS 332,235,488 354,775,778 352,346,555 346,773,677
HF - INTER-DEPARTMENTAL CHARGES 80,820,023 80,820,023 80,820,023 80,820,023
HH - INTERFD CHGS - INTERFUND CHARGES 19,332,746 18,184,980 25,242,167 25,499,897
MM - MASS TRANSPORTATION 42,217,100 43,177,862 44,231,337 45,384,706
NA - NCIFA EXPENDITURES 2,025,000 1,600,000 1,675,000 1,750,000
OO - OTHER EXPENSE 135,295,266 132,884,425 115,634,971 93,560,006
PP - EARLY INTERVENTION/SPECIAL EDUCATION 172,975,000 177,254,250 181,652,778 186,174,070
SS - RECIPIENT GRANTS 74,645,000 76,511,125 78,423,903 80,384,501
TT - PURCHASED SERVICES 57,944,683 58,813,853 60,284,200 61,188,463
WW - EMERGENCY VENDOR PAYMENTS 64,396,824 66,972,697 68,981,878 70,361,515
XX - MEDICAID 248,838,445 251,838,445 254,838,445 257,838,445
EXP Total 2,108,189,430 2,188,518,007 2,194,185,316 2,200,245,504
REV BA - INT PENALTY ON TAX 28,500,000 28,500,000 28,500,000 28,500,000
BC - PERMITS & LICENSES 8,300,832 8,300,832 8,300,832 8,300,832
BD - FINES & FORFEITS 49,499,708 49,499,708 49,499,708 49,499,708
BE - INVEST INCOME 3,331,500 10,331,500 17,331,500 24,331,500
BF - RENTS & RECOVERIES 16,694,401 14,694,401 14,694,401 14,694,401
BG - REVENUE OFFSET TO EXPENSE 18,499,454 18,499,454 31,999,454 38,799,454
BH - DEPT REVENUES 136,250,013 137,033,264 138,542,014 140,764,736
BI - CAP BACKCHARGES 8,075,464 8,358,105 8,650,639 8,953,411
BJ - INTERDEPT REVENUES 116,499,063 116,499,063 116,499,063 116,499,063
BO - PAY LIEU TAX - PAYMENT IN LIEU OF TAXES 8,661,865 8,661,865 8,661,865 8,661,865
BQ - D/S FROM CAP - DEBT SERVICE FROM CAPITAL 93,071,000 82,348,517 56,328,615 -
BW - INTERFD CHGS - INTERFUND CHARGES REVENUE 45,202,386 44,054,620 51,111,807 51,369,537
FA - FEDERAL AID - REIMBURSEMENT OF EXPENSES 158,236,049 160,186,409 161,836,089 163,172,329
SA - STATE AID - REIMBURSEMENT OF EXPENSES 234,035,429 237,303,797 240,492,910 243,598,547
TA - SALES TAX CO - SALES TAX COUNTYWIDE 970,802,675 998,955,953 1,027,925,675 1,057,735,520
TB - PART COUNTY - SALES TAX PART COUNTY 85,385,709 87,861,895 90,409,890 93,031,776
TL - PROPERTY TAX 120,039,282 120,039,282 120,039,282 120,039,282
TO - OTB 5% TAX 3,229,600 2,906,433 2,615,791 2,615,791
TX - SPECIAL TAXS - SPECIAL TAXES 3,875,000 3,875,000 3,875,000 3,875,000
REV Total 2,108,189,430 2,137,910,097 2,177,314,534 2,174,442,753
GENERAL FUND

FISCAL 2012–2015 MULTI-YEAR FINANCIAL
13
E/R OBJ 2012 ADOPTED 2013 ADOPTED 2014 ADOPTED 2015 ADOPTED
EXP DD - GENERAL EXPENSES 100 103 106 109
DE - CONTRACTUAL SERVICES 15,300 15,744 16,200 16,670
EXP Total 15,400 15,847 16,306 16,779
AC - DEPARTMENT OF INVESTIGATIONS

FISCAL 2012–2015 MULTI-YEAR FINANCIAL
14
E/R OBJ 2012 ADOPTED 2013 ADOPTED 2014 ADOPTED 2015 ADOPTED
EXP AA - SALARIES, WAGES & FEES 1,800,980 1,839,510 1,840,343 1,841,192
DD - GENERAL EXPENSES 33,033 33,991 34,977 35,991
DE - CONTRACTUAL SERVICES 12,250 12,605 12,971 13,347
EXP Total 1,846,263 1,886,106 1,888,290 1,890,530
AR - ASSESSMENT REVIEW COMMISSION

FISCAL 2012–2015 MULTI-YEAR FINANCIAL
15
E/R OBJ 2012 ADOPTED 2013 ADOPTED 2014 ADOPTED 2015 ADOPTED
EXP AA - SALARIES, WAGES & FEES 8,434,763 8,622,794 8,628,278 8,633,871
BB - EQUIPMENT 5,000 5,145 5,294 5,448
DD - GENERAL EXPENSES 303,900 312,713 321,782 331,113
DE - CONTRACTUAL SERVICES 39,000 40,131 41,295 42,492
EXP Total 8,782,663 8,980,783 8,996,648 9,012,925
REV BH - DEPT REVENUES 100,400 100,400 100,400 100,400
BI - CAP BACKCHARGES 155,300 160,736 166,361 172,184
REV Total 255,700 261,136 266,761 272,584
AS - ASSESSMENT DEPARTMENT

FISCAL 2012–2015 MULTI-YEAR FINANCIAL
16
E/R OBJ 2012 ADOPTED 2013 ADOPTED 2014 ADOPTED 2015 ADOPTED
EXP AA - SALARIES, WAGES & FEES 7,786,438 8,092,978 8,101,283 8,109,754
BB - EQUIPMENT 15,000 15,435 15,883 16,343
DD - GENERAL EXPENSES 427,400 439,795 452,549 465,673
DE - CONTRACTUAL SERVICES 2,800,000 2,945,000 3,094,205 3,247,737
EXP Total 11,028,838 11,493,208 11,663,919 11,839,506
REV BD - FINES & FORFEITS 590,000 590,000 590,000 590,000
BF - RENTS & RECOVERIES 620,000 620,000 620,000 620,000
BH - DEPT REVENUES 95,000 95,000 95,000 95,000
BJ - INTERDEPT REVENUES 3,124,796 3,124,796 3,124,796 3,124,796
FA - FEDERAL AID - REIMBURSEMENT OF EXPENSES 300,000 300,000 300,000 300,000
SA - STATE AID - REIMBURSEMENT OF EXPENSES 75,000 75,000 75,000 75,000
REV Total 4,804,796 4,804,796 4,804,796 4,804,796
AT - COUNTY ATTORNEY

FISCAL 2012–2015 MULTI-YEAR FINANCIAL
17
E/R OBJ 2012 ADOPTED 2013 ADOPTED 2014 ADOPTED 2015 ADOPTED
EXP AA - SALARIES, WAGES & FEES (82,009,638) (79,870,404) (75,112,886) (74,892,125)
AB - FRINGE BENEFITS 27,306,963 29,195,523 31,228,473 33,427,955
AC - WORKERS COMPENSATION 12,314,600 12,671,723 13,039,203 13,417,340
BB - EQUIPMENT 10,000 10,290 10,588 10,895
DD - GENERAL EXPENSES 50,500 51,965 53,471 55,022
DE - CONTRACTUAL SERVICES 2,803,600 2,884,904 2,968,567 3,054,655
GA - LOCAL GOVT ASST PROGRAM 62,852,361 64,704,079 66,609,498 68,570,173
HC - NHC ASSN EXP - NASSAU HEALTH CARE ASSN 13,000,000 13,000,000 13,000,000 -
HF - INTER-DEPARTMENTAL CHARGES 5,947,211 5,947,211 5,947,211 5,947,211
HH - INTERFD CHGS - INTERFUND CHARGES 19,322,746 18,174,980 25,232,167 25,489,897
NA - NCIFA EXPENDITURES 2,025,000 1,600,000 1,675,000 1,750,000
OO - OTHER EXPENSE 44,901,094 47,005,296 49,253,912 51,659,450
EXP Total 108,524,437 115,375,569 133,905,205 128,490,475
REV BD - FINES & FORFEITS 2,850,000 2,850,000 2,850,000 2,850,000
BF - RENTS & RECOVERIES 1,020,000 1,020,000 1,020,000 1,020,000
BG - REVENUE OFFSET TO EXPENSE 15,110,954 15,110,954 15,110,954 15,110,954
BH - DEPT REVENUES 620,000 620,000 620,000 620,000
BJ - INTERDEPT REVENUES 59,582,617 59,582,617 59,582,617 59,582,617
BO - PAY LIEU TAX - PAYMENT IN LIEU OF TAXES 8,661,865 8,661,865 8,661,865 8,661,865
BQ - D/S FROM CAP - DEBT SERVICE FROM CAPITAL 18,071,000 12,348,517 6,328,615 -
BW - INTERFD CHGS - INTERFUND CHARGES REVENUE 39,643,146 38,495,380 45,552,567 45,810,297
FA - FEDERAL AID - REIMBURSEMENT OF EXPENSES 118,400 118,400 118,400 118,400
SA - STATE AID - REIMBURSEMENT OF EXPENSES 2,405,000 2,405,000 2,405,000 2,405,000
TA - SALES TAX CO - SALES TAX COUNTYWIDE 970,802,675 998,955,953 1,027,925,675 1,057,735,520
TB - PART COUNTY - SALES TAX PART COUNTY 85,385,709 87,861,895 90,409,890 93,031,776
TL - PROPERTY TAX 120,039,282 120,039,282 120,039,282 120,039,282
TO - OTB 5% TAX 3,229,600 2,906,433 2,615,791 2,615,791
REV Total 1,327,540,248 1,350,976,295 1,383,240,656 1,409,601,502
BU - OFFICE OF MANAGEMENT AND BUDGET

FISCAL 2012–2015 MULTI-YEAR FINANCIAL
18
E/R OBJ 2012 ADOPTED 2013 ADOPTED 2014 ADOPTED 2015 ADOPTED
EXP AA - SALARIES, WAGES & FEES 1,690,540 1,693,079 1,693,214 1,693,351
BB - EQUIPMENT 2,400 2,470 2,541 2,615
DD - GENERAL EXPENSES 14,700 15,126 15,565 16,016
EXP Total 1,707,640 1,710,675 1,711,320 1,711,983
REV BC - PERMITS & LICENSES 2,922,307 2,922,307 2,922,307 2,922,307
BD - FINES & FORFEITS 470,000 470,000 470,000 470,000
BH - DEPT REVENUES 200 200 200 200
SA - STATE AID - REIMBURSEMENT OF EXPENSES 45,000 45,000 45,000 45,000
REV Total 3,437,507 3,437,507 3,437,507 3,437,507
CA - OFFICE OF CONSUMER AFFAIRS
FISCAL 2012–2015 MULTI-YEAR FINANCIAL
19
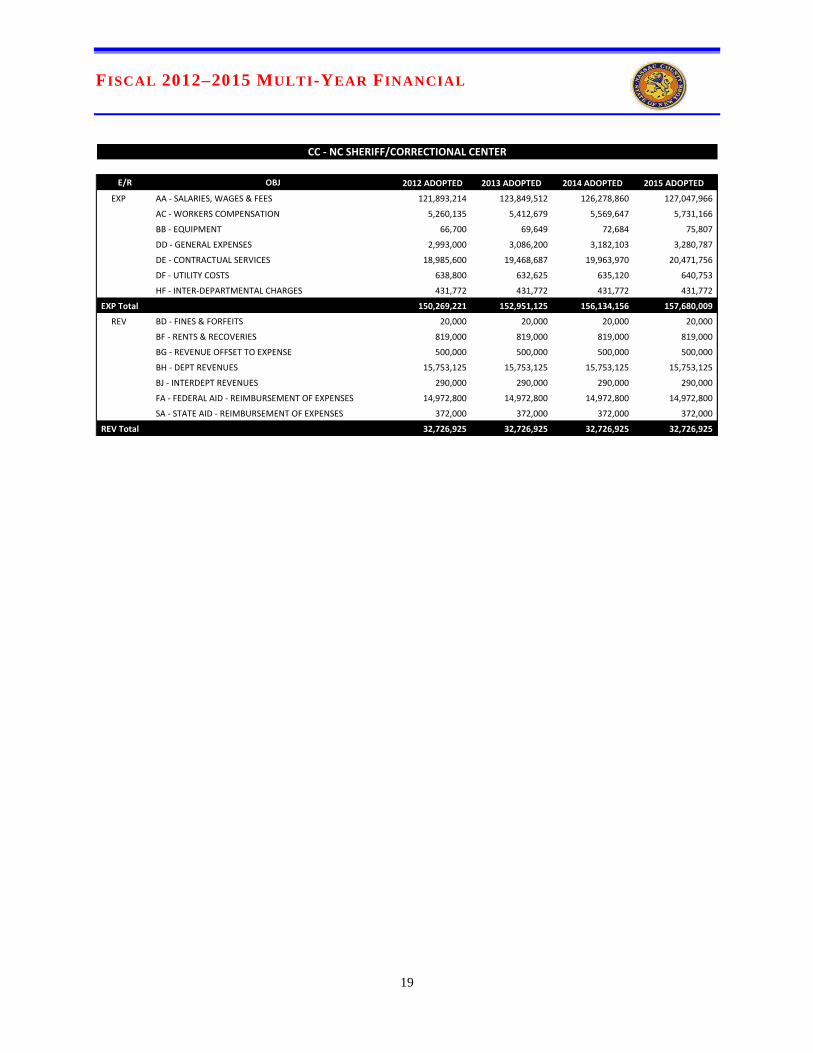
E/R OBJ 2012 ADOPTED 2013 ADOPTED 2014 ADOPTED 2015 ADOPTED
EXP AA - SALARIES, WAGES & FEES 121,893,214 123,849,512 126,278,860 127,047,966
AC - WORKERS COMPENSATION 5,260,135 5,412,679 5,569,647 5,731,166
BB - EQUIPMENT 66,700 69,649 72,684 75,807
DD - GENERAL EXPENSES 2,993,000 3,086,200 3,182,103 3,280,787
DE - CONTRACTUAL SERVICES 18,985,600 19,468,687 19,963,970 20,471,756
DF - UTILITY COSTS 638,800 632,625 635,120 640,753
HF - INTER-DEPARTMENTAL CHARGES 431,772 431,772 431,772 431,772
EXP Total 150,269,221 152,951,125 156,134,156 157,680,009
REV BD - FINES & FORFEITS 20,000 20,000 20,000 20,000
BF - RENTS & RECOVERIES 819,000 819,000 819,000 819,000
BG - REVENUE OFFSET TO EXPENSE 500,000 500,000 500,000 500,000
BH - DEPT REVENUES 15,753,125 15,753,125 15,753,125 15,753,125
BJ - INTERDEPT REVENUES 290,000 290,000 290,000 290,000
FA - FEDERAL AID - REIMBURSEMENT OF EXPENSES 14,972,800 14,972,800 14,972,800 14,972,800
SA - STATE AID - REIMBURSEMENT OF EXPENSES 372,000 372,000 372,000 372,000
REV Total 32,726,925 32,726,925 32,726,925 32,726,925
CC - NC SHERIFF/CORRECTIONAL CENTER

FISCAL 2012–2015 MULTI-YEAR FINANCIAL
20
E/R OBJ 2012 ADOPTED 2013 ADOPTED 2014 ADOPTED 2015 ADOPTED
EXP AA - SALARIES, WAGES & FEES 1,751,629 1,811,529 1,813,125 1,814,753
DD - GENERAL EXPENSES 80,000 82,320 84,707 87,164
DE - CONTRACTUAL SERVICES 225,000 231,525 238,239 245,148
EXP Total 2,056,629 2,125,374 2,136,072 2,147,065
CE - COUNTY EXECUTIVE
FISCAL 2012–2015 MULTI-YEAR FINANCIAL
21
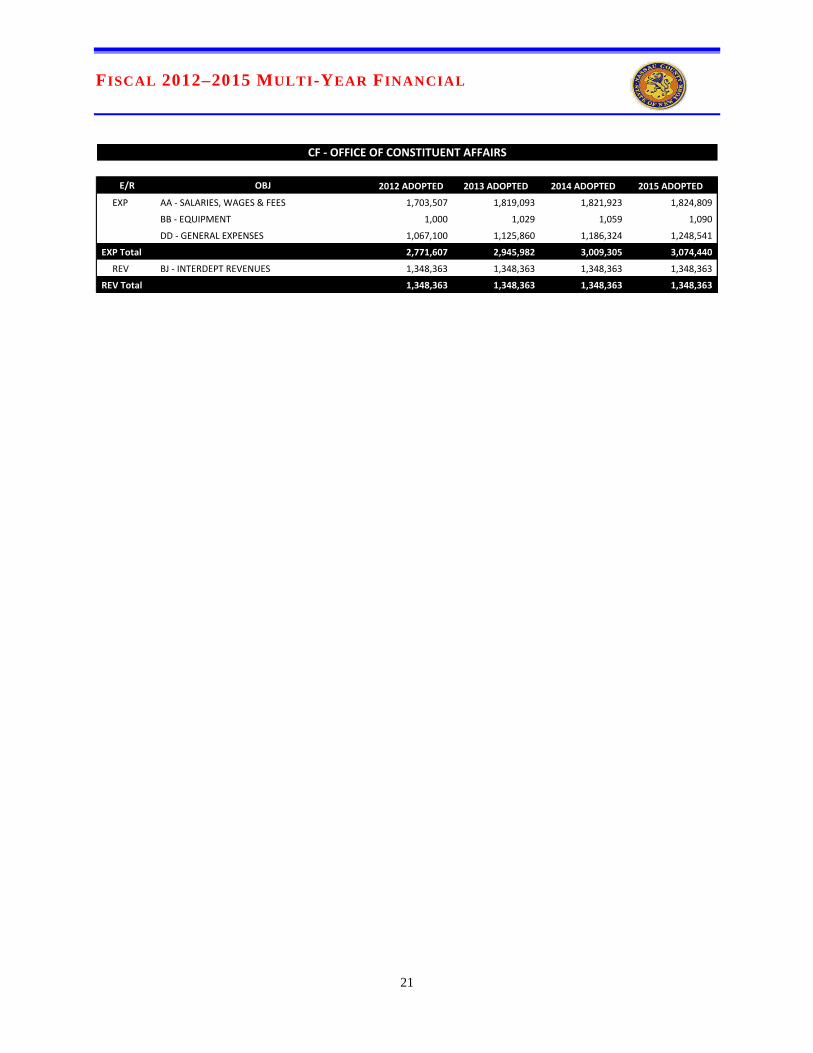
E/R OBJ 2012 ADOPTED 2013 ADOPTED 2014 ADOPTED 2015 ADOPTED
EXP AA - SALARIES, WAGES & FEES 1,703,507 1,819,093 1,821,923 1,824,809
BB - EQUIPMENT 1,000 1,029 1,059 1,090
DD - GENERAL EXPENSES 1,067,100 1,125,860 1,186,324 1,248,541
EXP Total 2,771,607 2,945,982 3,009,305 3,074,440
REV BJ - INTERDEPT REVENUES 1,348,363 1,348,363 1,348,363 1,348,363
REV Total 1,348,363 1,348,363 1,348,363 1,348,363
CF - OFFICE OF CONSTITUENT AFFAIRS

FISCAL 2012–2015 MULTI-YEAR FINANCIAL
22
E/R OBJ 2012 ADOPTED 2013 ADOPTED 2014 ADOPTED 2015 ADOPTED
EXP AA - SALARIES, WAGES & FEES 5,412,219 5,488,769 5,490,402 5,492,068
BB - EQUIPMENT 50,000 51,450 52,942 54,477
DD - GENERAL EXPENSES 300,000 308,700 317,652 326,864
DE - CONTRACTUAL SERVICES 300,000 308,700 317,652 326,864
EXP Total 6,062,219 6,157,619 6,178,649 6,200,273
REV BD - FINES & FORFEITS 200,000 200,000 200,000 200,000
BH - DEPT REVENUES 23,952,000 23,952,000 23,952,000 23,952,000
REV Total 24,152,000 24,152,000 24,152,000 24,152,000
CL - COUNTY CLERK

FISCAL 2012–2015 MULTI-YEAR FINANCIAL
23
E/R OBJ 2012 ADOPTED 2013 ADOPTED 2014 ADOPTED 2015 ADOPTED
EXP AA - SALARIES, WAGES & FEES 6,410,289 6,767,817 6,775,988 6,784,322
BB - EQUIPMENT 5,000 5,145 5,294 5,448
DD - GENERAL EXPENSES 75,000 77,175 79,413 81,716
DE - CONTRACTUAL SERVICES 425,000 437,325 450,007 463,058
EXP Total 6,915,289 7,287,462 7,310,702 7,334,543
REV BF - RENTS & RECOVERIES 250,000 250,000 250,000 250,000
BH - DEPT REVENUES 16,300 16,300 16,300 16,300
REV Total 266,300 266,300 266,300 266,300
CO - COUNTY COMPTROLLER

FISCAL 2012–2015 MULTI-YEAR FINANCIAL
24
E/R OBJ 2012 ADOPTED 2013 ADOPTED 2014 ADOPTED 2015 ADOPTED
EXP AA - SALARIES, WAGES & FEES 3,858,344 3,945,723 3,947,815 3,949,948
DD - GENERAL EXPENSES 327,400 336,895 346,665 356,718
DE - CONTRACTUAL SERVICES 11,000 11,319 11,647 11,985
HH - INTERFD CHGS - INTERFUND CHARGES 10,000 10,000 10,000 10,000
EXP Total 4,206,744 4,303,937 4,316,126 4,328,651
REV BF - RENTS & RECOVERIES 138,961 138,961 138,961 138,961
BH - DEPT REVENUES 612,000 612,000 612,000 612,000
REV Total 750,961 750,961 750,961 750,961
CS - CIVIL SERVICE
FISCAL 2012–2015 MULTI-YEAR FINANCIAL
25
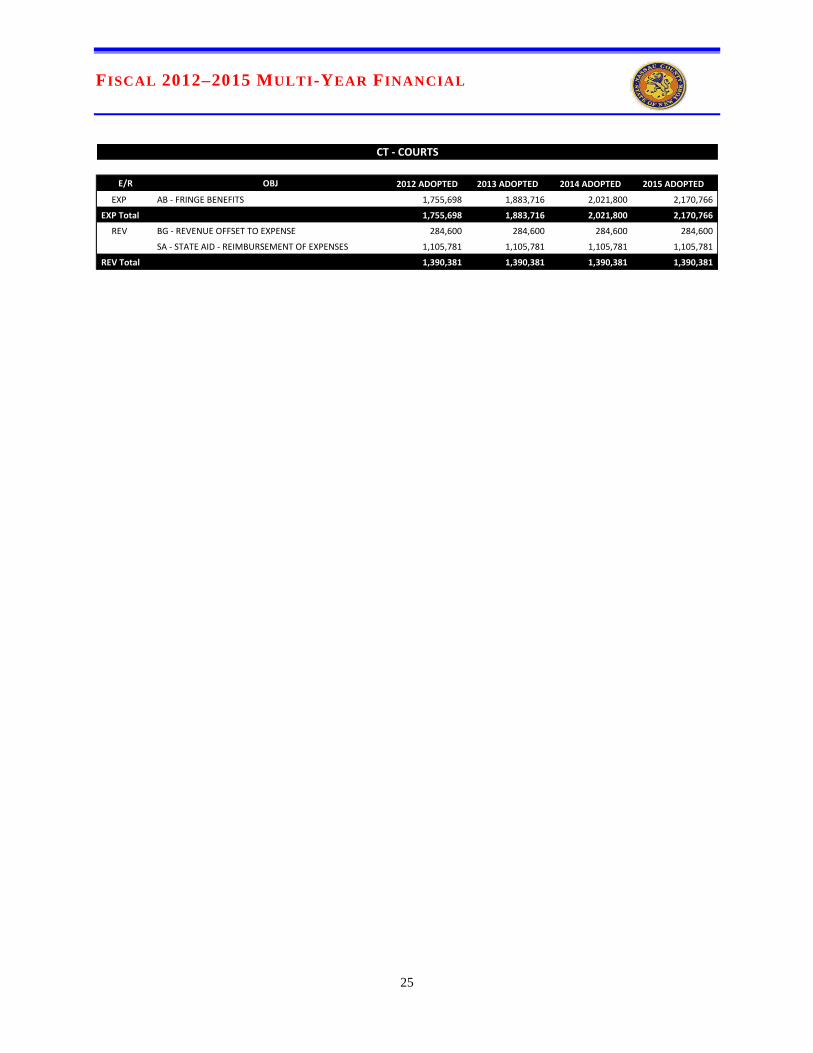
E/R OBJ 2012 ADOPTED 2013 ADOPTED 2014 ADOPTED 2015 ADOPTED
EXP AB - FRINGE BENEFITS 1,755,698 1,883,716 2,021,800 2,170,766
EXP Total 1,755,698 1,883,716 2,021,800 2,170,766
REV BG - REVENUE OFFSET TO EXPENSE 284,600 284,600 284,600 284,600
SA - STATE AID - REIMBURSEMENT OF EXPENSES 1,105,781 1,105,781 1,105,781 1,105,781
REV Total 1,390,381 1,390,381 1,390,381 1,390,381
CT - COURTS

FISCAL 2012–2015 MULTI-YEAR FINANCIAL
26
E/R OBJ 2012 ADOPTED 2013 ADOPTED 2014 ADOPTED 2015 ADOPTED
EXP AA - SALARIES, WAGES & FEES 28,218,694 29,117,572 29,144,428 29,171,821
BB - EQUIPMENT 75,500 77,690 79,942 82,261
DD - GENERAL EXPENSES 1,002,300 1,031,367 1,061,276 1,092,053
DE - CONTRACTUAL SERVICES 1,057,500 1,088,168 1,119,724 1,152,196
EXP Total 30,353,994 31,314,796 31,405,371 31,498,332
REV BF - RENTS & RECOVERIES 250,000 250,000 250,000 250,000
BH - DEPT REVENUES 12,000 12,000 12,000 12,000
BJ - INTERDEPT REVENUES 366,454 366,454 366,454 366,454
FA - FEDERAL AID - REIMBURSEMENT OF EXPENSES 34,400 34,400 34,400 34,400
SA - STATE AID - REIMBURSEMENT OF EXPENSES 39,400 39,400 39,400 39,400
REV Total 702,254 702,254 702,254 702,254
DA - DISTRICT ATTORNEY

FISCAL 2012–2015 MULTI-YEAR FINANCIAL
27
E/R OBJ 2012 ADOPTED 2013 ADOPTED 2014 ADOPTED 2015 ADOPTED
EXP HD - DEBT SERVICE CHARGEBACKS 332,235,488 354,775,778 352,346,555 346,773,677
EXP Total 332,235,488 354,775,778 352,346,555 346,773,677
DS - DEBT SERVICE

FISCAL 2012–2015 MULTI-YEAR FINANCIAL
28
E/R OBJ 2012 ADOPTED 2013 ADOPTED 2014 ADOPTED 2015 ADOPTED
EXP AA - SALARIES, WAGES & FEES 12,192,047 12,751,333 12,775,423 12,799,994
BB - EQUIPMENT 119,100 122,554 126,108 129,765
DD - GENERAL EXPENSES 3,560,500 3,663,755 3,770,003 3,879,333
DE - CONTRACTUAL SERVICES 1,046,500 1,076,849 1,108,077 1,140,211
OO - OTHER EXPENSE 1,463,272 1,463,272 1,463,272 1,463,272
EXP Total 18,381,419 19,077,762 19,242,883 19,412,576
REV BF - RENTS & RECOVERIES 120,000 120,000 120,000 120,000
BH - DEPT REVENUES 35,000 35,000 35,000 35,000
REV Total 155,000 155,000 155,000 155,000
EL - BOARD OF ELECTIONS

FISCAL 2012–2015 MULTI-YEAR FINANCIAL
29
E/R OBJ 2012 ADOPTED 2013 ADOPTED 2014 ADOPTED 2015 ADOPTED
EXP AA - SALARIES, WAGES & FEES 581,771 583,473 583,519 583,566
DD - GENERAL EXPENSES 9,500 9,776 10,059 10,351
DE - CONTRACTUAL SERVICES 100,000 102,900 105,884 108,955
EXP Total 691,271 696,149 699,462 702,871
REV FA - FEDERAL AID - REIMBURSEMENT OF EXPENSES 491,571 491,571 491,571 491,571
REV Total 491,571 491,571 491,571 491,571
EM - EMERGENCY MANAGEMENT

FISCAL 2012–2015 MULTI-YEAR FINANCIAL
30
E/R OBJ 2012 ADOPTED 2013 ADOPTED 2014 ADOPTED 2015 ADOPTED
EXP AB - FRINGE BENEFITS 214,195,431 242,469,885 229,496,306 250,568,242
EXP Total 214,195,431 242,469,885 229,496,306 250,568,242
REV BG - REVENUE OFFSET TO EXPENSE 2,603,900 2,603,900 2,603,900 2,603,900
REV Total 2,603,900 2,603,900 2,603,900 2,603,900
FB - FRINGE BENEFIT

FISCAL 2012–2015 MULTI-YEAR FINANCIAL
31
E/R OBJ 2012 ADOPTED 2013 ADOPTED 2014 ADOPTED 2015 ADOPTED
EXP AA - SALARIES, WAGES & FEES 13,966,902 14,427,579 14,441,397 14,455,492
BB - EQUIPMENT 27,600 28,400 29,224 30,072
DD - GENERAL EXPENSES 1,688,101 1,740,957 1,795,347 1,851,313
DE - CONTRACTUAL SERVICES 548,000 563,892 580,245 597,072
DG - VAR DIRECT EXPENSES 5,000,000 5,000,000 5,000,000 5,000,000
HF - INTER-DEPARTMENTAL CHARGES 6,311,999 6,311,999 6,311,999 6,311,999
PP - EARLY INTERVENTION/SPECIAL EDUCATION 172,975,000 177,254,250 181,652,778 186,174,070
EXP Total 200,517,602 205,327,078 209,810,989 214,420,017
REV BC - PERMITS & LICENSES 4,085,925 4,085,925 4,085,925 4,085,925
BD - FINES & FORFEITS 277,900 277,900 277,900 277,900
BF - RENTS & RECOVERIES 807,300 807,300 807,300 807,300
BH - DEPT REVENUES 11,429,450 11,429,450 11,429,450 11,429,450
BW - INTERFD CHGS - INTERFUND CHARGES REVENUE 477,640 477,640 477,640 477,640
SA - STATE AID - REIMBURSEMENT OF EXPENSES 95,021,780 97,346,871 99,738,129 102,197,504
REV Total 112,099,995 114,425,086 116,816,344 119,275,719
HE - HEALTH DEPARTMENT

FISCAL 2012–2015 MULTI-YEAR FINANCIAL
32
E/R OBJ 2012 ADOPTED 2013 ADOPTED 2014 ADOPTED 2015 ADOPTED
EXP AA - SALARIES, WAGES & FEES 82,700 84,583 84,675 84,768
DD - GENERAL EXPENSES 5,400 5,557 5,718 5,884
HF - INTER-DEPARTMENTAL CHARGES 229,707 229,707 229,707 229,707
EXP Total 317,807 319,847 320,099 320,359
HI - HOUSING & INTERGOVERNMENTAL AFFAIRS

FISCAL 2012–2015 MULTI-YEAR FINANCIAL
33
E/R OBJ 2012 ADOPTED 2013 ADOPTED 2014 ADOPTED 2015 ADOPTED
EXP AA - SALARIES, WAGES & FEES 270,333 270,341 270,349 270,357
DD - GENERAL EXPENSES 5,450 5,608 5,771 5,938
DE - CONTRACTUAL SERVICES 11,600 11,936 12,283 12,639
EXP Total 287,383 287,885 288,402 288,934
HR - COMMISSION ON HUMAN RIGHTS

FISCAL 2012–2015 MULTI-YEAR FINANCIAL
34
E/R OBJ 2012 ADOPTED 2013 ADOPTED 2014 ADOPTED 2015 ADOPTED
EXP AA - SALARIES, WAGES & FEES 6,780,727 7,145,881 7,154,778 7,163,853
BB - EQUIPMENT 1,000 1,029 1,059 1,090
DD - GENERAL EXPENSES 651,200 670,085 689,517 709,513
DE - CONTRACTUAL SERVICES 29,628,447 30,487,672 31,371,814 32,281,597
HF - INTER-DEPARTMENTAL CHARGES 4,216,267 4,216,267 4,216,267 4,216,267
EXP Total 41,277,641 42,520,934 43,433,436 44,372,320
REV BD - FINES & FORFEITS 40,000 40,000 40,000 40,000
BH - DEPT REVENUES 16,800 16,800 16,800 16,800
BJ - INTERDEPT REVENUES 14,762,793 14,762,793 14,762,793 14,762,793
BW - INTERFD CHGS - INTERFUND CHARGES REVENUE 565,000 565,000 565,000 565,000
FA - FEDERAL AID - REIMBURSEMENT OF EXPENSES 5,632,871 5,632,871 5,632,871 5,632,871
SA - STATE AID - REIMBURSEMENT OF EXPENSES 13,541,152 13,541,152 13,541,152 13,541,152
REV Total 34,558,616 34,558,616 34,558,616 34,558,616
HS - DEPARTMENT OF HUMAN SERVICES

FISCAL 2012–2015 MULTI-YEAR FINANCIAL
35
E/R OBJ 2012 ADOPTED 2013 ADOPTED 2014 ADOPTED 2015 ADOPTED
EXP AA - SALARIES, WAGES & FEES 6,904,265 7,221,072 7,229,843 7,238,789
DD - GENERAL EXPENSES 308,150 317,086 326,282 335,744
DE - CONTRACTUAL SERVICES 8,609,797 8,859,481 9,116,406 9,380,782
DF - UTILITY COSTS 4,245,500 4,281,379 4,317,617 4,354,217
HF - INTER-DEPARTMENTAL CHARGES 1,341,876 1,341,876 1,341,876 1,341,876
EXP Total 21,409,588 22,020,894 22,332,023 22,651,408
REV BH - DEPT REVENUES 5,000 5,000 5,000 5,000
BI - CAP BACKCHARGES 2,500,000 2,587,500 2,678,063 2,771,795
BJ - INTERDEPT REVENUES 4,462,594 4,462,594 4,462,594 4,462,594
SA - STATE AID - REIMBURSEMENT OF EXPENSES 433,500 433,500 433,500 433,500
REV Total 7,401,094 7,488,594 7,579,157 7,672,889
IT - INFORMATION TECHNOLOGY

FISCAL 2012–2015 MULTI-YEAR FINANCIAL
36
E/R OBJ 2012 ADOPTED 2013 ADOPTED 2014 ADOPTED 2015 ADOPTED
EXP AA - SALARIES, WAGES & FEES 6,298,656 6,406,384 6,408,941 6,411,548
BB - EQUIPMENT 45,777 47,105 48,471 49,876
DD - GENERAL EXPENSES 1,682,331 1,731,119 1,781,321 1,832,979
DE - CONTRACTUAL SERVICES 1,568,274 1,628,254 1,689,973 1,753,483
EXP Total 9,595,038 9,812,861 9,928,706 10,047,886
LE - COUNTY LEGISLATURE

FISCAL 2012–2015 MULTI-YEAR FINANCIAL
37
E/R OBJ 2012 ADOPTED 2013 ADOPTED 2014 ADOPTED 2015 ADOPTED
EXP AA - SALARIES, WAGES & FEES 227,000 273,097 274,019 274,959
DD - GENERAL EXPENSES 5,700 5,865 6,035 6,210
DE - CONTRACTUAL SERVICES 407,900 419,729 431,901 444,426
EXP Total 640,600 698,691 711,956 725,596
LR - OFFICE OF LABOR RELATIONS

FISCAL 2012–2015 MULTI-YEAR FINANCIAL
38
E/R OBJ 2012 ADOPTED 2013 ADOPTED 2014 ADOPTED 2015 ADOPTED
EXP AA - SALARIES, WAGES & FEES 280,017 280,087 280,158 280,231
DD - GENERAL EXPENSES 6,000 6,174 6,353 6,537
DE - CONTRACTUAL SERVICES 51,400 52,891 54,424 56,003
EXP Total 337,417 339,152 340,936 342,771
MA - OFFICE OF MINORITY AFFAIRS

FISCAL 2012–2015 MULTI-YEAR FINANCIAL
39
E/R OBJ 2012 ADOPTED 2013 ADOPTED 2014 ADOPTED 2015 ADOPTED
EXP AA - SALARIES, WAGES & FEES 4,836,109 5,123,928 5,132,076 5,140,388
BB - EQUIPMENT 11,800 12,142 12,494 12,857
DD - GENERAL EXPENSES 382,975 395,315 408,012 421,077
DE - CONTRACTUAL SERVICES 57,160 58,818 60,523 62,279
HF - INTER-DEPARTMENTAL CHARGES 1,134,415 1,134,415 1,134,415 1,134,415
EXP Total 6,422,459 6,724,617 6,747,521 6,771,015
REV BH - DEPT REVENUES 20,000 20,000 20,000 20,000
BW - INTERFD CHGS - INTERFUND CHARGES REVENUE 166,200 166,200 166,200 166,200
REV Total 186,200 186,200 186,200 186,200
ME - MEDICAL EXAMINER

FISCAL 2012–2015 MULTI-YEAR FINANCIAL
40
E/R OBJ 2012 ADOPTED 2013 ADOPTED 2014 ADOPTED 2015 ADOPTED
EXP AA - SALARIES, WAGES & FEES 453,354 457,646 457,732 457,819
DD - GENERAL EXPENSES 9,000 9,261 9,530 9,806
DE - CONTRACTUAL SERVICES 13,700 14,097 14,506 14,927
EXP Total 476,054 481,004 481,768 482,552
REV BH - DEPT REVENUES 400,000 400,000 400,000 400,000
REV Total 400,000 400,000 400,000 400,000
PA - PUBLIC ADMINISTRATOR

FISCAL 2012–2015 MULTI-YEAR FINANCIAL
41
E/R OBJ 2012 ADOPTED 2013 ADOPTED 2014 ADOPTED 2015 ADOPTED
EXP AA - SALARIES, WAGES & FEES 16,672,571 17,450,449 17,484,576 17,519,385
BB - EQUIPMENT 30,900 31,796 32,718 33,667
DD - GENERAL EXPENSES 319,800 329,013 338,512 348,299
DE - CONTRACTUAL SERVICES 535,725 551,261 567,248 583,698
DF - UTILITY COSTS 500 505 515 525
HF - INTER-DEPARTMENTAL CHARGES 865,428 865,428 865,428 865,428
EXP Total 18,424,924 19,228,452 19,288,996 19,351,002
REV BH - DEPT REVENUES 1,883,500 1,883,500 1,883,500 1,883,500
SA - STATE AID - REIMBURSEMENT OF EXPENSES 5,305,800 5,305,800 5,305,800 5,305,800
REV Total 7,189,300 7,189,300 7,189,300 7,189,300
PB - PROBATION

FISCAL 2012–2015 MULTI-YEAR FINANCIAL
42
E/R OBJ 2012 ADOPTED 2013 ADOPTED 2014 ADOPTED 2015 ADOPTED
EXP AA - SALARIES, WAGES & FEES 708,004 758,062 759,121 760,202
DD - GENERAL EXPENSES 44,400 45,688 47,013 48,376
DE - CONTRACTUAL SERVICES 22,500 23,153 23,824 24,515
EXP Total 774,904 826,902 829,958 833,092
PE - DEPARTMENT OF HUMAN RESOURCES

FISCAL 2012–2015 MULTI-YEAR FINANCIAL
43
E/R OBJ 2012 ADOPTED 2013 ADOPTED 2014 ADOPTED 2015 ADOPTED
EXP AA - SALARIES, WAGES & FEES 13,502,466 13,869,894 13,886,620 13,903,681
BB - EQUIPMENT 456,500 471,479 486,891 502,751
DD - GENERAL EXPENSES 1,429,700 1,480,586 1,532,948 1,586,829
DE - CONTRACTUAL SERVICES 3,375,200 3,480,983 3,589,834 3,701,842
HF - INTER-DEPARTMENTAL CHARGES 80,000 80,000 80,000 80,000
EXP Total 18,843,866 19,382,942 19,576,294 19,775,103
REV BF - RENTS & RECOVERIES 1,587,340 1,587,340 1,587,340 1,587,340
BH - DEPT REVENUES 18,429,150 18,429,150 18,429,150 18,429,150
TX - SPECIAL TAXS - SPECIAL TAXES 675,000 675,000 675,000 675,000
REV Total 20,691,490 20,691,490 20,691,490 20,691,490
PK - PARKS, RECREATION AND MUSEUMS

FISCAL 2012–2015 MULTI-YEAR FINANCIAL
44
E/R OBJ 2012 ADOPTED 2013 ADOPTED 2014 ADOPTED 2015 ADOPTED
EXP AA - SALARIES, WAGES & FEES 1,083,245 1,155,149 1,156,623 1,158,127
DD - GENERAL EXPENSES 17,500 18,008 18,530 19,067
DE - CONTRACTUAL SERVICES 1,500 1,544 1,588 1,634
EXP Total 1,102,245 1,174,700 1,176,741 1,178,828
REV BF - RENTS & RECOVERIES 100,000 100,000 100,000 100,000
BH - DEPT REVENUES 20,500 20,500 20,500 20,500
REV Total 120,500 120,500 120,500 120,500
PR - PURCHASING DEPARTMENT

FISCAL 2012–2015 MULTI-YEAR FINANCIAL
45
E/R OBJ 2012 ADOPTED 2013 ADOPTED 2014 ADOPTED 2015 ADOPTED
EXP AA - SALARIES, WAGES & FEES 26,537,741 27,883,078 27,917,009 27,951,618
AC - WORKERS COMPENSATION 2,040,200 2,099,366 2,160,247 2,222,895
BB - EQUIPMENT 93,000 95,697 98,472 101,328
DD - GENERAL EXPENSES 4,631,300 4,375,726 4,228,172 4,159,315
DE - CONTRACTUAL SERVICES 5,690,791 5,855,824 6,025,643 6,200,386
DF - UTILITY COSTS 29,042,575 29,063,992 29,356,097 29,734,219
HF - INTER-DEPARTMENTAL CHARGES 13,480,936 13,480,936 13,480,936 13,480,936
EXP Total 81,516,543 82,854,619 83,266,577 83,850,697
REV BC - PERMITS & LICENSES 1,292,600 1,292,600 1,292,600 1,292,600
BD - FINES & FORFEITS 10,000 10,000 10,000 10,000
BH - DEPT REVENUES 1,779,000 1,779,000 1,779,000 1,779,000
BI - CAP BACKCHARGES 5,420,164 5,609,870 5,806,215 6,009,433
BJ - INTERDEPT REVENUES 8,154,796 8,154,796 8,154,796 8,154,796
BW - INTERFD CHGS - INTERFUND CHARGES REVENUE 3,630,000 3,630,000 3,630,000 3,630,000
FA - FEDERAL AID - REIMBURSEMENT OF EXPENSES 25,000 25,000 25,000 25,000
SA - STATE AID - REIMBURSEMENT OF EXPENSES 100,000 100,000 100,000 100,000
REV Total 20,411,560 20,601,266 20,797,611 21,000,829
PW - PUBLIC WORKS DEPARTMENT

FISCAL 2012–2015 MULTI-YEAR FINANCIAL
46
E/R OBJ 2012 ADOPTED 2013 ADOPTED 2014 ADOPTED 2015 ADOPTED
EXP AA - SALARIES, WAGES & FEES 758,395 768,437 768,680 768,928
BB - EQUIPMENT 5,000 5,145 5,294 5,448
DD - GENERAL EXPENSES 160,500 165,155 169,944 174,872
DE - CONTRACTUAL SERVICES 125,000 128,625 132,355 136,193
EXP Total 1,048,895 1,067,362 1,076,273 1,085,441
RM - RECORDS MANAGEMENT

FISCAL 2012–2015 MULTI-YEAR FINANCIAL
47
E/R OBJ 2012 ADOPTED 2013 ADOPTED 2014 ADOPTED 2015 ADOPTED
EXP AA - SALARIES, WAGES & FEES 250,950 258,315 258,462 258,613
DD - GENERAL EXPENSES 2,800 2,881 2,965 3,051
DE - CONTRACTUAL SERVICES 12,500 12,863 13,236 13,619
EXP Total 266,250 274,059 274,663 275,283
REV BH - DEPT REVENUES 18,000 18,000 18,000 18,000
REV Total 18,000 18,000 18,000 18,000
SA - COORD AGENCY FOR SPANISH AMERICANS
\

FISCAL 2012–2015 MULTI-YEAR FINANCIAL
48
E/R OBJ 2012 ADOPTED 2013 ADOPTED 2014 ADOPTED 2015 ADOPTED
EXP AA - SALARIES, WAGES & FEES 48,973,297 49,350,774 49,370,472 49,390,563
BB - EQUIPMENT 24,000 24,696 25,412 26,149
DD - GENERAL EXPENSES 982,700 1,011,198 1,040,523 1,070,698
DE - CONTRACTUAL SERVICES 7,931,409 8,161,420 8,398,101 8,641,646
HF - INTER-DEPARTMENTAL CHARGES 20,083,243 20,083,243 20,083,243 20,083,243
SS - RECIPIENT GRANTS 74,645,000 76,511,125 78,423,903 80,384,501
TT - PURCHASED SERVICES 57,944,683 58,813,853 60,284,200 61,188,463
WW - EMERGENCY VENDOR PAYMENTS 64,396,824 66,972,697 68,981,878 70,361,515
XX - MEDICAID 248,838,445 251,838,445 254,838,445 257,838,445
EXP Total 523,819,601 532,767,451 541,446,176 548,985,223
REV BH - DEPT REVENUES 14,701,232 14,701,232 14,701,232 14,701,232
BJ - INTERDEPT REVENUES 100,600 100,600 100,600 100,600
FA - FEDERAL AID - REIMBURSEMENT OF EXPENSES 130,661,007 132,611,367 134,261,047 135,597,287
SA - STATE AID - REIMBURSEMENT OF EXPENSES 63,158,116 64,101,393 64,899,248 65,545,510
REV Total 208,620,955 211,514,592 213,962,126 215,944,629
SS - SOCIAL SERVICES

FISCAL 2012–2015 MULTI-YEAR FINANCIAL
49
E/R OBJ 2012 ADOPTED 2013 ADOPTED 2014 ADOPTED 2015 ADOPTED
EXP AA - SALARIES, WAGES & FEES 2,121,810 2,185,398 2,186,670 2,187,967
BB - EQUIPMENT 7,700 7,923 8,153 8,390
DD - GENERAL EXPENSES 243,700 250,767 258,040 265,523
DE - CONTRACTUAL SERVICES 69,100 71,104 73,166 75,288
OO - OTHER EXPENSE 75,000,000 70,000,000 50,000,000 25,000,000
EXP Total 77,442,310 72,515,193 52,526,028 27,537,167
REV BA - INT PENALTY ON TAX 28,500,000 28,500,000 28,500,000 28,500,000
BD - FINES & FORFEITS 20,000 20,000 20,000 20,000
BE - INVEST INCOME 3,331,500 10,331,500 17,331,500 24,331,500
BG - REVENUE OFFSET TO EXPENSE - - 13,500,000 20,300,000
BH - DEPT REVENUES 750,100 750,100 750,100 750,100
BQ - D/S FROM CAP - DEBT SERVICE FROM CAPITAL 75,000,000 70,000,000 50,000,000 -
TX - SPECIAL TAXS - SPECIAL TAXES 3,200,000 3,200,000 3,200,000 3,200,000
REV Total 110,801,600 112,801,600 113,301,600 77,101,600
TR - COUNTY TREASURER

FISCAL 2012–2015 MULTI-YEAR FINANCIAL
50
E/R OBJ 2012 ADOPTED 2013 ADOPTED 2014 ADOPTED 2015 ADOPTED
EXP AA - SALARIES, WAGES & FEES 2,835,441 2,841,741 2,843,067 2,844,420
BB - EQUIPMENT 21,800 22,432 23,083 23,752
DD - GENERAL EXPENSES 325,180 334,610 344,314 354,299
DE - CONTRACTUAL SERVICES 10,899,656 11,215,746 11,541,003 11,875,692
HF - INTER-DEPARTMENTAL CHARGES 25,531,950 25,531,950 25,531,950 25,531,950
EXP Total 39,614,027 39,946,479 40,283,416 40,630,112
REV BD - FINES & FORFEITS 45,021,808 45,021,808 45,021,808 45,021,808
BJ - INTERDEPT REVENUES 10,899,656 10,899,656 10,899,656 10,899,656
REV Total 55,921,464 55,921,464 55,921,464 55,921,464
TV - TRAFFIC & PARKING VIOLATIONS AGENCY

FISCAL 2012–2015 MULTI-YEAR FINANCIAL
51
E/R OBJ 2012 ADOPTED 2013 ADOPTED 2014 ADOPTED 2015 ADOPTED
EXP AA - SALARIES, WAGES & FEES 168,901 175,304 175,432 175,563
DD - GENERAL EXPENSES 9,000 9,261 9,530 9,806
DE - CONTRACTUAL SERVICES 700 720 741 763
HF - INTER-DEPARTMENTAL CHARGES 1,165,219 1,165,219 1,165,219 1,165,219
EXP Total 1,343,820 1,350,504 1,350,922 1,351,350
REV BJ - INTERDEPT REVENUES 1,538,194 1,538,194 1,538,194 1,538,194
SA - STATE AID - REIMBURSEMENT OF EXPENSES 32,900 32,900 32,900 32,900
REV Total 1,571,094 1,571,094 1,571,094 1,571,094
VS - VETERANS SERVICES AGENCY

FISCAL 2012–2015 MULTI-YEAR FINANCIAL
52

APPENDICES


FISCAL 2012–2015 MULTI-YEAR FINANCIAL
Nassau County Office of Management and Budget
53
APPENDIX A
MULTI-YEAR PLAN UPDATE BASELINE INFLATORS
The Administration’s financial plans have been based on conservative assumptions for all fiscal years.
Table A.1 below identifies the primary assumptions in the Fiscal 2012-2015 Multi-Year Financial Plan
Update baseline.
Table A.1: MYP Update Baseline Inflators
Expense / Revenue Baseline
Category Inflator Explanation
Wages Variable Reflect terms of existing contracts
Non-Police Pension Contribution State Rates Reflects State Comptroller's effective rate, and preliminary 2012 estimates
Police Pension Contribution State Rates Reflects State Comptroller's effective rate, and preliminary 2012 estimates
Health Insurance - Actives 5.87%,5.87%,5.87%
Reflects NYSHIP'S estimated increase for 2012 adjusted for Headcount
assumptions
Health Insurance - Retirees 8.27%,8.27%,8.27%
Reflects NYSHIP'S estimated increase for 2012 adjusted for Headcount
assumptions
Other-Than-Personal-Services 2.9%,2.9%,2.9%
Utilities
Light and Power 1.00%,2.00%,2.00% For 2013 - 2015 respectively, U.S. Dept of Energy Estimates
Brokered Gas 4.94%,-2.78%,4.92% For 2013 - 2015 respectively, U.S. Dept of Energy Estimates
Trigen 2.00%,2.00%,2.00% For 2013 - 2015 respectively, U.S. Dept of Energy Estimates
Fuel -17.4%, -14.4%, -11.20% Reflects current market rates
Water 1.00%,1.00%,1.00% Reflects current market rates
Telephone 1.00%,1.00%,1.00% For 2013 - 2015 respectively
Medicaid $3m,$3m,$3m Reflects most current caseload information
Social Services Entitlements Variable Reflects most current caseload information
Special Education Program Variable Reflects most current caseload information
State Aid Variable Variable based upon reimbursement formula
Federal Aid Variable Variable based upon reimbursement formula
Sales Tax 2.90%, 2.90%, 2.90%
Property Tax None No property tax increase in the baseline

FISCAL 2012–2015 MULTI-YEAR FINANCIAL
Nassau County Office of Management and Budget
54
APPENDIX B: BORROWING SCHEDULE
2012 Budget and the 2012-2015 Multi Year Plan
Debt Service Assumptions Schedule
MYP Assumptions
Proceed
Requirement Sale Date
First Interest
Payment Date
First Principal
Payment Date
Final Principal
Payment Date
Weighted
Average
Life
Interest
Rate
Mode Coupon
2011 Remaining
Capital Borrowings 2, 3
Capital-General 165,000,000 10/01/11 04/01/12 04/01/12 04/01/31 11.95 Fixed 6.00%
Capital-SSWRD 4
25,000,000 10/01/11 04/01/12 04/01/12 04/01/31 11.95 Fixed 6.00%
Environmental Bond Act 29,630,000 10/01/11 04/01/12 04/01/12 04/01/31 11.95 Fixed 6.00%
Judgments & Settlements 100,000,000 10/01/11 04/01/12 04/01/12 04/01/21 5.49 Fixed 6.00%
Total 319,630,000
Cash Flow Borrowings 1
RANs (New) N/A N/A N/A N/A N/A N/A N/A
TAN (New) 230,000,000 12/01/11 11/01/12 N/A 11/01/12 0.92 Fixed 3.00%
230,000,000
2012
Capital Borrowings 2, 3
Capital-General 120,000,000 04/01/12 10/01/12 04/01/13 04/01/32 12.53 Fixed 6.25%
Capital-SSWRD 4
55,000,000 04/01/12 10/01/12 04/01/13 04/01/32 12.53 Fixed 6.25%
Environmental Bond Act - 04/01/12 10/01/12 04/01/13 04/01/32 12.53 Fixed 6.25%
Judgments & Settlements 20,000,000 04/01/12 10/01/12 04/01/13 04/01/22 6.01 Fixed 6.25%
Total 195,000,000
Cash Flow Borrowings 1
RANs (New) 325,000,000 06/01/12 11/01/12 N/A 02/01/13 0.67 Fixed 3.00%
TAN (New) 225,000,000 12/01/12 11/01/13 N/A 11/01/13 0.92 Fixed 3.00%
550,000,000
2013
Capital Borrowings 2, 3
Capital-General 120,000,000 04/01/13 10/01/13 04/01/14 04/01/33 12.60 Fixed 6.50%
Capital-SSWRD 4
45,000,000 04/01/13 10/01/13 04/01/14 04/01/33 12.60 Fixed 6.50%
Environmental Bond Act - 04/01/13 10/01/13 04/01/14 04/01/33 12.60 Fixed 6.50%
Judgments & Settlements 20,000,000 04/01/13 10/01/13 04/01/14 04/01/23 6.03 Fixed 6.50%
Total 185,000,000
Cash Flow Borrowings 1
RANs (New) - N/A N/A N/A N/A N/A N/A N/A
TAN (New) 300,000,000 12/01/13 11/01/14 N/A 11/01/14 0.92 Fixed 4.50%
300,000,000
2014
Capital Borrowings 2, 3
Capital-General 110,000,000 04/01/14 10/01/14 04/01/15 04/01/34 12.60 Fixed 6.50%
Capital-SSWRD 4
35,000,000 04/01/14 10/01/14 04/01/15 04/01/34 12.60 Fixed 6.50%
Environmental Bond Act - 04/01/14 10/01/14 04/01/15 04/01/34 12.60 Fixed 6.50%
Judgments & Settlements 20,000,000 04/01/14 10/01/14 04/01/15 04/01/24 6.03 Fixed 6.50%
Total 165,000,000
Cash Flow Borrowings 1
RANs (New) - N/A N/A N/A N/A N/A N/A N/A
TAN (New) 325,000,000 12/01/14 11/01/15 N/A 11/01/15 0.92 Fixed 4.50%
325,000,000
2015
Capital Borrowings 2, 3
Capital-General 115,500,000 04/01/15 10/01/15 04/01/16 04/01/35 12.60 Fixed 6.50%
Capital-SSWRD 4
36,750,000 04/01/15 10/01/15 04/01/16 04/01/35 12.60 Fixed 6.50%
Environmental Bond Act - 04/01/15 10/01/15 04/01/16 04/01/35 12.60 Fixed 6.50%
Judgments & Settlements - 04/01/15 10/01/15 04/01/16 04/01/25 6.03 Fixed 6.50%
Total 152,250,000
Cash Flow Borrowings 1
RANs (New) - N/A N/A N/A N/A N/A N/A N/A
TAN (New) 350,000,000 12/01/15 11/01/16 N/A 11/01/16 0.92 Fixed 4.50%
350,000,000
1 Estimated borrowing need2 Assumptions above were used to generate budget for debt service; size and timing of actual borrowing will vary.3 As warrented; the County may substitute Bond Anticipation Notes for Bonds to finance the Capital Improvement Plan4 Projects for the SSWRD may be funded through borrowing from either the County, NYS EFC, or the NC SSWFA.
Nassau County
September 15, 2011

FISCAL 2012–2015 MULTI-YEAR FINANCIAL
Nassau County Office of Management and Budget
55
APPENDIX C: DEBT SERVICE BASELINE
Nassau County
2012-2015 MYP
Baseline
Existing Debt Service Obligations
12/31/2012 12/31/2013 12/31/2014 12/31/2015
General Fund Obligations
General Imrpovement Debt
Principal 41,184,262 43,523,897 38,889,942 41,257,706
Interest 40,393,369 37,883,124 36,961,640 35,417,490
NIFA Set Asides
Principal 135,102,661 142,385,098 141,115,418 130,770,879
Interest 62,472,352 56,451,852 49,574,405 43,096,971
Fees 3,367,313 3,302,779 3,020,124 2,693,068
Total 282,519,956 283,546,752 269,561,529 253,236,114
Parks And Recreation
General Imrpovement Debt
Principal 3,523,045 3,107,000 2,855,098 2,760,249
Interest 1,521,785 1,389,114 1,276,621 1,170,720
NIFA Set Asides
Principal 3,309,507 3,201,758 3,096,587 2,674,811
Interest 1,477,516 1,321,742 1,174,724 1,034,244
Fees 93,991 92,190 84,300 75,171
Total 9,925,844 9,111,803 8,487,330 7,715,195
Environmental Bond Act
General Imrpovement Debt
Principal 3,463,664 3,723,586 3,942,231 4,171,760
Interest 4,982,912 4,861,110 4,737,952 4,604,193
NIFA Set Asides
Principal 713,205 835,777 914,972 852,728
Interest 327,355 295,589 257,174 215,254
Fees 5,973 5,858 5,357 4,777
Total 9,493,107 9,721,920 9,857,687 9,848,712
Police District
General Imrpovement Debt
Principal 837,328 880,298 1,004,662 1,044,311
Interest 834,475 793,100 750,131 710,528
NIFA Set Asides
Principal 35,889 39,020 47,949 43,971
Interest 24,223 22,659 20,938 18,789
Fees 1,136 1,114 1,019 909
Total 1,733,051 1,736,192 1,824,699 1,818,509
Police Headquarters
General Imrpovement Debt
Principal 4,338,383 4,161,922 4,456,873 4,703,771
Interest 4,041,050 3,865,917 3,688,016 3,512,624
NIFA Set Asides
Principal 1,527,795 1,459,693 1,489,071 1,369,250
Interest 740,631 668,776 603,447 537,456
Fees 60,628 59,466 54,377 48,489
Total 10,708,488 10,215,775 10,291,785 10,171,589

FISCAL 2012–2015 MULTI-YEAR FINANCIAL
Nassau County Office of Management and Budget
56
APPENDIX C: DEBT SERVICE BASELINE (continued)
12/31/2012 12/31/2013 12/31/2014 12/31/2015
Fire Prevention Fund
General Imrpovement Debt
Principal 51,910 62,684 64,260 66,911
Interest 64,989 62,252 59,170 56,499
NIFA Set Asides
Principal 158,368 134,203 123,921 105,079
Interest 59,594 51,958 45,717 40,027
Fees 3,852 3,778 3,455 3,081
Total 338,713 314,875 296,523 271,597
Community College
General Imrpovement Debt
Principal 1,425,240 1,505,821 1,217,855 1,320,124
Interest 1,981,137 1,922,694 1,858,501 1,813,665
NIFA Set Asides
Principal 2,159,133 2,111,824 1,728,348 1,341,600
Interest 658,739 553,306 450,661 367,500
Fees 24,718 24,244 22,169 19,769
Total 6,248,967 6,117,889 5,277,535 4,862,657
Water related project
General Imrpovement Debt
Principal 1,398,032 1,281,236 1,305,544 1,375,154
Interest 1,961,694 1,903,935 1,849,039 1,792,353
NIFA Set Asides
Principal 1,632,917 1,607,173 1,503,951 1,345,840
Interest 645,960 567,740 492,198 422,397
Fees 39,278 38,525 35,228 31,413
Total 5,677,881 5,398,609 5,185,961 4,967,158
Sewer related project
General Imrpovement Debt
Principal 1,889,338 1,568,742 1,584,159 1,681,571
Interest 1,628,079 1,556,513 1,492,203 1,424,720
NIFA Set Asides
Principal 2,068,858 1,955,072 2,069,782 1,927,507
Interest 1,177,428 1,081,797 996,544 907,156
Fees 94,926 93,107 85,139 75,919
Total 6,858,630 6,255,230 6,227,828 6,016,873
Total General Improvement
General Imrpovement Debt
Principal 58,111,202 59,815,186 55,320,625 58,381,557
Interest 57,409,490 54,237,759 52,673,274 50,502,791
Less: Existing Water Related
Less: Series 1993 Retirement Bonds
Defeasance - - - -
Total 115,520,692 114,052,945 107,993,899 108,884,348

FISCAL 2012–2015 MULTI-YEAR FINANCIAL
Nassau County Office of Management and Budget
57
APPENDIX C: DEBT SERVICE BASELINE (continued)
12/31/2012 12/31/2013 12/31/2014 12/31/2015
Total Existing NIFA
Principal 146,708,333 153,729,618 152,090,000 140,431,667
Interest 67,583,797 61,015,420 53,615,809 46,639,794
Fees 3,691,816 3,621,063 3,311,168 2,952,595
Total 217,983,946 218,366,101 209,016,978 190,024,056
Expense of Loans 4,235,200 3,921,600 3,123,200 2,304,000
Short Term Interest
BAN Interest (Capital) - - - -
BAN Interest (SSWRD) - - - -
BAN Interest (Environmental Bond Act) - - - -
RAN Interest 5,963,056 6,500,000 - -
TAN Interest 6,325,000 6,187,500 12,375,000 13,406,250
Total 12,288,056 12,687,500 12,375,000 13,406,250
Total General Obligation 350,027,894 349,028,145 332,509,077 314,618,654
TOTAL EXISTING OBLIGATIONS 350,027,894 349,028,145 332,509,077 314,618,654
Future Obligations
General Capital
Principal 7,690,000 13,705,000 19,750,000 25,140,000
Interest 18,776,888 28,085,269 35,922,075 41,384,963
SSWRD
Principal 985,000 2,345,000 3,775,000 4,995,000
Interest 2,940,394 5,215,481 7,154,831 8,762,119
Judgments
Principal 1,950,000 3,750,000 4,900,000 5,645,000
Interest 1,830,938 2,568,563 2,821,875 2,707,819
Environmental Bond Act
Principal 275,000 430,000 605,000 780,000
Interest 617,531 861,525 1,096,856 1,323,000
Workers Compensation Financing
Principal - - - -
Interest - - - -
Total Future Obligations
Principal 10,900,000 20,230,000 29,030,000 36,560,000
Interest 24,165,750 36,730,838 46,995,638 54,177,900
Total 35,065,750 56,960,838 76,025,638 90,737,900
TOTAL COUNTY DEBT SERVICE 385,093,644 405,988,983 408,534,714 405,356,554

FISCAL 2012–2015 MULTI-YEAR FINANCIAL
Nassau County Office of Management and Budget
58
APPENDIX D
Adopted
2011 2012 2012 2013 2014 2015
Projected Budget Projected Projected Projected Projected
OPERATING EXPENSES:
Salaries 131,280,322 127,638,123 127,638,123 133,073,769 139,328,236 146,294,648
Fringe Benefits 48,125,099 50,352,721 50,352,721 56,396,235 59,780,009 63,366,810
Equipment 1,500,000 1,500,000 1,500,000 1,500,000 1,545,000 1,591,350
General Expenses 8,575,000 8,575,000 8,575,000 8,575,000 8,832,250 9,097,218
Contractual 6,650,000 5,350,000 5,350,000 5,350,000 5,510,500 5,675,815
Utility Costs (Telephone & Other) 1,575,156 1,575,156 1,575,156 1,888,162 1,944,807 2,003,151
Utility Costs (LIPA) 4,200,000 4,700,000 4,700,000 5,138,000 5,394,900 5,664,645
Interfund Charges 3,200,000 3,200,000 3,200,000 3,328,000 3,494,400 3,669,120
Other 55,000 55,000 55,000 55,000 55,000 55,000
Total Operating Expenses 205,160,577 202,946,000 202,946,000 215,304,166 225,885,102 237,417,756
% growth 106.1% 104.9% 105.1%
OPERATING REVENUES:
Investment Income 200,000 200,000 200,000 200,000 200,000 200,000
Rents & Recoveries 950,000 400,000 400,000 400,000 400,000 400,000
Revenue Offset to Expenses 4,188,000 4,188,000 4,188,000 4,188,000 4,188,000 4,188,000
Service Fees 5,651,000 5,851,000 5,851,000 5,851,000 5,851,000 5,851,000
Student Revenues 78,143,682 83,393,727 83,393,727 83,393,727 83,393,727 83,393,727
Revenue in Lieu of Spons Share 14,400,000 14,000,000 14,000,000 14,000,000 14,000,000 14,000,000
Federal Aid 250,000 250,000 250,000 250,000 250,000 250,000
State Operating Aid- Base Rate + $100,000 HighNeeds 43,645,454 41,013,015 41,013,015 41,013,015 41,013,015 41,013,015
State Rental Aid (50% assumption)Endo 443,571 443,375 443,375 443,375 443,375 443,375
Property Taxes 52,206,883 52,206,883 52,206,883 52,206,883 52,206,883 52,206,883
Fund Balance 2,188,000 1,000,000 1,000,000 1,000,000 0 0
Total Operating Revenue 202,266,590 202,946,000 202,946,000 202,946,000 201,946,000 201,946,000
Operations Gain (Loss)-(Baseline Operating Results)* (2,893,987) 0 0 (12,358,166) (23,939,102) (35,471,756)
* The Baseline Operating Results for future years is before the recognition of the impact of
increased enrollment, State Aid, Sponsor Support, Tuition or other revenue enhancement
or cost savings measures.
Current Assumptions: (in Body) 2011 2012 2013 2014 2015
Enrollment Increase 2.378% 0.000% 0.000% 0.000% 0.000%
# FTE's (2010 ~ 19,392) 19,853.0 19,853.0 19,853.0 19,853.0 19,853.0
State Aid per FTE 2,260 2,122 2,122 2,122 2,122
Increase in FT Tuition 110 258 0 0 0
FT Tuition 3,732 3,990 3,990 3,990 3,990
Prop Tax Increase 0 0.00% 0.00% 0.00% 0.00%
NASSAU COMMUNITY COLLEGE
Fiscal 2012-2015 Multi-Year Financial Plan

FISCAL 2012–2015 MULTI-YEAR FINANCIAL
Nassau County Office of Management and Budget
59
APPENDIX D
______________________________________________________________________________
2013 2014 2015
Projected Projected Projected
BASELINE (GAP) (12,358,166) (23,939,102) (35,471,756)
GAP CLOSING MEASURES A significant savings has already been attained
from Cost Cutting for the 2011 and 2012 budgets
1. Initiatives- Planned ($7.1 Million and $5.8 Million respectively)
A. 2013 Instructional Efficiencies Including the Early Retirement Incentive ($4.5 - - -
B. Reduce PT Assignments Million) All of which were permanent cuts and are - - -
C. OTPS Contracts shown in the body of this plan for all years. - - -
D. Fee Adjustments - - -
E. Contingency Adjustment (Reserve for Items Not Materializing) - - -
Total Cost Reductions - - -
2. State
FTE in body
A. Increase in State Aid Rate in 2013 19,853.0 - - - -
B. Increase in State Aid Rate in 2014 19,853.0 100 - 1,985,300 1,985,300
C. Increase in State Aid Rate in 2015 19,853.0 100 - - 1,985,300
Total State Aid - 1,985,300 3,970,600
3. Sponsor Support
A. Increase in Sponsor Support 2013 0.00% - - -
B. Increase in Sponsor Support 2014 3.90% - 2,036,068 2,036,068
C. Increase in Sponsor Support 2015 3.90% - - 2,115,475
Total Fund Balance - 2,036,068 4,151,544
4. Tuition-
A. Increase in Tuition in 2013 250$ 5,225,171 5,225,171 5,225,171
B. Increase in Tuition in 2014 250$ - 5,225,171 5,225,171
C. Increase in Tuition in 2015 250$ - 5,225,171
Total Tuition Increases 5,225,171 10,450,342 15,675,513
5. Enrollment Increases- Student Revenue Increases
A. Enrollment impact-Student Revenue 2013 0.00% - - -
B. Enrollment impact-Student Revenue 2014 1.00% - 938,441 990,692
C. Enrollment impact-Student Revenue 2015 1.00% - - 1,000,599
Total Enrollment impact-Student Revenue - 938,441 1,991,292
6. Enrollment Increases- Instructional Cost Factor Enrollment Increases
A. Enrollment impact-Instructional Cost Factor 2013 0.00% - - -
B. Enrollment impact-Instructional Cost Factor 2014 1.00% - (469,220) (495,346)
C. Enrollment impact-Instructional Cost Factor 2015 1.00% - - (500,300)
Total Enrollment impact-Instructional Cost Factor - (469,220) (995,646)
7. Enrollment Increases- State Aid- 2012Base= 19,853.0
A. 2013 Enrollment Increase-State Aid 0.00% 0.00 - - -
B. 2014 Enrollment Increase-State Aid 1.00% 198.53 - - 460,987
C. 2015 Enrollment Increase-State Aid 1.00% 200.52 - -
Total Enrollment impact-State Aid - - 460,987
8. Fund Balance
A. Use of Fund Balance in 2013 - - -
B. Use of Fund Balance in 2014 - - -
C. Use of Fund Balance in 2015 - - -
Total Fund Balance - - -
9. Other Revenue Enhancements/ Savings Measures & Use of Fund Balance- To Be Determined
A. 2013 Items 7,132,996 7,132,996 7,132,996
B. 2014 Items - 1,865,176 1,865,176
C. 2015 Items - - 1,219,296
Total Other 7,132,996 8,998,172 10,217,468
Total GAP Closers 12,358,166 23,939,102 35,471,756
Preliminary Balance Baseline GAP surplus/(deficit) 0 0 0
NASSAU COMMUNITY COLLEGE
Fiscal 2012-2015 Multi-Year Financial Plan

FISCAL 2012–2015 MULTI-YEAR FINANCIAL
Nassau County Office of Management and Budget
60
APPENDIX E
NASSAU HEALTH CARE CORPORATION (FISCAL 2011-2014)
(Provided by the Nassau Health Care Corporation)
Nassau Health Care Corporation and Subsidiaries As of 9/27/10
2011 Approved Budget
Consolidated
(In Thousands)
Approved
2011 2012 2013 2014
Budget Projected Projected Projected
Operating Revenues:
Net patient service revenue 393,079 397,739 402,448 407,207
NYS Intergovernmental transfer 102,528 96,109 96,109 96,109
Nassau County Billings 0 0 0 0
Historical Mission/Article VI Payments 5,000 5,000 5,000 5,000
Federal & State Aid 3,372 3,416 3,461 3,506
Miscellaneous 18,232 18,364 18,498 18,634
Total operating revenue 522,211 520,628 525,516 530,456
Operating Expenses:
Salaries 254,965 257,866 260,804 263,779
Fringe Benefits 99,377 104,863 96,101 99,392
Supplies 28,035 28,854 29,697 30,565
Expenses 91,511 93,893 96,345 98,870
Utilities 25,100 25,627 26,164 26,713
Depreciation 18,636 20,636 22,636 24,636
Interest Expense 11,964 11,843 11,721 11,481
Bad Debt Expense 40,746 41,337 41,936 42,543
Total operating expenses 570,334 584,919 585,404 597,979
Gain (Loss) From Operations (48,123) (64,291) (59,888) (67,523)
NonOperating Revenues:
Investment Income 1,236 1,236 1,236 1,236
BASELINE SURPLUS (GAP) AS OF January 1, 2011 (46,887) (63,055) (58,652) (66,287)
** NHCC, Ltd not eliminated, NHCF Eliminated
Major Assumptions
6) Baseline Gap and Assumptions exclude expenses for Post Employment Benefits (OPEB).
The annual required contribution for OPEB will be a non-cash item.
4) Nassau County Mission Payment and Article VI funding is assumed to remain at $18 million for 2011-2014 of
……which $13 Million will be contribute to the IGT distribution.
1) Pension expense is projected at 14.3% for 2011, 15.3% for 2012 and 10% for 2013 and 2014.
2) Annual growth in health insurance premiums is 12% for 2011 and approximately 8.5% ($3,060 per year) 2012-2014
5) Nassau County Billings exclude approximately $10 Million of pass-through items such as
Termination pay and Health Insurance for retirees incurred on behalf of Nassau County.
3) Salary cost include 1.25% step increase each year and a cost of living (COLA) of 0% in 2011 through 2014.
Note: The NHCC 2012 -2015 MYP is pending formalization.

FISCAL 2012–2015 MULTI-YEAR FINANCIAL
Nassau County Office of Management and Budget
61
APPENDIX E
NASSAU HEALTH CARE CORPORATION (FISCAL 2011-2014)
(Provided by the Nassau Health Care Corporation)
Nassau Health Care Corporation and Subsidiaries As of 9/27/10
2011 Approved Budget
Consolidated Approved
(In Thousands) 2011 2012 2013 2014
Projected Projected Projected Projected
BASELINE SURPLUS (GAP) AS OF January 1, 2011 (46,887) (63,055) (58,652) (66,287)
Revenue Programs to Eliminate Gap ("PEG")
NUMC Dialysis Expansion - I/P 01/01/11 2,000$ 2,020$ 2,040$ 2,060$
NUMC Clinical Integration NSLIJ 01/01/12 -$ 6,000$ 10,000$ 15,000$
NUMC NYSDOH Psychiatric Rate Increase Part 2 01/01/11 2,000$ 2,020$ 2,040$ 2,060$
NUMC Charge Capture - CDM 11/01/10 3,000$ 3,030$ 3,060$ 3,091$
NUMC Revenue Cycle - Denial Management 11/01/10 3,000$ 3,030$ 3,060$ 3,091$
NUMC ARRA HIT Incentive payments 10/01/11 7,057$ 5,209$ 3,361$ 1,513$
NUMC Program Restructuring - Hospitalists 01/01/11 7,800$ 15,000$ 18,000$ 20,000$
NUMC Program Restructuring - Neurosurgery 01/01/11 4,800$ 4,848$ 4,896$ 4,945$
NUMC Program Restructuring - Plastics 01/01/11 1,000$ 1,010$ 1,020$ 1,030$
NUMC Program Restructuring - Cardiology 01/01/11 2,200$ 2,222$ 2,244$ 2,266$
NUMC Program Restructuring - Anesthesia 01/01/11 1,200$ 1,212$ 1,224$ 1,236$
NUMC IGT Impact on Revenue Initiatives -$ -$ (8,514)$ (11,400)$
AHP Property Closing 12/01/11 1,000$ -$ -$ -$
AHP Rate Appeal Approval 07/01/11 -$ 4,000$ 4,040$ 4,080$
Sub-Total Revenue Initiatives 35,057$ 49,601$ 46,471$ 48,972$
Expense PEGNUMC IGT Impact for Expense Initiatives -$ -$ -$ (625)$
NUMC Health Insurance Restructuring 01/01/11 3,000$ 6,000$ 6,000$ 6,000$
NUMC 340B Inpatient 01/01/12 -$ 5,000$ 5,000$ 5,000$
Sub-Total Expense Initiatives 3,000$ 11,000$ 11,000$ 10,375$
Total Initiatives - Pending 38,057$ 60,601$ 57,471$ 59,347$
TOTAL SURPLUS/ (DEFICIT) AFTER GAP
CLOSING MEASURES (8,830)$ (2,454)$ (1,181)$ (6,940)$

FISCAL 2012–2015 MULTI-YEAR FINANCIAL
Nassau County Office of Management and Budget
62
APPENDIX E
NASSAU HEALTH CARE CORPORATION (FISCAL 2012-2015)
(Provided by the Nassau Health Care Corporation)
Nassau Health Care Corporation and Subsidiaries As of 3/2/12
2012 Approved Budget
Consolidated
(In Thousands)
Approved
2012
Budget
Operating Revenues:
Net patient service revenue 416,847
NYS Intergovernmental transfer 43,031
Nassau County Billings 22,944
Historical Mission/Article VI Payments 18,000
Federal & State Aid 3,361
Miscellaneous 19,008
Total operating revenue 523,191
Operating Expenses:
Salaries 222,837
Fringe Benefits 101,305
Supplies 34,898
Expenses 80,516
Utilities 22,593
Depreciation 19,116
Interest Expense 11,004
Bad Debt Expense 40,562
Total operating expenses 532,831
Gain (Loss) From Operations (9,640)
NonOperating Revenues:
Investment Income 1,152
BASELINE SURPLUS (GAP) AS OF January 1, 2012 (8,488)
** NHCC, Ltd not eliminated, NHCF Eliminated
Major Assumptions
6) Baseline Gap and Assumptions exclude expenses for Post Employment Benefits (OPEB).
The annual required contribution for OPEB will be a non-cash item.
4) Nassau County Mission Payment and Article VI funding is assumed to remain at $18 million for 2012.
1) Pension expense is projected at 17.6% for 2012.
2) Annual growth in health insurance premiums is 3% for 2012.
5) Nassau County Billings excludes approximately $ 2 Million of pass-through items such as
Termination pay incurred on behalf of Nassau County.
3) Salary cost includes 1.25% step increase.

FISCAL 2012–2015 MULTI-YEAR FINANCIAL
Nassau County Office of Management and Budget
63
APPENDIX F
SEWER AND STORM WATER RESOURCE DISTRICT FINANCIAL PLAN
E/R OBJ 2012 ADOPTED 2013 ADOPTED 2014 ADOPTED 2015 ADOPTED
EXP DE - CONTRACTUAL SERVICES 950,000 950,000 950,000 950,000
FF - INTEREST 7,678,894 7,309,831 6,956,531 6,606,881
GG - PRINCIPAL 7,800,000 7,955,000 8,425,000 8,425,000
LZ - TRANS OUT TO SSW FOR DEBT SERVICE 100,872,046 101,116,109 101,029,409 101,409,059
EXP Total 117,300,940 117,330,940 117,360,940 117,390,940
REV BE - INVEST INCOME 30,000 60,000 90,000 120,000
TL - PROPERTY TAX 117,270,940 117,270,940 117,270,940 117,270,940
REV Total 117,300,940 117,330,940 117,360,940 117,390,940
Surplus / (Deficit) - - - -
E/R OBJ 2012 ADOPTED 2013 ADOPTED 2014 ADOPTED 2015 ADOPTED
EXP AA - SALARIES, WAGES & FEES 19,332,216 19,730,599 20,171,129 20,207,808
AB - FRINGE BENEFITS 11,614,028 12,963,716 12,825,874 13,919,372
BB - EQUIPMENT 323,900 333,293 342,959 352,904
DD - GENERAL EXPENSES 14,540,674 14,811,423 15,134,710 15,499,493
DE - CONTRACTUAL SERVICES 24,020,600 24,717,197 25,433,996 26,171,582
DF - UTILITY COSTS 10,749,300 10,898,903 11,068,848 11,252,801
FF - INTEREST 9,143,079 8,318,051 7,573,137 6,896,107
GG - PRINCIPAL 16,677,500 14,434,000 13,803,000 12,939,000
HH - INTERFD CHGS - INTERFUND CHARGES 36,720,711 40,398,659 43,851,357 46,609,662
OO - OTHER EXPENSE 21,095,600 21,109,063 21,122,862 21,137,006
EXP Total 164,217,608 167,714,904 171,327,871 174,985,735
REV AA - FUND BALANCE 18,327,668 21,558,151 25,124,272 28,268,115
BC - PERMITS & LICENSES 734,800 734,800 734,800 734,800
BE - INVEST INCOME 1,141,500 1,141,500 1,251,500 1,361,500
BF - RENTS & RECOVERIES 71,000 71,000 71,000 71,000
BG - REVENUE OFFSET TO EXPENSE 164,900 164,900 164,900 164,900
BH - DEPT REVENUES 40,004,300 40,004,300 40,004,300 40,004,300
BI - CAP BACKCHARGES 650,000 672,750 696,296 720,667
BR - DUE FR GOVTS - DUE FROM OTHER GOVTS 2,251,394 2,251,394 2,251,394 2,251,394
IF - INTERFD TSFS - INTERFUND TRANSFERS 100,872,046 101,116,109 101,029,409 101,409,059
REV Total 164,217,608 167,714,904 171,327,871 174,985,735
Surplus / (Deficit) - - - -
SEWER AND STORM WATER FINANCE AUTHORITY
SEWER AND STOMR WATER RESOURCE DISTRICT