Adopted Budget Book - Hartford Public Schools
253
May 3, 2010 Hartford Public Schools’ Education Budget FY 2010-11 Submitted by the Hartford Board of Education
Transcript of Adopted Budget Book - Hartford Public Schools

May 3, 2010
Hartford Public Schools’Adopted Education Budget
FY 2010-11
Submitted by the Hartford Board of Education

Cover Page Photo Collage: Students at four outstanding Hartford Public Schools. Clockwise from left to right – Capital Preparatory Academy, the Sport and Medical Sciences Academy, High School, Inc. and the University High School of Science and Engineering.
Table of Contents
PAGES
I. Executive Summary 1-17
II. Elementary School Budgets 18-131
III. Secondary School Budgets 132-195
IV. Alternative School Budgets 196-219
V. Central Services Budgets 220-247

2010-11 Adopted Education Budget Executive Summary
The following Executive Summary presents highlights of the budget on critical issues facing our school district. Although detailed information follows in other sections of the budget, the Executive Summary will provide the reader key points regarding the budget. BUDGET PROCESS The Hartford Public Schools develops an Operating Budget on an annual basis. The budget fiscal year begins on July 1 and ends on June 30th. The Hartford Public Schools’ budget process involves three phases:
Step I: The district prepares an estimate of the amount of funding needed during the next fiscal year for the support of the Hartford Public Schools. The Superintendent Recommended Budget is presented to the Hartford Board of Education for review.
Step II: The Board of Education will hold several work sessions and a public dialogue session on the Recommended Budget to receive input from citizens on the budget. The Board will make revisions and will adopt a Budget in May and submit it to the City of Hartford, Court of the Common Council.
Step III: The City of Hartford, Court of the Common Council must approve a local appropriation to the Hartford Public Schools’ by May 31st. If the approved appropriation is less than the Hartford Public Schools’ Adopted request, the School Board must reduce the budget accordingly. The following is a summary of the 2010-11 Budget Calendar: Target Date Activity/Process October 2009 Goals and Priorities developed
November 2009 School and District Improvement Plans developed
January 29, 2010 Initiation of budget process/planning and distribution of budget development tools
February 1 – February 12, 2010 Budget workshops
February 26, 2010 Completed budgets due from Schools and Support Service Centers
March 1-12, 2010 Budget Compliance Reviews
March 15-26, 2010 Final Budget Revisions due from Schools and Service Centers
April 6, 2010 Superintendent Recommended Budget presented to Board of Education
April 12-29, 2010 Board of Education/Finance Committee Budget Workshops
April 20, 2010 Public Hearing on Recommended Budget
May 3, 2010 Board of Education Adopts 2010-11 Budget
1

CHOOSE. ACHIEVE. SUCCEED www.hartfordschools.org
2010-11 STRATEGIC OPERATING PLAN GOALS SUPPORTED BY THE 2010-11 ADOPTED BUDGET Goal 1: High Academic Achievement
1. On the Grades 3-8 CMT in Reading, Mathematics, Writing and Science the average grade level gain in the percentage of students scoring at or above proficiency will be at least
a. 12 percentage points for all students b. 21 percentage points for students identified as special education c. 18 percentage points for students identified as English Language Learners
2. On the Grade 10 CAPT in Reading, Mathematics, Writing and Science, the gain in the
percentage of students scoring at or above proficiency will be at least
a. 12 percentage points for all students b. 21 percentage points for students identified as special education c. 18 percentage points for students identified as English Language Learners
3. The percentage of students graduating within 4-5 years will increase by at least 12
percentage points.
4. The percentage of students attending two-and four-year institutions will increase by 5%.
5. On the Grades K-3 DRA2 in Reading, the average grade level gain in the percentage of students at or above proficiency, between September and May annually, will be at least a. 4 percentage points for all students b. 7 percentage points for students identified as special education c. 6 percentage points for students identified as English Language Learners
6. On the District Benchmark Assessment in Reading, the average grade level gain in the
percentage of students at or above proficiency, between September and May annually, will be at least
a. 4 percentage points for general education students b. 7 percentage points for students identified as special education c. 6 percentage points for students identified as English Language Learners
7. On the District Benchmark Assessment in Writing, the average grade level gain in the
percentage of students at or above proficiency, between September and May annually, will be at least
a. 4 percentage points for general education students b. 7 percentage points for students identified as special education
2

CHOOSE. ACHIEVE. SUCCEED www.hartfordschools.org
c. 6 percentage points for students identified as English Language Learners
8. On the District Benchmark Assessment in Mathematics, the average grade level gain in the percentage of students at or above proficiency, between September and May annually, will be at least
a. 4 percentage points for general education students b. 7 percentage points for students identified as special education c. 6 percentage points for students identified as English Language Learners
9. On the District Benchmark Assessment in Science, the average grade level gain in the
percentage of students at or above proficiency, between September and May annually, will be at least
a. 4 percentage points for general education students b. 7 percentage points for students identified as special education c. 6 percentage points for students identified as English Language Learners
10. On the Developmental Indicators for the Assessment of Learning (DIAL) for pre-
Kindergarten students, the average gain in the percentage of students at or above proficiency will be at least 4 percentage points annually from September to May.
11. Align community resources in the arts and sciences with curriculum and course
development. 12. At least 90% of all Individual Education Plans will be rated at or above the effective range
on the IEP rubric. Goal 2: School Accountability and Empowerment
1. All schools below an OSI of 70 will demonstrate an increase of 12 points over three years.
2. The percent of students meeting district performance targets will increase by 4% annually, in order to close the achievement gap.
3. Eighty percent of Hartford Public Schools will be in the autonomous range of the School Accountability Matrix by the end of 2012.
Goal 3: Effective School Leaders
1. All school leaders will attain an overall score at or above the effective range on the School Leader Rubric (SLR) by their 3rd year of employment as a principal.
2. The quality and effectiveness of professional development and support will result in the
advancement of school leaders towards the effective range on the SLR.
3

CHOOSE. ACHIEVE. SUCCEED www.hartfordschools.org
3. The district will internally and externally recruit, develop, and retain effective school leaders that reflect the diversity of the community to a greater degree with a goal of having an effective principal in every school.
Goal 4: Effective Teachers
1. All teachers will attain an overall score at or above the effective range on the Effective Teacher Rubric (ETR) by their 3rd year of employment as a teacher.
2. The quality and effectiveness of professional development and support will result in the
advancement of teachers towards the effective range on the ETR. 3. The district will internally and externally recruit, develop, and retain effective teachers that
reflect the diversity of the community to a greater degree with a goal of having an effective teacher in every classroom.
Goal 5: Equitable Allocation of Resources
1. The district and schools shall operate in a fiscally responsible manner and align their resources to this Plan.
2. At least seventy percent of the general funds operating budget will be equitably distributed
to schools pursuant to choice and respective student needs. 3. Close the equity gap at all schools through the SBB process. 4. Grant funds will be appropriately aligned to support the achievement of district performance
targets and Plan goals. 5. In collaboration with the City of Hartford, a long-range Facilities Management Plan (FMP)
will be developed that supports an All-Choice System of Schools. Goal 6: Strong Parent / Community Communication and Collaboration
1. Increase the level of parental and community involvement in each child’s education. 2. Improve the level of satisfaction of parents, families and students with their schools. 3. High performing community partnerships will exist at all schools. 4. All autonomous schools will establish School Governance Councils (SGCs). 5. Increase the level of parent satisfaction with the effectiveness of the district PPT process.
Goal 7: Positive School Climate 1. All schools will provide a positive climate and safe environment
4

CHOOSE. ACHIEVE. SUCCEED www.hartfordschools.org
2. All schools will implement programs to develop student character and life skills preparing
our students to be competitive in the global economy 3. Increase instructional time by improving classroom management
Goal 8: All Choice System of Schools
1. The district will create an all-choice system of schools where families and students can engage in informed choice options for an inter-district or intra-district school.
2. The district will annually increase the percentage of students choosing an intra-district
school in order to attain the demand principle of the 2008 Sheff stipulation. 3. The district will annually increase the percentage of students receiving one of their first
three school choices at transitional entry grade levels in the inter or intra-district application process.
4. There will be a representative population of students receiving special education and English
Language Learner services at all inter- and intra-district schools Goal 9: District Reform Sustainability
1. Develop a succession plan for the Superintendent and key senior management positions. 2. Develop and adopt required Reform Governance in Action (RGA) reform policies. 3. Establish a Board of Education and senior cabinet induction and sustainability plan that
enable HPS to continue reform governance work. 4. Develop a three-year financial plan aligned to the Plan and update annually. 5. Work in collaboration with the local education fund (Achieve Hartford) to sustain district
reform. 6. Focus and align community partnerships and donor grants that support and enhance the
greatest points of leverage for closing the achievement gap. 7. Achieve annual progress on the measures of the Plan.
5

CHOOSE. ACHIEVE. SUCCEED www.hartfordschools.org
BUDGET FORMAT The 2010-11 Budget document is divided into four major sections: Executive Summary, School Budgets, Alternative Learning, and Central Services. The Executive Summary will provide the reader with key points regarding the overall budget. The School Budgets were developed using our Student-Based Budget (SBB) methodology known as Weighted Student Funding (WSF). SBB was implemented in FY 2008-09 and is based on simple principals: ENROLLMENT The Hartford Public Schools utilizes enrollment projections developed by Schools to prepare its budget. Student enrollment projections are a major consideration when developing the budget both at the district and school level. Student enrollment drives the level of state and federal funding the Hartford Public School district receives. In addition, enrollment drives the revenue each school receives under SBB. Not only is enrollment significant to funding levels, but it is a determining factor in the number of instructional and support staff needed to provide educational and support services to students. The following chart shows the actual and projected enrollment in the Hartford Public Schools over the last five years.
23,000
23,500
24,000
24,500
25,000
25,500
26,000
26,500
27,000
Historical Enrollment Trends
Enro llment 24,449 24,558 24,558 24,758 26,555
06/ 07 07/ 08 08/ 09 09/ 10 10/ 11
1. Those closest to students get to make decision about
Educational Programs
Choice of partners and supports
Budgets, including fewer restrictions and less central office control
2. Empowered schools are accountable for results
Fair and comprehensive evaluation of schools
Timely and accurate data for principals and teachers
3. Students can count on equitable and transparent funding
Different students have different educational needs; funding should reflect those needs
School budget transparency
The 2010-11 projected student enrollment is 26,555 students. This represents an increase of 1,797, or 7.3% students over the FY 2009-10 actual enrollment. The increase is derived as follows:
40% Inter-District/Choice students 34% Suburban Magnet students 9% Special Education Programs 7% Special Education Out-of-District 5% Affiliated Charter Schools 5% Enrollment Caps
A detailed listing of enrollment by school can be found on page 17 of this Executive Summary.
6

CHOOSE. ACHIEVE. SUCCEED www.hartfordschools.org
FISCALLY DEPENDENT SCHOOL DISTRICT The Hartford Public Schools is a fiscally dependent school district pursuant to state law. The Hartford Public Schools has no power to tax property or derive income through taxation of any type. In addition, under state law, the Hartford Public Schools is not authorized to borrow money or incur debt. It receives its funding through state and federal grants and an annual appropriation from the City of Hartford. The Hartford Public Schools does not prepare or administer a budget for the school Debt Service Fund, or the Capital Projects Funds. These funds are prepared and administered by the City of Hartford. SUMMARY OF FUNDS The following budgets are included in the Adopted Operating Budget: General Funds and Special Funds. The General Fund budget is intended to finance instructional programs, day-to-day operations to support those programs, and general operations of our school district. The Special Funds includes revenue we have received for specific projects, fee-based programs, donations, tuitions, etc. Included under these accounts are funds received from the Federal and State government for entitlement programs, such as those targeted at low-income students. The funding under Special Funds are restricted and may only be used for programs and services dictated by the source of the funding. The schedule below presents a summary comparison of the funds included in this budget. The FY 2010-11 Adopted General Fund budget reflects an increase of $1,250,000 over the FY 2009-10 Adopted Budget. The FY 2010-11 Adopted Special Funds Budget reflects a decrease of $15,473,174 over the FY 2009-10 Adopted Special Funds Budget.
Adopted Adopted ChangeFUND 2009-10 2010-11
General Operating Budget 284,554,001$ 285,804,001$ 1,250,000$ Special Funds 111,088,295$ 95,615,121$ (15,473,174)$
TOTAL 395,642,296$ 381,419,122$ (14,223,174)$
Student Enrollment 24,758 26,555 1,797 Per Pupil Expenditures 15,980$ 14,363$ (1,617)$
General Operating
Budget75%
Special Funds 25%
7

CHOOSE. ACHIEVE. SUCCEED www.hartfordschools.org
GENERAL OPERATING BUDGET The 2010-11 Adopted General Funds Budget of $285.8 million represents an increase of $1,250,000, or .44% compared to the 2009-10 Adopted General Budget of $284.6 million. The following represent the changes by major category.
Certified and Non-Certified Salaries decrease by $2,156,262. Salary accounts are forecasted to increase by approximately 4%, or $6,011,800 as a result of contractual salary increases. This increase is offset by a reduction of 152.1 certified and non-certified positions at an average salary of $53,702, or $8,168,062.
Utilities decrease by $ 294,215. The decrease is derived from historical consumption analysis and rate trending. We are forecasting a 5% rate increase offset by assumed energy use reductions resulting from energy savings initiatives such as retro-commissioning projects and energy efficiency efforts.
Supplies and materials decrease by $1,073,631.
Student transportation increases by $ 684,339. The increase is attributable to the projected addition of 8 buses for In-City Magnet students, and 7 additional buses for Group I In-City to In-City Special Education students.
Student tuition increases by $4,209,266. The increase is attributable to a projected increase of 718 students attending inter-district magnet programs at an average tuition cost of $4,132 per student, or $2,966,776, plus a projected increase of $1,242,490 for Special Education students attending out-of-district programs.
Rental of Facilities decrease by $ 331,173. The decrease is attributable to a reduction in reimbursement of operating expenses to lessors.
Fringe Benefits are projected to decrease by $1,837,478. The decrease is derived as follows: deferral of 100% of MERF contribution for FY10-11; a net increase 1 of 1.3% increase in employee health insurance, 13.7% increase in workers compensation, 2% increase in social security costs, 17.5% increase in unemployment compensation costs, and 10.3% increase in property and liability insurance.
All other accounts increase by $2,049,154. The increase is derived from mandated compensatory education required for Special Education students of $2,650,274, offset by a net decrease of $601,120 in areas such as travel expenses, communications and postage, advertising, printing costs, and other operating expenses.
1 Health insurance rates have increased approximately 10% over FY 09-10. The budget assumes a similar increase in employee co-premium share to offset increasing rates. The forecasted budget increase is net of revenue increases.
8

CHOOSE. ACHIEVE. SUCCEED www.hartfordschools.org
SPECIAL FUNDS BUDGET The 2010-11 Adopted Special Funds Budget of $95.6 million represents a decrease of $15.5 million, or 13.9% compared to the 2009-10 Amended Special Funds Budget of $111.09 million. The decrease is a result of the expiration of AARA funding, in addition to an anticipated reduction in state categorical funding. A detailed listing of the changes in grant funding can be found on page 13 of this Executive Summary. The following represent the changes by major category.
Certified and Non-Certified Salaries increase by $2,924,046. The increase is attributable to the addition of 60 positions, at an average salary of $48,734.
Professional Contracts and Services decrease by $6,215,474. The decrease is attributable to the expiration of one-year, one-time Title I AARA, and IDEA AARA funding and associated expenditures.
Instructional supplies, materials, text and library books decrease by $7,741,393. The decrease is attributable to the expiration of Title I AARA, and IDEA AARA funding.
Student transportation decreases by $1,588,146, primarily resulting from the assignment of the suburban magnet transportation grant, its associated costs, and State reimbursement to CREC.
Student tuition increases by $ 844,536. The increase is attributable to a projected increase in Special Education students attending out-of-district programs.
Computers and equipment decrease by $3,930,905. The decrease is attributable to the expiration of one-year, one-time Title I AARA, and IDEA AARA funding and associated expenditures.
Fringe Benefits are projected to increase by $1,210,885 as a result of the addition of 60 certified and non-certified positions.
All other accounts decrease by 976,723, resulting from reductions in areas such as Indirect, other operating expenses, travel expenses, printing costs, communications, and miscellaneous services.
9

CHOOSE. ACHIEVE. SUCCEED www.hartfordschools.org
STAFFING
The 2010-11 Adopted Budget includes a total of 2,993.4 full-time positions (FTE’s). This reflects a decrease 92.1 positions over the 2009-10 Adopted Budget of 3,086.0 full-time positions. A summary of the position changes can be found on page 16 of this Executive Summary.
School- Based FTE's
2,817.9 FTE's
94%
Central Services
139.5FTE's4.8%
Buildings & Grounds36 FTE's
1.2%
The chart depicted to the left illustrates the division of staffing by location. School-based staffing accounts for 2,817.9 full-time equivalents (FTE’s), or 94%, of the total 2010-11 Adopted budgeted FTE’s. The remaining FTE’s consist of central services of 139.5 FTE’s, or 4.8%, and buildings and grounds staffing of 36 FTE’s, or 1.2%.
10

CHOOSE. ACHIEVE. SUCCEED www.hartfordschools.org
REVENUE
The 2010-11 Adopted All Funds Budget of $381.4m is anticipated to be financed by $192,078,360, or 50%, in pass-through grants from the State of Connecticut, $93,725,641, or 25%, in City of Hartford support for Education through local tax contributions, and $95,615,121 or 25%, in Grant Funds.
CHANGE CHANGE
ADOPTED ANTICIPATED ADOPTED vs. FORECASTED FY 11 FORECAST vs.
REVENUE REVENUE ANTICIPATED REVENUE FY 10 ANTICIPATED
FY 2009-10 % FY 2009-10 % FY 2009-10 FY 2010-11 %
BOE OPERATING BUDGET 395,642,296 100% 395,642,296 100% - 381,419,122 100% (14,223,174)
STATE OF CONNECTICUT(PASS-THRU GRANTS)EDUCATION COST SHARING (ECS) 187,974,890 187,202,055 (772,835) 187,974,890 772,835 TRANSPORTATION 3,240,089 4,606,138 1,366,049 4,028,367 (577,771) HEALTH & WELFARE 55,721 75,103 19,382 75,103 -
TOTAL STATE OF CT PASS-THRU GRANTS 191,270,700 48% 191,883,296 48% 612,596 192,078,360 50% 195,064
LOCAL TAX CONTRIBUTIONS 93,283,301 24% 92,670,705 23% (612,596) 93,725,641 25% 1,054,936
GRANT FUNDS - SPECIAL FUNDS 111,088,295 28% 111,088,295 28% - 95,615,121 25% (15,473,174)
TOTAL REVENUES 395,642,296 100% 395,642,296 100% - 381,419,122 100% (14,223,174)
-
STATE and LOCAL REVENUE FY 2010-2011
Version: May 3, 2010
11

HARTFORD PUBLIC SCHOOLSALL FUNDS SUMMARY BY COST CENTER
Schools Actual Enroll GB SF Total
Per Pupil FTEs
Proj Enroll GB SF Total
Per Pupil FTEs Enroll GB SF Total
Per Pupil FTEs
Achievement First 441 720,167 - 720,167 1,633 4.0 625 1,611,515 - 1,611,515 2,578 7.0 184 891,348 - 891,348 945 3.0 Batchelder 565 5,220,311 297,758 5,518,069 9,766 66.1 561 5,096,891 498,684 5,595,575 9,974 62.0 (4) (123,420) 200,926 77,506 208 (4.1) Betances 360 3,849,935 280,925 4,130,860 11,475 50.5 368 3,510,797 326,405 3,837,202 10,427 45.4 8 (339,138) 45,480 (293,658) (1,047) (5.1) Breakthrough 349 1,935,471 2,109,691 4,045,162 11,591 47.4 350 1,721,462 2,265,371 3,986,833 11,391 46.4 1 (214,009) 155,680 (58,329) (200) (1.0) Breakthrough II 130 1,398,616 48,044 1,446,660 11,128 15.7 154 1,444,779 168,237 1,613,016 10,474 17.9 24 46,163 120,193 166,356 (654) 2.2 Latino Studies @ Burns 602 5,660,231 363,965 6,024,196 10,007 69.5 634 6,201,963 344,622 6,546,585 10,326 72.2 32 541,732 (19,343) 522,389 319 2.7 Burr 621 6,050,784 280,426 6,331,210 10,195 71.5 704 6,929,752 374,524 7,304,276 10,375 78.4 83 878,968 94,098 973,066 180 6.9 Clark 409 4,669,217 338,235 5,007,452 12,243 63.0 428 4,498,032 414,245 4,912,277 11,477 58.4 19 (171,185) 76,010 (95,175) (766) (4.6) Dwight/Bellizzi 763 8,066,702 513,086 8,579,788 11,245 100.4 676 6,912,495 424,184 7,336,679 10,853 79.5 (87) (1,154,207) (88,902) (1,243,109) (392) (20.9) Fisher 257 3,129,384 295,366 3,424,750 13,326 40.0 360 2,211,907 1,801,096 4,013,003 11,147 43.2 103 (917,477) 1,505,730 588,253 (2,179) 3.2 CommPact @ M.D. Fox 805 7,669,569 507,032 8,176,601 10,157 94.5 826 7,709,896 467,023 8,176,919 9,899 91.4 21 40,327 (40,009) 318 (258) (3.1) Hooker 345 3,548,265 246,703 3,794,968 11,000 41.9 313 3,408,844 196,982 3,605,826 11,520 40.6 (32) (139,421) (49,721) (189,142) 520 (1.3) Global 411 3,739,685 370,233 4,109,918 10,000 46.6 483 4,352,034 503,431 4,855,465 10,053 54.6 72 612,349 133,198 745,547 53 8.0 Kennelly 788 6,972,321 429,078 7,401,399 9,393 87.5 775 6,839,265 629,919 7,469,184 9,638 81.2 (13) (133,056) 200,841 67,785 245 (6.3) King 512 5,062,561 377,638 5,440,199 10,625 64.0 507 4,724,569 288,546 5,013,115 9,888 54.5 (5) (337,992) (89,092) (427,084) (738) (9.5) Kinsella 625 3,781,834 3,677,598 7,459,432 11,935 87.1 669 3,168,987 4,332,883 7,501,870 11,214 84.1 44 (612,847) 655,285 42,438 (722) (3.0) McDonough 358 3,693,339 323,306 4,016,645 11,220 46.7 413 3,805,892 210,287 4,016,179 9,724 44.0 55 112,553 (113,019) (466) (1,495) (2.7) Milner 382 3,955,116 283,917 4,239,033 11,097 49.0 429 3,800,586 410,677 4,211,263 9,816 46.0 47 (154,530) 126,760 (27,770) (1,280) (3.0) Montessori 147 876,774 935,544 1,812,318 12,329 18.3 200 951,660 1,375,290 2,326,949 11,635 25.4 53 74,886 439,746 514,631 (694) 7.1 Moylan 616 6,183,803 367,011 6,550,814 10,634 80.5 672 6,500,090 418,734 6,918,824 10,296 78.0 56 316,287 51,723 368,010 (339) (2.5) Naylor 697 6,720,100 323,304 7,043,403 10,105 80.1 725 6,831,153 407,028 7,238,181 9,984 79.5 28 111,053 83,724 194,777 (122) (0.6) Parkville 517 5,414,833 429,659 5,844,492 11,305 68.4 535 5,434,648 468,773 5,903,421 11,034 66.1 18 19,815 39,114 58,929 (270) (2.3) Rawson 720 6,798,144 400,686 7,198,830 9,998 86.0 735 6,445,904 423,678 6,869,582 9,346 76.9 15 (352,240) 22,992 (329,248) (652) (9.1) America's Choice @Sand 414 4,098,398 309,028 4,407,426 10,646 54.0 429 4,173,972 237,415 4,411,387 10,283 49.0 15 75,574 (71,613) 3,961 (363) (5.0) Sanchez 495 4,789,744 372,253 5,161,997 10,428 59.5 518 4,739,470 285,124 5,024,594 9,700 54.6 23 (50,274) (87,129) (137,403) (728) (4.9) Simpson-Waverly 380 3,848,647 251,776 4,100,423 10,791 51.1 427 4,115,835 421,626 4,537,461 10,626 50.0 47 267,188 169,850 437,038 (164) (1.1) Webster 620 3,233,299 3,668,008 6,901,307 11,131 80.7 625 2,841,833 3,791,272 6,633,105 10,613 78.2 5 (391,466) 123,264 (268,202) (518) (2.5) West Middle 681 6,033,752 462,492 6,496,244 9,539 73.0 698 6,157,652 411,943 6,569,595 9,412 72.5 17 123,900 (50,549) 73,351 (127) (0.5) Wish 413 4,380,661 335,135 4,715,796 11,418 56.5 456 4,833,749 424,196 5,257,945 11,531 62.7 43 453,088 89,061 542,149 112 6.2 Hartford Magnet Middle 608 3,268,518 3,716,735 6,985,253 11,489 81.7 629 2,708,716 4,084,219 6,792,935 10,800 75.9 21 (559,802) 367,484 (192,318) (689) (5.8) Quirk Middle 242 3,442,946 377,634 3,820,580 15,788 41.0 - - - - - (242) (3,442,946) (377,634) (3,820,580) (15,788) (41.0) BHS Lower 767 8,817,059 591,026 9,408,085 12,266 101.0 700 8,054,855 438,359 8,493,214 12,133 85.5 (67) (762,204) (152,667) (914,871) (133) (15.5) BHS Upper 600 6,912,595 503,639 7,416,234 12,360 77.5 525 6,199,289 305,548 6,504,837 12,390 63.4 (75) (713,306) (198,091) (911,397) 30 (14.1) Capital Preparatory 280 1,200,573 1,737,781 2,938,353 10,494 30.0 400 1,789,059 2,510,130 4,299,189 10,748 40.0 120 588,486 772,349 1,360,835 254 10.0 Classical 716 3,719,436 4,499,303 8,218,739 11,479 94.8 751 3,477,338 4,821,892 8,299,230 11,051 86.0 35 (242,098) 322,589 80,491 (428) (8.8) Hartford Insurance 200 2,366,637 566,736 2,933,372 14,667 26.5 300 3,181,863 158,075 3,339,938 11,133 33.5 100 815,226 (408,661) 406,565 (3,534) 7.0 HPHS 9th 400 4,664,001 277,180 4,941,181 12,353 49.0 400 4,580,115 226,526 4,806,641 12,017 46.6 - (83,886) (50,654) (134,540) (336) (2.4) HPHS Engineering . . . 400 4,493,703 274,522 4,768,225 11,921 46.0 400 4,254,744 315,709 4,570,453 11,426 44.9 - (238,959) 41,187 (197,773) (494) (1.1) HPHS Law & Government 400 4,633,293 236,424 4,869,717 12,174 49.8 400 4,576,199 228,955 4,805,154 12,013 49.5 - (57,094) (7,470) (64,564) (161) (0.3) HPHS Nursing 400 4,519,692 280,905 4,800,597 12,001 53.1 400 4,542,651 278,626 4,821,277 12,053 52.5 - 22,959 (2,280) 20,680 52 (0.6) Journalism 200 2,553,646 250,652 2,804,298 14,021 24.5 285 3,351,204 221,482 3,572,686 12,536 34.3 85 797,558 (29,171) 768,388 (1,486) 9.8 Pathways to Technology 353 1,927,225 2,319,243 4,246,468 12,030 47.8 360 1,819,404 2,415,596 4,235,000 11,764 44.6 7 (107,821) 96,353 (11,468) (266) (3.2) Sport & Medical Sciences 609 3,356,553 3,962,835 7,319,388 12,019 75.2 685 3,396,815 4,474,576 7,871,391 11,491 80.2 76 40,262 511,741 552,003 (528) 5.0 Univ High Science & Eng 362 1,986,590 2,212,451 4,199,041 11,600 42.7 414 2,067,714 2,632,468 4,700,182 11,353 45.3 52 81,124 420,017 501,141 (246) 2.6 Culinary Arts @ WHS 300 3,546,248 396,006 3,942,254 13,141 39.1 306 3,908,165 295,910 4,204,075 13,739 43.6 6 361,917 (100,097) 261,821 598 4.6 WHS 11-12th 336 4,076,175 450,429 4,526,604 13,472 49.3 184 2,930,338 160,306 3,090,644 16,797 33.1 (152) (1,145,837) (290,124) (1,435,961) 3,325 (16.2) 2550 Elementary 39 1,492,840 267,757 1,760,597 45,144 21.3 56 1,964,811 18,809 1,983,620 35,422 21.3 17 471,971 (248,948) 223,023 (9,722) - 2550 Main @ Secondary 90 3,232,850 10,063 3,242,913 36,032 33.6 90 2,927,848 44,396 2,972,244 33,025 28.7 - (305,003) 34,333 (270,670) (3,007) (4.9) Gifted & Talented 64 425,340 - 425,340 6,646 4.0 81 546,849 - 546,849 6,751 5.0 17 121,509 - 121,509 105 1.0 HALO - 1,076,040 - 1,076,040 - 8.0 - 949,400 - 949,400 - 9.0 - (126,640) - (126,640) - 1.0 OPP 90 1,145,299 90,000 1,235,299 13,726 14.0 150 1,621,703 536,542 2,158,244 14,388 20.0 60 476,404 446,542 922,945 663 6.0 Adult Ed - 1,485,404 2,139,601 3,625,005 - 32.0 - 1,287,532 1,625,667 2,913,199 - 24.0 - (197,872) (513,935) (711,807) - (8.0) Non-Public - - 414,013 414,013 - 1.7 - 350,986 350,986 - 1.4 - - (63,028) (63,028) - (0.4) Sundry - Schools - 4,296,794 1,157,170 5,453,964 - 29.0 - 4,296,794 1,157,170 5,453,964 - 29.0
Subtotal Schools 21,879 205,844,326 44,172,832 250,017,153 11,427 2,797.1 22,811 205,409,036 49,624,137 255,033,173 11,180 2,696.9 932 (435,290) 5,451,305 5,016,015 (247) (99.6)
Superintendent 620,348 - 620,348 4.0 575,619 - 575,619 3.0 (44,729) - (44,729) (1.0) Elementary 463,512 743,440 1,206,953 4.5 463,512 646,060 1,109,572 7.0 - (97,380) (97,380) 2.5 Secondary 769,883 789,906 1,559,789 10.1 387,078 1,490,394 1,877,472 7.0 (382,805) 700,488 317,683 (3.1) School Design 881,803 2,277,122 3,158,924 5.0 255,484 1,420,603 1,676,087 4.0 (626,319) (856,519) (1,482,838) (1.0) Academics & Assessment 3,495,897 28,367,179 31,863,076 31.0 3,412,112 16,795,971 20,208,083 29.0 (83,785) (11,571,208) (11,654,993) (2.0) LSS 555,243 149,592 704,836 6.0 555,244 159,135 714,379 6.0 1 9,543 9,544 - SPED 9,420,483 24,114,814 33,535,297 25.9 13,983,710 16,220,337 30,204,047 39.7 4,563,227 (7,894,477) (3,331,250) 13.8 LSH 2,033,233 - 2,033,233 25.8 2,033,233 - 2,033,233 25.8 - - - - Prevention 249,070 1,184,769 1,433,839 4.4 249,070 332,067 581,137 5.0 - (852,702) (852,702) 0.6 Psychological 1,740,708 - 1,740,708 16.4 1,740,708 - 1,740,708 15.6 - - - (0.8) Health 702,506 2,156,409 2,858,915 33.8 702,506 2,038,267 2,740,773 31.8 - (118,142) (118,142) (2.0) Welcome 143,661 483,142 626,803 3.5 143,661 284,488 428,149 3.5 - (198,654) (198,654) - Strategic 325,554 520,000 845,554 3.0 367,581 297,000 664,581 3.0 42,027 (223,000) (180,973) - Communications 426,791 - 426,791 2.5 426,791 - 426,791 2.0 - - - (0.5) School Operations 751,816 - 751,816 5.0 751,283 - 751,283 5.0 (533) - (533) - Transportation 21,454,939 3,151,200 24,606,139 3.0 22,123,641 2,423,258 24,546,899 4.0 668,702 (727,942) (59,240) 1.0 Learning Corridor 1,291,810 - 1,291,810 9.0 1,185,095 - 1,185,095 8.0 (106,715) - (106,715) (1.0) B&G 14,175,335 - 14,175,335 28.0 13,289,329 - 13,289,329 28.0 (886,006) - (886,006) - Security 301,198 - 301,198 2.0 347,611 - 347,611 2.0 46,413 - 46,413 - Printing 576,685 - 576,685 3.0 576,285 - 576,285 3.0 (400) - (400) - RSCO/Choice 5,887,753 992,631 6,880,384 10.0 8,830,117 1,030,820 9,860,937 8.5 2,942,364 38,189 2,980,553 (1.5) Finance & Operations 5,140,890 9,491 5,150,381 28.0 5,284,376 - 5,284,376 27.5 143,486 (9,491) 133,995 (0.5) Talent Office 1,666,822 793,205 2,460,027 12.0 1,507,516 1,155,836 2,663,352 15.0 (159,306) 362,631 203,325 3.0 Labor Relations 706,024 - 706,024 4.0 866,954 174,163 1,041,117 4.0 160,930 174,163 335,093 - Board 180,837 - 180,837 1.0 336,448 200,000 536,448 1.0 155,611 200,000 355,611 - Sundry 4,746,872 519,624 5,266,496 - - 659,637 659,637 (4,746,872) 140,013 (4,606,859) - SBHC - 662,946 662,946 8.0 - 662,946 662,946 8.0 - - - -
Subtotal Central Svs 78,709,673 66,915,470 145,625,143 288.9 80,394,964 45,990,982 126,385,946 296.4 1,685,291 (20,924,488) (19,239,197) 7.5
GRAND TOTAL ALL 21,879 284,554,001 111,088,295 395,642,296 3,086.0 22,811 285,804,001 95,615,121 381,419,122 2,993.3 932 1,250,000 (15,473,174) (14,223,174) (92.1)
% Change FY09/10 Adopted to FY10/11 Adopted
Adopted Budget FY10/11
Adopted Budget FY09/10
12

HARTFORD PUBLIC SCHOOLSSPECIAL FUNDS REVENUE SUMMARY BY GRANT
FY 2009-10 FY 2010-11 FY 09-10Adopted Adopted Adopted vs.Budget Budget FY 10-11 Adopted
State Magnet Operating 24,301,440 31,524,000 7,222,560 Title I Part A Improving Basic Skills 18,431,401 18,431,401 - Title I Part A Improving Basic Skills - Carryover 4,648,503 2,759,805 (1,888,698) IDEA 611 6,388,307 6,100,679 (287,628) IDEA 611 - Carryover 300,329 - (300,329) Carl Perkins 666,835 666,835 - Title IV Safe & Drug Free 259,978 259,978 - Title II A Teachers 3,392,078 3,286,846 (105,232) Title II A Teachers Carryover - 692,600 692,600 Title I A School Improvement 673,532 600,175 (73,357) Title I A School Improvement - Carryover 680,995 - (680,995) Homeless Education 50,310 25,310 (25,000) IDEA 619 Pre-School Handicap 212,784 212,784 - Other Direct Federal - Carryover 950,271 150,000 (800,271) Other Direct Federal 480,000 559,040 79,040 Title III English, Language, Learner 470,421 470,421 - State Adult Education 2,139,601 1,625,667 (513,934) State Bilingual 280,869 280,869 - State Visually Impaired (BESB) 256,528 256,528 - Department of Health Services 624,000 846,213 222,213 Priority School District 6,298,095 6,298,095 - Medicaid Coordination (SBCH) 1,646,000 1,646,000 - Other State Grants 11,874,677 7,700,000 (4,174,677) Medical Reimbursement (Third Party Billing) 1,845,000 1,845,000 - School Readiness Pre-K Funds 3,078,000 2,622,000 (456,000) Mass Mutual 24,919 - (24,919) Travelers 146,282 - (146,282) Hartford Foundation for Public Giving 483,500 - (483,500) Say Yes to Education 193,033 - (193,033) AARA - Title I 11,216,007 3,561,957 (7,654,050) AARA - IDEA 611/619 7,788,098 1,124,138 (6,663,960) Oth Found/Private Sources/Fee Collections 363,502 1,187,000 823,498 Regional School Choice Supplement 923,000 881,780 (41,220)
Fund 2007 Special Funds Totals 111,088,295 95,615,121 (15,473,174)
Description
13

HARTFORD PUBLIC SCHOOLSGENERAL BUDGET SUMMARY BY OBJECT CODE
FY 2009-10 FY 2010-11 FY 2009-10
Adopted Adopted Adopted vs.Budget Budget FY 2010-11 Adopted
Certified Administrators 10 2,554,369 2,704,705 150,336 Certified Asst Administrators 11 98,123 - (98,123) Instructional Administrators 12 8,442,017 7,534,719 (907,298) Instructional Staff 13 98,369,864 97,995,775 (374,089) Certified Support Staff 14 5,400,386 5,243,358 (157,028) Certified Benefits 19 1,900,000 2,020,000 120,000 Certified Salaries Total 116,764,759 115,498,557 (1,266,202)
Non Cert Administrators 20 1,265,989 1,527,514 261,525 Non-Cert Asst Administrators 21 1,190,708 1,668,308 477,600 Support Staff 22 5,008,660 5,127,264 118,604 Clerical & Tech Staff 23 5,810,385 5,304,711 (505,674) Medical Staff 24 1,846,201 1,870,117 23,916 Paraprofessionals & Security 25 11,790,181 11,071,162 (719,019) Custodial Staff 26 7,053,873 6,568,026 (485,847) Carpenters & Electricians 27 674,131 612,612 (61,519) Mechanical & Plumbers 28 791,282 791,636 354 Non Cert Benefits 29 600,000 600,000 - Non Certified Salaries Total 36,031,410 35,141,350 (890,060)
Instructional Improvements 32 530,582 502,596 (27,986) Professional Services 33 3,094,343 3,877,572 783,229 Professional Contracts & Svs 3,624,925 4,380,168 755,243
Maint Supplies & Services 42 390,302 418,980 28,678 Maintenance Contracts 43 2,177,738 2,258,397 80,659 Rental - Equip & Facilities 44 5,355,294 5,024,121 (331,173) Building Improvements 45 3,610,182 2,895,000 (715,182) Purchased Property Services 11,533,516 10,596,498 (937,018)
Transportation 51 21,200,954 21,885,293 684,339 Communications 53 150,422 132,254 (18,168) Advertising 54 148,136 114,136 (34,000) Printing & Binding 55 104,612 62,660 (41,952) Tuition 56 19,399,734 23,609,000 4,209,266 Travel & Conferences 58 266,302 197,628 (68,674) Misc Services 59 394,686 567,337 172,651 Systemwide Purchased Svs Total 41,664,846 46,568,308 4,903,462
Supplies & Materials 61 5,588,721 4,515,090 (1,073,631) Utilities 62 13,302,655 13,008,440 (294,215) Food Service Supplies 63 2,000 - (2,000) Text & Library Books 64 1,982,407 1,451,466 (530,941) Misc Supplies 69 385,178 489,080 103,902 Supplies, Text, Utilities Total 21,260,961 19,464,076 (1,796,885)
Equipment 73 688,862 685,837 (3,025) Outlay Total 688,862 685,837 (3,025)
Organization Dues 81 45,032 44,691 (341) Legal Judgments 82 300,000 300,000 - Other Operating Expenses 89 571,369 490,272 (81,097) Mandated Compensatory Education 89 - 2,650,274 2,650,274 Other Misc Expend Total 916,401 3,485,237 2,568,836
Revenue Loss Mitigation Fund 99 246,873 - (246,873) Enrollment Loss Mitigation Fund 99 - - - Fringe Benefits 99 51,821,448 49,983,970 (1,837,478) Other Sundry Total 52,068,321 49,983,970 (2,084,351)
Fund 1003 General Budget Totals 284,554,001 285,804,001 1,250,000
Description Account
14

HARTFORD PUBLIC SCHOOLSSPECIAL FUNDS SUMMARY BY OBJECT CODE
FY 2009-10 FY 2010-11 FY 2009-10Amended Adopted Adopted vs.
Budget Budget FY 2010-11 Adopted
Certified Administrators 10 1,864,214 2,637,528 773,314 Certified Asst Administrators 11 130,300 183,977 53,677 Instructional Administrators 12 859,590 789,480 (70,110) Instructional Staff 13 29,362,660 30,713,970 1,351,310 Certified Support Staff 14 748,048 814,021 65,973 Certified Salaries Total 32,964,812 35,138,976 2,174,164
Non Cert Administrators 20 400,726 112,810 (287,916) Non-Cert Asst Administrators 21 835,421 834,313 (1,108) Support Staff 22 4,484,743 5,136,213 651,470 Clerical & Tech Staff 23 1,893,840 1,212,846 (680,994) Medical Staff 24 1,478,499 1,425,601 (52,898) Paraprofessionals & Security 25 2,040,419 2,673,721 633,302 Custodial Staff 26 315,691 796,745 481,054 Carpenters & Electricians 27 6,000 29,972 23,972 Student Workers 29 22,000 5,000 (17,000) Non Certified Salaries Total 11,477,339 12,227,221 749,882
Instructional Improvements 32 10,096,226 7,920,055 (2,176,171) Professional Services 33 6,089,332 2,050,029 (4,039,303) Professional Contracts & Svs 16,185,558 9,970,084 (6,215,474)
Maint Supplies & Services 42 3,500 3,000 (500) Maintenance Contracts 43 238,057 308,043 69,986 Rental - Equip & Facilities 44 406,175 253,193 (152,982) Purchased Property Services 647,732 564,236 (83,496)
Transportation 51 5,169,716 3,581,570 (1,588,146) Communications 53 88,000 62,187 (25,813) Advertising 54 142,864 227,764 84,900 Printing & Binding 55 67,500 30,000 (37,500) Tuition 56 10,127,464 10,972,000 844,536 Travel & Conferences 58 480,679 133,715 (346,964) Misc Services 59 699,236 344,556 (354,680) Systemwide Purchased Svs Total 16,775,459 15,351,792 (1,423,667)
Supplies & Materials 61 10,052,099 3,961,542 (6,090,557) Food Service Supplies 63 - Text & Library Books 64 1,931,276 280,440 (1,650,836) Misc Supplies 69 499,000 598,552 99,552 Supplies, Text, Utilities Total 12,482,375 4,840,534 (7,641,841)
Equipment 73 5,888,031 1,957,126 (3,930,905) Outlay Total 5,888,031 1,957,126 (3,930,905)
Organization Dues 81 21,835 45,349 23,514 Other Operating Expenses 89 1,003,961 936,659 (67,302) Indirect 99 1,134,150 865,216 (268,934) Other Misc Expend Total 2,159,946 1,847,224 (312,722)
Fringe Benefits 99 12,507,043 13,717,928 1,210,885 Sundry Total 12,507,043 13,717,928 1,210,885
Fund 2007 Special Funds Totals 111,088,295 95,615,121 (15,473,174)
Description Account
15

FY 2010-11 Adopted Staffing Changes – All Funds
Change
School Administrators (10.5) Teachers (49.5) Social Workers (3.8) Guidance Counselors (K-12) (3.5) School Psychologists (1.2) Manager/Supervisors (0.5) Support Staff 0.5 Dental Staff (1.0) Medical Staff (1.0) Clerical/Secretarial Support (9.9) Prevention/Intervention 3.9 Paras (17.2) CDA's 4.0 FRA's (14.0) School & Family Support Coordinators 12.0 Nurse (0.5) Custodians (3.2) Security/Safety (2.0) Gym/Pool Asst 1.0 Tech Support (1.0) Other 0.3 District ELL/Talent Development/Instr Technology/Intervention 5.0 TOTAL (92.1)
16

PROJECTED ENROLLMENT FY 2010-11
Oct'09 School PK KF 1 2 3 4 5 6 7 8 9 10 11 12PROJ 11 TOTAL
OCT 09 TOTAL CHANGE
Achievement 1st 88 92 92 92 ‐ 88 88 85 ‐ 625 441 184 Batchelder 18 46 44 66 66 69 69 54 54 75 561 568 (7)Betances 72 72 69 57 44 54 368 356 12 Breakthrough Magnet 53 32 32 33 33 32 33 34 35 33 350 352 (2)Breakthrough II 44 22 22 22 22 22 154 129 25 Burns Latino Studies 36 66 66 66 50 72 66 69 66 77 634 584 50 Burr 36 92 92 80 63 50 75 69 75 72 704 625 79 Chrtr for Yng Children ‐ 89 (89) Clark 18 46 54 60 38 46 42 40 38 46 428 416 12 Dwight/Bellizzi Asian Studies 36 69 80 51 54 60 50 36 72 168 676 766 (90)Fisher 37 37 35 38 64 46 28 35 40 360 253 107 Global Communications 65 88 88 88 ‐ ‐ 66 88 483 375 108 Hooker 30 30 30 30 32 31 30 31 35 34 313 345 (32)Kennelly 18 80 72 92 69 96 96 96 78 78 775 796 (21)Kinsella Magnet 60 66 71 70 67 68 68 70 70 59 669 616 53 McDonough 18 46 46 46 46 46 44 40 81 ‐ 413 358 55 MD Fox CommPACT 36 92 132 115 120 115 96 66 54 ‐ 826 801 25 Milner Core Knowledge 18 46 51 54 44 44 44 42 42 44 429 401 28 ML King ‐ 46 46 66 66 75 54 52 54 48 507 515 (8)Montessori Magnet 90 55 18 15 12 10 200 149 51 Moylan Montessori 24 8 32 ‐ 32 Moylan 36 69 69 69 46 72 63 54 81 81 640 610 30 Naylor 36 80 80 69 72 75 75 81 73 84 725 699 26 Parkville 36 80 80 80 72 69 64 54 535 514 21 Rawson 36 69 69 84 81 96 108 69 48 75 735 732 3 Sanchez 36 76 80 82 53 57 80 54 518 493 25 SAND America's Choice ‐ 46 54 66 60 50 57 42 54 429 414 15 Simpson‐Waverly 18 46 44 51 50 50 40 44 44 40 427 437 (10)Webster MicroSociety Magnet 50 51 69 79 62 66 66 65 58 59 625 619 6 West Middle 18 69 92 105 84 88 78 54 50 60 698 698 ‐ Wish 18 49 50 50 54 61 52 42 34 46 456 426 30
ELEMENTARY TOTAL 891 1,739 1,829 1,873 1,678 1,638 1,584 1,440 1,404 1,219 15,295 14,577 718 HMMS 208 209 212 629 611 18 Quirk ‐ 243 (243)BHS Lower 450 250 700 772 (72)BHS Upper 275 250 525 577 (52)Capital Preparatory 83 70 53 69 53 40 32 400 277 123 Classical Magnet 110 109 114 109 118 103 88 751 715 36 Culinary Arts Academy 100 90 50 66 306 284 22 HPHS Freshman Academy 400 400 373 27 HPHS Eng & Green Tech 134 133 133 400 378 22 HPHS Law & Government 134 133 133 400 378 22 HPHS Nursing 134 133 133 400 394 6 High School Inc. 100 130 70 ‐ 300 197 103 Journalism & Media 100 90 95 ‐ 285 167 118 OPPortunity High 60 40 40 10 150 90 60 Pathways Magnet 96 80 96 88 360 350 10 SMSA 75 90 81 112 106 116 105 685 602 83 University High 110 141 90 73 414 362 52 Weaver Senior Academy 184 184 335 (151)
SECONDARY TOTAL 476 478 460 1,706 1,500 1,374 1,295 7,289 7,105 184 2550 Main Acad. 1 2 2 12 12 2 22 2 2 56 34 22 2550 Main Acad. 2 19 12 11 7 15 13 13 90 75 15 Gifted & Talented 22 23 17 19 81 60 21
PROGRAMS TOTAL ‐ ‐ 2 2 12 34 25 58 33 13 7 15 13 13 227 169 58 DISTRICT TOTAL 891 1,739 1,831 1,875 1,690 1,672 1,609 1,974 1,915 1,692 1,713 1,515 1,387 1,308 22,811 21,851 960
SpEd Out of Dist. 391 272 119 Bloomfield VoAg 3 3 ‐ East Htfd/Glastonbury 40 7 33 GH Acad of Arts 156 130 26 GH Acad of Math/Sci 192 99 93 Glastonbury VoAg 40 24 16 Great Path 150 102 48 International Bacc. 48 48 ‐ International Mag 100 76 24 Metropolitan Lrng 220 214 6 Montessori 163 158 5 Open Choice*** 1,450 1,250 200 Public Safety Acad 200 98 102 Reggio Mag for Arts 150 79 71 Two Rivers 161 161 ‐ Goodwin/River Academy 75 ‐ 75 University of Htfd 205 186 19 TOTAL OUT OF DISTRICT 3,744 2,907 837 GRAND TOTAL 891 1,739 1,831 1,875 1,690 1,672 1,609 1,974 1,915 1,692 1,713 1,515 1,387 1,308 26,555 24,758 1,797
17

ELEMENTARY
SCHOOLS

Achievement First
09/10 10/11
Adopted Difference
FY FY 10/11FY
Adopted
$ FTE $FTE$ FTE
BUDGET FUND 1003
120 Non-Certified Salaries $167,632 4.0 $290,806 7.0 $123,174 3.0
$167,632 4.0Total Salaries $290,806 7.0 $123,174 3.0
900 Fringe Benefits $85,962 $140,372 $54,410 0.0
$85,962Total Benefits $140,372 $54,410 0.0
330 Other Prof. Tech Svs/MHIS $290,573 $554,810 $264,237 0.0
620 Utilities $176,000 $625,527 $449,527 0.0
$466,573Total Operating Expenses $1,180,337 $713,764 0.0
$720,167 4.0TOTAL BUDGET FUND $1,611,515 7.0 $891,348 3.01003
$720,167 4.0GRAND TOTAL ALL FUNDS $1,611,515 7.0 $891,348 3.0
18

Achievement First
Certified Staff Enrollment Non-Certified Staff
STAFFING and ENROLLMENT
Adopted Actual Projected Adopted
09/10 10/11 09/10 10/11 09/10 10/11
Adopted Adopted
Principals Clerical Support
Pre-K 0 0
Associate/Assistant Principal Paraprofessionals
K 87 88 Classroom
Dean Special Education
Teachers 1st 92 92 Other - Special Educ
Pre-K
Regular 2nd 89 92 Kindergarten
Associate Teacher Other Para
Art 3rd 0 92
Business Prev/Interv Staff
Reading 4th 0 0
Foreign Language CDA
Health 5th 88 88
Tech Comp Educ Family Resource Aides
Math 6th 85 88
Music School and Family Support
Science 7th 0 85
Social Studies Nurse 0.8 1.3
English 8th 0 0
Physical Education Custodial Staff 3.2 5.2
Special Education 9th 0 0
Pre-K Security 0.5
Kindergarten 10th 0 0
Bilingual Gym & Pool Asst
TESOL/ELL 11th 0 0
Speech M&C Journeyman
Library Media 12th 0 0
Coach Tech Support
Other
Other
Social Workers
Guidance Counselors
441 625 4.0 7.0Total Total Total
Adopted
Staffing Total 4.0 7.0
Adopted
19

L W Batchelder Elementary
18 108,000
46 253,506
176 1,369,104
192 1,244,736
129 920,028
0 0
119 74,613
56 17,584
0 0
30 77,790
49 229,222
6 45,600
6 83,886
0 0
Grade Weights
Pre K
K
1-3
4-6
7-8
9-12
Weight Per Capita
Projected
Enrollment/
Hours $
X
X
X
X
X
=
=
=
=
=
Need Weights
Academic Intervention*
DRA (K-3)
47 29,469
Achievement (4-12)
Well Below Standards X =
X =
X =
X =
X =
X =
=
Below Standards
High Achievement (Lvl 5)
English Language Learners
0-30 Months
Special Education
Level 1
XLevel 2
XLevel 3
XLevel 4
=
=
=
Total WSF FORMULA = 4,475,326
X
2 3,242X =Trans to Mainstream
22 18,546X =30 + Months
6,0001.26
5,5110.85
7,7791.20
6,4831.00
7,1321.10
8,4281.30
6270.10
6270.10
3140.05
6270.10
2,5930.40
1,6210.25
8430.13
4,6780.80
7,6001.30
13,9812.40
23,7354.07
Foundation = 0
Federal/State Categorical = 498,684
GRAND TOTAL ALL FUNDS FY = 5,595,575
561
$9,974
Total WSF = 4,475,326
Enrollment
Per Pupil Funding
Utilities = 231,863
Special Ed. Programs = 389,702
10/11
Other Programs = 0
ADOPTED BUDGET
20

L W Batchelder Elementary
09/10 10/11
Adopted Difference
FY FY 10/11FY
Adopted
$ FTE $FTE$ FTE
BUDGET FUND 1003
110 Certified Salaries $2,979,554 41.9 $2,881,430 38.8 ($98,124) -3.1
110 Part Time Certified Salaries $72,104 $40,000 ($32,104) 0.0
120 Non-Certified Salaries $624,309 19.8 $578,446 17.3 ($45,863) -2.5
120 Part Time Non-Certified Salaries $10,000 $10,000 $0 0.0
$3,685,967 61.6Total Salaries $3,509,876 56.0 ($176,091) -5.6
900 Fringe Benefits $1,125,042 $1,185,793 $60,751 0.0
$1,125,042Total Benefits $1,185,793 $60,751 0.0
330 Other Prof. Tech Svs/MHIS $31,435 $48,807 $17,372 0.0
430 Maintenance Contracts $19,391 $23,472 $4,081 0.0
611 Supplies & Materials $181,444 $97,080 ($84,364) 0.0
620 Utilities $177,032 $231,863 $54,831 0.0
$409,302Total Operating Expenses $401,222 ($8,080) 0.0
$5,220,311 61.6TOTAL BUDGET FUND $5,096,891 56.0 ($123,420) -5.61003
BUDGET FUND 2007
110 Certified Salaries $125,312 1.8 $207,055 2.8 $81,743 1.0
110 Part Time Certified Salaries $23,229 $16,742 0.0 ($6,487) 0.0
120 Non-Certified Salaries $69,842 2.8 $134,191 3.3 $64,349 0.5
120 Part Time Non-Certified Salaries $1,217 $1,217 0.0 $0 0.0
$219,600 4.5Total Salaries $359,205 6.0 $139,605 1.5
900 Fringe Benefits $69,916 $129,980 $60,064 0.0
$69,916Total Benefits $129,980 $60,064 0.0
325 Parent Activities $5,108 $4,960 0.0 ($148) 0.0
611 Supplies & Materials $3,133 $4,539 0.0 $1,406 0.0
$8,241Total Operating Expenses $9,499 0.0 $1,258 0.0
$297,757 4.5TOTAL BUDGET FUND $498,684 6.0 $200,927 1.52007
$5,518,069 66.1GRAND TOTAL ALL FUNDS $5,595,575 62.0 $77,507 -4.1
21

L W Batchelder Elementary
Certified Staff Enrollment Non-Certified Staff
STAFFING and ENROLLMENT
Adopted Actual Projected Adopted
09/10 10/11 09/10 10/11 09/10 10/11
Adopted Adopted
Principals 1.0 1.0 Clerical Support 2.0 2.0
Pre-K 18 18
Associate/Assistant Principal 1.0 1.0 Paraprofessionals
K 40 46 Classroom
Dean Special Education 1.0
Teachers 1st 65 44 Other - Special Educ 8.0 7.0
Pre-K 1.0
Regular 19.0 17.0 2nd 64 66 Kindergarten 1.5
Associate Teacher Other Para 4.5
Art 1.0 1.0 3rd 65 66
Business Prev/Interv Staff 1.0 1.0
Reading 4th 67 69
Foreign Language CDA 1.0 1.0
Health 5th 69 69
Tech Comp Educ Family Resource Aides 1.0
Math 1.0 1.0 6th 52 54
Music 1.6 1.0 School and Family Support 1.0
Science 1.0 1.0 7th 75 54
Social Studies 1.0 1.0 Nurse 1.0 1.0
English 2.0 2.0 8th 50 75
Physical Education 1.5 1.5 Custodial Staff 3.0 3.0
Special Education 4.0 5.0 9th 0 0
Pre-K 1.0 0.5 Security 1.0 1.0
Kindergarten 3.0 3.0 10th 0 0
Bilingual Gym & Pool Asst
TESOL/ELL 1.0 1.0 11th 0 0
Speech 1.0 1.0 M&C Journeyman
Library Media 1.0 1.0 12th 0 0
Coach 1.0 1.0 Tech Support
Other
Other
Social Workers 0.5 1.0
Guidance Counselors 1.0 0.5
43.6 41.5 565 561 22.5 20.5Total Total Total
Adopted
Staffing Total 66.1 62.0
Adopted
22

This page intentionally left blank.
23

Ramon E Betances
72 432,000
72 396,792
170 1,322,430
54 350,082
0 0
0 0
130 81,510
13 4,082
0 0
65 168,545
32 149,696
3 22,800
4 55,924
0 0
Grade Weights
Pre K
K
1-3
4-6
7-8
9-12
Weight Per Capita
Projected
Enrollment/
Hours $
X
X
X
X
X
=
=
=
=
=
Need Weights
Academic Intervention*
DRA (K-3)
19 11,913
Achievement (4-12)
Well Below Standards X =
X =
X =
X =
X =
X =
=
Below Standards
High Achievement (Lvl 5)
English Language Learners
0-30 Months
Special Education
Level 1
XLevel 2
XLevel 3
XLevel 4
=
=
=
Total WSF FORMULA = 3,052,448
X
10 16,210X =Trans to Mainstream
48 40,464X =30 + Months
6,0001.26
5,5110.85
7,7791.20
6,4831.00
7,1321.10
8,4281.30
6270.10
6270.10
3140.05
6270.10
2,5930.40
1,6210.25
8430.13
4,6780.80
7,6001.30
13,9812.40
23,7354.07
Foundation = 0
Federal/State Categorical = 326,405
GRAND TOTAL ALL FUNDS FY = 3,837,202
368
$10,427
Total WSF = 3,052,448
Enrollment
Per Pupil Funding
Utilities = 173,043
Special Ed. Programs = 119,706
10/11
Other Programs = 165,600
ADOPTED BUDGET
24

Ramon E Betances
09/10 10/11
Adopted Difference
FY FY 10/11FY
Adopted
$ FTE $FTE$ FTE
BUDGET FUND 1003
110 Certified Salaries $2,140,810 30.5 $1,853,257 25.4 ($287,553) -5.1
110 Part Time Certified Salaries $48,190 $5,317 ($42,873) 0.0
120 Non-Certified Salaries $554,976 16.5 $568,078 16.5 $13,102 0.0
120 Part Time Non-Certified Salaries $5,505 $4,400 ($1,105) 0.0
$2,749,481 47.0Total Salaries $2,431,052 41.9 ($318,429) -5.1
900 Fringe Benefits $862,838 $855,580 ($7,258) 0.0
$862,838Total Benefits $855,580 ($7,258) 0.0
322 Instr. Impr. Services $9,839 $0 ($9,839) 0.0
330 Other Prof. Tech Svs/MHIS $31,094 $32,016 $922 0.0
430 Maintenance Contracts $9,774 $9,774 0.0
530 Communications $1,000 $750 ($250) 0.0
611 Supplies & Materials $33,744 $8,582 ($25,162) 0.0
620 Utilities $161,939 $173,043 $11,104 0.0
$237,616Total Operating Expenses $224,165 ($13,451) 0.0
$3,849,935 47.0TOTAL BUDGET FUND $3,510,797 41.9 ($339,138) -5.11003
BUDGET FUND 2007
110 Certified Salaries $189,250 3.0 $182,000 3.0 ($7,250) 0.0
110 Part Time Certified Salaries $8,944 $16,500 0.0 $7,556 0.0
120 Non-Certified Salaries $13,013 0.5 $23,100 0.5 $10,087 0.0
120 Part Time Non-Certified Salaries $2,388 $3,000 0.0 $612 0.0
$213,595 3.5Total Salaries $224,600 3.5 $11,005 0.0
900 Fringe Benefits $57,837 $68,640 $10,803 0.0
$57,837Total Benefits $68,640 $10,803 0.0
325 Parent Activities $3,771 $2,967 0.0 ($804) 0.0
611 Supplies & Materials $5,722 $29,198 0.0 $23,476 0.0
899 Other Operating Exp. $1,000 0.0 $1,000 0.0
$9,493Total Operating Expenses $33,165 0.0 $23,672 0.0
$280,925 3.5TOTAL BUDGET FUND $326,405 3.5 $45,480 0.02007
$4,130,860 50.5GRAND TOTAL ALL FUNDS $3,837,202 45.4 ($293,658) -5.1
25

Ramon E Betances
Certified Staff Enrollment Non-Certified Staff
STAFFING and ENROLLMENT
Adopted Actual Projected Adopted
09/10 10/11 09/10 10/11 09/10 10/11
Adopted Adopted
Principals 1.0 1.0 Clerical Support 2.0 2.0
Pre-K 23 72
Associate/Assistant Principal Paraprofessionals
K 69 72 Classroom
Dean 1.0 Special Education
Teachers 1st 52 69 Other - Special Educ 3.0 3.0
Pre-K 4.0
Regular 11.0 10.0 2nd 52 57 Kindergarten
Associate Teacher 2.0 3.0 Other Para 3.0
Art 1.0 0.6 3rd 59 44
Business Prev/Interv Staff 1.0
Reading 4th 57 54
Foreign Language CDA 2.0 2.0
Health 5th 48 0
Tech Comp Educ Family Resource Aides 1.0
Math 6th 0 0
Music 1.0 0.6 School and Family Support 1.0
Science 7th 0 0
Social Studies Nurse 1.0 1.0
English 8th 0 0
Physical Education 1.0 0.6 Custodial Staff 3.0 3.0
Special Education 3.0 2.5 9th 0 0
Pre-K 2.0 2.0 Security 1.0 1.0
Kindergarten 4.0 3.0 10th 0 0
Bilingual 0.5 1.0 Gym & Pool Asst
TESOL/ELL 2.0 1.5 11th 0 0
Speech 0.5 0.6 M&C Journeyman
Library Media 0.5 12th 0 0
Coach 3.0 Tech Support
Other
Other
Social Workers 1.0 1.0
Guidance Counselors
33.5 28.4 360 368 17.0 17.0Total Total Total
Adopted
Staffing Total 50.5 45.4
Adopted
26

This page intentionally left blank.
27

Breakthrough Magnet
28 168,000
15 82,665
57 443,403
55 356,565
31 221,092
0 0
36 22,572
12 3,768
2 1,254
0 0
9 42,102
2 15,200
3 41,943
0 0
Grade Weights
Pre K
K
1-3
4-6
7-8
9-12
Weight Per Capita
Projected
Enrollment/
Hours $
X
X
X
X
X
=
=
=
=
=
Need Weights
Academic Intervention*
DRA (K-3)
8 5,016
Achievement (4-12)
Well Below Standards X =
X =
X =
X =
X =
X =
=
Below Standards
High Achievement (Lvl 5)
English Language Learners
0-30 Months
Special Education
Level 1
XLevel 2
XLevel 3
XLevel 4
=
=
=
Total WSF FORMULA = 1,410,972
X
3 4,863X =Trans to Mainstream
3 2,529X =30 + Months
6,0001.26
5,5110.85
7,7791.20
6,4831.00
7,1321.10
8,4281.30
6270.10
6270.10
3140.05
6270.10
2,5930.40
1,6210.25
8430.13
4,6780.80
7,6001.30
13,9812.40
23,7354.07
Foundation = 0
Federal/State Categorical = 2,265,371
GRAND TOTAL ALL FUNDS FY = 3,986,833
350
$11,391
Total WSF = 1,410,972
Enrollment
Per Pupil Funding
Utilities = 230,686
Special Ed. Programs = 79,804
10/11
Other Programs = 0
ADOPTED BUDGET
28

Breakthrough Magnet
09/10 10/11
Adopted Difference
FY FY 10/11FY
Adopted
$ FTE $FTE$ FTE
BUDGET FUND 1003
110 Certified Salaries $778,026 10.4 $651,369 8.4 ($126,657) -2.0
120 Non-Certified Salaries $330,590 10.0 $369,712 11.0 $39,122 1.0
120 Part Time Non-Certified Salaries $8,500 $3,400 ($5,100) 0.0
$1,117,116 20.4Total Salaries $1,024,481 19.4 ($92,635) -1.0
900 Fringe Benefits $379,232 $382,794 $3,562 0.0
$379,232Total Benefits $382,794 $3,562 0.0
330 Other Prof. Tech Svs/MHIS $21,207 $31,146 $9,939 0.0
611 Supplies & Materials $214,371 $52,355 ($162,016) 0.0
620 Utilities $203,545 $230,686 $27,141 0.0
$439,123Total Operating Expenses $314,187 ($124,936) 0.0
$1,935,471 20.4TOTAL BUDGET FUND $1,721,462 19.4 ($214,009) -1.01003
BUDGET FUND 2007
110 Certified Salaries $910,570 17.0 $1,056,856 18.0 $146,286 1.0
110 Part Time Certified Salaries $130,908 $215,134 0.0 $84,226 0.0
120 Non-Certified Salaries $292,110 10.0 $254,825 9.0 ($37,285) -1.0
120 Part Time Non-Certified Salaries $79,600 $78,880 0.0 ($720) 0.0
$1,413,188 27.0Total Salaries $1,605,695 27.0 $192,507 0.0
900 Fringe Benefits $402,452 $463,271 $60,819 0.0
$402,452Total Benefits $463,271 $60,819 0.0
322 Instr. Impr. Services $6,000 $6,000 0.0 $0 0.0
324 Field Trips $24,000 $0 ($24,000) 0.0
325 Parent Activities $2,931 $2,931 0.0 $0 0.0
530 Communications $10,000 $10,000 0.0 $0 0.0
611 Supplies & Materials $202,268 $124,125 0.0 ($78,143) 0.0
700 Equipment $38,755 $53,000 0.0 $14,245 0.0
899 Other Operating Exp. $10,097 $349 0.0 ($9,748) 0.0
$294,051Total Operating Expenses $196,405 0.0 ($97,646) 0.0
$2,109,691 27.0TOTAL BUDGET FUND $2,265,371 27.0 $155,680 0.02007
$4,045,162 47.4GRAND TOTAL ALL FUNDS $3,986,833 46.4 ($58,329) -1.0
29
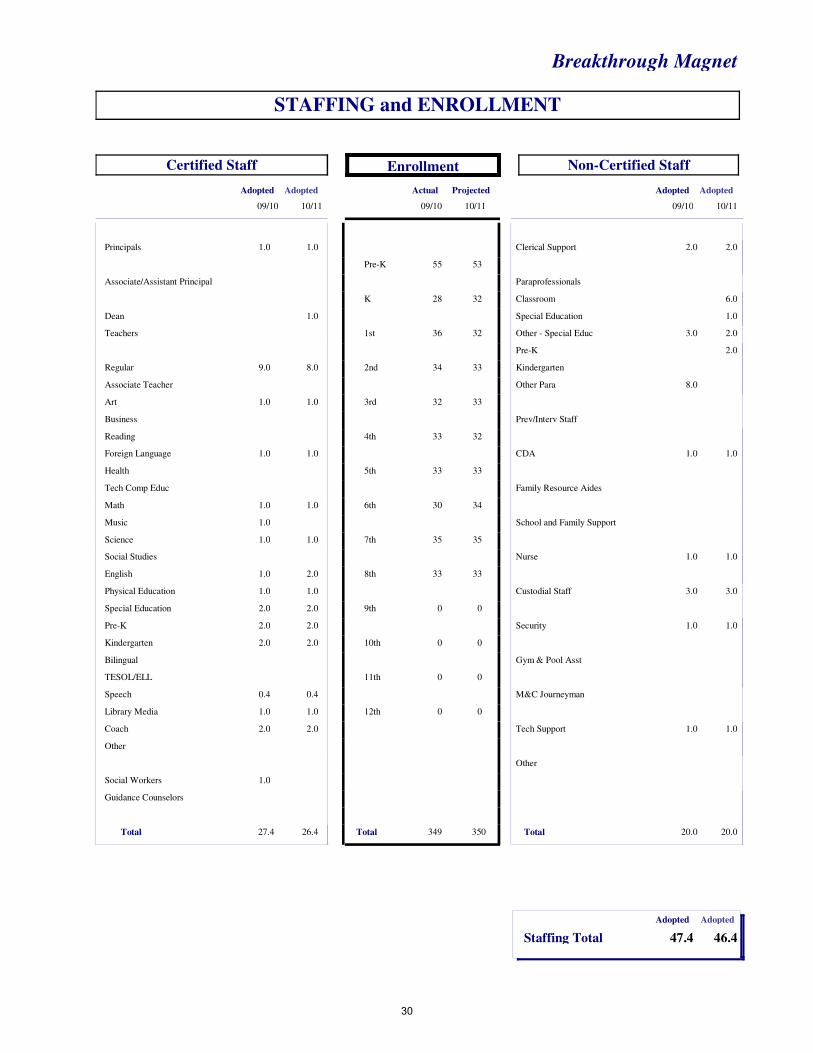
Breakthrough Magnet
Certified Staff Enrollment Non-Certified Staff
STAFFING and ENROLLMENT
Adopted Actual Projected Adopted
09/10 10/11 09/10 10/11 09/10 10/11
Adopted Adopted
Principals 1.0 1.0 Clerical Support 2.0 2.0
Pre-K 55 53
Associate/Assistant Principal Paraprofessionals
K 28 32 Classroom 6.0
Dean 1.0 Special Education 1.0
Teachers 1st 36 32 Other - Special Educ 3.0 2.0
Pre-K 2.0
Regular 9.0 8.0 2nd 34 33 Kindergarten
Associate Teacher Other Para 8.0
Art 1.0 1.0 3rd 32 33
Business Prev/Interv Staff
Reading 4th 33 32
Foreign Language 1.0 1.0 CDA 1.0 1.0
Health 5th 33 33
Tech Comp Educ Family Resource Aides
Math 1.0 1.0 6th 30 34
Music 1.0 School and Family Support
Science 1.0 1.0 7th 35 35
Social Studies Nurse 1.0 1.0
English 1.0 2.0 8th 33 33
Physical Education 1.0 1.0 Custodial Staff 3.0 3.0
Special Education 2.0 2.0 9th 0 0
Pre-K 2.0 2.0 Security 1.0 1.0
Kindergarten 2.0 2.0 10th 0 0
Bilingual Gym & Pool Asst
TESOL/ELL 11th 0 0
Speech 0.4 0.4 M&C Journeyman
Library Media 1.0 1.0 12th 0 0
Coach 2.0 2.0 Tech Support 1.0 1.0
Other
Other
Social Workers 1.0
Guidance Counselors
27.4 26.4 349 350 20.0 20.0Total Total Total
Adopted
Staffing Total 47.4 46.4
Adopted
30

This page intentionally left blank.
31

Breakthrough II
44 264,000
22 121,242
66 513,414
22 142,626
0 0
0 0
53 33,231
0 0
0 0
2 5,186
4 18,712
0 0
3 41,943
0 0
Grade Weights
Pre K
K
1-3
4-6
7-8
9-12
Weight Per Capita
Projected
Enrollment/
Hours $
X
X
X
X
X
=
=
=
=
=
Need Weights
Academic Intervention*
DRA (K-3)
0 0
Achievement (4-12)
Well Below Standards X =
X =
X =
X =
X =
X =
=
Below Standards
High Achievement (Lvl 5)
English Language Learners
0-30 Months
Special Education
Level 1
XLevel 2
XLevel 3
XLevel 4
=
=
=
Total WSF FORMULA = 1,142,040
X
0 0X =Trans to Mainstream
2 1,686X =30 + Months
6,0001.26
5,5110.85
7,7791.20
6,4831.00
7,1321.10
8,4281.30
6270.10
6270.10
3140.05
6270.10
2,5930.40
1,6210.25
8430.13
4,6780.80
7,6001.30
13,9812.40
23,7354.07
Foundation = 265,000
Federal/State Categorical = 168,236
GRAND TOTAL ALL FUNDS FY = 1,613,016
154
$10,474
Total WSF = 1,407,040
Enrollment
Per Pupil Funding
Utilities = 37,740
Special Ed. Programs = 0
10/11
Other Programs = 0
ADOPTED BUDGET
32

Breakthrough II
09/10 10/11
Adopted Difference
FY FY 10/11FY
Adopted
$ FTE $FTE$ FTE
BUDGET FUND 1003
110 Certified Salaries $597,298 8.2 $722,905 9.4 $125,607 1.2
110 Part Time Certified Salaries $16,000 $17,940 $1,940 0.0
120 Non-Certified Salaries $220,808 7.0 $199,487 6.0 ($21,321) -1.0
120 Part Time Non-Certified Salaries $49,900 $55,500 $5,600 0.0
$884,006 15.2Total Salaries $995,832 15.4 $111,826 0.2
900 Fringe Benefits $277,836 $327,284 $49,449 0.0
$277,836Total Benefits $327,284 $49,449 0.0
324 Field Trips $1,150 $1,150 $0 0.0
325 Parent Activities $500 $500 $0 0.0
330 Other Prof. Tech Svs/MHIS $12,019 $13,398 $1,379 0.0
430 Maintenance Contracts $2,999 $6,000 $3,001 0.0
530 Communications $1,600 $700 ($900) 0.0
611 Supplies & Materials $149,273 $49,942 ($99,331) 0.0
620 Utilities $44,000 $37,740 ($6,260) 0.0
700 Equipment $20,000 $7,000 ($13,000) 0.0
899 Other Operating Exp. $5,233 $5,233 $0 0.0
$236,774Total Operating Expenses $121,663 ($115,111) 0.0
$1,398,616 15.2TOTAL BUDGET FUND $1,444,779 15.4 $46,164 0.21003
BUDGET FUND 2007
110 Certified Salaries $14,939 0.5 $76,077 1.5 $61,138 1.0
110 Part Time Certified Salaries $13,995 $5,000 0.0 ($8,995) 0.0
120 Non-Certified Salaries $0 0.0 $26,178 1.0 $26,178 1.0
$28,934 0.5Total Salaries $107,255 2.5 $78,321 2.0
900 Fringe Benefits $4,217 $36,544 $32,327 0.0
$4,217Total Benefits $36,544 $32,327 0.0
325 Parent Activities $874 $767 0.0 ($107) 0.0
611 Supplies & Materials $14,019 $23,671 0.0 $9,652 0.0
$14,893Total Operating Expenses $24,438 0.0 $9,545 0.0
$48,044 0.5TOTAL BUDGET FUND $168,237 2.5 $120,193 2.02007
$1,446,660 15.7GRAND TOTAL ALL FUNDS $1,613,016 17.9 $166,356 2.2
33

Breakthrough II
Certified Staff Enrollment Non-Certified Staff
STAFFING and ENROLLMENT
Adopted Actual Projected Adopted
09/10 10/11 09/10 10/11 09/10 10/11
Adopted Adopted
Principals 1.0 1.0 Clerical Support 1.0 1.0
Pre-K 44 44
Associate/Assistant Principal Paraprofessionals
K 22 22 Classroom 2.0
Dean Special Education
Teachers 1st 22 22 Other - Special Educ
Pre-K 1.0
Regular 2.0 5.0 2nd 21 22 Kindergarten
Associate Teacher 1.0 Other Para 3.0
Art 3rd 21 22
Business Prev/Interv Staff
Reading 4th 0 22
Foreign Language 0.5 0.7 CDA 2.0 2.0
Health 5th 0 0
Tech Comp Educ Family Resource Aides
Math 6th 0 0
Music School and Family Support
Science 7th 0 0
Social Studies Nurse 0.2 0.2
English 8th 0 0
Physical Education 0.3 0.5 Custodial Staff 0.8 0.8
Special Education 0.5 0.5 9th 0 0
Pre-K 1.7 1.5 Security
Kindergarten 1.0 10th 0 0
Bilingual Gym & Pool Asst
TESOL/ELL 11th 0 0
Speech 0.2 0.2 M&C Journeyman
Library Media 12th 0 0
Coach 0.5 1.5 Tech Support
Other
Other
Social Workers
Guidance Counselors
8.7 10.9 130 154 7.0 7.0Total Total Total
Adopted
Staffing Total 15.7 17.9
Adopted
34

This page intentionally left blank.
35

Latino Studies @ Burns
36 216,000
66 363,726
182 1,415,778
207 1,341,981
143 1,019,876
0 0
217 136,059
39 12,246
0 0
111 287,823
41 191,798
9 68,400
21 293,601
0 0
Grade Weights
Pre K
K
1-3
4-6
7-8
9-12
Weight Per Capita
Projected
Enrollment/
Hours $
X
X
X
X
X
=
=
=
=
=
Need Weights
Academic Intervention*
DRA (K-3)
100 62,700
Achievement (4-12)
Well Below Standards X =
X =
X =
X =
X =
X =
=
Below Standards
High Achievement (Lvl 5)
English Language Learners
0-30 Months
Special Education
Level 1
XLevel 2
XLevel 3
XLevel 4
=
=
=
Total WSF FORMULA = 5,531,898
X
5 8,105X =Trans to Mainstream
135 113,805X =30 + Months
6,0001.26
5,5110.85
7,7791.20
6,4831.00
7,1321.10
8,4281.30
6270.10
6270.10
3140.05
6270.10
2,5930.40
1,6210.25
8430.13
4,6780.80
7,6001.30
13,9812.40
23,7354.07
Foundation = 0
Federal/State Categorical = 344,621
GRAND TOTAL ALL FUNDS FY = 6,546,585
634
$10,326
Total WSF = 5,531,898
Enrollment
Per Pupil Funding
Utilities = 236,460
Special Ed. Programs = 429,606
10/11
Other Programs = 4,000
ADOPTED BUDGET
36

Latino Studies @ Burns
09/10 10/11
Adopted Difference
FY FY 10/11FY
Adopted
$ FTE $FTE$ FTE
BUDGET FUND 1003
110 Certified Salaries $3,177,225 45.3 $3,500,012 47.7 $322,787 2.4
110 Part Time Certified Salaries $68,757 $75,000 $6,243 0.0
120 Non-Certified Salaries $681,128 21.0 $751,656 21.5 $70,528 0.5
120 Part Time Non-Certified Salaries $30,219 $17,000 ($13,219) 0.0
$3,957,329 66.3Total Salaries $4,343,668 69.2 $386,339 2.9
900 Fringe Benefits $1,208,606 $1,463,626 $255,021 0.0
$1,208,606Total Benefits $1,463,626 $255,021 0.0
322 Instr. Impr. Services $5,000 $0 ($5,000) 0.0
324 Field Trips $8,000 $3,000 ($5,000) 0.0
330 Other Prof. Tech Svs/MHIS $52,059 $55,158 $3,099 0.0
430 Maintenance Contracts $16,678 $22,053 $5,375 0.0
530 Communications $4,000 $2,000 ($2,000) 0.0
580 Travel/Conferences & Seminars $5,000 $1,500 ($3,500) 0.0
611 Supplies & Materials $185,183 $65,498 ($119,685) 0.0
620 Utilities $199,376 $236,460 $37,084 0.0
700 Equipment $15,000 $5,000 ($10,000) 0.0
899 Other Operating Exp. $4,000 $4,000 $0 0.0
$494,296Total Operating Expenses $394,669 ($99,627) 0.0
$5,660,231 66.3TOTAL BUDGET FUND $6,201,963 69.2 $541,733 2.91003
BUDGET FUND 2007
110 Certified Salaries $137,321 1.7 $150,251 2.0 $12,930 0.3
110 Part Time Certified Salaries $20,000 $20,000 0.0 $0 0.0
120 Non-Certified Salaries $54,200 1.5 $41,878 1.0 ($12,322) -0.5
120 Part Time Non-Certified Salaries $15,000 $15,000 0.0 $0 0.0
$226,521 3.2Total Salaries $227,129 3.0 $608 -0.2
900 Fringe Benefits $66,129 $68,726 $2,596 0.0
$66,129Total Benefits $68,726 $2,596 0.0
325 Parent Activities $4,619 $4,942 0.0 $323 0.0
611 Supplies & Materials $66,696 $43,825 0.0 ($22,871) 0.0
$71,315Total Operating Expenses $48,767 0.0 ($22,548) 0.0
$363,965 3.2TOTAL BUDGET FUND $344,622 3.0 ($19,344) -0.22007
$6,024,196 69.5GRAND TOTAL ALL FUNDS $6,546,585 72.2 $522,389 2.7
37

Latino Studies @ Burns
Certified Staff Enrollment Non-Certified Staff
STAFFING and ENROLLMENT
Adopted Actual Projected Adopted
09/10 10/11 09/10 10/11 09/10 10/11
Adopted Adopted
Principals 1.0 1.0 Clerical Support 2.0 2.0
Pre-K 35 36
Associate/Assistant Principal Paraprofessionals
K 70 66 Classroom
Dean 1.0 1.0 Special Education
Teachers 1st 73 66 Other - Special Educ 4.0 7.0
Pre-K 1.5
Regular 12.0 12.0 2nd 59 66 Kindergarten
Associate Teacher 3.0 Other Para 6.5
Art 1.0 1.0 3rd 70 50
Business Prev/Interv Staff 1.0
Reading 2.0 4th 69 72
Foreign Language 2.0 2.0 CDA 1.0 2.0
Health 5th 76 66
Tech Comp Educ Family Resource Aides
Math 1.0 1.0 6th 67 69
Music 1.0 1.0 School and Family Support 1.0 1.0
Science 1.0 1.0 7th 83 66
Social Studies 1.0 Nurse 1.0 1.0
English 1.0 2.0 8th 0 77
Physical Education 1.5 2.0 Custodial Staff 5.0 5.0
Special Education 4.5 5.0 9th 0 0
Pre-K 1.0 Security 2.0 2.0
Kindergarten 3.0 3.0 10th 0 0
Bilingual 6.0 6.5 Gym & Pool Asst
TESOL/ELL 2.0 2.0 11th 0 0
Speech 1.0 1.2 M&C Journeyman
Library Media 1.0 1.0 12th 0 0
Coach 2.0 3.0 Tech Support
Other
Other
Social Workers 1.0 1.0
Guidance Counselors
47.0 49.7 602 634 22.5 22.5Total Total Total
Adopted
Staffing Total 69.5 72.2
Adopted
38

This page intentionally left blank.
39

Alfred E Burr Elementary
36 216,000
92 507,012
235 1,828,065
194 1,257,702
147 1,048,404
0 0
185 115,995
38 11,932
1 627
92 238,556
72 336,816
9 68,400
20 279,620
0 0
Grade Weights
Pre K
K
1-3
4-6
7-8
9-12
Weight Per Capita
Projected
Enrollment/
Hours $
X
X
X
X
X
=
=
=
=
=
Need Weights
Academic Intervention*
DRA (K-3)
50 31,350
Achievement (4-12)
Well Below Standards X =
X =
X =
X =
X =
X =
=
Below Standards
High Achievement (Lvl 5)
English Language Learners
0-30 Months
Special Education
Level 1
XLevel 2
XLevel 3
XLevel 4
=
=
=
Total WSF FORMULA = 6,046,240
X
20 32,420X =Trans to Mainstream
87 73,341X =30 + Months
6,0001.26
5,5110.85
7,7791.20
6,4831.00
7,1321.10
8,4281.30
6270.10
6270.10
3140.05
6270.10
2,5930.40
1,6210.25
8430.13
4,6780.80
7,6001.30
13,9812.40
23,7354.07
Foundation = 0
Federal/State Categorical = 374,524
GRAND TOTAL ALL FUNDS FY = 7,304,276
704
$10,375
Total WSF = 6,046,240
Enrollment
Per Pupil Funding
Utilities = 420,975
Special Ed. Programs = 462,537
10/11
Other Programs = 0
ADOPTED BUDGET
40

Alfred E Burr Elementary
09/10 10/11
Adopted Difference
FY FY 10/11FY
Adopted
$ FTE $FTE$ FTE
BUDGET FUND 1003
110 Certified Salaries $3,191,721 45.2 $3,743,334 51.1 $551,613 6.0
110 Part Time Certified Salaries $74,600 $85,000 $10,400 0.0
120 Non-Certified Salaries $749,814 23.0 $795,194 23.5 $45,380 0.5
120 Part Time Non-Certified Salaries $51,300 $15,800 ($35,500) 0.0
$4,067,435 68.2Total Salaries $4,639,328 74.6 $571,893 6.5
900 Fringe Benefits $1,249,854 $1,562,168 $312,314 0.0
$1,249,854Total Benefits $1,562,168 $312,314 0.0
330 Other Prof. Tech Svs/MHIS $58,281 $66,248 $7,967 0.0
430 Maintenance Contracts $16,678 $23,554 $6,876 0.0
530 Communications $3,005 $3,005 $0 0.0
611 Supplies & Materials $207,787 $184,474 ($23,313) 0.0
620 Utilities $391,244 $420,975 $29,731 0.0
700 Equipment $44,000 $21,000 ($23,000) 0.0
899 Other Operating Exp. $12,500 $9,000 ($3,500) 0.0
$733,495Total Operating Expenses $728,256 ($5,239) 0.0
$6,050,784 68.2TOTAL BUDGET FUND $6,929,752 74.6 $878,968 6.51003
BUDGET FUND 2007
110 Certified Salaries $128,327 2.4 $85,000 1.8 ($43,327) -0.6
110 Part Time Certified Salaries $69,750 $105,243 0.0 $35,493 0.0
120 Non-Certified Salaries $25,171 1.0 $46,000 2.0 $20,829 1.0
120 Part Time Non-Certified Salaries $0 $48,500 0.0 $48,500 0.0
$223,248 3.4Total Salaries $284,743 3.8 $61,495 0.4
900 Fringe Benefits $48,401 $54,071 $5,670 0.0
$48,401Total Benefits $54,071 $5,670 0.0
325 Parent Activities $4,811 $5,275 0.0 $464 0.0
611 Supplies & Materials $3,966 $0 0.0 ($3,966) 0.0
700 Equipment $0 $30,435 0.0 $30,435 0.0
$8,777Total Operating Expenses $35,710 0.0 $26,933 0.0
$280,426 3.4TOTAL BUDGET FUND $374,524 3.8 $94,098 0.42007
$6,331,210 71.5GRAND TOTAL ALL FUNDS $7,304,276 78.4 $973,066 6.9
41

Alfred E Burr Elementary
Certified Staff Enrollment Non-Certified Staff
STAFFING and ENROLLMENT
Adopted Actual Projected Adopted
09/10 10/11 09/10 10/11 09/10 10/11
Adopted Adopted
Principals 1.0 1.0 Clerical Support 2.0 2.0
Pre-K 40 36
Associate/Assistant Principal 1.0 1.0 Paraprofessionals
K 97 92 Classroom
Dean 1.0 Special Education 2.0
Teachers 1st 80 92 Other - Special Educ 8.0 6.0
Pre-K 1.0
Regular 16.0 17.0 2nd 63 80 Kindergarten 2.0
Associate Teacher 1.0 Other Para 3.0
Art 1.0 1.5 3rd 52 63
Business Prev/Interv Staff 2.0 1.0
Reading 0.5 1.0 4th 48 50
Foreign Language CDA 2.0 2.0
Health 5th 65 75
Tech Comp Educ Family Resource Aides 1.0 1.0
Math 1.0 1.0 6th 54 69
Music 1.5 1.5 School and Family Support
Science 1.0 1.0 7th 72 75
Social Studies 1.0 1.0 Nurse 1.0 1.0
English 2.0 2.0 8th 50 72
Physical Education 2.0 2.0 Custodial Staff 3.0 4.0
Special Education 7.0 7.0 9th 0 0
Pre-K 0.5 1.0 Security 2.0 3.0
Kindergarten 4.0 4.0 10th 0 0
Bilingual Gym & Pool Asst
TESOL/ELL 2.0 3.0 11th 0 0
Speech 1.0 1.4 M&C Journeyman
Library Media 1.0 1.0 12th 0 0
Coach 2.0 3.0 Tech Support 0.5
Other
Other
Social Workers 1.0 1.5
Guidance Counselors
47.5 52.9 621 704 24.0 25.5Total Total Total
Adopted
Staffing Total 71.5 78.4
Adopted
42

This page intentionally left blank.
43

John C Clark
18 108,000
46 253,506
152 1,182,408
128 829,824
84 599,088
0 0
103 64,581
35 10,990
0 0
13 33,709
36 168,408
5 38,000
7 97,867
0 0
Grade Weights
Pre K
K
1-3
4-6
7-8
9-12
Weight Per Capita
Projected
Enrollment/
Hours $
X
X
X
X
X
=
=
=
=
=
Need Weights
Academic Intervention*
DRA (K-3)
42 26,334
Achievement (4-12)
Well Below Standards X =
X =
X =
X =
X =
X =
=
Below Standards
High Achievement (Lvl 5)
English Language Learners
0-30 Months
Special Education
Level 1
XLevel 2
XLevel 3
XLevel 4
=
=
=
Total WSF FORMULA = 3,437,032
X
2 3,242X =Trans to Mainstream
25 21,075X =30 + Months
6,0001.26
5,5110.85
7,7791.20
6,4831.00
7,1321.10
8,4281.30
6270.10
6270.10
3140.05
6270.10
2,5930.40
1,6210.25
8430.13
4,6780.80
7,6001.30
13,9812.40
23,7354.07
Foundation = 0
Federal/State Categorical = 243,063
GRAND TOTAL ALL FUNDS FY = 4,912,277
428
$11,477
Total WSF = 3,437,032
Enrollment
Per Pupil Funding
Utilities = 246,314
Special Ed. Programs = 985,868
10/11
Other Programs = 0
ADOPTED BUDGET
44

John C Clark
09/10 10/11
Adopted Difference
FY FY 10/11FY
Adopted
$ FTE $FTE$ FTE
BUDGET FUND 1003
110 Certified Salaries $2,357,848 32.5 $2,373,944 32.4 $16,096 -0.1
110 Part Time Certified Salaries $40,997 $28,000 ($12,997) 0.0
120 Non-Certified Salaries $798,911 26.3 $687,618 21.4 ($111,293) -4.8
120 Part Time Non-Certified Salaries $8,578 $5,000 ($3,578) 0.0
$3,206,334 58.8Total Salaries $3,094,562 53.8 ($111,772) -4.9
900 Fringe Benefits $1,045,292 $1,078,070 $32,778 0.0
$1,045,292Total Benefits $1,078,070 $32,778 0.0
330 Other Prof. Tech Svs/MHIS $33,495 $37,236 $3,741 0.0
430 Maintenance Contracts $11,656 $11,656 $0 0.0
530 Communications $1,100 $2,000 $900 0.0
611 Supplies & Materials $24,730 $28,194 $3,464 0.0
620 Utilities $346,610 $246,314 ($100,296) 0.0
$417,591Total Operating Expenses $325,400 ($92,191) 0.0
$4,669,217 58.8TOTAL BUDGET FUND $4,498,032 53.8 ($171,185) -4.91003
BUDGET FUND 2007
110 Certified Salaries $194,805 3.0 $222,974 3.0 $28,169 0.0
110 Part Time Certified Salaries $37,659 $15,000 0.0 ($22,659) 0.0
120 Non-Certified Salaries $29,974 1.3 $67,822 1.6 $37,848 0.4
$262,438 4.3Total Salaries $305,796 4.6 $43,358 0.4
900 Fringe Benefits $68,261 $102,813 $34,552 0.0
$68,261Total Benefits $102,813 $34,552 0.0
325 Parent Activities $3,993 $3,607 0.0 ($386) 0.0
611 Supplies & Materials $3,543 $2,029 0.0 ($1,514) 0.0
$7,536Total Operating Expenses $5,636 0.0 ($1,900) 0.0
$338,235 4.3TOTAL BUDGET FUND $414,245 4.6 $76,010 0.42007
$5,007,452 63.0GRAND TOTAL ALL FUNDS $4,912,277 58.4 ($95,175) -4.6
45

John C Clark
Certified Staff Enrollment Non-Certified Staff
STAFFING and ENROLLMENT
Adopted Actual Projected Adopted
09/10 10/11 09/10 10/11 09/10 10/11
Adopted Adopted
Principals 1.0 1.0 Clerical Support 2.0 2.0
Pre-K 15 18
Associate/Assistant Principal 1.0 Paraprofessionals
K 50 46 Classroom
Dean Special Education
Teachers 1st 56 54 Other - Special Educ 16.0 12.0
Pre-K
Regular 13.0 13.0 2nd 38 60 Kindergarten 1.0
Associate Teacher Other Para 2.5
Art 1.0 1.0 3rd 47 38
Business Prev/Interv Staff 1.0
Reading 4th 42 46
Foreign Language CDA 1.0 1.0
Health 5th 45 42
Tech Comp Educ Family Resource Aides 1.0 1.0
Math 1.0 1.0 6th 38 40
Music 0.5 1.0 School and Family Support
Science 1.0 1.0 7th 44 38
Social Studies 1.0 1.0 Nurse 1.0 1.0
English 1.0 1.0 8th 34 46
Physical Education 1.5 1.5 Custodial Staff 3.0 3.0
Special Education 5.5 6.5 9th 0 0
Pre-K 0.5 0.5 Security 1.0 1.0
Kindergarten 3.0 2.0 10th 0 0
Bilingual Gym & Pool Asst
TESOL/ELL 0.5 0.5 11th 0 0
Speech 1.0 1.4 M&C Journeyman
Library Media 0.5 0.5 12th 0 0
Coach 2.0 2.0 Tech Support
Other
Other
Social Workers 0.5 0.5
Guidance Counselors
35.5 35.4 409 428 27.5 23.0Total Total Total
Adopted
Staffing Total 63.0 58.4
Adopted
46

This page intentionally left blank.
47

Dwight/Bellizzi
36 216,000
69 380,259
185 1,439,115
146 946,518
240 1,711,680
0 0
145 90,915
60 18,840
2 1,254
146 378,578
70 327,460
9 68,400
16 223,696
0 0
Grade Weights
Pre K
K
1-3
4-6
7-8
9-12
Weight Per Capita
Projected
Enrollment/
Hours $
X
X
X
X
X
=
=
=
=
=
Need Weights
Academic Intervention*
DRA (K-3)
68 42,636
Achievement (4-12)
Well Below Standards X =
X =
X =
X =
X =
X =
=
Below Standards
High Achievement (Lvl 5)
English Language Learners
0-30 Months
Special Education
Level 1
XLevel 2
XLevel 3
XLevel 4
=
=
=
Total WSF FORMULA = 5,981,718
X
29 47,009X =Trans to Mainstream
106 89,358X =30 + Months
6,0001.26
5,5110.85
7,7791.20
6,4831.00
7,1321.10
8,4281.30
6270.10
6270.10
3140.05
6270.10
2,5930.40
1,6210.25
8430.13
4,6780.80
7,6001.30
13,9812.40
23,7354.07
Foundation = 265,000
Federal/State Categorical = 424,184
GRAND TOTAL ALL FUNDS FY = 7,336,679
676
$10,853
Total WSF = 6,246,718
Enrollment
Per Pupil Funding
Utilities = 395,781
Special Ed. Programs = 269,996
10/11
Other Programs = 0
ADOPTED BUDGET
48

Dwight/Bellizzi
09/10 10/11
Adopted Difference
FY FY 10/11FY
Adopted
$ FTE $FTE$ FTE
BUDGET FUND 1003
110 Certified Salaries $4,398,294 61.9 $3,924,528 53.5 ($473,766) -8.4
110 Part Time Certified Salaries $124,714 $85,000 ($39,714) 0.0
120 Non-Certified Salaries $1,040,954 31.0 $766,390 20.8 ($274,564) -10.3
120 Part Time Non-Certified Salaries $40,517 $18,397 ($22,120) 0.0
$5,604,479 92.9Total Salaries $4,794,315 74.3 ($810,164) -18.6
900 Fringe Benefits $1,724,561 $1,605,231 ($119,330) 0.0
$1,724,561Total Benefits $1,605,231 ($119,330) 0.0
330 Other Prof. Tech Svs/MHIS $80,998 $58,812 ($22,186) 0.0
430 Maintenance Contracts $32,174 $31,930 ($244) 0.0
530 Communications $2,500 $0 ($2,500) 0.0
611 Supplies & Materials $216,031 $26,426 ($189,605) 0.0
620 Utilities $402,879 $395,781 ($7,098) 0.0
700 Equipment $800 $0 ($800) 0.0
899 Other Operating Exp. $2,280 $0 ($2,280) 0.0
$737,662Total Operating Expenses $512,949 ($224,713) 0.0
$8,066,702 92.9TOTAL BUDGET FUND $6,912,495 74.3 ($1,154,207) -18.61003
BUDGET FUND 2007
110 Certified Salaries $281,263 4.5 $263,795 4.0 ($17,468) -0.5
110 Part Time Certified Salaries $13,632 $0 0.0 ($13,632) 0.0
120 Non-Certified Salaries $80,732 3.0 $40,144 1.3 ($40,588) -1.8
120 Part Time Non-Certified Salaries $1,065 $0 0.0 ($1,065) 0.0
$376,692 7.5Total Salaries $303,939 5.3 ($72,753) -2.3
900 Fringe Benefits $117,254 $102,024 ($15,229) 0.0
$117,254Total Benefits $102,024 ($15,229) 0.0
325 Parent Activities $7,271 $6,745 0.0 ($526) 0.0
611 Supplies & Materials $11,869 $11,476 0.0 ($393) 0.0
$19,140Total Operating Expenses $18,221 0.0 ($919) 0.0
$513,086 7.5TOTAL BUDGET FUND $424,184 5.3 ($88,901) -2.32007
$8,579,788 100.4GRAND TOTAL ALL FUNDS $7,336,679 79.5 ($1,243,108) -20.9
49

Dwight/Bellizzi
Certified Staff Enrollment Non-Certified Staff
STAFFING and ENROLLMENT
Adopted Actual Projected Adopted
09/10 10/11 09/10 10/11 09/10 10/11
Adopted Adopted
Principals 1.0 1.0 Clerical Support 4.0 3.0
Pre-K 19 36
Associate/Assistant Principal 2.0 1.0 Paraprofessionals
K 87 69 Classroom
Dean Special Education
Teachers 1st 53 80 Other - Special Educ 7.0 4.0
Pre-K 0.5
Regular 17.0 17.0 2nd 58 51 Kindergarten 0.5
Associate Teacher Other Para 5.0
Art 0.6 1.5 3rd 63 54
Business Prev/Interv Staff 2.0 1.0
Reading 1.5 1.0 4th 52 60
Foreign Language 2.0 CDA 1.0 1.0
Health 1.0 5th 37 50
Tech Comp Educ 1.0 1.0 Family Resource Aides 2.0
Math 4.0 3.0 6th 72 36
Music 1.6 1.5 School and Family Support 1.0
Science 2.0 2.0 7th 169 72
Social Studies 2.0 2.0 Nurse 2.0 1.5
English 4.0 3.0 8th 153 168
Physical Education 1.8 1.5 Custodial Staff 7.0 6.0
Special Education 7.0 6.0 9th 0 0
Pre-K 1.0 1.0 Security 4.0 3.5
Kindergarten 4.0 3.0 10th 0 0
Bilingual 3.0 2.0 Gym & Pool Asst
TESOL/ELL 3.0 3.0 11th 0 0
Speech 1.4 1.0 M&C Journeyman
Library Media 2.0 1.0 12th 0 0
Coach 3.0 2.0 Tech Support
Other
Other
Social Workers 1.5 1.0
Guidance Counselors 1.0
66.4 57.5 763 676 34.0 22.0Total Total Total
Adopted
Staffing Total 100.4 79.5
Adopted
50

This page intentionally left blank.
51

Fisher STEM
0 0
20 110,220
59 458,961
97 628,851
47 335,204
0 0
29 18,183
16 5,024
3 1,881
0 0
36 168,408
5 38,000
3 41,943
0 0
Grade Weights
Pre K
K
1-3
4-6
7-8
9-12
Weight Per Capita
Projected
Enrollment/
Hours $
X
X
X
X
X
=
=
=
=
=
Need Weights
Academic Intervention*
DRA (K-3)
15 9,405
Achievement (4-12)
Well Below Standards X =
X =
X =
X =
X =
X =
=
Below Standards
High Achievement (Lvl 5)
English Language Learners
0-30 Months
Special Education
Level 1
XLevel 2
XLevel 3
XLevel 4
=
=
=
Total WSF FORMULA = 1,821,138
X
0 0X =Trans to Mainstream
6 5,058X =30 + Months
6,0001.26
5,5110.85
7,7791.20
6,4831.00
7,1321.10
8,4281.30
6270.10
6270.10
3140.05
6270.10
2,5930.40
1,6210.25
8430.13
4,6780.80
7,6001.30
13,9812.40
23,7354.07
Foundation = 0
Federal/State Categorical = 1,801,096
GRAND TOTAL ALL FUNDS FY = 4,013,003
360
$11,147
Total WSF = 1,821,138
Enrollment
Per Pupil Funding
Utilities = 151,357
Special Ed. Programs = 239,412
10/11
Other Programs = 0
ADOPTED BUDGET
52

Fisher STEM
09/10 10/11
Adopted Difference
FY FY 10/11FY
Adopted
$ FTE $FTE$ FTE
BUDGET FUND 1003
110 Certified Salaries $1,712,190 24.0 $1,080,579 14.4 ($631,611) -9.6
110 Part Time Certified Salaries $19,000 $12,000 ($7,000) 0.0
120 Non-Certified Salaries $410,815 12.0 $388,564 11.9 ($22,251) -0.1
120 Part Time Non-Certified Salaries $10,500 $4,500 ($6,000) 0.0
$2,152,505 36.0Total Salaries $1,485,643 26.3 ($666,862) -9.7
900 Fringe Benefits $672,864 $527,243 ($145,621) 0.0
$672,864Total Benefits $527,243 ($145,621) 0.0
330 Other Prof. Tech Svs/MHIS $25,612 $32,451 $6,839 0.0
430 Maintenance Contracts $19,269 $0 ($19,269) 0.0
530 Communications $1,000 $0 ($1,000) 0.0
611 Supplies & Materials $19,200 $15,213 ($3,987) 0.0
620 Utilities $238,934 $151,357 ($87,577) 0.0
$304,015Total Operating Expenses $199,021 ($104,994) 0.0
$3,129,384 36.0TOTAL BUDGET FUND $2,211,907 26.3 ($917,477) -9.71003
BUDGET FUND 2007
110 Certified Salaries $140,871 2.0 $1,006,689 15.8 $865,818 13.8
110 Part Time Certified Salaries $22,839 $40,847 0.0 $18,008 0.0
120 Non-Certified Salaries $53,789 2.0 $25,150 1.1 ($28,639) -0.9
120 Part Time Non-Certified Salaries $2,241 $6,000 0.0 $3,759 0.0
$219,740 4.0Total Salaries $1,078,686 16.9 $858,946 12.9
900 Fringe Benefits $65,938 $328,587 $262,649 0.0
$65,938Total Benefits $328,587 $262,649 0.0
325 Parent Activities $3,222 $7,281 0.0 $4,059 0.0
330 Other Prof. Tech Svs/MHIS $0 $30,000 0.0 $30,000 0.0
430 Maintenance Contracts $0 $18,495 0.0 $18,495 0.0
510 Transportation $30,000 0.0 $30,000 0.0
530 Communications $0 $9,000 0.0 $9,000 0.0
611 Supplies & Materials $6,466 $296,547 0.0 $290,081 0.0
899 Other Operating Exp. $2,500 0.0 $2,500 0.0
$9,688Total Operating Expenses $393,823 0.0 $384,135 0.0
$295,366 4.0TOTAL BUDGET FUND $1,801,096 16.9 $1,505,730 12.92007
$3,424,750 40.0GRAND TOTAL ALL FUNDS $4,013,003 43.2 $588,254 3.2
53

Fisher STEM
Certified Staff Enrollment Non-Certified Staff
STAFFING and ENROLLMENT
Adopted Actual Projected Adopted
09/10 10/11 09/10 10/11 09/10 10/11
Adopted Adopted
Principals 1.0 1.0 Clerical Support 2.0 1.0
Pre-K 0 0
Associate/Assistant Principal Paraprofessionals
K 0 37 Classroom 1.0
Dean Special Education
Teachers 1st 29 37 Other - Special Educ 6.0 6.0
Pre-K
Regular 12.0 12.0 2nd 28 35 Kindergarten 1.0
Associate Teacher Other Para 1.0
Art 0.5 1.0 3rd 45 38
Business Prev/Interv Staff
Reading 1.0 1.0 4th 32 64
Foreign Language CDA
Health 5th 33 46
Tech Comp Educ 1.0 1.0 Family Resource Aides 1.0 0.6
Math 1.0 1.0 6th 25 28
Music 0.5 1.0 School and Family Support
Science 1.0 1.0 7th 31 35
Social Studies 1.0 1.0 Nurse 1.0 0.6
English 1.0 1.0 8th 34 40
Physical Education 1.0 1.0 Custodial Staff 2.0 1.8
Special Education 2.5 2.4 9th 0 0
Pre-K Security 1.0 1.0
Kindergarten 2.0 10th 0 0
Bilingual Gym & Pool Asst
TESOL/ELL 11th 0 0
Speech 0.5 0.6 M&C Journeyman
Library Media 0.4 12th 0 0
Coach 1.0 2.0 Tech Support
Other
Other
Social Workers 1.0 0.8
Guidance Counselors
26.0 30.2 257 360 14.0 13.0Total Total Total
Adopted
Staffing Total 40.0 43.2
Adopted
54

This page intentionally left blank.
55

Comm Pact @ M.D. Fox
36 216,000
92 507,012
367 2,854,893
277 1,795,791
54 385,128
0 0
249 156,123
36 11,304
0 0
117 303,381
66 308,748
14 106,400
14 195,734
0 0
Grade Weights
Pre K
K
1-3
4-6
7-8
9-12
Weight Per Capita
Projected
Enrollment/
Hours $
X
X
X
X
X
=
=
=
=
=
Need Weights
Academic Intervention*
DRA (K-3)
47 29,469
Achievement (4-12)
Well Below Standards X =
X =
X =
X =
X =
X =
=
Below Standards
High Achievement (Lvl 5)
English Language Learners
0-30 Months
Special Education
Level 1
XLevel 2
XLevel 3
XLevel 4
=
=
=
Total WSF FORMULA = 6,974,836
X
21 34,041X =Trans to Mainstream
84 70,812X =30 + Months
6,0001.26
5,5110.85
7,7791.20
6,4831.00
7,1321.10
8,4281.30
6270.10
6270.10
3140.05
6270.10
2,5930.40
1,6210.25
8430.13
4,6780.80
7,6001.30
13,9812.40
23,7354.07
Foundation = 0
Federal/State Categorical = 467,023
GRAND TOTAL ALL FUNDS FY = 8,176,918
826
$9,899
Total WSF = 6,974,836
Enrollment
Per Pupil Funding
Utilities = 455,746
Special Ed. Programs = 279,313
10/11
Other Programs = 0
ADOPTED BUDGET
56
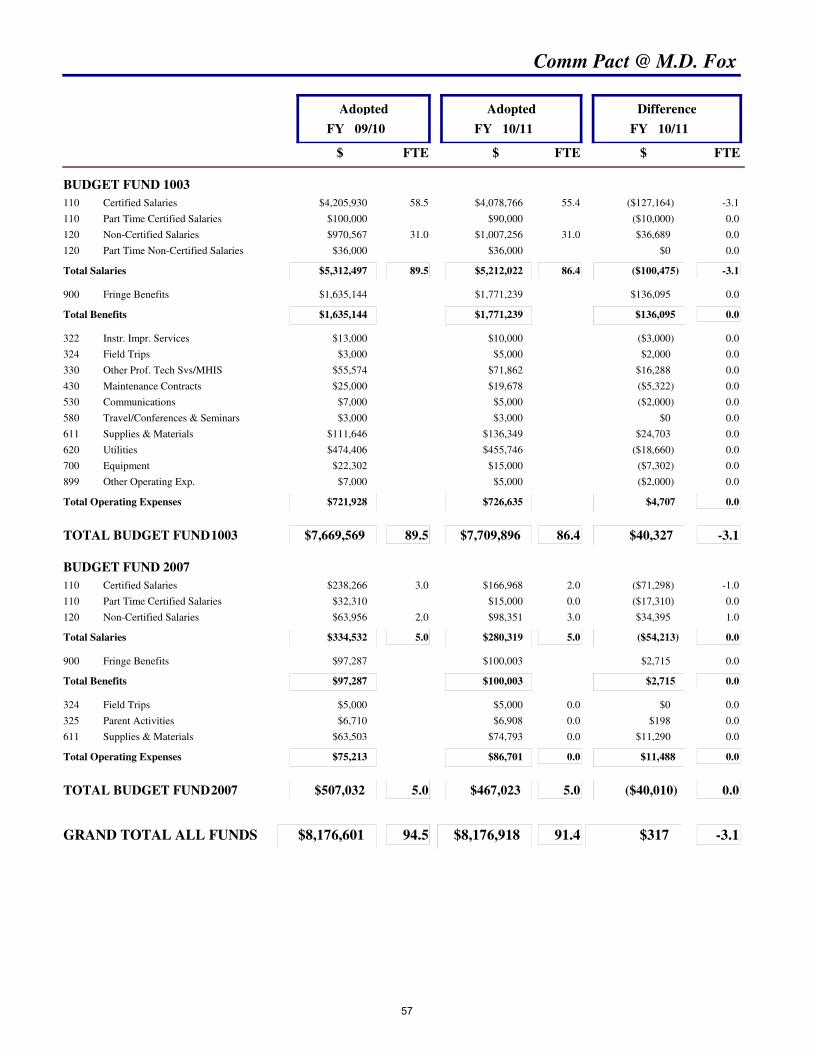
Comm Pact @ M.D. Fox
09/10 10/11
Adopted Difference
FY FY 10/11FY
Adopted
$ FTE $FTE$ FTE
BUDGET FUND 1003
110 Certified Salaries $4,205,930 58.5 $4,078,766 55.4 ($127,164) -3.1
110 Part Time Certified Salaries $100,000 $90,000 ($10,000) 0.0
120 Non-Certified Salaries $970,567 31.0 $1,007,256 31.0 $36,689 0.0
120 Part Time Non-Certified Salaries $36,000 $36,000 $0 0.0
$5,312,497 89.5Total Salaries $5,212,022 86.4 ($100,475) -3.1
900 Fringe Benefits $1,635,144 $1,771,239 $136,095 0.0
$1,635,144Total Benefits $1,771,239 $136,095 0.0
322 Instr. Impr. Services $13,000 $10,000 ($3,000) 0.0
324 Field Trips $3,000 $5,000 $2,000 0.0
330 Other Prof. Tech Svs/MHIS $55,574 $71,862 $16,288 0.0
430 Maintenance Contracts $25,000 $19,678 ($5,322) 0.0
530 Communications $7,000 $5,000 ($2,000) 0.0
580 Travel/Conferences & Seminars $3,000 $3,000 $0 0.0
611 Supplies & Materials $111,646 $136,349 $24,703 0.0
620 Utilities $474,406 $455,746 ($18,660) 0.0
700 Equipment $22,302 $15,000 ($7,302) 0.0
899 Other Operating Exp. $7,000 $5,000 ($2,000) 0.0
$721,928Total Operating Expenses $726,635 $4,707 0.0
$7,669,569 89.5TOTAL BUDGET FUND $7,709,896 86.4 $40,327 -3.11003
BUDGET FUND 2007
110 Certified Salaries $238,266 3.0 $166,968 2.0 ($71,298) -1.0
110 Part Time Certified Salaries $32,310 $15,000 0.0 ($17,310) 0.0
120 Non-Certified Salaries $63,956 2.0 $98,351 3.0 $34,395 1.0
$334,532 5.0Total Salaries $280,319 5.0 ($54,213) 0.0
900 Fringe Benefits $97,287 $100,003 $2,715 0.0
$97,287Total Benefits $100,003 $2,715 0.0
324 Field Trips $5,000 $5,000 0.0 $0 0.0
325 Parent Activities $6,710 $6,908 0.0 $198 0.0
611 Supplies & Materials $63,503 $74,793 0.0 $11,290 0.0
$75,213Total Operating Expenses $86,701 0.0 $11,488 0.0
$507,032 5.0TOTAL BUDGET FUND $467,023 5.0 ($40,010) 0.02007
$8,176,601 94.5GRAND TOTAL ALL FUNDS $8,176,918 91.4 $317 -3.1
57

Comm Pact @ M.D. Fox
Certified Staff Enrollment Non-Certified Staff
STAFFING and ENROLLMENT
Adopted Actual Projected Adopted
09/10 10/11 09/10 10/11 09/10 10/11
Adopted Adopted
Principals 1.0 1.0 Clerical Support 3.0 3.0
Pre-K 35 36
Associate/Assistant Principal 1.0 1.0 Paraprofessionals
K 135 92 Classroom 3.0
Dean Special Education
Teachers 1st 126 132 Other - Special Educ 8.0 7.0
Pre-K 1.0
Regular 21.0 21.0 2nd 122 115 Kindergarten 3.0
Associate Teacher Other Para 8.0 1.0
Art 2.0 2.0 3rd 118 120
Business Prev/Interv Staff 1.0 1.0
Reading 2.0 2.0 4th 98 115
Foreign Language CDA 2.0 4.0
Health 0.5 5th 106 96
Tech Comp Educ Family Resource Aides 1.0 1.0
Math 6th 65 66
Music 2.0 2.0 School and Family Support
Science 7th 0 54
Social Studies Nurse 1.0 1.0
English 8th 0 0
Physical Education 2.0 2.0 Custodial Staff 6.0 6.0
Special Education 5.0 5.0 9th 0 0
Pre-K 2.0 Security 3.0 3.0
Kindergarten 6.0 4.0 10th 0 0
Bilingual 9.0 9.0 Gym & Pool Asst
TESOL/ELL 2.0 2.0 11th 0 0
Speech 1.0 1.4 M&C Journeyman
Library Media 1.0 1.0 12th 0 0
Coach 2.0 2.0 Tech Support
Other
Other
Social Workers 2.0 2.0
Guidance Counselors
61.5 57.4 805 826 33.0 34.0Total Total Total
Adopted
Staffing Total 94.5 91.4
Adopted
58

This page intentionally left blank.
59

Global Communications Academy( IB)
0 0
65 358,215
264 2,053,656
66 427,878
88 627,616
0 0
132 82,764
16 5,024
2 1,254
11 28,523
18 84,204
5 38,000
12 167,772
0 0
Grade Weights
Pre K
K
1-3
4-6
7-8
9-12
Weight Per Capita
Projected
Enrollment/
Hours $
X
X
X
X
X
=
=
=
=
=
Need Weights
Academic Intervention*
DRA (K-3)
14 8,778
Achievement (4-12)
Well Below Standards X =
X =
X =
X =
X =
X =
=
Below Standards
High Achievement (Lvl 5)
English Language Learners
0-30 Months
Special Education
Level 1
XLevel 2
XLevel 3
XLevel 4
=
=
=
Total WSF FORMULA = 3,898,663
X
3 4,863X =Trans to Mainstream
12 10,116X =30 + Months
6,0001.26
5,5110.85
7,7791.20
6,4831.00
7,1321.10
8,4281.30
6270.10
6270.10
3140.05
6270.10
2,5930.40
1,6210.25
8430.13
4,6780.80
7,6001.30
13,9812.40
23,7354.07
Foundation = 0
Federal/State Categorical = 503,431
GRAND TOTAL ALL FUNDS FY = 4,855,465
483
$10,053
Total WSF = 3,898,663
Enrollment
Per Pupil Funding
Utilities = 174,056
Special Ed. Programs = 279,315
10/11
Other Programs = 0
ADOPTED BUDGET
60

Global Communications Academy( IB)
09/10 10/11
Adopted Difference
FY FY 10/11FY
Adopted
$ FTE $FTE$ FTE
BUDGET FUND 1003
110 Certified Salaries $2,243,881 31.1 $2,340,030 31.3 $96,149 0.2
110 Part Time Certified Salaries $21,972 $29,600 $7,628 0.0
120 Non-Certified Salaries $376,015 11.0 $662,714 19.5 $286,699 8.5
120 Part Time Non-Certified Salaries $17,000 $13,389 ($3,611) 0.0
$2,658,868 42.1Total Salaries $3,045,733 50.8 $386,865 8.7
900 Fringe Benefits $798,486 $1,055,717 $257,230 0.0
$798,486Total Benefits $1,055,717 $257,230 0.0
330 Other Prof. Tech Svs/MHIS $0 $42,021 $42,021 0.0
430 Maintenance Contracts $9,839 $17,126 $7,287 0.0
530 Communications $1,500 $1,500 $0 0.0
611 Supplies & Materials $68,514 $13,881 ($54,633) 0.0
620 Utilities $198,478 $174,056 ($24,422) 0.0
899 Other Operating Exp. $4,000 $2,000 ($2,000) 0.0
$282,331Total Operating Expenses $250,584 ($31,747) 0.0
$3,739,685 42.1TOTAL BUDGET FUND $4,352,034 50.8 $612,348 8.71003
BUDGET FUND 2007
110 Certified Salaries $22,821 0.5 $278,938 3.8 $256,117 3.3
110 Part Time Certified Salaries $0 $90,000 0.0 $90,000 0.0
120 Non-Certified Salaries $196,875 4.0 $0 0.0 ($196,875) -4.0
120 Part Time Non-Certified Salaries $0 $35,000 0.0 $35,000 0.0
$219,696 4.5Total Salaries $403,938 3.8 $184,242 -0.8
900 Fringe Benefits $107,090 $91,374 ($15,716) 0.0
$107,090Total Benefits $91,374 ($15,716) 0.0
324 Field Trips $4,000 $0 ($4,000) 0.0
325 Parent Activities $1,757 $3,382 0.0 $1,625 0.0
330 Other Prof. Tech Svs/MHIS $2,000 $0 0.0 ($2,000) 0.0
611 Supplies & Materials $35,690 $4,737 0.0 ($30,953) 0.0
$43,447Total Operating Expenses $8,119 0.0 ($35,328) 0.0
$370,233 4.5TOTAL BUDGET FUND $503,431 3.8 $133,198 -0.82007
$4,109,918 46.6GRAND TOTAL ALL FUNDS $4,855,465 54.6 $745,547 8.0
61

Global Communications Academy( IB)
Certified Staff Enrollment Non-Certified Staff
STAFFING and ENROLLMENT
Adopted Actual Projected Adopted
09/10 10/11 09/10 10/11 09/10 10/11
Adopted Adopted
Principals 1.0 1.0 Clerical Support 1.5 2.0
Pre-K 0
Associate/Assistant Principal 1.0 Paraprofessionals
K 84 65 Classroom
Dean 1.0 Special Education
Teachers 1st 97 88 Other - Special Educ 4.0 7.0
Pre-K
Regular 11.0 13.0 2nd 78 88 Kindergarten 1.5
Associate Teacher Other Para 2.0 1.0
Art 1.0 1.0 3rd 0 88
Business Prev/Interv Staff 1.0 1.0
Reading 1.0 4th 0 0
Foreign Language 1.0 1.4 CDA
Health 5th 63 0
Tech Comp Educ 0.5 Family Resource Aides
Math 1.0 1.0 6th 89 66
Music 1.0 1.0 School and Family Support
Science 1.0 1.0 7th 0 88
Social Studies 1.0 1.0 Nurse 0.5 1.0
English 1.0 1.0 8th 0 0
Physical Education 1.0 1.4 Custodial Staff 3.0 4.0
Special Education 3.0 3.0 9th 0 0
Pre-K Security 1.0 2.0
Kindergarten 4.0 3.0 10th 0 0
Bilingual Gym & Pool Asst
TESOL/ELL 0.5 0.5 11th 0 0
Speech 0.6 0.8 M&C Journeyman
Library Media 12th 0 0
Coach 0.5 Tech Support
Other
Other 2.0
Social Workers 2.0 2.5
Guidance Counselors
31.6 35.1 411 483 15.0 19.5Total Total Total
Adopted
Staffing Total 46.6 54.6
Adopted
62

This page intentionally left blank.
63

Mary Hooker
30 180,000
30 165,330
92 715,668
92 596,436
69 492,108
0 0
91 57,057
18 5,652
0 0
25 64,825
18 84,204
12 91,200
5 69,905
0 0
Grade Weights
Pre K
K
1-3
4-6
7-8
9-12
Weight Per Capita
Projected
Enrollment/
Hours $
X
X
X
X
X
=
=
=
=
=
Need Weights
Academic Intervention*
DRA (K-3)
17 10,659
Achievement (4-12)
Well Below Standards X =
X =
X =
X =
X =
X =
=
Below Standards
High Achievement (Lvl 5)
English Language Learners
0-30 Months
Special Education
Level 1
XLevel 2
XLevel 3
XLevel 4
=
=
=
Total WSF FORMULA = 2,596,720
X
19 30,799X =Trans to Mainstream
39 32,877X =30 + Months
6,0001.26
5,5110.85
7,7791.20
6,4831.00
7,1321.10
8,4281.30
6270.10
6270.10
3140.05
6270.10
2,5930.40
1,6210.25
8430.13
4,6780.80
7,6001.30
13,9812.40
23,7354.07
Foundation = 265,000
Federal/State Categorical = 196,981
GRAND TOTAL ALL FUNDS FY = 3,605,826
313
$11,520
Total WSF = 2,861,720
Enrollment
Per Pupil Funding
Utilities = 184,254
Special Ed. Programs = 119,706
10/11
Other Programs = 243,165
ADOPTED BUDGET
64

Mary Hooker
09/10 10/11
Adopted Difference
FY FY 10/11FY
Adopted
$ FTE $FTE$ FTE
BUDGET FUND 1003
110 Certified Salaries $2,124,486 28.9 $1,821,704 24.6 ($302,782) -4.3
110 Part Time Certified Salaries $26,658 $42,958 $16,300 0.0
120 Non-Certified Salaries $330,400 9.0 $479,265 13.6 $148,865 4.6
120 Part Time Non-Certified Salaries $641 $0 ($641) 0.0
$2,482,185 37.9Total Salaries $2,343,927 38.3 ($138,258) 0.3
900 Fringe Benefits $742,367 $803,321 $60,954 0.0
$742,367Total Benefits $803,321 $60,954 0.0
322 Instr. Impr. Services $11,656 $0 ($11,656) 0.0
330 Other Prof. Tech Svs/MHIS $22,598 $27,231 $4,633 0.0
430 Maintenance Contracts $13,656 $13,656 0.0
530 Communications $1,000 $1,000 $0 0.0
611 Supplies & Materials $11,148 $35,455 $24,307 0.0
620 Utilities $277,000 $184,254 ($92,746) 0.0
899 Other Operating Exp. $311 $0 ($311) 0.0
$323,713Total Operating Expenses $261,596 ($62,117) 0.0
$3,548,265 37.9TOTAL BUDGET FUND $3,408,844 38.3 ($139,421) 0.31003
BUDGET FUND 2007
110 Certified Salaries $70,040 1.0 $88,346 1.0 $18,306 0.0
110 Part Time Certified Salaries $8,267 $4,453 0.0 ($3,814) 0.0
120 Non-Certified Salaries $74,925 3.0 $36,726 1.3 ($38,199) -1.7
120 Part Time Non-Certified Salaries $0 $16,822 0.0 $16,822 0.0
$153,232 4.0Total Salaries $146,347 2.3 ($6,885) -1.7
900 Fringe Benefits $57,361 $46,758 ($10,603) 0.0
$57,361Total Benefits $46,758 ($10,603) 0.0
325 Parent Activities $3,488 $3,488 0.0 $0 0.0
611 Supplies & Materials $32,622 $389 0.0 ($32,233) 0.0
$36,110Total Operating Expenses $3,877 0.0 ($32,233) 0.0
$246,703 4.0TOTAL BUDGET FUND $196,982 2.3 ($49,721) -1.72007
$3,794,968 41.9GRAND TOTAL ALL FUNDS $3,605,826 40.6 ($189,142) -1.3
65

Mary Hooker
Certified Staff Enrollment Non-Certified Staff
STAFFING and ENROLLMENT
Adopted Actual Projected Adopted
09/10 10/11 09/10 10/11 09/10 10/11
Adopted Adopted
Principals 1.0 1.0 Clerical Support 2.0 2.0
Pre-K 0 30
Associate/Assistant Principal 1.0 Paraprofessionals
K 37 30 Classroom
Dean Special Education
Teachers 1st 46 30 Other - Special Educ 3.0 3.0
Pre-K 3.0
Regular 12.0 10.0 2nd 42 30 Kindergarten
Associate Teacher Other Para 2.0
Art 0.8 0.8 3rd 44 32
Business Prev/Interv Staff
Reading 4th 39 31
Foreign Language CDA 2.0
Health 5th 31 30
Tech Comp Educ Family Resource Aides 1.0
Math 1.0 1.0 6th 36 31
Music 1.0 1.0 School and Family Support
Science 1.0 1.0 7th 40 35
Social Studies 1.0 1.0 Nurse 1.0 1.0
English 1.0 1.0 8th 30 34
Physical Education 1.0 1.0 Custodial Staff 2.0 3.0
Special Education 2.0 2.0 9th 0 0
Pre-K Security 1.0 1.0
Kindergarten 2.0 2.0 10th 0 0
Bilingual 0.5 0.5 Gym & Pool Asst
TESOL/ELL 1.0 1.0 11th 0 0
Speech 0.8 0.8 M&C Journeyman
Library Media 0.8 0.5 12th 0 0
Coach 1.0 Tech Support
Other
Other
Social Workers 1.0 1.0
Guidance Counselors
29.9 25.6 345 313 12.0 15.0Total Total Total
Adopted
Staffing Total 41.9 40.6
Adopted
66

This page intentionally left blank.
67

Eleanor B Kennelly Elementary
18 108,000
80 440,880
233 1,812,507
288 1,867,104
156 1,112,592
0 0
187 117,249
72 22,608
7 4,389
92 238,556
41 191,798
31 235,600
8 111,848
0 0
Grade Weights
Pre K
K
1-3
4-6
7-8
9-12
Weight Per Capita
Projected
Enrollment/
Hours $
X
X
X
X
X
=
=
=
=
=
Need Weights
Academic Intervention*
DRA (K-3)
49 30,723
Achievement (4-12)
Well Below Standards X =
X =
X =
X =
X =
X =
=
Below Standards
High Achievement (Lvl 5)
English Language Learners
0-30 Months
Special Education
Level 1
XLevel 2
XLevel 3
XLevel 4
=
=
=
Total WSF FORMULA = 6,375,883
X
9 14,589X =Trans to Mainstream
80 67,440X =30 + Months
6,0001.26
5,5110.85
7,7791.20
6,4831.00
7,1321.10
8,4281.30
6270.10
6270.10
3140.05
6270.10
2,5930.40
1,6210.25
8430.13
4,6780.80
7,6001.30
13,9812.40
23,7354.07
Foundation = 0
Federal/State Categorical = 458,738
GRAND TOTAL ALL FUNDS FY = 7,469,184
775
$9,638
Total WSF = 6,375,883
Enrollment
Per Pupil Funding
Utilities = 223,969
Special Ed. Programs = 410,594
10/11
Other Programs = 0
ADOPTED BUDGET
68

Eleanor B Kennelly Elementary
09/10 10/11
Adopted Difference
FY FY 10/11FY
Adopted
$ FTE $FTE$ FTE
BUDGET FUND 1003
110 Certified Salaries $4,100,828 57.5 $3,892,004 52.7 ($208,824) -4.8
110 Part Time Certified Salaries $159,000 $96,388 ($62,612) 0.0
120 Non-Certified Salaries $795,634 24.8 $716,768 21.5 ($78,866) -3.3
120 Part Time Non-Certified Salaries $28,894 $23,894 ($5,000) 0.0
$5,084,356 82.3Total Salaries $4,729,054 74.2 ($355,302) -8.0
900 Fringe Benefits $1,518,129 $1,571,674 $53,545 0.0
$1,518,129Total Benefits $1,571,674 $53,545 0.0
322 Instr. Impr. Services $5,000 $2,000 ($3,000) 0.0
330 Other Prof. Tech Svs/MHIS $38,698 $101,118 $62,420 0.0
430 Maintenance Contracts $26,153 $14,591 ($11,562) 0.0
450 Improvement to Facilities $8,175 $5,000 ($3,175) 0.0
530 Communications $1,500 $2,000 $500 0.0
580 Travel/Conferences & Seminars $500 $0 ($500) 0.0
611 Supplies & Materials $85,736 $187,859 $102,123 0.0
620 Utilities $189,624 $223,969 $34,345 0.0
700 Equipment $10,950 $2,000 ($8,950) 0.0
899 Other Operating Exp. $3,500 $0 ($3,500) 0.0
$369,836Total Operating Expenses $538,537 $168,701 0.0
$6,972,321 82.3TOTAL BUDGET FUND $6,839,265 74.2 ($133,056) -8.01003
BUDGET FUND 2007
110 Certified Salaries $132,456 2.0 $289,652 4.0 $157,196 2.0
110 Part Time Certified Salaries $93,813 $65,444 0.0 ($28,369) 0.0
120 Non-Certified Salaries $102,745 3.3 $118,517 3.0 $15,772 -0.3
$329,014 5.3Total Salaries $473,613 7.0 $144,599 1.8
900 Fringe Benefits $89,639 $148,905 $59,266 0.0
$89,639Total Benefits $148,905 $59,266 0.0
325 Parent Activities $7,401 $7,401 0.0 $0 0.0
611 Supplies & Materials $3,024 $0 0.0 ($3,024) 0.0
$10,425Total Operating Expenses $7,401 0.0 ($3,024) 0.0
$429,078 5.3TOTAL BUDGET FUND $629,919 7.0 $200,841 1.82007
$7,401,399 87.5GRAND TOTAL ALL FUNDS $7,469,184 81.2 $67,785 -6.3
69

Eleanor B Kennelly Elementary
Certified Staff Enrollment Non-Certified Staff
STAFFING and ENROLLMENT
Adopted Actual Projected Adopted
09/10 10/11 09/10 10/11 09/10 10/11
Adopted Adopted
Principals 1.0 1.0 Clerical Support 3.0 2.0
Pre-K 16 18
Associate/Assistant Principal 1.0 1.0 Paraprofessionals
K 69 80 Classroom
Dean Special Education 2.0
Teachers 1st 93 72 Other - Special Educ 6.0 6.0
Pre-K 0.5
Regular 24.0 23.0 2nd 66 92 Kindergarten 1.0
Associate Teacher Other Para 8.0
Art 2.0 1.0 3rd 98 69
Business Prev/Interv Staff 1.0 3.0
Reading 1.0 2.0 4th 102 96
Foreign Language CDA 1.0 2.0
Health 1.0 5th 105 96
Tech Comp Educ Family Resource Aides 1.0 1.0
Math 2.0 2.0 6th 77 96
Music 2.0 2.0 School and Family Support
Science 2.0 2.0 7th 72 78
Social Studies 2.0 1.0 Nurse 1.0 1.0
English 2.0 2.0 8th 90 78
Physical Education 2.0 2.0 Custodial Staff 5.0 4.0
Special Education 4.0 6.0 9th 0 0
Pre-K 1.0 Security 2.0 2.0
Kindergarten 4.0 4.0 10th 0 0
Bilingual Gym & Pool Asst
TESOL/ELL 2.0 2.0 11th 0 0
Speech 1.0 1.2 M&C Journeyman
Library Media 1.0 1.0 12th 0 0
Coach 1.0 1.0 Tech Support
Other 0.5 0.5
Other
Social Workers 2.0 2.0
Guidance Counselors 1.0
59.5 56.7 788 775 28.0 24.5Total Total Total
Adopted
Staffing Total 87.5 81.2
Adopted
70

This page intentionally left blank.
71

M L King Jr Elementary
0 0
46 253,506
178 1,384,662
181 1,173,423
102 727,464
0 0
143 89,661
23 7,222
0 0
6 15,558
52 243,256
7 53,200
13 181,753
0 0
Grade Weights
Pre K
K
1-3
4-6
7-8
9-12
Weight Per Capita
Projected
Enrollment/
Hours $
X
X
X
X
X
=
=
=
=
=
Need Weights
Academic Intervention*
DRA (K-3)
38 23,826
Achievement (4-12)
Well Below Standards X =
X =
X =
X =
X =
X =
=
Below Standards
High Achievement (Lvl 5)
English Language Learners
0-30 Months
Special Education
Level 1
XLevel 2
XLevel 3
XLevel 4
=
=
=
Total WSF FORMULA = 4,165,138
X
3 4,863X =Trans to Mainstream
8 6,744X =30 + Months
6,0001.26
5,5110.85
7,7791.20
6,4831.00
7,1321.10
8,4281.30
6270.10
6270.10
3140.05
6270.10
2,5930.40
1,6210.25
8430.13
4,6780.80
7,6001.30
13,9812.40
23,7354.07
Foundation = 0
Federal/State Categorical = 288,545
GRAND TOTAL ALL FUNDS FY = 5,013,115
507
$9,888
Total WSF = 4,165,138
Enrollment
Per Pupil Funding
Utilities = 399,823
Special Ed. Programs = 159,609
10/11
Other Programs = 0
ADOPTED BUDGET
72
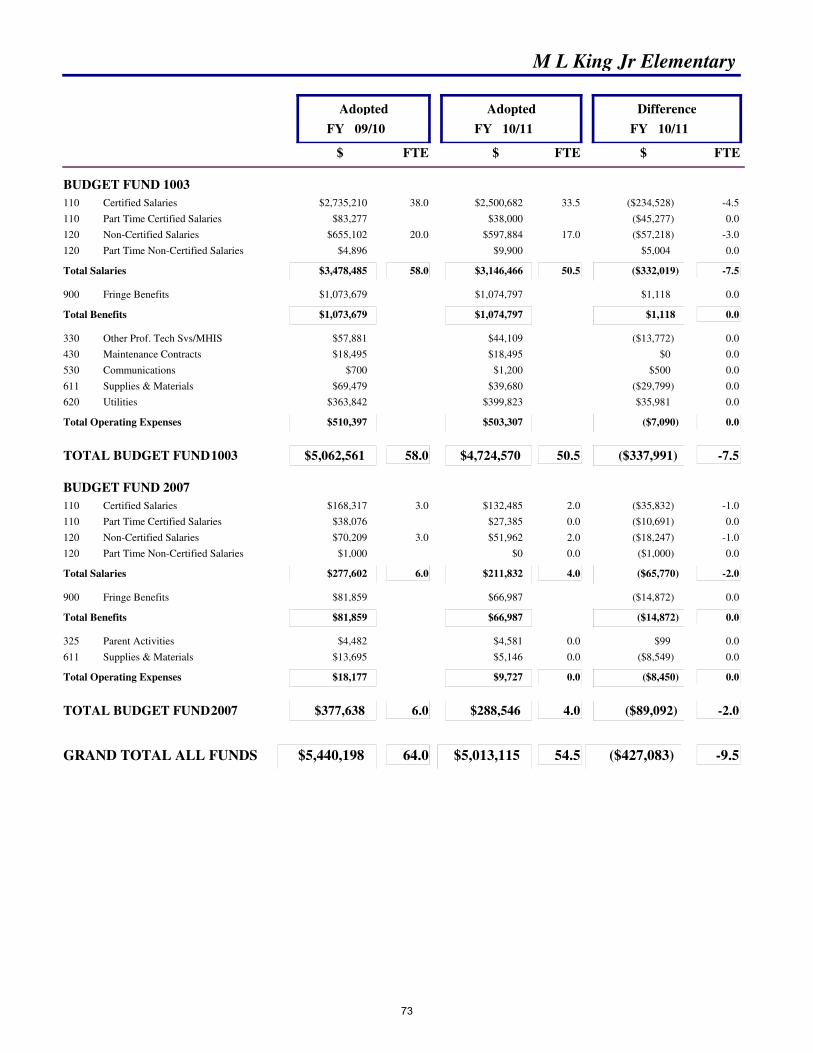
M L King Jr Elementary
09/10 10/11
Adopted Difference
FY FY 10/11FY
Adopted
$ FTE $FTE$ FTE
BUDGET FUND 1003
110 Certified Salaries $2,735,210 38.0 $2,500,682 33.5 ($234,528) -4.5
110 Part Time Certified Salaries $83,277 $38,000 ($45,277) 0.0
120 Non-Certified Salaries $655,102 20.0 $597,884 17.0 ($57,218) -3.0
120 Part Time Non-Certified Salaries $4,896 $9,900 $5,004 0.0
$3,478,485 58.0Total Salaries $3,146,466 50.5 ($332,019) -7.5
900 Fringe Benefits $1,073,679 $1,074,797 $1,118 0.0
$1,073,679Total Benefits $1,074,797 $1,118 0.0
330 Other Prof. Tech Svs/MHIS $57,881 $44,109 ($13,772) 0.0
430 Maintenance Contracts $18,495 $18,495 $0 0.0
530 Communications $700 $1,200 $500 0.0
611 Supplies & Materials $69,479 $39,680 ($29,799) 0.0
620 Utilities $363,842 $399,823 $35,981 0.0
$510,397Total Operating Expenses $503,307 ($7,090) 0.0
$5,062,561 58.0TOTAL BUDGET FUND $4,724,570 50.5 ($337,991) -7.51003
BUDGET FUND 2007
110 Certified Salaries $168,317 3.0 $132,485 2.0 ($35,832) -1.0
110 Part Time Certified Salaries $38,076 $27,385 0.0 ($10,691) 0.0
120 Non-Certified Salaries $70,209 3.0 $51,962 2.0 ($18,247) -1.0
120 Part Time Non-Certified Salaries $1,000 $0 0.0 ($1,000) 0.0
$277,602 6.0Total Salaries $211,832 4.0 ($65,770) -2.0
900 Fringe Benefits $81,859 $66,987 ($14,872) 0.0
$81,859Total Benefits $66,987 ($14,872) 0.0
325 Parent Activities $4,482 $4,581 0.0 $99 0.0
611 Supplies & Materials $13,695 $5,146 0.0 ($8,549) 0.0
$18,177Total Operating Expenses $9,727 0.0 ($8,450) 0.0
$377,638 6.0TOTAL BUDGET FUND $288,546 4.0 ($89,092) -2.02007
$5,440,198 64.0GRAND TOTAL ALL FUNDS $5,013,115 54.5 ($427,083) -9.5
73

M L King Jr Elementary
Certified Staff Enrollment Non-Certified Staff
STAFFING and ENROLLMENT
Adopted Actual Projected Adopted
09/10 10/11 09/10 10/11 09/10 10/11
Adopted Adopted
Principals 1.0 1.0 Clerical Support 2.0 2.0
Pre-K 9 0
Associate/Assistant Principal 1.0 1.0 Paraprofessionals
K 46 46 Classroom
Dean Special Education 4.0
Teachers 1st 70 46 Other - Special Educ 5.0 1.0
Pre-K
Regular 20.0 15.0 2nd 66 66 Kindergarten 1.0
Associate Teacher Other Para 6.0 1.0
Art 1.0 1.0 3rd 80 66
Business Prev/Interv Staff 1.0
Reading 1.0 1.0 4th 72 75
Foreign Language CDA 1.0
Health 0.5 5th 62 54
Tech Comp Educ Family Resource Aides 1.0 1.0
Math 0.5 1.0 6th 63 52
Music 1.0 1.0 School and Family Support
Science 0.5 1.0 7th 44 54
Social Studies 0.5 1.0 Nurse 1.0 1.0
English 0.5 1.0 8th 0 48
Physical Education 1.5 1.5 Custodial Staff 5.0 5.0
Special Education 4.0 4.0 9th 0 0
Pre-K 1.0 Security 2.0 2.0
Kindergarten 3.0 2.0 10th 0 0
Bilingual Gym & Pool Asst
TESOL/ELL 11th 0 0
Speech 1.0 1.0 M&C Journeyman
Library Media 1.0 1.0 12th 0 0
Coach 1.0 1.0 Tech Support
Other
Other
Social Workers 1.0 1.0
Guidance Counselors
41.0 35.5 512 507 23.0 19.0Total Total Total
Adopted
Staffing Total 64.0 54.5
Adopted
74

This page intentionally left blank.
75

R J Kinsella Magnet of Performing Arts
30 180,000
29 159,819
95 739,005
113 732,579
73 520,636
0 0
64 40,128
33 10,362
0 0
13 33,709
37 173,086
4 30,400
4 55,924
0 0
Grade Weights
Pre K
K
1-3
4-6
7-8
9-12
Weight Per Capita
Projected
Enrollment/
Hours $
X
X
X
X
X
=
=
=
=
=
Need Weights
Academic Intervention*
DRA (K-3)
22 13,794
Achievement (4-12)
Well Below Standards X =
X =
X =
X =
X =
X =
=
Below Standards
High Achievement (Lvl 5)
English Language Learners
0-30 Months
Special Education
Level 1
XLevel 2
XLevel 3
XLevel 4
=
=
=
Total WSF FORMULA = 2,733,601
X
8 12,968X =Trans to Mainstream
37 31,191X =30 + Months
6,0001.26
5,5110.85
7,7791.20
6,4831.00
7,1321.10
8,4281.30
6270.10
6270.10
3140.05
6270.10
2,5930.40
1,6210.25
8430.13
4,6780.80
7,6001.30
13,9812.40
23,7354.07
Foundation = 0
Federal/State Categorical = 4,332,882
GRAND TOTAL ALL FUNDS FY = 7,501,870
669
$11,214
Total WSF = 2,733,601
Enrollment
Per Pupil Funding
Utilities = 275,778
Special Ed. Programs = 159,609
10/11
Other Programs = 0
ADOPTED BUDGET
76

R J Kinsella Magnet of Performing Arts
09/10 10/11
Adopted Difference
FY FY 10/11FY
Adopted
$ FTE $FTE$ FTE
BUDGET FUND 1003
110 Certified Salaries $1,517,937 20.5 $1,252,321 17.0 ($265,616) -3.5
110 Part Time Certified Salaries $105,736 $65,400 ($40,336) 0.0
120 Non-Certified Salaries $614,428 20.0 $479,787 15.0 ($134,641) -5.0
120 Part Time Non-Certified Salaries $22,000 $28,500 $6,500 0.0
$2,260,101 40.5Total Salaries $1,826,008 32.0 ($434,093) -8.5
900 Fringe Benefits $726,413 $627,322 ($99,091) 0.0
$726,413Total Benefits $627,322 ($99,091) 0.0
322 Instr. Impr. Services $58,118 $55,118 ($3,000) 0.0
325 Parent Activities $2,000 $2,000 $0 0.0
330 Other Prof. Tech Svs/MHIS $36,866 $58,203 $21,337 0.0
430 Maintenance Contracts $19,000 $16,350 ($2,650) 0.0
530 Communications $6,636 $3,636 ($3,000) 0.0
580 Travel/Conferences & Seminars $1,000 $1,000 $0 0.0
611 Supplies & Materials $204,735 $90,107 ($114,628) 0.0
620 Utilities $250,000 $275,778 $25,778 0.0
700 Equipment $3,500 $0 ($3,500) 0.0
899 Other Operating Exp. $213,465 $213,465 $0 0.0
$795,320Total Operating Expenses $715,657 ($79,663) 0.0
$3,781,834 40.5TOTAL BUDGET FUND $3,168,987 32.0 ($612,847) -8.51003
BUDGET FUND 2007
110 Certified Salaries $1,804,202 33.6 $2,207,791 37.6 $403,589 4.0
110 Part Time Certified Salaries $325,463 $276,542 0.0 ($48,921) 0.0
120 Non-Certified Salaries $432,575 13.0 $553,851 14.5 $121,276 1.5
120 Part Time Non-Certified Salaries $45,000 $40,000 0.0 ($5,000) 0.0
$2,607,240 46.6Total Salaries $3,078,184 52.1 $470,944 5.5
900 Fringe Benefits $717,317 $968,285 $250,967 0.0
$717,317Total Benefits $968,285 $250,967 0.0
322 Instr. Impr. Services $33,342 $30,577 0.0 ($2,765) 0.0
324 Field Trips $50,000 $47,000 0.0 ($3,000) 0.0
325 Parent Activities $4,868 $5,032 0.0 $164 0.0
530 Communications $23,364 $14,364 0.0 ($9,000) 0.0
611 Supplies & Materials $103,804 $121,561 0.0 $17,757 0.0
700 Equipment $78,695 $19,220 0.0 ($59,475) 0.0
899 Other Operating Exp. $48,660 $48,660 0.0 $0 0.0
901 Mandated Compensatory Education $10,308 $0 ($10,308) 0.0
$353,041Total Operating Expenses $286,414 0.0 ($66,627) 0.0
$3,677,598 46.6TOTAL BUDGET FUND $4,332,883 52.1 $655,284 5.52007
$7,459,432 87.1GRAND TOTAL ALL FUNDS $7,501,870 84.1 $42,438 -3.0
77

R J Kinsella Magnet of Performing Arts
Certified Staff Enrollment Non-Certified Staff
STAFFING and ENROLLMENT
Adopted Actual Projected Adopted
09/10 10/11 09/10 10/11 09/10 10/11
Adopted Adopted
Principals 1.0 1.0 Clerical Support 3.0 3.0
Pre-K 58 60
Associate/Assistant Principal 1.0 Paraprofessionals
K 63 66 Classroom
Dean 1.0 1.0 Special Education 3.0
Teachers 1st 69 71 Other - Special Educ 9.0 4.0
Pre-K 0.5
Regular 18.0 18.0 2nd 58 70 Kindergarten 2.0
Associate Teacher Other Para 4.0
Art 3.0 3.0 3rd 65 67
Business Prev/Interv Staff 1.0 1.0
Reading 1.0 1.0 4th 65 68
Foreign Language 1.0 1.0 CDA 4.0 4.0
Health 5th 71 68
Tech Comp Educ 1.0 1.0 Family Resource Aides 1.0 1.0
Math 1.0 1.0 6th 67 70
Music 4.6 4.6 School and Family Support
Science 1.0 1.0 7th 54 70
Social Studies 1.0 1.0 Nurse 1.0 1.0
English 2.0 2.0 8th 55 59
Physical Education 2.0 2.0 Custodial Staff 5.0 5.0
Special Education 4.0 4.0 9th 0 0
Pre-K 3.0 3.0 Security 2.0 2.0
Kindergarten 3.0 3.0 10th 0 0
Bilingual Gym & Pool Asst
TESOL/ELL 0.5 1.0 11th 0 0
Speech 1.0 1.0 M&C Journeyman
Library Media 0.5 1.0 12th 0 0
Coach 2.0 2.0 Tech Support 1.0 1.0
Other
Other 2.0 2.0
Social Workers 1.0 1.0
Guidance Counselors 0.5 1.0
54.1 54.6 625 669 33.0 29.5Total Total Total
Adopted
Staffing Total 87.1 84.1
Adopted
78

This page intentionally left blank.
79

Thomas J McDonough
18 108,000
46 253,506
138 1,073,502
130 842,790
81 577,692
0 0
134 84,018
21 6,594
0 0
54 140,022
25 116,950
10 76,000
7 97,867
0 0
Grade Weights
Pre K
K
1-3
4-6
7-8
9-12
Weight Per Capita
Projected
Enrollment/
Hours $
X
X
X
X
X
=
=
=
=
=
Need Weights
Academic Intervention*
DRA (K-3)
27 16,929
Achievement (4-12)
Well Below Standards X =
X =
X =
X =
X =
X =
=
Below Standards
High Achievement (Lvl 5)
English Language Learners
0-30 Months
Special Education
Level 1
XLevel 2
XLevel 3
XLevel 4
=
=
=
Total WSF FORMULA = 3,440,235
X
0 0X =Trans to Mainstream
55 46,365X =30 + Months
6,0001.26
5,5110.85
7,7791.20
6,4831.00
7,1321.10
8,4281.30
6270.10
6270.10
3140.05
6270.10
2,5930.40
1,6210.25
8430.13
4,6780.80
7,6001.30
13,9812.40
23,7354.07
Foundation = 0
Federal/State Categorical = 210,288
GRAND TOTAL ALL FUNDS FY = 4,016,179
413
$9,724
Total WSF = 3,440,235
Enrollment
Per Pupil Funding
Utilities = 206,049
Special Ed. Programs = 159,607
10/11
Other Programs = 0
ADOPTED BUDGET
80

Thomas J McDonough
09/10 10/11
Adopted Difference
FY FY 10/11FY
Adopted
$ FTE $FTE$ FTE
BUDGET FUND 1003
110 Certified Salaries $2,096,708 30.0 $2,109,264 28.7 $12,556 -1.3
110 Part Time Certified Salaries $82,458 $42,105 ($40,353) 0.0
120 Non-Certified Salaries $418,370 12.2 $463,203 13.5 $44,833 1.3
120 Part Time Non-Certified Salaries $4,304 $4,046 ($258) 0.0
$2,601,840 42.2Total Salaries $2,618,618 42.2 $16,778 0.0
900 Fringe Benefits $781,186 $887,077 $105,890 0.0
$781,186Total Benefits $887,077 $105,890 0.0
322 Instr. Impr. Services $16,678 $0 ($16,678) 0.0
330 Other Prof. Tech Svs/MHIS $37,881 $35,931 ($1,950) 0.0
430 Maintenance Contracts $16,678 $16,678 0.0
530 Communications $1,600 $1,600 $0 0.0
611 Supplies & Materials $63,298 $30,119 ($33,179) 0.0
620 Utilities $181,036 $206,049 $25,013 0.0
899 Other Operating Exp. $9,820 $9,820 $0 0.0
$310,313Total Operating Expenses $300,197 ($10,116) 0.0
$3,693,339 42.2TOTAL BUDGET FUND $3,805,892 42.2 $112,552 0.01003
BUDGET FUND 2007
110 Certified Salaries $162,476 2.5 $110,352 1.8 ($52,124) -0.7
110 Part Time Certified Salaries $16,269 $40,955 $24,686 0.0
120 Non-Certified Salaries $47,347 2.0 $0 0.0 ($47,347) -2.0
$226,092 4.5Total Salaries $151,307 1.8 ($74,785) -2.7
900 Fringe Benefits $68,173 $35,167 ($33,006) 0.0
$68,173Total Benefits $35,167 ($33,006) 0.0
325 Parent Activities $3,394 $3,394 $0 0.0
611 Supplies & Materials $25,647 $20,419 ($5,228) 0.0
$29,041Total Operating Expenses $23,813 ($5,228) 0.0
$323,306 4.5TOTAL BUDGET FUND $210,287 1.8 ($113,019) -2.72007
$4,016,645 46.7GRAND TOTAL ALL FUNDS $4,016,179 44.0 ($467) -2.7
81

Thomas J McDonough
Certified Staff Enrollment Non-Certified Staff
STAFFING and ENROLLMENT
Adopted Actual Projected Adopted
09/10 10/11 09/10 10/11 09/10 10/11
Adopted Adopted
Principals 1.0 1.0 Clerical Support 2.0 2.0
Pre-K 22 18
Associate/Assistant Principal Paraprofessionals
K 52 46 Classroom
Dean Special Education 1.0
Teachers 1st 52 46 Other - Special Educ 3.2 4.0
Pre-K 0.5
Regular 15.0 12.0 2nd 51 46 Kindergarten
Associate Teacher Other Para 2.0
Art 1.0 1.0 3rd 45 46
Business Prev/Interv Staff
Reading 4th 43 46
Foreign Language CDA 2.0 1.0
Health 5th 43 44
Tech Comp Educ Family Resource Aides 1.0 1.0
Math 1.0 6th 50 40
Music 1.0 1.0 School and Family Support
Science 1.0 7th 0 81
Social Studies Nurse 1.0 1.0
English 1.0 8th 0 0
Physical Education 1.0 1.0 Custodial Staff 2.0 2.0
Special Education 2.5 2.5 9th 0 0
Pre-K 2.0 1.0 Security 1.0 1.0
Kindergarten 3.0 2.0 10th 0 0
Bilingual 1.0 1.0 Gym & Pool Asst
TESOL/ELL 1.0 1.0 11th 0 0
Speech 1.0 1.0 M&C Journeyman
Library Media 0.5 0.5 12th 0 0
Coach 1.5 2.0 Tech Support
Other
Other
Social Workers 1.0 0.5
Guidance Counselors
32.5 30.5 358 413 14.2 13.5Total Total Total
Adopted
Staffing Total 46.7 44.0
Adopted
82

This page intentionally left blank.
83

Milner Core Knowledge Academy
18 108,000
46 253,506
149 1,159,071
130 842,790
86 613,352
0 0
132 82,764
33 10,362
0 0
35 90,755
41 191,798
2 15,200
4 55,924
0 0
Grade Weights
Pre K
K
1-3
4-6
7-8
9-12
Weight Per Capita
Projected
Enrollment/
Hours $
X
X
X
X
X
=
=
=
=
=
Need Weights
Academic Intervention*
DRA (K-3)
81 50,787
Achievement (4-12)
Well Below Standards X =
X =
X =
X =
X =
X =
=
Below Standards
High Achievement (Lvl 5)
English Language Learners
0-30 Months
Special Education
Level 1
XLevel 2
XLevel 3
XLevel 4
=
=
=
Total WSF FORMULA = 3,508,029
X
0 0X =Trans to Mainstream
40 33,720X =30 + Months
6,0001.26
5,5110.85
7,7791.20
6,4831.00
7,1321.10
8,4281.30
6270.10
6270.10
3140.05
6270.10
2,5930.40
1,6210.25
8430.13
4,6780.80
7,6001.30
13,9812.40
23,7354.07
Foundation = 0
Federal/State Categorical = 239,495
GRAND TOTAL ALL FUNDS FY = 4,211,263
429
$9,816
Total WSF = 3,508,029
Enrollment
Per Pupil Funding
Utilities = 172,851
Special Ed. Programs = 290,888
10/11
Other Programs = 0
ADOPTED BUDGET
84

Milner Core Knowledge Academy
09/10 10/11
Adopted Difference
FY FY 10/11FY
Adopted
$ FTE $FTE$ FTE
BUDGET FUND 1003
110 Certified Salaries $2,356,994 33.6 $2,100,692 28.5 ($256,302) -5.1
110 Part Time Certified Salaries $39,993 $57,000 $17,007 0.0
120 Non-Certified Salaries $432,353 11.4 $474,486 13.5 $42,133 2.1
120 Part Time Non-Certified Salaries $20,500 $20,500 $0 0.0
$2,849,840 45.0Total Salaries $2,652,678 42.0 ($197,162) -3.0
900 Fringe Benefits $858,423 $890,816 $32,393 0.0
$858,423Total Benefits $890,816 $32,393 0.0
330 Other Prof. Tech Svs/MHIS $35,773 $37,323 $1,550 0.0
430 Maintenance Contracts $9,839 $9,774 ($65) 0.0
530 Communications $1,045 $1,045 $0 0.0
611 Supplies & Materials $24,750 $36,099 $11,349 0.0
620 Utilities $175,446 $172,851 ($2,595) 0.0
$246,853Total Operating Expenses $257,092 $10,239 0.0
$3,955,116 45.0TOTAL BUDGET FUND $3,800,586 42.0 ($154,530) -3.01003
BUDGET FUND 2007
110 Certified Salaries $154,037 2.4 $215,236 3.0 $61,199 0.6
110 Part Time Certified Salaries $21,120 $21,120 0.0 $0 0.0
120 Non-Certified Salaries $34,313 1.6 $52,091 1.0 $17,778 -0.6
$209,470 4.0Total Salaries $288,447 4.0 $78,977 0.0
900 Fringe Benefits $59,292 $92,884 $33,592 0.0
$59,292Total Benefits $92,884 $33,592 0.0
325 Parent Activities $3,574 $3,508 0.0 ($66) 0.0
611 Supplies & Materials $11,581 $25,838 0.0 $14,257 0.0
$15,155Total Operating Expenses $29,346 0.0 $14,191 0.0
$283,917 4.0TOTAL BUDGET FUND $410,677 4.0 $126,760 0.02007
$4,239,033 49.0GRAND TOTAL ALL FUNDS $4,211,263 46.0 ($27,770) -3.0
85
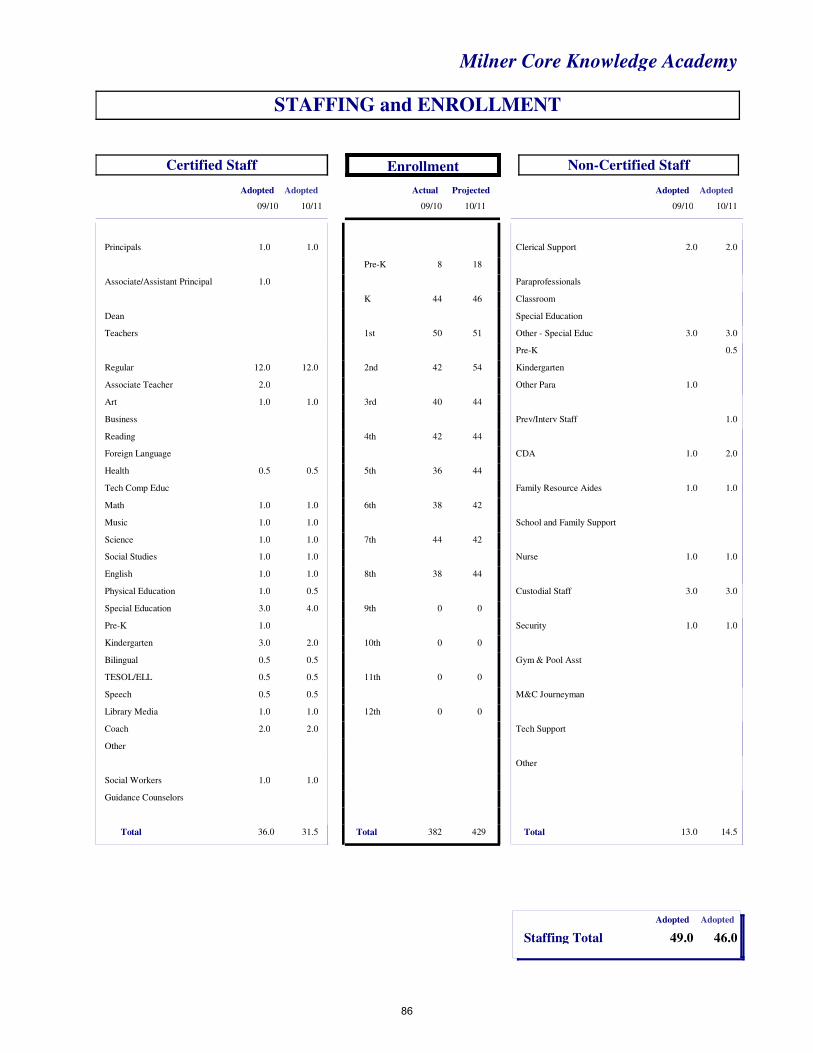
Milner Core Knowledge Academy
Certified Staff Enrollment Non-Certified Staff
STAFFING and ENROLLMENT
Adopted Actual Projected Adopted
09/10 10/11 09/10 10/11 09/10 10/11
Adopted Adopted
Principals 1.0 1.0 Clerical Support 2.0 2.0
Pre-K 8 18
Associate/Assistant Principal 1.0 Paraprofessionals
K 44 46 Classroom
Dean Special Education
Teachers 1st 50 51 Other - Special Educ 3.0 3.0
Pre-K 0.5
Regular 12.0 12.0 2nd 42 54 Kindergarten
Associate Teacher 2.0 Other Para 1.0
Art 1.0 1.0 3rd 40 44
Business Prev/Interv Staff 1.0
Reading 4th 42 44
Foreign Language CDA 1.0 2.0
Health 0.5 0.5 5th 36 44
Tech Comp Educ Family Resource Aides 1.0 1.0
Math 1.0 1.0 6th 38 42
Music 1.0 1.0 School and Family Support
Science 1.0 1.0 7th 44 42
Social Studies 1.0 1.0 Nurse 1.0 1.0
English 1.0 1.0 8th 38 44
Physical Education 1.0 0.5 Custodial Staff 3.0 3.0
Special Education 3.0 4.0 9th 0 0
Pre-K 1.0 Security 1.0 1.0
Kindergarten 3.0 2.0 10th 0 0
Bilingual 0.5 0.5 Gym & Pool Asst
TESOL/ELL 0.5 0.5 11th 0 0
Speech 0.5 0.5 M&C Journeyman
Library Media 1.0 1.0 12th 0 0
Coach 2.0 2.0 Tech Support
Other
Other
Social Workers 1.0 1.0
Guidance Counselors
36.0 31.5 382 429 13.0 14.5Total Total Total
Adopted
Staffing Total 49.0 46.0
Adopted
86

This page intentionally left blank.
87
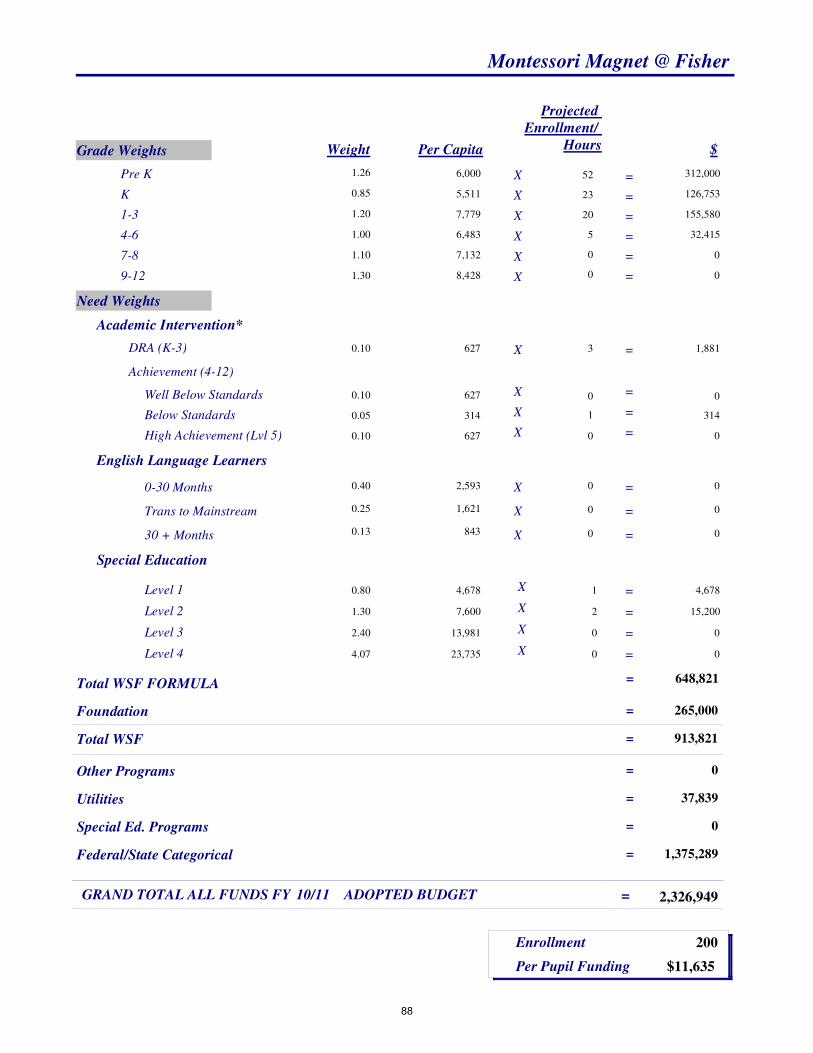
Montessori Magnet @ Fisher
52 312,000
23 126,753
20 155,580
5 32,415
0 0
0 0
3 1,881
1 314
0 0
0 0
1 4,678
2 15,200
0 0
0 0
Grade Weights
Pre K
K
1-3
4-6
7-8
9-12
Weight Per Capita
Projected
Enrollment/
Hours $
X
X
X
X
X
=
=
=
=
=
Need Weights
Academic Intervention*
DRA (K-3)
0 0
Achievement (4-12)
Well Below Standards X =
X =
X =
X =
X =
X =
=
Below Standards
High Achievement (Lvl 5)
English Language Learners
0-30 Months
Special Education
Level 1
XLevel 2
XLevel 3
XLevel 4
=
=
=
Total WSF FORMULA = 648,821
X
0 0X =Trans to Mainstream
0 0X =30 + Months
6,0001.26
5,5110.85
7,7791.20
6,4831.00
7,1321.10
8,4281.30
6270.10
6270.10
3140.05
6270.10
2,5930.40
1,6210.25
8430.13
4,6780.80
7,6001.30
13,9812.40
23,7354.07
Foundation = 265,000
Federal/State Categorical = 1,375,289
GRAND TOTAL ALL FUNDS FY = 2,326,949
200
$11,635
Total WSF = 913,821
Enrollment
Per Pupil Funding
Utilities = 37,839
Special Ed. Programs = 0
10/11
Other Programs = 0
ADOPTED BUDGET
88

Montessori Magnet @ Fisher
09/10 10/11
Adopted Difference
FY FY 10/11FY
Adopted
$ FTE $FTE$ FTE
BUDGET FUND 1003
110 Certified Salaries $309,612 3.7 $429,210 6.0 $119,598 2.3
110 Part Time Certified Salaries $45,668 $150,680 $105,012 0.0
120 Non-Certified Salaries $167,340 5.5 $45,944 1.2 ($121,396) -4.3
120 Part Time Non-Certified Salaries $42,000 $6,230 ($35,770) 0.0
$564,620 9.2Total Salaries $632,064 7.2 $67,444 -2.0
900 Fringe Benefits $172,880 $160,916 ($11,964) 0.0
$172,880Total Benefits $160,916 ($11,964) 0.0
322 Instr. Impr. Services $0 $62,000 $62,000 0.0
324 Field Trips $500 $0 ($500) 0.0
325 Parent Activities $0 $2,500 $2,500 0.0
330 Other Prof. Tech Svs/MHIS $0 $17,400 $17,400 0.0
430 Maintenance Contracts $157 $6,375 $6,218 0.0
530 Communications $2,500 $0 ($2,500) 0.0
611 Supplies & Materials $136,117 $32,566 ($103,551) 0.0
620 Utilities $37,839 $37,839 0.0
$139,274Total Operating Expenses $158,680 $19,406 0.0
$876,774 9.2TOTAL BUDGET FUND $951,660 7.2 $74,886 -2.01003
BUDGET FUND 2007
110 Certified Salaries $481,971 6.6 $556,760 7.4 $74,789 0.8
110 Part Time Certified Salaries $22,500 $25,759 0.0 $3,259 0.0
120 Non-Certified Salaries $74,038 2.5 $285,807 10.8 $211,769 8.3
120 Part Time Non-Certified Salaries $5,000 $32,825 0.0 $27,825 0.0
$583,509 9.1Total Salaries $901,151 18.2 $317,642 9.1
900 Fringe Benefits $168,677 $315,277 $146,600 0.0
$168,677Total Benefits $315,277 $146,600 0.0
322 Instr. Impr. Services $8,000 $19,000 0.0 $11,000 0.0
325 Parent Activities $6,102 $424 0.0 ($5,678) 0.0
330 Other Prof. Tech Svs/MHIS $20,000 $14,500 0.0 ($5,500) 0.0
430 Maintenance Contracts $8,611 $0 0.0 ($8,611) 0.0
530 Communications $4,000 $9,500 0.0 $5,500 0.0
580 Travel/Conferences & Seminars $12,000 0.0 $12,000 0.0
611 Supplies & Materials $128,645 $96,438 0.0 ($32,207) 0.0
899 Other Operating Exp. $8,000 $7,000 0.0 ($1,000) 0.0
$183,358Total Operating Expenses $158,862 0.0 ($24,496) 0.0
$935,544 9.1TOTAL BUDGET FUND $1,375,290 18.2 $439,746 9.12007
$1,812,318 18.3GRAND TOTAL ALL FUNDS $2,326,949 25.4 $514,632 7.1
89

Montessori Magnet @ Fisher
Certified Staff Enrollment Non-Certified Staff
STAFFING and ENROLLMENT
Adopted Actual Projected Adopted
09/10 10/11 09/10 10/11 09/10 10/11
Adopted Adopted
Principals 1.0 1.0 Clerical Support 1.0 1.0
Pre-K 97 90
Associate/Assistant Principal Paraprofessionals
K 12 55 Classroom 3.0
Dean Special Education
Teachers 1st 15 18 Other - Special Educ
Pre-K 6.0
Regular 3.0 3.0 2nd 15 15 Kindergarten
Associate Teacher Other Para 5.5
Art 3rd 8 12
Business Prev/Interv Staff
Reading 4th 0 10
Foreign Language 0.5 CDA
Health 5th 0 0
Tech Comp Educ Family Resource Aides 0.4
Math 6th 0 0
Music 0.2 0.4 School and Family Support
Science 7th 0 0
Social Studies Nurse 0.5 0.4
English 8th 0 0
Physical Education 0.4 0.2 Custodial Staff 1.0 1.2
Special Education 0.5 0.6 9th 0 0
Pre-K 5.0 6.0 Security
Kindergarten 10th 0 0
Bilingual Gym & Pool Asst
TESOL/ELL 11th 0 0
Speech 0.2 0.4 M&C Journeyman
Library Media 0.1 12th 0 0
Coach 1.0 Tech Support
Other
Other
Social Workers 0.2
Guidance Counselors
10.3 13.4 147 200 8.0 12.0Total Total Total
Adopted
Staffing Total 18.3 25.4
Adopted
90

This page intentionally left blank.
91

Moylan
76 456,000
83 457,413
184 1,431,336
189 1,225,287
140 998,480
0 0
153 95,931
52 16,328
2 1,254
66 171,138
50 233,900
6 45,600
18 251,658
0 0
Grade Weights
Pre K
K
1-3
4-6
7-8
9-12
Weight Per Capita
Projected
Enrollment/
Hours $
X
X
X
X
X
=
=
=
=
=
Need Weights
Academic Intervention*
DRA (K-3)
41 25,707
Achievement (4-12)
Well Below Standards X =
X =
X =
X =
X =
X =
=
Below Standards
High Achievement (Lvl 5)
English Language Learners
0-30 Months
Special Education
Level 1
XLevel 2
XLevel 3
XLevel 4
=
=
=
Total WSF FORMULA = 5,497,054
X
10 16,210X =Trans to Mainstream
84 70,812X =30 + Months
6,0001.26
5,5110.85
7,7791.20
6,4831.00
7,1321.10
8,4281.30
6270.10
6270.10
3140.05
6270.10
2,5930.40
1,6210.25
8430.13
4,6780.80
7,6001.30
13,9812.40
23,7354.07
Foundation = 0
Federal/State Categorical = 418,734
GRAND TOTAL ALL FUNDS FY = 6,918,824
672
$10,296
Total WSF = 5,497,054
Enrollment
Per Pupil Funding
Utilities = 383,240
Special Ed. Programs = 619,796
10/11
Other Programs = 0
ADOPTED BUDGET
92

Moylan
09/10 10/11
Adopted Difference
FY FY 10/11FY
Adopted
$ FTE $FTE$ FTE
BUDGET FUND 1003
110 Certified Salaries $3,242,130 45.5 $3,477,870 47.0 $235,740 1.5
110 Part Time Certified Salaries $120,000 $90,000 ($30,000) 0.0
120 Non-Certified Salaries $871,302 28.5 $831,635 25.5 ($39,667) -3.0
120 Part Time Non-Certified Salaries $11,900 $15,600 $3,700 0.0
$4,245,332 74.0Total Salaries $4,415,105 72.5 $169,773 -1.5
900 Fringe Benefits $1,323,590 $1,496,521 $172,931 0.0
$1,323,590Total Benefits $1,496,521 $172,931 0.0
322 Instr. Impr. Services $14,775 $14,775 $0 0.0
330 Other Prof. Tech Svs/MHIS $52,354 $58,464 $6,110 0.0
430 Maintenance Contracts $18,553 $18,553 0.0
530 Communications $3,744 $3,744 $0 0.0
611 Supplies & Materials $202,596 $109,688 ($92,908) 0.0
620 Utilities $341,412 $383,240 $41,828 0.0
$614,881Total Operating Expenses $588,464 ($26,417) 0.0
$6,183,803 74.0TOTAL BUDGET FUND $6,500,090 72.5 $316,287 -1.51003
BUDGET FUND 2007
110 Certified Salaries $115,340 2.0 $124,538 2.0 $9,198 0.0
110 Part Time Certified Salaries $6,026 $6,026 0.0 $0 0.0
120 Non-Certified Salaries $117,114 4.5 $100,116 3.5 ($16,998) -1.0
120 Part Time Non-Certified Salaries $6,027 $6,027 0.0 $0 0.0
$244,507 6.5Total Salaries $236,707 5.5 ($7,800) -1.0
900 Fringe Benefits $91,596 $87,892 ($3,704) 0.0
$91,596Total Benefits $87,892 ($3,704) 0.0
322 Instr. Impr. Services $0 $15,000 0.0 $15,000 0.0
324 Field Trips $1,000 $0 ($1,000) 0.0
325 Parent Activities $4,602 $4,834 0.0 $232 0.0
611 Supplies & Materials $25,305 $68,301 0.0 $42,996 0.0
700 Equipment $6,000 0.0 $6,000 0.0
$30,907Total Operating Expenses $94,135 0.0 $63,228 0.0
$367,010 6.5TOTAL BUDGET FUND $418,734 5.5 $51,724 -1.02007
$6,550,814 80.5GRAND TOTAL ALL FUNDS $6,918,824 78.0 $368,011 -2.5
93

Moylan
Certified Staff Enrollment Non-Certified Staff
STAFFING and ENROLLMENT
Adopted Actual Projected Adopted
09/10 10/11 09/10 10/11 09/10 10/11
Adopted Adopted
Principals 1.0 1.0 Clerical Support 2.0 2.0
Pre-K 73 76
Associate/Assistant Principal 1.0 1.0 Paraprofessionals
K 66 83 Classroom 1.0
Dean Special Education 4.0
Teachers 1st 64 69 Other - Special Educ 14.0 6.0
Pre-K 2.0
Regular 11.0 13.0 2nd 45 69 Kindergarten 2.0
Associate Teacher 2.0 Other Para 5.0
Art 1.0 1.0 3rd 71 46
Business Prev/Interv Staff
Reading 1.0 1.0 4th 61 72
Foreign Language CDA 3.0 3.0
Health 5th 54 63
Tech Comp Educ Family Resource Aides 1.0
Math 1.0 1.0 6th 63 54
Music 1.0 1.0 School and Family Support 1.0
Science 1.0 1.0 7th 74 56
Social Studies 1.0 1.0 Nurse 1.0 1.0
English 2.0 2.0 8th 45 84
Physical Education 2.0 2.0 Custodial Staff 4.0 4.0
Special Education 4.5 6.0 9th 0 0
Pre-K 4.0 3.5 Security 2.0 2.0
Kindergarten 3.0 3.0 10th 0 0
Bilingual 3.5 3.5 Gym & Pool Asst 1.0 1.0
TESOL/ELL 1.5 1.5 11th 0 0
Speech 1.0 1.5 M&C Journeyman
Library Media 1.0 1.0 12th 0 0
Coach 2.0 2.0 Tech Support
Other
Other
Social Workers 2.0 2.0
Guidance Counselors
47.5 49.0 616 672 33.0 29.0Total Total Total
Adopted
Staffing Total 80.5 78.0
Adopted
94

This page intentionally left blank.
95

James H Naylor Elementary
36 216,000
80 440,880
221 1,719,159
231 1,497,573
157 1,119,724
0 0
202 126,654
59 18,526
0 0
69 178,917
51 238,578
7 53,200
9 125,829
0 0
Grade Weights
Pre K
K
1-3
4-6
7-8
9-12
Weight Per Capita
Projected
Enrollment/
Hours $
X
X
X
X
X
=
=
=
=
=
Need Weights
Academic Intervention*
DRA (K-3)
47 29,469
Achievement (4-12)
Well Below Standards X =
X =
X =
X =
X =
X =
=
Below Standards
High Achievement (Lvl 5)
English Language Learners
0-30 Months
Special Education
Level 1
XLevel 2
XLevel 3
XLevel 4
=
=
=
Total WSF FORMULA = 5,846,926
X
16 25,936X =Trans to Mainstream
67 56,481X =30 + Months
6,0001.26
5,5110.85
7,7791.20
6,4831.00
7,1321.10
8,4281.30
6270.10
6270.10
3140.05
6270.10
2,5930.40
1,6210.25
8430.13
4,6780.80
7,6001.30
13,9812.40
23,7354.07
Foundation = 0
Federal/State Categorical = 407,028
GRAND TOTAL ALL FUNDS FY = 7,238,181
725
$9,984
Total WSF = 5,846,926
Enrollment
Per Pupil Funding
Utilities = 324,529
Special Ed. Programs = 659,698
10/11
Other Programs = 0
ADOPTED BUDGET
96

James H Naylor Elementary
09/10 10/11
Adopted Difference
FY FY 10/11FY
Adopted
$ FTE $FTE$ FTE
BUDGET FUND 1003
110 Certified Salaries $3,442,614 48.1 $3,566,200 48.3 $123,586 0.1
110 Part Time Certified Salaries $177,021 $109,523 ($67,498) 0.0
120 Non-Certified Salaries $872,530 28.0 $913,204 28.0 $40,674 0.0
120 Part Time Non-Certified Salaries $34,000 $32,000 ($2,000) 0.0
$4,526,165 76.1Total Salaries $4,620,927 76.3 $94,762 0.1
900 Fringe Benefits $1,380,918 $1,565,416 $184,499 0.0
$1,380,918Total Benefits $1,565,416 $184,499 0.0
330 Other Prof. Tech Svs/MHIS $50,556 $74,175 $23,619 0.0
430 Maintenance Contracts $11,656 $11,656 $0 0.0
530 Communications $6,900 $6,900 $0 0.0
611 Supplies & Materials $438,429 $226,550 ($211,879) 0.0
620 Utilities $304,976 $324,529 $19,553 0.0
899 Other Operating Exp. $500 $1,000 $500 0.0
$813,017Total Operating Expenses $644,810 ($168,207) 0.0
$6,720,100 76.1TOTAL BUDGET FUND $6,831,153 76.3 $111,054 0.11003
BUDGET FUND 2007
110 Certified Salaries $108,522 1.5 $135,000 1.8 $26,478 0.3
110 Part Time Certified Salaries $52,884 $134,782 0.0 $81,898 0.0
120 Non-Certified Salaries $56,749 2.5 $38,449 1.5 ($18,300) -1.0
$218,155 4.0Total Salaries $308,231 3.3 $90,076 -0.8
900 Fringe Benefits $59,028 $62,809 $3,782 0.0
$59,028Total Benefits $62,809 $3,782 0.0
325 Parent Activities $5,712 $5,988 0.0 $276 0.0
330 Other Prof. Tech Svs/MHIS $30,000 $30,000 0.0 $0 0.0
611 Supplies & Materials $10,409 $0 0.0 ($10,409) 0.0
$46,121Total Operating Expenses $35,988 0.0 ($10,133) 0.0
$323,304 4.0TOTAL BUDGET FUND $407,028 3.3 $83,725 -0.82007
$7,043,403 80.1GRAND TOTAL ALL FUNDS $7,238,181 79.5 $194,778 -0.6
97

James H Naylor Elementary
Certified Staff Enrollment Non-Certified Staff
STAFFING and ENROLLMENT
Adopted Actual Projected Adopted
09/10 10/11 09/10 10/11 09/10 10/11
Adopted Adopted
Principals 1.0 1.0 Clerical Support 2.0 2.0
Pre-K 34 36
Associate/Assistant Principal 1.0 1.0 Paraprofessionals
K 80 80 Classroom
Dean Special Education 5.0
Teachers 1st 68 80 Other - Special Educ 10.0 11.0
Pre-K
Regular 20.0 19.0 2nd 67 69 Kindergarten 1.5
Associate Teacher Other Para 7.5
Art 1.2 1.2 3rd 75 72
Business Prev/Interv Staff 1.0
Reading 4th 77 75
Foreign Language CDA 1.0 1.0
Health 5th 83 75
Tech Comp Educ Family Resource Aides 1.0
Math 1.0 1.0 6th 72 81
Music 1.6 1.6 School and Family Support 1.0
Science 1.0 1.0 7th 84 73
Social Studies 2.0 2.0 Nurse 1.0 1.0
English 2.0 2.0 8th 57 84
Physical Education 1.6 1.6 Custodial Staff 5.0 5.0
Special Education 6.0 6.0 9th 0 0
Pre-K 2.0 2.0 Security 2.0 2.0
Kindergarten 4.0 4.0 10th 0 0
Bilingual Gym & Pool Asst
TESOL/ELL 1.0 1.0 11th 0 0
Speech 1.2 1.6 M&C Journeyman
Library Media 1.0 1.0 12th 0 0
Coach 1.0 1.0 Tech Support
Other
Other
Social Workers 1.0 1.0
Guidance Counselors 1.0
49.6 50.0 697 725 30.5 29.5Total Total Total
Adopted
Staffing Total 80.1 79.5
Adopted
98

This page intentionally left blank.
99

Parkville Community
36 216,000
80 440,880
232 1,804,728
187 1,212,321
0 0
0 0
71 44,517
11 3,454
0 0
62 160,766
43 201,154
15 114,000
19 265,639
0 0
Grade Weights
Pre K
K
1-3
4-6
7-8
9-12
Weight Per Capita
Projected
Enrollment/
Hours $
X
X
X
X
X
=
=
=
=
=
Need Weights
Academic Intervention*
DRA (K-3)
10 6,270
Achievement (4-12)
Well Below Standards X =
X =
X =
X =
X =
X =
=
Below Standards
High Achievement (Lvl 5)
English Language Learners
0-30 Months
Special Education
Level 1
XLevel 2
XLevel 3
XLevel 4
=
=
=
Total WSF FORMULA = 4,570,430
X
33 53,493X =Trans to Mainstream
56 47,208X =30 + Months
6,0001.26
5,5110.85
7,7791.20
6,4831.00
7,1321.10
8,4281.30
6270.10
6270.10
3140.05
6270.10
2,5930.40
1,6210.25
8430.13
4,6780.80
7,6001.30
13,9812.40
23,7354.07
Foundation = 0
Federal/State Categorical = 297,591
GRAND TOTAL ALL FUNDS FY = 5,903,421
535
$11,034
Total WSF = 4,570,430
Enrollment
Per Pupil Funding
Utilities = 434,614
Special Ed. Programs = 600,786
10/11
Other Programs = 0
ADOPTED BUDGET
100

Parkville Community
09/10 10/11
Adopted Difference
FY FY 10/11FY
Adopted
$ FTE $FTE$ FTE
BUDGET FUND 1003
110 Certified Salaries $2,929,946 40.4 $2,883,022 39.1 ($46,924) -1.3
110 Part Time Certified Salaries $16,565 $16,500 ($65) 0.0
120 Non-Certified Salaries $777,232 24.0 $681,138 20.5 ($96,094) -3.5
120 Part Time Non-Certified Salaries $9,308 $3,755 ($5,553) 0.0
$3,733,051 64.4Total Salaries $3,584,415 59.6 ($148,636) -4.8
900 Fringe Benefits $1,187,820 $1,233,493 $45,672 0.0
$1,187,820Total Benefits $1,233,493 $45,672 0.0
330 Other Prof. Tech Svs/MHIS $35,957 $46,545 $10,588 0.0
430 Maintenance Contracts $16,678 $19,078 $2,400 0.0
611 Supplies & Materials $48,716 $115,703 $66,987 0.0
620 Utilities $392,611 $434,614 $42,003 0.0
700 Equipment $800 $800 0.0
$493,962Total Operating Expenses $616,740 $122,778 0.0
$5,414,833 64.4TOTAL BUDGET FUND $5,434,648 59.6 $19,814 -4.81003
BUDGET FUND 2007
110 Certified Salaries $272,192 3.5 $174,299 3.0 ($97,893) -0.5
110 Part Time Certified Salaries $44,093 $47,142 0.0 $3,049 0.0
120 Non-Certified Salaries $13,013 0.5 $126,210 3.5 $113,197 3.0
120 Part Time Non-Certified Salaries $2,100 $0 0.0 ($2,100) 0.0
$331,398 4.0Total Salaries $347,651 6.5 $16,253 2.5
900 Fringe Benefits $80,611 $116,213 $35,602 0.0
$80,611Total Benefits $116,213 $35,602 0.0
325 Parent Activities $4,979 $4,347 0.0 ($632) 0.0
611 Supplies & Materials $12,671 $562 0.0 ($12,109) 0.0
$17,650Total Operating Expenses $4,909 0.0 ($12,741) 0.0
$429,659 4.0TOTAL BUDGET FUND $468,773 6.5 $39,114 2.52007
$5,844,492 68.4GRAND TOTAL ALL FUNDS $5,903,421 66.1 $58,928 -2.3
101

Parkville Community
Certified Staff Enrollment Non-Certified Staff
STAFFING and ENROLLMENT
Adopted Actual Projected Adopted
09/10 10/11 09/10 10/11 09/10 10/11
Adopted Adopted
Principals 1.0 1.0 Clerical Support 1.5 2.0
Pre-K 33 36
Associate/Assistant Principal 1.0 Paraprofessionals
K 78 80 Classroom 1.0
Dean 1.0 1.0 Special Education
Teachers 1st 78 80 Other - Special Educ 6.0 7.0
Pre-K 1.0
Regular 20.0 19.0 2nd 74 80 Kindergarten 2.0
Associate Teacher Other Para 4.0
Art 1.0 1.0 3rd 66 72
Business Prev/Interv Staff 1.0 1.0
Reading 4th 70 69
Foreign Language CDA 3.0 2.0
Health 5th 56 64
Tech Comp Educ Family Resource Aides 1.0 1.0
Math 6th 62 54
Music 1.0 1.0 School and Family Support
Science 7th 0 0
Social Studies Nurse 1.0 1.0
English 8th 0 0
Physical Education 1.8 1.8 Custodial Staff 5.0 4.0
Special Education 5.0 6.0 9th 0 0
Pre-K 1.0 1.0 Security 2.0 2.0
Kindergarten 4.0 4.0 10th 0 0
Bilingual Gym & Pool Asst
TESOL/ELL 1.5 1.5 11th 0 0
Speech 1.1 1.3 M&C Journeyman
Library Media 0.5 0.5 12th 0 0
Coach 3.0 2.0 Tech Support
Other
Other
Social Workers 1.0 1.0
Guidance Counselors
43.9 42.1 517 535 24.5 24.0Total Total Total
Adopted
Staffing Total 68.4 66.1
Adopted
102

This page intentionally left blank.
103

Sarah J Rawson
36 216,000
69 380,259
234 1,820,286
273 1,769,859
123 877,236
0 0
108 67,716
44 13,816
0 0
4 10,372
47 219,866
13 98,800
6 83,886
0 0
Grade Weights
Pre K
K
1-3
4-6
7-8
9-12
Weight Per Capita
Projected
Enrollment/
Hours $
X
X
X
X
X
=
=
=
=
=
Need Weights
Academic Intervention*
DRA (K-3)
52 32,604
Achievement (4-12)
Well Below Standards X =
X =
X =
X =
X =
X =
=
Below Standards
High Achievement (Lvl 5)
English Language Learners
0-30 Months
Special Education
Level 1
XLevel 2
XLevel 3
XLevel 4
=
=
=
Total WSF FORMULA = 5,597,379
X
1 1,621X =Trans to Mainstream
6 5,058X =30 + Months
6,0001.26
5,5110.85
7,7791.20
6,4831.00
7,1321.10
8,4281.30
6270.10
6270.10
3140.05
6270.10
2,5930.40
1,6210.25
8430.13
4,6780.80
7,6001.30
13,9812.40
23,7354.07
Foundation = 0
Federal/State Categorical = 423,678
GRAND TOTAL ALL FUNDS FY = 6,869,582
735
$9,346
Total WSF = 5,597,379
Enrollment
Per Pupil Funding
Utilities = 336,768
Special Ed. Programs = 511,757
10/11
Other Programs = 0
ADOPTED BUDGET
104

Sarah J Rawson
09/10 10/11
Adopted Difference
FY FY 10/11FY
Adopted
$ FTE $FTE$ FTE
BUDGET FUND 1003
110 Certified Salaries $3,670,431 51.2 $3,428,174 46.4 ($242,257) -4.8
110 Part Time Certified Salaries $43,619 $35,813 ($7,806) 0.0
120 Non-Certified Salaries $917,589 30.0 $899,128 27.0 ($18,461) -3.0
120 Part Time Non-Certified Salaries $21,500 $15,589 ($5,911) 0.0
$4,653,139 81.2Total Salaries $4,378,704 73.4 ($274,435) -7.8
900 Fringe Benefits $1,460,457 $1,511,163 $50,706 0.0
$1,460,457Total Benefits $1,511,163 $50,706 0.0
330 Other Prof. Tech Svs/MHIS $53,406 $77,164 $23,758 0.0
430 Maintenance Contracts $15,168 $15,168 $0 0.0
530 Communications $3,000 $3,000 $0 0.0
611 Supplies & Materials $171,816 $106,063 ($65,753) 0.0
620 Utilities $419,572 $336,768 ($82,804) 0.0
700 Equipment $10,586 $17,874 $7,288 0.0
890 Athletics Activies $3,000 $0 ($3,000) 0.0
899 Other Operating Exp. $8,000 $0 ($8,000) 0.0
$684,548Total Operating Expenses $556,037 ($128,511) 0.0
$6,798,144 81.2TOTAL BUDGET FUND $6,445,904 73.4 ($352,240) -7.81003
BUDGET FUND 2007
110 Certified Salaries $145,808 2.8 $137,137 2.5 ($8,671) -0.3
110 Part Time Certified Salaries $111,369 $109,173 0.0 ($2,196) 0.0
120 Non-Certified Salaries $49,897 2.0 $23,785 1.0 ($26,112) -1.0
120 Part Time Non-Certified Salaries $10,631 $8,925 0.0 ($1,706) 0.0
$317,705 4.8Total Salaries $279,020 3.5 ($38,685) -1.3
900 Fringe Benefits $67,194 $56,712 ($10,482) 0.0
$67,194Total Benefits $56,712 ($10,482) 0.0
322 Instr. Impr. Services $22,083 0.0 $22,083 0.0
325 Parent Activities $6,487 $6,487 0.0 $0 0.0
330 Other Prof. Tech Svs/MHIS $0 $9,049 0.0 $9,049 0.0
611 Supplies & Materials $9,300 $31,624 0.0 $22,324 0.0
700 Equipment $0 $18,703 0.0 $18,703 0.0
$15,787Total Operating Expenses $87,946 0.0 $72,159 0.0
$400,686 4.8TOTAL BUDGET FUND $423,678 3.5 $22,992 -1.32007
$7,198,830 86.0GRAND TOTAL ALL FUNDS $6,869,582 76.9 ($329,248) -9.1
105

Sarah J Rawson
Certified Staff Enrollment Non-Certified Staff
STAFFING and ENROLLMENT
Adopted Actual Projected Adopted
09/10 10/11 09/10 10/11 09/10 10/11
Adopted Adopted
Principals 1.0 1.0 Clerical Support 2.0 2.0
Pre-K 27 36
Associate/Assistant Principal 0.5 0.5 Paraprofessionals
K 65 69 Classroom
Dean 1.0 1.0 Special Education 2.0
Teachers 1st 80 69 Other - Special Educ 11.0 8.0
Pre-K
Regular 22.0 22.0 2nd 75 84 Kindergarten 2.0
Associate Teacher Other Para 6.0
Art 1.0 1.0 3rd 96 81
Business Prev/Interv Staff 1.0
Reading 1.0 4th 105 96
Foreign Language CDA 3.0 3.0
Health 5th 71 108
Tech Comp Educ 1.0 1.0 Family Resource Aides 1.0
Math 2.0 2.0 6th 46 69
Music 1.5 1.5 School and Family Support 1.0
Science 1.0 1.0 7th 75 48
Social Studies 1.0 1.0 Nurse 1.0 1.0
English 2.0 2.0 8th 80 75
Physical Education 1.5 1.5 Custodial Staff 5.0 5.0
Special Education 4.5 4.0 9th 0 0
Pre-K 2.0 1.0 Security 3.0 3.0
Kindergarten 3.0 3.0 10th 0 0
Bilingual Gym & Pool Asst
TESOL/ELL 1.0 11th 0 0
Speech 1.0 1.4 M&C Journeyman
Library Media 1.0 1.0 12th 0 0
Coach 3.0 2.0 Tech Support
Other
Other
Social Workers 1.0 1.0
Guidance Counselors 1.0
54.0 48.9 720 735 32.0 28.0Total Total Total
Adopted
Staffing Total 86.0 76.9
Adopted
106

This page intentionally left blank.
107

America's Choice @ Sand
0 0
46 253,506
180 1,400,220
149 965,967
54 385,128
0 0
143 89,661
27 8,478
0 0
53 137,429
20 93,560
18 136,800
7 97,867
0 0
Grade Weights
Pre K
K
1-3
4-6
7-8
9-12
Weight Per Capita
Projected
Enrollment/
Hours $
X
X
X
X
X
=
=
=
=
=
Need Weights
Academic Intervention*
DRA (K-3)
48 30,096
Achievement (4-12)
Well Below Standards X =
X =
X =
X =
X =
X =
=
Below Standards
High Achievement (Lvl 5)
English Language Learners
0-30 Months
Special Education
Level 1
XLevel 2
XLevel 3
XLevel 4
=
=
=
Total WSF FORMULA = 3,626,336
X
3 4,863X =Trans to Mainstream
27 22,761X =30 + Months
6,0001.26
5,5110.85
7,7791.20
6,4831.00
7,1321.10
8,4281.30
6270.10
6270.10
3140.05
6270.10
2,5930.40
1,6210.25
8430.13
4,6780.80
7,6001.30
13,9812.40
23,7354.07
Foundation = 0
Federal/State Categorical = 237,415
GRAND TOTAL ALL FUNDS FY = 4,411,388
429
$10,283
Total WSF = 3,626,336
Enrollment
Per Pupil Funding
Utilities = 197,837
Special Ed. Programs = 349,800
10/11
Other Programs = 0
ADOPTED BUDGET
108

America's Choice @ Sand
09/10 10/11
Adopted Difference
FY FY 10/11FY
Adopted
$ FTE $FTE$ FTE
BUDGET FUND 1003
110 Certified Salaries $2,135,568 31.0 $2,382,650 31.9 $247,082 0.9
110 Part Time Certified Salaries $69,900 $27,000 ($42,900) 0.0
120 Non-Certified Salaries $618,978 19.5 $504,380 14.5 ($114,598) -5.0
120 Part Time Non-Certified Salaries $18,555 $9,000 ($9,555) 0.0
$2,843,001 50.5Total Salaries $2,923,030 46.4 $80,029 -4.1
900 Fringe Benefits $895,315 $992,578 $97,263 0.0
$895,315Total Benefits $992,578 $97,263 0.0
324 Field Trips $5,000 $0 ($5,000) 0.0
330 Other Prof. Tech Svs/MHIS $46,564 $37,323 ($9,241) 0.0
430 Maintenance Contracts $10,474 $10,474 $0 0.0
530 Communications $7,994 $1,000 ($6,994) 0.0
611 Supplies & Materials $72,966 $11,730 ($61,236) 0.0
620 Utilities $206,084 $197,837 ($8,247) 0.0
700 Equipment $6,000 $0 ($6,000) 0.0
899 Other Operating Exp. $5,000 $0 ($5,000) 0.0
$360,082Total Operating Expenses $258,364 ($101,718) 0.0
$4,098,398 50.5TOTAL BUDGET FUND $4,173,972 46.4 $75,574 -4.11003
BUDGET FUND 2007
110 Certified Salaries $197,506 2.5 $122,048 1.7 ($75,458) -0.9
110 Part Time Certified Salaries $6,930 $25,000 0.0 $18,070 0.0
120 Non-Certified Salaries $21,853 1.0 $22,509 1.0 $656 0.0
120 Part Time Non-Certified Salaries $7,795 $0 0.0 ($7,795) 0.0
$234,084 3.5Total Salaries $169,557 2.7 ($64,527) -0.9
900 Fringe Benefits $64,973 $49,465 ($15,508) 0.0
$64,973Total Benefits $49,465 ($15,508) 0.0
325 Parent Activities $4,003 $3,454 0.0 ($549) 0.0
611 Supplies & Materials $5,968 $14,939 0.0 $8,971 0.0
$9,971Total Operating Expenses $18,393 0.0 $8,422 0.0
$309,028 3.5TOTAL BUDGET FUND $237,415 2.7 ($71,613) -0.92007
$4,407,426 54.0GRAND TOTAL ALL FUNDS $4,411,388 49.0 $3,962 -5.0
109

America's Choice @ Sand
Certified Staff Enrollment Non-Certified Staff
STAFFING and ENROLLMENT
Adopted Actual Projected Adopted
09/10 10/11 09/10 10/11 09/10 10/11
Adopted Adopted
Principals 1.0 1.0 Clerical Support 2.0 2.0
Pre-K 30 0
Associate/Assistant Principal 1.0 1.0 Paraprofessionals
K 54 46 Classroom
Dean Special Education
Teachers 1st 64 54 Other - Special Educ 7.0 6.0
Pre-K
Regular 15.0 14.0 2nd 59 66 Kindergarten 0.5
Associate Teacher Other Para 3.5 1.0
Art 1.0 1.0 3rd 51 60
Business Prev/Interv Staff
Reading 1.0 1.0 4th 58 50
Foreign Language CDA 2.0
Health 5th 41 57
Tech Comp Educ Family Resource Aides 1.0 1.0
Math 1.0 6th 57 42
Music 1.0 1.0 School and Family Support
Science 1.0 7th 0 54
Social Studies 1.0 Nurse 1.0 1.0
English 1.0 8th 0 0
Physical Education 1.0 1.0 Custodial Staff 3.0 3.0
Special Education 4.0 3.0 9th 0 0
Pre-K 1.0 Security 1.0 1.0
Kindergarten 3.0 2.0 10th 0 0
Bilingual 1.0 1.0 Gym & Pool Asst
TESOL/ELL 1.0 1.0 11th 0 0
Speech 0.5 0.5 M&C Journeyman
Library Media 12th 0 0
Coach 1.0 1.0 Tech Support
Other
Other
Social Workers 1.0 1.0
Guidance Counselors
33.5 33.5 414 429 20.5 15.5Total Total Total
Adopted
Staffing Total 54.0 49.0
Adopted
110

This page intentionally left blank.
111

Maria C Sanchez
36 216,000
76 418,836
215 1,672,485
191 1,238,253
0 0
0 0
220 137,940
28 8,792
0 0
109 282,637
36 168,408
5 38,000
5 69,905
0 0
Grade Weights
Pre K
K
1-3
4-6
7-8
9-12
Weight Per Capita
Projected
Enrollment/
Hours $
X
X
X
X
X
=
=
=
=
=
Need Weights
Academic Intervention*
DRA (K-3)
24 15,048
Achievement (4-12)
Well Below Standards X =
X =
X =
X =
X =
X =
=
Below Standards
High Achievement (Lvl 5)
English Language Learners
0-30 Months
Special Education
Level 1
XLevel 2
XLevel 3
XLevel 4
=
=
=
Total WSF FORMULA = 4,346,324
X
1 1,621X =Trans to Mainstream
93 78,399X =30 + Months
6,0001.26
5,5110.85
7,7791.20
6,4831.00
7,1321.10
8,4281.30
6270.10
6270.10
3140.05
6270.10
2,5930.40
1,6210.25
8430.13
4,6780.80
7,6001.30
13,9812.40
23,7354.07
Foundation = 0
Federal/State Categorical = 285,124
GRAND TOTAL ALL FUNDS FY = 5,024,594
518
$9,700
Total WSF = 4,346,324
Enrollment
Per Pupil Funding
Utilities = 273,440
Special Ed. Programs = 119,706
10/11
Other Programs = 0
ADOPTED BUDGET
112

Maria C Sanchez
09/10 10/11
Adopted Difference
FY FY 10/11FY
Adopted
$ FTE $FTE$ FTE
BUDGET FUND 1003
110 Certified Salaries $2,801,000 38.5 $2,801,130 37.7 $130 -0.8
110 Part Time Certified Salaries $36,596 $15,773 ($20,823) 0.0
120 Non-Certified Salaries $565,715 17.0 $437,215 12.0 ($128,500) -5.0
120 Part Time Non-Certified Salaries $7,034 $10,050 $3,016 0.0
$3,410,345 55.5Total Salaries $3,264,168 49.7 ($146,177) -5.8
900 Fringe Benefits $1,045,941 $1,090,255 $44,314 0.0
$1,045,941Total Benefits $1,090,255 $44,314 0.0
322 Instr. Impr. Services $11,656 $0 ($11,656) 0.0
324 Field Trips $900 $900 $0 0.0
330 Other Prof. Tech Svs/MHIS $39,657 $51,066 $11,409 0.0
430 Maintenance Contracts $13,656 $13,656 0.0
530 Communications $4,750 $3,250 ($1,500) 0.0
611 Supplies & Materials $23,791 $41,735 $17,944 0.0
620 Utilities $252,004 $273,440 $21,436 0.0
899 Other Operating Exp. $700 $1,000 $300 0.0
$333,458Total Operating Expenses $385,047 $51,589 0.0
$4,789,744 55.5TOTAL BUDGET FUND $4,739,470 49.7 ($50,274) -5.81003
BUDGET FUND 2007
110 Certified Salaries $210,120 3.0 $77,681 0.9 ($132,439) -2.1
110 Part Time Certified Salaries $20,006 $13,521 0.0 ($6,485) 0.0
120 Non-Certified Salaries $22,874 1.0 $97,950 4.0 $75,076 3.0
120 Part Time Non-Certified Salaries $7,788 $0 0.0 ($7,788) 0.0
$260,788 4.0Total Salaries $189,152 4.9 ($71,636) 0.9
900 Fringe Benefits $69,075 $71,814 $2,739 0.0
$69,075Total Benefits $71,814 $2,739 0.0
325 Parent Activities $4,525 $4,130 0.0 ($395) 0.0
330 Other Prof. Tech Svs/MHIS $7,396 $0 0.0 ($7,396) 0.0
611 Supplies & Materials $30,469 $20,028 0.0 ($10,441) 0.0
$42,390Total Operating Expenses $24,158 0.0 ($18,232) 0.0
$372,253 4.0TOTAL BUDGET FUND $285,124 4.9 ($87,129) 0.92007
$5,161,997 59.5GRAND TOTAL ALL FUNDS $5,024,594 54.6 ($137,403) -4.9
113

Maria C Sanchez
Certified Staff Enrollment Non-Certified Staff
STAFFING and ENROLLMENT
Adopted Actual Projected Adopted
09/10 10/11 09/10 10/11 09/10 10/11
Adopted Adopted
Principals 1.0 1.0 Clerical Support 2.0 2.0
Pre-K 36 36
Associate/Assistant Principal 1.0 1.0 Paraprofessionals
K 78 76 Classroom
Dean Special Education
Teachers 1st 83 80 Other - Special Educ 3.0 3.0
Pre-K 0.5
Regular 14.0 15.0 2nd 51 82 Kindergarten 1.5
Associate Teacher Other Para 3.0
Art 1.0 1.0 3rd 58 53
Business Prev/Interv Staff
Reading 1.0 1.0 4th 80 57
Foreign Language CDA 3.0 3.0
Health 5th 69 80
Tech Comp Educ Family Resource Aides 1.0 1.0
Math 6th 40 54
Music 1.0 0.6 School and Family Support
Science 7th 0 0
Social Studies Nurse 1.0 1.0
English 8th 0 0
Physical Education 1.5 1.5 Custodial Staff 4.0 3.0
Special Education 3.0 3.0 9th 0 0
Pre-K 1.0 1.0 Security 1.0 1.0
Kindergarten 3.0 3.0 10th 0 0
Bilingual 7.0 5.0 Gym & Pool Asst
TESOL/ELL 2.0 2.0 11th 0 0
Speech 1.0 1.0 M&C Journeyman
Library Media 0.5 0.5 12th 0 0
Coach 2.0 1.0 Tech Support
Other
Other
Social Workers 1.5 1.0
Guidance Counselors
41.5 38.6 495 518 18.0 16.0Total Total Total
Adopted
Staffing Total 59.5 54.6
Adopted
114

This page intentionally left blank.
115
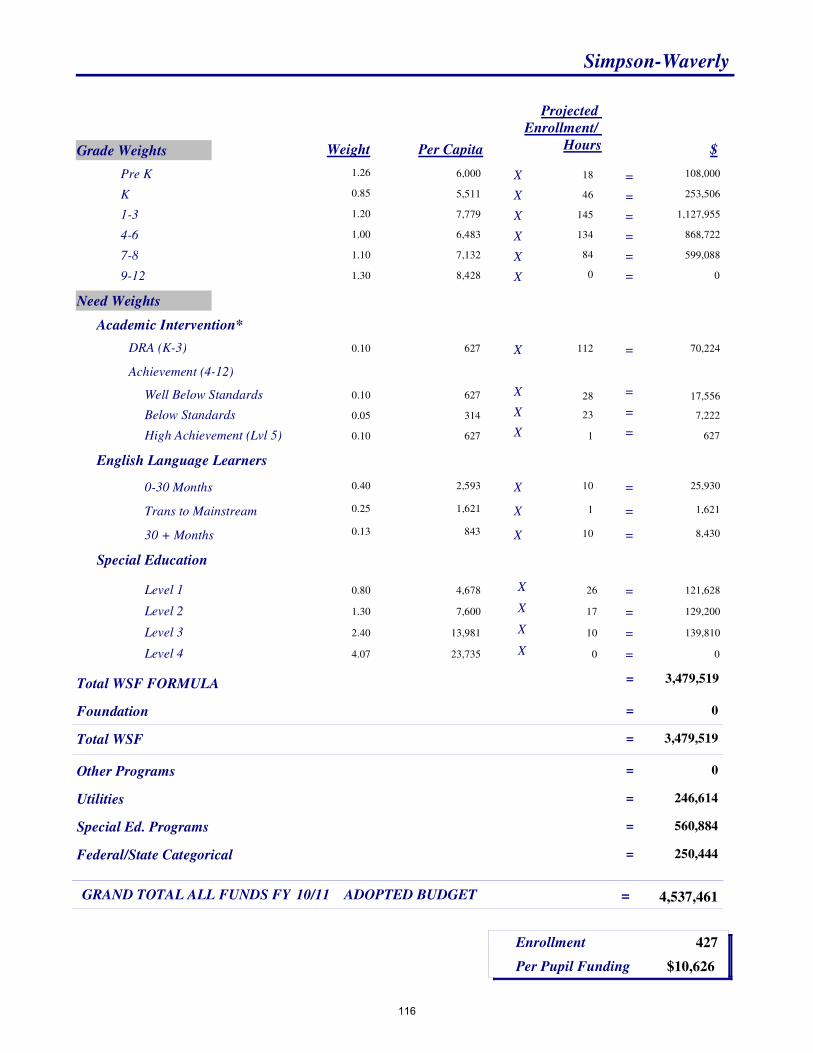
Simpson-Waverly
18 108,000
46 253,506
145 1,127,955
134 868,722
84 599,088
0 0
112 70,224
23 7,222
1 627
10 25,930
26 121,628
17 129,200
10 139,810
0 0
Grade Weights
Pre K
K
1-3
4-6
7-8
9-12
Weight Per Capita
Projected
Enrollment/
Hours $
X
X
X
X
X
=
=
=
=
=
Need Weights
Academic Intervention*
DRA (K-3)
28 17,556
Achievement (4-12)
Well Below Standards X =
X =
X =
X =
X =
X =
=
Below Standards
High Achievement (Lvl 5)
English Language Learners
0-30 Months
Special Education
Level 1
XLevel 2
XLevel 3
XLevel 4
=
=
=
Total WSF FORMULA = 3,479,519
X
1 1,621X =Trans to Mainstream
10 8,430X =30 + Months
6,0001.26
5,5110.85
7,7791.20
6,4831.00
7,1321.10
8,4281.30
6270.10
6270.10
3140.05
6270.10
2,5930.40
1,6210.25
8430.13
4,6780.80
7,6001.30
13,9812.40
23,7354.07
Foundation = 0
Federal/State Categorical = 250,444
GRAND TOTAL ALL FUNDS FY = 4,537,461
427
$10,626
Total WSF = 3,479,519
Enrollment
Per Pupil Funding
Utilities = 246,614
Special Ed. Programs = 560,884
10/11
Other Programs = 0
ADOPTED BUDGET
116

Simpson-Waverly
09/10 10/11
Adopted Difference
FY FY 10/11FY
Adopted
$ FTE $FTE$ FTE
BUDGET FUND 1003
110 Certified Salaries $2,109,043 31.8 $2,233,844 30.0 $124,801 -1.8
110 Part Time Certified Salaries $30,500 $39,760 $9,260 0.0
120 Non-Certified Salaries $539,728 16.5 $544,863 16.0 $5,135 -0.5
120 Part Time Non-Certified Salaries $8,388 $8,388 $0 0.0
$2,687,659 48.3Total Salaries $2,826,855 46.0 $139,196 -2.3
900 Fringe Benefits $846,261 $965,792 $119,531 0.0
$846,261Total Benefits $965,792 $119,531 0.0
322 Instr. Impr. Services $13,228 $1,000 ($12,228) 0.0
330 Other Prof. Tech Svs/MHIS $43,424 $37,149 ($6,275) 0.0
430 Maintenance Contracts $11,656 $11,656 0.0
530 Communications $540 $1,540 $1,000 0.0
611 Supplies & Materials $27,216 $23,583 ($3,633) 0.0
620 Utilities $230,319 $246,614 $16,295 0.0
700 Equipment $1,646 $1,646 0.0
$314,727Total Operating Expenses $323,188 $8,461 0.0
$3,848,647 48.3TOTAL BUDGET FUND $4,115,835 46.0 $267,188 -2.31003
BUDGET FUND 2007
110 Certified Salaries $133,880 1.8 $200,643 2.5 $66,763 0.8
110 Part Time Certified Salaries $20,705 $33,114 0.0 $12,409 0.0
120 Non-Certified Salaries $28,600 1.0 $63,186 1.5 $34,586 0.5
120 Part Time Non-Certified Salaries $1,380 $1,380 0.0 $0 0.0
$184,565 2.8Total Salaries $298,323 4.0 $113,758 1.3
900 Fringe Benefits $51,045 $93,947 $42,902 0.0
$51,045Total Benefits $93,947 $42,902 0.0
325 Parent Activities $2,974 $3,806 0.0 $832 0.0
611 Supplies & Materials $13,192 $25,550 0.0 $12,358 0.0
$16,166Total Operating Expenses $29,356 0.0 $13,190 0.0
$251,776 2.8TOTAL BUDGET FUND $421,626 4.0 $169,850 1.32007
$4,100,424 51.1GRAND TOTAL ALL FUNDS $4,537,461 50.0 $437,037 -1.1
117

Simpson-Waverly
Certified Staff Enrollment Non-Certified Staff
STAFFING and ENROLLMENT
Adopted Actual Projected Adopted
09/10 10/11 09/10 10/11 09/10 10/11
Adopted Adopted
Principals 1.0 1.0 Clerical Support 2.0 2.0
Pre-K 13 18
Associate/Assistant Principal Paraprofessionals
K 42 46 Classroom
Dean 1.0 Special Education 1.0
Teachers 1st 49 44 Other - Special Educ 7.0 6.0
Pre-K 0.5
Regular 12.0 14.0 2nd 49 51 Kindergarten 1.0
Associate Teacher 4.0 Other Para 2.5
Art 1.0 1.0 3rd 49 50
Business Prev/Interv Staff 1.0
Reading 4th 39 50
Foreign Language CDA 1.0 1.0
Health 5th 39 40
Tech Comp Educ Family Resource Aides
Math 1.0 1.0 6th 31 44
Music 1.0 1.0 School and Family Support
Science 1.0 1.0 7th 40 44
Social Studies 1.0 1.0 Nurse 1.0 1.0
English 1.0 1.0 8th 29 40
Physical Education 1.0 1.0 Custodial Staff 3.0 3.0
Special Education 3.6 5.0 9th 0 0
Pre-K 0.5 0.5 Security 1.0 1.0
Kindergarten 2.0 2.0 10th 0 0
Bilingual Gym & Pool Asst
TESOL/ELL 11th 0 0
Speech 0.5 0.5 M&C Journeyman
Library Media 1.0 0.5 12th 0 0
Coach 1.0 Tech Support
Other
Other
Social Workers 1.0 1.0
Guidance Counselors
33.6 32.5 380 427 17.5 17.5Total Total Total
Adopted
Staffing Total 51.1 50.0
Adopted
118

This page intentionally left blank.
119

Noah Webster Micro Society Magnet
28 168,000
21 115,731
98 762,342
118 764,994
72 513,504
0 0
57 35,739
19 5,966
6 3,762
7 18,151
27 126,306
5 38,000
1 13,981
0 0
Grade Weights
Pre K
K
1-3
4-6
7-8
9-12
Weight Per Capita
Projected
Enrollment/
Hours $
X
X
X
X
X
=
=
=
=
=
Need Weights
Academic Intervention*
DRA (K-3)
16 10,032
Achievement (4-12)
Well Below Standards X =
X =
X =
X =
X =
X =
=
Below Standards
High Achievement (Lvl 5)
English Language Learners
0-30 Months
Special Education
Level 1
XLevel 2
XLevel 3
XLevel 4
=
=
=
Total WSF FORMULA = 2,598,944
X
5 8,105X =Trans to Mainstream
17 14,331X =30 + Months
6,0001.26
5,5110.85
7,7791.20
6,4831.00
7,1321.10
8,4281.30
6270.10
6270.10
3140.05
6270.10
2,5930.40
1,6210.25
8430.13
4,6780.80
7,6001.30
13,9812.40
23,7354.07
Foundation = 0
Federal/State Categorical = 3,791,272
GRAND TOTAL ALL FUNDS FY = 6,633,105
625
$10,613
Total WSF = 2,598,944
Enrollment
Per Pupil Funding
Utilities = 163,085
Special Ed. Programs = 79,804
10/11
Other Programs = 0
ADOPTED BUDGET
120

Noah Webster Micro Society Magnet
09/10 10/11
Adopted Difference
FY FY 10/11FY
Adopted
$ FTE $FTE$ FTE
BUDGET FUND 1003
110 Certified Salaries $1,686,993 23.0 $1,586,793 21.0 ($100,200) -2.0
110 Part Time Certified Salaries $142,528 $106,804 ($35,724) 0.0
120 Non-Certified Salaries $385,115 11.0 $165,475 6.0 ($219,640) -5.0
120 Part Time Non-Certified Salaries $43,400 $54,000 $10,600 0.0
$2,258,036 34.0Total Salaries $1,913,072 27.0 ($344,964) -7.0
900 Fringe Benefits $661,389 $585,487 ($75,903) 0.0
$661,389Total Benefits $585,487 ($75,903) 0.0
322 Instr. Impr. Services $1,000 $0 ($1,000) 0.0
324 Field Trips $2,919 $0 ($2,919) 0.0
325 Parent Activities $1,000 $0 ($1,000) 0.0
330 Other Prof. Tech Svs/MHIS $8,156 $54,375 $46,219 0.0
430 Maintenance Contracts $11,656 $21,400 $9,744 0.0
530 Communications $500 $1,600 $1,100 0.0
560 Tuition $1,000 $0 ($1,000) 0.0
580 Travel/Conferences & Seminars $400 $400 $0 0.0
611 Supplies & Materials $39,460 $95,609 $56,149 0.0
620 Utilities $234,283 $163,085 ($71,198) 0.0
700 Equipment $2,000 $4,305 $2,305 0.0
899 Other Operating Exp. $11,500 $2,500 ($9,000) 0.0
$313,874Total Operating Expenses $343,274 $29,400 0.0
$3,233,299 34.0TOTAL BUDGET FUND $2,841,833 27.0 ($391,467) -7.01003
BUDGET FUND 2007
110 Certified Salaries $1,930,120 31.2 $1,917,606 31.3 ($12,514) 0.1
110 Part Time Certified Salaries $175,020 $133,410 ($41,610) 0.0
120 Non-Certified Salaries $422,451 15.5 $639,947 19.9 $217,496 4.4
120 Part Time Non-Certified Salaries $50,503 $3,000 ($47,503) 0.0
$2,578,094 46.7Total Salaries $2,693,963 51.2 $115,869 4.6
900 Fringe Benefits $741,657 $911,852 $170,195 0.0
$741,657Total Benefits $911,852 $170,195 0.0
322 Instr. Impr. Services $47,250 $81,195 $33,945 0.0
324 Field Trips $2,621 $0 ($2,621) 0.0
325 Parent Activities $8,000 $10,961 $2,961 0.0
330 Other Prof. Tech Svs/MHIS $74,988 $12,000 ($62,988) 0.0
530 Communications $6,500 $3,000 ($3,500) 0.0
611 Supplies & Materials $101,415 $56,518 ($44,897) 0.0
700 Equipment $84,000 $2,000 ($82,000) 0.0
899 Other Operating Exp. $6,916 $3,216 ($3,700) 0.0
901 Mandated Compensatory Education $16,567 $16,567 $0 0.0
$348,257Total Operating Expenses $185,457 ($162,800) 0.0
$3,668,008 46.7TOTAL BUDGET FUND $3,791,272 51.2 $123,264 4.62007
$6,901,308 80.7GRAND TOTAL ALL FUNDS $6,633,105 78.2 ($268,203) -2.4
121

Noah Webster Micro Society Magnet
Certified Staff Enrollment Non-Certified Staff
STAFFING and ENROLLMENT
Adopted Actual Projected Adopted
09/10 10/11 09/10 10/11 09/10 10/11
Adopted Adopted
Principals 1.0 1.0 Clerical Support 2.0 2.0
Pre-K 63 50
Associate/Assistant Principal 0.5 0.5 Paraprofessionals
K 67 51 Classroom
Dean 2.0 1.0 Special Education 2.0
Teachers 1st 80 69 Other - Special Educ 2.0 2.0
Pre-K
Regular 20.0 19.0 2nd 63 79 Kindergarten 2.0
Associate Teacher Other Para 6.0
Art 1.9 2.0 3rd 62 62
Business Prev/Interv Staff 0.9
Reading 4th 63 66
Foreign Language CDA 6.0 7.0
Health 5th 62 66
Tech Comp Educ Family Resource Aides 1.0
Math 2.0 2.0 6th 52 65
Music 2.0 2.0 School and Family Support 1.0
Science 1.0 1.0 7th 58 58
Social Studies 1.0 1.0 Nurse 1.0 1.0
English 2.0 2.0 8th 50 59
Physical Education 2.0 2.0 Custodial Staff 5.0 5.0
Special Education 4.0 3.0 9th 0 0
Pre-K 3.0 2.0 Security 3.0 3.0
Kindergarten 4.0 4.0 10th 0 0
Bilingual Gym & Pool Asst
TESOL/ELL 1.0 1.0 11th 0 0
Speech 1.3 1.3 M&C Journeyman
Library Media 1.0 1.0 12th 0 0
Coach 3.0 4.0 Tech Support 0.5
Other 1.0
Other
Social Workers 1.0 1.0
Guidance Counselors 0.5 0.5
54.2 52.3 620 625 26.5 25.9Total Total Total
Adopted
Staffing Total 80.7 78.2
Adopted
122

This page intentionally left blank.
123

West Middle Elementary
18 108,000
69 380,259
281 2,185,899
220 1,426,260
110 784,520
0 0
288 180,576
43 13,502
2 1,254
135 350,055
57 266,646
6 45,600
5 69,905
0 0
Grade Weights
Pre K
K
1-3
4-6
7-8
9-12
Weight Per Capita
Projected
Enrollment/
Hours $
X
X
X
X
X
=
=
=
=
=
Need Weights
Academic Intervention*
DRA (K-3)
42 26,334
Achievement (4-12)
Well Below Standards X =
X =
X =
X =
X =
X =
=
Below Standards
High Achievement (Lvl 5)
English Language Learners
0-30 Months
Special Education
Level 1
XLevel 2
XLevel 3
XLevel 4
=
=
=
Total WSF FORMULA = 5,893,928
X
8 12,968X =Trans to Mainstream
50 42,150X =30 + Months
6,0001.26
5,5110.85
7,7791.20
6,4831.00
7,1321.10
8,4281.30
6270.10
6270.10
3140.05
6270.10
2,5930.40
1,6210.25
8430.13
4,6780.80
7,6001.30
13,9812.40
23,7354.07
Foundation = 0
Federal/State Categorical = 411,943
GRAND TOTAL ALL FUNDS FY = 6,569,595
698
$9,412
Total WSF = 5,893,928
Enrollment
Per Pupil Funding
Utilities = 183,920
Special Ed. Programs = 79,804
10/11
Other Programs = 0
ADOPTED BUDGET
124

West Middle Elementary
09/10 10/11
Adopted Difference
FY FY 10/11FY
Adopted
$ FTE $FTE$ FTE
BUDGET FUND 1003
110 Certified Salaries $3,526,463 48.5 $3,470,794 46.7 ($55,669) -1.8
110 Part Time Certified Salaries $77,719 $70,195 ($7,524) 0.0
120 Non-Certified Salaries $697,017 20.0 $730,120 20.5 $33,103 0.5
120 Part Time Non-Certified Salaries $8,780 $2,000 ($6,780) 0.0
$4,309,979 68.5Total Salaries $4,273,109 67.2 ($36,870) -1.3
900 Fringe Benefits $1,309,766 $1,443,976 $134,210 0.0
$1,309,766Total Benefits $1,443,976 $134,210 0.0
322 Instr. Impr. Services $21,495 $0 ($21,495) 0.0
330 Other Prof. Tech Svs/MHIS $0 $60,726 $60,726 0.0
430 Maintenance Contracts $58,358 $21,495 ($36,863) 0.0
530 Communications $2,465 $2,465 $0 0.0
611 Supplies & Materials $180,667 $171,961 ($8,706) 0.0
620 Utilities $151,022 $183,920 $32,898 0.0
$414,007Total Operating Expenses $440,567 $26,560 0.0
$6,033,752 68.5TOTAL BUDGET FUND $6,157,652 67.2 $123,900 -1.31003
BUDGET FUND 2007
110 Certified Salaries $225,160 3.5 $264,011 4.3 $38,851 0.8
110 Part Time Certified Salaries $28,937 $25,682 0.0 ($3,255) 0.0
120 Non-Certified Salaries $25,000 1.0 $20,044 1.0 ($4,956) 0.0
$279,097 4.5Total Salaries $309,737 5.3 $30,640 0.8
900 Fringe Benefits $73,740 $92,762 $19,022 0.0
$73,740Total Benefits $92,762 $19,022 0.0
325 Parent Activities $5,733 $6,141 0.0 $408 0.0
330 Other Prof. Tech Svs/MHIS $45,000 $0 0.0 ($45,000) 0.0
611 Supplies & Materials $58,922 $3,303 0.0 ($55,619) 0.0
$109,655Total Operating Expenses $9,444 0.0 ($100,211) 0.0
$462,492 4.5TOTAL BUDGET FUND $411,943 5.3 ($50,549) 0.82007
$6,496,244 73.0GRAND TOTAL ALL FUNDS $6,569,595 72.5 $73,351 -0.5
125

West Middle Elementary
Certified Staff Enrollment Non-Certified Staff
STAFFING and ENROLLMENT
Adopted Actual Projected Adopted
09/10 10/11 09/10 10/11 09/10 10/11
Adopted Adopted
Principals 1.0 1.0 Clerical Support 3.0 3.0
Pre-K 14 18
Associate/Assistant Principal 1.0 1.0 Paraprofessionals
K 91 69 Classroom
Dean 1.0 1.0 Special Education 3.0
Teachers 1st 93 92 Other - Special Educ 3.0 2.0
Pre-K
Regular 21.0 21.0 2nd 84 105 Kindergarten 1.5
Associate Teacher Other Para 4.0
Art 1.0 1.0 3rd 92 84
Business Prev/Interv Staff 2.0 1.0
Reading 2.0 2.0 4th 73 88
Foreign Language CDA 2.0 2.0
Health 5th 61 78
Tech Comp Educ Family Resource Aides
Math 1.0 1.0 6th 53 54
Music 1.0 1.0 School and Family Support 1.0
Science 1.0 1.0 7th 62 50
Social Studies 1.0 1.0 Nurse 1.0 1.0
English 2.0 2.0 8th 58 60
Physical Education 2.0 2.0 Custodial Staff 4.0 4.0
Special Education 3.5 4.0 9th 0 0
Pre-K 1.0 1.0 Security 2.0 3.0
Kindergarten 4.0 3.0 10th 0 0
Bilingual Gym & Pool Asst
TESOL/ELL 3.0 3.0 11th 0 0
Speech 1.0 1.0 M&C Journeyman
Library Media 1.0 1.0 12th 0 0
Coach 2.0 2.0 Tech Support
Other
Other
Social Workers 1.0 1.0
Guidance Counselors 0.5
52.0 51.0 681 698 21.0 21.5Total Total Total
Adopted
Staffing Total 73.0 72.5
Adopted
126

This page intentionally left blank.
127

Fred D Wish
18 108,000
49 270,039
154 1,197,966
155 1,004,865
80 570,560
0 0
105 65,835
24 7,536
0 0
43 111,499
43 201,154
8 60,800
4 55,924
0 0
Grade Weights
Pre K
K
1-3
4-6
7-8
9-12
Weight Per Capita
Projected
Enrollment/
Hours $
X
X
X
X
X
=
=
=
=
=
Need Weights
Academic Intervention*
DRA (K-3)
28 17,556
Achievement (4-12)
Well Below Standards X =
X =
X =
X =
X =
X =
=
Below Standards
High Achievement (Lvl 5)
English Language Learners
0-30 Months
Special Education
Level 1
XLevel 2
XLevel 3
XLevel 4
=
=
=
Total WSF FORMULA = 3,724,323
X
8 12,968X =Trans to Mainstream
47 39,621X =30 + Months
6,0001.26
5,5110.85
7,7791.20
6,4831.00
7,1321.10
8,4281.30
6270.10
6270.10
3140.05
6270.10
2,5930.40
1,6210.25
8430.13
4,6780.80
7,6001.30
13,9812.40
23,7354.07
Foundation = 0
Federal/State Categorical = 253,014
GRAND TOTAL ALL FUNDS FY = 5,257,945
456
$11,531
Total WSF = 3,724,323
Enrollment
Per Pupil Funding
Utilities = 121,209
Special Ed. Programs = 988,217
10/11
Other Programs = 171,182
ADOPTED BUDGET
128

Fred D Wish
09/10 10/11
Adopted Difference
FY FY 10/11FY
Adopted
$ FTE $FTE$ FTE
BUDGET FUND 1003
110 Certified Salaries $2,581,122 35.6 $2,715,288 36.5 $134,166 0.9
110 Part Time Certified Salaries $53,698 $21,600 ($32,098) 0.0
120 Non-Certified Salaries $540,441 16.5 $680,841 21.1 $140,400 4.6
120 Part Time Non-Certified Salaries $4,400 $6,400 $2,000 0.0
$3,179,661 52.1Total Salaries $3,424,129 57.6 $244,468 5.5
900 Fringe Benefits $972,328 $1,181,384 $209,057 0.0
$972,328Total Benefits $1,181,384 $209,057 0.0
330 Other Prof. Tech Svs/MHIS $33,072 $42,108 $9,036 0.0
430 Maintenance Contracts $12,838 $12,838 $0 0.0
530 Communications $300 $550 $250 0.0
611 Supplies & Materials $23,396 $51,531 $28,135 0.0
620 Utilities $159,066 $121,209 ($37,857) 0.0
$228,672Total Operating Expenses $228,236 ($436) 0.0
$4,380,661 52.1TOTAL BUDGET FUND $4,833,749 57.6 $453,089 5.51003
BUDGET FUND 2007
110 Certified Salaries $189,975 2.9 $222,417 3.2 $32,442 0.3
110 Part Time Certified Salaries $32,373 $19,000 0.0 ($13,373) 0.0
120 Non-Certified Salaries $35,460 1.5 $71,927 1.9 $36,467 0.4
120 Part Time Non-Certified Salaries $0 $2,309 0.0 $2,309 0.0
$257,808 4.4Total Salaries $315,653 5.1 $57,845 0.7
900 Fringe Benefits $69,700 $104,855 $35,155 0.0
$69,700Total Benefits $104,855 $35,155 0.0
325 Parent Activities $3,625 $3,688 0.0 $63 0.0
611 Supplies & Materials $4,002 $0 0.0 ($4,002) 0.0
$7,627Total Operating Expenses $3,688 0.0 ($3,939) 0.0
$335,135 4.4TOTAL BUDGET FUND $424,196 5.1 $89,061 0.72007
$4,715,795 56.5GRAND TOTAL ALL FUNDS $5,257,945 62.7 $542,150 6.2
129

Fred D Wish
Certified Staff Enrollment Non-Certified Staff
STAFFING and ENROLLMENT
Adopted Actual Projected Adopted
09/10 10/11 09/10 10/11 09/10 10/11
Adopted Adopted
Principals 1.0 1.0 Clerical Support 2.0 2.0
Pre-K 14 18
Associate/Assistant Principal 1.0 1.0 Paraprofessionals
K 49 49 Classroom
Dean Special Education
Teachers 1st 46 50 Other - Special Educ 8.0 12.0
Pre-K 0.5
Regular 14.0 12.0 2nd 52 50 Kindergarten 0.5
Associate Teacher Other Para 1.0
Art 1.0 1.0 3rd 57 54
Business Prev/Interv Staff 1.0
Reading 4th 52 61
Foreign Language CDA 1.0 1.0
Health 5th 44 52
Tech Comp Educ Family Resource Aides 1.0 1.0
Math 1.0 1.0 6th 33 42
Music 1.0 0.6 School and Family Support
Science 1.0 1.0 7th 45 34
Social Studies 1.0 Nurse 1.0 1.0
English 1.0 1.0 8th 21 46
Physical Education 1.0 1.0 Custodial Staff 3.0 3.0
Special Education 6.0 7.0 9th 0 0
Pre-K 0.5 0.5 Security 1.0 1.0
Kindergarten 3.0 3.0 10th 0 0
Bilingual 3.0 3.0 Gym & Pool Asst
TESOL/ELL 11th 0 0
Speech 1.0 1.6 M&C Journeyman
Library Media 1.0 1.0 12th 0 0
Coach 1.0 1.0 Tech Support
Other 1.0
Other
Social Workers 1.0 1.0
Guidance Counselors
38.5 39.7 413 456 18.0 23.0Total Total Total
Adopted
Staffing Total 56.5 62.7
Adopted
130

This page intentionally left blank.
131

SECONDARY
SCHOOLS

Hartford Magnet Middle
0 0
0 0
0 0
104 674,232
213 1,519,116
0 0
0 0
29 9,106
9 5,643
10 25,930
24 112,272
11 83,600
0 0
0 0
Grade Weights
Pre K
K
1-3
4-6
7-8
9-12
Weight Per Capita
Projected
Enrollment/
Hours $
X
X
X
X
X
=
=
=
=
=
Need Weights
Academic Intervention*
DRA (K-3)
19 11,913
Achievement (4-12)
Well Below Standards X =
X =
X =
X =
X =
X =
=
Below Standards
High Achievement (Lvl 5)
English Language Learners
0-30 Months
Special Education
Level 1
XLevel 2
XLevel 3
XLevel 4
=
=
=
Total WSF FORMULA = 2,479,357
X
6 9,726X =Trans to Mainstream
33 27,819X =30 + Months
6,0001.26
5,5110.85
7,7791.20
6,4831.00
7,1321.10
8,4281.30
6270.10
6270.10
3140.05
6270.10
2,5930.40
1,6210.25
8430.13
4,6780.80
7,6001.30
13,9812.40
23,7354.07
Foundation = 0
Federal/State Categorical = 4,084,218
GRAND TOTAL ALL FUNDS FY = 6,792,934
629
$10,800
Total WSF = 2,479,357
Enrollment
Per Pupil Funding
Utilities = 29,849
Special Ed. Programs = 199,510
10/11
Other Programs = 0
ADOPTED BUDGET
132

Hartford Magnet Middle
09/10 10/11
Adopted Difference
FY FY 10/11FY
Adopted
$ FTE $FTE$ FTE
BUDGET FUND 1003
110 Certified Salaries $1,878,910 26.0 $1,695,780 23.0 ($183,130) -3.0
120 Non-Certified Salaries $441,375 14.0 $294,510 9.0 ($146,865) -5.0
120 Part Time Non-Certified Salaries $88,000 $10,000 ($78,000) 0.0
$2,408,285 40.0Total Salaries $2,000,290 32.0 ($407,995) -8.0
900 Fringe Benefits $737,932 $674,213 ($63,719) 0.0
$737,932Total Benefits $674,213 ($63,719) 0.0
322 Instr. Impr. Services $20,000 $0 ($20,000) 0.0
430 Maintenance Contracts $27,950 $0 ($27,950) 0.0
530 Communications $12,500 $0 ($12,500) 0.0
611 Supplies & Materials $51,047 $4,364 ($46,683) 0.0
620 Utilities $10,804 $29,849 $19,045 0.0
$122,301Total Operating Expenses $34,213 ($88,088) 0.0
$3,268,518 40.0TOTAL BUDGET FUND $2,708,716 32.0 ($559,802) -8.01003
BUDGET FUND 2007
110 Certified Salaries $2,105,856 37.1 $2,219,868 37.3 $114,012 0.2
110 Part Time Certified Salaries $253,590 $166,990 0.0 ($86,600) 0.0
120 Non-Certified Salaries $197,880 4.6 $264,635 6.6 $66,755 2.0
120 Part Time Non-Certified Salaries $20,000 $84,264 0.0 $64,264 0.0
$2,577,326 41.7Total Salaries $2,735,757 43.9 $158,431 2.2
900 Fringe Benefits $674,073 $833,642 $159,568 0.0
$674,073Total Benefits $833,642 $159,568 0.0
322 Instr. Impr. Services $0 $15,000 0.0 $15,000 0.0
324 Field Trips $61,220 $40,000 0.0 ($21,220) 0.0
325 Parent Activities $2,785 $2,785 0.0 $0 0.0
330 Other Prof. Tech Svs/MHIS $68,000 $104,723 0.0 $36,723 0.0
430 Maintenance Contracts $0 $27,950 0.0 $27,950 0.0
530 Communications $17,500 $21,000 0.0 $3,500 0.0
560 Tuition $138,000 $100,000 0.0 ($38,000) 0.0
611 Supplies & Materials $97,525 $139,862 0.0 $42,337 0.0
700 Equipment $40,000 $30,000 0.0 ($10,000) 0.0
899 Other Operating Exp. $36,000 $33,500 0.0 ($2,500) 0.0
901 Mandated Compensatory Education $4,306 $0 ($4,306) 0.0
$465,336Total Operating Expenses $514,820 0.0 $49,484 0.0
$3,716,735 41.7TOTAL BUDGET FUND $4,084,219 43.9 $367,483 2.22007
$6,985,254 81.7GRAND TOTAL ALL FUNDS $6,792,934 75.9 ($192,319) -5.8
133

Hartford Magnet Middle
Certified Staff Enrollment Non-Certified Staff
STAFFING and ENROLLMENT
Adopted Actual Projected Adopted
09/10 10/11 09/10 10/11 09/10 10/11
Adopted Adopted
Principals 1.0 1.0 Clerical Support 3.0 2.0
Pre-K 0 0
Associate/Assistant Principal 1.0 1.0 Paraprofessionals
K 0 0 Classroom
Dean 1.0 Special Education
Teachers 1st 0 0 Other - Special Educ 7.0 5.0
Pre-K
Regular 3.0 3.0 2nd 0 0 Kindergarten
Associate Teacher Other Para
Art 2.0 2.0 3rd 0 0
Business Prev/Interv Staff 1.0 1.0
Reading 2.0 4th 0 0
Foreign Language 4.0 4.0 CDA
Health 5th 0 0
Tech Comp Educ 3.0 2.0 Family Resource Aides
Math 9.0 8.0 6th 206 208
Music 3.8 4.0 School and Family Support 1.0
Science 7.0 7.0 7th 199 209
Social Studies 7.0 7.0 Nurse 1.0 1.0
English 11.0 7.0 8th 203 212
Physical Education 3.0 2.0 Custodial Staff 2.0 2.0
Special Education 3.0 3.0 9th 0 0
Pre-K Security 2.0 2.0
Kindergarten 10th 0 0
Bilingual Gym & Pool Asst 1.0 1.0
TESOL/ELL 2.0 1.0 11th 0 0
Speech 0.3 0.3 M&C Journeyman
Library Media 1.0 1.0 12th 0 0
Coach 2.0 Tech Support
Other
Other 1.6 0.6
Social Workers 1.0 1.0
Guidance Counselors 1.0 1.0
63.1 60.3 608 629 18.6 15.6Total Total Total
Adopted
Staffing Total 81.7 75.9
Adopted
134

This page intentionally left blank.
135

Bulkeley Lower
0 0
0 0
0 0
0 0
0 0
700 5,899,600
0 0
47 14,758
0 0
64 165,952
123 575,394
32 243,200
4 55,924
0 0
Grade Weights
Pre K
K
1-3
4-6
7-8
9-12
Weight Per Capita
Projected
Enrollment/
Hours $
X
X
X
X
X
=
=
=
=
=
Need Weights
Academic Intervention*
DRA (K-3)
49 30,723
Achievement (4-12)
Well Below Standards X =
X =
X =
X =
X =
X =
=
Below Standards
High Achievement (Lvl 5)
English Language Learners
0-30 Months
Special Education
Level 1
XLevel 2
XLevel 3
XLevel 4
=
=
=
Total WSF FORMULA = 7,086,646
X
1 1,621X =Trans to Mainstream
118 99,474X =30 + Months
6,0001.26
5,5110.85
7,7791.20
6,4831.00
7,1321.10
8,4281.30
6270.10
6270.10
3140.05
6270.10
2,5930.40
1,6210.25
8430.13
4,6780.80
7,6001.30
13,9812.40
23,7354.07
Foundation = 0
Federal/State Categorical = 438,358
GRAND TOTAL ALL FUNDS FY = 8,493,213
700
$12,133
Total WSF = 7,086,646
Enrollment
Per Pupil Funding
Utilities = 451,754
Special Ed. Programs = 516,455
10/11
Other Programs = 0
ADOPTED BUDGET
136

Bulkeley Lower
09/10 10/11
Adopted Difference
FY FY 10/11FY
Adopted
$ FTE $FTE$ FTE
BUDGET FUND 1003
110 Certified Salaries $4,382,281 62.0 $3,913,459 51.5 ($468,822) -10.5
110 Part Time Certified Salaries $88,327 $185,786 $97,459 0.0
120 Non-Certified Salaries $1,103,389 32.0 $1,021,850 28.5 ($81,539) -3.5
120 Part Time Non-Certified Salaries $54,619 $55,372 $753 0.0
$5,628,616 94.0Total Salaries $5,176,467 80.0 ($452,149) -14.0
900 Fringe Benefits $1,752,826 $1,729,054 ($23,772) 0.0
$1,752,826Total Benefits $1,729,054 ($23,772) 0.0
322 Instr. Impr. Services $199 $0 ($199) 0.0
330 Other Prof. Tech Svs/MHIS $51,412 $79,903 $28,491 0.0
430 Maintenance Contracts $30,410 $34,053 $3,643 0.0
441 Rental of Facilities $1,000 $1,000 0.0
510 Transportation $68,038 $68,038 0.0
530 Communications $1,000 $7,015 $6,015 0.0
611 Supplies & Materials $415,041 $343,894 ($71,147) 0.0
620 Utilities $468,810 $451,754 ($17,056) 0.0
700 Equipment $182,745 $110,125 ($72,620) 0.0
890 Athletics Activies $280,000 $8,500 ($271,500) 0.0
899 Other Operating Exp. $6,000 $45,052 $39,052 0.0
$1,435,617Total Operating Expenses $1,149,334 ($286,283) 0.0
$8,817,059 94.0TOTAL BUDGET FUND $8,054,855 80.0 ($762,204) -14.01003
BUDGET FUND 2007
110 Certified Salaries $190,256 3.0 $71,535 1.0 ($118,721) -2.0
110 Part Time Certified Salaries $33,571 $0 0.0 ($33,571) 0.0
120 Non-Certified Salaries $182,025 4.0 $204,052 4.5 $22,027 0.5
120 Part Time Non-Certified Salaries $1,841 $0 0.0 ($1,841) 0.0
$407,693 7.0Total Salaries $275,587 5.5 ($132,106) -1.5
900 Fringe Benefits $145,092 $120,908 ($24,184) 0.0
$145,092Total Benefits $120,908 ($24,184) 0.0
325 Parent Activities $8,368 $6,962 0.0 ($1,406) 0.0
330 Other Prof. Tech Svs/MHIS $26,133 $0 0.0 ($26,133) 0.0
611 Supplies & Materials $3,740 $34,902 0.0 $31,162 0.0
$38,241Total Operating Expenses $41,864 0.0 $3,623 0.0
$591,026 7.0TOTAL BUDGET FUND $438,359 5.5 ($152,667) -1.52007
$9,408,085 101.0GRAND TOTAL ALL FUNDS $8,493,213 85.5 ($914,871) -15.5
137

Bulkeley Lower
Certified Staff Enrollment Non-Certified Staff
STAFFING and ENROLLMENT
Adopted Actual Projected Adopted
09/10 10/11 09/10 10/11 09/10 10/11
Adopted Adopted
Principals 1.0 1.0 Clerical Support 4.0 2.5
Pre-K 0 0
Associate/Assistant Principal 2.0 2.0 Paraprofessionals
K 0 0 Classroom
Dean 1.0 2.0 Special Education
Teachers 1st 0 0 Other - Special Educ 7.0 10.0
Pre-K
Regular 2nd 0 0 Kindergarten
Associate Teacher Other Para 3.0
Art 1.0 1.0 3rd 0 0
Business Prev/Interv Staff 5.0 4.0
Reading 4th 0 0
Foreign Language 1.0 1.0 CDA
Health 1.0 1.0 5th 0 0
Tech Comp Educ Family Resource Aides 1.0 0.5
Math 9.0 6.0 6th 0 0
Music 1.0 School and Family Support
Science 9.0 6.0 7th 0 0
Social Studies 9.0 3.0 Nurse 1.0 1.0
English 8.0 5.0 8th 0 0
Physical Education 3.0 3.0 Custodial Staff 8.0 8.0
Special Education 10.0 7.0 9th 516 450
Pre-K Security 5.0 4.0
Kindergarten 10th 251 250
Bilingual Gym & Pool Asst
TESOL/ELL 2.0 2.0 11th 0 0
Speech 0.5 M&C Journeyman 1.0 1.0
Library Media 1.0 1.0 12th 0 0
Coach 3.0 6.0 Tech Support 1.0 1.0
Other
Other 1.0
Social Workers 1.0 1.0
Guidance Counselors 3.0 3.0
65.0 52.5 767 700 36.0 33.0Total Total Total
Adopted
Staffing Total 101.0 85.5
Adopted
138

This page intentionally left blank.
139

Bulkeley Upper
0 0
0 0
0 0
0 0
0 0
525 4,424,700
0 0
50 15,700
0 0
39 101,127
48 224,544
18 136,800
17 237,677
0 0
Grade Weights
Pre K
K
1-3
4-6
7-8
9-12
Weight Per Capita
Projected
Enrollment/
Hours $
X
X
X
X
X
=
=
=
=
=
Need Weights
Academic Intervention*
DRA (K-3)
35 21,945
Achievement (4-12)
Well Below Standards X =
X =
X =
X =
X =
X =
=
Below Standards
High Achievement (Lvl 5)
English Language Learners
0-30 Months
Special Education
Level 1
XLevel 2
XLevel 3
XLevel 4
=
=
=
Total WSF FORMULA = 5,259,241
X
16 25,936X =Trans to Mainstream
84 70,812X =30 + Months
6,0001.26
5,5110.85
7,7791.20
6,4831.00
7,1321.10
8,4281.30
6270.10
6270.10
3140.05
6270.10
2,5930.40
1,6210.25
8430.13
4,6780.80
7,6001.30
13,9812.40
23,7354.07
Foundation = 0
Federal/State Categorical = 305,548
GRAND TOTAL ALL FUNDS FY = 6,504,838
525
$12,390
Total WSF = 5,259,241
Enrollment
Per Pupil Funding
Utilities = 451,753
Special Ed. Programs = 488,296
10/11
Other Programs = 0
ADOPTED BUDGET
140

Bulkeley Upper
09/10 10/11
Adopted Difference
FY FY 10/11FY
Adopted
$ FTE $FTE$ FTE
BUDGET FUND 1003
110 Certified Salaries $3,538,569 48.5 $2,943,950 38.9 ($594,619) -9.6
110 Part Time Certified Salaries $43,000 $275,001 $232,001 0.0
120 Non-Certified Salaries $755,540 23.0 $685,628 20.5 ($69,912) -2.5
120 Part Time Non-Certified Salaries $47,000 $94,398 $47,398 0.0
$4,384,109 71.5Total Salaries $3,998,977 59.4 ($385,132) -12.1
900 Fringe Benefits $1,345,139 $1,266,981 ($78,158) 0.0
$1,345,139Total Benefits $1,266,981 ($78,158) 0.0
322 Instr. Impr. Services $2,500 $2,500 $0 0.0
324 Field Trips $5,000 $5,000 $0 0.0
330 Other Prof. Tech Svs/MHIS $51,412 $45,675 ($5,737) 0.0
430 Maintenance Contracts $19,371 $19,371 $0 0.0
441 Rental of Facilities $1,000 $1,000 0.0
450 Improvement to Facilities $52,007 $10,000 ($42,007) 0.0
510 Transportation $44,538 $44,538 0.0
530 Communications $6,000 $6,000 $0 0.0
611 Supplies & Materials $348,029 $290,787 ($57,242) 0.0
620 Utilities $468,611 $451,753 ($16,858) 0.0
700 Equipment $50,358 $25,000 ($25,358) 0.0
890 Athletics Activies $170,334 $8,372 ($161,962) 0.0
899 Other Operating Exp. $9,725 $23,335 $13,610 0.0
$1,183,347Total Operating Expenses $933,331 ($250,016) 0.0
$6,912,595 71.5TOTAL BUDGET FUND $6,199,289 59.4 ($713,306) -12.11003
BUDGET FUND 2007
110 Certified Salaries $173,755 2.0 $108,076 1.5 ($65,679) -0.5
110 Part Time Certified Salaries $29,430 $0 0.0 ($29,430) 0.0
120 Non-Certified Salaries $150,345 4.0 $98,791 2.5 ($51,554) -1.5
120 Part Time Non-Certified Salaries $11,386 $2,808 0.0 ($8,578) 0.0
$364,916 6.0Total Salaries $209,675 4.0 ($155,241) -2.0
900 Fringe Benefits $125,083 $81,761 ($43,321) 0.0
$125,083Total Benefits $81,761 ($43,321) 0.0
325 Parent Activities $5,142 $4,617 0.0 ($525) 0.0
611 Supplies & Materials $8,498 $9,495 0.0 $997 0.0
$13,640Total Operating Expenses $14,112 0.0 $472 0.0
$503,639 6.0TOTAL BUDGET FUND $305,548 4.0 ($198,090) -2.02007
$7,416,234 77.5GRAND TOTAL ALL FUNDS $6,504,838 63.4 ($911,396) -14.1
141

Bulkeley Upper
Certified Staff Enrollment Non-Certified Staff
STAFFING and ENROLLMENT
Adopted Actual Projected Adopted
09/10 10/11 09/10 10/11 09/10 10/11
Adopted Adopted
Principals 1.0 1.0 Clerical Support 4.0 3.5
Pre-K 0 0
Associate/Assistant Principal 1.0 1.0 Paraprofessionals
K 0 0 Classroom
Dean 1.0 1.0 Special Education
Teachers 1st 0 0 Other - Special Educ 8.0 9.0
Pre-K
Regular 2nd 0 0 Kindergarten
Associate Teacher Other Para 1.0
Art 1.0 1.0 3rd 0 0
Business 3.0 Prev/Interv Staff 3.0 2.0
Reading 4th 0 0
Foreign Language 3.0 2.0 CDA
Health 1.0 5th 0 0
Tech Comp Educ Family Resource Aides 1.0 0.5
Math 6.0 5.0 6th 0 0
Music 1.0 School and Family Support
Science 6.0 5.0 7th 0 0
Social Studies 5.0 4.0 Nurse
English 5.0 5.0 8th 0 0
Physical Education 2.0 1.0 Custodial Staff 4.0 2.0
Special Education 5.0 5.0 9th 0 0
Pre-K Security 3.0 3.0
Kindergarten 10th 0 0
Bilingual Gym & Pool Asst 2.0 2.0
TESOL/ELL 2.0 2.0 11th 340 275
Speech 0.5 0.4 M&C Journeyman
Library Media 1.0 12th 260 250
Coach 1.5 2.0 Tech Support
Other 0.5
Other 1.0 1.0
Social Workers 1.0 1.0
Guidance Counselors 4.0 3.0
50.5 40.4 600 525 27.0 23.0Total Total Total
Adopted
Staffing Total 77.5 63.4
Adopted
142

This page intentionally left blank.
143

Capital Preparatory Magnet
0 0
0 0
0 0
40 259,320
62 442,184
98 825,944
0 0
12 3,768
2 1,254
0 0
8 37,424
1 7,600
0 0
0 0
Grade Weights
Pre K
K
1-3
4-6
7-8
9-12
Weight Per Capita
Projected
Enrollment/
Hours $
X
X
X
X
X
=
=
=
=
=
Need Weights
Academic Intervention*
DRA (K-3)
4 2,508
Achievement (4-12)
Well Below Standards X =
X =
X =
X =
X =
X =
=
Below Standards
High Achievement (Lvl 5)
English Language Learners
0-30 Months
Special Education
Level 1
XLevel 2
XLevel 3
XLevel 4
=
=
=
Total WSF FORMULA = 1,587,459
X
2 3,242X =Trans to Mainstream
5 4,215X =30 + Months
6,0001.26
5,5110.85
7,7791.20
6,4831.00
7,1321.10
8,4281.30
6270.10
6270.10
3140.05
6270.10
2,5930.40
1,6210.25
8430.13
4,6780.80
7,6001.30
13,9812.40
23,7354.07
Foundation = 0
Federal/State Categorical = 2,510,130
GRAND TOTAL ALL FUNDS FY = 4,299,189
400
$10,748
Total WSF = 1,587,459
Enrollment
Per Pupil Funding
Utilities = 201,600
Special Ed. Programs = 0
10/11
Other Programs = 0
ADOPTED BUDGET
144

Capital Preparatory Magnet
09/10 10/11
Adopted Difference
FY FY 10/11FY
Adopted
$ FTE $FTE$ FTE
BUDGET FUND 1003
110 Certified Salaries $800,730 10.0 $1,131,600 14.0 $330,870 4.0
120 Non-Certified Salaries $71,019 1.3 $0 0.0 ($71,019) -1.3
120 Part Time Non-Certified Salaries $0 $14,000 $14,000 0.0
$871,749 11.3Total Salaries $1,145,600 14.0 $273,851 2.8
900 Fringe Benefits $251,575 $355,601 $104,027 0.0
$251,575Total Benefits $355,601 $104,027 0.0
322 Instr. Impr. Services $44,989 $10,500 ($34,489) 0.0
430 Maintenance Contracts $5,000 $5,000 0.0
530 Communications $1,000 $0 ($1,000) 0.0
580 Travel/Conferences & Seminars $400 $500 $100 0.0
611 Supplies & Materials $23,060 $62,258 $39,198 0.0
620 Utilities $201,600 $201,600 0.0
700 Equipment $5,500 $5,000 ($500) 0.0
899 Other Operating Exp. $2,300 $3,000 $700 0.0
$77,249Total Operating Expenses $287,858 $210,609 0.0
$1,200,573 11.3TOTAL BUDGET FUND $1,789,059 14.0 $588,487 2.81003
BUDGET FUND 2007
110 Certified Salaries $530,193 9.0 $853,569 13.0 $323,376 4.0
110 Part Time Certified Salaries $142,522 $200,743 0.0 $58,221 0.0
120 Non-Certified Salaries $409,805 9.8 $612,240 13.0 $202,435 3.3
120 Part Time Non-Certified Salaries $62,055 $55,305 0.0 ($6,750) 0.0
$1,144,575 18.8Total Salaries $1,721,857 26.0 $577,282 7.3
900 Fringe Benefits $361,285 $570,713 $209,428 0.0
$361,285Total Benefits $570,713 $209,428 0.0
322 Instr. Impr. Services $14,000 $6,000 0.0 ($8,000) 0.0
324 Field Trips $3,000 $0 ($3,000) 0.0
325 Parent Activities $1,423 $2,300 0.0 $877 0.0
330 Other Prof. Tech Svs/MHIS $9,167 $34,800 0.0 $25,633 0.0
441 Rental of Facilities $15,000 $0 ($15,000) 0.0
510 Transportation $25,000 $24,000 0.0 ($1,000) 0.0
530 Communications $8,500 $8,400 0.0 ($100) 0.0
560 Tuition $10,000 $0 ($10,000) 0.0
611 Supplies & Materials $117,519 $64,767 0.0 ($52,752) 0.0
700 Equipment $0 $15,281 0.0 $15,281 0.0
890 Athletics Activies $12,500 $0 ($12,500) 0.0
899 Other Operating Exp. $15,812 $62,012 0.0 $46,200 0.0
$231,921Total Operating Expenses $217,560 0.0 ($14,361) 0.0
$1,737,781 18.8TOTAL BUDGET FUND $2,510,130 26.0 $772,349 7.32007
$2,938,353 30.0GRAND TOTAL ALL FUNDS $4,299,189 40.0 $1,360,836 10.0
145

Capital Preparatory Magnet
Certified Staff Enrollment Non-Certified Staff
STAFFING and ENROLLMENT
Adopted Actual Projected Adopted
09/10 10/11 09/10 10/11 09/10 10/11
Adopted Adopted
Principals 1.0 1.0 Clerical Support 1.0 1.0
Pre-K 0 0
Associate/Assistant Principal 1.0 1.0 Paraprofessionals
K 0 0 Classroom
Dean 1.0 Special Education
Teachers 1st 0 0 Other - Special Educ
Pre-K
Regular 2nd 0 0 Kindergarten
Associate Teacher Other Para
Art 1.0 1.0 3rd 0 0
Business Prev/Interv Staff
Reading 4th 0 0
Foreign Language 2.0 3.0 CDA
Health 5th 0 0
Tech Comp Educ Family Resource Aides 1.0
Math 4.0 5.0 6th 48 83
Music School and Family Support 1.0
Science 2.0 4.0 7th 44 70
Social Studies 2.0 3.0 Nurse 1.0 1.0
English 4.0 6.0 8th 43 53
Physical Education Custodial Staff 2.0
Special Education 1.0 1.0 9th 47 69
Pre-K Security 2.0 2.0
Kindergarten 10th 38 53
Bilingual Gym & Pool Asst
TESOL/ELL 11th 31 40
Speech M&C Journeyman
Library Media 12th 29 32
Coach Tech Support
Other
Other 6.0 6.0
Social Workers 1.0 1.0
Guidance Counselors
19.0 27.0 280 400 11.0 13.0Total Total Total
Adopted
Staffing Total 30.0 40.0
Adopted
146

This page intentionally left blank.
147

Classical Magnet
0 0
0 0
0 0
55 356,565
116 827,312
207 1,744,596
0 0
35 10,990
10 6,270
2 5,186
19 88,882
4 30,400
1 13,981
0 0
Grade Weights
Pre K
K
1-3
4-6
7-8
9-12
Weight Per Capita
Projected
Enrollment/
Hours $
X
X
X
X
X
=
=
=
=
=
Need Weights
Academic Intervention*
DRA (K-3)
26 16,302
Achievement (4-12)
Well Below Standards X =
X =
X =
X =
X =
X =
=
Below Standards
High Achievement (Lvl 5)
English Language Learners
0-30 Months
Special Education
Level 1
XLevel 2
XLevel 3
XLevel 4
=
=
=
Total WSF FORMULA = 3,113,842
X
2 3,242X =Trans to Mainstream
12 10,116X =30 + Months
6,0001.26
5,5110.85
7,7791.20
6,4831.00
7,1321.10
8,4281.30
6270.10
6270.10
3140.05
6270.10
2,5930.40
1,6210.25
8430.13
4,6780.80
7,6001.30
13,9812.40
23,7354.07
Foundation = 0
Federal/State Categorical = 4,821,893
GRAND TOTAL ALL FUNDS FY = 8,299,231
751
$11,051
Total WSF = 3,113,842
Enrollment
Per Pupil Funding
Utilities = 283,692
Special Ed. Programs = 79,804
10/11
Other Programs = 0
ADOPTED BUDGET
148

Classical Magnet
09/10 10/11
Adopted Difference
FY FY 10/11FY
Adopted
$ FTE $FTE$ FTE
BUDGET FUND 1003
110 Certified Salaries $1,837,443 25.3 $1,789,158 24.0 ($48,285) -1.3
120 Non-Certified Salaries $582,965 14.0 $507,154 12.0 ($75,811) -2.0
$2,420,408 39.3Total Salaries $2,296,312 36.0 ($124,096) -3.3
900 Fringe Benefits $792,665 $805,346 $12,681 0.0
$792,665Total Benefits $805,346 $12,681 0.0
322 Instr. Impr. Services $10,000 $0 ($10,000) 0.0
611 Supplies & Materials $56,314 $91,988 $35,674 0.0
620 Utilities $440,049 $283,692 ($156,357) 0.0
$506,363Total Operating Expenses $375,680 ($130,683) 0.0
$3,719,436 39.3TOTAL BUDGET FUND $3,477,338 36.0 ($242,098) -3.31003
BUDGET FUND 2007
110 Certified Salaries $2,057,154 36.0 $2,274,130 38.0 $216,976 2.0
110 Part Time Certified Salaries $377,000 $377,000 $0 0.0
120 Non-Certified Salaries $499,229 19.5 $413,253 12.0 ($85,976) -7.5
120 Part Time Non-Certified Salaries $151,195 $151,000 ($195) 0.0
$3,084,578 55.5Total Salaries $3,215,383 50.0 $130,805 -5.5
900 Fringe Benefits $829,143 $932,328 $103,185 0.0
$829,143Total Benefits $932,328 $103,185 0.0
322 Instr. Impr. Services $43,800 $6,000 ($37,800) 0.0
324 Field Trips $106,863 $85,000 ($21,863) 0.0
325 Parent Activities $3,128 $3,413 $285 0.0
330 Other Prof. Tech Svs/MHIS $135,000 $135,000 $0 0.0
430 Maintenance Contracts $14,838 $47,000 $32,162 0.0
510 Transportation $40,000 $40,000 $0 0.0
530 Communications $9,000 $9,000 $0 0.0
611 Supplies & Materials $160,098 $154,768 ($5,330) 0.0
890 Athletics Activies $20,000 $0 ($20,000) 0.0
899 Other Operating Exp. $52,855 $44,000 ($8,855) 0.0
901 Mandated Compensatory Education $150,000 $150,000 0.0
$585,582Total Operating Expenses $674,181 $88,599 0.0
$4,499,303 55.5TOTAL BUDGET FUND $4,821,892 50.0 $322,589 -5.52007
$8,218,739 94.8GRAND TOTAL ALL FUNDS $8,299,231 86.0 $80,491 -8.8
149

Classical Magnet
Certified Staff Enrollment Non-Certified Staff
STAFFING and ENROLLMENT
Adopted Actual Projected Adopted
09/10 10/11 09/10 10/11 09/10 10/11
Adopted Adopted
Principals 1.0 1.0 Clerical Support 7.0 7.0
Pre-K 0 0
Associate/Assistant Principal 2.0 2.0 Paraprofessionals
K 0 0 Classroom 1.0
Dean Special Education
Teachers 1st 0 0 Other - Special Educ 2.5 2.0
Pre-K
Regular 1.0 2nd 0 0 Kindergarten
Associate Teacher Other Para 12.0 1.0
Art 3.0 3.0 3rd 0 0
Business Prev/Interv Staff
Reading 4th 0 0
Foreign Language 7.0 7.0 CDA
Health 5th 0 0
Tech Comp Educ 1.0 1.0 Family Resource Aides 1.0 1.0
Math 8.0 8.0 6th 109 110
Music 3.3 3.0 School and Family Support
Science 7.0 7.0 7th 116 109
Social Studies 7.0 7.0 Nurse 1.0 1.0
English 10.0 10.0 8th 110 114
Physical Education 3.0 4.0 Custodial Staff 6.0 6.0
Special Education 2.0 2.0 9th 119 109
Pre-K Security 2.0 2.0
Kindergarten 10th 104 118
Bilingual Gym & Pool Asst
TESOL/ELL 11th 88 103
Speech M&C Journeyman
Library Media 1.0 1.0 12th 70 88
Coach 1.0 Tech Support 1.0 1.0
Other
Other 1.0 2.0
Social Workers 1.0 1.0
Guidance Counselors 4.0 4.0
61.3 62.0 716 751 33.5 24.0Total Total Total
Adopted
Staffing Total 94.8 86.0
Adopted
150

This page intentionally left blank.
151

Hartford's Insurance & Finance Academy
0 0
0 0
0 0
0 0
0 0
300 2,528,400
0 0
19 5,966
0 0
7 18,151
34 159,052
5 38,000
0 0
0 0
Grade Weights
Pre K
K
1-3
4-6
7-8
9-12
Weight Per Capita
Projected
Enrollment/
Hours $
X
X
X
X
X
=
=
=
=
=
Need Weights
Academic Intervention*
DRA (K-3)
22 13,794
Achievement (4-12)
Well Below Standards X =
X =
X =
X =
X =
X =
=
Below Standards
High Achievement (Lvl 5)
English Language Learners
0-30 Months
Special Education
Level 1
XLevel 2
XLevel 3
XLevel 4
=
=
=
Total WSF FORMULA = 2,792,803
X
1 1,621X =Trans to Mainstream
33 27,819X =30 + Months
6,0001.26
5,5110.85
7,7791.20
6,4831.00
7,1321.10
8,4281.30
6270.10
6270.10
3140.05
6270.10
2,5930.40
1,6210.25
8430.13
4,6780.80
7,6001.30
13,9812.40
23,7354.07
Foundation = 265,000
Federal/State Categorical = 158,076
GRAND TOTAL ALL FUNDS FY = 3,339,938
300
$11,133
Total WSF = 3,057,803
Enrollment
Per Pupil Funding
Utilities = 84,158
Special Ed. Programs = 39,901
10/11
Other Programs = 0
ADOPTED BUDGET
152

Hartford's Insurance & Finance Academy
09/10 10/11
Adopted Difference
FY FY 10/11FY
Adopted
$ FTE $FTE$ FTE
BUDGET FUND 1003
110 Certified Salaries $1,412,293 19.0 $1,783,425 24.0 $371,132 5.0
110 Part Time Certified Salaries $33,000 $33,000 $0 0.0
120 Non-Certified Salaries $217,849 5.7 $369,769 7.6 $151,920 1.9
120 Part Time Non-Certified Salaries $18,000 $18,000 $0 0.0
$1,681,142 24.7Total Salaries $2,204,194 31.6 $523,052 6.9
900 Fringe Benefits $493,982 $740,020 $246,038 0.0
$493,982Total Benefits $740,020 $246,038 0.0
324 Field Trips $1,000 $1,000 $0 0.0
325 Parent Activities $1,000 $1,000 $0 0.0
330 Other Prof. Tech Svs/MHIS $26,053 $35,100 $9,047 0.0
430 Maintenance Contracts $16,578 $18,784 $2,206 0.0
530 Communications $5,000 $5,000 $0 0.0
611 Supplies & Materials $100,882 $91,607 ($9,275) 0.0
620 Utilities $40,000 $84,158 $44,158 0.0
899 Other Operating Exp. $1,000 $1,000 $0 0.0
$191,513Total Operating Expenses $237,649 $46,136 0.0
$2,366,637 24.7TOTAL BUDGET FUND $3,181,863 31.6 $815,226 6.91003
BUDGET FUND 2007
120 Non-Certified Salaries $110,750 1.8 $89,425 1.9 ($21,325) 0.1
120 Part Time Non-Certified Salaries $1,858 $0 0.0 ($1,858) 0.0
$112,608 1.8Total Salaries $89,425 1.9 ($23,183) 0.1
900 Fringe Benefits $56,935 $43,165 ($13,769) 0.0
$56,935Total Benefits $43,165 ($13,769) 0.0
322 Instr. Impr. Services $1,000 $1,000 0.0 $0 0.0
325 Parent Activities $1,714 $1,777 0.0 $63 0.0
330 Other Prof. Tech Svs/MHIS $13,600 $8,600 0.0 ($5,000) 0.0
510 Transportation $1,000 $1,000 0.0 $0 0.0
580 Travel/Conferences & Seminars $3,000 $3,000 0.0 $0 0.0
611 Supplies & Materials $89,775 $10,108 0.0 ($79,667) 0.0
700 Equipment $240,000 $0 ($240,000) 0.0
899 Other Operating Exp. $47,104 $0 0.0 ($47,104) 0.0
$397,193Total Operating Expenses $25,485 0.0 ($371,708) 0.0
$566,736 1.8TOTAL BUDGET FUND $158,075 1.9 ($408,660) 0.12007
$2,933,372 26.5GRAND TOTAL ALL FUNDS $3,339,938 33.5 $406,566 7.0
153

Hartford's Insurance & Finance Academy
Certified Staff Enrollment Non-Certified Staff
STAFFING and ENROLLMENT
Adopted Actual Projected Adopted
09/10 10/11 09/10 10/11 09/10 10/11
Adopted Adopted
Principals 1.0 1.0 Clerical Support 1.0 1.0
Pre-K 0 0
Associate/Assistant Principal Paraprofessionals
K 0 0 Classroom
Dean 1.0 Special Education
Teachers 1st 0 0 Other - Special Educ 1.0
Pre-K
Regular 2nd 0 0 Kindergarten
Associate Teacher Other Para
Art 1.0 3rd 0 0
Business 2.0 2.0 Prev/Interv Staff 1.0 2.0
Reading 1.0 1.0 4th 0 0
Foreign Language 1.0 1.0 CDA
Health 0.5 0.5 5th 0 0
Tech Comp Educ Family Resource Aides 1.0
Math 2.0 3.0 6th 0 0
Music School and Family Support 1.0
Science 2.0 3.0 7th 0 0
Social Studies 2.0 3.0 Nurse 0.5 0.5
English 2.0 3.0 8th 0 0
Physical Education 0.5 1.0 Custodial Staff 2.0 2.0
Special Education 2.0 2.0 9th 135 100
Pre-K Security 1.0 1.0
Kindergarten 10th 65 130
Bilingual Gym & Pool Asst
TESOL/ELL 1.0 1.0 11th 70
Speech M&C Journeyman
Library Media 12th 0
Coach Tech Support
Other
Other 1.0 1.0
Social Workers 0.5
Guidance Counselors 1.0 1.0
19.0 24.0 200 300 7.5 9.5Total Total Total
Adopted
Staffing Total 26.5 33.5
Adopted
154

This page intentionally left blank.
155

9th Grade Academy @HPHS
0 0
0 0
0 0
0 0
0 0
400 3,371,200
0 0
74 23,236
0 0
30 77,790
101 472,478
24 182,400
2 27,962
0 0
Grade Weights
Pre K
K
1-3
4-6
7-8
9-12
Weight Per Capita
Projected
Enrollment/
Hours $
X
X
X
X
X
=
=
=
=
=
Need Weights
Academic Intervention*
DRA (K-3)
78 48,906
Achievement (4-12)
Well Below Standards X =
X =
X =
X =
X =
X =
=
Below Standards
High Achievement (Lvl 5)
English Language Learners
0-30 Months
Special Education
Level 1
XLevel 2
XLevel 3
XLevel 4
=
=
=
Total WSF FORMULA = 4,278,869
X
2 3,242X =Trans to Mainstream
85 71,655X =30 + Months
6,0001.26
5,5110.85
7,7791.20
6,4831.00
7,1321.10
8,4281.30
6270.10
6270.10
3140.05
6270.10
2,5930.40
1,6210.25
8430.13
4,6780.80
7,6001.30
13,9812.40
23,7354.07
Foundation = 0
Federal/State Categorical = 226,527
GRAND TOTAL ALL FUNDS FY = 4,806,641
400
$12,017
Total WSF = 4,278,869
Enrollment
Per Pupil Funding
Utilities = 221,443
Special Ed. Programs = 79,802
10/11
Other Programs = 0
ADOPTED BUDGET
156

9th Grade Academy @HPHS
09/10 10/11
Adopted Difference
FY FY 10/11FY
Adopted
$ FTE $FTE$ FTE
BUDGET FUND 1003
110 Certified Salaries $2,241,397 31.1 $2,548,091 34.1 $306,694 3.0
110 Part Time Certified Salaries $68,506 $81,500 $12,994 0.0
120 Non-Certified Salaries $515,050 15.0 $402,776 10.5 ($112,274) -4.5
120 Part Time Non-Certified Salaries $22,000 $24,500 $2,500 0.0
$2,846,953 46.1Total Salaries $3,056,867 44.6 $209,914 -1.5
900 Fringe Benefits $870,483 $996,723 $126,240 0.0
$870,483Total Benefits $996,723 $126,240 0.0
322 Instr. Impr. Services $4,489 $4,489 $0 0.0
324 Field Trips $7,000 $7,000 $0 0.0
330 Other Prof. Tech Svs/MHIS $44,933 $34,800 ($10,133) 0.0
430 Maintenance Contracts $20,000 $12,638 ($7,362) 0.0
510 Transportation $14,883 $14,883 0.0
530 Communications $5,000 $5,000 $0 0.0
580 Travel/Conferences & Seminars $2,000 $2,000 $0 0.0
611 Supplies & Materials $484,091 $188,322 ($295,769) 0.0
620 Utilities $237,730 $221,443 ($16,287) 0.0
700 Equipment $18,870 $14,000 ($4,870) 0.0
890 Athletics Activies $114,352 $2,450 ($111,902) 0.0
899 Other Operating Exp. $8,100 $19,500 $11,400 0.0
$946,565Total Operating Expenses $526,525 ($420,040) 0.0
$4,664,001 46.1TOTAL BUDGET FUND $4,580,115 44.6 ($83,886) -1.51003
BUDGET FUND 2007
110 Certified Salaries $36,838 0.8 $0 0.0 ($36,838) -0.8
110 Part Time Certified Salaries $33,771 $33,771 0.0 $0 0.0
120 Non-Certified Salaries $95,022 2.1 $101,976 2.0 $6,954 -0.1
120 Part Time Non-Certified Salaries $9,142 $6,745 0.0 ($2,397) 0.0
$174,773 2.9Total Salaries $142,492 2.0 ($32,281) -0.9
900 Fringe Benefits $59,815 $50,229 ($9,585) 0.0
$59,815Total Benefits $50,229 ($9,585) 0.0
325 Parent Activities $2,571 $3,355 0.0 $784 0.0
611 Supplies & Materials $40,021 $30,450 0.0 ($9,571) 0.0
$42,592Total Operating Expenses $33,805 0.0 ($8,787) 0.0
$277,180 2.9TOTAL BUDGET FUND $226,526 2.0 ($50,653) -0.92007
$4,941,181 49.0GRAND TOTAL ALL FUNDS $4,806,641 46.6 ($134,540) -2.4
157

9th Grade Academy @HPHS
Certified Staff Enrollment Non-Certified Staff
STAFFING and ENROLLMENT
Adopted Actual Projected Adopted
09/10 10/11 09/10 10/11 09/10 10/11
Adopted Adopted
Principals 1.3 1.0 Clerical Support 2.1 2.0
Pre-K 0 0
Associate/Assistant Principal 0.3 Paraprofessionals
K 0 0 Classroom
Dean 1.0 1.0 Special Education
Teachers 1st 0 0 Other - Special Educ 6.0 2.0
Pre-K
Regular 2nd 0 0 Kindergarten
Associate Teacher 1.0 Other Para
Art 3rd 0 0
Business Prev/Interv Staff 3.0 2.0
Reading 4th 0 0
Foreign Language CDA
Health 1.0 1.0 5th 0 0
Tech Comp Educ 1.0 1.0 Family Resource Aides
Math 4.0 4.0 6th 0 0
Music School and Family Support 1.0
Science 3.0 4.0 7th 0 0
Social Studies 3.0 4.0 Nurse 0.3 0.3
English 5.0 6.0 8th 0 0
Physical Education 1.0 Custodial Staff 3.3 3.0
Special Education 5.0 5.0 9th 400 400
Pre-K Security 1.3 1.3
Kindergarten 10th 0 0
Bilingual 2.0 2.0 Gym & Pool Asst 0.5 0.5
TESOL/ELL 1.0 1.0 11th 0 0
Speech 0.1 0.6 M&C Journeyman 0.3 0.3
Library Media 0.5 0.3 12th 0 0
Coach 1.0 Tech Support 0.5 0.3
Other
Other
Social Workers 1.0 1.0
Guidance Counselors 1.0 1.0
31.9 34.1 400 400 17.1 12.5Total Total Total
Adopted
Staffing Total 49.0 46.6
Adopted
158

This page intentionally left blank.
159

Academy of Engineering & Green Technologies @ HPHS
0 0
0 0
0 0
0 0
0 0
400 3,371,200
0 0
33 10,362
1 627
20 51,860
52 243,256
18 136,800
3 41,943
0 0
Grade Weights
Pre K
K
1-3
4-6
7-8
9-12
Weight Per Capita
Projected
Enrollment/
Hours $
X
X
X
X
X
=
=
=
=
=
Need Weights
Academic Intervention*
DRA (K-3)
40 25,080
Achievement (4-12)
Well Below Standards X =
X =
X =
X =
X =
X =
=
Below Standards
High Achievement (Lvl 5)
English Language Learners
0-30 Months
Special Education
Level 1
XLevel 2
XLevel 3
XLevel 4
=
=
=
Total WSF FORMULA = 3,953,496
X
2 3,242X =Trans to Mainstream
82 69,126X =30 + Months
6,0001.26
5,5110.85
7,7791.20
6,4831.00
7,1321.10
8,4281.30
6270.10
6270.10
3140.05
6270.10
2,5930.40
1,6210.25
8430.13
4,6780.80
7,6001.30
13,9812.40
23,7354.07
Foundation = 0
Federal/State Categorical = 315,709
GRAND TOTAL ALL FUNDS FY = 4,570,453
400
$11,426
Total WSF = 3,953,496
Enrollment
Per Pupil Funding
Utilities = 221,444
Special Ed. Programs = 79,804
10/11
Other Programs = 0
ADOPTED BUDGET
160

Academy of Engineering & Green Technologies @ HPHS
09/10 10/11
Adopted Difference
FY FY 10/11FY
Adopted
$ FTE $FTE$ FTE
BUDGET FUND 1003
110 Certified Salaries $2,298,805 32.3 $2,390,714 31.9 $91,909 -0.4
110 Part Time Certified Salaries $51,175 $97,675 $46,500 0.0
120 Non-Certified Salaries $410,759 11.4 $367,948 10.1 ($42,811) -1.3
120 Part Time Non-Certified Salaries $23,000 $30,500 $7,500 0.0
$2,783,739 43.7Total Salaries $2,886,837 42.0 $103,098 -1.7
900 Fringe Benefits $832,079 $931,620 $99,541 0.0
$832,079Total Benefits $931,620 $99,541 0.0
322 Instr. Impr. Services $25,000 $25,000 $0 0.0
324 Field Trips $10,000 $10,000 $0 0.0
330 Other Prof. Tech Svs/MHIS $54,933 $49,800 ($5,133) 0.0
430 Maintenance Contracts $23,869 $15,633 ($8,236) 0.0
510 Transportation $0 $14,883 $14,883 0.0
530 Communications $500 $500 $0 0.0
611 Supplies & Materials $390,401 $53,977 ($336,424) 0.0
620 Utilities $237,730 $221,444 ($16,286) 0.0
700 Equipment $16,000 $22,000 $6,000 0.0
890 Athletics Activies $114,352 $2,450 ($111,902) 0.0
899 Other Operating Exp. $5,100 $20,600 $15,500 0.0
$877,885Total Operating Expenses $436,287 ($441,598) 0.0
$4,493,703 43.7TOTAL BUDGET FUND $4,254,744 42.0 ($238,959) -1.71003
BUDGET FUND 2007
110 Certified Salaries $25,000 0.6 $102,605 1.2 $77,605 0.6
110 Part Time Certified Salaries $22,834 $10,000 0.0 ($12,834) 0.0
120 Non-Certified Salaries $69,683 1.7 $78,317 1.7 $8,634 0.0
120 Part Time Non-Certified Salaries $10,500 $10,500 0.0 $0 0.0
$128,017 2.3Total Salaries $201,422 2.9 $73,405 0.6
900 Fringe Benefits $43,585 $70,898 $27,313 0.0
$43,585Total Benefits $70,898 $27,313 0.0
322 Instr. Impr. Services $6,000 $6,000 0.0 $0 0.0
325 Parent Activities $3,085 $3,409 0.0 $324 0.0
330 Other Prof. Tech Svs/MHIS $46,384 $1,000 0.0 ($45,384) 0.0
510 Transportation $1,000 $1,000 0.0 $0 0.0
580 Travel/Conferences & Seminars $3,000 $0 ($3,000) 0.0
611 Supplies & Materials $41,450 $29,979 0.0 ($11,471) 0.0
899 Other Operating Exp. $2,001 $2,001 0.0 $0 0.0
$102,920Total Operating Expenses $43,389 0.0 ($59,531) 0.0
$274,522 2.3TOTAL BUDGET FUND $315,709 2.9 $41,187 0.62007
$4,768,225 46.0GRAND TOTAL ALL FUNDS $4,570,453 44.9 ($197,772) -1.1
161

Academy of Engineering & Green Technologies @ HPHS
Certified Staff Enrollment Non-Certified Staff
STAFFING and ENROLLMENT
Adopted Actual Projected Adopted
09/10 10/11 09/10 10/11 09/10 10/11
Adopted Adopted
Principals 1.3 1.0 Clerical Support 1.1 1.0
Pre-K 0 0
Associate/Assistant Principal 0.3 Paraprofessionals
K 0 0 Classroom
Dean 2.0 1.0 Special Education
Teachers 1st 0 0 Other - Special Educ 2.0 2.0
Pre-K
Regular 2nd 0 0 Kindergarten
Associate Teacher 2.0 Other Para 1.0 1.0
Art 3rd 0 0
Business Prev/Interv Staff 2.0 1.0
Reading 1.0 1.0 4th 0 0
Foreign Language 1.0 1.5 CDA
Health 5th 0 0
Tech Comp Educ 2.0 2.0 Family Resource Aides
Math 5.0 5.0 6th 0 0
Music 1.0 1.0 School and Family Support 1.0 1.0
Science 3.0 4.0 7th 0 0
Social Studies 1.0 2.0 Nurse 0.3 0.3
English 3.0 4.0 8th 0 0
Physical Education 1.0 1.0 Custodial Staff 3.3 3.0
Special Education 4.0 4.0 9th 0 134
Pre-K Security 1.3 1.3
Kindergarten 10th 163 133
Bilingual Gym & Pool Asst 0.5 0.5
TESOL/ELL 3.0 2.0 11th 140 133
Speech 0.1 0.1 M&C Journeyman 0.3 0.3
Library Media 0.5 0.3 12th 97 0
Coach 1.0 Tech Support 0.5 0.3
Other
Other 0.3
Social Workers 1.0 1.0
Guidance Counselors 1.0 1.0
32.9 33.1 400 400 13.1 11.8Total Total Total
Adopted
Staffing Total 46.0 44.9
Adopted
162

This page intentionally left blank.
163

Law & Government Academy @ HPHS
0 0
0 0
0 0
0 0
0 0
400 3,371,200
0 0
40 12,560
0 0
27 70,011
45 210,510
23 174,800
6 83,886
0 0
Grade Weights
Pre K
K
1-3
4-6
7-8
9-12
Weight Per Capita
Projected
Enrollment/
Hours $
X
X
X
X
X
=
=
=
=
=
Need Weights
Academic Intervention*
DRA (K-3)
25 15,675
Achievement (4-12)
Well Below Standards X =
X =
X =
X =
X =
X =
=
Below Standards
High Achievement (Lvl 5)
English Language Learners
0-30 Months
Special Education
Level 1
XLevel 2
XLevel 3
XLevel 4
=
=
=
Total WSF FORMULA = 3,997,910
X
9 14,589X =Trans to Mainstream
53 44,679X =30 + Months
6,0001.26
5,5110.85
7,7791.20
6,4831.00
7,1321.10
8,4281.30
6270.10
6270.10
3140.05
6270.10
2,5930.40
1,6210.25
8430.13
4,6780.80
7,6001.30
13,9812.40
23,7354.07
Foundation = 0
Federal/State Categorical = 228,953
GRAND TOTAL ALL FUNDS FY = 4,805,154
400
$12,013
Total WSF = 3,997,910
Enrollment
Per Pupil Funding
Utilities = 221,444
Special Ed. Programs = 356,847
10/11
Other Programs = 0
ADOPTED BUDGET
164

Law & Government Academy @ HPHS
09/10 10/11
Adopted Difference
FY FY 10/11FY
Adopted
$ FTE $FTE$ FTE
BUDGET FUND 1003
110 Certified Salaries $2,280,393 31.3 $2,429,557 32.3 $149,164 1.0
110 Part Time Certified Salaries $83,427 $128,630 $45,203 0.0
120 Non-Certified Salaries $500,934 15.2 $542,343 14.8 $41,409 -0.4
120 Part Time Non-Certified Salaries $34,096 $17,800 ($16,296) 0.0
$2,898,850 46.5Total Salaries $3,118,330 47.2 $219,480 0.7
900 Fringe Benefits $874,253 $1,027,010 $152,757 0.0
$874,253Total Benefits $1,027,010 $152,757 0.0
322 Instr. Impr. Services $15,000 $1,000 ($14,000) 0.0
324 Field Trips $7,000 $0 ($7,000) 0.0
330 Other Prof. Tech Svs/MHIS $49,933 $34,800 ($15,133) 0.0
430 Maintenance Contracts $17,913 $18,385 $472 0.0
510 Transportation $14,883 $14,883 0.0
530 Communications $5,000 $2,000 ($3,000) 0.0
580 Travel/Conferences & Seminars $5,000 $0 ($5,000) 0.0
611 Supplies & Materials $374,162 $112,897 ($261,265) 0.0
620 Utilities $237,730 $221,444 ($16,286) 0.0
700 Equipment $28,500 $7,500 ($21,000) 0.0
890 Athletics Activies $114,352 $2,450 ($111,902) 0.0
899 Other Operating Exp. $5,600 $15,500 $9,900 0.0
$860,190Total Operating Expenses $430,859 ($429,331) 0.0
$4,633,293 46.5TOTAL BUDGET FUND $4,576,199 47.2 ($57,094) 0.71003
BUDGET FUND 2007
110 Certified Salaries $7,268 0.4 $71,539 1.3 $64,271 0.9
110 Part Time Certified Salaries $8,000 $4,000 0.0 ($4,000) 0.0
120 Non-Certified Salaries $115,574 2.9 $49,387 1.0 ($66,187) -1.9
120 Part Time Non-Certified Salaries $0 $4,000 0.0 $4,000 0.0
$130,842 3.3Total Salaries $128,926 2.3 ($1,916) -1.0
900 Fringe Benefits $61,335 $46,616 ($14,719) 0.0
$61,335Total Benefits $46,616 ($14,719) 0.0
325 Parent Activities $3,085 $3,418 0.0 $333 0.0
330 Other Prof. Tech Svs/MHIS $19,220 $0 0.0 ($19,220) 0.0
530 Communications $0 $1,587 0.0 $1,587 0.0
611 Supplies & Materials $21,942 $48,408 0.0 $26,466 0.0
$44,247Total Operating Expenses $53,413 0.0 $9,166 0.0
$236,424 3.3TOTAL BUDGET FUND $228,955 2.3 ($7,469) -1.02007
$4,869,717 49.8GRAND TOTAL ALL FUNDS $4,805,154 49.5 ($64,563) -0.3
165

Law & Government Academy @ HPHS
Certified Staff Enrollment Non-Certified Staff
STAFFING and ENROLLMENT
Adopted Actual Projected Adopted
09/10 10/11 09/10 10/11 09/10 10/11
Adopted Adopted
Principals 1.3 1.0 Clerical Support 1.1 1.0
Pre-K 0 0
Associate/Assistant Principal 0.3 Paraprofessionals
K 0 0 Classroom
Dean 2.0 1.0 Special Education 1.0
Teachers 1st 0 0 Other - Special Educ 4.0 4.0
Pre-K
Regular 2nd 0 0 Kindergarten
Associate Teacher Other Para 3.0 1.0
Art 1.0 2.0 3rd 0 0
Business Prev/Interv Staff 2.0 2.0
Reading 1.0 1.0 4th 0 0
Foreign Language 2.0 2.0 CDA
Health 5th 0 0
Tech Comp Educ 1.0 1.0 Family Resource Aides 1.0
Math 3.0 4.0 6th 0 0
Music School and Family Support 1.0 1.0
Science 3.0 3.0 7th 0 0
Social Studies 3.0 4.0 Nurse 0.3 0.3
English 3.0 3.0 8th 0 0
Physical Education 1.0 1.0 Custodial Staff 3.3 3.0
Special Education 5.0 5.0 9th 21 0
Pre-K Security 1.3 1.3
Kindergarten 10th 170 134
Bilingual Gym & Pool Asst 0.5 0.5
TESOL/ELL 2.0 2.0 11th 118 133
Speech 0.1 0.3 M&C Journeyman 0.3 0.3
Library Media 0.5 0.3 12th 91 133
Coach Tech Support 0.5 0.3
Other 1.0
Other 0.3
Social Workers 0.8 0.8
Guidance Counselors 1.0 2.0
31.7 33.6 400 400 18.1 15.8Total Total Total
Adopted
Staffing Total 49.8 49.5
Adopted
166

This page intentionally left blank.
167

Nursing Academy @ HPHS
0 0
0 0
0 0
0 0
0 0
400 3,371,200
0 0
39 12,246
0 0
21 54,453
34 159,052
16 121,600
8 111,848
0 0
Grade Weights
Pre K
K
1-3
4-6
7-8
9-12
Weight Per Capita
Projected
Enrollment/
Hours $
X
X
X
X
X
=
=
=
=
=
Need Weights
Academic Intervention*
DRA (K-3)
30 18,810
Achievement (4-12)
Well Below Standards X =
X =
X =
X =
X =
X =
=
Below Standards
High Achievement (Lvl 5)
English Language Learners
0-30 Months
Special Education
Level 1
XLevel 2
XLevel 3
XLevel 4
=
=
=
Total WSF FORMULA = 3,920,344
X
8 12,968X =Trans to Mainstream
69 58,167X =30 + Months
6,0001.26
5,5110.85
7,7791.20
6,4831.00
7,1321.10
8,4281.30
6270.10
6270.10
3140.05
6270.10
2,5930.40
1,6210.25
8430.13
4,6780.80
7,6001.30
13,9812.40
23,7354.07
Foundation = 0
Federal/State Categorical = 278,626
GRAND TOTAL ALL FUNDS FY = 4,821,276
400
$12,053
Total WSF = 3,920,344
Enrollment
Per Pupil Funding
Utilities = 221,444
Special Ed. Programs = 239,412
10/11
Other Programs = 161,450
ADOPTED BUDGET
168

Nursing Academy @ HPHS
09/10 10/11
Adopted Difference
FY FY 10/11FY
Adopted
$ FTE $FTE$ FTE
BUDGET FUND 1003
110 Certified Salaries $2,504,291 34.3 $2,264,715 30.5 ($239,576) -3.8
110 Part Time Certified Salaries $42,038 $99,538 $57,500 0.0
120 Non-Certified Salaries $501,564 15.2 $666,618 19.5 $165,054 4.3
120 Part Time Non-Certified Salaries $10,616 $12,035 $1,419 0.0
$3,058,509 49.6Total Salaries $3,042,906 50.0 ($15,603) 0.4
900 Fringe Benefits $933,077 $1,035,226 $102,149 0.0
$933,077Total Benefits $1,035,226 $102,149 0.0
324 Field Trips $3,361 $3,361 $0 0.0
330 Other Prof. Tech Svs/MHIS $39,933 $34,800 ($5,133) 0.0
430 Maintenance Contracts $11,000 $10,663 ($337) 0.0
510 Transportation $0 $14,883 $14,883 0.0
530 Communications $1,000 $1,000 $0 0.0
611 Supplies & Materials $116,630 $150,318 $33,688 0.0
620 Utilities $237,730 $221,444 ($16,286) 0.0
700 Equipment $0 $6,000 $6,000 0.0
890 Athletics Activies $114,352 $2,450 ($111,902) 0.0
899 Other Operating Exp. $4,100 $19,600 $15,500 0.0
$528,106Total Operating Expenses $464,519 ($63,587) 0.0
$4,519,692 49.6TOTAL BUDGET FUND $4,542,651 50.0 $22,959 0.41003
BUDGET FUND 2007
110 Certified Salaries $34,592 0.7 $31,368 0.2 ($3,224) -0.5
110 Part Time Certified Salaries $13,432 $10,000 0.0 ($3,432) 0.0
120 Non-Certified Salaries $116,532 2.9 $115,268 2.3 ($1,264) -0.6
120 Part Time Non-Certified Salaries $1,805 $1,805 0.0 $0 0.0
$166,361 3.5Total Salaries $158,441 2.5 ($7,920) -1.0
900 Fringe Benefits $69,385 $65,751 ($3,635) 0.0
$69,385Total Benefits $65,751 ($3,635) 0.0
322 Instr. Impr. Services $1,000 $1,000 0.0 $0 0.0
325 Parent Activities $3,085 $3,553 0.0 $468 0.0
330 Other Prof. Tech Svs/MHIS $7,600 $7,600 0.0 $0 0.0
510 Transportation $1,000 $1,000 0.0 $0 0.0
580 Travel/Conferences & Seminars $1,500 $1,500 0.0 $0 0.0
611 Supplies & Materials $25,974 $24,781 0.0 ($1,193) 0.0
700 Equipment $5,000 $15,000 0.0 $10,000 0.0
$45,159Total Operating Expenses $54,434 0.0 $9,275 0.0
$280,905 3.5TOTAL BUDGET FUND $278,626 2.5 ($2,280) -1.02007
$4,800,597 53.1GRAND TOTAL ALL FUNDS $4,821,276 52.5 $20,679 -0.6
169

Nursing Academy @ HPHS
Certified Staff Enrollment Non-Certified Staff
STAFFING and ENROLLMENT
Adopted Actual Projected Adopted
09/10 10/11 09/10 10/11 09/10 10/11
Adopted Adopted
Principals 1.3 1.0 Clerical Support 1.1 1.0
Pre-K 0 0
Associate/Assistant Principal 0.3 Paraprofessionals
K 0 0 Classroom 1.0
Dean Special Education
Teachers 1st 0 0 Other - Special Educ 6.0 6.0
Pre-K 2.0
Regular 2nd 0 0 Kindergarten
Associate Teacher Other Para 2.0 1.0
Art 1.0 1.0 3rd 0 0
Business Prev/Interv Staff 2.0 2.0
Reading 1.0 1.0 4th 0 0
Foreign Language 1.0 2.0 CDA 2.0
Health 5th 0 0
Tech Comp Educ Family Resource Aides
Math 5.0 5.0 6th 0 0
Music School and Family Support 1.0
Science 5.0 5.0 7th 0 0
Social Studies 4.0 3.0 Nurse 0.3 0.3
English 4.0 4.0 8th 0 0
Physical Education 1.0 1.0 Custodial Staff 3.3 3.0
Special Education 4.0 3.0 9th 12 0
Pre-K Security 1.3 1.3
Kindergarten 10th 162 134
Bilingual Gym & Pool Asst 0.5 0.5
TESOL/ELL 1.0 1.0 11th 114 133
Speech 0.2 0.2 M&C Journeyman 0.3 0.3
Library Media 0.5 0.3 12th 112 133
Coach Tech Support 0.5 0.3
Other 4.0 1.0
Other 1.3
Social Workers 1.0 1.0
Guidance Counselors 1.0 1.0
35.0 30.7 400 400 18.1 21.8Total Total Total
Adopted
Staffing Total 53.1 52.5
Adopted
170

This page intentionally left blank.
171

Journalism & Media Academy
0 0
0 0
0 0
0 0
0 0
285 2,401,980
0 0
9 2,826
1 627
5 12,965
27 126,306
2 15,200
7 97,867
0 0
Grade Weights
Pre K
K
1-3
4-6
7-8
9-12
Weight Per Capita
Projected
Enrollment/
Hours $
X
X
X
X
X
=
=
=
=
=
Need Weights
Academic Intervention*
DRA (K-3)
10 6,270
Achievement (4-12)
Well Below Standards X =
X =
X =
X =
X =
X =
=
Below Standards
High Achievement (Lvl 5)
English Language Learners
0-30 Months
Special Education
Level 1
XLevel 2
XLevel 3
XLevel 4
=
=
=
Total WSF FORMULA = 2,674,157
X
0 0X =Trans to Mainstream
12 10,116X =30 + Months
6,0001.26
5,5110.85
7,7791.20
6,4831.00
7,1321.10
8,4281.30
6270.10
6270.10
3140.05
6270.10
2,5930.40
1,6210.25
8430.13
4,6780.80
7,6001.30
13,9812.40
23,7354.07
Foundation = 265,000
Federal/State Categorical = 221,482
GRAND TOTAL ALL FUNDS FY = 3,572,685
285
$12,536
Total WSF = 2,939,157
Enrollment
Per Pupil Funding
Utilities = 372,145
Special Ed. Programs = 39,901
10/11
Other Programs = 0
ADOPTED BUDGET
172

Journalism & Media Academy
09/10 10/11
Adopted Difference
FY FY 10/11FY
Adopted
$ FTE $FTE$ FTE
BUDGET FUND 1003
110 Certified Salaries $1,244,276 16.8 $1,605,410 21.1 $361,134 4.3
110 Part Time Certified Salaries $47,850 $106,818 $58,968 0.0
120 Non-Certified Salaries $220,648 5.4 $433,380 10.7 $212,732 5.3
120 Part Time Non-Certified Salaries $22,982 $8,800 ($14,182) 0.0
$1,535,756 22.2Total Salaries $2,154,408 31.8 $618,652 9.6
900 Fringe Benefits $450,681 $715,444 $264,762 0.0
$450,681Total Benefits $715,444 $264,762 0.0
324 Field Trips $11,000 $0 ($11,000) 0.0
325 Parent Activities $1,000 $0 ($1,000) 0.0
330 Other Prof. Tech Svs/MHIS $43,801 $24,795 ($19,006) 0.0
430 Maintenance Contracts $15,352 $9,333 ($6,019) 0.0
441 Rental of Facilities $480 $480 0.0
510 Transportation $1,500 $9,600 $8,100 0.0
530 Communications $2,510 $1,000 ($1,510) 0.0
611 Supplies & Materials $177,645 $51,219 ($126,426) 0.0
620 Utilities $211,661 $372,145 $160,484 0.0
700 Equipment $24,000 $0 ($24,000) 0.0
890 Athletics Activies $65,000 $1,021 ($63,979) 0.0
899 Other Operating Exp. $13,740 $11,760 ($1,980) 0.0
$567,209Total Operating Expenses $481,353 ($85,856) 0.0
$2,553,646 22.2TOTAL BUDGET FUND $3,351,205 31.8 $797,558 9.61003
BUDGET FUND 2007
110 Certified Salaries $14,008 0.2 $45,358 1.0 $31,350 0.8
110 Part Time Certified Salaries $0 $15,000 0.0 $15,000 0.0
120 Non-Certified Salaries $134,553 2.1 $75,750 1.5 ($58,803) -0.6
$148,561 2.3Total Salaries $136,108 2.5 ($12,453) 0.2
900 Fringe Benefits $72,763 $50,993 ($21,770) 0.0
$72,763Total Benefits $50,993 ($21,770) 0.0
325 Parent Activities $1,714 $1,506 0.0 ($208) 0.0
330 Other Prof. Tech Svs/MHIS $600 $0 0.0 ($600) 0.0
510 Transportation $1,000 $1,600 0.0 $600 0.0
611 Supplies & Materials $1,014 $6,275 0.0 $5,261 0.0
700 Equipment $25,000 $25,000 0.0 $0 0.0
$29,328Total Operating Expenses $34,381 0.0 $5,053 0.0
$250,652 2.3TOTAL BUDGET FUND $221,482 2.5 ($29,170) 0.22007
$2,804,298 24.5GRAND TOTAL ALL FUNDS $3,572,686 34.3 $768,388 9.8
173

Journalism & Media Academy
Certified Staff Enrollment Non-Certified Staff
STAFFING and ENROLLMENT
Adopted Actual Projected Adopted
09/10 10/11 09/10 10/11 09/10 10/11
Adopted Adopted
Principals 1.0 1.0 Clerical Support 1.5 1.5
Pre-K 0 0
Associate/Assistant Principal Paraprofessionals
K 0 0 Classroom
Dean 1.0 Special Education 1.0
Teachers 1st 0 0 Other - Special Educ 1.0
Pre-K
Regular 2nd 0 0 Kindergarten
Associate Teacher Other Para
Art 1.0 3rd 0 0
Business Prev/Interv Staff 2.0 2.0
Reading 1.0 1.0 4th 0 0
Foreign Language 1.0 1.5 CDA
Health 5th 0 0
Tech Comp Educ 1.0 1.0 Family Resource Aides
Math 2.0 2.0 6th 0 0
Music School and Family Support
Science 2.0 2.0 7th 0 0
Social Studies 2.0 3.0 Nurse 0.2 0.4
English 2.0 3.0 8th 0 0
Physical Education 1.0 1.0 Custodial Staff 1.6 3.0
Special Education 2.0 2.0 9th 100 100
Pre-K Security 1.0 2.0
Kindergarten 10th 100 90
Bilingual Gym & Pool Asst
TESOL/ELL 11th 0 95
Speech 0.1 0.2 M&C Journeyman
Library Media 0.2 0.4 12th 0 0
Coach Tech Support 0.2 0.4
Other 0.2
Other 1.0 1.0
Social Workers 1.0 1.0
Guidance Counselors 0.5 1.0
17.0 22.1 200 285 7.5 12.2Total Total Total
Adopted
Staffing Total 24.5 34.3
Adopted
174

This page intentionally left blank.
175

Pathways to Technology
0 0
0 0
0 0
0 0
0 0
180 1,517,040
0 0
11 3,454
3 1,881
4 10,372
17 79,526
8 60,800
2 27,962
0 0
Grade Weights
Pre K
K
1-3
4-6
7-8
9-12
Weight Per Capita
Projected
Enrollment/
Hours $
X
X
X
X
X
=
=
=
=
=
Need Weights
Academic Intervention*
DRA (K-3)
9 5,643
Achievement (4-12)
Well Below Standards X =
X =
X =
X =
X =
X =
=
Below Standards
High Achievement (Lvl 5)
English Language Learners
0-30 Months
Special Education
Level 1
XLevel 2
XLevel 3
XLevel 4
=
=
=
Total WSF FORMULA = 1,720,101
X
1 1,621X =Trans to Mainstream
14 11,802X =30 + Months
6,0001.26
5,5110.85
7,7791.20
6,4831.00
7,1321.10
8,4281.30
6270.10
6270.10
3140.05
6270.10
2,5930.40
1,6210.25
8430.13
4,6780.80
7,6001.30
13,9812.40
23,7354.07
Foundation = 0
Federal/State Categorical = 2,415,596
GRAND TOTAL ALL FUNDS FY = 4,235,000
360
$11,764
Total WSF = 1,720,101
Enrollment
Per Pupil Funding
Utilities = 99,303
Special Ed. Programs = 0
10/11
Other Programs = 0
ADOPTED BUDGET
176

Pathways to Technology
09/10 10/11
Adopted Difference
FY FY 10/11FY
Adopted
$ FTE $FTE$ FTE
BUDGET FUND 1003
110 Certified Salaries $1,148,605 15.8 $1,099,314 14.6 ($49,291) -1.2
110 Part Time Certified Salaries $7,000 $5,000 ($2,000) 0.0
120 Non-Certified Salaries $224,975 6.0 $128,970 3.0 ($96,005) -3.0
120 Part Time Non-Certified Salaries $1,500 $1,500 $0 0.0
$1,382,080 21.8Total Salaries $1,234,784 17.6 ($147,296) -4.2
900 Fringe Benefits $424,648 $407,166 ($17,481) 0.0
$424,648Total Benefits $407,166 ($17,481) 0.0
324 Field Trips $0 $2,293 $2,293 0.0
430 Maintenance Contracts $9,839 $9,839 $0 0.0
510 Transportation $3,000 $0 ($3,000) 0.0
611 Supplies & Materials $14,715 $27,351 $12,636 0.0
620 Utilities $92,862 $99,303 $6,441 0.0
700 Equipment $0 $38,587 $38,587 0.0
899 Other Operating Exp. $81 $81 $0 0.0
$120,497Total Operating Expenses $177,454 $56,957 0.0
$1,927,225 21.8TOTAL BUDGET FUND $1,819,404 17.6 ($107,820) -4.21003
BUDGET FUND 2007
110 Certified Salaries $1,000,996 20.0 $1,087,845 20.0 $86,849 0.0
110 Part Time Certified Salaries $108,450 $98,300 0.0 ($10,150) 0.0
120 Non-Certified Salaries $198,240 6.0 $282,153 7.0 $83,913 1.0
120 Part Time Non-Certified Salaries $4,500 $4,500 0.0 $0 0.0
$1,312,186 26.0Total Salaries $1,472,798 27.0 $160,612 1.0
900 Fringe Benefits $373,658 $480,337 $106,679 0.0
$373,658Total Benefits $480,337 $106,679 0.0
322 Instr. Impr. Services $9,000 $9,000 0.0 $0 0.0
324 Field Trips $10,000 $0 0.0 ($10,000) 0.0
325 Parent Activities $3,351 $3,351 0.0 $0 0.0
330 Other Prof. Tech Svs/MHIS $55,525 $35,712 0.0 ($19,813) 0.0
441 Rental of Facilities $310,000 $245,593 0.0 ($64,407) 0.0
510 Transportation $11,900 $8,000 0.0 ($3,900) 0.0
530 Communications $22,000 $22,000 0.0 $0 0.0
580 Travel/Conferences & Seminars $1,000 $1,000 0.0 $0 0.0
611 Supplies & Materials $142,098 $114,858 0.0 ($27,240) 0.0
700 Equipment $61,191 $15,612 0.0 ($45,579) 0.0
899 Other Operating Exp. $7,335 $7,335 0.0 $0 0.0
$633,400Total Operating Expenses $462,461 0.0 ($170,939) 0.0
$2,319,244 26.0TOTAL BUDGET FUND $2,415,596 27.0 $96,352 1.02007
$4,246,468 47.8GRAND TOTAL ALL FUNDS $4,235,000 44.6 ($11,469) -3.2
177

Pathways to Technology
Certified Staff Enrollment Non-Certified Staff
STAFFING and ENROLLMENT
Adopted Actual Projected Adopted
09/10 10/11 09/10 10/11 09/10 10/11
Adopted Adopted
Principals 1.0 1.0 Clerical Support 2.0 2.0
Pre-K 0 0
Associate/Assistant Principal Paraprofessionals
K 0 0 Classroom
Dean 1.0 1.0 Special Education 1.0
Teachers 1st 0 0 Other - Special Educ 2.0
Pre-K
Regular 1.0 2nd 0 0 Kindergarten
Associate Teacher 2.0 2.0 Other Para 1.0
Art 1.0 1.0 3rd 0 0
Business Prev/Interv Staff 1.0
Reading 4th 0 0
Foreign Language 3.0 2.0 CDA
Health 5th 0 0
Tech Comp Educ 7.0 6.0 Family Resource Aides 1.0
Math 4.0 4.0 6th 0 0
Music School and Family Support 1.0
Science 3.0 3.0 7th 0 0
Social Studies 3.0 3.0 Nurse 1.0 1.0
English 3.0 3.0 8th 0 0
Physical Education 1.0 1.0 Custodial Staff 2.0 2.0
Special Education 2.0 2.0 9th 85 96
Pre-K Security 2.0 1.0
Kindergarten 10th 100 80
Bilingual Gym & Pool Asst
TESOL/ELL 0.8 0.8 11th 86 96
Speech M&C Journeyman
Library Media 12th 82 88
Coach 1.0 Tech Support 1.0 1.0
Other 1.0
Other
Social Workers 1.0 0.8
Guidance Counselors 2.0 2.0
35.8 34.6 353 360 12.0 10.0Total Total Total
Adopted
Staffing Total 47.8 44.6
Adopted
178

This page intentionally left blank.
179

Sport and Medical Sciences Academy
0 0
0 0
0 0
35 226,905
96 684,672
213 1,795,164
0 0
20 6,280
3 1,881
3 7,779
26 121,628
3 22,800
2 27,962
0 0
Grade Weights
Pre K
K
1-3
4-6
7-8
9-12
Weight Per Capita
Projected
Enrollment/
Hours $
X
X
X
X
X
=
=
=
=
=
Need Weights
Academic Intervention*
DRA (K-3)
11 6,897
Achievement (4-12)
Well Below Standards X =
X =
X =
X =
X =
X =
=
Below Standards
High Achievement (Lvl 5)
English Language Learners
0-30 Months
Special Education
Level 1
XLevel 2
XLevel 3
XLevel 4
=
=
=
Total WSF FORMULA = 2,922,135
X
1 1,621X =Trans to Mainstream
22 18,546X =30 + Months
6,0001.26
5,5110.85
7,7791.20
6,4831.00
7,1321.10
8,4281.30
6270.10
6270.10
3140.05
6270.10
2,5930.40
1,6210.25
8430.13
4,6780.80
7,6001.30
13,9812.40
23,7354.07
Foundation = 0
Federal/State Categorical = 4,474,576
GRAND TOTAL ALL FUNDS FY = 7,871,391
685
$11,491
Total WSF = 2,922,135
Enrollment
Per Pupil Funding
Utilities = 354,974
Special Ed. Programs = 119,706
10/11
Other Programs = 0
ADOPTED BUDGET
180

Sport and Medical Sciences Academy
09/10 10/11
Adopted Difference
FY FY 10/11FY
Adopted
$ FTE $FTE$ FTE
BUDGET FUND 1003
110 Certified Salaries $1,587,974 21.6 $1,552,001 20.7 ($35,973) -0.9
110 Part Time Certified Salaries $73,600 $3,500 ($70,100) 0.0
120 Non-Certified Salaries $272,050 9.0 $535,728 15.0 $263,678 6.0
120 Part Time Non-Certified Salaries $80,300 $36,800 ($43,500) 0.0
$2,013,924 30.6Total Salaries $2,128,029 35.7 $114,105 5.1
900 Fringe Benefits $573,406 $747,704 $174,298 0.0
$573,406Total Benefits $747,704 $174,298 0.0
322 Instr. Impr. Services $10,000 $5,000 ($5,000) 0.0
324 Field Trips $20,000 $10,000 ($10,000) 0.0
325 Parent Activities $10,000 $0 ($10,000) 0.0
330 Other Prof. Tech Svs/MHIS $67,581 $59,595 ($7,986) 0.0
430 Maintenance Contracts $3,000 $2,000 ($1,000) 0.0
510 Transportation $8,000 $6,000 ($2,000) 0.0
530 Communications $14,000 $14,000 $0 0.0
580 Travel/Conferences & Seminars $5,000 $2,500 ($2,500) 0.0
611 Supplies & Materials $200,642 $59,013 ($141,629) 0.0
620 Utilities $383,000 $354,974 ($28,026) 0.0
700 Equipment $45,000 $4,000 ($41,000) 0.0
890 Athletics Activies $1,000 $1,000 $0 0.0
899 Other Operating Exp. $2,000 $3,000 $1,000 0.0
$769,223Total Operating Expenses $521,082 ($248,141) 0.0
$3,356,553 30.6TOTAL BUDGET FUND $3,396,815 35.7 $40,262 5.11003
BUDGET FUND 2007
110 Certified Salaries $1,777,008 30.6 $2,326,541 37.5 $549,533 6.9
110 Part Time Certified Salaries $263,000 $318,000 0.0 $55,000 0.0
120 Non-Certified Salaries $584,443 14.0 $330,203 7.0 ($254,240) -7.0
$2,624,451 44.6Total Salaries $2,974,744 44.5 $350,293 -0.1
900 Fringe Benefits $782,858 $895,695 $112,837 0.0
$782,858Total Benefits $895,695 $112,837 0.0
322 Instr. Impr. Services $28,452 $26,500 0.0 ($1,952) 0.0
325 Parent Activities $6,000 $16,271 0.0 $10,271 0.0
330 Other Prof. Tech Svs/MHIS $0 $15,000 0.0 $15,000 0.0
430 Maintenance Contracts $22,400 $22,371 0.0 ($29) 0.0
510 Transportation $0 $84,712 0.0 $84,712 0.0
611 Supplies & Materials $228,674 $279,283 0.0 $50,609 0.0
890 Athletics Activies $260,000 $0 0.0 ($260,000) 0.0
899 Other Operating Exp. $10,000 $160,000 0.0 $150,000 0.0
$555,526Total Operating Expenses $604,137 0.0 $48,611 0.0
$3,962,835 44.6TOTAL BUDGET FUND $4,474,576 44.5 $511,741 -0.12007
$7,319,388 75.2GRAND TOTAL ALL FUNDS $7,871,391 80.2 $552,003 5.0
181

Sport and Medical Sciences Academy
Certified Staff Enrollment Non-Certified Staff
STAFFING and ENROLLMENT
Adopted Actual Projected Adopted
09/10 10/11 09/10 10/11 09/10 10/11
Adopted Adopted
Principals 1.0 1.0 Clerical Support 4.0 4.0
Pre-K 0 0
Associate/Assistant Principal 1.0 1.0 Paraprofessionals
K 0 0 Classroom
Dean 1.0 1.0 Special Education 1.0
Teachers 1st 0 0 Other - Special Educ 4.0 3.0
Pre-K
Regular 2nd 0 0 Kindergarten
Associate Teacher Other Para
Art 2.0 2.0 3rd 0 0
Business 2.0 2.0 Prev/Interv Staff 1.0 1.0
Reading 4th 0 0
Foreign Language 2.0 3.0 CDA
Health 0.5 5th 0 0
Tech Comp Educ Family Resource Aides 1.0
Math 9.0 9.0 6th 0 75
Music 1.0 1.0 School and Family Support
Science 7.0 8.0 7th 83 90
Social Studies 4.0 5.0 Nurse 1.0 1.0
English 9.0 10.0 8th 86 81
Physical Education 3.5 5.0 Custodial Staff 6.0 6.0
Special Education 3.0 3.0 9th 116 112
Pre-K Security 3.0 3.0
Kindergarten 10th 129 106
Bilingual Gym & Pool Asst
TESOL/ELL 1.0 1.0 11th 114 116
Speech 0.2 0.2 M&C Journeyman
Library Media 1.0 1.0 12th 81 105
Coach 1.0 Tech Support 1.0 1.0
Other
Other 2.0 2.0
Social Workers 2.0 2.0
Guidance Counselors 2.0 2.0
52.2 58.2 609 685 23.0 22.0Total Total Total
Adopted
Staffing Total 75.2 80.2
Adopted
182

This page intentionally left blank.
183

University HS Science & Engineering
0 0
0 0
0 0
0 0
0 0
211 1,778,308
0 0
7 2,198
2 1,254
1 2,593
3 14,034
2 15,200
0 0
0 0
Grade Weights
Pre K
K
1-3
4-6
7-8
9-12
Weight Per Capita
Projected
Enrollment/
Hours $
X
X
X
X
X
=
=
=
=
=
Need Weights
Academic Intervention*
DRA (K-3)
6 3,762
Achievement (4-12)
Well Below Standards X =
X =
X =
X =
X =
X =
=
Below Standards
High Achievement (Lvl 5)
English Language Learners
0-30 Months
Special Education
Level 1
XLevel 2
XLevel 3
XLevel 4
=
=
=
Total WSF FORMULA = 1,822,277
X
2 3,242X =Trans to Mainstream
2 1,686X =30 + Months
6,0001.26
5,5110.85
7,7791.20
6,4831.00
7,1321.10
8,4281.30
6270.10
6270.10
3140.05
6270.10
2,5930.40
1,6210.25
8430.13
4,6780.80
7,6001.30
13,9812.40
23,7354.07
Foundation = 0
Federal/State Categorical = 2,632,468
GRAND TOTAL ALL FUNDS FY = 4,700,182
414
$11,353
Total WSF = 1,822,277
Enrollment
Per Pupil Funding
Utilities = 245,437
Special Ed. Programs = 0
10/11
Other Programs = 0
ADOPTED BUDGET
184

University HS Science & Engineering
09/10 10/11
Adopted Difference
FY FY 10/11FY
Adopted
$ FTE $FTE$ FTE
BUDGET FUND 1003
110 Certified Salaries $1,078,480 14.6 $1,149,350 15.0 $70,870 0.4
110 Part Time Certified Salaries $30,278 $0 ($30,278) 0.0
120 Non-Certified Salaries $215,675 5.0 $200,212 5.0 ($15,463) 0.0
$1,324,433 19.6Total Salaries $1,349,562 20.0 $25,129 0.4
900 Fringe Benefits $402,157 $456,734 $54,577 0.0
$402,157Total Benefits $456,734 $54,577 0.0
611 Supplies & Materials $0 $15,981 $15,981 0.0
620 Utilities $260,000 $245,437 ($14,563) 0.0
$260,000Total Operating Expenses $261,418 $1,418 0.0
$1,986,590 19.6TOTAL BUDGET FUND $2,067,714 20.0 $81,124 0.41003
BUDGET FUND 2007
110 Certified Salaries $972,255 16.5 $1,281,112 19.7 $308,857 3.2
110 Part Time Certified Salaries $126,709 $207,114 0.0 $80,405 0.0
120 Non-Certified Salaries $263,577 6.6 $248,000 5.6 ($15,577) -1.0
120 Part Time Non-Certified Salaries $23,000 $31,000 0.0 $8,000 0.0
$1,385,541 23.1Total Salaries $1,767,226 25.3 $381,685 2.2
900 Fringe Benefits $400,004 $528,007 $128,003 0.0
$400,004Total Benefits $528,007 $128,003 0.0
322 Instr. Impr. Services $8,460 $6,000 0.0 ($2,460) 0.0
324 Field Trips $11,000 $12,000 0.0 $1,000 0.0
325 Parent Activities $3,260 $5,062 0.0 $1,802 0.0
330 Other Prof. Tech Svs/MHIS $52,240 $52,018 0.0 ($222) 0.0
430 Maintenance Contracts $28,000 $24,000 0.0 ($4,000) 0.0
441 Rental of Facilities $1,500 $4,000 0.0 $2,500 0.0
510 Transportation $14,000 $16,000 0.0 $2,000 0.0
530 Communications $11,500 $13,500 0.0 $2,000 0.0
580 Travel/Conferences & Seminars $1,000 $1,000 0.0 $0 0.0
611 Supplies & Materials $150,113 $112,878 0.0 ($37,235) 0.0
700 Equipment $48,816 $63,773 0.0 $14,957 0.0
890 Athletics Activies $19,223 $0 ($19,223) 0.0
899 Other Operating Exp. $17,340 $27,005 0.0 $9,665 0.0
901 Mandated Compensatory Education $60,454 $0 ($60,454) 0.0
$426,906Total Operating Expenses $337,236 0.0 ($89,670) 0.0
$2,212,451 23.1TOTAL BUDGET FUND $2,632,469 25.3 $420,018 2.22007
$4,199,041 42.7GRAND TOTAL ALL FUNDS $4,700,182 45.3 $501,142 2.6
185

University HS Science & Engineering
Certified Staff Enrollment Non-Certified Staff
STAFFING and ENROLLMENT
Adopted Actual Projected Adopted
09/10 10/11 09/10 10/11 09/10 10/11
Adopted Adopted
Principals 1.0 1.0 Clerical Support 3.0 3.0
Pre-K 0
Associate/Assistant Principal 1.0 1.0 Paraprofessionals
K 0 0 Classroom
Dean 1.0 1.0 Special Education
Teachers 1st 0 0 Other - Special Educ
Pre-K
Regular 2nd 0 0 Kindergarten
Associate Teacher Other Para 1.0 1.0
Art 1.0 3rd 0 0
Business Prev/Interv Staff
Reading 4th 0 0
Foreign Language 3.0 3.0 CDA
Health 1.0 1.0 5th 0 0
Tech Comp Educ 1.0 2.0 Family Resource Aides
Math 7.0 7.0 6th 0 0
Music 0.2 School and Family Support
Science 5.5 6.0 7th 0 0
Social Studies 3.0 3.0 Nurse 1.0 1.0
English 4.0 4.0 8th 0 0
Physical Education 1.0 1.0 Custodial Staff 3.0 3.0
Special Education 1.0 1.0 9th 127 110
Pre-K Security 2.0 1.0
Kindergarten 10th 103 141
Bilingual Gym & Pool Asst
TESOL/ELL 11th 76 90
Speech M&C Journeyman
Library Media 12th 56 73
Coach Tech Support 1.0 1.0
Other
Other 0.6 0.6
Social Workers 0.1 0.5
Guidance Counselors 1.5 2.0
31.1 34.7 362 414 11.6 10.6Total Total Total
Adopted
Staffing Total 42.7 45.3
Adopted
186

This page intentionally left blank.
187

Weaver Culinary Arts
0 0
0 0
0 0
0 0
0 0
306 2,578,968
0 0
40 12,560
0 0
6 15,558
49 229,222
34 258,400
9 125,829
0 0
Grade Weights
Pre K
K
1-3
4-6
7-8
9-12
Weight Per Capita
Projected
Enrollment/
Hours $
X
X
X
X
X
=
=
=
=
=
Need Weights
Academic Intervention*
DRA (K-3)
49 30,723
Achievement (4-12)
Well Below Standards X =
X =
X =
X =
X =
X =
=
Below Standards
High Achievement (Lvl 5)
English Language Learners
0-30 Months
Special Education
Level 1
XLevel 2
XLevel 3
XLevel 4
=
=
=
Total WSF FORMULA = 3,266,434
X
0 0X =Trans to Mainstream
18 15,174X =30 + Months
6,0001.26
5,5110.85
7,7791.20
6,4831.00
7,1321.10
8,4281.30
6270.10
6270.10
3140.05
6270.10
2,5930.40
1,6210.25
8430.13
4,6780.80
7,6001.30
13,9812.40
23,7354.07
Foundation = 0
Federal/State Categorical = 295,909
GRAND TOTAL ALL FUNDS FY = 4,204,075
306
$13,739
Total WSF = 3,266,434
Enrollment
Per Pupil Funding
Utilities = 402,319
Special Ed. Programs = 239,413
10/11
Other Programs = 0
ADOPTED BUDGET
188

Weaver Culinary Arts
09/10 10/11
Adopted Difference
FY FY 10/11FY
Adopted
$ FTE $FTE$ FTE
BUDGET FUND 1003
110 Certified Salaries $1,822,997 25.6 $1,903,615 25.6 $80,618 0.0
110 Part Time Certified Salaries $28,945 $52,010 $23,065 0.0
120 Non-Certified Salaries $322,622 9.5 $543,734 14.2 $221,112 4.7
120 Part Time Non-Certified Salaries $12,750 $10,400 ($2,350) 0.0
$2,187,314 35.1Total Salaries $2,509,759 39.8 $322,445 4.8
900 Fringe Benefits $657,915 $861,467 $203,552 0.0
$657,915Total Benefits $861,467 $203,552 0.0
322 Instr. Impr. Services $199 $0 ($199) 0.0
324 Field Trips $2,738 $0 ($2,738) 0.0
330 Other Prof. Tech Svs/MHIS $24,699 $26,622 $1,923 0.0
430 Maintenance Contracts $9,839 $11,203 $1,364 0.0
441 Rental of Facilities $600 $600 0.0
510 Transportation $0 $12,000 $12,000 0.0
530 Communications $8,800 $3,300 ($5,500) 0.0
611 Supplies & Materials $281,338 $65,370 ($215,968) 0.0
620 Utilities $317,492 $402,318 $84,826 0.0
890 Athletics Activies $51,513 $377 ($51,136) 0.0
899 Other Operating Exp. $4,401 $15,149 $10,748 0.0
$701,019Total Operating Expenses $536,939 ($164,080) 0.0
$3,546,248 35.1TOTAL BUDGET FUND $3,908,165 39.8 $361,917 4.81003
BUDGET FUND 2007
110 Certified Salaries $77,099 0.9 $77,000 1.0 ($99) 0.1
110 Part Time Certified Salaries $11,041 $15,000 0.0 $3,959 0.0
120 Non-Certified Salaries $140,723 3.1 $102,033 2.8 ($38,690) -0.3
$228,863 4.0Total Salaries $194,033 3.8 ($34,830) -0.2
900 Fringe Benefits $93,039 $73,593 ($19,446) 0.0
$93,039Total Benefits $73,593 ($19,446) 0.0
322 Instr. Impr. Services $4,000 $0 ($4,000) 0.0
325 Parent Activities $2,228 $2,561 0.0 $333 0.0
330 Other Prof. Tech Svs/MHIS $600 $0 0.0 ($600) 0.0
510 Transportation $1,000 $1,000 0.0 $0 0.0
611 Supplies & Materials $18,276 $14,723 0.0 ($3,553) 0.0
700 Equipment $48,000 $10,000 0.0 ($38,000) 0.0
$74,104Total Operating Expenses $28,284 0.0 ($45,820) 0.0
$396,006 4.0TOTAL BUDGET FUND $295,910 3.8 ($100,096) -0.22007
$3,942,254 39.1GRAND TOTAL ALL FUNDS $4,204,075 43.6 $261,820 4.6
189

Weaver Culinary Arts
Certified Staff Enrollment Non-Certified Staff
STAFFING and ENROLLMENT
Adopted Actual Projected Adopted
09/10 10/11 09/10 10/11 09/10 10/11
Adopted Adopted
Principals 1.0 1.0 Clerical Support 1.6 2.0
Pre-K 0 0
Associate/Assistant Principal Paraprofessionals
K 0 0 Classroom
Dean Special Education
Teachers 1st 0 0 Other - Special Educ 4.0 6.0
Pre-K
Regular 2nd 0 0 Kindergarten
Associate Teacher Other Para
Art 1.0 1.0 3rd 0 0
Business 1.0 Prev/Interv Staff 1.0 2.0
Reading 0.5 4th 0 0
Foreign Language 1.0 1.0 CDA
Health 0.5 0.5 5th 0 0
Tech Comp Educ Family Resource Aides 1.0 1.0
Math 3.0 3.0 6th 0 0
Music School and Family Support
Science 2.0 2.0 7th 0 0
Social Studies 2.0 2.0 Nurse 0.3 0.4
English 3.0 3.0 8th 0 0
Physical Education 0.5 0.5 Custodial Staff 2.4 3.2
Special Education 6.0 6.0 9th 100 100
Pre-K Security 1.0 1.0
Kindergarten 10th 70 90
Bilingual Gym & Pool Asst
TESOL/ELL 11th 65 50
Speech 0.2 0.2 M&C Journeyman
Library Media 0.4 12th 65 66
Coach 0.5 Tech Support 0.3 0.4
Other 3.3 3.0
Other 1.0 1.0
Social Workers 1.0 1.0
Guidance Counselors 1.0 1.0
26.4 26.6 300 306 12.6 17.0Total Total Total
Adopted
Staffing Total 39.0 43.6
Adopted
190

This page intentionally left blank.
191

Weaver Senior Academy
0 0
0 0
0 0
0 0
0 0
184 1,550,752
0 0
47 14,758
1 627
3 7,779
57 266,646
21 159,600
6 83,886
0 0
Grade Weights
Pre K
K
1-3
4-6
7-8
9-12
Weight Per Capita
Projected
Enrollment/
Hours $
X
X
X
X
X
=
=
=
=
=
Need Weights
Academic Intervention*
DRA (K-3)
42 26,334
Achievement (4-12)
Well Below Standards X =
X =
X =
X =
X =
X =
=
Below Standards
High Achievement (Lvl 5)
English Language Learners
0-30 Months
Special Education
Level 1
XLevel 2
XLevel 3
XLevel 4
=
=
=
Total WSF FORMULA = 2,117,061
X
1 1,621X =Trans to Mainstream
6 5,058X =30 + Months
6,0001.26
5,5110.85
7,7791.20
6,4831.00
7,1321.10
8,4281.30
6270.10
6270.10
3140.05
6270.10
2,5930.40
1,6210.25
8430.13
4,6780.80
7,6001.30
13,9812.40
23,7354.07
Foundation = 265,000
Federal/State Categorical = 160,306
GRAND TOTAL ALL FUNDS FY = 3,090,644
184
$16,797
Total WSF = 2,382,061
Enrollment
Per Pupil Funding
Utilities = 231,333
Special Ed. Programs = 316,944
10/11
Other Programs = 0
ADOPTED BUDGET
192

Weaver Senior Academy
09/10 10/11
Adopted Difference
FY FY 10/11FY
Adopted
$ FTE $FTE$ FTE
BUDGET FUND 1003
110 Certified Salaries $2,028,372 27.1 $1,168,950 15.3 ($859,422) -11.7
110 Part Time Certified Salaries $28,777 $81,582 $52,805 0.0
120 Non-Certified Salaries $566,085 16.6 $540,273 15.7 ($25,812) -0.9
120 Part Time Non-Certified Salaries $22,346 $15,600 ($6,746) 0.0
$2,645,580 43.7Total Salaries $1,806,405 31.1 ($839,175) -12.6
900 Fringe Benefits $838,617 $630,080 ($208,537) 0.0
$838,617Total Benefits $630,080 ($208,537) 0.0
322 Instr. Impr. Services $15,000 $15,000 0.0
330 Other Prof. Tech Svs/MHIS $41,115 $16,008 ($25,107) 0.0
430 Maintenance Contracts $13,975 $32,508 $18,533 0.0
441 Rental of Facilities $920 $920 0.0
510 Transportation $18,400 $18,400 0.0
530 Communications $4,400 $3,000 ($1,400) 0.0
611 Supplies & Materials $36,584 $152,067 $115,483 0.0
620 Utilities $317,492 $231,333 ($86,159) 0.0
890 Athletics Activies $177,066 $577 ($176,489) 0.0
899 Other Operating Exp. $1,346 $24,040 $22,694 0.0
$591,978Total Operating Expenses $493,853 ($98,125) 0.0
$4,076,175 43.7TOTAL BUDGET FUND $2,930,338 31.1 ($1,145,837) -12.61003
BUDGET FUND 2007
110 Certified Salaries $158,984 2.5 $0 0.0 ($158,984) -2.5
110 Part Time Certified Salaries $13,891 $22,100 0.0 $8,209 0.0
120 Non-Certified Salaries $143,680 3.2 $84,506 2.0 ($59,174) -1.2
$316,555 5.7Total Salaries $106,606 2.0 ($209,949) -3.7
900 Fringe Benefits $116,600 $41,111 ($75,488) 0.0
$116,600Total Benefits $41,111 ($75,488) 0.0
325 Parent Activities $3,205 $3,003 0.0 ($202) 0.0
611 Supplies & Materials $14,069 $9,585 0.0 ($4,484) 0.0
$17,274Total Operating Expenses $12,588 0.0 ($4,686) 0.0
$450,429 5.7TOTAL BUDGET FUND $160,305 2.0 ($290,123) -3.72007
$4,526,603 49.3GRAND TOTAL ALL FUNDS $3,090,644 33.1 ($1,435,960) -16.2
193

Weaver Culinary Arts
Certified Staff Enrollment Non-Certified Staff
STAFFING and ENROLLMENT
Adopted Actual Projected Adopted
09/10 10/11 09/10 10/11 09/10 10/11
Adopted Adopted
Principals 1.0 1.0 Clerical Support 1.6 2.0
Pre-K 0 0
Associate/Assistant Principal Paraprofessionals
K 0 0 Classroom
Dean Special Education
Teachers 1st 0 0 Other - Special Educ 4.0 6.0
Pre-K
Regular 2nd 0 0 Kindergarten
Associate Teacher Other Para
Art 1.0 1.0 3rd 0 0
Business 1.0 Prev/Interv Staff 1.0 2.0
Reading 0.5 4th 0 0
Foreign Language 1.0 1.0 CDA
Health 0.5 0.5 5th 0 0
Tech Comp Educ Family Resource Aides 1.0 1.0
Math 3.0 3.0 6th 0 0
Music School and Family Support
Science 2.0 2.0 7th 0 0
Social Studies 2.0 2.0 Nurse 0.3 0.4
English 3.0 3.0 8th 0 0
Physical Education 0.5 0.5 Custodial Staff 2.4 3.2
Special Education 6.0 6.0 9th 100 100
Pre-K Security 1.0 1.0
Kindergarten 10th 70 90
Bilingual Gym & Pool Asst
TESOL/ELL 11th 65 50
Speech 0.2 0.2 M&C Journeyman
Library Media 0.4 12th 65 66
Coach 0.5 Tech Support 0.3 0.4
Other 3.3 3.0
Other 1.0 1.0
Social Workers 1.0 1.0
Guidance Counselors 1.0 1.0
26.4 26.6 300 306 12.6 17.0Total Total Total
Adopted
Staffing Total 39.0 43.6
Adopted
194

This page intentionally left blank.
195

ALTERNATIVE
LEARNING

2550 Elementary School
0 0
0 0
16 124,464
36 233,388
4 28,528
0 0
0 0
2 628
0 0
0 0
0 0
0 0
0 0
56 1,329,160
Grade Weights
Pre K
K
1-3
4-6
7-8
9-12
Weight Per Capita
Projected
Enrollment/
Hours $
X
X
X
X
X
=
=
=
=
=
Need Weights
Academic Intervention*
DRA (K-3)
8 5,016
Achievement (4-12)
Well Below Standards X =
X =
X =
X =
X =
X =
=
Below Standards
High Achievement (Lvl 5)
English Language Learners
0-30 Months
Special Education
Level 1
XLevel 2
XLevel 3
XLevel 4
=
=
=
Total WSF FORMULA = 1,725,399
X
0 0X =Trans to Mainstream
5 4,215X =30 + Months
6,0001.26
5,5110.85
7,7791.20
6,4831.00
7,1321.10
8,4281.30
6270.10
6270.10
3140.05
6270.10
2,5930.40
1,6210.25
8430.13
4,6780.80
7,6001.30
13,9812.40
23,7354.07
Foundation = 0
Federal/State Categorical = 18,809
GRAND TOTAL ALL FUNDS FY = 1,983,620
56
$35,422
Total WSF = 1,725,399
Enrollment
Per Pupil Funding
Utilities = 0
Special Ed. Programs = 239,412
10/11
Other Programs = 0
ADOPTED BUDGET
196

2550 Elementary School
09/10 10/11
Adopted Difference
FY FY 10/11FY
Adopted
$ FTE $FTE$ FTE
BUDGET FUND 1003
110 Certified Salaries $916,053 12.3 $1,118,039 14.3 $201,986 2.0
110 Part Time Certified Salaries $13,000 $5,000 ($8,000) 0.0
120 Non-Certified Salaries $182,175 7.0 $188,384 7.0 $6,209 0.0
$1,111,228 19.3Total Salaries $1,311,423 21.3 $200,195 2.0
900 Fringe Benefits $340,247 $441,411 $101,164 0.0
$340,247Total Benefits $441,411 $101,164 0.0
330 Other Prof. Tech Svs/MHIS $21,655 $4,175 ($17,480) 0.0
530 Communications $1,160 $0 ($1,160) 0.0
611 Supplies & Materials $18,550 $207,802 $189,252 0.0
$41,365Total Operating Expenses $211,977 $170,612 0.0
$1,492,840 19.3TOTAL BUDGET FUND $1,964,811 21.3 $471,971 2.01003
BUDGET FUND 2007
110 Certified Salaries $167,934 2.0 $0 0.0 ($167,934) -2.0
$167,934 2.0Total Salaries $0 0.0 ($167,934) -2.0
900 Fringe Benefits $45,124 $0 ($45,124) 0.0
$45,124Total Benefits $0 ($45,124) 0.0
325 Parent Activities $1,045 $216 0.0 ($829) 0.0
611 Supplies & Materials $53,654 $8,101 0.0 ($45,553) 0.0
700 Equipment $10,492 0.0 $10,492 0.0
$54,699Total Operating Expenses $18,809 0.0 ($35,890) 0.0
$267,757 2.0TOTAL BUDGET FUND $18,809 0.0 ($248,948) -2.02007
$1,760,597 21.3GRAND TOTAL ALL FUNDS $1,983,620 21.3 $223,023 0.0
197

2550 Elementary School
Certified Staff Enrollment Non-Certified Staff
STAFFING and ENROLLMENT
Adopted Actual Projected Adopted
09/10 10/11 09/10 10/11 09/10 10/11
Adopted Adopted
Principals 1.0 Clerical Support
Pre-K 0 0
Associate/Assistant Principal 1.0 Paraprofessionals
K 0 0 Classroom
Dean Special Education
Teachers 1st 1 2 Other - Special Educ 7.0 7.0
Pre-K
Regular 3.0 2.0 2nd 4 2 Kindergarten
Associate Teacher Other Para
Art 3rd 8 12
Business Prev/Interv Staff
Reading 1.5 2.5 4th 8 12
Foreign Language CDA
Health 5th 12 2
Tech Comp Educ 1.0 Family Resource Aides
Math 6th 2 22
Music School and Family Support
Science 7th 2 2
Social Studies Nurse
English 8th 2 2
Physical Education Custodial Staff
Special Education 4.0 5.0 9th 0 0
Pre-K Security
Kindergarten 10th 0 0
Bilingual Gym & Pool Asst
TESOL/ELL 11th 0 0
Speech M&C Journeyman
Library Media 12th 0 0
Coach Tech Support
Other 0.8 0.8
Other
Social Workers 3.0 3.0
Guidance Counselors
14.3 14.3 39 56 7.0 7.0Total Total Total
Adopted
Staffing Total 21.3 21.3
Adopted
198

This page intentionally left blank.
199

2550 Secondary Academy
0 0
0 0
0 0
19 123,177
23 164,036
48 404,544
0 0
1 314
0 0
1 2,593
0 0
0 0
0 0
90 2,136,150
Grade Weights
Pre K
K
1-3
4-6
7-8
9-12
Weight Per Capita
Projected
Enrollment/
Hours $
X
X
X
X
X
=
=
=
=
=
Need Weights
Academic Intervention*
DRA (K-3)
10 6,270
Achievement (4-12)
Well Below Standards X =
X =
X =
X =
X =
X =
=
Below Standards
High Achievement (Lvl 5)
English Language Learners
0-30 Months
Special Education
Level 1
XLevel 2
XLevel 3
XLevel 4
=
=
=
Total WSF FORMULA = 2,848,043
X
0 0X =Trans to Mainstream
13 10,959X =30 + Months
6,0001.26
5,5110.85
7,7791.20
6,4831.00
7,1321.10
8,4281.30
6270.10
6270.10
3140.05
6270.10
2,5930.40
1,6210.25
8430.13
4,6780.80
7,6001.30
13,9812.40
23,7354.07
Foundation = 0
Federal/State Categorical = 44,396
GRAND TOTAL ALL FUNDS FY = 2,972,243
90
$33,025
Total WSF = 2,848,043
Enrollment
Per Pupil Funding
Utilities = 0
Special Ed. Programs = 79,804
10/11
Other Programs = 0
ADOPTED BUDGET
200

2550 Secondary Academy
09/10 10/11
Adopted Difference
FY FY 10/11FY
Adopted
$ FTE $FTE$ FTE
BUDGET FUND 1003
110 Certified Salaries $1,728,327 22.6 $1,699,818 21.2 ($28,509) -1.4
110 Part Time Certified Salaries $119,060 $10,000 ($109,060) 0.0
120 Non-Certified Salaries $400,311 11.0 $311,230 7.5 ($89,081) -3.5
120 Part Time Non-Certified Salaries $5,787 $0 ($5,787) 0.0
$2,253,485 33.6Total Salaries $2,021,048 28.7 ($232,437) -4.9
900 Fringe Benefits $672,637 $683,549 $10,911 0.0
$672,637Total Benefits $683,549 $10,911 0.0
322 Instr. Impr. Services $2,010 $2,010 $0 0.0
324 Field Trips $5,000 $5,000 $0 0.0
325 Parent Activities $1,000 $1,000 $0 0.0
330 Other Prof. Tech Svs/MHIS $6,242 $7,830 $1,588 0.0
430 Maintenance Contracts $13,760 $6,822 ($6,938) 0.0
530 Communications $3,000 $3,000 $0 0.0
611 Supplies & Materials $208,501 $167,374 ($41,127) 0.0
620 Utilities $65,000 $0 ($65,000) 0.0
700 Equipment $2,000 $30,000 $28,000 0.0
899 Other Operating Exp. $215 $215 $0 0.0
$306,728Total Operating Expenses $223,251 ($83,477) 0.0
$3,232,850 33.6TOTAL BUDGET FUND $2,927,848 28.7 ($305,003) -4.91003
BUDGET FUND 2007
110 Part Time Certified Salaries $0 $43,086 $43,086 0.0
$0Total Salaries $43,086 $43,086 0.0
900 Fringe Benefits $0 $625 $625 0.0
$0Total Benefits $625 $625 0.0
325 Parent Activities $221 $685 $464 0.0
611 Supplies & Materials $9,842 $0 ($9,842) 0.0
$10,063Total Operating Expenses $685 ($9,378) 0.0
$10,063TOTAL BUDGET FUND $44,396 $34,3332007
$3,242,913 33.6GRAND TOTAL ALL FUNDS $2,972,243 28.7 ($270,670) -4.9
201

2550 Secondary Academy
Certified Staff Enrollment Non-Certified Staff
STAFFING and ENROLLMENT
Adopted Actual Projected Adopted
09/10 10/11 09/10 10/11 09/10 10/11
Adopted Adopted
Principals 1.0 Clerical Support 1.0 1.0
Pre-K 0 0
Associate/Assistant Principal Paraprofessionals
K 0 0 Classroom
Dean 1.0 1.0 Special Education
Teachers 1st 0 0 Other - Special Educ
Pre-K
Regular 2nd 0 0 Kindergarten
Associate Teacher Other Para 2.0
Art 0.5 0.5 3rd 0 0
Business Prev/Interv Staff 3.0 2.0
Reading 4th 0 0
Foreign Language CDA
Health 5th 0 0
Tech Comp Educ 1.0 1.0 Family Resource Aides 1.0 1.0
Math 1.0 2.0 6th 7 19
Music 0.2 0.5 School and Family Support
Science 2.0 2.0 7th 14 12
Social Studies 1.0 1.0 Nurse 1.0 0.5
English 3.0 2.0 8th 9 11
Physical Education 0.4 0.5 Custodial Staff 1.0 1.0
Special Education 5.0 4.0 9th 16 7
Pre-K Security 2.0 2.0
Kindergarten 10th 16 15
Bilingual Gym & Pool Asst
TESOL/ELL 11th 13 13
Speech 0.5 0.2 M&C Journeyman
Library Media 12th 15 13
Coach 1.0 Tech Support
Other 1.0 3.0
Other
Social Workers 3.0 3.0
Guidance Counselors 1.0 0.5
22.6 21.2 90 90 11.0 7.5Total Total Total
Adopted
Staffing Total 33.6 28.7
Adopted
202

This page intentionally left blank.
203

Gifted & Talented
0 0
0 0
0 0
62 401,946
19 135,508
0 0
0 0
5 1,570
4 2,508
1 2,593
0 0
0 0
0 0
0 0
Grade Weights
Pre K
K
1-3
4-6
7-8
9-12
Weight Per Capita
Projected
Enrollment/
Hours $
X
X
X
X
X
=
=
=
=
=
Need Weights
Academic Intervention*
DRA (K-3)
3 1,881
Achievement (4-12)
Well Below Standards X =
X =
X =
X =
X =
X =
=
Below Standards
High Achievement (Lvl 5)
English Language Learners
0-30 Months
Special Education
Level 1
XLevel 2
XLevel 3
XLevel 4
=
=
=
Total WSF FORMULA = 546,849
X
0 0X =Trans to Mainstream
1 843X =30 + Months
6,0001.26
5,5110.85
7,7791.20
6,4831.00
7,1321.10
8,4281.30
6270.10
6270.10
3140.05
6270.10
2,5930.40
1,6210.25
8430.13
4,6780.80
7,6001.30
13,9812.40
23,7354.07
Foundation = 0
Federal/State Categorical = 0
GRAND TOTAL ALL FUNDS FY = 546,849
81
$6,751
Total WSF = 546,849
Enrollment
Per Pupil Funding
Utilities = 0
Special Ed. Programs = 0
10/11
Other Programs = 0
ADOPTED BUDGET
204

Gifted & Talented
09/10 10/11
Adopted Difference
FY FY 10/11FY
Adopted
$ FTE $FTE$ FTE
BUDGET FUND 1003
110 Certified Salaries $254,014 4.0 $357,675 5.0 $103,661 1.0
110 Part Time Certified Salaries $23,618 $10,000 ($13,618) 0.0
120 Part Time Non-Certified Salaries $10,000 $10,000 0.0
$277,632 4.0Total Salaries $377,675 5.0 $100,043 1.0
900 Fringe Benefits $68,596 $112,970 $44,374 0.0
$68,596Total Benefits $112,970 $44,374 0.0
322 Instr. Impr. Services $1,000 $1,000 0.0
324 Field Trips $4,937 $2,000 ($2,937) 0.0
611 Supplies & Materials $45,121 $28,204 ($16,917) 0.0
700 Equipment $29,054 $25,000 ($4,054) 0.0
$79,112Total Operating Expenses $56,204 ($22,908) 0.0
$425,340 4.0TOTAL BUDGET FUND $546,849 5.0 $121,509 1.01003
$425,340 4.0GRAND TOTAL ALL FUNDS $546,849 5.0 $121,509 1.0
205

Gifted & Talented
Certified Staff Enrollment Non-Certified Staff
STAFFING and ENROLLMENT
Adopted Actual Projected Adopted
09/10 10/11 09/10 10/11 09/10 10/11
Adopted Adopted
Principals Clerical Support
Pre-K 0 0
Associate/Assistant Principal Paraprofessionals
K 0 0 Classroom
Dean 1.0 Special Education
Teachers 1st 0 0 Other - Special Educ
Pre-K
Regular 3.0 5.0 2nd 0 0 Kindergarten
Associate Teacher Other Para
Art 3rd 0 0
Business Prev/Interv Staff
Reading 4th 23 22
Foreign Language CDA
Health 5th 17 23
Tech Comp Educ Family Resource Aides
Math 6th 24 17
Music School and Family Support
Science 7th 0 19
Social Studies Nurse
English 8th 0 0
Physical Education Custodial Staff
Special Education 9th 0 0
Pre-K Security
Kindergarten 10th 0 0
Bilingual Gym & Pool Asst
TESOL/ELL 11th 0 0
Speech M&C Journeyman
Library Media 12th 0 0
Coach Tech Support
Other
Other
Social Workers
Guidance Counselors
4.0 5.0 64 81Total Total Total
Adopted
Staffing Total 4.0 5.0
Adopted
206

This page intentionally left blank.
207

HALO
Certified Staff Enrollment Non-Certified Staff
STAFFING and ENROLLMENT
Adopted Actual Projected Adopted
09/10 10/11 09/10 10/11 09/10 10/11
Adopted Adopted
Principals Clerical Support 1.0
Pre-K 0
Associate/Assistant Principal 1.0 Paraprofessionals
K 0 Classroom
Dean Special Education
Teachers 1st 0 Other - Special Educ
Pre-K
Regular 4.0 2nd 0 Kindergarten
Associate Teacher Other Para
Art 3rd 0
Business Prev/Interv Staff
Reading 4th 0
Foreign Language CDA
Health 5th 0
Tech Comp Educ Family Resource Aides
Math 1.0 6th 0
Music School and Family Support
Science 1.0 7th 0
Social Studies Nurse
English 1.0 8th 0
Physical Education Custodial Staff
Special Education 1.0 1.0 9th 0
Pre-K Security 1.0 2.0
Kindergarten 10th 0
Bilingual Gym & Pool Asst
TESOL/ELL 11th 0
Speech M&C Journeyman
Library Media 12th 0
Coach Tech Support
Other 1.0
Other
Social Workers 0.5
Guidance Counselors 0.5 1.0
7.0 6.0 0 1.0 3.0Total Total Total
Adopted
Staffing Total 8.0 9.0
Adopted
208

HALO
09/10 10/11
Adopted Difference
FY FY 10/11FY
Adopted
$ FTE $FTE$ FTE
BUDGET FUND 1003
110 Certified Salaries $539,600 7.0 $485,758 6.0 ($53,842) -1.0
110 Part Time Certified Salaries $5,774 $0 ($5,774) 0.0
120 Non-Certified Salaries $29,650 1.0 $105,600 3.0 $75,950 2.0
120 Part Time Non-Certified Salaries $29,589 $0 ($29,589) 0.0
$604,613 8.0Total Salaries $591,358 9.0 ($13,255) 1.0
900 Fringe Benefits $162,900 $203,161 $40,261 0.0
$162,900Total Benefits $203,161 $40,261 0.0
330 Other Prof. Tech Svs/MHIS $1,000 $3,480 $2,480 0.0
430 Maintenance Contracts $5,300 $2,994 ($2,306) 0.0
441 Rental of Facilities $125,000 $125,000 $0 0.0
510 Transportation $25,000 $7,000 ($18,000) 0.0
530 Communications $500 $500 $0 0.0
580 Travel/Conferences & Seminars $100 $100 0.0
611 Supplies & Materials $151,727 $12,807 ($138,920) 0.0
700 Equipment $3,000 $3,000 0.0
$308,527Total Operating Expenses $154,881 ($153,646) 0.0
$1,076,040 8.0TOTAL BUDGET FUND $949,400 9.0 ($126,640) 1.01003
$1,076,040 8.0GRAND TOTAL ALL FUNDS $949,400 9.0 ($126,640) 1.0
209

OPPortunity High School
0 0
0 0
0 0
0 0
0 0
150 1,264,200
0 0
5 1,570
0 0
0 0
12 56,136
3 22,800
0 0
0 0
Grade Weights
Pre K
K
1-3
4-6
7-8
9-12
Weight Per Capita
Projected
Enrollment/
Hours $
X
X
X
X
X
=
=
=
=
=
Need Weights
Academic Intervention*
DRA (K-3)
3 1,881
Achievement (4-12)
Well Below Standards X =
X =
X =
X =
X =
X =
=
Below Standards
High Achievement (Lvl 5)
English Language Learners
0-30 Months
Special Education
Level 1
XLevel 2
XLevel 3
XLevel 4
=
=
=
Total WSF FORMULA = 1,356,703
X
0 0X =Trans to Mainstream
12 10,116X =30 + Months
6,0001.26
5,5110.85
7,7791.20
6,4831.00
7,1321.10
8,4281.30
6270.10
6270.10
3140.05
6270.10
2,5930.40
1,6210.25
8430.13
4,6780.80
7,6001.30
13,9812.40
23,7354.07
Foundation = 265,000
Federal/State Categorical = 536,542
GRAND TOTAL ALL FUNDS FY = 2,158,245
150
$14,388
Total WSF = 1,621,703
Enrollment
Per Pupil Funding
Utilities = 0
Special Ed. Programs = 0
10/11
Other Programs = 0
ADOPTED BUDGET
210

OPPortunity High School
09/10 10/11
Adopted Difference
FY FY 10/11FY
Adopted
$ FTE $FTE$ FTE
BUDGET FUND 1003
110 Certified Salaries $649,080 8.5 $953,040 12.4 $303,960 3.9
110 Part Time Certified Salaries $4,000 $4,000 $0 0.0
120 Non-Certified Salaries $183,225 4.5 $167,380 4.0 ($15,845) -0.5
120 Part Time Non-Certified Salaries $3,000 $3,500 $500 0.0
$839,305 13.0Total Salaries $1,127,920 16.4 $288,615 3.4
900 Fringe Benefits $268,777 $379,894 $111,116 0.0
$268,777Total Benefits $379,894 $111,116 0.0
322 Instr. Impr. Services $5,000 $5,000 0.0
325 Parent Activities $1,000 $0 ($1,000) 0.0
330 Other Prof. Tech Svs/MHIS $3,384 $18,050 $14,666 0.0
430 Maintenance Contracts $7,331 $19,281 $11,950 0.0
530 Communications $500 $500 $0 0.0
611 Supplies & Materials $20,315 $63,558 $43,243 0.0
700 Equipment $2,947 $5,000 $2,053 0.0
899 Other Operating Exp. $1,740 $2,500 $760 0.0
$37,217Total Operating Expenses $113,889 $76,672 0.0
$1,145,299 13.0TOTAL BUDGET FUND $1,621,703 16.4 $476,403 3.41003
BUDGET FUND 2007
110 Certified Salaries $70,939 1.0 $224,325 2.6 $153,386 1.6
110 Part Time Certified Salaries $0 $20,000 0.0 $20,000 0.0
120 Non-Certified Salaries $0 0.0 $30,015 1.0 $30,015 1.0
$70,939 1.0Total Salaries $274,340 3.6 $203,401 2.6
900 Fringe Benefits $19,061 $85,059 $65,998 0.0
$19,061Total Benefits $85,059 $65,998 0.0
322 Instr. Impr. Services $15,000 0.0 $15,000 0.0
324 Field Trips $15,000 0.0 $15,000 0.0
325 Parent Activities $0 $2,000 0.0 $2,000 0.0
330 Other Prof. Tech Svs/MHIS $0 $14,000 0.0 $14,000 0.0
530 Communications $0 $3,000 0.0 $3,000 0.0
580 Travel/Conferences & Seminars $3,000 0.0 $3,000 0.0
611 Supplies & Materials $0 $95,143 0.0 $95,143 0.0
700 Equipment $0 $30,000 0.0 $30,000 0.0
$0Total Operating Expenses $177,143 0.0 $177,143 0.0
$90,000 1.0TOTAL BUDGET FUND $536,542 3.6 $446,542 2.62007
$1,235,299 14.0GRAND TOTAL ALL FUNDS $2,158,245 20.0 $922,945 6.0
211

OPPortunity High School
Certified Staff Enrollment Non-Certified Staff
STAFFING and ENROLLMENT
Adopted Actual Projected Adopted
09/10 10/11 09/10 10/11 09/10 10/11
Adopted Adopted
Principals 1.0 1.0 Clerical Support 1.0 1.0
Pre-K 0 0
Associate/Assistant Principal Paraprofessionals
K 0 0 Classroom
Dean 1.0 Special Education
Teachers 1st 0 0 Other - Special Educ
Pre-K
Regular 2nd 0 0 Kindergarten
Associate Teacher Other Para
Art 3rd 0 0
Business Prev/Interv Staff 1.0
Reading 1.0 1.0 4th 0 0
Foreign Language 0.5 CDA
Health 0.5 0.5 5th 0 0
Tech Comp Educ 1.0 1.0 Family Resource Aides 1.0
Math 1.0 2.0 6th 0 0
Music 1.0 School and Family Support
Science 1.0 2.0 7th 0 0
Social Studies 1.0 1.0 Nurse 0.5 1.0
English 1.0 2.0 8th 0 0
Physical Education 0.5 0.5 Custodial Staff 1.0 1.0
Special Education 1.0 0.5 9th 55 60
Pre-K Security 1.0 1.0
Kindergarten 10th 24 40
Bilingual 0.5 Gym & Pool Asst
TESOL/ELL 11th 10 40
Speech M&C Journeyman
Library Media 12th 1 10
Coach Tech Support
Other
Other
Social Workers 0.5
Guidance Counselors 0.5
9.5 15.0 90 150 4.5 5.0Total Total Total
Adopted
Staffing Total 14.0 20.0
Adopted
212

This page intentionally left blank.
213

Adult Ed
09/10 10/11
Adopted Difference
FY FY 10/11FY
Adopted
$ FTE $FTE$ FTE
BUDGET FUND 1003
110 Certified Salaries $493,432 6.0 $404,052 4.0 ($89,380) -2.0
110 Part Time Certified Salaries $21,443 $2,500 ($18,943) 0.0
120 Non-Certified Salaries $320,406 9.0 $291,698 8.0 ($28,708) -1.0
120 Part Time Non-Certified Salaries $17,000 $15,000 ($2,000) 0.0
$852,281 15.0Total Salaries $713,250 12.0 ($139,031) -3.0
900 Fringe Benefits $298,501 $268,731 ($29,770) 0.0
$298,501Total Benefits $268,731 ($29,770) 0.0
322 Instr. Impr. Services $6,200 $6,500 $300 0.0
330 Other Prof. Tech Svs/MHIS $35,384 $35,384 $0 0.0
430 Maintenance Contracts $18,500 $20,000 $1,500 0.0
441 Rental of Facilities $500 $0 ($500) 0.0
530 Communications $1,500 $1,000 ($500) 0.0
611 Supplies & Materials $50,686 $87,022 $36,336 0.0
620 Utilities $205,000 $153,645 ($51,355) 0.0
899 Other Operating Exp. $16,852 $2,000 ($14,852) 0.0
$334,622Total Operating Expenses $305,551 ($29,071) 0.0
$1,485,404 15.0TOTAL BUDGET FUND $1,287,532 12.0 ($197,872) -3.01003
BUDGET FUND 2007
110 Certified Salaries $471,004 6.0 $380,948 5.0 ($90,056) -1.0
110 Part Time Certified Salaries $410,000 $400,000 ($10,000) 0.0
120 Non-Certified Salaries $429,503 11.0 $330,937 7.0 ($98,566) -4.0
120 Part Time Non-Certified Salaries $50,000 $66,500 $16,500 0.0
$1,360,507 17.0Total Salaries $1,178,385 12.0 ($182,122) -5.0
900 Fringe Benefits $357,198 $289,982 ($67,216) 0.0
$357,198Total Benefits $289,982 ($67,216) 0.0
322 Instr. Impr. Services $3,238 $3,500 $262 0.0
324 Field Trips $3,000 $3,000 $0 0.0
330 Other Prof. Tech Svs/MHIS $20,000 $10,000 ($10,000) 0.0
510 Transportation $35,000 $45,000 $10,000 0.0
530 Communications $13,600 $13,600 $0 0.0
580 Travel/Conferences & Seminars $1,200 $1,200 $0 0.0
611 Supplies & Materials $177,208 $67,000 ($110,208) 0.0
700 Equipment $50,548 $14,000 ($36,548) 0.0
899 Other Operating Exp. $118,102 $0 ($118,102) 0.0
$421,896Total Operating Expenses $157,300 ($264,596) 0.0
$2,139,601 17.0TOTAL BUDGET FUND $1,625,667 12.0 ($513,934) -5.02007
$3,625,005 32.0GRAND TOTAL ALL FUNDS $2,913,198 24.0 ($711,806) -8.0
214

Adult Ed
Certified Staff Enrollment Non-Certified Staff
STAFFING and ENROLLMENT
Adopted Actual Projected Adopted
09/10 10/11 09/10 10/11 09/10 10/11
Adopted Adopted
Principals Clerical Support 3.0 3.0
Pre-K 0
Associate/Assistant Principal Paraprofessionals
K 0 Classroom 1.0
Dean Special Education
Teachers 1st 0 Other - Special Educ
Pre-K
Regular 7.0 2nd 0 Kindergarten
Associate Teacher Other Para 1.0
Art 3rd 0
Business Prev/Interv Staff
Reading 4th 0
Foreign Language CDA
Health 5th 0
Tech Comp Educ Family Resource Aides
Math 6th 0
Music School and Family Support
Science 7th 0
Social Studies Nurse
English 8th 0
Physical Education Custodial Staff 3.0 2.0
Special Education 9th 0
Pre-K Security 4.0 2.0
Kindergarten 10th 0
Bilingual Gym & Pool Asst
TESOL/ELL 11th 0
Speech M&C Journeyman
Library Media 12th 0
Coach Tech Support
Other 4.0 8.0
Other 9.0 7.0
Social Workers 1.0 1.0
Guidance Counselors
12.0 9.0 0 20.0 15.0Total Total Total
Adopted
Staffing Total 32.0 24.0
Adopted
215

Non-Public/Neglected & Delinquent
09/10 10/11
Adopted Difference
FY FY 10/11FY
Adopted
$ FTE $FTE$ FTE
BUDGET FUND 2007110 Certified Salaries $124,669 1.7 $119,999 1.4 ($4,670) -0.4
120 Part Time Non-Certified Salaries $0 $7,000 $7,000 0.0
$124,669 1.7Total Salaries $126,999 1.4 $2,330 -0.4
900 Fringe Benefits $33,499 $38,131 $4,633 0.0
$33,499Total Benefits $38,131 $4,633 0.0
322 Instr. Impr. Services $110,566 $70,465 ($40,101) 0.0
324 Field Trips $4,500 ($4,500) 0.0
325 Parent Activities $1,000 ($1,000) 0.0
330 Other Prof. Tech Svs/MHIS $82,199 ($82,199) 0.0
611 Supplies & Materials $19,580 $115,391 $95,811 0.0
700 Equipment $38,000 ($38,000) 0.0
$255,845Total Operating Expenses $185,856 ($69,989) 0.0
$414,013 1.7TOTAL BUDGET FUND $350,986 1.4 ($63,026) -0.42007
$414,013 1.7GRAND TOTAL ALL FUNDS $350,986 1.4 ($63,026) -0.4
216

Non-Public/Neglected & Delinquent
Certified Staff Enrollment Non-Certified Staff
STAFFING and ENROLLMENT
Adopted Proposed Actual Projected Adopted Proposed
09/10 10/11 09/10 10/11 09/10 10/11
Principals Clerical Support
Pre-K
Associate/Assistant Principal Paraprofessionals
K Classroom
Dean Special Education
Teachers 1st Other - Special Educ
Pre-K
Regular 1.7 1.4 2nd Kindergarten
Associate Teacher Other Para
Art 3rd
Business Prev/Interv Staff
Reading 4th
Foreign Language CDA
Health 5th
Tech Comp Educ Family Resource Aides
Math 6th
Music School and Family Support
Science 7th
Social Studies Nurse
English 8th
Physical Education Custodial Staff
Special Education 9th
Pre-K Security
Kindergarten 10th
Bilingual Gym & Pool Asst
TESOL/ELL 11th
Speech M&C Journeyman
Library Media 12th
Coach Tech Support
Other
Other
Social Workers
Guidance Counselors
1.7 1.4Total Total Total
Adopted Proposed
Staffing Total 1.7 1.4
217

Sundry-Schools
09/10 10/11
Adopted Difference
FY FY 10/11FY
Proposed
$ FTE $FTE$ FTE
BUDGET FUND 1003110 Part Time Certified Salaries $0 $1,880,000 $1,880,000 0.0
120 Part Time Non-Certified Salaries $0 $500,000 $500,000 0.0
$0Total Salaries $2,380,000 $2,380,000 0.0
901 Mandated Compensatory Education $0 $1,855,192 $1,855,192 0.0
$0Total Operating Expenses $1,855,192 $1,855,192 0.0
900 Reimbursement/Benefits $0 $61,602 $61,602 0.0
$0Total Reimbursement/Benefits $61,602 $61,602 0.0
$0TOTAL BUDGET FUND $4,296,794 $4,296,7941003
BUDGET FUND 2007120 Non-Certified Salaries $0 $780,448 29.0 $780,448 29.0
$0Total Salaries $780,448 29.0 $780,448 29.0
900 Fringe Benefits $0 0.0 $376,722 0.0 $376,722 0.0
$0 0.0Total Benefits $376,722 0.0 $376,722 0.0
$0 0.0TOTAL BUDGET FUND $1,157,170 29.0 $1,157,170 29.02007
$0 0.0GRAND TOTAL ALL FUNDS $5,453,964 29.0 $5,453,964 29.0
218

This page intentionally left blank.
219

CENTRAL
SERVICES

Superintendent
09/10 10/11
Adopted Difference
FY FY 10/11FY
Adopted
$ FTE $FTE$ FTE
BUDGET FUND 1003110 Certified Salaries $242,785 1.0 $251,450 1.0 $8,665 0.0
120 Non-Certified Salaries $176,208 3.0 $130,903 2.0 ($45,305) -1.0
$418,993 4.0Total Salaries $382,353 3.0 ($36,640) -1.0
900 Fringe Benefits $155,596 $151,966 ($3,630) 0.0
$155,596Total Benefits $151,966 ($3,630) 0.0
322 Instr. Impr. Services $6,000 $3,000 ($3,000) 0.0
430 Maintenance Contracts $0 $2,000 $2,000 0.0
530 Communications $1,000 $300 ($700) 0.0
580 Travel/Conferences & Seminars $9,000 $9,000 $0 0.0
611 Supplies & Materials $5,000 $3,300 ($1,700) 0.0
899 Other Operating Exp. $24,759 $23,700 ($1,059) 0.0
$45,759Total Operating Expenses $41,300 ($4,459) 0.0
$620,348 4.0TOTAL BUDGET FUND $575,619 3.0 ($44,729) -1.01003
$620,348 4.0GRAND TOTAL ALL FUNDS $575,619 3.0 ($44,729) -1.0
220

Elementary Education
09/10 10/11
Adopted Difference
FY FY 10/11FY
Adopted
$ FTE $FTE$ FTE
BUDGET FUND 1003110 Certified Salaries $150,000 1.0 $169,000 1.0 $19,000 0.0
110 Part Time Certified Salaries $0 $5,000 $5,000 0.0
120 Non-Certified Salaries $78,639 1.5 $104,208 2.0 $25,569 0.5
120 Part Time Non-Certified Salaries $2,500 $2,000 ($500) 0.0
$231,139 2.5Total Salaries $280,208 3.0 $49,069 0.5
900 Fringe Benefits $80,822 $103,474 $22,652 0.0
$80,822Total Benefits $103,474 $22,652 0.0
322 Instr. Impr. Services $17,500 $18,000 $500 0.0
330 Other Prof. Tech Svs/MHIS $5,000 $5,000 $0 0.0
430 Maintenance Contracts $0 $11,947 $11,947 0.0
530 Communications $800 $900 $100 0.0
580 Travel/Conferences & Seminars $3,710 $3,700 ($10) 0.0
611 Supplies & Materials $4,807 $4,800 ($7) 0.0
700 Equipment $2,500 $2,500 $0 0.0
899 Other Operating Exp. $117,234 $32,983 ($84,251) 0.0
$151,551Total Operating Expenses $79,830 ($71,721) 0.0
$463,512 2.5TOTAL BUDGET FUND $463,512 3.0 $0 0.51003
BUDGET FUND 2007110 Certified Salaries $358,349 2.0 $373,106 4.0 $14,757 2.0
110 Part Time Certified Salaries $195,581 $147,856 ($47,725) 0.0
$553,930 2.0Total Salaries $520,962 4.0 ($32,968) 2.0
900 Fringe Benefits $99,124 $119,038 $19,914 0.0
$99,124Total Benefits $119,038 $19,914 0.0
322 Instr. Impr. Services $41,257 $0 ($41,257) 0.0
330 Other Prof. Tech Svs/MHIS $1,800 $0 ($1,800) 0.0
430 Maintenance Contracts $5,000 $0 ($5,000) 0.0
611 Supplies & Materials $39,929 $0 ($39,929) 0.0
899 Other Operating Exp. $2,400 $0 ($2,400) 0.0
999 Indirect $0 $6,060 $6,060 0.0
$90,386Total Operating Expenses $6,060 ($84,326) 0.0
$743,440 2.0TOTAL BUDGET FUND $646,060 4.0 ($97,380) 2.02007
$1,206,953 4.5GRAND TOTAL ALL FUNDS $1,109,572 7.0 ($97,380) 2.5
221

Secondary Education
09/10 10/11
Adopted Difference
FY FY 10/11FY
Adopted
$ FTE $FTE$ FTE
BUDGET FUND 1003110 Certified Salaries $137,800 1.0 $163,000 1.0 $25,200 0.0
120 Non-Certified Salaries $177,754 5.5 $60,179 1.0 ($117,575) -4.5
120 Part Time Non-Certified Salaries $34,144 $3,000 ($31,144) 0.0
$349,698 6.5Total Salaries $226,179 2.0 ($123,519) -4.5
900 Fringe Benefits $130,791 $80,346 ($50,445) 0.0
$130,791Total Benefits $80,346 ($50,445) 0.0
322 Instr. Impr. Services $60,000 $25,000 ($35,000) 0.0
330 Other Prof. Tech Svs/MHIS $5,000 $3,000 ($2,000) 0.0
430 Maintenance Contracts $5,000 $9,253 $4,253 0.0
530 Communications $500 $300 ($200) 0.0
580 Travel/Conferences & Seminars $2,700 $2,700 $0 0.0
611 Supplies & Materials $49,182 $22,100 ($27,082) 0.0
700 Equipment $7,000 ($7,000) 0.0
899 Other Operating Exp. $160,012 $18,200 ($141,812) 0.0
$289,394Total Operating Expenses $80,553 ($208,841) 0.0
$769,883 6.5TOTAL BUDGET FUND $387,078 2.0 ($382,805) -4.51003
BUDGET FUND 2007110 Certified Salaries $437,823 3.6 $693,523 5.0 $255,700 1.4
110 Part Time Certified Salaries $0 $125,735 $125,735 0.0
120 Part Time Non-Certified Salaries $64,260 $0 ($64,260) 0.0
$502,083 3.6Total Salaries $819,258 5.0 $317,175 1.4
900 Fringe Benefits $122,559 $219,104 $96,545 0.0
$122,559Total Benefits $219,104 $96,545 0.0
322 Instr. Impr. Services $74,368 $0 ($74,368) 0.0
330 Other Prof. Tech Svs/MHIS $89,257 $46,000 ($43,257) 0.0
611 Supplies & Materials $1,639 $370,649 $369,010 0.0
899 Other Operating Exp. $0 $15,000 $15,000 0.0
999 Indirect $0 $20,383 $20,383 0.0
$165,264Total Operating Expenses $452,032 $286,768 0.0
$789,906 3.6TOTAL BUDGET FUND $1,490,394 5.0 $700,488 1.42007
$1,559,789 10.1GRAND TOTAL ALL FUNDS $1,877,472 7.0 $317,683 -3.1
222

School Design
09/10 10/11
Adopted Difference
FY FY 10/11FY
Adopted
$ FTE $FTE$ FTE
BUDGET FUND 1003110 Certified Salaries $254,943 2.0 $106,933 1.0 ($148,010) -1.0
120 Non-Certified Salaries $58,406 1.0 $53,935 1.0 ($4,471) 0.0
$313,349 3.0Total Salaries $160,868 2.0 ($152,481) -1.0
900 Fringe Benefits $98,454 $59,537 ($38,917) 0.0
$98,454Total Benefits $59,537 ($38,917) 0.0
322 Instr. Impr. Services $5,000 $0 ($5,000) 0.0
430 Maintenance Contracts $0 $2,045 $2,045 0.0
530 Communications $20,000 $14,500 ($5,500) 0.0
580 Travel/Conferences & Seminars $5,000 $2,700 ($2,300) 0.0
611 Supplies & Materials $405,000 $2,600 ($402,400) 0.0
700 Equipment $20,000 $7,500 ($12,500) 0.0
899 Other Operating Exp. $15,000 $5,734 ($9,266) 0.0
$470,000Total Operating Expenses $35,079 ($434,921) 0.0
$881,803 3.0TOTAL BUDGET FUND $255,484 2.0 ($626,319) -1.01003
BUDGET FUND 2007110 Certified Salaries $229,123 2.0 $265,858 2.0 $36,735 0.0
110 Part Time Certified Salaries $261,344 $50,735 ($210,609) 0.0
120 Part Time Non-Certified Salaries $2,650 ($2,650) 0.0
$493,117 2.0Total Salaries $316,593 2.0 ($176,524) 0.0
900 Fringe Benefits $65,558 $84,029 $18,471 0.0
$65,558Total Benefits $84,029 $18,471 0.0
322 Instr. Impr. Services $230,000 $428,981 $198,981 0.0
324 Field Trips $435 ($435) 0.0
330 Other Prof. Tech Svs/MHIS $363,632 $363,000 ($632) 0.0
510 Transportation $35,000 ($35,000) 0.0
530 Communications $0 $10,000 $10,000 0.0
580 Travel/Conferences & Seminars $40,855 $0 ($40,855) 0.0
611 Supplies & Materials $402,215 $218,000 ($184,215) 0.0
700 Equipment $514,253 $0 ($514,253) 0.0
899 Other Operating Exp. $104,895 $0 ($104,895) 0.0
999 Indirect $27,162 ($27,162) 0.0
$1,718,447Total Operating Expenses $1,019,981 ($698,466) 0.0
$2,277,122 2.0TOTAL BUDGET FUND $1,420,603 2.0 ($856,519) 0.02007
$3,158,924 5.0GRAND TOTAL ALL FUNDS $1,676,087 4.0 ($1,482,838) -1.0
223

Academics
09/10 10/11
Adopted Difference
FY FY 10/11FY
Adopted
$ FTE $FTE$ FTE
BUDGET FUND 1003110 Certified Salaries $998,530 8.0 $1,023,859 8.0 $25,329 0.0
110 Part Time Certified Salaries $182,355 $203,000 $20,645 0.0
120 Non-Certified Salaries $281,373 5.0 $282,348 5.0 $975 0.0
120 Part Time Non-Certified Salaries $31,300 $0 ($31,300) 0.0
$1,493,558 13.0Total Salaries $1,509,207 13.0 $15,649 0.0
900 Fringe Benefits $417,632 $460,008 $42,376 0.0
$417,632Total Benefits $460,008 $42,376 0.0
322 Instr. Impr. Services $142,748 $181,578 $38,830 0.0
330 Other Prof. Tech Svs/MHIS $100,000 $0 ($100,000) 0.0
430 Maintenance Contracts $24,585 $12,000 ($12,585) 0.0
530 Communications $27,500 $32,500 $5,000 0.0
580 Travel/Conferences & Seminars $12,000 $12,000 $0 0.0
611 Supplies & Materials $1,254,122 $1,136,341 ($117,781) 0.0
700 Equipment $0 $25,000 $25,000 0.0
899 Other Operating Exp. $23,752 $43,478 $19,726 0.0
$1,584,707Total Operating Expenses $1,442,897 ($141,810) 0.0
$3,495,897 13.0TOTAL BUDGET FUND $3,412,112 13.0 ($83,785) 0.01003
BUDGET FUND 2007110 Certified Salaries $4,639,055 11.0 $976,162 9.0 ($3,662,893) -2.0
110 Part Time Certified Salaries $667,757 $4,829,745 $4,161,988 0.0
120 Non-Certified Salaries $463,695 7.0 $494,927 7.0 $31,232 0.0
120 Part Time Non-Certified Salaries $329,096 $225,000 ($104,096) 0.0
$6,099,603 18.0Total Salaries $6,525,834 16.0 $426,231 -2.0
900 Fringe Benefits $1,518,984 $631,977 ($887,008) 0.0
$1,518,984Total Benefits $631,977 ($887,008) 0.0
322 Instr. Impr. Services $8,414,103 $6,535,996 ($1,878,107) 0.0
325 Parent Activities $8,000 $1,700 ($6,300) 0.0
330 Other Prof. Tech Svs/MHIS $2,096,309 $98,127 ($1,998,182) 0.0
430 Maintenance Contracts $148,208 $139,832 ($8,376) 0.0
441 Rental of Facilities $75,000 ($75,000) 0.0
510 Transportation $314,851 ($314,851) 0.0
530 Communications $73,015 $0 ($73,015) 0.0
580 Travel/Conferences & Seminars $45,000 $0 ($45,000) 0.0
611 Supplies & Materials $5,517,672 $1,289,896 ($4,227,776) 0.0
700 Equipment $3,565,484 $1,572,609 ($1,992,875) 0.0
899 Other Operating Exp. $490,950 $0 ($490,950) 0.0
$20,748,592Total Operating Expenses $9,638,160 ($11,110,432) 0.0
$28,367,179 18.0TOTAL BUDGET FUND $16,795,971 16.0 ($11,571,209) -2.02007
$31,863,076 31.0GRAND TOTAL ALL FUNDS $20,208,083 29.0 ($11,654,993) -2.0
224

Learning and Student Support Services
09/10 10/11
Adopted Difference
FY FY 10/11FY
Adopted
$ FTE $FTE$ FTE
BUDGET FUND 1003110 Certified Salaries $140,400 1.0 $145,600 1.0 $5,200 0.0
110 Part Time Certified Salaries $164,423 $151,773 ($12,650) 0.0
120 Non-Certified Salaries $132,316 4.0 $140,321 4.0 $8,005 0.0
$437,139 5.0Total Salaries $437,694 5.0 $555 0.0
900 Fringe Benefits $107,961 $115,550 $7,589 0.0
$107,961Total Benefits $115,550 $7,589 0.0
530 Communications $2,000 ($2,000) 0.0
580 Travel/Conferences & Seminars $0 $2,000 $2,000 0.0
611 Supplies & Materials $3,352 ($3,352) 0.0
899 Other Operating Exp. $4,791 ($4,791) 0.0
$10,143Total Operating Expenses $2,000 ($8,143) 0.0
$555,243 5.0TOTAL BUDGET FUND $555,244 5.0 $1 0.01003
BUDGET FUND 2007110 Certified Salaries $117,910 1.0 $121,172 1.0 $3,262 0.0
$117,910 1.0Total Salaries $121,172 1.0 $3,262 0.0
900 Fringe Benefits $31,682 $37,963 $6,281 0.0
$31,682Total Benefits $37,963 $6,281 0.0
$149,592 1.0TOTAL BUDGET FUND $159,135 1.0 $9,543 0.02007
$704,836 6.0GRAND TOTAL ALL FUNDS $714,379 6.0 $9,544 0.0
225

Special Education
09/10 10/11
Adopted Difference
FY FY 10/11FY
Adopted
$ FTE $FTE$ FTE
BUDGET FUND 1003110 Certified Salaries $220,388 3.0 $228,544 3.0 $8,156 0.0
110 Part Time Certified Salaries $0 $1,000 $1,000 0.0
120 Non-Certified Salaries $95,874 2.0 $95,874 2.0 $0 0.0
120 Part Time Non-Certified Salaries $20,425 $8,500 ($11,925) 0.0
$336,687 5.0Total Salaries $333,918 5.0 ($2,769) 0.0
900 Fringe Benefits $109,945 $118,546 $8,601 0.0
$109,945Total Benefits $118,546 $8,601 0.0
330 Other Prof. Tech Svs/MHIS $5,374 $10,000 $4,626 0.0
430 Maintenance Contracts $0 $2,999 $2,999 0.0
530 Communications $5,305 $5,000 ($305) 0.0
560 Tuition $8,917,762 $13,489,000 $4,571,238 0.0
611 Supplies & Materials $41,410 $20,247 ($21,163) 0.0
700 Equipment $4,000 $4,000 $0 0.0
$8,973,851Total Operating Expenses $13,531,246 $4,557,395 0.0
$9,420,483 5.0TOTAL BUDGET FUND $13,983,710 5.0 $4,563,227 0.01003
BUDGET FUND 2007110 Certified Salaries $1,628,788 17.9 $1,559,191 16.2 ($69,597) -1.7
110 Part Time Certified Salaries $1,001,287 $215,800 ($785,487) 0.0
120 Non-Certified Salaries $179,846 3.0 $629,756 18.5 $449,910 15.5
120 Part Time Non-Certified Salaries $329,159 $94,300 ($234,859) 0.0
$3,139,080 20.9Total Salaries $2,499,047 34.7 ($640,033) 13.8
900 Fringe Benefits $574,230 $803,751 $229,521 0.0
$574,230Total Benefits $803,751 $229,521 0.0
322 Instr. Impr. Services $282,737 $33,000 ($249,737) 0.0
323 Pupil Svs:Non Payroll Svs $317,055 $240,000 0.0 ($77,055) 0.0
324 Field Trips $1,000 $1,000 $0 0.0
325 Parent Activities $62,000 $10,000 ($52,000) 0.0
330 Other Prof. Tech Svs/MHIS $1,746,962 $420,000 ($1,326,962) 0.0
510 Transportation $1,281,365 $900,000 ($381,365) 0.0
530 Communications $14,000 $2,000 ($12,000) 0.0
560 Tuition $12,962,350 $10,872,000 ($2,090,350) 0.0
580 Travel/Conferences & Seminars $25,276 $5,000 ($20,276) 0.0
611 Supplies & Materials $2,291,816 $266,047 ($2,025,769) 0.0
700 Equipment $1,042,858 $10,000 ($1,032,858) 0.0
899 Other Operating Exp. $12,671 $4,800 ($7,871) 0.0
999 Indirect $361,414 $153,692 ($207,722) 0.0
$20,401,504Total Operating Expenses $12,917,539 0.0 ($7,483,965) 0.0
$24,114,814 20.9TOTAL BUDGET FUND $16,220,337 34.7 ($7,894,477) 13.82007
$33,535,297 25.9GRAND TOTAL ALL FUNDS $30,204,047 39.7 ($3,331,250) 13.8
226

Language, Speech & Hearing
09/10 10/11
Adopted Difference
FY FY 10/11FY
Adopted
$ FTE $FTE$ FTE
BUDGET FUND 1003110 Certified Salaries $523,453 6.3 $541,841 7.3 $18,388 1.0
120 Non-Certified Salaries $885,987 19.5 $883,710 18.5 ($2,277) -1.0
$1,409,440 25.8Total Salaries $1,425,551 25.8 $16,111 0.0
900 Fringe Benefits $594,986 $596,326 $1,340 0.0
$594,986Total Benefits $596,326 $1,340 0.0
530 Communications $459 $200 ($259) 0.0
580 Travel/Conferences & Seminars $720 $2,000 $1,280 0.0
611 Supplies & Materials $9,713 $7,156 ($2,557) 0.0
700 Equipment $1,600 $2,000 $400 0.0
899 Other Operating Exp. $16,315 ($16,315) 0.0
$28,807Total Operating Expenses $11,356 ($17,451) 0.0
$2,033,233 25.8TOTAL BUDGET FUND $2,033,233 25.8 $0 0.01003
$2,033,233 25.8GRAND TOTAL ALL FUNDS $2,033,233 25.8 $0 0.0
227

Prevention & Intervention
09/10 10/11
Adopted Difference
FY FY 10/11FY
Adopted
$ FTE $FTE$ FTE
BUDGET FUND 1003110 Certified Salaries $178,173 1.5 $185,836 1.5 $7,663 0.0
$178,173 1.5Total Salaries $185,836 1.5 $7,663 0.0
900 Fringe Benefits $47,875 $58,222 $10,347 0.0
$47,875Total Benefits $58,222 $10,347 0.0
322 Instr. Impr. Services $0 $1,000 $1,000 0.0
330 Other Prof. Tech Svs/MHIS $1,000 ($1,000) 0.0
530 Communications $500 $500 $0 0.0
580 Travel/Conferences & Seminars $0 $600 $600 0.0
611 Supplies & Materials $20,522 $2,812 ($17,710) 0.0
700 Equipment $1,000 $0 ($1,000) 0.0
899 Other Operating Exp. $0 $100 $100 0.0
$23,022Total Operating Expenses $5,012 ($18,010) 0.0
$249,070 1.5TOTAL BUDGET FUND $249,070 1.5 $0 0.01003
BUDGET FUND 2007110 Certified Salaries $31,709 0.4 $0 0.0 ($31,709) -0.4
110 Part Time Certified Salaries $26,000 ($26,000) 0.0
120 Non-Certified Salaries $127,545 2.5 $187,317 3.5 $59,772 1.0
$185,254 2.9Total Salaries $187,317 3.5 $2,063 0.6
900 Fringe Benefits $74,302 $90,418 $16,116 0.0
$74,302Total Benefits $90,418 $16,116 0.0
322 Instr. Impr. Services $7,776 $0 ($7,776) 0.0
330 Other Prof. Tech Svs/MHIS $720,178 ($720,178) 0.0
510 Transportation $6,150 $5,000 ($1,150) 0.0
530 Communications $1,000 $0 ($1,000) 0.0
580 Travel/Conferences & Seminars $1,500 $0 ($1,500) 0.0
611 Supplies & Materials $61,473 $37,130 ($24,343) 0.0
700 Equipment $2,000 $7,000 $5,000 0.0
899 Other Operating Exp. $92,905 $0 ($92,905) 0.0
999 Indirect $32,231 $5,202 ($27,029) 0.0
$925,213Total Operating Expenses $54,332 ($870,881) 0.0
$1,184,769 2.9TOTAL BUDGET FUND $332,067 3.5 ($852,702) 0.62007
$1,433,839 4.4GRAND TOTAL ALL FUNDS $581,137 5.0 ($852,702) 0.6
228
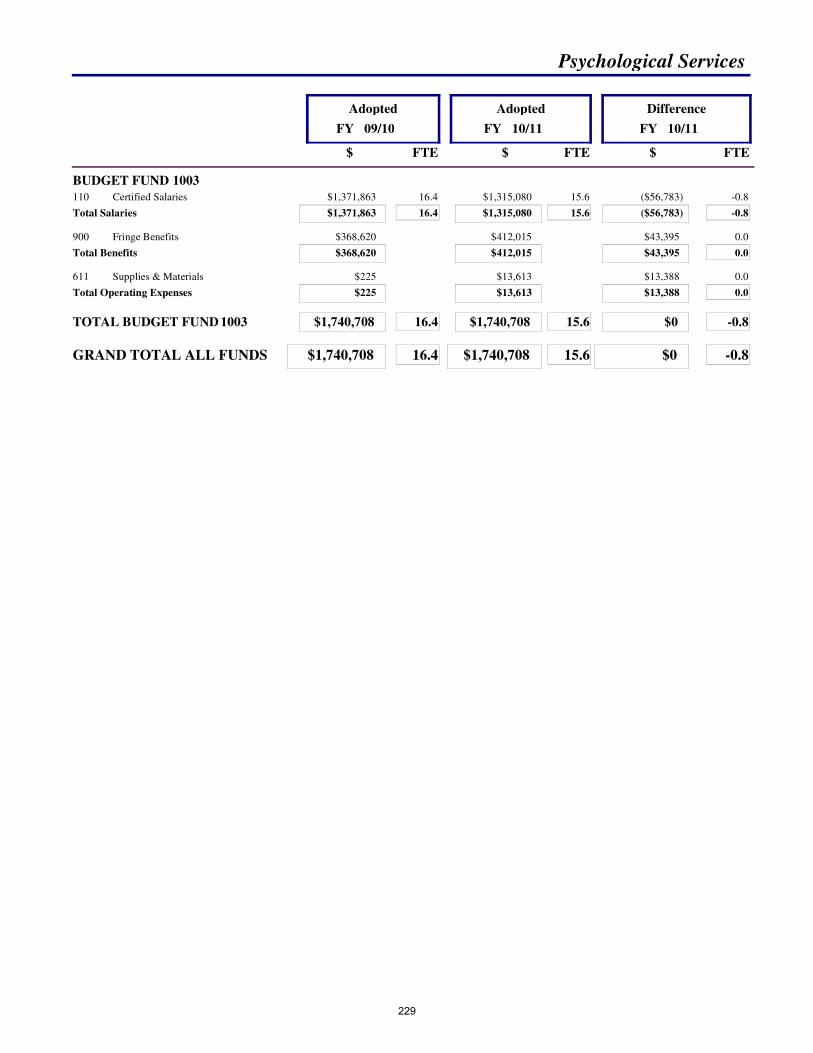
Psychological Services
09/10 10/11
Adopted Difference
FY FY 10/11FY
Adopted
$ FTE $FTE$ FTE
BUDGET FUND 1003110 Certified Salaries $1,371,863 16.4 $1,315,080 15.6 ($56,783) -0.8
$1,371,863 16.4Total Salaries $1,315,080 15.6 ($56,783) -0.8
900 Fringe Benefits $368,620 $412,015 $43,395 0.0
$368,620Total Benefits $412,015 $43,395 0.0
611 Supplies & Materials $225 $13,613 $13,388 0.0
$225Total Operating Expenses $13,613 $13,388 0.0
$1,740,708 16.4TOTAL BUDGET FUND $1,740,708 15.6 $0 -0.81003
$1,740,708 16.4GRAND TOTAL ALL FUNDS $1,740,708 15.6 $0 -0.8
229

Health Services
09/10 10/11
Adopted Difference
FY FY 10/11FY
Adopted
$ FTE $FTE$ FTE
BUDGET FUND 1003120 Non-Certified Salaries $444,262 7.5 $457,465 7.5 $13,203 0.0
120 Part Time Non-Certified Salaries $5,000 $5,000 $0 0.0
$449,262 7.5Total Salaries $462,465 7.5 $13,203 0.0
900 Fringe Benefits $228,200 $221,201 ($6,999) 0.0
$228,200Total Benefits $221,201 ($6,999) 0.0
430 Maintenance Contracts $4,500 $4,500 $0 0.0
441 Rental of Facilities $1,500 $1,500 $0 0.0
530 Communications $3,000 $3,000 $0 0.0
580 Travel/Conferences & Seminars $720 $2,000 $1,280 0.0
611 Supplies & Materials $3,070 $4,070 $1,000 0.0
700 Equipment $2,600 ($2,600) 0.0
899 Other Operating Exp. $9,654 $3,770 ($5,884) 0.0
$25,044Total Operating Expenses $18,840 ($6,204) 0.0
$702,506 7.5TOTAL BUDGET FUND $702,506 7.5 $0 0.01003
BUDGET FUND 2007120 Non-Certified Salaries $1,269,710 26.3 $1,215,183 24.3 ($54,527) -2.0
120 Part Time Non-Certified Salaries $34,946 $41,700 $6,754 0.0
$1,304,656 26.3Total Salaries $1,256,883 24.3 ($47,773) -2.0
900 Fringe Benefits $653,781 $589,759 ($64,022) 0.0
$653,781Total Benefits $589,759 ($64,022) 0.0
322 Instr. Impr. Services $5,615 ($5,615) 0.0
330 Other Prof. Tech Svs/MHIS $27,500 $27,500 $0 0.0
430 Maintenance Contracts $19,500 $18,500 ($1,000) 0.0
441 Rental of Facilities $4,675 $3,600 ($1,075) 0.0
530 Communications $6,385 $0 ($6,385) 0.0
580 Travel/Conferences & Seminars $500 $0 ($500) 0.0
611 Supplies & Materials $128,903 $138,238 $9,335 0.0
700 Equipment $931 ($931) 0.0
999 Indirect $3,963 $3,787 ($176) 0.0
$197,972Total Operating Expenses $191,625 ($6,347) 0.0
$2,156,409 26.3TOTAL BUDGET FUND $2,038,267 24.3 ($118,142) -2.02007
$2,858,915 33.8GRAND TOTAL ALL FUNDS $2,740,773 31.8 ($118,142) -2.0
230

The Welcome Center
09/10 10/11
Adopted Difference
FY FY 10/11FY
Adopted
$ FTE $FTE$ FTE
BUDGET FUND 1003120 Non-Certified Salaries $61,251 1.5 $68,316 1.5 $7,065 0.0
$61,251 1.5Total Salaries $68,316 1.5 $7,065 0.0
900 Fringe Benefits $31,410 $32,976 $1,567 0.0
$31,410Total Benefits $32,976 $1,567 0.0
322 Instr. Impr. Services $10,000 $5,000 ($5,000) 0.0
325 Parent Activities $6,000 $6,000 $0 0.0
330 Other Prof. Tech Svs/MHIS $5,000 $5,000 $0 0.0
430 Maintenance Contracts $0 $412 $412 0.0
530 Communications $3,500 $3,500 $0 0.0
580 Travel/Conferences & Seminars $2,500 $2,500 $0 0.0
611 Supplies & Materials $10,000 $14,957 $4,957 0.0
899 Other Operating Exp. $14,000 $5,000 ($9,000) 0.0
$51,000Total Operating Expenses $42,369 ($8,631) 0.0
$143,661 1.5TOTAL BUDGET FUND $143,661 1.5 $1 0.01003
BUDGET FUND 2007120 Non-Certified Salaries $174,514 2.0 $185,667 2.0 $11,153 0.0
$174,514 2.0Total Salaries $185,667 2.0 $11,153 0.0
900 Fringe Benefits $89,491 $89,621 $131 0.0
$89,491Total Benefits $89,621 $131 0.0
322 Instr. Impr. Services $2,500 $0 ($2,500) 0.0
325 Parent Activities $193,131 $9,200 ($183,931) 0.0
330 Other Prof. Tech Svs/MHIS $500 $0 ($500) 0.0
510 Transportation $250 ($250) 0.0
611 Supplies & Materials $1,822 $0 ($1,822) 0.0
899 Other Operating Exp. $20,935 $0 ($20,935) 0.0
$219,138Total Operating Expenses $9,200 ($209,938) 0.0
$483,143 2.0TOTAL BUDGET FUND $284,488 2.0 ($198,654) 0.02007
$626,803 3.5GRAND TOTAL ALL FUNDS $428,150 3.5 ($198,654) 0.0
231

Strategic Partnerships
09/10 10/11
Adopted Difference
FY FY 10/11FY
Adopted
$ FTE $FTE$ FTE
BUDGET FUND 1003120 Non-Certified Salaries $208,292 3.0 $213,292 3.0 $5,000 0.0
120 Part Time Non-Certified Salaries $0 $5,000 $5,000 0.0
$208,292 3.0Total Salaries $218,292 3.0 $10,000 0.0
900 Fringe Benefits $106,812 $103,339 ($3,474) 0.0
$106,812Total Benefits $103,339 ($3,474) 0.0
322 Instr. Impr. Services $0 $2,500 $2,500 0.0
330 Other Prof. Tech Svs/MHIS $0 $20,000 $20,000 0.0
530 Communications $300 $300 $0 0.0
580 Travel/Conferences & Seminars $2,700 $2,700 $0 0.0
611 Supplies & Materials $2,250 $3,250 $1,000 0.0
899 Other Operating Exp. $5,200 $17,200 $12,000 0.0
$10,450Total Operating Expenses $45,950 $35,500 0.0
$325,554 3.0TOTAL BUDGET FUND $367,581 3.0 $42,026 0.01003
BUDGET FUND 2007330 Other Prof. Tech Svs/MHIS $270,000 $297,000 $27,000 0.0
510 Transportation $250,000 ($250,000) 0.0
$520,000Total Operating Expenses $297,000 ($223,000) 0.0
$520,000TOTAL BUDGET FUND $297,000 ($223,000)2007
$845,554 3.0GRAND TOTAL ALL FUNDS $664,581 3.0 ($180,974) 0.0
232

Communications
09/10 10/11
Adopted Difference
FY FY 10/11FY
Adopted
$ FTE $FTE$ FTE
BUDGET FUND 1003120 Non-Certified Salaries $173,680 2.5 $151,185 2.0 ($22,495) -0.5
120 Part Time Non-Certified Salaries $0 $11,000 $11,000 0.0
$173,680 2.5Total Salaries $162,185 2.0 ($11,495) -0.5
900 Fringe Benefits $89,063 $73,818 ($15,245) 0.0
$89,063Total Benefits $73,818 ($15,245) 0.0
322 Instr. Impr. Services $3,000 $3,000 $0 0.0
330 Other Prof. Tech Svs/MHIS $32,548 $32,549 $1 0.0
430 Maintenance Contracts $0 $2,045 $2,045 0.0
530 Communications $38,000 $38,000 $0 0.0
611 Supplies & Materials $0 $2,480 $2,480 0.0
700 Equipment $0 $40,000 $40,000 0.0
899 Other Operating Exp. $90,500 $72,714 ($17,786) 0.0
$164,048Total Operating Expenses $190,788 $26,740 0.0
$426,791 2.5TOTAL BUDGET FUND $426,791 2.0 $0 -0.51003
$426,791 2.5GRAND TOTAL ALL FUNDS $426,791 2.0 $0 -0.5
233

School Operations
09/10 10/11
Adopted Difference
FY FY 10/11FY
Adopted
$ FTE $FTE$ FTE
BUDGET FUND 1003120 Non-Certified Salaries $403,182 5.0 $434,967 5.0 $31,785 0.0
120 Part Time Non-Certified Salaries $34,000 $1,000 ($33,000) 0.0
$437,182 5.0Total Salaries $435,967 5.0 ($1,215) 0.0
900 Fringe Benefits $209,353 $210,035 $682 0.0
$209,353Total Benefits $210,035 $682 0.0
322 Instr. Impr. Services $1,000 $1,000 $0 0.0
330 Other Prof. Tech Svs/MHIS $95,481 $95,481 $0 0.0
530 Communications $400 $400 $0 0.0
580 Travel/Conferences & Seminars $4,700 $4,700 $0 0.0
611 Supplies & Materials $2,100 $2,100 $0 0.0
700 Equipment $1,000 $1,000 $0 0.0
899 Other Operating Exp. $600 $600 $0 0.0
$105,281Total Operating Expenses $105,281 $0 0.0
$751,816 5.0TOTAL BUDGET FUND $751,283 5.0 ($533) 0.01003
$751,816 5.0GRAND TOTAL ALL FUNDS $751,283 5.0 ($533) 0.0
234

Student Transportation
09/10 10/11
Adopted Difference
FY FY 10/11FY
Adopted
$ FTE $FTE$ FTE
BUDGET FUND 1003120 Non-Certified Salaries $178,387 3.0 $264,724 4.0 $86,337 1.0
120 Part Time Non-Certified Salaries $23,800 $53,000 $29,200 0.0
$202,187 3.0Total Salaries $317,724 4.0 $115,537 1.0
900 Fringe Benefits $93,298 $131,837 $38,539 0.0
$93,298Total Benefits $131,837 $38,539 0.0
430 Maintenance Contracts $0 $2,045 $2,045 0.0
510 Transportation $21,153,454 $21,660,185 $506,731 0.0
530 Communications $1,000 $2,500 $1,500 0.0
611 Supplies & Materials $5,000 $6,350 $1,350 0.0
700 Equipment $0 $3,000 $3,000 0.0
$21,159,454Total Operating Expenses $21,674,080 $514,626 0.0
$21,454,939 3.0TOTAL BUDGET FUND $22,123,641 4.0 $668,702 1.01003
BUDGET FUND 2007510 Transportation $3,151,200 $2,423,258 ($727,942) 0.0
$3,151,200Total Operating Expenses $2,423,258 ($727,942) 0.0
$3,151,200TOTAL BUDGET FUND $2,423,258 ($727,942)2007
$24,606,139 3.0GRAND TOTAL ALL FUNDS $24,546,899 4.0 ($59,240) 1.0
235

Building & Grounds
09/10 10/11
Adopted Difference
FY FY 10/11FY
Adopted
$ FTE $FTE$ FTE
BUDGET FUND 1003120 Non-Certified Salaries $1,427,208 28.0 $1,402,771 28.0 ($24,437) 0.0
120 Part Time Non-Certified Salaries $54,540 $59,500 $4,960 0.0
$1,481,748 28.0Total Salaries $1,462,271 28.0 ($19,477) 0.0
900 Fringe Benefits $736,045 $681,669 ($54,375) 0.0
$736,045Total Benefits $681,669 ($54,375) 0.0
330 Other Prof. Tech Svs/MHIS $10,000 $30,000 $20,000 0.0
430 Maintenance Contracts $1,726,611 $1,782,268 $55,657 0.0
441 Rental of Facilities $5,228,294 $4,893,621 ($334,673) 0.0
450 Improvement to Facilities $3,550,000 $2,880,000 ($670,000) 0.0
530 Communications $700 $1,000 $300 0.0
580 Travel/Conferences & Seminars $12,581 $24,000 $11,419 0.0
611 Supplies & Materials $531,440 $534,498 $3,058 0.0
620 Utilities $829,266 $803,202 ($26,064) 0.0
700 Equipment $68,500 $196,500 $128,000 0.0
899 Other Operating Exp. $150 $300 $150 0.0
$11,957,542Total Operating Expenses $11,145,389 ($812,153) 0.0
$14,175,335 28.0TOTAL BUDGET FUND $13,289,329 28.0 ($886,005) 0.01003
$14,175,335 28.0GRAND TOTAL ALL FUNDS $13,289,329 28.0 ($886,005) 0.0
236

Learning Corridor
09/10 10/11
Adopted Difference
FY FY 10/11FY
Adopted
$ FTE $FTE$ FTE
BUDGET FUND 1003120 Non-Certified Salaries $361,854 9.0 $344,700 8.0 ($17,154) -1.0
120 Part Time Non-Certified Salaries $0 $2,000 $2,000 0.0
$361,854 9.0Total Salaries $346,700 8.0 ($15,154) -1.0
900 Fringe Benefits $185,559 $166,540 ($19,019) 0.0
$185,559Total Benefits $166,540 ($19,019) 0.0
430 Maintenance Contracts $142,530 $187,720 $45,190 0.0
530 Communications $500 ($500) 0.0
611 Supplies & Materials $73,877 $72,000 ($1,877) 0.0
620 Utilities $527,490 $412,135 ($115,355) 0.0
$744,397Total Operating Expenses $671,855 ($72,542) 0.0
$1,291,810 9.0TOTAL BUDGET FUND $1,185,095 8.0 ($106,715) -1.01003
$1,291,810 9.0GRAND TOTAL ALL FUNDS $1,185,095 8.0 ($106,715) -1.0
237

Safety & Security
09/10 10/11
Adopted Difference
FY FY 10/11FY
Adopted
$ FTE $FTE$ FTE
BUDGET FUND 1003120 Non-Certified Salaries $160,742 2.0 $166,724 2.0 $5,982 0.0
120 Part Time Non-Certified Salaries $3,000 $31,500 $28,500 0.0
$163,742 2.0Total Salaries $198,224 2.0 $34,482 0.0
900 Fringe Benefits $82,658 $82,887 $229 0.0
$82,658Total Benefits $82,887 $229 0.0
330 Other Prof. Tech Svs/MHIS $3,000 $15,000 $12,000 0.0
430 Maintenance Contracts $1,936 $10,000 $8,064 0.0
530 Communications $2,357 $2,750 $393 0.0
580 Travel/Conferences & Seminars $1,000 $1,000 $0 0.0
611 Supplies & Materials $46,505 $37,750 ($8,755) 0.0
$54,798Total Operating Expenses $66,500 $11,702 0.0
$301,198 2.0TOTAL BUDGET FUND $347,611 2.0 $46,413 0.01003
$301,198 2.0GRAND TOTAL ALL FUNDS $347,611 2.0 $46,413 0.0
238

Printing & Delivery
09/10 10/11
Adopted Difference
FY FY 10/11FY
Adopted
$ FTE $FTE$ FTE
BUDGET FUND 1003120 Non-Certified Salaries $159,266 3.0 $172,500 3.0 $13,234 0.0
120 Part Time Non-Certified Salaries $90,000 $46,000 ($44,000) 0.0
$249,266 3.0Total Salaries $218,500 3.0 ($30,766) 0.0
900 Fringe Benefits $86,262 $86,785 $523 0.0
$86,262Total Benefits $86,785 $523 0.0
430 Maintenance Contracts $142,862 $140,000 ($2,862) 0.0
530 Communications $20,000 ($20,000) 0.0
611 Supplies & Materials $68,345 $119,000 $50,655 0.0
700 Equipment $9,950 $12,000 $2,050 0.0
$241,157Total Operating Expenses $271,000 $29,843 0.0
$576,685 3.0TOTAL BUDGET FUND $576,285 3.0 ($400) 0.01003
$576,685 3.0GRAND TOTAL ALL FUNDS $576,285 3.0 ($400) 0.0
239

RSCO & Choice
09/10 10/11
Adopted Difference
FY FY 10/11FY
Adopted
$ FTE $FTE$ FTE
BUDGET FUND 1003110 Certified Salaries $0 $44,978 0.3 $44,978 0.3
120 Non-Certified Salaries $150,220 2.0 $91,419 1.0 ($58,801) -1.0
$150,220 2.0Total Salaries $136,397 1.3 ($13,823) -0.7
900 Fringe Benefits $77,033 $58,220 ($18,813) 0.0
$77,033Total Benefits $58,220 ($18,813) 0.0
530 Communications $60,000 $65,000 $5,000 0.0
560 Tuition $5,600,000 $8,570,000 $2,970,000 0.0
611 Supplies & Materials $500 $500 $0 0.0
$5,660,500Total Operating Expenses $8,635,500 $2,975,000 0.0
$5,887,753 2.0TOTAL BUDGET FUND $8,830,117 1.3 $2,942,364 -0.71003
BUDGET FUND 2007110 Certified Salaries $0 $145,092 1.2 $145,092 1.2
120 Non-Certified Salaries $529,447 8.0 $367,845 6.0 ($161,602) -2.0
120 Part Time Non-Certified Salaries $4,000 $17,250 $13,250 0.0
$533,447 8.0Total Salaries $530,187 7.2 ($3,260) -0.8
900 Fringe Benefits $271,806 $224,336 ($47,471) 0.0
$271,806Total Benefits $224,336 ($47,471) 0.0
322 Instr. Impr. Services $10,500 $10,500 $0 0.0
330 Other Prof. Tech Svs/MHIS $57,542 $41,320 ($16,222) 0.0
430 Maintenance Contracts $0 $12,895 $12,895 0.0
530 Communications $78,000 $110,000 $32,000 0.0
580 Travel/Conferences & Seminars $2,000 $2,700 $700 0.0
611 Supplies & Materials $26,836 $36,462 $9,626 0.0
700 Equipment $4,500 $4,000 ($500) 0.0
899 Other Operating Exp. $8,000 $58,420 $50,420 0.0
$187,378Total Operating Expenses $276,297 $88,919 0.0
$992,631 8.0TOTAL BUDGET FUND $1,030,820 7.2 $38,188 -0.82007
$6,880,384 10.0GRAND TOTAL ALL FUNDS $9,860,936 8.5 $2,980,552 -1.5
240

Financial Management
09/10 10/11
Adopted Difference
FY FY 10/11FY
Adopted
$ FTE $FTE$ FTE
BUDGET FUND 1003120 Non-Certified Salaries $1,594,953 28.0 $1,731,765 27.5 $136,812 -0.5
120 Part Time Non-Certified Salaries $4,000 $9,000 $5,000 0.0
$1,598,953 28.0Total Salaries $1,740,765 27.5 $141,812 -0.5
900 Fringe Benefits $818,198 $836,611 $18,414 0.0
$818,198Total Benefits $836,611 $18,414 0.0
322 Instr. Impr. Services $6,000 $73,000 $67,000 0.0
330 Other Prof. Tech Svs/MHIS $726,153 $1,003,000 $276,847 0.0
430 Maintenance Contracts $12,500 $14,000 $1,500 0.0
530 Communications $16,000 $11,000 ($5,000) 0.0
560 Tuition $1,898,086 $1,550,000 ($348,086) 0.0
580 Travel/Conferences & Seminars $5,000 $4,000 ($1,000) 0.0
611 Supplies & Materials $22,000 $22,000 $0 0.0
700 Equipment $28,500 $20,000 ($8,500) 0.0
899 Other Operating Exp. $9,500 $10,000 $500 0.0
$2,723,739Total Operating Expenses $2,707,000 ($16,739) 0.0
$5,140,890 28.0TOTAL BUDGET FUND $5,284,376 27.5 $143,487 -0.51003
BUDGET FUND 2007899 Other Operating Exp. $9,491 $0 ($9,491) 0.0
$9,491Total Operating Expenses $0 ($9,491) 0.0
$9,491TOTAL BUDGET FUND $0 ($9,491)2007
$5,150,381 28.0GRAND TOTAL ALL FUNDS $5,284,376 27.5 $133,996 -0.5
241

Talent Office
09/10 10/11
Adopted Difference
FY FY 10/11FY
Adopted
$ FTE $FTE$ FTE
BUDGET FUND 1003110 Certified Salaries $134,160 1.0 $72,500 0.5 ($61,660) -0.5
120 Non-Certified Salaries $775,502 11.0 $848,096 12.0 $72,594 1.0
120 Part Time Non-Certified Salaries $43,000 $3,000 ($40,000) 0.0
$952,662 12.0Total Salaries $923,596 12.5 ($29,066) 0.5
900 Fringe Benefits $437,016 $432,320 ($4,696) 0.0
$437,016Total Benefits $432,320 ($4,696) 0.0
322 Instr. Impr. Services $4,200 $750 ($3,450) 0.0
330 Other Prof. Tech Svs/MHIS $175,050 $106,350 ($68,700) 0.0
430 Maintenance Contracts $2,994 $3,000 $6 0.0
530 Communications $55,000 $17,000 ($38,000) 0.0
580 Travel/Conferences & Seminars $10,000 $3,000 ($7,000) 0.0
611 Supplies & Materials $12,000 $3,000 ($9,000) 0.0
899 Other Operating Exp. $1,900 $500 ($1,400) 0.0
$261,144Total Operating Expenses $133,600 ($127,544) 0.0
900 Reimbursement/Benefits $16,000 $18,000 $2,000 0.0
$16,000Total Reimbursement/Benefits $18,000 $2,000 0.0
$1,666,822 12.0TOTAL BUDGET FUND $1,507,516 12.5 ($159,306) 0.51003
BUDGET FUND 2007110 Certified Salaries $0 0.0 $72,500 0.5 $72,500 0.5
110 Part Time Certified Salaries $0 $34,000 $34,000 0.0
120 Non-Certified Salaries $0 0.0 $189,436 2.0 $189,436 2.0
120 Part Time Non-Certified Salaries $0 $66,400 $66,400 0.0
$0 0.0Total Salaries $362,336 2.5 $362,336 2.5
900 Fringe Benefits $0 0.0 $119,235 $119,235 0.0
$0 0.0Total Benefits $119,235 $119,235 0.0
330 Other Prof. Tech Svs/MHIS $0 $43,080 $43,080 0.0
530 Communications $0 $60,000 $60,000 0.0
611 Supplies & Materials $0 $7,800 $7,800 0.0
899 Other Operating Exp. $264,005 $33,385 ($230,620) 0.0
$264,005Total Operating Expenses $144,265 ($119,740) 0.0
900 Reimbursement/Benefits $529,200 $530,000 $800 0.0
$529,200Total Reimbursement/Benefits $530,000 $800 0.0
$793,205 0.0TOTAL BUDGET FUND $1,155,836 2.5 $362,631 2.52007
$2,460,027 12.0GRAND TOTAL ALL FUNDS $2,663,351 15.0 $203,325 3.0
242

Labor & Legal Services
09/10 10/11
Adopted Difference
FY FY 10/11FY
Adopted
$ FTE $FTE$ FTE
BUDGET FUND 1003120 Non-Certified Salaries $266,409 4.0 $253,262 3.0 ($13,147) -1.0
120 Part Time Non-Certified Salaries $0 $45,000 $45,000 0.0
$266,409 4.0Total Salaries $298,262 3.0 $31,853 -1.0
900 Fringe Benefits $136,615 $125,692 ($10,922) 0.0
$136,615Total Benefits $125,692 ($10,922) 0.0
322 Instr. Impr. Services $3,000 $500 ($2,500) 0.0
330 Other Prof. Tech Svs/MHIS $0 $125,000 $125,000 0.0
430 Maintenance Contracts $0 $2,500 $2,500 0.0
530 Communications $0 $7,000 $7,000 0.0
580 Travel/Conferences & Seminars $0 $2,700 $2,700 0.0
611 Supplies & Materials $0 $4,500 $4,500 0.0
899 Other Operating Exp. $300,000 $300,800 $800 0.0
$303,000Total Operating Expenses $443,000 $140,000 0.0
$706,024 4.0TOTAL BUDGET FUND $866,954 3.0 $160,931 -1.01003
BUDGET FUND 2007110 Certified Salaries $0 $125,000 1.0 $125,000 1.0
$0Total Salaries $125,000 1.0 $125,000 1.0
900 Fringe Benefits $0 $39,163 $39,163 0.0
$0Total Benefits $39,163 $39,163 0.0
322 Instr. Impr. Services $0 $5,000 $5,000 0.0
700 Equipment $0 $5,000 $5,000 0.0
$0Total Operating Expenses $10,000 $10,000 0.0
$0TOTAL BUDGET FUND $174,163 1.0 $174,1632007
$706,024 4.0GRAND TOTAL ALL FUNDS $1,041,117 4.0 $335,093 0.0
243

Board of Education Office
09/10 10/11
Adopted Difference
FY FY 10/11FY
Adopted
$ FTE $FTE$ FTE
BUDGET FUND 1003110 Certified Salaries $20,000 0.0 ($20,000) 0.0
110 Part Time Certified Salaries $0 $25,000 $25,000 0.0
120 Non-Certified Salaries $58,350 1.0 $60,101 1.0 $1,751 0.0
120 Part Time Non-Certified Salaries $23,503 $16,200 ($7,303) 0.0
$101,853 1.0Total Salaries $101,301 1.0 ($552) 0.0
900 Fringe Benefits $37,094 $30,323 ($6,771) 0.0
$37,094Total Benefits $30,323 ($6,771) 0.0
322 Instr. Impr. Services $3,000 $2,000 ($1,000) 0.0
330 Other Prof. Tech Svs/MHIS $15,000 $12,000 ($3,000) 0.0
530 Communications $1,100 $1,100 $0 0.0
611 Supplies & Materials $4,800 $4,000 ($800) 0.0
700 Equipment $0 $2,500 $2,500 0.0
899 Other Operating Exp. $17,990 $183,224 $165,234 0.0
$41,890Total Operating Expenses $204,824 $162,934 0.0
$180,837 1.0TOTAL BUDGET FUND $336,448 1.0 $155,611 0.01003
BUDGET FUND 2007330 Other Prof. Tech Svs/MHIS $0 $200,000 $200,000 0.0
$0Total Operating Expenses $200,000 $200,000 0.0
$0TOTAL BUDGET FUND $200,000 $200,0002007
$180,837 1.0GRAND TOTAL ALL FUNDS $536,448 1.0 $355,611 0.0
244

Sundry-Central Services
$ FTE $ FTE $ FTE
110 Part-Time Certified Salaries 1,900,000$ (1,900,000)$
120 Part-time Non-Certified Salaries 600,000$ (600,000)$
Total Salaries 2,500,000$ (2,500,000)$
899 Other Operating Exp. 246,872$ (246,872)$
Total Operating Expenses 246,872$ (246,872)$
900 Reimbursement/Benefits 2,000,000$ (2,000,000)$
Total Reimbursement/Benefits 2,000,000$ (2,000,000)$
TOTAL BUDGET FUND 1003 4,746,872$ (4,746,872)$
Difference
FY 10/11
BUDGET FUND 1003
Adopted
FY 09/10
Adopted
FY 10/11
999 Indirect 519,624$ 659,637$ 140,013$
Total Operating Expenses 519,624$ 659,637$ 140,013$
TOTAL BUDGET FUND 2007 519,624$ 659,637$ 140,013$
GRAND TOTAL ALL FUNDS 5,266,496$ 659,637$ (4,606,859)$
BUDGET FUND 2007
245

School-Based Clinics
09/10 10/11
Adopted Difference
FY FY 10/11FY
Adopted
$ FTE $FTE$ FTE
BUDGET FUND 2007120 Non-Certified Salaries $428,748 8.0 $436,023 8.0 $7,275 0.0
$428,748 8.0Total Salaries $436,023 8.0 $7,275 0.0
900 Fringe Benefits $219,862 $210,468 ($9,394) 0.0
$219,862Total Benefits $210,468 ($9,394) 0.0
999 Indirect $14,336 $16,455 $2,119 0.0
$14,336Total Operating Expenses $16,455 $2,119 0.0
$662,946 8.0TOTAL BUDGET FUND $662,946 8.0 $0 0.02007
$662,946 8.0GRAND TOTAL ALL FUNDS $662,946 8.0 $0 0.0
246

School-Based Clinics
Certified Staff Enrollment Non-Certified Staff
STAFFING and ENROLLMENT
Adopted Proposed Actual Projected Adopted Proposed
09/10 10/11 09/10 10/11 09/10 10/11
Principals Clerical Support 2.0 2.0
Pre-K
Associate/Assistant Principal Paraprofessionals
K Classroom
Dean Special Education
Teachers 1st Other - Special Educ
Pre-K
Regular 2nd Kindergarten
Associate Teacher Other Para
Art 3rd
Business Prev/Interv Staff
Reading 4th
Foreign Language CDA
Health 5th
Tech Comp Educ Family Resource Aides
Math 6th
Music School and Family Support
Science 7th
Social Studies Nurse 3.0 3.0
English 8th
Physical Education Custodial Staff
Special Education 9th
Pre-K Security
Kindergarten 10th
Bilingual Gym & Pool Asst
TESOL/ELL 11th
Speech M&C Journeyman
Library Media 12th
Coach Tech Support
Other
Other 3.0 3.0
Social Workers
Guidance Counselors
8.0 8.0Total Total Total
Adopted Proposed
Staffing Total 8.0 8.0
247