
Adolescent body composition, and associations with body ...
43
Adolescent body composition, and associations with body size and growth from birth to late adolescence. The Tromsø Study: Fit Futures – a Norwegian longitudinal cohort study. Elin Evensen 1, 2 , Nina Emaus 2 , Anne-Sofie Furberg 3, 4 , Ane Kokkvoll 5 , Jonathan Wells 6 , Tom Wilsgaard 3, 1 , Anne Winther 7 , Guri Skeie 3 1 Department of Clinical Research, University Hospital of North Norway, Tromsø, Norway 2 Department of Health and Care Sciences, Faculty of Health Sciences, UiT The Arctic University of Norway, Tromsø, Norway 3 Department of Community Medicine, Faculty of Health Sciences, UiT The Arctic University of Norway, Tromsø, Norway 4 Department of Microbiology and Infection Control, University Hospital of North Norway, Tromsø, Norway 5 Department of Paediatrics, Finnmark Hospital Trust, Hammerfest, Norway 6 Childhood Nutrition Research Centre, UCL Great Ormond Street, Institute of Child Health, London, UK 7 Division of Neurosciences, Orthopedics and Rehabilitation Services, University Hospital of North Norway, Tromsø, Norway Running head: Childhood growth and adolescent body composition KEYWORDS: BODY COMPOSITION, FAT MASS INDEX, DUAL-ENERGY X-RAY ABSORPTIOMETRY, BIRTH WEIGHT, CHILDREN, ADOLESCENTS
Transcript of Adolescent body composition, and associations with body ...

Adolescent body composition, and associations with body size and growth from birth to late
adolescence. The Tromsø Study: Fit Futures – a Norwegian longitudinal cohort study.
Elin Evensen1, 2, Nina Emaus2, Anne-Sofie Furberg3, 4, Ane Kokkvoll5, Jonathan Wells6, Tom
Wilsgaard3, 1, Anne Winther7, Guri Skeie3
1 Department of Clinical Research, University Hospital of North Norway, Tromsø, Norway
2 Department of Health and Care Sciences, Faculty of Health Sciences, UiT The Arctic
University of Norway, Tromsø, Norway
3 Department of Community Medicine, Faculty of Health Sciences, UiT The Arctic
University of Norway, Tromsø, Norway
4 Department of Microbiology and Infection Control, University Hospital of North Norway,
Tromsø, Norway
5 Department of Paediatrics, Finnmark Hospital Trust, Hammerfest, Norway
6 Childhood Nutrition Research Centre, UCL Great Ormond Street, Institute of Child Health,
London, UK
7 Division of Neurosciences, Orthopedics and Rehabilitation Services, University Hospital of
North Norway, Tromsø, Norway
Running head: Childhood growth and adolescent body composition
KEYWORDS:
BODY COMPOSITION, FAT MASS INDEX, DUAL-ENERGY X-RAY
ABSORPTIOMETRY, BIRTH WEIGHT, CHILDREN, ADOLESCENTS

Corresponding author:
Elin Kristin Evensen
Department of Clinical Research, Post box 78, University Hospital of North Norway
N-9038 Tromsø, Norway
[email protected] mobile phone +47 95 92 23 13
ORCID: 0000-0002-5962-6695

ABSTRACT
Background: Fat- and fat-free masses and fat distribution are related to cardio-metabolic risk.
Objectives: To explore how birth weight, childhood body mass index (BMI) and BMI gain
were related to adolescent body composition and central obesity.
Methods: In a population-based longitudinal study, body composition was measured by dual-
energy X-ray absorptiometry in 907 Norwegian adolescents (48% girls). Associations
between birth weight, BMI-categories, and BMI gain were evaluated by fitting linear mixed
models, and conditional growth models with fat mass index (FMI, kg/m2), fat-free mass index
(FFMI, kg/m2) standard deviation scores (SDS), central obesity at 15-20 years, and change in
FMI SDS and FFMI SDS between ages 15-17 and 18-20 as outcomes.
Results: Birth weight was associated with FFMI in adolescence. Greater BMI gain in
childhood, conditioned on prior body size, was associated with higher FMI, FFMI and central
overweight/obesity with the strongest associations seen at age 6-16.5 years: FMI SDS: β=0.67
(95% confidence interval: 0.63, 0.71), FFMI SDS: 0.46 (0.39, 0.52), in girls, FMI SDS: 0.80
(0.75, 0.86), FFMI SDS: 0.49 (0.43, 0.55), in boys.
Conclusions: Compared to birth and early childhood, high BMI and greater BMI gain at later
ages, are strong predictors of higher fat mass and central overweight/obesity at 15-20 years of
age.

1
ABBREVIATIONS:
BMI, body mass index; FMI, fat mass index; FFMI, fat-free mass index; SDS, standard
deviation scores; CVD, cardiovascular disease; DXA, dual-energy X-ray absorptiometry;
TFF1, The Tromsø Study, Fit Futures 1; TFF2, The Tromsø Study, Fit Futures 2; GA,
gestational age; SGA, small for gestational age; LGA, large for gestational age; MBRN, the
Medical Birth Registry of Norway; WC, waist circumference; FM, fat mass; FFM, fat-free
mass; FMR, fat mass ratio; IOTF, the International Obesity Task Force; PDS, pubertal
development scale; WHO, World Health Organization; SD, standard deviation; GEE,
generalized estimating equations; OR, odds ratio; CI, confidence interval; rs, Spearman’s rank
correlation coefficient; 4C, 4-component model.

2
INTRODUCTION
Childhood and adolescent obesity is associated with increased risk of adult morbidity,
especially cardiovascular disease (CVD) and diabetes type 2 (1-4). Prolonged duration of
obesity is also a strong predictor of CVD and diabetes (5, 6). A moderate degree of tracking
(maintenance of certain risk factors over time) of overweight and obesity from childhood to
adolescence and adulthood has been reported (3, 7). Body mass index (BMI, kg/m2) is a
common measure of overweight and obesity (3). However, childhood BMI might not
accurately predict adverse levels of adiposity (3, 8), and children with the same BMI may
have very different fat- and fat-free mass distribution (9).
Body composition measurements e.g. by dual-energy X-ray absorptiometry (DXA), provide
supplementary information regarding fat-, lean-, fat-free mass, and fat distribution (10). Such
body composition indices, as well as waist circumference and other measures of central
obesity, are regarded as better measures of cardio-metabolic risk than BMI (11-13), and have
been linked to clustered CVD risk factors in European adolescents (14).
Birth weight is used as a proxy for intra-uterine and maternal nutrition, and may indicate
maternal, and environmental factors affecting foetal growth. Birth weight is consistently
positively associated with subsequent lean mass (9, 15-19), but associations with subsequent
fat mass, and central obesity are less clear (9, 15, 16, 20-22). Early postnatal growth,
compared to childhood growth, may influence body composition later in life differently;
weight or BMI gain later in childhood has been more strongly linked to adiposity measures (9,
16-18, 21-25). However, previous findings are not consistent, and few larger studies have
investigated associations between childhood growth and DXA measures of body composition
in adolescence or adulthood (16, 25). The International Diabetes Federation has requested

3
more research into early growth, body composition and fat distribution among children and
adolescents (13).
Current treatment results for obesity in adolescents are moderate, especially for those with
severe obesity (26). Early identification of children at risk is important, as preventing or
delaying onset of obesity may influence future health (5, 6, 13). To identify if there are
critical periods of growth during childhood and adolescence, we need more research into the
relation between birth weight, childhood BMI gain, and body composition later in life (13,
27).
In this study, we present population-based body composition measures obtained by DXA in
Norwegian boys and girls at 15-17 and 18-20 years of age. The aim of the study was to
explore: i) how birth weight, childhood BMI and BMI gain were related to body composition
measures and central obesity in late adolescence, and ii) if childhood BMI gain was related to
changes in body composition in the transition to young adulthood.
METHODS
Study sample
The Tromsø Study: Fit Futures, a population-based prospective cohort study has been
described previously (28). The cohort consists of adolescents from the Tromsø region,
Northern Norway. Fit Futures 1 (TFF1) was conducted in 2010-2011 and 961 (92.9%)
participants were in the core age group of 15-17 years (born 1992-1994). A follow-up study,
Fit Futures 2 (TFF2), was conducted in 2012-2013 and re-invited all participants from TFF1.
Trained study nurses at the Clinical Research Unit, University Hospital of North Norway,
performed data collection, following standardized procedures. For this study, anthropometric

4
data from birth and childhood was retrospectively collected. Each participant’s unique
personal identification number was used to link to the Medical Birth Registry of Norway
(MBRN) and childhood health records. A sample of 907 girls and boys were eligible for
analysis in the present study (Figure 1).
The Regional Committee for Medical and Health Research Ethics, North Norway approved
TFF1, TFF2 and the present study (Reference number: 2014/1397). All students, and
parents/guardians of students younger than 16 years of age, gave written informed consent.
Anthropometric data
Information on birth weight (g), length (cm), gestational age (GA; weeks) was obtained from
MBRN. GA was determined by ultrasound examination, or last menstrual period if ultrasound
was missing. We calculated ponderal index (birth weight/birth length3; kg/m3). Growth status
at birth was categorised as small for gestational age (SGA; <10th percentile), appropriate for
gestational age and large for gestational age (LGA; >90th percentile) based on birth weight
and GA, according to a national reference standard of births in 1987-1998 (29).
Anthropometric measurements are part of regular health controls by public health nurses in
accordance with national preventive health programme guidelines. We retrospectively
collected height (cm), weight (kg), age (years, months), and date of measurements at target
ages; 2 and 6 years, from childhood health records for children living in Tromsø and the
neighbouring municipalities during childhood. The exact age of the participants at the time
measurements were taken varied slightly; median ages: 2.5 (range: 1.9-4.5) and 6.0 years
(range: 5.0-7.7).

5
In TFF1 and TFF2, height and weight were measured to the nearest 0.1 cm and 0.1 kg,
respectively, on an automatic electronic scale/stadiometer (Jenix DS 102 stadiometer, Dong
Sahn Jenix, Seoul, Korea). Participants wore light clothing and no footwear. Waist
circumference (WC) was measured to the nearest cm with a measuring tape placed
horizontally at umbilical level and at the end of a normal expiration. Subjects were standing
with arms relaxed at sides and weight evenly distributed across feet. WC was measured twice
and the mean value was used in the analyses. A WC ≥80 cm for girls and ≥94 cm for boys
was used to define central overweight/obesity (13). Age at outcome measures in TFF1 and
TFF2 are denoted 15-17 (median age: 16.6 range: 15.7-17.9 years), and 18-20 (median age:
18.6 range: 17.8-20.1 years) years of age, respectively or combined as 15-20 years of age.
Total body DXA scans were performed in TFF1 and TFF2 with the same DXA instrument, a
GE Lunar prodigy (Lunar Corporation, Madison, Wisconsin, USA). Reported precision
(Coefficient of variation) of the Lunar Prodigy instrument was <2.0% for total body measures
(30). Lean mass, fat mass (FM), and bone mineral content were assessed and analysed with
enCORE paediatric software version 13.4. Fat-free mass (20) was calculated as body weight
minus FM. Fat mass index (FMI; FM in kg/ height in m2), and fat-free mass index (FFMI;
FFM in kg/ height in m2) were calculated (10). Android:gynoid fat mass ratio (FMR; android
FM (g) divided by gynoid FM (g)), a measure of abdominal fat, was also derived (16). Sex
and age specific FMI and FFMI standard deviation scores (SDS) were calculated according to
a UK reference standard (10). Change in FMI SDS and FFMI SDS between age 15-17 and
18-20 years was calculated as the individual FMI SDS/FFMI SDS at the latter age minus FMI
SDS/FFMI SDS at the first age.
6
Height and weight were used to calculate BMI (weight/height2; kg/m2) at each age. BMI SDS
was calculated according to the Norwegian reference standard (31). Participants were
classified into BMI categories using the International Obesity Task Force (IOTF) age- and
sex-specific cut-off values for children 2-18 years of age (32). Due to a relatively small
proportion of participants with obesity, it was not possible to analyse obesity alone.
Therefore, in the main analysis BMI was dichotomised as normal weight (adult BMI <25
kg/m2) and overweight/obesity (adult BMI ≥25 kg/m2). In addition, we used the following
four categories; underweight (corresponding to adult BMI <18.5 kg/m2), normal-weight (adult
BMI ≥18.5-<25kg/m2), light overweight (adult BMI ≥25-<27 kg/m2) and severe
overweight/obesity (adult BMI ≥27 kg/m2). For comparison, prevalence rates according to the
WHO Child Growth Standards and Growth reference 5-19 years are presented (33, 34).
Covariates from TFF1
Girls were categorised into three stages of pubertal maturation: early (<12.5 years),
intermediate (12.5-13.9 years) and late (≥14.0 years), based on age at menarche reported in
self-administered questionnaires. Pubertal maturation in boys was classified as barely started
(PDS: 2.0-2.9), underway (PDS: 3.0-3.9), and completed (PDS: 4.0), based on the pubertal
development scale (PDS), a validated self-reported measure. The boys rated four secondary
sexual characteristics on a scale ranging from 1 (not yet started) to 4 (complete) and the PDS-
score was calculated as a total mean score of the four items (28, 35). None had a score <2.0 in
total score.
Physical activity frequency was measured through the validated WHO Health Behaviour in
Schoolchildren questionnaire (36), which included the question: “If you are actively doing
sports or physical activity outside school, how many days a week are you active?” Answers

7
were given in six predefined categories; “never” (1), “less than once a week” (2), “1 day a
week” (3), “2 to 3 days a week” (4), “4 to 6 days a week” (5), and “almost every day” (6).
The answers were recoded into three categories of physical activity: “low” (1-2), “moderate”
(3-4), and “high” (5-6).
Statistical analyses
Sex specific characteristics of the study population are presented as means and standard
deviations (SD) for continuous variables and numbers and percentages for categorical
variables. Correlations between body composition and anthropometric measurements were
explored by Spearman’s rank correlation coefficient (rs).
Since age at childhood measurements varied, we used linear spline multilevel models fitted by
Stata’s mixed command to estimate individual growth trajectories (37). “The broken stick
model” (37, 38) uses data from individuals and from the whole study population to estimate
person-specific length/height (cm) and weight (kg) with knots at target (median) ages: 2.5, 6.0
and 16.5 years, and individual growth trajectories between birth and age 2.5, and consecutive
ages. Individual-level random effects for intercept and slopes are estimated as each person’s
deviation from the average trajectory (37). Sex and an interaction term with sex and splines
were included in the model to account for sex-differences in growth trajectories over time. In
a two-step process, birth length, birth weight, height and weight at target ages were estimated
by the model and used to calculate BMI variables.
The main outcomes in the present study were FMI SDS, FFMI SDS, android:gynoid FMR,
and changes in FMI SDS/FFMI SDS between 15-17 and 18-20 years of age. In addition, FMI
SDS and WC dichotomized, using the thresholds described above, were used as outcomes.

8
Exposure variables in the main analyses were birth weight per 1 SD, growth status at birth;
being born small, appropriate or large for GA, in addition to BMI category at 2.5, 6.0 and
16.5 years of age. We used linear mixed models with a random intercept on the subject level
to explore associations between exposure variables and repeated measures of FMI SDS, FFMI
SDS, and android:gynoid FMR at 15-17 and 18-20 years of age, as continuous outcomes. In
addition, generalized estimating equations (GEE) with a logit link function and an
unstructured correlation matrix were used in the analysis of binary outcome variables. We
explored the odds (ORs) of having central overweight/obesity (WC dichotomized), or a FMI
SDS ≥ 1.0 (vs. not) at 15-20 years of age related to the exposure variables.
We used conditional growth modelling (39) to assess BMI gain between birth and age 2.5,
and consecutive ages. In conditional growth models, growth measures are adjusted for prior
body size. Accordingly, standardized residuals were obtained by multiple linear regression
analyses of BMI SDS at all target ages regressed on prior BMI SDS (39). These residuals
were used simultaneously in a linear mixed model with the outcomes. This index of growth is
statistically independent of body size at the start of each growth period, and adjusts for both
catch-up growth, and regression to the mean. This approach asks a prospective question; for
each child, is he/she growing more than expected, given his or her size at the start of the
growth period and how is this growth associated with the outcome measure.
In a subgroup analysis of those with body composition measures both from TFF1 and TFF2,
we used conditional growth modelling to explore the relationship with change in FMI SDS
and FFMI SDS.

9
Since body composition differs between girls and boys and according to pubertal maturation
(40), all analyses were stratified by sex. Cross-product terms with sex and exposure variables
were used to test for potential sex interactions. Models were adjusted for potential
confounding factors; birth weight was adjusted for GA, associations between BMI at age 2.5
and 6.0 were adjusted for height at the same ages, BMI at age 16.5 was additionally adjusted
for height, pubertal maturation and physical activity levels. Conditional growth models were
adjusted for GA, pubertal maturation and physical activity levels.
Normality and linearity of exposures and outcome variables and residuals were checked by
visual inspections of histograms and plots. No assumptions were considered violated for the
final models applied.
We experienced missing data; height and weight from childhood health records, covariates
from MBRN or from questionnaires in TFF1. The percentages (numbers) of missing values
were; 10% (91) for GA, 4% (40) for birth length, 27% (244), and 22% (196) for height and
weight at 2.5 and 6.0 years, respectively. In TFF1, 1% (11) was missing data on physical
activity. Of the boys 22% (102) were missing PDS, of the girls 1% (6) were missing
menarche age (Figure 1). To minimize selection bias, missing values were estimated/imputed
under the assumption of missing at random. Linear spline multilevel models were used to
estimate missing birth length, height and weight at age 2.5 and 6.0. Multiple imputation was
used to impute missing GA and covariates from TFF1 based on exposure and outcome
variables. We used chained equations, generating 20 imputations and we report pooled
estimates (41). Separate imputations were performed for boys and girls. In sensitivity
analyses, the main analyses were repeated in a complete cases dataset (n=633). Differences

10
between participants with and without missing data were explored by t-test for continuous
variables and by the !"test for categorical variables.
All procedures were performed in Stata/MP 15.1 for Mac (Stata Corp, College Station, TX,
USA). Statistical significance level was set to a two-sided p-value of 5%.
RESULTS
We analysed data from 439 girls and 468 boys, 94% of the core age group <18 years of age in
TFF1. Of these, 68.5% (336 girls and 285 boys) had body composition measures from both
TFF1 and TFF2 (Figure 1), and were used in the subgroup analysis.
Body composition and overweight/obesity
Characteristics of the study population from birth up to 18-20 years of age are presented in
Table 1. The vast majority (99%) was of white ethnicity. Additional detailed descriptive body
composition measures per sex and age are provided in Table S1.
According to the IOTF definition, the prevalence of overweight including obesity was 9.1%
and 15.0% in girls, 6.4% and 8.6% in boys at 2.5 and 6.0 years of age, respectively. At 15-17
and 18-20 years of age, 20.8% and 21.4% of girls, and 23.4% and 28.0% of boys were
overweight/obese (Table 1). Comparisons with the WHO definitions are presented in Table
S2.
The proportion with a FMI SDS ≥1.0 was 19% and 17% in girls, 25% and 15% in boys at 15-
17 and 18-20 years of age, respectively. The proportion classified with central
overweight/obesity was 32.0% among girls, 13.5% among boys at 15-17 years of age (Table

11
1). There were significant positive correlations between WC and DXA measured truncal FM,
girls: (rs= 0.830, n=439, rs= 0.770, n=336), boys: (rs= 0.854, n=468, rs= 0.879, n=285) at 15-
17 and 18-20 years of age, respectively. Positive correlations were also seen between
android:gynoid FMR and truncal FM, girls: (rs= 0.804, n=439, rs=0.792, n=336), boys:
(rs=0.718, n=468, rs=0.689, n=285) at 15-17 and 18-20 years of age, respectively. All
correlation coefficients p <0.001.
Birth weight, body composition and central overweight/obesity
In both sexes, birth weight was positively associated (p<0.01) with FFMI SDS at 15-20 years
of age (Table 2). The estimates are equivalent to 1.9 kg FFM in girls and 2.2 kg FFM in boys
at age 15-20 per 1 SD (590 g) increase in birth weight. Birth weight was significantly
associated with higher FMI SDS at age 15-20 only in girls: 0.19 SDS (95% CI, 0.08 to 0.31,
p<0.01). To remove a possible effect of length at birth, we analysed ponderal index and the
estimated coefficients were similar as for birth weight (Table 2). There was no statistically
significant association between birth weight and android:gynoid FMR (Table 2). Birth weight
was significantly associated with height at 15-20 years of age in both sexes (girls: 2.5 cm,
boys: 2.2 cm, p<0.001) per 1 SD higher birth weight (data not shown). Being born SGA was
associated with lower FMI SDS and FFMI SDS, however only significant in girls (p<0.05)
(Table 2). In girls, 1 SD higher birth weight was associated with a significantly increased
odds of central overweight/obesity (OR 1.32, 95% CI 1.06 to 1.64) and a FMI SDS ≥1.0 (OR
1.38, 95% CI 1.05 to 1.81) whereas being born SGA revealed significantly reduced odds of
central overweight/obesity (OR 0.50, 95% CI 0.26 to 0.99). In boys, being born SGA was
associated with significantly reduced odds of a FMI SDS ≥1.0 (OR 0.44, 95% CI 0.21 to
0.92) (Table 3).

12
BMI gain and body composition
Associations of individually modelled growth (i.e. conditional changes in BMI SDS between
birth, age 2.5 years and consecutive ages) with body composition measures at 15-20 years of
age are shown in Figure 2 (Table S3). Childhood BMI gain was significantly positively
associated with FMI SDS, FFMI SDS and android:gynoid FMR at 15-20 years of age
(p<0.001). The magnitude of the associations increased with age. The observed effect of
increasing BMI from birth to 2.5 years of age was similar for FMI- and FFMI SDS. Greater
BMI gain at later ages had a stronger impact on FMI SDS than on FFMI SDS with the highest
estimates for growth between ages 6.0-16.5 years (Figure 2).
BMI gain and changes in FMI and FFMI SDS
On average, in both boys and girls, a small positive increase in FMI SDS was seen between
TFF1 and TFF2 (Table 4). There was a significant positive correlation between FMI SDS at
the two time points; girls: (rs = 0.796 n= 336 p<0.001), boys: (rs = 0.845 n= 285 p<0.001).
Greater BMI gain in early childhood was not a significant predictor of increase in FMI-, or
FFMI SDS between 15-17 and 18-20 years of age (Table 4). In both girls and boys, greater
BMI gain between ages 6.0-16.5 years was associated with a weak, but significant decrease in
FMI SDS but no significant change in FFMI SDS (Table 4). These findings were confirmed if
change in absolute values of FMI and FFMI were used as outcome instead of the SDS (data
not shown).
BMI categories, body composition and central overweight/obesity
In girls, overweight/obesity at 2.5 or at 6.0 years of age was associated with a significantly
higher FMI SDS and FFMI SDS, compared to being under-/normal weight at the same ages
(Table 2). The magnitude of the associations was similar. In boys, overweight/obesity at 2.5

13
years of age was significantly positively associated with FFMI SDS at 15-20 years of age.
Overweight/obesity at 6.0 years of age was associated with significantly higher FMI SDS and
FFMI SDS compared to being under-/normal weight, and the indices were estimated to give
similar effects. At age 16.5 years, stronger associations were seen with FMI SDS than FFMI
SDS for those with overweight/obesity, compared to those of normal weight. Stronger
estimated effects were seen with higher BMI, in both sexes. Compared to normal weight,
severe overweight/obesity at age 16.5 corresponded to an average of 21.3 kg increased FM in
girls, and 22.3 kg increased FM in boys. Furthermore, in both sexes, overweight/obesity both
at 6.0 and 16.5 years of age was significantly associated with an increased android:gynoid
FMR at 15-20 years of age (Table 2). No such association was seen with overweight/obesity
at 2.5 years of age. Underweight was consistently associated with significantly lower FMI
SDS and FFMI SDS at all ages (data shown only for 16.5 years). In addition,
overweight/obesity at 6.0 and 16.5 years of age was associated with significantly increased
odds of central overweight/obesity and a FMI SDS ≥1.0 compared to those of normal weight,
in both girls and boys (Table 3).
Sensitivity and dropout analyses
Sensitivity analyses showed no significant differences in body composition measures
compared to cases with missing birth weight and/or childhood measurements. Sensitivity
analyses produced results similar to those presented, except that birth weight in girls no
longer was significantly associated with FMI SDS (data not shown). Dropout analyses
(n=907) showed that significantly more boys (39.1%) than girls (23.5%) were either lost to
follow-up or were missing body composition measures in TFF2 (p<0.001). No significant
difference in birth weight or childhood BMI was seen between those with body composition
measures from TFF2 and those with missing values. However, girls who were missing in

14
TFF2 had significantly higher FMI, FMI SDS, mean waist and android:gynoid FMR in TFF1
than those with data also from TFF2 (p<0.05). Boys who were missing in TFF2 did not differ
from those with complete data except for significantly (p<0.01) higher android:gynoid FMR
in TFF1 (data not shown). Additional information on observed and estimated/imputed values
and sensitivity analyses are provided in Table S4, S5 and S6.
DISCUSSION
In this longitudinal population-based study with repeated DXA derived body composition
measures in adolescence, we found a weak significant association between birth weight and
FFMI SDS at 15-20 years of age in both sexes, and with FMI SDS only in girls. We did not
find any indications that low birth weight was associated with adverse levels of FM or central
obesity. BMI gain in each age interval from birth and up to 16.5 years of age was associated
with higher FMI-, FFMI SDS, and android:gynoid FMR, with the strongest associations seen
for the age period 6-16.5 years. While increasing BMI in early childhood was more equally
associated with both FFMI- and FMI SDS, increasing BMI later in childhood was more
strongly related to FMI SDS. However, a greater BMI gain in childhood was not associated
with a continued rise in FMI between 15-17 and 18-20 years of age. In both sexes,
overweight/obesity at 6.0 and 16.5 years of age was associated with significantly higher odds
of both central overweight/obesity and a FMI SDS ≥1.0, compared to being under-/normal
weight.
We compared our DXA derived body composition data with British reference data (collected
2001-2010) (10) due to lack of such reference data for Norwegian adolescents. DXA
reference data for FFMI and FMI were derived from the British database, which correlate
strongly (r >0.93 in both sexes) with equivalent FFMI and FMI SDS obtained from the gold

15
standard 4-component (4C) model in the same sample (10). Overall, our study population was
similar to the British reference population (10), as shown in table 1. Compared to Swedish
normative data, (42) our adolescents had higher weight, BMI and FM at all ages between 15-
19 years. The Swedish data (42) were collected 10-20 years before our study. This may
explain some of the differences, as the prevalence of overweight/obesity has increased in
recent decades (43). Variation between DXA scanners may also influence the measures (30,
42). Our cohort represents a Norwegian adolescent population, however with a restriction
since the prevalence of overweight/obesity, and BMI SDS at 16.5 years of age was somewhat
higher than reported from other regions of Norway (31, 44), and since the participants were of
mainly white ethnicity.
Birth weight, body composition and central overweight/obesity
In accordance with others (9, 15-19, 21, 22), we found an association between higher birth
weight and FFMI later in life. Associations between higher birth weight and FMI have been
less consistent (9), and we observed a positive association with FMI only in girls. However,
no statistically significant interaction with sex was seen. In girls, birth weight was also
associated with increased odds of a WC ≥80 cm, but there was no relation with
android:gynoid FMR. Also Sachdev et al., found associations between birth weight and
adiposity only in girls (17). In both sexes, there was a positive association between birth
weight and height at 15-20 years of age. Previous findings of significant associations between
birth weight and overweight/obesity measured by BMI (7, 27), might therefore reflect a larger
body size, not necessarily adiposity. Associations between birth weight and later body
composition are partly explained by genetic factors. In a review of twin studies, heritability of
BMI was found to be high, from 60-80% across ages while the influence of environmental
factors increased with age, up to 40% (45). Low birth weight, or preterm birth has been linked

16
to central obesity (9, 15, 20). We could not confirm an association between low birth weight
and later adverse levels of FMI or central obesity, results in line with findings from a Dutch
study of preterm infants (18).
BMI gain and body composition
Conditional BMI gain between ages 2.5-6.0, and 6.0-16.5 years, was strongly associated with
both higher FMI SDS and FFMI SDS at 15-20 years of age, with the highest estimates seen
for FMI SDS in the latter age interval. Overweight/obesity at the ages 6.0 and 16.5 years
reflected similar patterns. BMI gain in early childhood, before 2.5 years of age, indicated a
stronger association with FFMI, or a more equal association with FMI and FFMI, in line with
another study (46). Greater BMI gain after age 6.0 years, was more strongly associated with
higher FM in adolescence. This suggests that centile crossing is more “obesogenic” at later
ages, also observed by others (16, 17, 23, 24). Others have found that BMI changes between
2-6 years of age were most strongly associated with FM at age 15 (25), or adult overweight
(47). Barker et al. (48), linked rapid BMI gain between 2 and 11 years with CVD risk. A
recently published study showed that upward BMI centile crossing between 7 years of age
and early adulthood was associated with an increased risk of type 2 diabetes. However,
overweight at 7 years of age was associated with an increased risk of type 2 diabetes only if it
persisted until puberty or later ages (4). Early identification of children at risk, especially
those with a rapid increase in BMI around the age of six, may therefore be possible and of
importance. However, later childhood and adolescence emerge as an important period for
development of overweight or obesity (47), and are therefore of equal importance as target
for preventive efforts. Different influential factors may be of importance in different age
groups. As reported by Nan et al. (45), the influence of unique environmental factors on BMI
increased with age.

17
BMI gain and changes in FMI SDS
We found no indication that greater BMI gain in childhood was associated with a continued
rise in adiposity between 15-17 and 18-20 years of age. A weak decline in FMI SDS was
observed, which may indicate that body composition measures are stabilising in the transition
to young adulthood. It should be noted that these analyses were performed in a subgroup of
the study population and the possibility of selection bias cannot be ruled out.
Central overweight/obesity
A concern is related to the relatively large proportion (32.0%) of girls with a WC ≥80 cm at
15-17 years of age, since there is a link between central obesity and disease risk (6, 13). A
WC threshold of 80.9 cm in girls and 83.5 cm in boys was moderate to highly accurately
associated with an unhealthier clustered CVD risk in European adolescents (14). In line with
findings from the GOOD study from Sweden (23), we observed a strong association between
greater BMI gain between 6.0 and 16.5 years of age and central overweight/obesity measures
at 15-20 years of age. The observed gender difference in central overweight/obesity may, at
least partly, be related to accuracy of the reference (13). Stronger correlation between WC and
truncal fat mass was observed among boys. More boys than girls were classified as
overweight/obese based on BMI both according to the IOTF and the WHO reference.
However, considerably higher prevalence of central obesity in girls has recently been reported
from another Norwegian youth cohort (49). This should be a subject of further investigation.
Strengths and limitations
The main strengths of this study are its large, population-based design and access to
longitudinal data from birth to 18-20 years of age. The high attendance rate in TFF1 and the

18
population-based design reduce the risk of selection bias. Body composition was measured
with DXA, which has shown very good agreement with 4C models (10), and CT measures of
visceral adipose tissue (50). Data from MBRN and objectively measured height and weight
data from childhood and from the Fit Futures study reduce the risk of information bias.
Longitudinal data from birth and childhood with repeated body composition measures, at the
end of height growth, on the cusp of adulthood, is rare and a strength of this study. The main
limitation is missing data. Despite >90% participation rate in TFF1 this introduces a risk of
selection bias. However, sensitivity analyses showed that missing data from birth and/or
childhood were not related to the outcome. While more boys than girls did not attend TFF2,
dropout analyses showed higher levels of FMI and central obesity measures in girls who did
not attend TFF2. We used linear spline multilevel modelling (37), and multiple imputation
(41), to handle missing data. These are recommended methods to deal with challenges as we
experienced; when data are not measured at the same point in time, data are from different
sources or with missing data. The predicted height and weight values led to somewhat lower
proportions of overweight/obesity at age 2.5 and 6.0, than those observed. The estimated
associations between BMI categories in childhood and body composition in adolescence
might therefore be somewhat underestimated. Sensitivity analyses of complete cases did not
indicate that missing data highly influenced of our estimates. Unfortunately, information on
potential confounding factors, such as parental, nutritional, physical activity levels, and other
lifestyle factors were not available from MBRN and childhood health records. Such factors
might influence body composition, and would likely have improved our statistical models.
Whether our observation of patterns of BMI gain linked to adverse body composition in
adolescence will lead to disease, remains to be seen. Longitudinal cohort data on growth,
body composition and adult disease risk are currently sparse, and follow-up studies warranted
(1-3, 9, 13).

19
Conclusion
Overweight/obesity at 6.0 and 16.5 years of age as well as greater BMI gain in this age period
are strong predictors of higher FMI, FFMI as well as central obesity measures at 15-20 years
of age. Early identification of children at risk of adverse levels of adiposity is possible and
preventive efforts should focus both on childhood and adolescence.
Conflict of interest:
The authors declare that they have no conflict of interest.
Acknowledgements
This work was supported by a grant from the Northern Norway Regional Health Authority (grant
number SFP1226-15). The authors are grateful for the contribution by the participants in the Fit
Futures study. We thank the public health nurses in the cooperating municipalities, staff at the
Department of Community Medicine, Faculty of Health Sciences, UiT, The Arctic University of
Norway, and staff at the Clinical Research Department, University Hospital of North Norway for
facilitating data collection in the Fit Futures study. We wish to acknowledge the services of the
Medical Birth Registry of Norway and we thank the board of The Tromsø Study for the support in all
parts of the study.
Author’s contributions:
ASF and NE designed and conducted TFF1 and TFF2. NE, and EE were responsible for
supplementary data collection from childhood health records. JW calculated SDS according to the UK
reference. EE carried out the statistical analysis and drafted the initial manuscript. TW gave statistical
counselling. EE takes responsibility for the integrity of the data analysis. EE, GS, AK, ASF, JW, TW,

20
AW and NE made substantial contributions to the interpretation of data, critically revised the
manuscript and gave their approval of the final version of the manuscript.

21
REFERENCES:
1. Umer A, Kelley GA, Cottrell LE, Giacobbi P, Innes KE, Lilly CL. Childhood obesity and adult cardiovascular disease risk factors: a systematic review with meta-analysis. BMC Public Health 2017;17: 683.
2. Ajala O, Mold F, Boughton C, Cooke D, Whyte M. Childhood predictors of
cardiovascular disease in adulthood. A systematic review and meta-analysis. Obes Rev 2017;18: 1061-1070.
3. Simmonds M, Burch J, Llewellyn A, Griffiths C, Yang H, Owen C, et al. The use of
measures of obesity in childhood for predicting obesity and the development of obesity-related diseases in adulthood: a systematic review and meta-analysis. Health Technol Assess 2015;19: 1-336.
4. Bjerregaard LG, Jensen BW, Ängquist L, Osler M, Sørensen TIA, Baker JL. Change
in Overweight from Childhood to Early Adulthood and Risk of Type 2 Diabetes. N Engl J Med 2018;378: 1302-1312.
5. The NS, Richardson AS, Gordon-Larsen P. Timing and Duration of Obesity in
Relation to Diabetes. Diabetes Care 2013;36: 865. 6. Reis JP, Loria CM, Lewis CE, et al. Association between duration of overall and
abdominal obesity beginning in young adulthood and coronary artery calcification in middle age. JAMA 2013;310: 280-288.
7. Evensen E, Emaus N, Kokkvoll A, Wilsgaard T, Furberg A-S, Skeie G. The relation
between birthweight, childhood body mass index, and overweight and obesity in late adolescence: a longitudinal cohort study from Norway, The Tromsø Study, Fit Futures. BMJ Open 2017;7: e015576.
8. Javed A, Jumean M, Murad MH, Okorodudu D, Kumar S, Somers VK, et al.
Diagnostic performance of body mass index to identify obesity as defined by body adiposity in children and adolescents: a systematic review and meta-analysis. Pediatr Obes 2015;10: 234-244.
9. Wells JC, Chomtho S, Fewtrell MS. Programming of body composition by early
growth and nutrition. Proc Nutr Soc 2007;66: 423-434. 10. Wells JC, Williams JE, Chomtho S, Darch T, Grijalva-Eternod C, Kennedy K, et al.
Body-composition reference data for simple and reference techniques and a 4-component model: a new UK reference child. Am J Clin Nutr 2012;96: 1316-1326.
11. Cepeda-Valery B, Pressman GS, Figueredo VM, Romero-Corral A. Impact of obesity
on total and cardiovascular mortality--fat or fiction? Nat Rev Cardiol 2011;8: 233-237.
12. World Health Organization. Waist Circumference and Waist–Hip Ratio: Report of a
WHO Expert Consultation. Geneva, Switzerland 2008.
22
13. Zimmet P, Alberti KGMM, Kaufman F, Tajima N, Silink M, Arslanian S, et al. The metabolic syndrome in children and adolescents – an IDF consensus report. Pediatr Diabetes 2007;8: 299-306.
14. Gracia-Marco L, Moreno LA, Ruiz JR, Ortega FB, de Moraes AC, Gottrand F, et al.
Body Composition Indices and Single and Clustered Cardiovascular Disease Risk Factors in Adolescents: Providing Clinical-Based Cut-Points. Prog Cardiovasc Dis 2016;58: 555-564.
15. Rogers IS, Ness AR, Steer CD, Wells JCK, Emmett PM, Reilly JR, et al. Associations
of size at birth and dual-energy X-ray absorptiometry measures of lean and fat mass at 9 to 10 y of age1–3. Am J Clin Nutr 2006;84: 739-747.
16. Bann D, Wills A, Cooper R, Hardy R, Aihie Sayer A, Adams J, et al. Birth weight and
growth from infancy to late adolescence in relation to fat and lean mass in early old age: findings from the MRC National Survey of Health and Development. Int J Obes 2014;38: 69-75.
17. Sachdev HS, Fall CH, Osmond C, Lakshmy R, Dey Biswas SK, Leary SD, et al.
Anthropometric indicators of body composition in young adults: relation to size at birth and serial measurements of body mass index in childhood in the New Delhi birth cohort. Am J Clin Nutr 2005;82: 456-466.
18. Euser AM, Finken MJ, Keijzer-Veen MG, Hille ET, Wit JM, Dekker FW.
Associations between prenatal and infancy weight gain and BMI, fat mass, and fat distribution in young adulthood: a prospective cohort study in males and females born very preterm. Am J Clin Nutr 2005;81: 480-487.
19. Chomtho S, Wells JCK, Williams JE, Lucas A, Fewtrell MS. Associations between
birth weight and later body composition: evidence from the 4-component model. Am J Clin Nutr 2008;88: 1040-1048.
20. Dolan MS, Sorkin JD, Hoffman DJ. Birth weight is inversely associated with central
adipose tissue in healthy children and adolescents. Obesity (Silver Spring) 2007;15: 1600-1608.
21. Sayer AA, Syddall HE, Dennison EM, Gilbody HJ, Duggleby SL, Cooper C, et al.
Birth weight, weight at 1 y of age, and body composition in older men: findings from the Hertfordshire Cohort Study. Am J Clin Nutr 2004;80: 199-203.
22. Eriksson M, Tynelius P, Rasmussen F. Associations of birthweight and infant growth
with body composition at age 15 - the COMPASS study. Paediatr Perinat Epidemiol 2008;22: 379-388.
23. Kindblom JM, Lorentzon M, Hellqvist A, Lonn L, Brandberg J, Nilsson S, et al. BMI
changes during childhood and adolescence as predictors of amount of adult subcutaneous and visceral adipose tissue in men: the GOOD Study. Diabetes 2009;58: 867-874.

23
24. Ekelund U, Ong K, Linné Y, Neovius M, Brage S, Dunger DB, et al. Upward weight percentile crossing in infancy and early childhood independently predicts fat mass in young adults: the Stockholm Weight Development Study (SWEDES). Am J Clin Nutr 2006;83: 324-330.
25. Howe LD, Tilling K, Benfield L, Logue J, Sattar N, Ness AR, et al. Changes in
Ponderal Index and Body Mass Index across Childhood and Their Associations with Fat Mass and Cardiovascular Risk Factors at Age 15. PLoS One 2010;5: e15186.
26. Al�Khudairy L, Loveman E, Colquitt JL, Mead E, Johnson RE, Fraser H, et al. Diet,
physical activity and behavioural interventions for the treatment of overweight or obese adolescents aged 12 to 17 years. Cochrane Database Syst Rev 2017.
27. Brisbois TD, Farmer AP, McCargar LJ. Early markers of adult obesity: a review. Obes
Rev 2012;13: 347-367. 28. Winther A, Dennison E, Ahmed LA, Furberg A-S, Grimnes G, Jorde R, et al. The
Tromsø Study: Fit Futures: a study of Norwegian adolescents' lifestyle and bone health. Arch Osteoporos 2014;9: 185.
29. Skjaerven R, Gjessing HK, Bakketeig LS. Birthweight by gestational age in Norway.
Acta Obstet Gynecol Scand 2000;79: 440-449. 30. Keil M, Totosy de Zepetnek JO, Brooke-Wavell K, Goosey-Tolfrey VL. Measurement
precision of body composition variables in elite wheelchair athletes, using dual-energy X-ray absorptiometry. Eur J Sport Sci 2016;16: 65-71.
31. Juliusson PB, Roelants M, Nordal E, Furevik L, Eide GE, Moster D, et al. Growth
references for 0-19 year-old Norwegian children for length/height, weight, body mass index and head circumference. Ann Hum Biol 2013;40: 220-227.
32. Cole TJ, Lobstein T. Extended international (IOTF) body mass index cut-offs for
thinness, overweight and obesity. Pediatr Obes 2012;7: 284-294. 33. World Health Organization. Child Growth Standards: Length/height-for-age, weight-
for-age, weight-for-length, weight-for-height and body mass index-for-age: Methods and development. Geneva, Switzerland: WHO; 2006 [cited 2018 03. July]. Available from: http://www.who.int/childgrowth/standards/en/.
34. de Onis M, Onyango AW, Borghi E, Siyam A, Nishida C, J. S. Development of a
WHO growth reference for school-aged children and adolescents. Bull World Health Organ 2007;85: 660-667.
35. Petersen AC, Crockett L, Maryse R, Boxer A. A Self-Report Measure of Pubertal
Status: Reliability, Validity, and Initial Norms. J Youth Adolesc 1988;17: 117-133. 36. Rangul V, Holmen TL, Kurtze N, Cuypers K, Midthjell K. Reliability and validity of
two frequently used self-administered physical activity questionnaires in adolescents. BMC Med Res Methodol 2008;8: 47.

24
37. Howe LD, Tilling K, Matijasevich A, Petherick E, S., Santos AC, Fairley L, et al. Linear spline multilevel models for summarising childhood growth trajectories: A guide to their application using examples from five birth cohorts. Stat Methods Med Res 2016;25: 1854-1874.
38. Glavin K, Roelants M, Strand BH, Juliusson PB, Lie KK, Helseth S, et al. Important
periods of weight development in childhood: a population-based longitudinal study. BMC Public Health 2014;14: 160.
39. Wills AK, Strand BH, Glavin K, Silverwood RJ, Hovengen R. Regression models for
linking patterns of growth to a later outcome: infant growth and childhood overweight. BMC Med Res Methodol 2016;16: 41.
40. Loomba-Albrecht LA, Styne DM. Effect of puberty on body composition. Curr Opin
Endocrinol Diabetes Obes 2009;16: 10-15. 41. White IR, Royston P, Wood AM. Multiple imputation using chained equations: Issues
and guidance for practice. Stat Med 2011;30: 377-399. 42. Alwis G, Rosengren B, Stenevi-Lundgren S, Duppe H, Sernbo I, Karlsson MK.
Normative dual energy X-ray absorptiometry data in Swedish children and adolescents. Acta Paediatr 2010;99: 1091-1099.
43. Ng M, Fleming T, Robinson M, Thomson B, Graetz N, Margono C, et al. Global,
regional, and national prevalence of overweight and obesity in children and adults during 1980–2013: a systematic analysis for the Global Burden of Disease Study 2013. The Lancet 2014;384: 766-781.
44. Júlíusson PB, Eide GE, Roelants M, Waaler PE, Hauspie R, Bjerknes R. Overweight
and obesity in Norwegian children: prevalence and socio-demographic risk factors. Acta Paediatr 2010;99.
45. Nan C, Guo B, Warner C, Fowler T, Barrett T, Boomsma D, et al. Heritability of body
mass index in pre-adolescence, young adulthood and late adulthood. Eur J Epidemiol 2012;27: 247-253.
46. Johnson W., Choh A. C., Lee M., Towne B., Czerwinski S. A., Demerath E. W. Is
infant body mass index associated with adulthood body composition trajectories? An exploratory analysis. Pediatr Obes 2017;12: 10-18.
47. De Kroon MLA, Renders CM, Van Wouwe JP, Van Buuren S, Hirasing RA. The
Terneuzen Birth Cohort: BMI Changes between 2 and 6 Years Correlate Strongest with Adult Overweight. PLoS One 2010;5: e9155.
48. Barker DJ, Osmond C, Forsén TJ, Kajantie E, Eriksson JG. Trajectories of growth
among children who have coronary events as adults. N Engl J Med 2005;353: 1802-1809.

25
49. Næss M, Holmen TL, Langaas M, Bjørngaard JH, Kvaløy K. Intergenerational Transmission of Overweight and Obesity from Parents to Their Adolescent Offspring – The HUNT Study. PLoS One 2016;11: e0166585.
50. Bosch TA, Dengel DR, Kelly AS, Sinaiko AR, Moran A, Steinberger J. Visceral
adipose tissue measured by DXA correlates with measurement by CT and is associated with cardiometabolic risk factors in children. Pediatr Obes 2015;10: 172-179.

26
Table1.Sexspecificcharacteristicsofthestudypopulationatbirthandfouragesupto18-20yearsofage.TheTromsøStudy:FitFutures(n=907)
Girls Boys
Characteristics n mean/% SD n mean/% SDBirthBirthweight(g) 439 3453.9 579.3 468 3601.1 591.3Birthlength(cm)a 439 49.4 1.7 468 50.2 1.7Gestationalage(weeks) 389 39.7 1.8 427 39.6 2.1Bodymassindex(kg/m2)a 439 14.08 1.71 468 14.21 1.67BMISDSab 439 -0.04 1.31 468 -0.07 1.15Sizeforgestationalagec: 389 427 SGA 49 12.6% 46 10.8% AGA 302 77.6% 332 77.7% LGA 38 9.8% 49 11.5% 2.5yearsofageWeighta 439 13.5 1.4 468 14.2 1.4Height(cm)a 439 91.6 3.3 468 93.2 3.2Bodymassindex(kg/m2)a 439 16.10 1.27 468 16.31 1.18BMISDSab 439 -0.13 1.13 468 -0.23 0.98BMIcategoryad: 439 468 Underweight 61 13.9% 52 11.1% Normalweight 338 77.0% 386 82.5% Lightoverweight 29 6.6% 17 3.6% Severeoverweight/obesity 11 2.5% 13 2.8% 6.0yearsofageWeighta 439 21.5 3.4 468 21.6 2.9Height(cm)a 439 116.9 4.3 468 118.1 4.3Bodymassindex(kg/m2)a 439 15.70 1.96 468 15.47 1.62BMISDSab 439 -0.23 1.17 468 -0.25 1.06BMIcategoryad: 439 468 Underweight 53 12.1% 66 14.1% Normalweight 320 72.9% 362 77.4% Lightoverweight 37 8.4% 21 4.5% Severeoverweight/obesity 29 6.6% 19 4.1% 16.5yearsofageWeighta 439 61.5 11.9 468 70.4 14.6Height(cm)a 439 165.6 6.3 468 177.7 6.5Bodymassindex(kg/m2)a 439 22.40 4.07 468 22.24 4.19BMISDSab 439 0.46 1.20 468 0.35 1.15BMIcategoryad: 439 468 Underweight 27 6.2% 40 8.6% Normalweight 321 73.1% 318 68.0% Lightoverweight 38 8.7% 41 8.7% Severeoverweight/obesity 53 12.1% 69 14.7% Waistcircumference(cm) 439 77.5 10.3 468 81.9 11.2Centraloverweight/obesityi 141 32.1% 63 13.5% Fatmass 439 20.6 9.0 468 14.7 10.8Fatmasstrunk 439 9.9 4.8 468 7.4 5.7Fat-freemass 439 40.7 4.7 468 55.5 6.9Fatmassindex(kg/m2) 439 7.55 3.28 468 4.67 3.39Fat-freemassindex(kg/m2) 439 14.91 1.34 468 17.67 1.66

27
FatmassindexSDSe 439 0.23 0.95 468 0.06 1.15Fat-freemassindexSDSe 439 0.01 0.96 468 -0.09 0.95Android:gynoidfatmassratio 439 0.33 0.09 468 0.38 0.11Pubertalmaturation,girlsf: 436 - - -Early(<12.5y.) 130 29.8% - - -Intermediate(12.5-13.9y.) 204 46.8% - - -Late(≥14.0y.) 102 23.4% - - -Pubertalmaturation,boysg: - - - 366 Barelystarted(PDS2.0-2.9) - - - 65 17.7% Underway(PDS3.0-3.9) - - - 270 73.8% Completed(PDS4.0) - - - 31 8.5% Physicalactivity–frequencyh 436 460 Low 145 33.3% 171 37.2% Moderate 188 43.1% 169 36.7% High 103 23.6% 120 26.1% 18-20yearsofageAge(years) 358 18.6 0.4 303 18.6 0.4Weight 340 63.7 12.1 285 75.1 14.6Height(cm) 340 166.0 6.4 285 179.1 6.5Bodymassindex(kg/m2) 340 23.12 4.29 285 23.36 4.15BMIcategoryd: 340 285 Underweight 15 4.4% 24 8.4% Normalweight 252 74.1% 181 63.5% Lightoverweight 27 7.9% 36 12.6% Severeoverweight/obesity 46 13.5% 44 15.4% Waistcircumference(cm) 340 78.1 11.5 285 84.6 11.8Centraloverweight/obesityi 107 31.5% 54 19.0% Fatmass 336 21.8 9.4 285 16.6 11.3Fatmasstrunk 336 10.7 5.4 285 8.9 6.4Fat-freemass 336 41.7 4.9 285 58.4 7.2Fatmassindex(kg/m2) 336 7.93 3.46 285 5.18 3.45Fat-freemassindex(kg/m2) 336 15.13 1.39 285 18.18 1.78FatmassindexSDSe 336 0.22 1.05 285 0.02 1.18Fat-freemassindexSDSe 336 0.13 0.97 285 -0.17 1.07Android:gynoidfatmassratio 336 0.35 0.10 285 0.43 0.11 aBirthlength,height,weightat2.5,6.0and16.5yearsofage,andBMI,BMISDS,BMIcategoryatbirth,2.5,6.0and16.5yearsofagebasedonestimatedvaluesbylinearsplinemultilevelmodelattheexacttargetage.bBMISDSaccordingtoNorwegianreferencedata(31)cSizeforgestationalageaccordingtoNorwegianreferencedata(29)dBMIcategoriesaccordingtoIOTFage-andsex-specificcut-offvaluesforchildren2-18yearsofage(32);underweight(adultBMI<18.5kg/m2),normalweight(adultBMI≥18.5-<25kg/m2),lightoverweight(adultBMI≥25-<27kg/m2),severeoverweight/obesity(adultBMI≥27kg/m2)eStandarddeviationscores(SDS)forbodycompositionmeasuresaccordingtoUKreferencedata(10)fPubertalmaturationisbasedonageofmenarcheingirls.gPubertalmaturationisbasedonPubertalDevelopmentScale(PDS)inboys(35).Nonehadascore<2.0intotalscore.hPhysicalactivityiscategorisedintothreegroupsbasedonHealthBehaviourinSchoolChildrenquestionnaire(36)i Central overweight/obesity is defined as a waist circumference ≥80cmforgirlsand≥94cmforboys(13). SGA, small for gestational age; AGA, appropriate for gestational age; LGA, large for gestational age;BMI,bodymassindex

28
Tab
le 2
. R
egre
ssio
n co
effic
ient
s for
ass
ocia
tions
bet
wee
n bi
rth
wei
ght,
BM
I cat
egor
y at
2.5
, 6.0
, and
16.
5 ye
ars o
f age
and
fat m
ass i
ndex
SD
S, fa
t-fr
ee m
ass i
ndex
SD
S an
d an
droi
d:gy
noid
fat m
ass r
atio
at 1
5-20
yea
rs o
f age
in g
irls
and
boys
, The
Tro
msø
Stu
dy, F
it Fu
ture
s
G
IRL
S (n
=439
) B
OY
S (n
=468
)
FMI S
DS
FFM
I SD
S A
ndro
id:g
ynoi
d FM
R
FMI S
DS
FFM
I SD
S A
ndro
id:g
ynoi
d FM
R
Birt
h b
Birt
h w
eigh
t per
SD
0.
19 (0
.08,
0.3
1) *
* 0.
18 (0
.07,
0.2
9) *
* -0
.00
(-0.
01, 0
.01)
0.
09 (-
0.03
, 0.2
1)
0.15
(0.0
4, 0
.25)
**
-0.0
0 (-
0.02
, 0.0
1)
Pond
eral
inde
x pe
r SD
0.
14 (0
.05,
0.2
4) **
0.
16 (0
.06,
0.2
5) **
-0
.00
(-0.
01, 0
.01)
0.
09 (-
0.02
, 0.2
1)
0.12
(0.0
3, 0
.22)
* -0
.00
(-0.
01, 0
.01)
Si
ze fo
r ges
tatio
nal a
ge c:
SGA
-0
.40
(-0.
67, -
0.13
) **
-0.3
0 (-
0.56
, -0.
04) *
-0
.00
(-0.
03, 0
.03)
-0
.34
(-0.
68, 0
.01)
-0
.03
(-0.
32, 0
.26)
-0
.01
(-0.
04, 0
.03)
A
GA
Re
fere
nce
Refe
renc
e Re
fere
nce
Refe
renc
e Re
fere
nce
Refe
renc
e LG
A
0.20
(-0.
11, 0
.51)
0.
30 (-
0.01
, 0.6
1)
-0.0
1 (-
0.04
, 0.0
2)
0.27
(-0.
06, 0
.60)
0.
37 (0
.08,
0.6
5) *
0.00
(-0.
03, 0
.03)
2.5
year
s of a
ge d
Und
er-/n
orm
al w
eigh
t Re
fere
nce
Refe
renc
e Re
fere
nce
Refe
renc
e Re
fere
nce
Refe
renc
e O
verw
eigh
t/obe
sity
0.
50 (0
.19,
0.8
1) *
* 0.
50 (0
.19,
0.8
0) *
* 0.
01 (-
0.02
, 0.0
4)
0.34
(-0.
08, 0
.76)
0.
61 (0
.25,
0.9
6) *
* -0
.02
(-0.
06, 0
.02)
6.0
year
s of a
ge d
Und
er-/n
orm
al w
eigh
t Re
fere
nce
Refe
renc
e Re
fere
nce
Refe
renc
e Re
fere
nce
Refe
renc
e O
verw
eigh
t/obe
sity
1.
18 (0
.95,
1.4
1) *
**
0.97
(0.7
4, 1
.20)
***
0.
08 (0
.06,
0.1
0) *
**
1.17
(0.8
2, 1
.52)
***
1.
07 (0
.77,
1.3
7) *
**
0.11
(0.0
8, 0
.15)
***
16.5
yea
rs o
f age
e
Und
erw
eigh
t -0
.90
(-1.
14, -
0.66
) ***
-0
.66
(-0.
95, -
0.38
) ***
-0
.05
(-0.
08, -
0.03
) ***
-1
.10
(-1.
35, -
0.85
) ***
-1
.23
(-1.
49, -
0.97
) ***
-0
.04
(-0.
07, -
0.02
) **
Nor
mal
wei
ght
Refe
renc
e Re
fere
nce
Refe
renc
e Re
fere
nce
Refe
renc
e Re
fere
nce
Ligh
t ove
rwei
ght
0.94
(0.7
3, 1
.14)
***
0.
67 (0
.43,
0.9
2) *
**
0.07
(0.0
5, 0
.09)
***
1.
30 (1
.05,
1.5
5) *
**
0.43
(0.1
8, 0
.68)
***
0.
11 (0
.09,
0.1
4) *
**
Seve
re o
verw
eigh
t/obe
sity
1.95
(1.7
7, 2
.13)
***
1.
45 (1
.24,
1.6
7) *
**
0.15
(0.1
3, 0
.18)
***
1.
80 (1
.60,
2.0
0) *
**
0.97
(0.7
7, 1
.17)
***
0.
18 (0
.16,
0.2
0) *
**
B
ased
on
anal
ysis
with
line
ar m
ixed
mod
els.
Val
ues r
efle
ct st
anda
rdiz
ed β
coe
ffici
ents
(95%
CI)
for F
MI S
DS
and
FFM
I SD
S an
d β
coef
ficie
nts (
95%
CI)
for a
ndro
id:g
ynoi
d FM
R.
Ana
lyse
d in
a d
atas
et w
ith 2
0 im
puta
tions
(mul
tiple
impu
tatio
n of
mis
sing
co-
varia
tes a
t birt
h an
d at
16.
5 ye
ars o
f age
), n=
907
(439
girl
s and
468
boy
s)
a Fat
mas
s ind
ex a
nd F
at-f
ree
mas
s ind
ex S
DS
acco
rdin
g to
UK
Ref
eren
ce d
ata
(10)
b B
irth
mod
els a
re a
djus
ted
for g
esta
tiona
l age
. c Si
ze fo
r ges
tatio
nal a
ge a
ccor
ding
to N
orw
egia
n Re
fere
nce
data
(29)
d B
MI c
ateg
orie
s acc
ordi
ng to
IOTF
age
- and
sex-
spec
ific
cut-o
ff va
lues
for c
hild
ren
2-18
yea
rs o
f age
(32)
. Dic
hoto
mise
d: u
nder
-/nor
mal
wei
ght (
adul
t BM
I <25
kg/m
2 ), ov
erw
eigh
t/obe
sity
(adu
lt B
MI ≥
25 k
g/m
2 ). M
odel
s at 2
.5, a
nd 6
.0 y
ears
of a
ge a
re a
djus
ted
for h
eigh
t. e B
MI i
n fo
ur c
ateg
orie
s acc
ordi
ng to
IOTF
(32)
: und
erw
eigh
t (ad
ult B
MI <
18.5
kg/m
2 ), no
rmal
wei
ght (
adul
t BM
I ≥18
.5-<
25kg
/m2 ),
light
ove
rwei
ght (
adul
t BM
I ≥25
-<27
kg/
m2 ),
seve
re
over
wei
ght/o
besit
y (a
dult
BM
I ≥27
kg/
m2 ).
Mod
els a
t 16.
5 ye
ars o
f age
are
adj
uste
d fo
r hei
ght,
pube
rtal m
atur
atio
n an
d ph
ysic
al a
ctiv
ity fr
eque
ncy.
C
I, C
onfid
ence
inte
rval
; FM
I, fa
t mas
s ind
ex (k
g/m
2 ); FF
MI,
fat-f
ree
mas
s ind
ex (k
g/m
2 ); FM
R, fa
t mas
s rat
io; S
D, s
tand
ard
devi
atio
n; S
DS,
stan
dard
dev
iatio
n sc
ore;
Pon
dera
l ind
ex (k
g/m
3 ); SG
A, s
mal
l for
ges
tatio
nal a
ge; A
GA
, app
ropr
iate
for g
esta
tiona
l age
; LG
A, l
arge
for g
esta
tiona
l age
. * p
<0.0
5, **
p<0
.01,
*** p
<0.0
01

29
Tab
le 3
. O
dds r
atio
s (95
% C
I) fo
r ce
ntra
l ove
rwei
ght/o
besi
tya o
r a
fat m
ass i
ndex
SD
Sb ≥ 1
.0 a
t 15-
20 y
ears
of a
ge, T
he T
rom
sø S
tudy
: Fit
Futu
res
Gir
ls
Boy
s
Wai
st c
ateg
ory
(≥80
cm
) FM
I SD
S ≥
1.0
Wai
st c
ateg
ory
(≥94
cm
) FM
I SD
S ≥
1.0
Birt
h c
Birt
h w
eigh
t per
SD
1.
32 (1
.06,
1.6
4)*
1.38
(1.0
5, 1
.81)
*
1.23
(0.9
6, 1
.58)
1.
08 (0
.87,
1.3
4)
Size
for g
esta
tiona
l age
d
SG
A
0.50
(0.2
6, 0
.99)
* 0.
39 (0
.15,
1.0
4)
0.47
(0.2
0, 1
.14)
0.
44 (0
.21,
0.9
2) *
AG
A
Refe
renc
e
Refe
renc
e
Refe
renc
e
Refe
renc
e
LGA
1.
46 (0
.84,
2.5
3)
1.40
(0.6
9, 2
.83)
1.
62 (0
.82,
3.1
8)
1.02
(0.5
4, 1
.94)
2.5
year
s of a
ge e
Und
er-/n
orm
al w
eigh
t Re
fere
nce
Re
fere
nce
Re
fere
nce
Re
fere
nce
Ove
rwei
ght/o
besi
ty
1.39
(0.7
7, 2
.52)
2.
00 (1
.03,
3.8
9) *
1.32
(0.6
1, 2
.87)
1.
18 (0
.57,
2.4
5)
6.
0 ye
ars o
f age
e
Und
er-/n
orm
al w
eigh
t Re
fere
nce
Refe
renc
e Re
fere
nce
Refe
renc
e O
verw
eigh
t/obe
sity
4.
78 (3
.05,
7.4
8) *
**
7.41
(4.4
9, 1
2.20
) ***
5.
56 (3
.24,
9.5
4) *
**
4.14
(2.4
1, 7
.09)
***
16.5
yea
rs o
f age
f
U
nder
wei
ght
0.18
(0.0
4, 0
.73)
*
0.68
(0.1
6, 2
.85)
0.
48 (0
.06,
3.6
9)
0.12
(0.0
2, 0
.87)
*
Nor
mal
wei
ght
Refe
renc
e Re
fere
nce
Refe
renc
e Re
fere
nce
Ligh
t ove
rwei
ght
6.50
(3.9
2, 1
0.77
) ***
12
.49
(6.5
5, 2
3.81
) ***
10
.40
(4.9
9, 2
1.68
) ***
12
.84
(7.3
4, 2
2.45
) ***
Se
vere
ove
rwei
ght/o
besi
ty
18.8
1 (1
0.91
, 32.
42) *
**
74.2
2 (4
0.22
, 136
.96)
***
63
.89
(34.
98, 1
16.7
0) *
**
23.2
8 (1
4.73
, 36.
80) *
**
a C
entra
l obe
sity
wer
e de
fined
as a
wai
st ci
rcum
fere
nce ≥8
0 cm
for g
irls,
and ≥9
4 cm
for b
oys a
t 15-
20 y
ears
of a
ge.
Dat
a w
ere
anal
ysed
with
Gen
eral
ized
est
imat
ing
equa
tions
(GEE
) and
val
ues r
efle
ct o
dds r
atio
s (O
R) w
ith 9
5% C
I. A
naly
sed
in a
dat
aset
with
20
impu
tatio
ns (m
ultip
le im
puta
tion
of m
issi
ng c
o-va
riate
s at b
irth
and
at 1
6.5
year
s of a
ge),
n=90
7 (4
39 g
irls a
nd 4
68 b
oys)
b F
at m
ass i
ndex
and
Fat
-fre
e m
ass i
ndex
SD
S ac
cord
ing
to U
K re
fere
nce
data
(10)
c B
irth
mod
els a
re a
djus
ted
for g
esta
tiona
l age
. d Si
ze fo
r ges
tatio
nal a
ge a
ccor
ding
to N
orw
egia
n re
fere
nce
data
(29)
e B
MI c
ateg
orie
s acc
ordi
ng to
IOTF
age
- and
sex-
spec
ific
cut-o
ff va
lues
for c
hild
ren
2-18
yea
rs o
f age
(32)
. Dic
hoto
mise
d: u
nder
-/nor
mal
wei
ght (
adul
t BM
I <25
kg/m
2 ), ov
erw
eigh
t/obe
sity
(adu
lt B
MI ≥
25 k
g/m
2 ). M
odel
s at 2
.5, a
nd 6
.0 y
ears
of a
ge a
re a
djus
ted
for h
eigh
t. f B
MI i
n fo
ur c
ateg
orie
s acc
ordi
ng to
IOTF
(32)
: und
erw
eigh
t (ad
ult B
MI <
18.5
kg/m
2 ), no
rmal
wei
ght (
adul
t BM
I ≥18
.5-<
25kg
/m2 ),
light
ove
rwei
ght (
adul
t BM
I ≥25
-<27
kg/
m2 ),
seve
re
over
wei
ght/o
besit
y (a
dult
BM
I ≥27
kg/
m2 ).
Mod
els a
t 16.
5 ye
ars o
f age
are
adj
uste
d fo
r hei
ght,
pube
rtal m
atur
atio
n an
d ph
ysic
al a
ctiv
ity fr
eque
ncy.
O
R, O
dds r
atio
; CI,
Con
fiden
ce in
terv
al; F
MI,
fat m
ass i
ndex
(kg/
m2 );
SD, s
tand
ard
devi
atio
n; S
DS,
stan
dard
dev
iatio
n sc
ore;
SG
A, s
mal
l for
ges
tatio
nal a
ge; A
GA
, app
ropr
iate
for g
esta
tiona
l ag
e; L
GA
, lar
ge fo
r ges
tatio
nal a
ge.
* p<0
.05;
*** p
<0.0
01

30
Tab
le 4
Sta
ndar
dize
d re
gres
sion
coe
ffic
ient
s for
ass
ocia
tions
of c
ondi
tiona
l BM
I gai
n be
twee
n bi
rth, 2
.5, 6
.0, a
nd
16.5
yea
rs o
f age
with
cha
nges
in fa
t mas
s ind
ex S
DS
and
fat-f
ree
mas
s ind
ex S
DS
betw
een
15-1
7 an
d 18
-20
yea
rs o
f age
in g
irls a
nd b
oys,
The
Trom
sø S
tudy
: Fit
Futu
res
GIR
LS
Δ FM
I SD
S a
Δ FF
MI S
DS a
Mea
n ch
ange
(SD
) 0.
04 (0
.61)
0.
12 (0
.49)
Birt
h to
2.5
yea
rs o
f age
-0
.01
(-0.
07, 0
.06)
-0
.02
(-0.
08, 0
.03)
2.5
to 6
.0 y
ears
of a
ge
0.05
(-0.
01, 0
.12)
0.
03 (-
0.02
, 0.0
9)
6.
0 to
16.
5 ye
ars o
f age
-0
.08
(-0.
15, -
0.02
) *
-0.0
2 (-
0.07
, 0.0
4)
B
OY
S
M
ean
chan
ge (S
D)
0.01
(0.6
2)
-0.0
5 (0
.49)
Birt
h to
2.5
yea
rs o
f age
-0
.06
(-0.
14, 0
.01)
0.
01 (-
0.05
, 0.0
7)
2.
5 to
6.0
yea
rs o
f age
-0
.04
(-0.
11, 0
.04)
0.
02 (-
0.04
, 0.0
8)
6.
0 to
16.
5 ye
ars o
f age
-0
.11
(-0.
18, -
0.04
) **
0.01
(-0.
05, 0
.07)
Val
ues a
re b
ased
on
mul
tiple
line
ar re
gres
sion
mod
els a
nd re
flect
cha
nge
in st
anda
rdiz
ed c
oeff
icie
nts (
95%
CI)
per s
tand
ardi
zed
resid
ual o
f co
nditi
onal
ly m
odel
led
gain
in B
MI S
DS.
Con
ditio
nal g
row
th v
aria
bles
are
inde
pend
ent o
f prio
r bod
y siz
e. M
odel
s are
adj
uste
d fo
r ge
stat
iona
l age
, pub
erta
l mat
urat
ion
and
phys
ical
act
ivity
freq
uenc
y.
Ana
lyse
d in
a d
atas
et w
ith 2
0 im
puta
tions
(mul
tiple
impu
tatio
n of
mis
sing
co-
varia
tes a
t birt
h an
d at
16.
5 ye
ars o
f age
), n=
621
(336
girl
s an
d 28
5 bo
ys)
a Fat
mas
s ind
ex a
nd F
at-f
ree
mas
s ind
ex S
DS
acco
rdin
g to
UK
Ref
eren
ce d
ata
(10)
C
I, C
onfid
ence
inte
rval
; FM
I, fa
t mas
s ind
ex (k
g/m
2 ); FF
MI,
fat-f
ree
mas
s ind
ex (k
g/m
2 ); SD
, sta
ndar
d de
viat
ion;
SD
S, st
anda
rd d
evia
tion
scor
e * p
<0.0
5, **
p<0
.01

31
Figure legends
Figure 1 Flowchart of the study population, The Tromsø study: Fit Futures
Figure 2 Associations of conditional BMI gain from birth up to age 16.5 years with a) FMI SDS, b)
FFMI SDS and c) android:gynoid FMR at 15-20 years of age, in girls and boys. Values are based on
linear mixed models and reflect β coefficients and 95% CI per standardized residual of conditionally
modelled BMI gain. Models are adjusted for gestational age, pubertal maturation and physical
activity frequency measured in TFF1. (See also Table S2) Markers are placed approximately at mid-
point of each growth period. The Tromsø study: Fit Futures (n=907; 439 girls and 468 boys)


Adol
esce
nt b
ody
com
posit
ion,
and
ass
ocia
tions
with
bod
y si
ze a
nd g
row
th fr
om b
irth
to la
te a
dole
scen
ce. T
he T
rom
sø S
tudy
: Fit
Futu
res –
a N
orwe
gian
long
itudi
nal c
ohor
t stu
dy
Elin
Eve
nsen
* , Nin
a Em
aus,
Ann
e-So
fie F
urbe
rg, A
ne K
okkv
oll,
Jona
than
Wel
ls, T
om W
ilsga
ard,
Ann
e W
inth
er, G
uri S
keie
* D
epar
tmen
t of C
linic
al R
esea
rch,
Uni
vers
ity H
ospi
tal o
f Nor
th N
orw
ay, T
rom
sø, N
orw
ay. D
epar
tmen
t of H
ealth
and
Car
e Sc
ienc
es, F
acul
ty o
f Hea
lth S
cien
ces,
UiT
The
Arc
tic U
nive
rsity
of
Nor
way
, Tro
msø
, Nor
way
elin
.eve
nsen
@un
n.no
Ta
ble
S1 A
ge a
nd se
x sp
ecifi
c de
scrip
tive
anth
ropo
met
ric m
easu
res a
nd D
XA
-der
ived
bod
y co
mpo
sitio
n da
ta a
t age
15-
19 y
ears
of a
ge.
The
Trom
sø S
tudy
: Fit
Futu
res
A
ge (y
ears
) A
ge (y
ears
) A
ge (y
ears
) A
ge (y
ears
) A
ge (y
ears
)
Girl
s 15
n=
14
16
n=36
2 17
n=
63
18
n=28
3 19
n=
53
Wei
ght (
kg)
60.3
(8
.3)
61.4
(1
1.9)
60
.6
(10.
4)
63.5
(1
2.0)
63
.6
(12.
0)
Hei
ght (
cm)
164.
4 (6
.0)
164.
9 (6
.5)
165.
9 (5
.7)
166.
1 (6
.5)
165.
6 (6
.1)
Bod
y m
ass i
ndex
(kg/
m2 )
22
.46
(3.8
1)
22.5
5 (4
.14)
21
.98
(3.3
5)
23.0
3 (4
.19)
23
.25
(4.5
4)
Wai
st c
ircum
fere
nce
(cm
) 77
.3
(9.8
) 77
.5
(10.
4)
77.4
(1
0.4)
77
.9
(10.
9)
77.8
(1
2.7)
Fa
t mas
s (kg
) 21
.2
(6.6
) 20
.7
(9.2
) 19
.8
(8.2
) 21
.7
(9.4
) 22
.3
(9.7
) Fa
t mas
s tru
nk (k
g)
10.1
(3
.9)
9.9
(4.9
) 9.
5 (4
.5)
10.7
(5
.3)
11.1
(5
.7)
Lean
mas
s (kg
) 37
.1
(3.4
) 38
.7
(4.7
) 38
.7
(4.3
) 39
.4
(4.9
) 38
.9
(4.4
) Fa
t-fre
e m
ass (
kg)
39.2
(3
.5)
40.7
(4
.7)
40.8
(4
.4)
41.8
(4
.9)
41.3
(4
.6)
Fat m
ass i
ndex
(kg/
m2 )
7.95
(2
.74)
7.
60
(3.3
6)
7.19
(2
.91)
7.
88
(3.4
2)
8.20
(3
.69)
Fa
t-fre
e m
ass i
ndex
(kg/
m2 )
14.5
2 (1
.38)
14
.95
(1.3
8)
14.8
0 (1
.11)
15
.15
(1.3
9)
15.0
5 (1
.38)
Fa
t mas
s ind
ex S
DS
a 0.
43
(0.9
6)
0.25
(0
.95)
0.
08
(0.9
5)
0.21
(1
.04)
0.
26
(1.1
3)
Fat-f
ree
mas
s ind
ex S
DS
a -0
.26
(1.0
2)
0.03
(0
.98)
-0
.08
(0.8
6)
0.14
(0
.96)
0.
06
(1.0
3)
And
roid
:gyn
oid
fat m
ass r
atio
0.
34
(0.0
9)
0.34
(0
.09)
0.
32
(0.0
9)
0.36
(0
.10)
0.
35
(0.1
0)
Age
(yea
rs)
Age
(yea
rs)
Age
(yea
rs)
Age
(yea
rs)
Age
(yea
rs)
Boy
s 15
n=
35
16
n=37
4 17
n=
59
18
n=22
6 19
n=
59
Wei
ght (
kg)
67.6
(1
2.5)
70
.5
(14.
8)
69.6
(1
2.86
) 74
.7
(14.
8)
76.4
(1
4.2)
H
eigh
t (cm
) 17
4.8
(6.9
) 17
7.2
(6.6
) 17
7.4
(7.3
0)
179.
2 (6
.4)
178.
8 (7
.0)
Bod
y m
ass i
ndex
(kg/
m2 )
22
.13
(4.0
4)
22.4
1 (4
.29)
22
.02
(3.3
2)
23.2
3 (4
.16)
23
.87
(4.1
0)
Wai
st c
ircum
fere
nce
(cm
) 79
.7
(9.9
) 82
.3
(11.
6)
81.1
(9
.2)
84.3
(1
2.0)
85
.9
(10.
8)
Fat m
ass (
kg)
14.8
(1
0.2)
14
.9
(11.
2)
13.0
(8
.7)
16.2
(1
1.5)
18
.3
(10.
4)
Fat m
ass t
runk
(kg)
7.
5 (5
.6)
7.5
(5.9
) 6.
7 (4
.6)
8.6
(6.5
) 9.
9 (5
.9)
Lean
mas
s (kg
) 50
.6
(5.5
) 53
.8
(7.0
) 54
.8
(7.0
) 56
.1
(7.1
) 55
.6
(7.3
) Fa
t-fre
e m
ass (
kg)
52.8
(5
.3)
55.6
(7
.0)
56.6
(6
.9)
58.5
(7
.2)
58.1
(7
.5)
Fat m
ass i
ndex
(kg/
m2 )
4.88
(3
.50)
4.
74
(3.4
8)
4.09
(2
.63)
5.
03
(3.5
0)
5.75
(3
.22)
Fa
t-fre
e m
ass i
ndex
(kg/
m2 )
17.2
5 (1
.15)
17
.67
(1.7
2)
17.9
3 (1
.46)
18
.20
(1.7
7)
18.1
3 (1
.82)
Fa
t mas
s ind
ex S
DS
a 0.
22
(1.0
8)
0.08
(1
.17)
-0
.12
(1.0
6)
-0.0
3 (1
.19)
0.
22
(1.1
0)

Fat-f
ree
mas
s ind
ex S
DS
a -0
.13
(0.6
8)
-0.0
9 (0
.99)
-0
.08
(0.8
8)
-0.1
4 (1
.06)
-0
.26
(1.1
0)
And
roid
:gyn
oid
fat m
ass r
atio
0.
38
(0.1
1)
0.38
(0
.11)
0.
39
(0.0
9)
0.42
(0
.11)
0.
45
(0.1
0)
V
alue
s are
mea
ns a
nd st
anda
rd d
evia
tions
(SD
). A
ge g
roup
s: 15
: 15.
7-15
.9; 1
6: 1
6.0-
16.9
; 17:
17.
0-17
.9; 1
8: 1
8.0-
18.9
; 19:
19.
0-20
.1
Mea
sure
s at a
ge 1
5-17
yea
rs a
re fr
om F
it Fu
ture
s 1, a
nd a
t 18-
19 y
ears
of a
ge a
re re
peat
ed m
easu
res t
wo
year
s lat
er fr
om th
ose
who
als
o pa
rtici
pate
d in
Fit
Futu
res 2
. a St
anda
rd d
evia
tion
scor
es (S
DS)
for b
ody
com
posit
ion
mea
sure
s acc
ordi
ng to
UK
refe
renc
e da
ta [1
0].
DX
A, d
ual X
-ray
abs
orpt
iom
etry
; BM
I, bo
dy m
ass i
ndex
; n, n
umbe
r

Adolescent body composition, and associations with body size and growth from birth to late adolescence. The Tromsø Study: Fit Futures – a Norwegian longitudinal cohort study. Elin Evensen*, Nina Emaus, Anne-Sofie Furberg, Ane Kokkvoll, Jonathan Wells, Tom Wilsgaard, Anne Winther, Guri Skeie
* Department of Clinical Research, University Hospital of North Norway, Tromsø, Norway. Department of Health and Care Sciences, Faculty of Health Sciences, UiT The Arctic University of Norway, Tromsø, Norway [email protected] Table S2 BMI categories for girls and boys at 2.5, 6.0 and 16.5 years of age according to WHO and IOTF definitions. The Tromsø study: Fit Futures (n=907) WHO reference a IOTF reference b Girls n % n % 2.5 years of age 439 439
Underweight 4 0.9 61 13.9 Normal weight 424 96.6 338 77.0 Overweight/obesity 11 2.5 40 9.1
6.0 years of age 439 439 Underweight 57 13.0 53 12.1 Normal weight 300 68.3 320 72.9 Overweight/obesity 82 18.7 66 15.0
16.5 years of age 439 439 Underweight 40 9.1 27 6.2 Normal weight 301 68.6 321 73.1 Overweight/obesity 98 22.3 91 20.7
Boys 2.5 years of age 468 468
Underweight 4 0.9 52 11.1 Normal weight 449 95.9 386 82.5 Overweight/obesity 15 3.2 30 6.4
6.0 years of age 468 468 Underweight 70 14.9 66 14.1 Normal weight 335 71.6 362 77.4 Overweight/obesity 63 13.5 40 8.6
16.5 years of age 468 468 Underweight 68 14.5 40 8.6 Normal weight 282 60.3 318 67.9 Overweight/obesity 118 25.2 110 23.5
BMI categories are based on BMI (kg/m2)calculated from predicted height/weight values at exact ages 2.5, 6.0 and 16.5 years, by the linear spline multilevel model. a WHO growth standard for children 2-5 years [34] using <-2SD for underweight, >+2 SD for overweight including obesity, and WHO growth reference for ages 5-19 years [35] using <-1 SD for underweight, >+1 SD for overweight including obesity. b BMI categories according to International Obesity Taskforce age-and sex-specific cut-off values for children 2-18 years of age [33]; underweight (adult BMI <18.5kg/m2), normal weight (adult BMI ≥18.5-<25kg/m2), overweight including obesity (adult BMI ≥25 kg/m2)

Adol
esce
nt b
ody
com
posit
ion,
and
ass
ocia
tions
with
bod
y si
ze a
nd g
row
th fr
om b
irth
to la
te a
dole
scen
ce. T
he T
rom
sø S
tudy
: Fit
Futu
res –
a N
orwe
gian
long
itudi
nal c
ohor
t stu
dy.
Elin
Eve
nsen
* , Nin
a Em
aus,
Ann
e-So
fie F
urbe
rg, A
ne K
okkv
oll,
Jona
than
Wel
ls, T
om W
ilsga
ard,
Ann
e W
inth
er, G
uri S
keie
* D
epar
tmen
t of C
linic
al R
esea
rch,
Uni
vers
ity H
ospi
tal o
f Nor
th N
orw
ay, T
rom
sø, N
orw
ay. D
epar
tmen
t of H
ealth
and
Car
e Sc
ienc
es, F
acul
ty o
f Hea
lth S
cien
ces,
UiT
The
Arc
tic U
nive
rsity
of
Nor
way
, Tro
msø
, Nor
way
elin
.eve
nsen
@un
n.no
Ta
ble
S3 R
egre
ssio
n co
effic
ient
s for
ass
ocia
tions
of c
ondi
tiona
l BM
I gai
n be
twee
n bi
rth, 2
.5, 6
.0, a
nd 1
6.5
year
s of a
ge w
ith fa
t mas
s ind
ex S
DS,
fat-f
ree
mas
s in
dex
SDS
and
andr
oid:
gyno
id fa
t mas
s rat
io a
t 15-
20 y
ears
of a
ge in
girl
s and
boy
s, Th
e Tr
omsø
Stu
dy: F
it Fu
ture
s G
IRL
S
FMI S
DS a
FF
MI S
DS a
A
ndro
id:g
ynoi
d FM
R
Birt
h to
2.5
yea
rs o
f age
0.
28 (0
.24,
0.3
2) *
**
0.26
(0.2
0, 0
.32)
***
0.
02 (0
.01,
0.0
2) *
**
2.5
to 6
.0 y
ears
of a
ge
0.42
(0.3
8, 0
.46)
***
0.
31 (0
.25,
0.3
7) *
**
0.03
(0.0
2, 0
.03)
***
6.
0 to
16.
5 ye
ars o
f age
0.
67 (0
.63,
0.7
1) *
**
0.46
(0.3
9, 0
.52)
***
0.
05 (0
.05,
0.0
6) *
**
BO
YS
Birt
h to
2.5
yea
rs o
f age
0.
21 (0
.15,
0.2
7) *
**
0.24
(0.1
8, 0
.30)
***
0.
01 (0
.00,
0.0
2) *
*
2.
5 to
6.0
yea
rs o
f age
0.
40 (0
.34,
0.4
5) *
**
0.34
(0.2
7, 0
.40)
***
0.
03 (0
.03,
0.0
4) *
**
6.0
to 1
6.5
year
s of a
ge
0.80
(0.7
5, 0
.86)
***
0.
49 (0
.43,
0.5
5) *
**
0.06
(0.0
6, 0
.07)
***
V
alue
s are
bas
ed o
n lin
ear m
ixed
mod
els a
nd re
flect
s β c
oeffi
cien
ts (9
5% C
I) p
er st
anda
rdiz
ed re
sidua
l of c
ondi
tiona
lly m
odel
led
gain
in B
MI S
DS.
Con
ditio
nal g
row
th v
aria
bles
are
in
depe
nden
t of e
arlie
r bod
y siz
e. M
odel
s are
adj
uste
d fo
r ges
tatio
nal a
ge, p
uber
tal m
atur
atio
n an
d ph
ysic
al a
ctiv
ity fr
eque
ncy.
A
naly
sed
in a
dat
aset
with
20
impu
tatio
ns (m
ultip
le im
puta
tion
of m
issi
ng c
o-va
riate
s at b
irth
and
at 1
6.5
year
s of a
ge),
n=90
7 (4
39 g
irls a
nd 4
68 b
oys)
a F
at m
ass i
ndex
and
Fat
-fre
e m
ass i
ndex
SD
S ac
cord
ing
to U
K R
efer
ence
dat
a [1
0]
CI,
Con
fiden
ce in
terv
al; F
MI,
fat m
ass i
ndex
(kg/
m2 );
FFM
I, fa
t-fre
e m
ass i
ndex
(kg/
m2 );
FMR,
fat m
ass r
atio
; SD
S, st
anda
rd d
evia
tion
scor
e **
p<0
.01,
*** p
<0.0
01
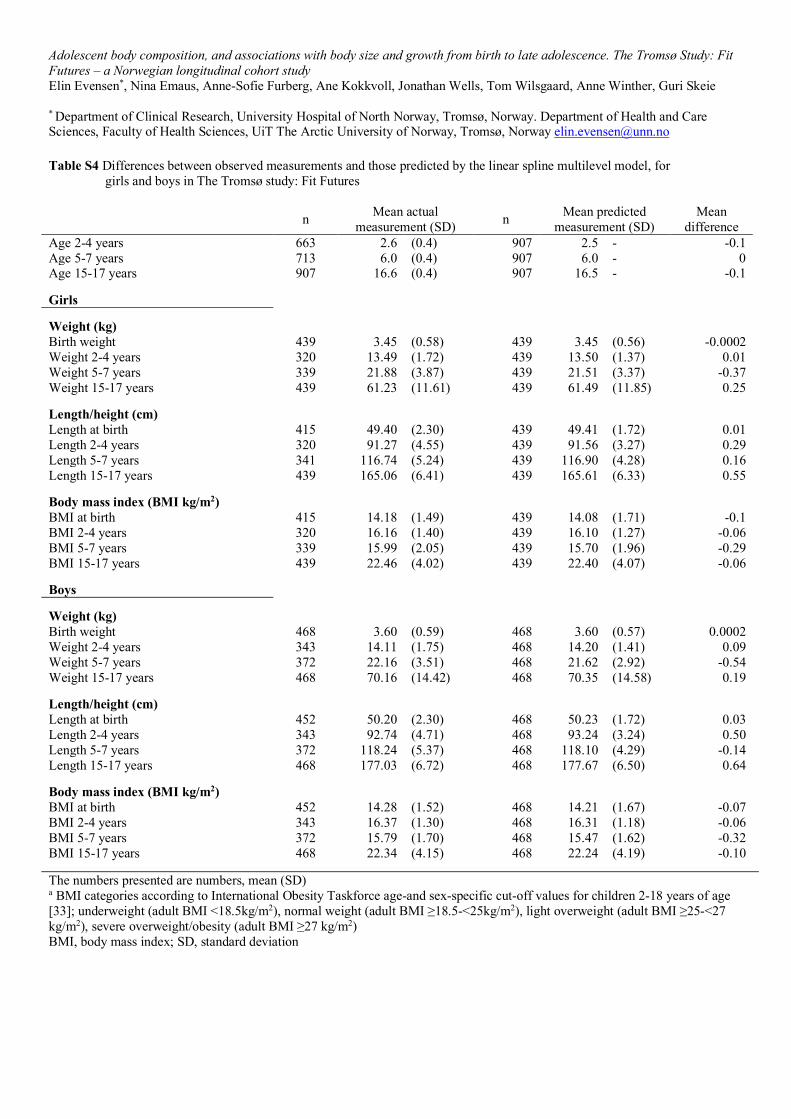
Adolescent body composition, and associations with body size and growth from birth to late adolescence. The Tromsø Study: Fit Futures – a Norwegian longitudinal cohort study Elin Evensen*, Nina Emaus, Anne-Sofie Furberg, Ane Kokkvoll, Jonathan Wells, Tom Wilsgaard, Anne Winther, Guri Skeie
* Department of Clinical Research, University Hospital of North Norway, Tromsø, Norway. Department of Health and Care Sciences, Faculty of Health Sciences, UiT The Arctic University of Norway, Tromsø, Norway [email protected] Table S4 Differences between observed measurements and those predicted by the linear spline multilevel model, for
girls and boys in The Tromsø study: Fit Futures
n Mean actual measurement (SD) n Mean predicted
measurement (SD) Mean
difference Age 2-4 years 663 2.6 (0.4) 907 2.5 - -0.1 Age 5-7 years 713 6.0 (0.4) 907 6.0 - 0 Age 15-17 years 907 16.6 (0.4) 907 16.5 - -0.1 Girls Weight (kg) Birth weight 439 3.45 (0.58) 439 3.45 (0.56) -0.0002 Weight 2-4 years 320 13.49 (1.72) 439 13.50 (1.37) 0.01 Weight 5-7 years 339 21.88 (3.87) 439 21.51 (3.37) -0.37 Weight 15-17 years 439 61.23 (11.61) 439 61.49 (11.85) 0.25
Length/height (cm) Length at birth 415 49.40 (2.30) 439 49.41 (1.72) 0.01 Length 2-4 years 320 91.27 (4.55) 439 91.56 (3.27) 0.29 Length 5-7 years 341 116.74 (5.24) 439 116.90 (4.28) 0.16 Length 15-17 years 439 165.06 (6.41) 439 165.61 (6.33) 0.55
Body mass index (BMI kg/m2) BMI at birth 415 14.18 (1.49) 439 14.08 (1.71) -0.1 BMI 2-4 years 320 16.16 (1.40) 439 16.10 (1.27) -0.06 BMI 5-7 years 339 15.99 (2.05) 439 15.70 (1.96) -0.29 BMI 15-17 years 439 22.46 (4.02) 439 22.40 (4.07) -0.06
Boys
Weight (kg) Birth weight 468 3.60 (0.59) 468 3.60 (0.57) 0.0002 Weight 2-4 years 343 14.11 (1.75) 468 14.20 (1.41) 0.09 Weight 5-7 years 372 22.16 (3.51) 468 21.62 (2.92) -0.54 Weight 15-17 years 468 70.16 (14.42) 468 70.35 (14.58) 0.19
Length/height (cm) Length at birth 452 50.20 (2.30) 468 50.23 (1.72) 0.03 Length 2-4 years 343 92.74 (4.71) 468 93.24 (3.24) 0.50 Length 5-7 years 372 118.24 (5.37) 468 118.10 (4.29) -0.14 Length 15-17 years 468 177.03 (6.72) 468 177.67 (6.50) 0.64
Body mass index (BMI kg/m2) BMI at birth 452 14.28 (1.52) 468 14.21 (1.67) -0.07 BMI 2-4 years 343 16.37 (1.30) 468 16.31 (1.18) -0.06 BMI 5-7 years 372 15.79 (1.70) 468 15.47 (1.62) -0.32 BMI 15-17 years 468 22.34 (4.15) 468 22.24 (4.19) -0.10 The numbers presented are numbers, mean (SD) a BMI categories according to International Obesity Taskforce age-and sex-specific cut-off values for children 2-18 years of age [33]; underweight (adult BMI <18.5kg/m2), normal weight (adult BMI ≥18.5-<25kg/m2), light overweight (adult BMI ≥25-<27 kg/m2), severe overweight/obesity (adult BMI ≥27 kg/m2) BMI, body mass index; SD, standard deviation
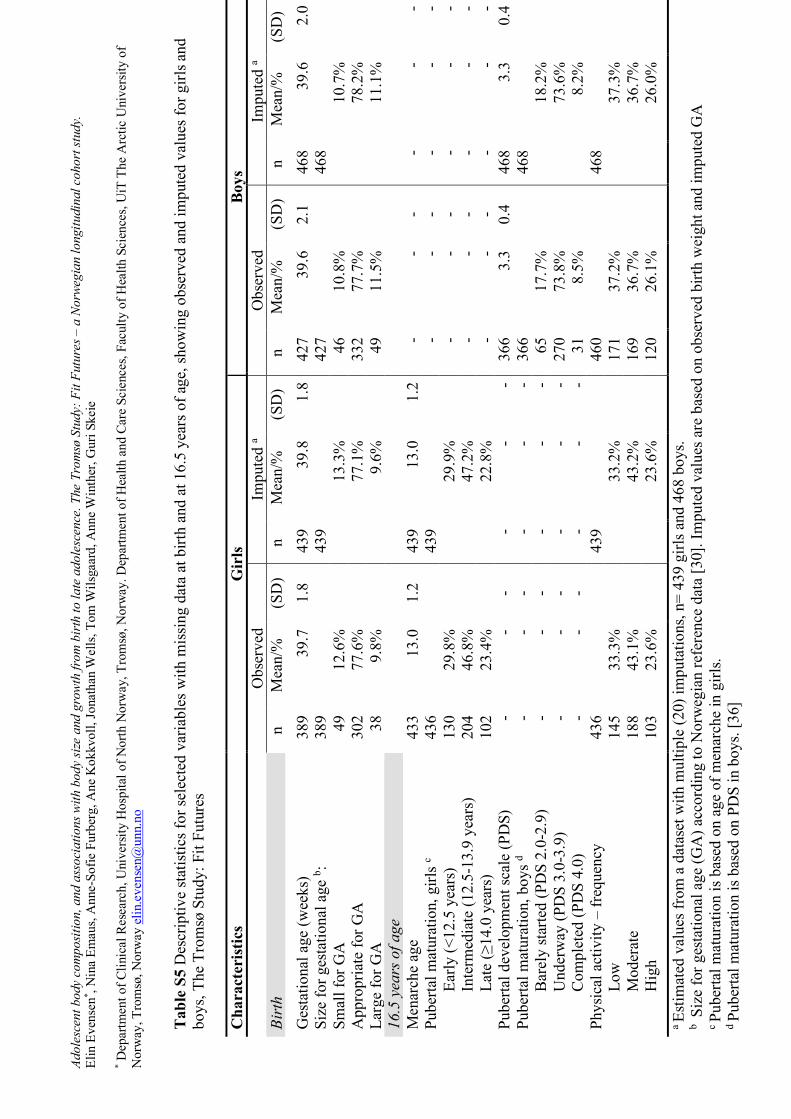
Adol
esce
nt b
ody
com
posit
ion,
and
ass
ocia
tions
with
bod
y si
ze a
nd g
row
th fr
om b
irth
to la
te a
dole
scen
ce. T
he T
rom
sø S
tudy
: Fit
Futu
res –
a N
orwe
gian
long
itudi
nal c
ohor
t stu
dy.
Elin
Eve
nsen
* , Nin
a Em
aus,
Ann
e-So
fie F
urbe
rg, A
ne K
okkv
oll,
Jona
than
Wel
ls, T
om W
ilsga
ard,
Ann
e W
inth
er, G
uri S
keie
* Dep
artm
ent o
f Clin
ical
Res
earc
h, U
nive
rsity
Hos
pita
l of N
orth
Nor
way
, Tro
msø
, Nor
way
. Dep
artm
ent o
f Hea
lth a
nd C
are
Scie
nces
, Fac
ulty
of H
ealth
Sci
ence
s, U
iT T
he A
rctic
Uni
vers
ity o
f N
orw
ay, T
rom
sø, N
orw
ay e
lin.e
vens
en@
unn.
no
Tabl
e S5
Des
crip
tive
stat
istic
s for
sele
cted
var
iabl
es w
ith m
issi
ng d
ata
at b
irth
and
at 1
6.5
year
s of a
ge, s
how
ing
obse
rved
and
impu
ted
valu
es fo
r girl
s and
bo
ys, T
he T
rom
sø S
tudy
: Fit
Futu
res
C
hara
cter
istic
s G
irls
Boys
Obs
erve
d
Impu
ted
a O
bser
ved
Impu
ted
a Bi
rth
n M
ean/
%
(SD
) n
Mea
n/%
(S
D)
n M
ean/
%
(SD
) n
Mea
n/%
(S
D)
G
esta
tiona
l age
(wee
ks)
389
39.7
1.
8 43
9 39
.8
1.8
427
39.6
2.
1 46
8 39
.6
2.0
Size
for g
esta
tiona
l age
b : 38
9
43
9
42
7
46
8
Sm
all f
or G
A
49
12.6
%
13.3
%
46
10
.8%
10
.7%
App
ropr
iate
for G
A
302
77.6
%
77.1
%
33
2 77
.7%
78
.2%
Larg
e fo
r GA
38
9.
8%
9.6%
49
11.5
%
11.1
%
16
.5 y
ears
of a
ge
Men
arch
e ag
e 43
3 13
.0
1.2
439
13.0
1.
2 -
- -
- -
- Pu
berta
l mat
urat
ion,
girl
s c 43
6
43
9
-
- -
- -
- Ea
rly (<
12.5
yea
rs)
130
29.8
%
29.9
%
-
- -
- -
- In
term
edia
te (1
2.5-
13.9
yea
rs)
204
46.8
%
47.2
%
-
- -
- -
- La
te (≥
14.0
yea
rs)
102
23.4
%
22.8
%
-
- -
- -
- Pu
berta
l dev
elop
men
t sca
le (P
DS)
-
- -
- -
- 36
6 3.
3 0.
4 46
8 3.
3 0.
4 Pu
berta
l mat
urat
ion,
boy
s d -
- -
- -
- 36
6
46
8
B
arel
y st
arte
d (P
DS
2.0-
2.9)
-
- -
- -
- 65
17
.7%
18
.2%
Und
erw
ay (P
DS
3.0-
3.9)
-
- -
- -
- 27
0 73
.8%
73
.6%
Com
plet
ed (P
DS
4.0)
-
- -
- -
- 31
8.
5%
8.2%
Phys
ical
act
ivity
– fr
eque
ncy
436
439
460
468
Low
14
5 33
.3%
33
.2%
171
37.2
%
37.3
%
M
oder
ate
188
43.1
%
43.2
%
16
9 36
.7%
36
.7%
Hig
h 10
3 23
.6%
23
.6%
120
26.1
%
26.0
%
a Es
timat
ed v
alue
s fro
m a
dat
aset
with
mul
tiple
(20)
impu
tatio
ns, n
= 43
9 gi
rls a
nd 4
68 b
oys.
b S
ize
for g
esta
tiona
l age
(GA
) acc
ordi
ng to
Nor
weg
ian
refe
renc
e da
ta [3
0]. I
mpu
ted
valu
es a
re b
ased
on
obse
rved
birt
h w
eigh
t and
impu
ted
GA
c Pu
berta
l mat
urat
ion
is b
ased
on
age
of m
enar
che
in g
irls.
d Pu
berta
l mat
urat
ion
is b
ased
on
PDS
in b
oys.
[36]

Adolescent body composition, and associations with body size and growth from birth to late adolescence. The Tromsø Study: Fit Futures – a Norwegian longitudinal cohort study. Elin Evensen*, Nina Emaus, Anne-Sofie Furberg, Ane Kokkvoll, Jonathan Wells, Tom Wilsgaard, Anne Winther, Guri Skeie
* Department of Clinical Research, University Hospital of North Norway, Tromsø, Norway. Department of Health and Care Sciences, Faculty of Health Sciences, UiT The Arctic University of Norway, Tromsø, Norway [email protected] Table S6 Differences between complete cases and participants with missing birth weight
and/or childhood BMI, girls and boys in The Tromsø study: Fit Futures Complete cases
n=633
Missing birth weight/ childhood BMI
n= 322
Mean difference p-value a
Girls TFF1 Missing: no/yes 306 65.8% 159 34.2% 0.762 b Fat mass index (kg/m2) 7.61 (3.45) 7.31 (2.76) 0.30 0.342 Fat-free mass index (kg/m2) 14.87 (1.41) 14.93 (1.19) -0.06 0.658 Fat mass index SDS 0.23 (0.99) 0.19 (0.84) 0.04 0.689 Fat-free mass index SDS -0.03 (1.01) 0.04 (0.88) -0.06 0.503 Waist circumferrence (cm) 77.56 (10.88) 76.62 (8.54) 0.94 0.343 Android:gynoid fat mass ratio 0.33 (0.09) 0.34 (0.08) -0.003 0.733 TFF2 Missing: no/yes 243 68.3% 113 31.7% 0.714 b Fat mass index (kg/m2) 7.96 (3.67) 7.69 (2.77) 0.27 0.494 Fat-free mass index (kg/m2) 15.07 (1.44) 15.18 (1.25) -0.11 0.491 Fat mass index SDS 0.20 (1.12) 0.20 (0.88) -0.0003 0.998 Fat-free mass index SDS 0.08 (1.00) 0.17 (0.92) -0.10 0.378 Waist circumferrence (cm) 77.98 (11.69) 77.59 (10.42) 0.38 0.765 Android:gynoid fat mass ratio 0.35 (0.10) 0.36 (0.09) -0.006 0.594 Boys TFF1 Missing: no/yes 327 66.7% 163 33.3% 0.762 b Fat mass index (kg/m2) 4.55 (3.43) 4.88 (3.32) -0.33 0.313 Fat-free mass index (kg/m2) 17.62 (1.70) 17.85 (1.59) -0.23 0.149 Fat mass index SDS 0.01 1.16 0.16 1.14 -0.15 0.169 Fat-free mass index SDS -0.12 (0.98) 0.02 (0.91) -0.14 0.116 Waist circumferrence (cm) 81.69 (11.45) 82.37 (11.07 -0.67 0.537 Android:gynoid fat mass ratio 0.38 (0.11) 0.38 (0.11) -0.006 0.557 TFF2 Missing: no/yes 206 69.6% 90 30.4% 0.714 b Fat mass index (kg/m2) 4.94 (3.42) 5.75 (3.73) -0.81 0.068 Fat-free mass index (kg/m2) 18.13 (1.83) 18.46 (1.60) -0.34 0.134 Fat mass index SDS -0.07 (1.19) 0.20 (1.19) -0.27 0.075 Fat-free mass index SDS -0.20 (1.10) 0.01 (0.97) -0.21 0.123 Waist circumferrence (cm) 84.04 (11.60) 86.11 (12.10) -2.07 0.164 Android:gynoid fat mass ratio 0.43 (0.11) 0.43 (0.11) -0.005 0.731 Values reported are mean (SD) or number and % n= 955, 465 girls, 490 boys with data from TFF1, 356 girls and 296 boys with data from TFF2. a p-values are obtained by two-samples t-test. b Sex difference in missing between girls and boys obtained by Chi-square test. BMI, body mass index; SDS, standard deviation scores; TFF1, The Tromsø study: Fit Futures 1; TFF2, The Tromsø study: Fit Futures 2


![Human Body Shape Modeling Using 3D Range Data for ...HBSM, for instance, woman body attractiveness [10], or adolescent body perception [1]. Various methods and tools are used in HBSM](https://static.fdocuments.us/doc/165x107/5e8d15a8bdc046461504bcde/human-body-shape-modeling-using-3d-range-data-for-hbsm-for-instance-woman.jpg)


