Adobe Digital Index: Europe's Best Of The Best
42
Best of the Best Benchmark Adobe Digital Index | Europe | 2014
Transcript of Adobe Digital Index: Europe's Best Of The Best

Best of the Best Benchmark Adobe Digital Index | Europe | 2014
ADOBE DIGITAL INDEX | Europe Best of the Best
ADOBE DIGITAL INDEX
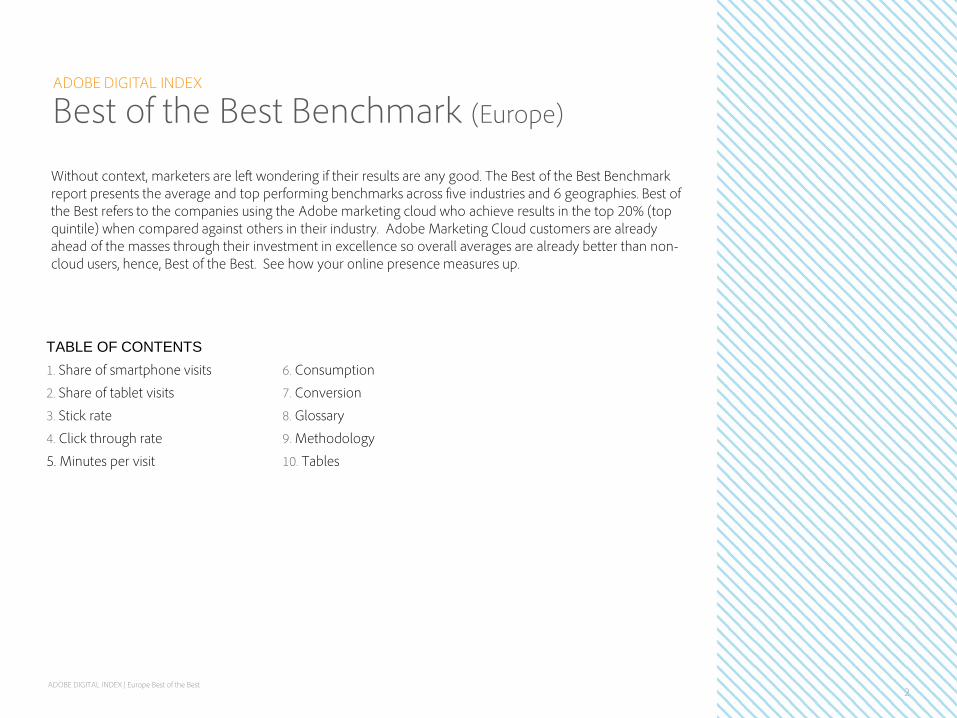
Best of the Best Benchmark (Europe)
Without context, marketers are left wondering if their results are any good. The Best of the Best Benchmark report presents the average and top performing benchmarks across five industries and 6 geographies. Best of the Best refers to the companies using the Adobe marketing cloud who achieve results in the top 20% (top quintile) when compared against others in their industry. Adobe Marketing Cloud customers are already ahead of the masses through their investment in excellence so overall averages are already better than non-cloud users, hence, Best of the Best. See how your online presence measures up.
2
TABLE OF CONTENTS 1. Share of smartphone visits
2. Share of tablet visits
3. Stick rate
4. Click through rate
5. Minutes per visit
6. Consumption
7. Conversion
8. Glossary
9. Methodology
10. Tables
ADOBE DIGITAL INDEX | Europe Best of the Best
ADOBE DIGITAL INDEX
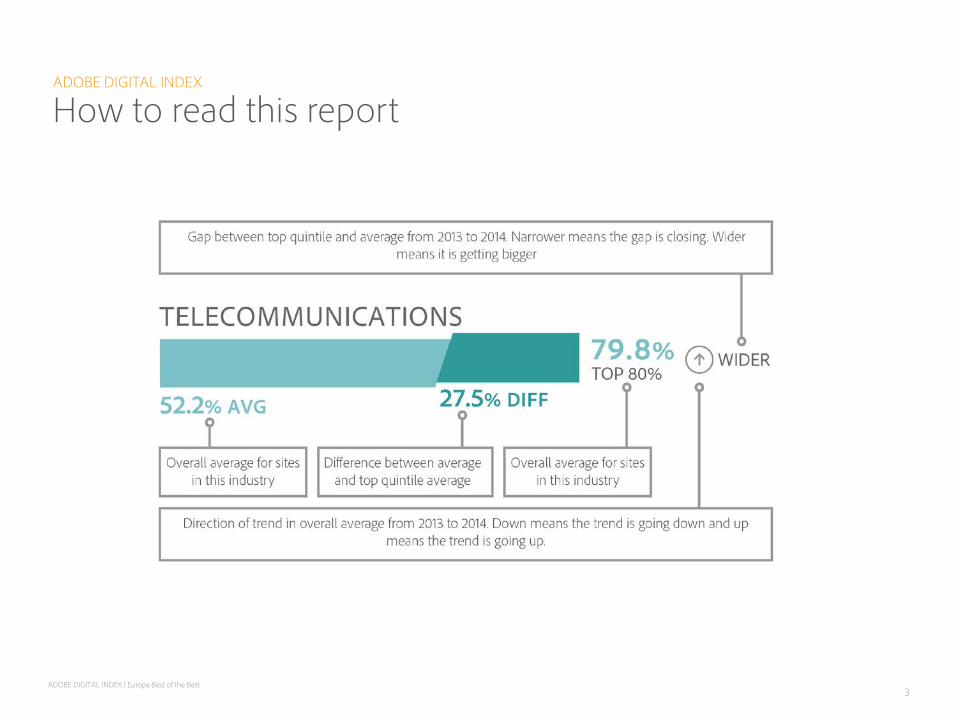
How to read this report
3
ADOBE DIGITAL INDEX | Europe Best of the Best
ADOBE DIGITAL INDEX
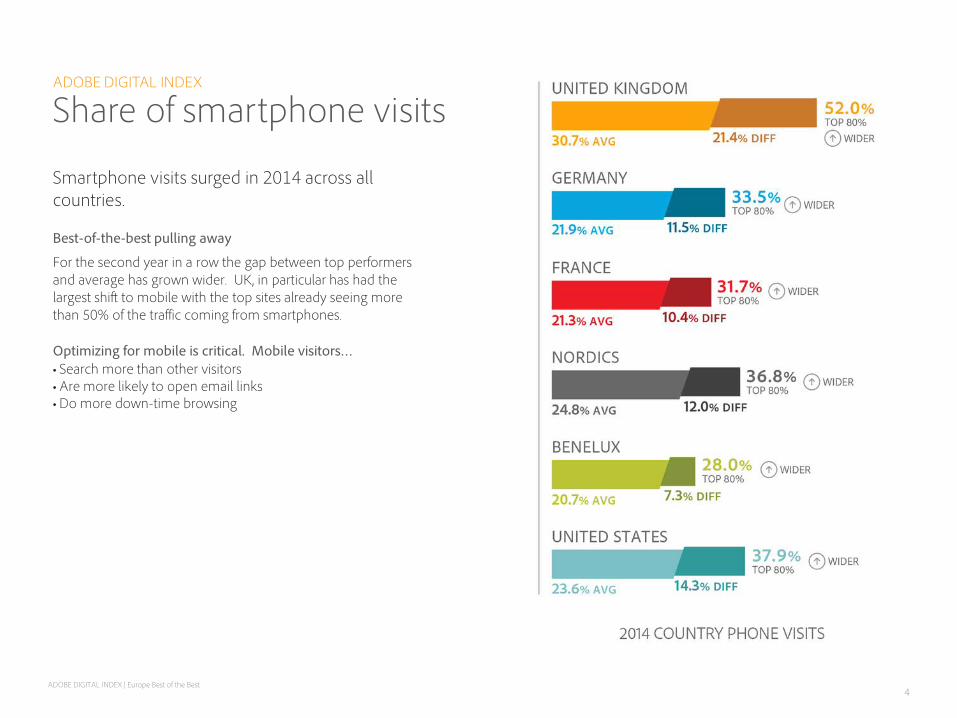
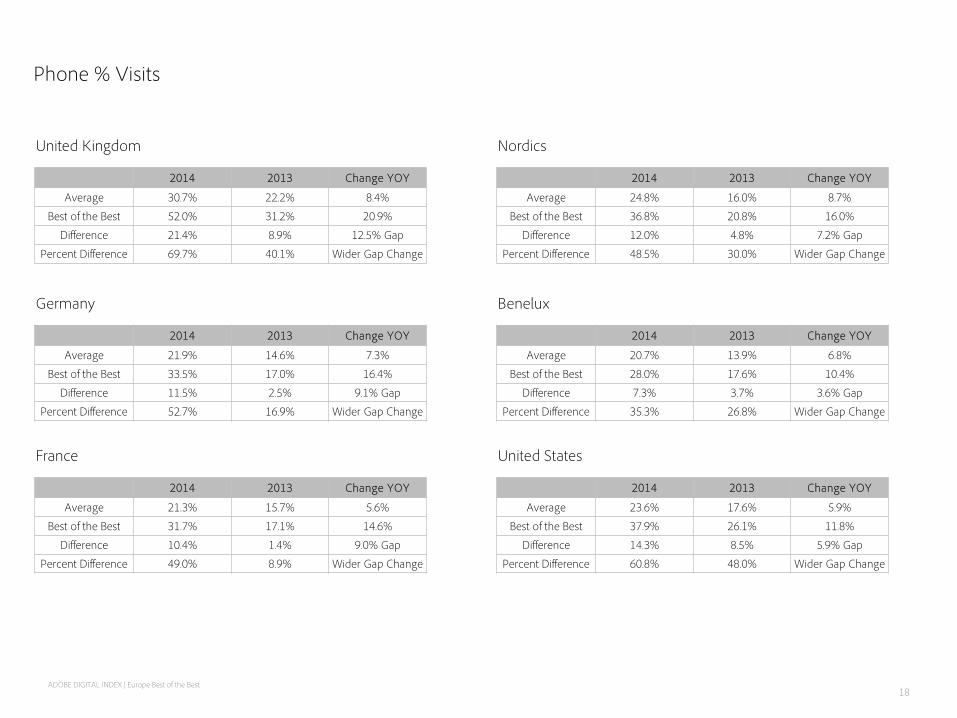
Share of smartphone visits
Smartphone visits surged in 2014 across all countries.
Best-of-the-best pulling away
For the second year in a row the gap between top performers and average has grown wider. UK, in particular has had the largest shift to mobile with the top sites already seeing more than 50% of the traffic coming from smartphones.
Optimizing for mobile is critical. Mobile visitors… • Search more than other visitors • Are more likely to open email links • Do more down-time browsing
4

ADOBE DIGITAL INDEX | Europe Best of the Best
ADOBE DIGITAL INDEX
Share of smartphone visits
• The best-of-the-best in Media & Entertainment continue to see strong usage of smartphones and outperform the masses by 17%.
• Compared to the US, Financial Services in Europe are attracting more smartphone visitors but retail, travel and technology are attracting fewer.
5
ADOBE DIGITAL INDEX | Europe Best of the Best
ADOBE DIGITAL INDEX
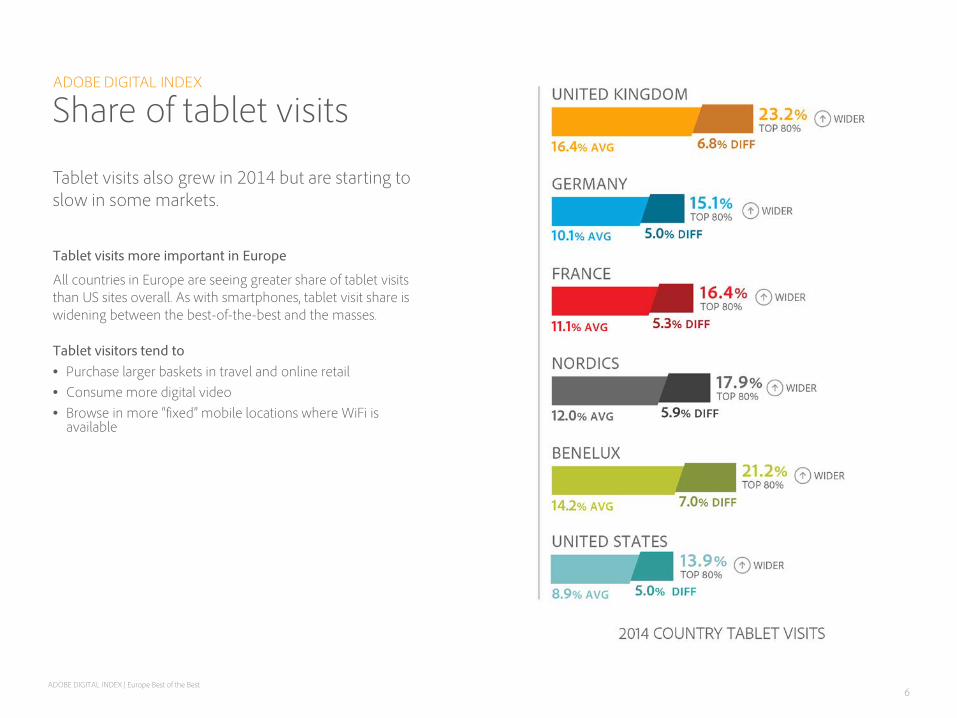
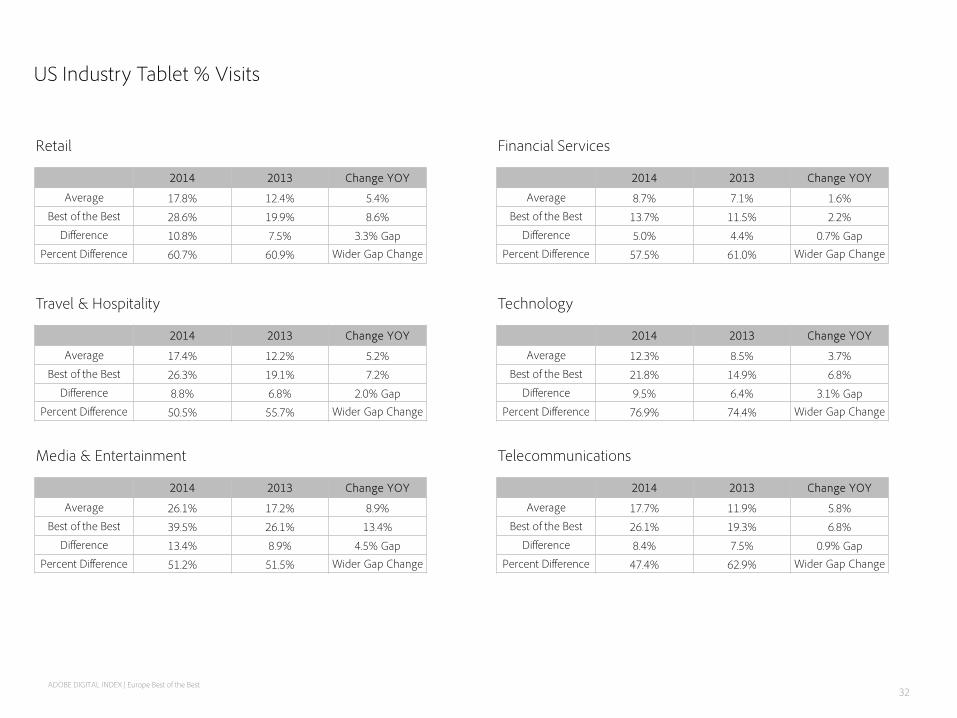
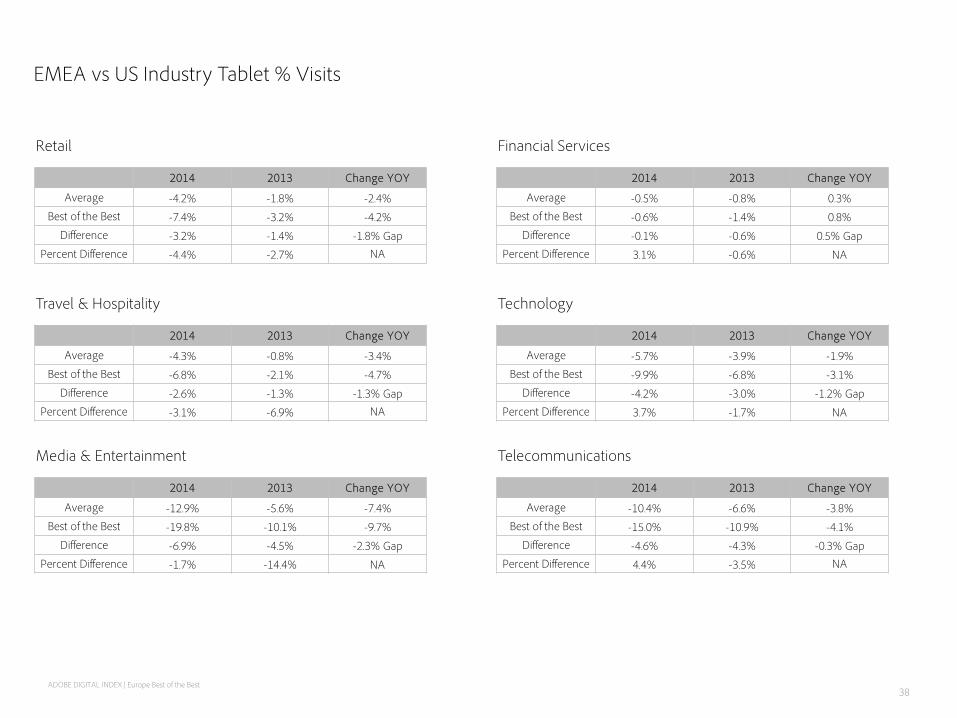
Share of tablet visits
Tablet visits also grew in 2014 but are starting to slow in some markets.
Tablet visits more important in Europe
All countries in Europe are seeing greater share of tablet visits than US sites overall. As with smartphones, tablet visit share is widening between the best-of-the-best and the masses.
Tablet visitors tend to • Purchase larger baskets in travel and online retail • Consume more digital video • Browse in more “fixed” mobile locations where WiFi is
available
6
ADOBE DIGITAL INDEX | Europe Best of the Best
ADOBE DIGITAL INDEX
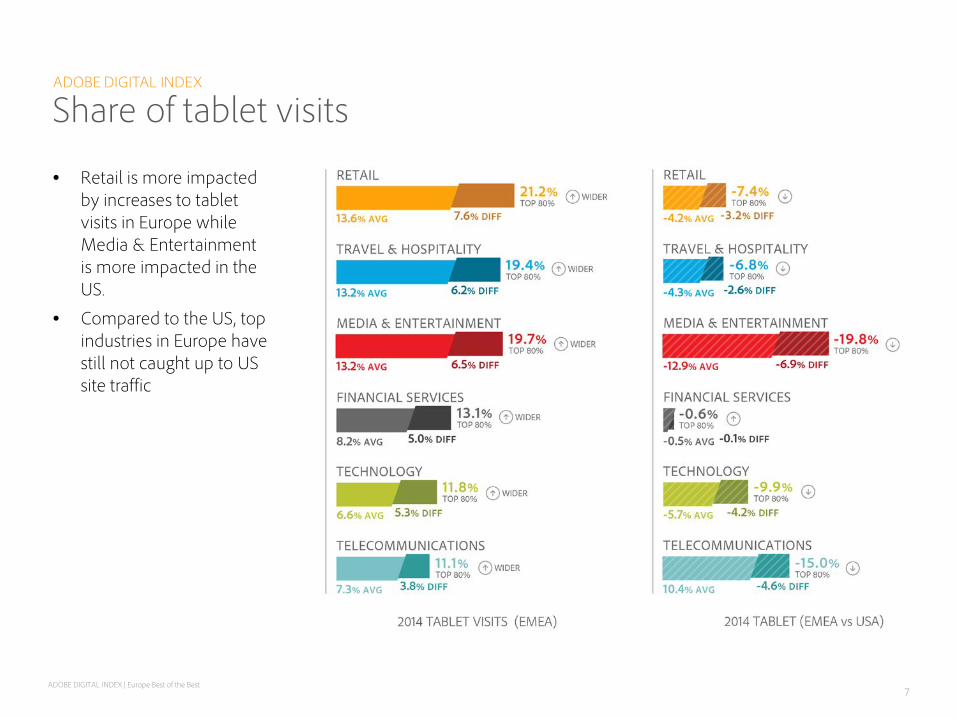
Share of tablet visits
• Retail is more impacted by increases to tablet visits in Europe while Media & Entertainment is more impacted in the US.
• Compared to the US, top industries in Europe have still not caught up to US site traffic
7
ADOBE DIGITAL INDEX | Europe Best of the Best
ADOBE DIGITAL INDEX
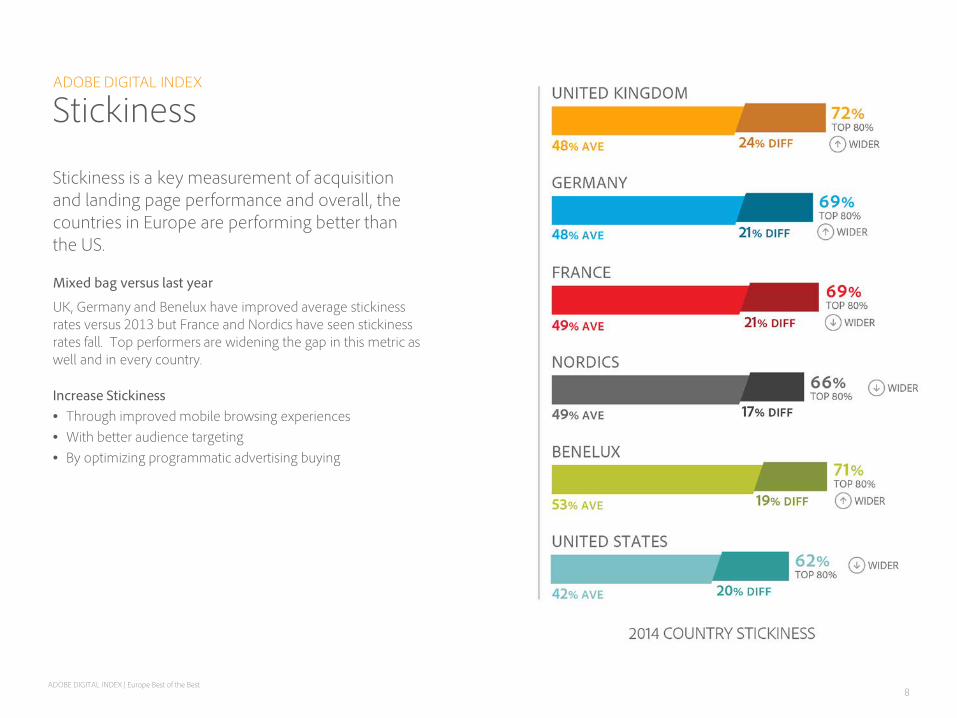
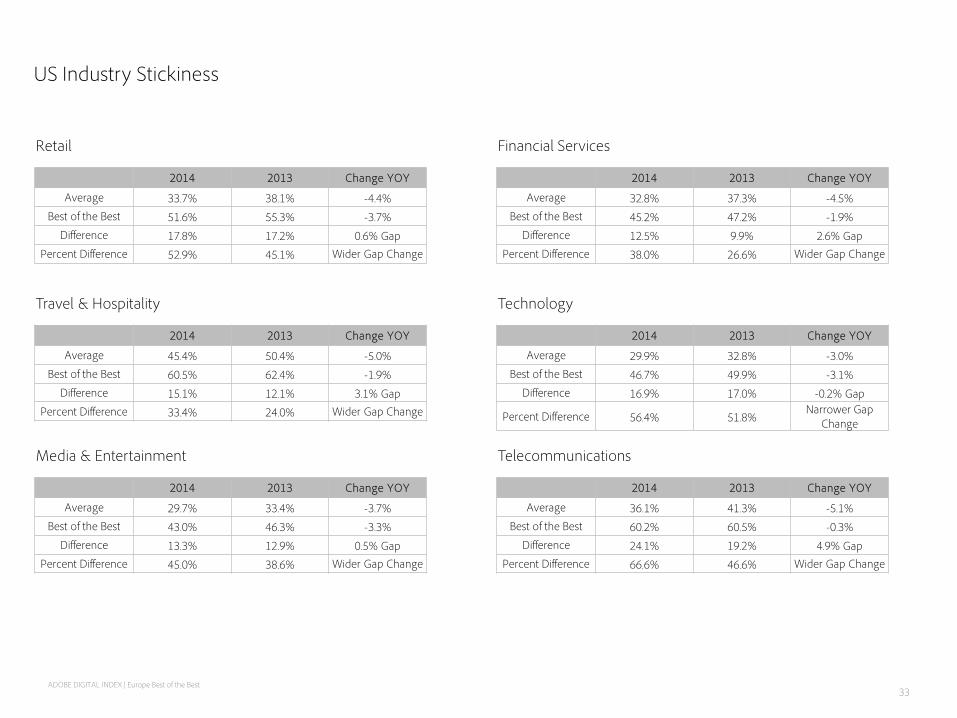
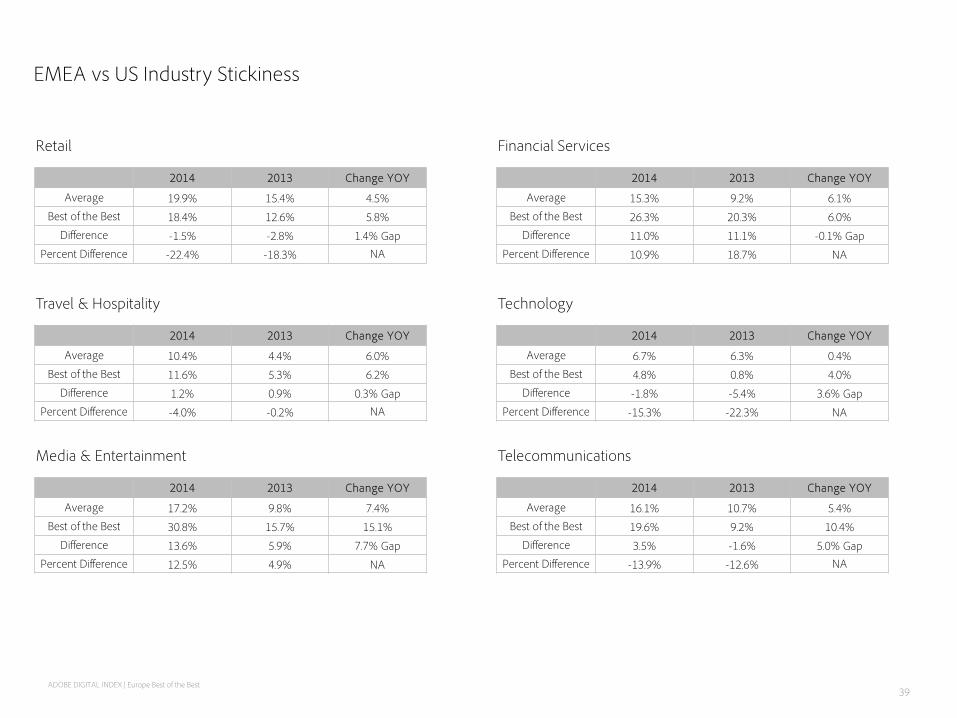
Stickiness
Stickiness is a key measurement of acquisition and landing page performance and overall, the countries in Europe are performing better than the US.
Mixed bag versus last year
UK, Germany and Benelux have improved average stickiness rates versus 2013 but France and Nordics have seen stickiness rates fall. Top performers are widening the gap in this metric as well and in every country.
Increase Stickiness • Through improved mobile browsing experiences • With better audience targeting • By optimizing programmatic advertising buying
8
ADOBE DIGITAL INDEX | Europe Best of the Best
ADOBE DIGITAL INDEX
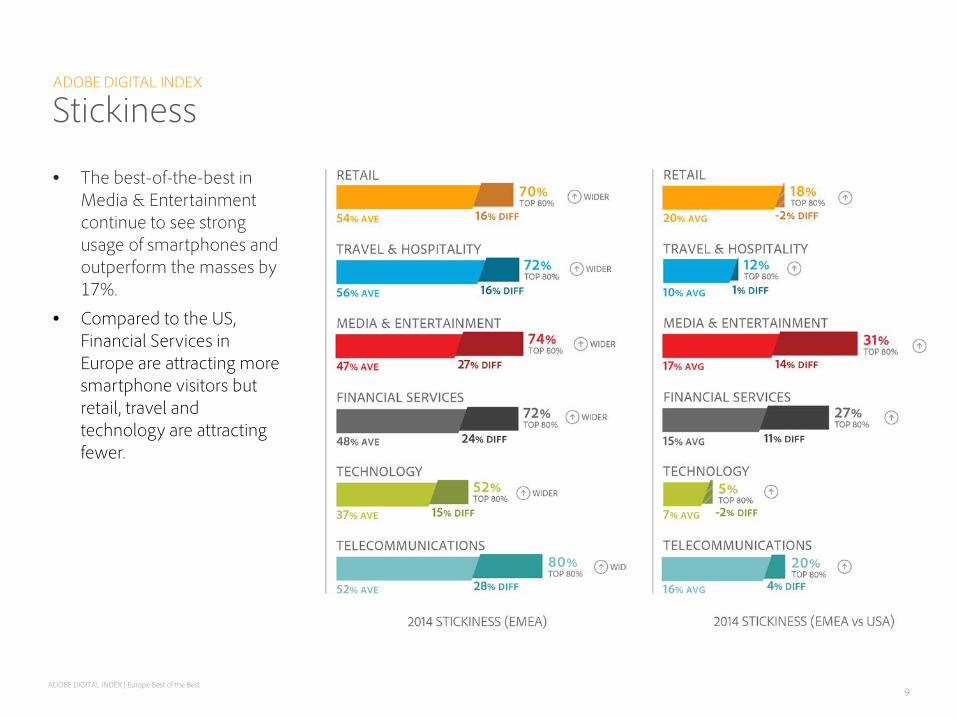
Stickiness
• The best-of-the-best in Media & Entertainment continue to see strong usage of smartphones and outperform the masses by 17%.
• Compared to the US, Financial Services in Europe are attracting more smartphone visitors but retail, travel and technology are attracting fewer.
9
ADOBE DIGITAL INDEX | Europe Best of the Best
ADOBE DIGITAL INDEX
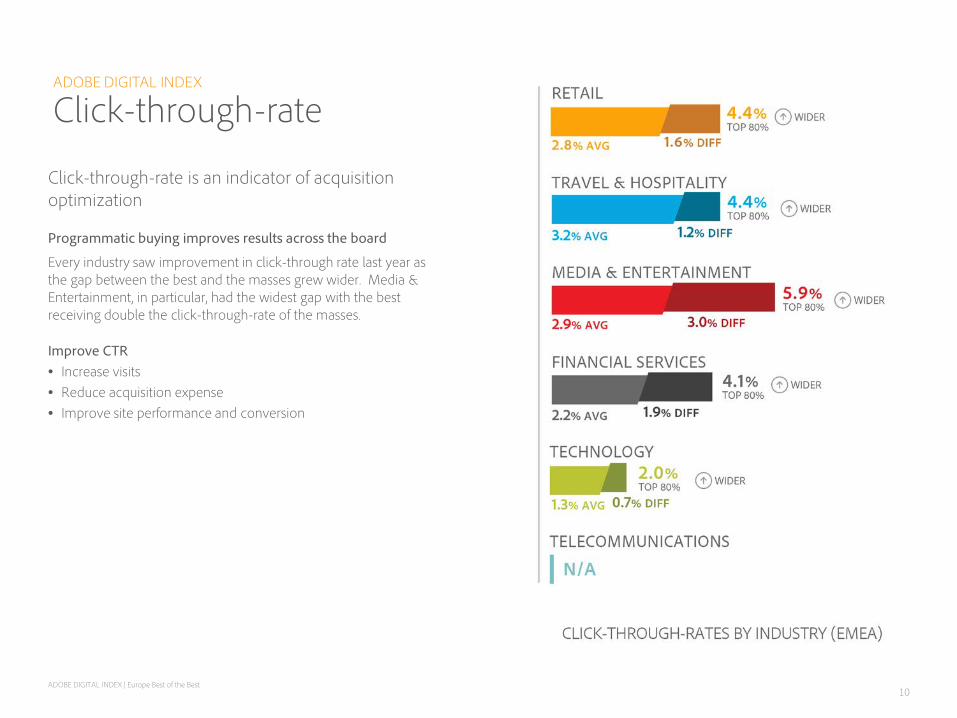
Click-through-rate
Click-through-rate is an indicator of acquisition optimization
Programmatic buying improves results across the board
Every industry saw improvement in click-through rate last year as the gap between the best and the masses grew wider. Media & Entertainment, in particular, had the widest gap with the best receiving double the click-through-rate of the masses.
Improve CTR • Increase visits • Reduce acquisition expense • Improve site performance and conversion
10
ADOBE DIGITAL INDEX | Europe Best of the Best
ADOBE DIGITAL INDEX
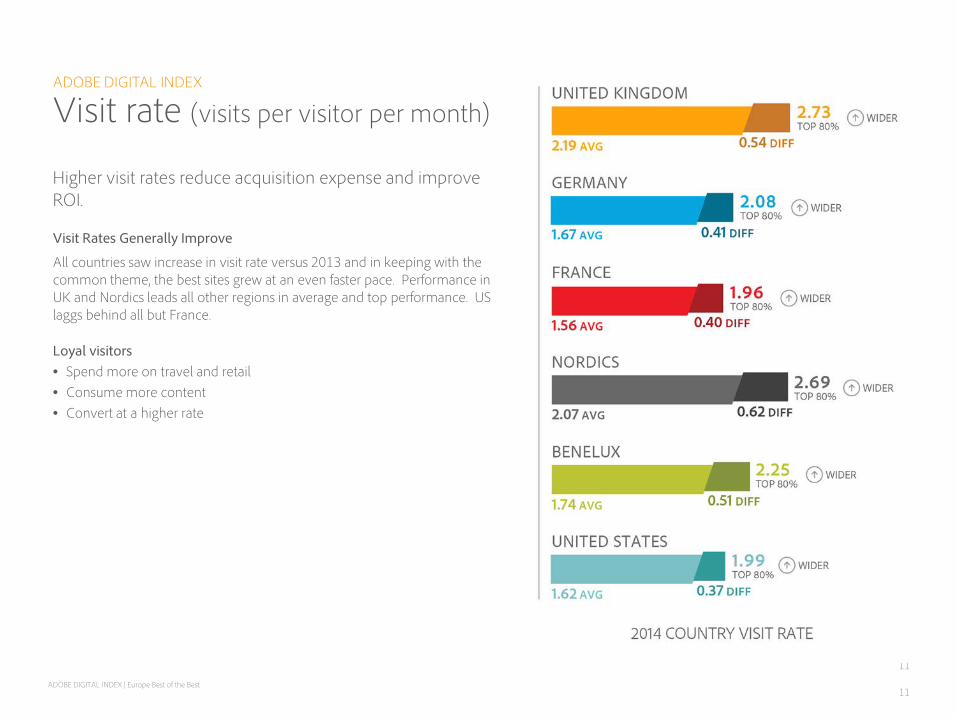
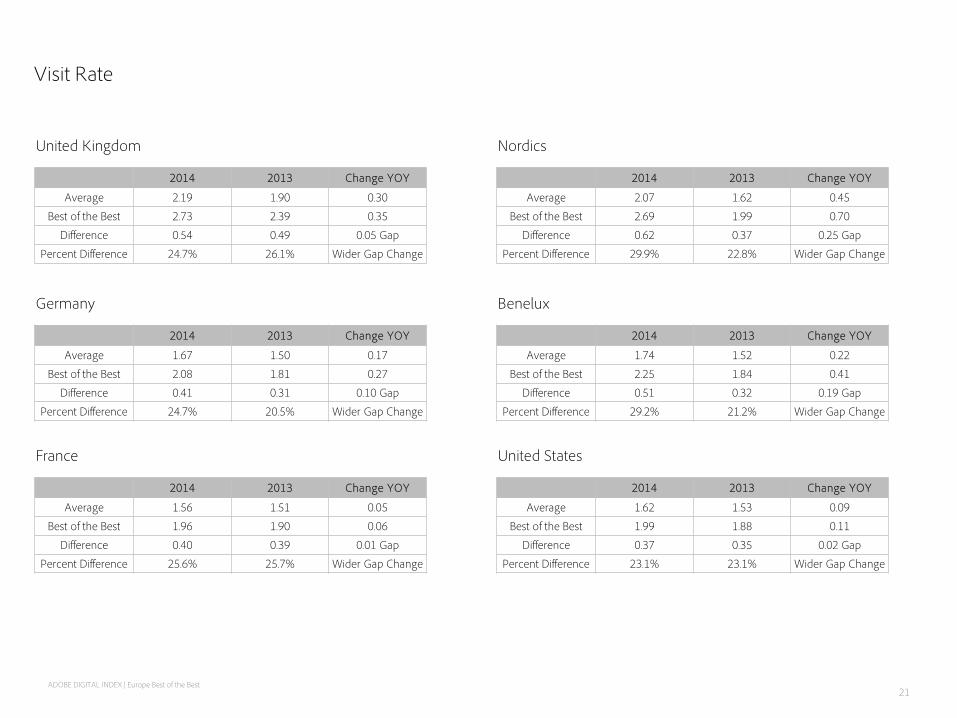
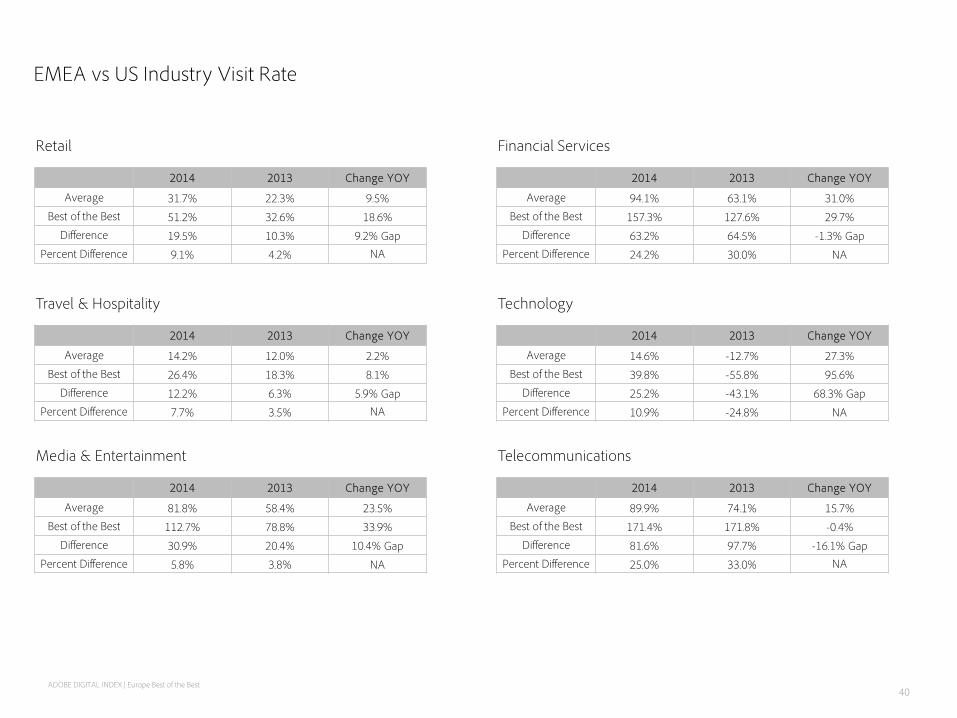
Visit rate (visits per visitor per month)
Higher visit rates reduce acquisition expense and improve ROI.
Visit Rates Generally Improve
All countries saw increase in visit rate versus 2013 and in keeping with the common theme, the best sites grew at an even faster pace. Performance in UK and Nordics leads all other regions in average and top performance. US laggs behind all but France.
Loyal visitors • Spend more on travel and retail • Consume more content • Convert at a higher rate
11
11
ADOBE DIGITAL INDEX | Europe Best of the Best
ADOBE DIGITAL INDEX
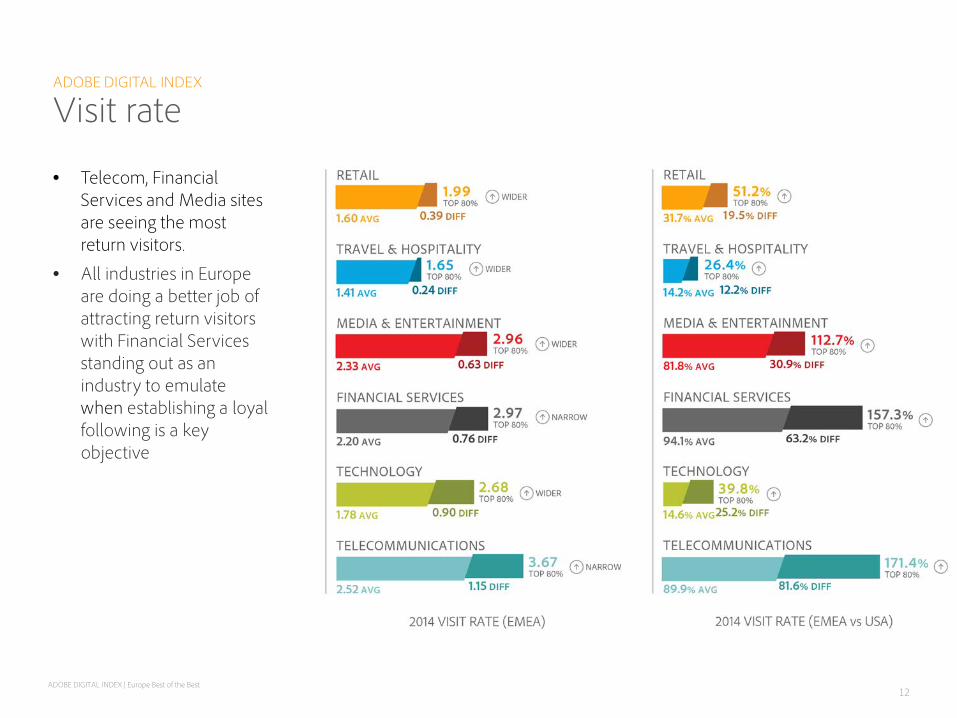
Visit rate
• Telecom, Financial Services and Media sites are seeing the most return visitors.
• All industries in Europe are doing a better job of attracting return visitors with Financial Services standing out as an industry to emulate when establishing a loyal following is a key objective
12
ADOBE DIGITAL INDEX | Europe Best of the Best
ADOBE DIGITAL INDEX
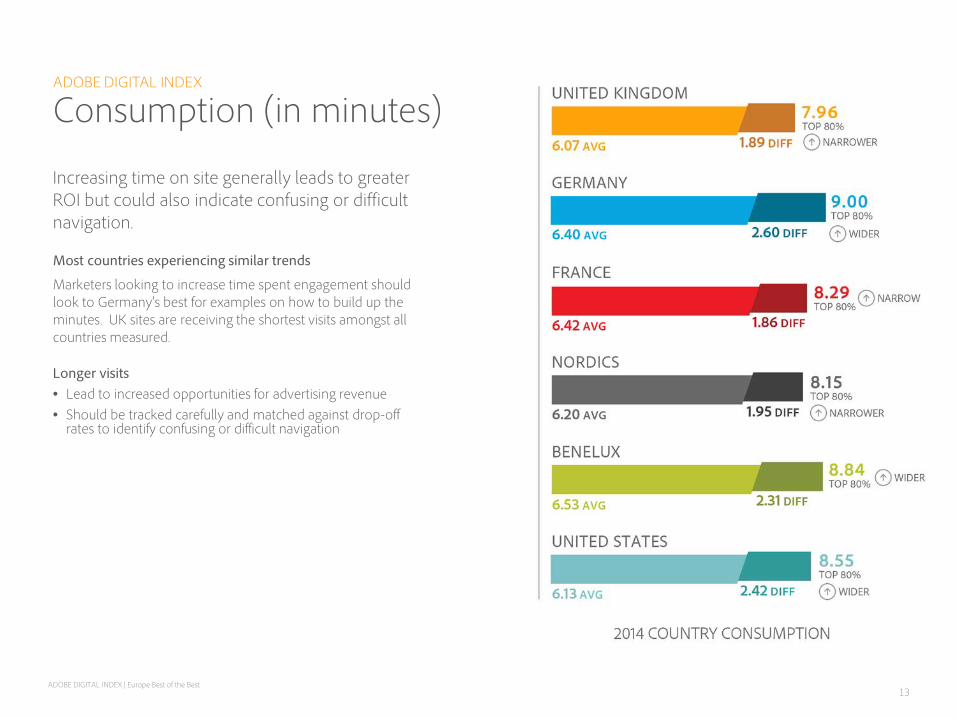
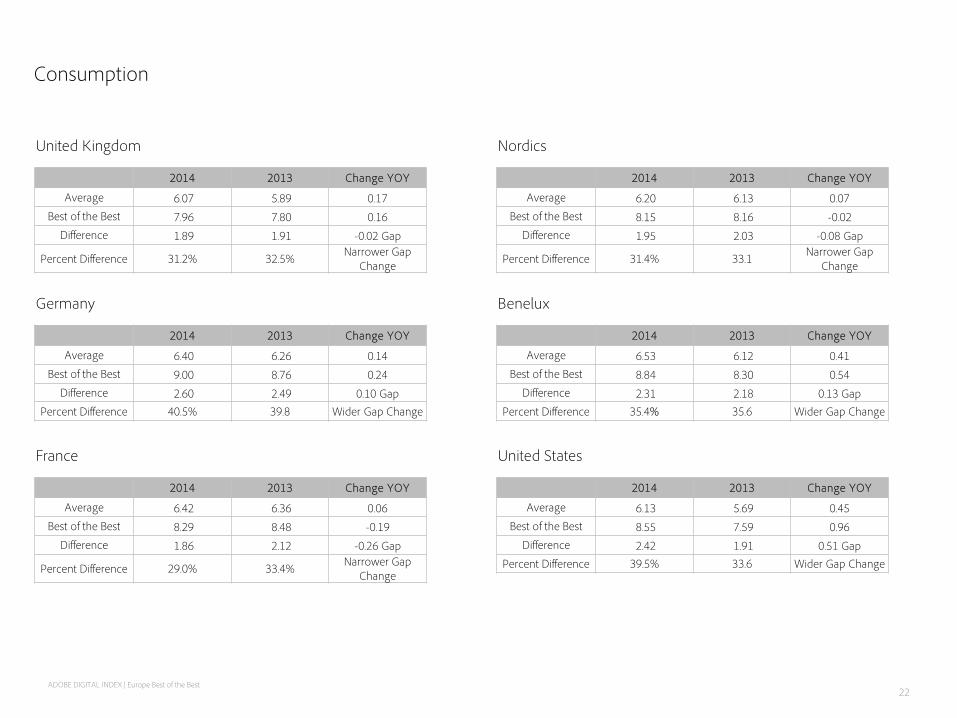
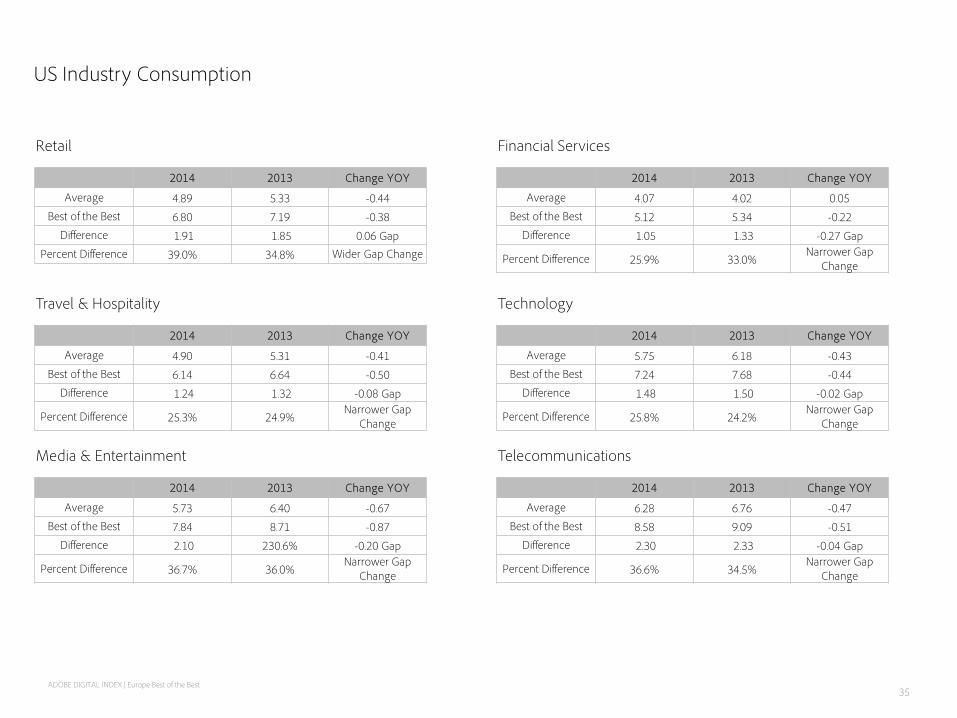
Consumption (in minutes)
Increasing time on site generally leads to greater ROI but could also indicate confusing or difficult navigation.
Most countries experiencing similar trends
Marketers looking to increase time spent engagement should look to Germany’s best for examples on how to build up the minutes. UK sites are receiving the shortest visits amongst all countries measured.
Longer visits • Lead to increased opportunities for advertising revenue • Should be tracked carefully and matched against drop-off
rates to identify confusing or difficult navigation
13
ADOBE DIGITAL INDEX | Europe Best of the Best
ADOBE DIGITAL INDEX
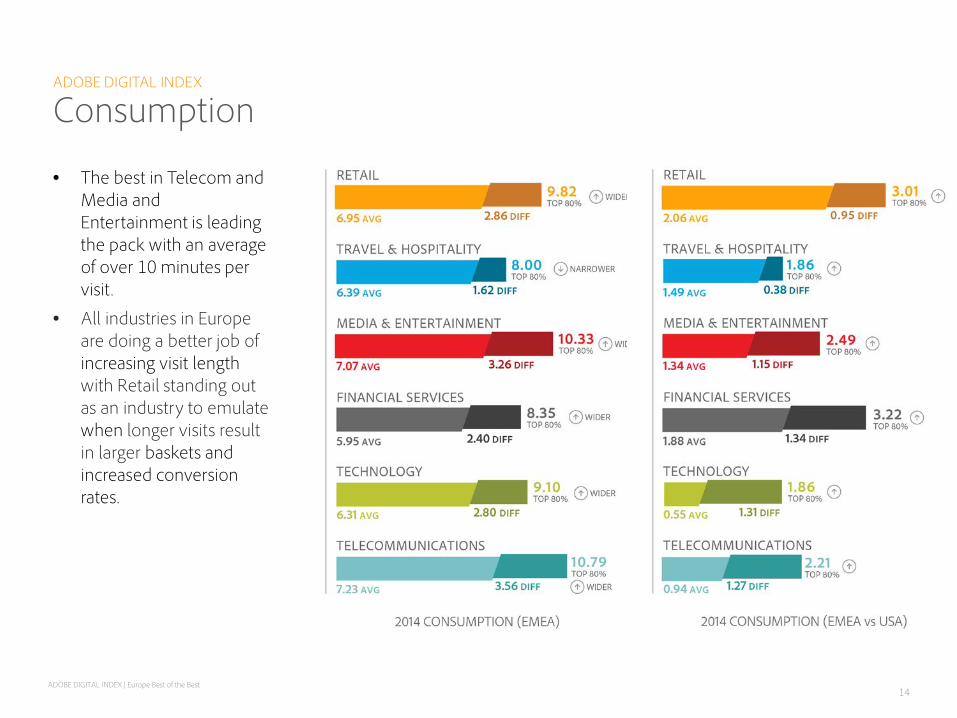
Consumption
• The best in Telecom and Media and Entertainment is leading the pack with an average of over 10 minutes per visit.
• All industries in Europe are doing a better job of increasing visit length with Retail standing out as an industry to emulate when longer visits result in larger baskets and increased conversion rates.
14
ADOBE DIGITAL INDEX | Europe Best of the Best
ADOBE DIGITAL INDEX
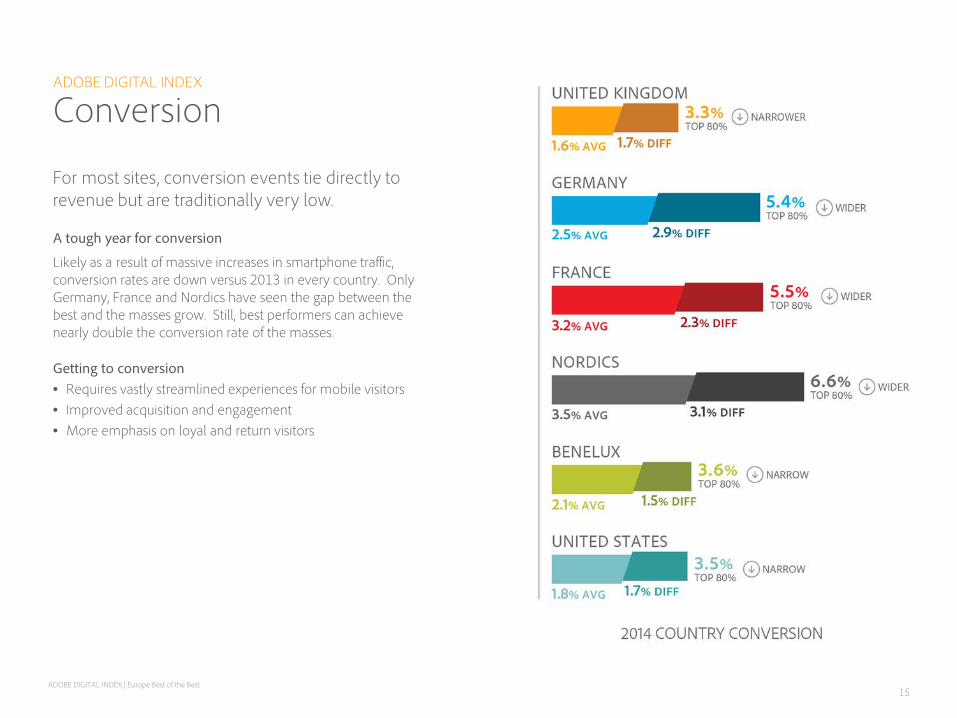
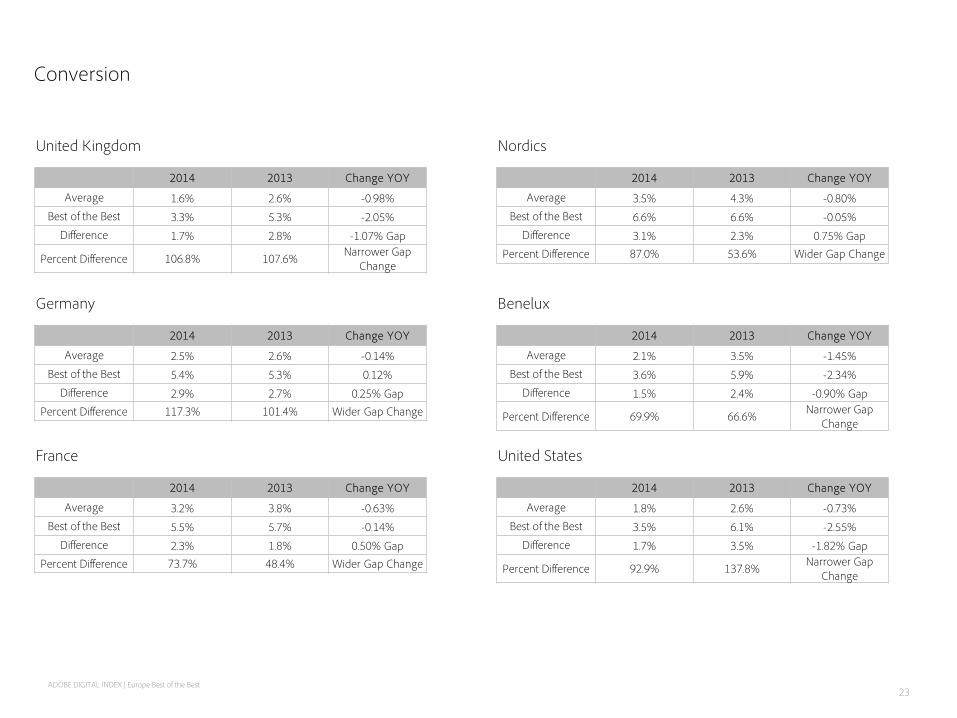
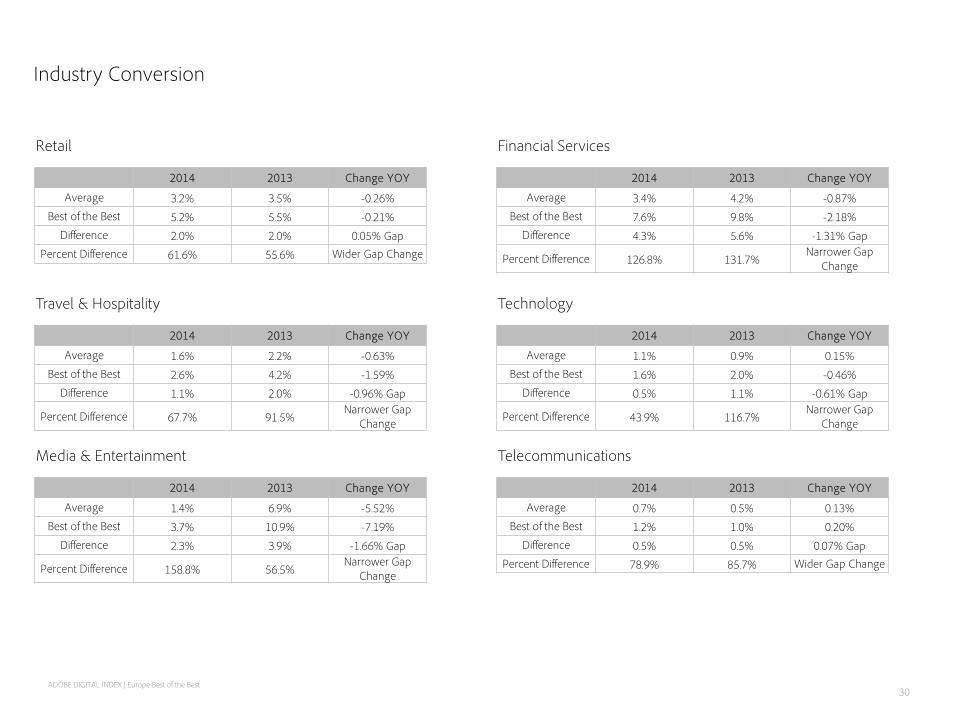
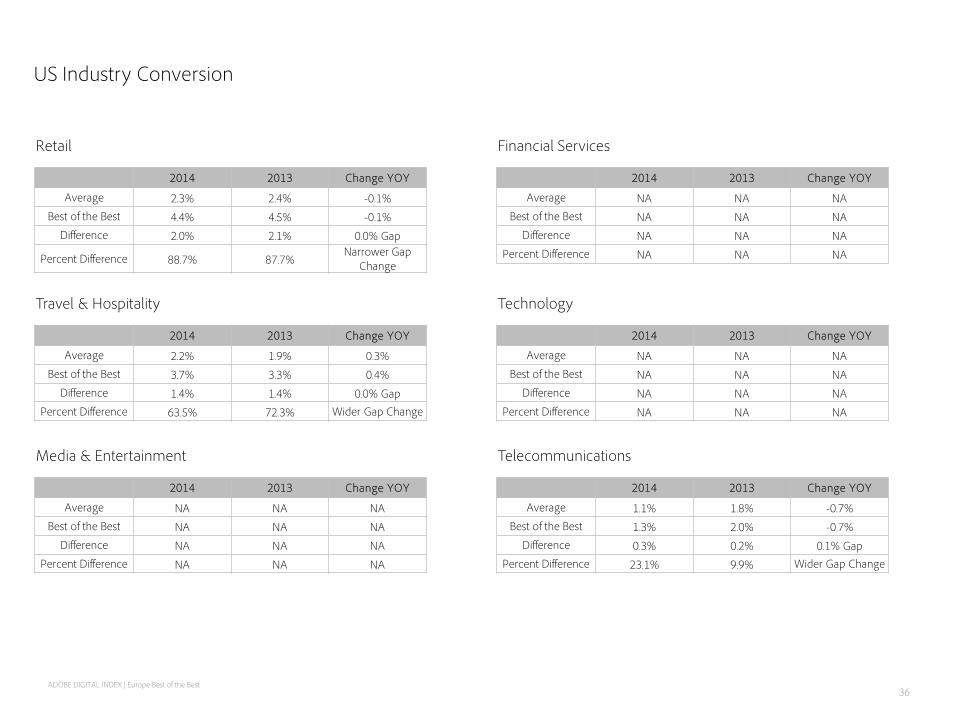
Conversion
For most sites, conversion events tie directly to revenue but are traditionally very low.
A tough year for conversion
Likely as a result of massive increases in smartphone traffic, conversion rates are down versus 2013 in every country. Only Germany, France and Nordics have seen the gap between the best and the masses grow. Still, best performers can achieve nearly double the conversion rate of the masses.
Getting to conversion • Requires vastly streamlined experiences for mobile visitors • Improved acquisition and engagement • More emphasis on loyal and return visitors
15
ADOBE DIGITAL INDEX | Europe Best of the Best
ADOBE DIGITAL INDEX
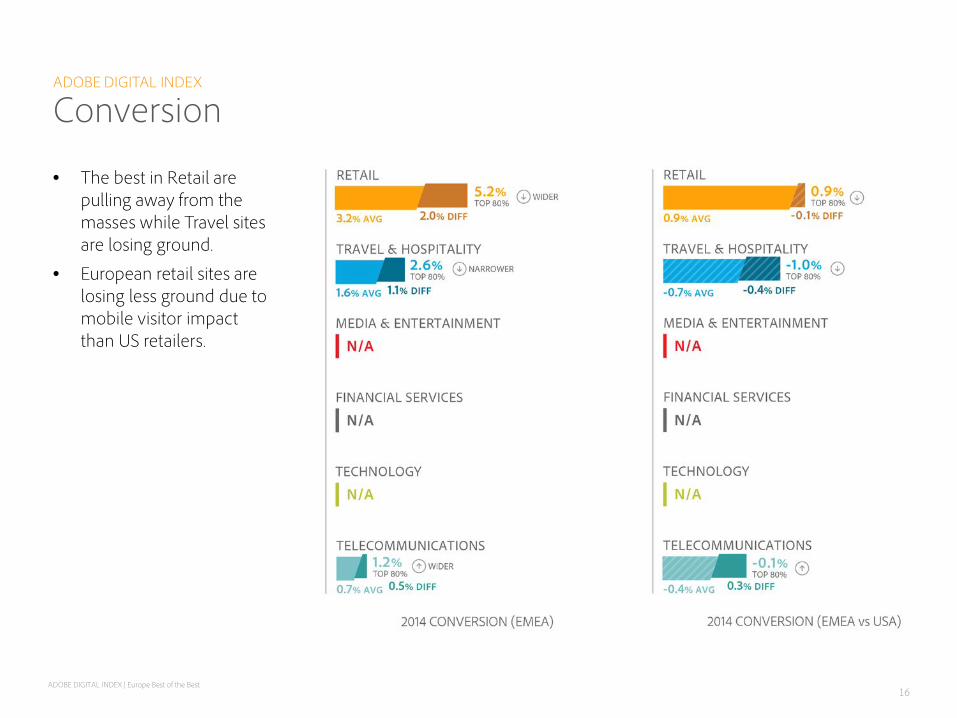
Conversion
• The best in Retail are pulling away from the masses while Travel sites are losing ground.
• European retail sites are losing less ground due to mobile visitor impact than US retailers.
16
ADOBE DIGITAL INDEX | Europe Best of the Best
ADOBE DIGITAL INDEX
Methodology This data is based on 100 billion visits during the 2013 and 2014 calendar year and is comprised of the aggregated and anonymous data from 3,000-plus websites in Europe (UK, Germany, France, Netherlands, Belgium, Luxemburg, Sweden, Norway, Finland).
Visit our website: adobe.ly/digitalindex
Read our blog: adobe.ly/digitalindex
Follow us: @adobeindex
Ask a question or make a suggestion: [email protected]
17
2014 2013 Change YOY
Average 30.7% 22.2% 8.4%
Best of the Best 52.0% 31.2% 20.9%
Difference 21.4% 8.9% 12.5% Gap
Percent Difference 69.7% 40.1% Wider Gap Change
Phone % Visits
United Kingdom
2014 2013 Change YOY
Average 21.9% 14.6% 7.3%
Best of the Best 33.5% 17.0% 16.4%
Difference 11.5% 2.5% 9.1% Gap
Percent Difference 52.7% 16.9% Wider Gap Change
Germany
2014 2013 Change YOY
Average 21.3% 15.7% 5.6%
Best of the Best 31.7% 17.1% 14.6%
Difference 10.4% 1.4% 9.0% Gap
Percent Difference 49.0% 8.9% Wider Gap Change
France
2014 2013 Change YOY
Average 24.8% 16.0% 8.7%
Best of the Best 36.8% 20.8% 16.0%
Difference 12.0% 4.8% 7.2% Gap
Percent Difference 48.5% 30.0% Wider Gap Change
Nordics
2014 2013 Change YOY
Average 20.7% 13.9% 6.8%
Best of the Best 28.0% 17.6% 10.4%
Difference 7.3% 3.7% 3.6% Gap
Percent Difference 35.3% 26.8% Wider Gap Change
Benelux
2014 2013 Change YOY
Average 23.6% 17.6% 5.9%
Best of the Best 37.9% 26.1% 11.8%
Difference 14.3% 8.5% 5.9% Gap
Percent Difference 60.8% 48.0% Wider Gap Change
United States
ADOBE DIGITAL INDEX | Europe Best of the Best 18

2014 2013 Change YOY
Average 16.4% 13.1% 3.3%
Best of the Best 23.2% 17.5% 5.7%
Difference 6.8% 4.4% 2.4% Gap
Percent Difference 41.7% 33.6% Wider Gap Change
Tablet % Visits
United Kingdom
2014 2013 Change YOY
Average 10.1% 6.8% 3.4%
Best of the Best 15.1% 10.1% 5.0%
Difference 5.0% 3.3% 1.7% Gap
Percent Difference 49.4% 49.4% Wider Gap Change
Germany
2014 2013 Change YOY
Average 11.1% 8.4% 2.7%
Best of the Best 16.4% 12.5% 3.8%
Difference 5.3% 4.1% 1.1% Gap
Percent Difference 47.4% 49.1% Wider Gap Change
France
2014 2013 Change YOY
Average 12.0% 9.1% 2.9%
Best of the Best 17.9% 13.7% 4.2%
Difference 5.9% 4.6% 1.3% Gap
Percent Difference 49.5% 50.4% Wider Gap Change
Nordics
2014 2013 Change YOY
Average 14.2% 11.6% 2.6%
Best of the Best 21.2% 17.8% 3.4%
Difference 7.0% 6.2% 0.8% Gap
Percent Difference 49.2% 53.8% Wider Gap Change
Benelux
2014 2013 Change YOY
Average 8.9% 7.6% 1.3%
Best of the Best 13.9% 11.6% 2.2%
Difference 5.0% 4.0% 1.0% Gap
Percent Difference 56.0% 52.5% Wider Gap Change
United States
ADOBE DIGITAL INDEX | Europe Best of the Best 19

2014 2013 Change YOY
Average 48.0% 46.5% 1.4%
Best of the Best 71.8% 66.5% 5.3%
Difference 23.8% 19.9% 3.9% Gap
Percent Difference 49.7% 42.8% Wider Gap Change
Stickiness
United Kingdom
2014 2013 Change YOY
Average 48.2% 48.0% 0.3%
Best of the Best 68.7% 64.7% 4.0%
Difference 20.5% 16.8% 3.7% Gap
Percent Difference 42.5% 35.0% Wider Gap Change
Germany
2014 2013 Change YOY
Average 48.6% 48.6% -0.0%
Best of the Best 69.1% 67.6% 1.4%
Difference 20.5% 19.1% 1.4% Gap
Percent Difference 42.2% 39.2% Wider Gap Change
France
2014 2013 Change YOY
Average 48.8% 48.9% -0.0%
Best of the Best 65.7% 64.1% 1.6%
Difference 16.9% 15.2% 1.7% Gap
Percent Difference 34.6% 31.2% Wider Gap Change
Nordics
2014 2013 Change YOY
Average 52.6% 51.5% 1.1%
Best of the Best 71.4% 65.2% 6.2%
Difference 18.8% 13.7% 5.1% Gap
Percent Difference 35.7% 26.6% Wider Gap Change
Benelux
2014 2013 Change YOY
Average 41.6% 42.0% -0.4%
Best of the Best 61.8% 59.4% 2.4%
Difference 20.2% 17.4% 2.8% Gap
Percent Difference 48.5% 41.5% Wider Gap Change
United States
ADOBE DIGITAL INDEX | Europe Best of the Best 20
2014 2013 Change YOY
Average 2.19 1.90 0.30
Best of the Best 2.73 2.39 0.35
Difference 0.54 0.49 0.05 Gap
Percent Difference 24.7% 26.1% Wider Gap Change
Visit Rate
United Kingdom
2014 2013 Change YOY
Average 1.67 1.50 0.17
Best of the Best 2.08 1.81 0.27
Difference 0.41 0.31 0.10 Gap
Percent Difference 24.7% 20.5% Wider Gap Change
Germany
2014 2013 Change YOY
Average 1.56 1.51 0.05
Best of the Best 1.96 1.90 0.06
Difference 0.40 0.39 0.01 Gap
Percent Difference 25.6% 25.7% Wider Gap Change
France
2014 2013 Change YOY
Average 2.07 1.62 0.45
Best of the Best 2.69 1.99 0.70
Difference 0.62 0.37 0.25 Gap
Percent Difference 29.9% 22.8% Wider Gap Change
Nordics
2014 2013 Change YOY
Average 1.74 1.52 0.22
Best of the Best 2.25 1.84 0.41
Difference 0.51 0.32 0.19 Gap
Percent Difference 29.2% 21.2% Wider Gap Change
Benelux
2014 2013 Change YOY
Average 1.62 1.53 0.09
Best of the Best 1.99 1.88 0.11
Difference 0.37 0.35 0.02 Gap
Percent Difference 23.1% 23.1% Wider Gap Change
United States
ADOBE DIGITAL INDEX | Europe Best of the Best 21
2014 2013 Change YOY
Average 6.07 5.89 0.17
Best of the Best 7.96 7.80 0.16
Difference 1.89 1.91 -0.02 Gap
Percent Difference 31.2% 32.5% Narrower Gap
Change
Consumption
United Kingdom
2014 2013 Change YOY
Average 6.40 6.26 0.14
Best of the Best 9.00 8.76 0.24
Difference 2.60 2.49 0.10 Gap
Percent Difference 40.5% 39.8 Wider Gap Change
Germany
2014 2013 Change YOY
Average 6.42 6.36 0.06
Best of the Best 8.29 8.48 -0.19
Difference 1.86 2.12 -0.26 Gap
Percent Difference 29.0% 33.4% Narrower Gap
Change
France
2014 2013 Change YOY
Average 6.20 6.13 0.07
Best of the Best 8.15 8.16 -0.02
Difference 1.95 2.03 -0.08 Gap
Percent Difference 31.4% 33.1 Narrower Gap
Change
Nordics
2014 2013 Change YOY
Average 6.53 6.12 0.41
Best of the Best 8.84 8.30 0.54
Difference 2.31 2.18 0.13 Gap
Percent Difference 35.4% 35.6 Wider Gap Change
Benelux
2014 2013 Change YOY
Average 6.13 5.69 0.45
Best of the Best 8.55 7.59 0.96
Difference 2.42 1.91 0.51 Gap
Percent Difference 39.5% 33.6 Wider Gap Change
United States
ADOBE DIGITAL INDEX | Europe Best of the Best 22
2014 2013 Change YOY
Average 1.6% 2.6% -0.98%
Best of the Best 3.3% 5.3% -2.05%
Difference 1.7% 2.8% -1.07% Gap
Percent Difference 106.8% 107.6% Narrower Gap
Change
Conversion
United Kingdom
2014 2013 Change YOY
Average 2.5% 2.6% -0.14%
Best of the Best 5.4% 5.3% 0.12%
Difference 2.9% 2.7% 0.25% Gap
Percent Difference 117.3% 101.4% Wider Gap Change
Germany
2014 2013 Change YOY
Average 3.2% 3.8% -0.63%
Best of the Best 5.5% 5.7% -0.14%
Difference 2.3% 1.8% 0.50% Gap
Percent Difference 73.7% 48.4% Wider Gap Change
France
2014 2013 Change YOY
Average 3.5% 4.3% -0.80%
Best of the Best 6.6% 6.6% -0.05%
Difference 3.1% 2.3% 0.75% Gap
Percent Difference 87.0% 53.6% Wider Gap Change
Nordics
2014 2013 Change YOY
Average 2.1% 3.5% -1.45%
Best of the Best 3.6% 5.9% -2.34%
Difference 1.5% 2.4% -0.90% Gap
Percent Difference 69.9% 66.6% Narrower Gap
Change
Benelux
2014 2013 Change YOY
Average 1.8% 2.6% -0.73%
Best of the Best 3.5% 6.1% -2.55%
Difference 1.7% 3.5% -1.82% Gap
Percent Difference 92.9% 137.8% Narrower Gap
Change
United States
ADOBE DIGITAL INDEX | Europe Best of the Best 23
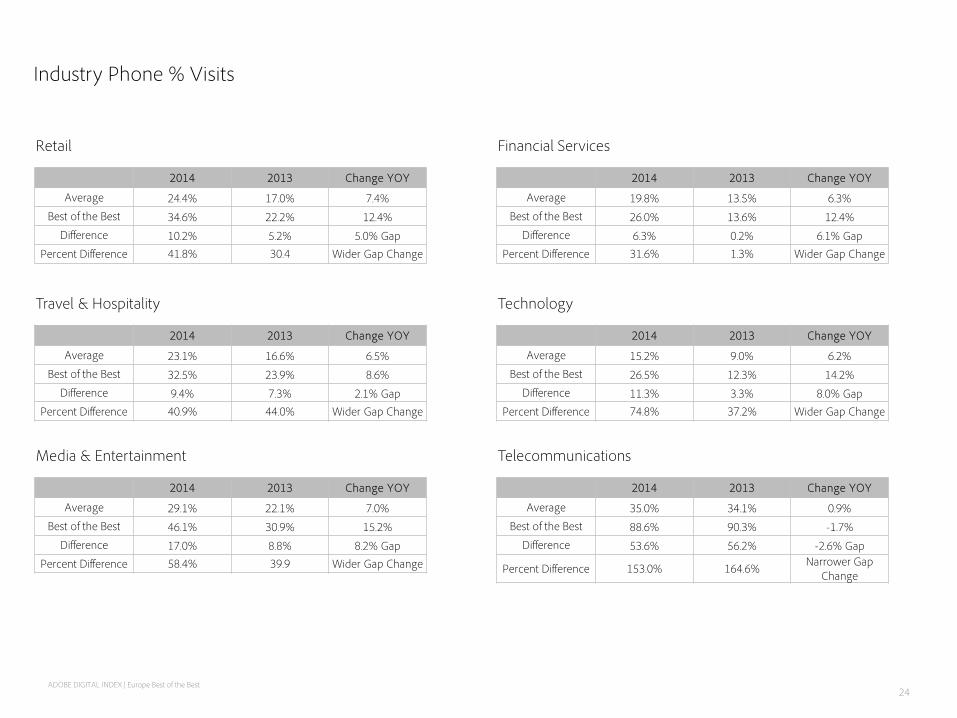
2014 2013 Change YOY
Average 24.4% 17.0% 7.4%
Best of the Best 34.6% 22.2% 12.4%
Difference 10.2% 5.2% 5.0% Gap
Percent Difference 41.8% 30.4 Wider Gap Change
Industry Phone % Visits
Retail
2014 2013 Change YOY
Average 23.1% 16.6% 6.5%
Best of the Best 32.5% 23.9% 8.6%
Difference 9.4% 7.3% 2.1% Gap
Percent Difference 40.9% 44.0% Wider Gap Change
Travel & Hospitality
2014 2013 Change YOY
Average 29.1% 22.1% 7.0%
Best of the Best 46.1% 30.9% 15.2%
Difference 17.0% 8.8% 8.2% Gap
Percent Difference 58.4% 39.9 Wider Gap Change
Media & Entertainment
2014 2013 Change YOY
Average 19.8% 13.5% 6.3%
Best of the Best 26.0% 13.6% 12.4%
Difference 6.3% 0.2% 6.1% Gap
Percent Difference 31.6% 1.3% Wider Gap Change
Financial Services
2014 2013 Change YOY
Average 15.2% 9.0% 6.2%
Best of the Best 26.5% 12.3% 14.2%
Difference 11.3% 3.3% 8.0% Gap
Percent Difference 74.8% 37.2% Wider Gap Change
Technology
2014 2013 Change YOY
Average 35.0% 34.1% 0.9%
Best of the Best 88.6% 90.3% -1.7%
Difference 53.6% 56.2% -2.6% Gap
Percent Difference 153.0% 164.6% Narrower Gap
Change
Telecommunications
ADOBE DIGITAL INDEX | Europe Best of the Best 24

2014 2013 Change YOY
Average 13.6% 10.6% 3.0%
Best of the Best 21.2% 16.7% 4.5%
Difference 7.6% 6.2% 1.5% Gap
Percent Difference 56.3% 58.2% Wider Gap Change
Industry Tablet % Visits
Retail
2014 2013 Change YOY
Average 13.2% 11.4% 1.8%
Best of the Best 19.4% 17.0% 2.4%
Difference 6.2% 5.6% 0.7% Gap
Percent Difference 47.4% 48.8% Wider Gap Change
Travel & Hospitality
2014 2013 Change YOY
Average 13.2% 11.7% 1.5%
Best of the Best 19.7% 16.0% 3.7%
Difference 6.5% 4.3% 2.2% Gap
Percent Difference 49.5% 37.1% Wider Gap Change
Media & Entertainment
2014 2013 Change YOY
Average 8.2% 6.3% 1.9%
Best of the Best 13.1% 10.1% 3.0%
Difference 5.0% 3.8% 1.2% Gap
Percent Difference 60.6% 60.4% Wider Gap Change
Financial Services
2014 2013 Change YOY
Average 6.6% 4.7% 1.9%
Best of the Best 11.8% 8.1% 3.7%
Difference 5.3% 3.4% 1.9% Gap
Percent Difference 80.6% 72.8% Wider Gap Change
Technology
2014 2013 Change YOY
Average 7.3% 5.3% 2.0%
Best of the Best 11.1% 8.4% 2.6%
Difference 3.8% 3.1% 0.6% Gap
Percent Difference 51.9% 59.3% Wider Gap Change
Telecommunications
ADOBE DIGITAL INDEX | Europe Best of the Best 25
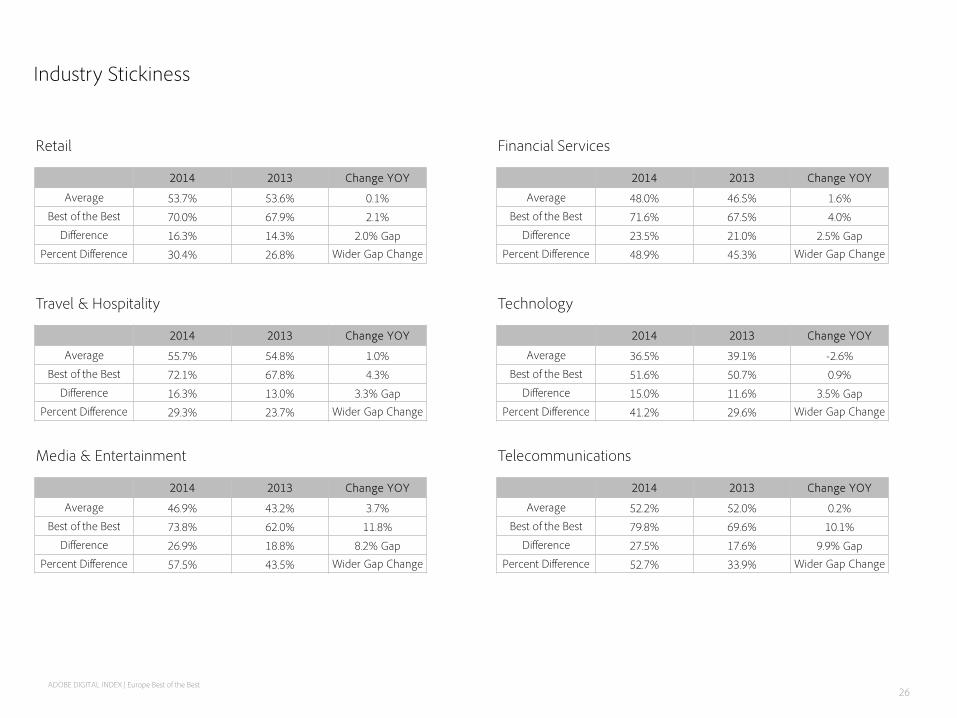
2014 2013 Change YOY
Average 53.7% 53.6% 0.1%
Best of the Best 70.0% 67.9% 2.1%
Difference 16.3% 14.3% 2.0% Gap
Percent Difference 30.4% 26.8% Wider Gap Change
Industry Stickiness
Retail
2014 2013 Change YOY
Average 55.7% 54.8% 1.0%
Best of the Best 72.1% 67.8% 4.3%
Difference 16.3% 13.0% 3.3% Gap
Percent Difference 29.3% 23.7% Wider Gap Change
Travel & Hospitality
2014 2013 Change YOY
Average 46.9% 43.2% 3.7%
Best of the Best 73.8% 62.0% 11.8%
Difference 26.9% 18.8% 8.2% Gap
Percent Difference 57.5% 43.5% Wider Gap Change
Media & Entertainment
2014 2013 Change YOY
Average 48.0% 46.5% 1.6%
Best of the Best 71.6% 67.5% 4.0%
Difference 23.5% 21.0% 2.5% Gap
Percent Difference 48.9% 45.3% Wider Gap Change
Financial Services
2014 2013 Change YOY
Average 36.5% 39.1% -2.6%
Best of the Best 51.6% 50.7% 0.9%
Difference 15.0% 11.6% 3.5% Gap
Percent Difference 41.2% 29.6% Wider Gap Change
Technology
2014 2013 Change YOY
Average 52.2% 52.0% 0.2%
Best of the Best 79.8% 69.6% 10.1%
Difference 27.5% 17.6% 9.9% Gap
Percent Difference 52.7% 33.9% Wider Gap Change
Telecommunications
ADOBE DIGITAL INDEX | Europe Best of the Best 26
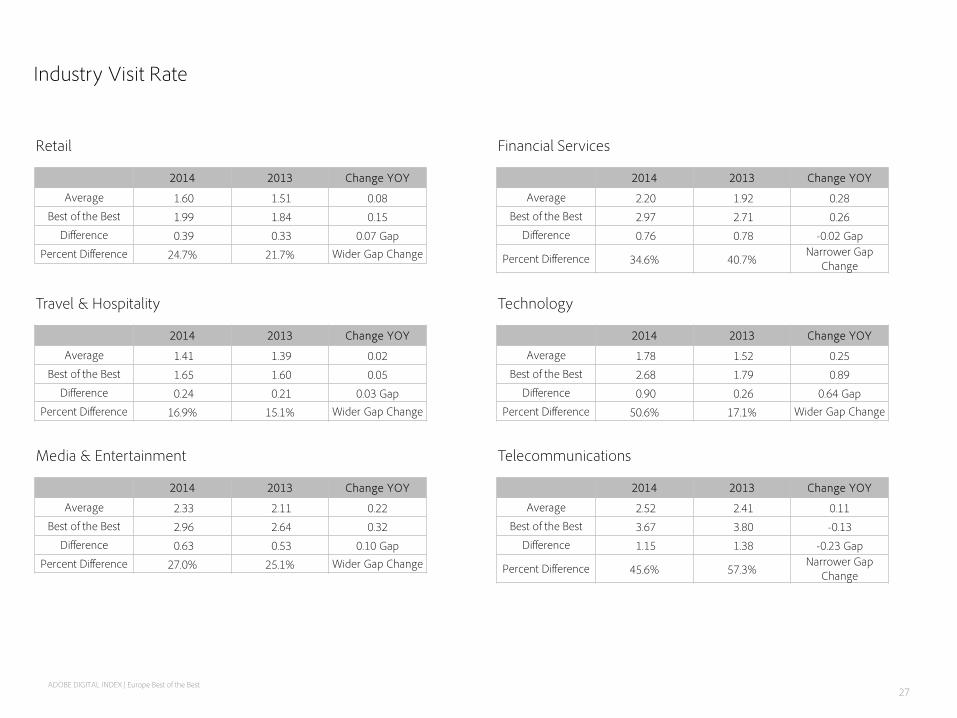
2014 2013 Change YOY
Average 1.60 1.51 0.08
Best of the Best 1.99 1.84 0.15
Difference 0.39 0.33 0.07 Gap
Percent Difference 24.7% 21.7% Wider Gap Change
Industry Visit Rate
Retail
2014 2013 Change YOY
Average 1.41 1.39 0.02
Best of the Best 1.65 1.60 0.05
Difference 0.24 0.21 0.03 Gap
Percent Difference 16.9% 15.1% Wider Gap Change
Travel & Hospitality
2014 2013 Change YOY
Average 2.33 2.11 0.22
Best of the Best 2.96 2.64 0.32
Difference 0.63 0.53 0.10 Gap
Percent Difference 27.0% 25.1% Wider Gap Change
Media & Entertainment
2014 2013 Change YOY
Average 2.20 1.92 0.28
Best of the Best 2.97 2.71 0.26
Difference 0.76 0.78 -0.02 Gap
Percent Difference 34.6% 40.7% Narrower Gap
Change
Financial Services
2014 2013 Change YOY
Average 1.78 1.52 0.25
Best of the Best 2.68 1.79 0.89
Difference 0.90 0.26 0.64 Gap
Percent Difference 50.6% 17.1% Wider Gap Change
Technology
2014 2013 Change YOY
Average 2.52 2.41 0.11
Best of the Best 3.67 3.80 -0.13
Difference 1.15 1.38 -0.23 Gap
Percent Difference 45.6% 57.3% Narrower Gap
Change
Telecommunications
ADOBE DIGITAL INDEX | Europe Best of the Best 27

2014 2013 Change YOY
Average 6.95 6.76 0.20
Best of the Best 9.82 9.15 0.67
Difference 2.86 2.39 0.47 Gap
Percent Difference 41.2% 35.4% Wider Gap Change
Industry Consumption
Retail
2014 2013 Change YOY
Average 6.39 6.55 -0.16
Best of the Best 8.00 8.45 -0.45
Difference 1.62 1.90 -0.29 Gap
Percent Difference 25.3% 29.1% Narrower Gap
Change
Travel & Hospitality
2014 2013 Change YOY
Average 7.07 6.78 0.29
Best of the Best 10.33 9.96 0.36
Difference 3.26 318.5% 0.07 Gap
Percent Difference 46.0% 47.0% Wider Gap Change
Media & Entertainment
2014 2013 Change YOY
Average 5.95 5.55 0.40
Best of the Best 8.35 7.70 0.65
Difference 2.40 2.15 0.25 Gap
Percent Difference 40.3% 38.7% Wider Gap Change
Financial Services
2014 2013 Change YOY
Average 6.31 6.05 0.26
Best of the Best 9.10 7.53 1.57
Difference 2.80 1.48 1.32 Gap
Percent Difference 44.4% 24.5% Wider Gap Change
Technology
2014 2013 Change YOY
Average 7.23 6.65 0.58
Best of the Best 10.79 9.04 1.75
Difference 3.56 2.40 1.17 Gap
Percent Difference 49.3% 36.0% Wider Gap Change
Telecommunications
ADOBE DIGITAL INDEX | Europe Best of the Best 28
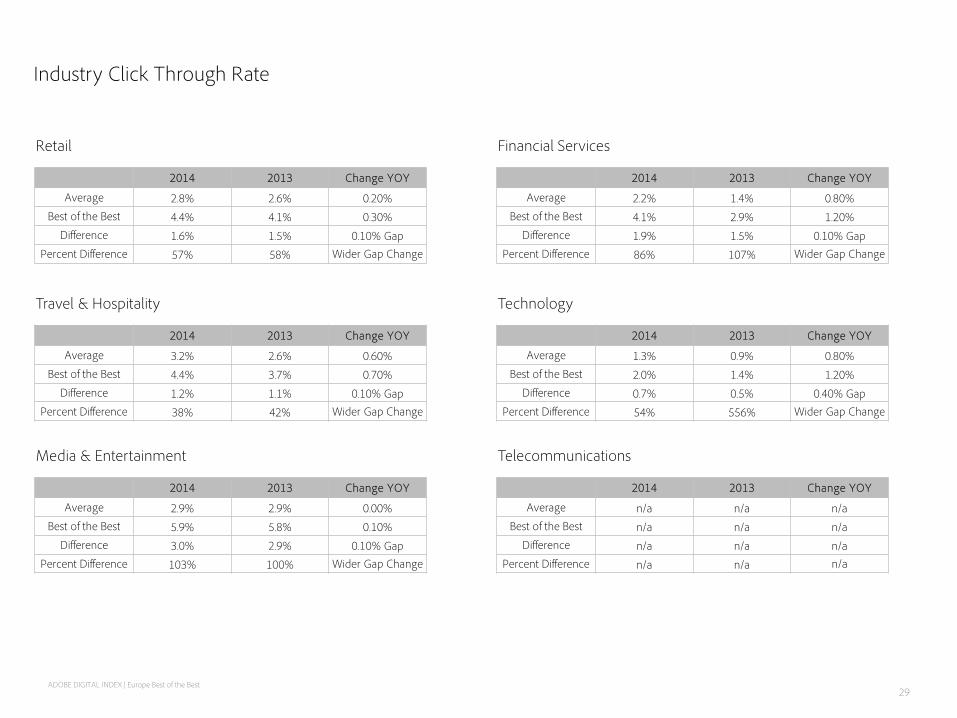
Industry Click Through Rate
ADOBE DIGITAL INDEX | Europe Best of the Best
2014 2013 Change YOY
Average 2.8% 2.6% 0.20%
Best of the Best 4.4% 4.1% 0.30%
Difference 1.6% 1.5% 0.10% Gap
Percent Difference 57% 58% Wider Gap Change
Retail
2014 2013 Change YOY
Average 3.2% 2.6% 0.60%
Best of the Best 4.4% 3.7% 0.70%
Difference 1.2% 1.1% 0.10% Gap
Percent Difference 38% 42% Wider Gap Change
Travel & Hospitality
2014 2013 Change YOY
Average 2.9% 2.9% 0.00%
Best of the Best 5.9% 5.8% 0.10%
Difference 3.0% 2.9% 0.10% Gap
Percent Difference 103% 100% Wider Gap Change
Media & Entertainment
2014 2013 Change YOY
Average 2.2% 1.4% 0.80%
Best of the Best 4.1% 2.9% 1.20%
Difference 1.9% 1.5% 0.10% Gap
Percent Difference 86% 107% Wider Gap Change
Financial Services
2014 2013 Change YOY
Average 1.3% 0.9% 0.80%
Best of the Best 2.0% 1.4% 1.20%
Difference 0.7% 0.5% 0.40% Gap
Percent Difference 54% 556% Wider Gap Change
Technology
2014 2013 Change YOY
Average n/a n/a n/a
Best of the Best n/a n/a n/a
Difference n/a n/a n/a
Percent Difference n/a n/a n/a
Telecommunications
29
2014 2013 Change YOY
Average 3.2% 3.5% -0.26%
Best of the Best 5.2% 5.5% -0.21%
Difference 2.0% 2.0% 0.05% Gap
Percent Difference 61.6% 55.6% Wider Gap Change
Industry Conversion
Retail
2014 2013 Change YOY
Average 1.6% 2.2% -0.63%
Best of the Best 2.6% 4.2% -1.59%
Difference 1.1% 2.0% -0.96% Gap
Percent Difference 67.7% 91.5% Narrower Gap
Change
Travel & Hospitality
2014 2013 Change YOY
Average 1.4% 6.9% -5.52%
Best of the Best 3.7% 10.9% -7.19%
Difference 2.3% 3.9% -1.66% Gap
Percent Difference 158.8% 56.5% Narrower Gap
Change
Media & Entertainment
2014 2013 Change YOY
Average 3.4% 4.2% -0.87%
Best of the Best 7.6% 9.8% -2.18%
Difference 4.3% 5.6% -1.31% Gap
Percent Difference 126.8% 131.7% Narrower Gap
Change
Financial Services
2014 2013 Change YOY
Average 1.1% 0.9% 0.15%
Best of the Best 1.6% 2.0% -0.46%
Difference 0.5% 1.1% -0.61% Gap
Percent Difference 43.9% 116.7% Narrower Gap
Change
Technology
2014 2013 Change YOY
Average 0.7% 0.5% 0.13%
Best of the Best 1.2% 1.0% 0.20%
Difference 0.5% 0.5% 0.07% Gap
Percent Difference 78.9% 85.7% Wider Gap Change
Telecommunications
ADOBE DIGITAL INDEX | Europe Best of the Best 30

2014 2013 Change YOY
Average 26.6% 20.2% 6.4%
Best of the Best 40.1% 30.3% 9.8%
Difference 13.4% 10.0% 3.4% Gap
Percent Difference 50.4% 49.5% Wider Gap Change
US Industry Phone % Visits
Retail
2014 2013 Change YOY
Average 31.1% 23.9% 7.2%
Best of the Best 40.7% 32.4% 8.3%
Difference 9.6% 8.5% 1.1% Gap
Percent Difference 30.9% 35.6% Wider Gap Change
Travel & Hospitality
2014 2013 Change YOY
Average 35.5% 24.1% 11.4%
Best of the Best 50.9% 35.5% 15.5%
Difference 15.4% 11.3% 4.1% Gap
Percent Difference 43.5% 47.0% Wider Gap Change
Media & Entertainment
2014 2013 Change YOY
Average 13.8% 11.8% 2.0%
Best of the Best 20.5% 17.2% 3.2%
Difference 6.6% 5.4% 1.3% Gap
Percent Difference 47.9% 45.4% Wider Gap Change
Financial Services
2014 2013 Change YOY
Average 19.0% 14.2% 4.8%
Best of the Best 32.7% 23.7% 9.0%
Difference 13.7% 9.5% 4.2% Gap
Percent Difference 72.5% 67.4% Wider Gap Change
Technology
2014 2013 Change YOY
Average 25.6% 18.1% 7.6%
Best of the Best 37.1% 26.2% 10.9%
Difference 11.4% 8.1% 3.3% Gap
Percent Difference 44.7% 45.1% Wider Gap Change
Telecommunications
ADOBE DIGITAL INDEX | Europe Best of the Best 31
2014 2013 Change YOY
Average 17.8% 12.4% 5.4%
Best of the Best 28.6% 19.9% 8.6%
Difference 10.8% 7.5% 3.3% Gap
Percent Difference 60.7% 60.9% Wider Gap Change
US Industry Tablet % Visits
Retail
2014 2013 Change YOY
Average 17.4% 12.2% 5.2%
Best of the Best 26.3% 19.1% 7.2%
Difference 8.8% 6.8% 2.0% Gap
Percent Difference 50.5% 55.7% Wider Gap Change
Travel & Hospitality
2014 2013 Change YOY
Average 26.1% 17.2% 8.9%
Best of the Best 39.5% 26.1% 13.4%
Difference 13.4% 8.9% 4.5% Gap
Percent Difference 51.2% 51.5% Wider Gap Change
Media & Entertainment
2014 2013 Change YOY
Average 8.7% 7.1% 1.6%
Best of the Best 13.7% 11.5% 2.2%
Difference 5.0% 4.4% 0.7% Gap
Percent Difference 57.5% 61.0% Wider Gap Change
Financial Services
2014 2013 Change YOY
Average 12.3% 8.5% 3.7%
Best of the Best 21.8% 14.9% 6.8%
Difference 9.5% 6.4% 3.1% Gap
Percent Difference 76.9% 74.4% Wider Gap Change
Technology
2014 2013 Change YOY
Average 17.7% 11.9% 5.8%
Best of the Best 26.1% 19.3% 6.8%
Difference 8.4% 7.5% 0.9% Gap
Percent Difference 47.4% 62.9% Wider Gap Change
Telecommunications
ADOBE DIGITAL INDEX | Europe Best of the Best 32
2014 2013 Change YOY
Average 33.7% 38.1% -4.4%
Best of the Best 51.6% 55.3% -3.7%
Difference 17.8% 17.2% 0.6% Gap
Percent Difference 52.9% 45.1% Wider Gap Change
US Industry Stickiness
Retail
2014 2013 Change YOY
Average 45.4% 50.4% -5.0%
Best of the Best 60.5% 62.4% -1.9%
Difference 15.1% 12.1% 3.1% Gap
Percent Difference 33.4% 24.0% Wider Gap Change
Travel & Hospitality
2014 2013 Change YOY
Average 29.7% 33.4% -3.7%
Best of the Best 43.0% 46.3% -3.3%
Difference 13.3% 12.9% 0.5% Gap
Percent Difference 45.0% 38.6% Wider Gap Change
Media & Entertainment
2014 2013 Change YOY
Average 32.8% 37.3% -4.5%
Best of the Best 45.2% 47.2% -1.9%
Difference 12.5% 9.9% 2.6% Gap
Percent Difference 38.0% 26.6% Wider Gap Change
Financial Services
2014 2013 Change YOY
Average 29.9% 32.8% -3.0%
Best of the Best 46.7% 49.9% -3.1%
Difference 16.9% 17.0% -0.2% Gap
Percent Difference 56.4% 51.8% Narrower Gap
Change
Technology
2014 2013 Change YOY
Average 36.1% 41.3% -5.1%
Best of the Best 60.2% 60.5% -0.3%
Difference 24.1% 19.2% 4.9% Gap
Percent Difference 66.6% 46.6% Wider Gap Change
Telecommunications
ADOBE DIGITAL INDEX | Europe Best of the Best 33

2014 2013 Change YOY
Average 1.28 1.29 -0.01
Best of the Best 1.48 1.52 -0.04
Difference 0.20 0.23 -0.03 Gap
Percent Difference 15.6% 17.5% Narrower Gap
Change
US Industry Visit Rate
Retail
2014 2013 Change YOY
Average 1.27 1.27 0.00
Best of the Best 1.39 1.42 -0.03
Difference 0.12 0.15 -0.03 Gap
Percent Difference 9.2% 11.6% Narrower Gap
Change
Travel & Hospitality
2014 2013 Change YOY
Average 1.51 1.53 -0.01
Best of the Best 1.83 1.85 -0.02
Difference 0.32 0.33 -0.01 Gap
Percent Difference 21.2% 21.4% Narrower Gap
Change
Media & Entertainment
2014 2013 Change YOY
Average 1.26 1.29 -0.03
Best of the Best 1.39 1.43 -0.04
Difference 0.13 0.14 -0.01 Gap
Percent Difference 10.4% 10.7% Narrower Gap
Change
Financial Services
2014 2013 Change YOY
Average 1.63 1.65 -0.02
Best of the Best 2.28 2.34 -0.07
Difference 0.65 0.69 -0.05 Gap
Percent Difference 39.7% 41.9% Narrower Gap
Change
Technology
2014 2013 Change YOY
Average 1.62 1.67 -0.05
Best of the Best 1.96 2.08 -0.12
Difference 0.33 0.41 -0.07 Gap
Percent Difference 20.6% 24.4% Narrower Gap
Change
Telecommunications
ADOBE DIGITAL INDEX | Europe Best of the Best 34
2014 2013 Change YOY
Average 4.89 5.33 -0.44
Best of the Best 6.80 7.19 -0.38
Difference 1.91 1.85 0.06 Gap
Percent Difference 39.0% 34.8% Wider Gap Change
US Industry Consumption
Retail
2014 2013 Change YOY
Average 4.90 5.31 -0.41
Best of the Best 6.14 6.64 -0.50
Difference 1.24 1.32 -0.08 Gap
Percent Difference 25.3% 24.9% Narrower Gap
Change
Travel & Hospitality
2014 2013 Change YOY
Average 5.73 6.40 -0.67
Best of the Best 7.84 8.71 -0.87
Difference 2.10 230.6% -0.20 Gap
Percent Difference 36.7% 36.0% Narrower Gap
Change
Media & Entertainment
2014 2013 Change YOY
Average 4.07 4.02 0.05
Best of the Best 5.12 5.34 -0.22
Difference 1.05 1.33 -0.27 Gap
Percent Difference 25.9% 33.0% Narrower Gap
Change
Financial Services
2014 2013 Change YOY
Average 5.75 6.18 -0.43
Best of the Best 7.24 7.68 -0.44
Difference 1.48 1.50 -0.02 Gap
Percent Difference 25.8% 24.2% Narrower Gap
Change
Technology
2014 2013 Change YOY
Average 6.28 6.76 -0.47
Best of the Best 8.58 9.09 -0.51
Difference 2.30 2.33 -0.04 Gap
Percent Difference 36.6% 34.5% Narrower Gap
Change
Telecommunications
ADOBE DIGITAL INDEX | Europe Best of the Best 35
2014 2013 Change YOY
Average 2.3% 2.4% -0.1%
Best of the Best 4.4% 4.5% -0.1%
Difference 2.0% 2.1% 0.0% Gap
Percent Difference 88.7% 87.7% Narrower Gap
Change
US Industry Conversion
Retail
2014 2013 Change YOY
Average 2.2% 1.9% 0.3%
Best of the Best 3.7% 3.3% 0.4%
Difference 1.4% 1.4% 0.0% Gap
Percent Difference 63.5% 72.3% Wider Gap Change
Travel & Hospitality
2014 2013 Change YOY
Average NA NA NA
Best of the Best NA NA NA
Difference NA NA NA
Percent Difference NA NA NA
Media & Entertainment
2014 2013 Change YOY
Average NA NA NA
Best of the Best NA NA NA
Difference NA NA NA
Percent Difference NA NA NA
Financial Services
2014 2013 Change YOY
Average NA NA NA
Best of the Best NA NA NA
Difference NA NA NA
Percent Difference NA NA NA
Technology
2014 2013 Change YOY
Average 1.1% 1.8% -0.7%
Best of the Best 1.3% 2.0% -0.7%
Difference 0.3% 0.2% 0.1% Gap
Percent Difference 23.1% 9.9% Wider Gap Change
Telecommunications
ADOBE DIGITAL INDEX | Europe Best of the Best 36

2014 2013 Change YOY
Average -2.3% -3.3% 1.0%
Best of the Best -5.5% -8.1% 2.6%
Difference -3.2% -4.9% 1.6% Gap
Percent Difference -8.6% -19.1% NA
EMEA vs US Industry Phone % Visits
Retail
2014 2013 Change YOY
Average -8.0% -7.2% -0.8%
Best of the Best -8.2% -8.4% 0.2%
Difference -0.2% -1.2% 1.0% Gap
Percent Difference 9.9% 8.4% NA
Travel & Hospitality
2014 2013 Change YOY
Average -6.4% -2.0% -4.3%
Best of the Best -4.8% -4.6% -0.2%
Difference 1.6% -2.5% 4.1% Gap
Percent Difference 14.9% -7.1% NA
Media & Entertainment
2014 2013 Change YOY
Average 5.9% 1.6% 4.3%
Best of the Best 5.6% -3.6% 9.1%
Difference -0.4% -5.2% 4.8% Gap
Percent Difference -16.3% -44.1% NA
Financial Services
2014 2013 Change YOY
Average -3.8% -5.2% 1.4%
Best of the Best -6.2% -11.4% 5.2%
Difference -2.4% -6.2% 3.8% Gap
Percent Difference 2.3% -30.2% NA
Technology
2014 2013 Change YOY
Average 9.4% 16.1% -6.7%
Best of the Best 51.6% 64.1% -12.6%
Difference 42.1% 48.0% -5.9% Gap
Percent Difference 108.3% 119.5% NA
Telecommunications
ADOBE DIGITAL INDEX | Europe Best of the Best 37
2014 2013 Change YOY
Average -4.2% -1.8% -2.4%
Best of the Best -7.4% -3.2% -4.2%
Difference -3.2% -1.4% -1.8% Gap
Percent Difference -4.4% -2.7% NA
EMEA vs US Industry Tablet % Visits
Retail
2014 2013 Change YOY
Average -4.3% -0.8% -3.4%
Best of the Best -6.8% -2.1% -4.7%
Difference -2.6% -1.3% -1.3% Gap
Percent Difference -3.1% -6.9% NA
Travel & Hospitality
2014 2013 Change YOY
Average -12.9% -5.6% -7.4%
Best of the Best -19.8% -10.1% -9.7%
Difference -6.9% -4.5% -2.3% Gap
Percent Difference -1.7% -14.4% NA
Media & Entertainment
2014 2013 Change YOY
Average -0.5% -0.8% 0.3%
Best of the Best -0.6% -1.4% 0.8%
Difference -0.1% -0.6% 0.5% Gap
Percent Difference 3.1% -0.6% NA
Financial Services
2014 2013 Change YOY
Average -5.7% -3.9% -1.9%
Best of the Best -9.9% -6.8% -3.1%
Difference -4.2% -3.0% -1.2% Gap
Percent Difference 3.7% -1.7% NA
Technology
2014 2013 Change YOY
Average -10.4% -6.6% -3.8%
Best of the Best -15.0% -10.9% -4.1%
Difference -4.6% -4.3% -0.3% Gap
Percent Difference 4.4% -3.5% NA
Telecommunications
ADOBE DIGITAL INDEX | Europe Best of the Best 38
2014 2013 Change YOY
Average 19.9% 15.4% 4.5%
Best of the Best 18.4% 12.6% 5.8%
Difference -1.5% -2.8% 1.4% Gap
Percent Difference -22.4% -18.3% NA
EMEA vs US Industry Stickiness
Retail
2014 2013 Change YOY
Average 10.4% 4.4% 6.0%
Best of the Best 11.6% 5.3% 6.2%
Difference 1.2% 0.9% 0.3% Gap
Percent Difference -4.0% -0.2% NA
Travel & Hospitality
2014 2013 Change YOY
Average 17.2% 9.8% 7.4%
Best of the Best 30.8% 15.7% 15.1%
Difference 13.6% 5.9% 7.7% Gap
Percent Difference 12.5% 4.9% NA
Media & Entertainment
2014 2013 Change YOY
Average 15.3% 9.2% 6.1%
Best of the Best 26.3% 20.3% 6.0%
Difference 11.0% 11.1% -0.1% Gap
Percent Difference 10.9% 18.7% NA
Financial Services
2014 2013 Change YOY
Average 6.7% 6.3% 0.4%
Best of the Best 4.8% 0.8% 4.0%
Difference -1.8% -5.4% 3.6% Gap
Percent Difference -15.3% -22.3% NA
Technology
2014 2013 Change YOY
Average 16.1% 10.7% 5.4%
Best of the Best 19.6% 9.2% 10.4%
Difference 3.5% -1.6% 5.0% Gap
Percent Difference -13.9% -12.6% NA
Telecommunications
ADOBE DIGITAL INDEX | Europe Best of the Best 39
2014 2013 Change YOY
Average 31.7% 22.3% 9.5%
Best of the Best 51.2% 32.6% 18.6%
Difference 19.5% 10.3% 9.2% Gap
Percent Difference 9.1% 4.2% NA
EMEA vs US Industry Visit Rate
Retail
2014 2013 Change YOY
Average 14.2% 12.0% 2.2%
Best of the Best 26.4% 18.3% 8.1%
Difference 12.2% 6.3% 5.9% Gap
Percent Difference 7.7% 3.5% NA
Travel & Hospitality
2014 2013 Change YOY
Average 81.8% 58.4% 23.5%
Best of the Best 112.7% 78.8% 33.9%
Difference 30.9% 20.4% 10.4% Gap
Percent Difference 5.8% 3.8% NA
Media & Entertainment
2014 2013 Change YOY
Average 94.1% 63.1% 31.0%
Best of the Best 157.3% 127.6% 29.7%
Difference 63.2% 64.5% -1.3% Gap
Percent Difference 24.2% 30.0% NA
Financial Services
2014 2013 Change YOY
Average 14.6% -12.7% 27.3%
Best of the Best 39.8% -55.8% 95.6%
Difference 25.2% -43.1% 68.3% Gap
Percent Difference 10.9% -24.8% NA
Technology
2014 2013 Change YOY
Average 89.9% 74.1% 15.7%
Best of the Best 171.4% 171.8% -0.4%
Difference 81.6% 97.7% -16.1% Gap
Percent Difference 25.0% 33.0% NA
Telecommunications
ADOBE DIGITAL INDEX | Europe Best of the Best 40
2014 2013 Change YOY
Average 2.06 1.42 0.64
Best of the Best 3.01 1.96 1.05
Difference 0.95 0.54 0.41 Gap
Percent Difference 2% 1% NA
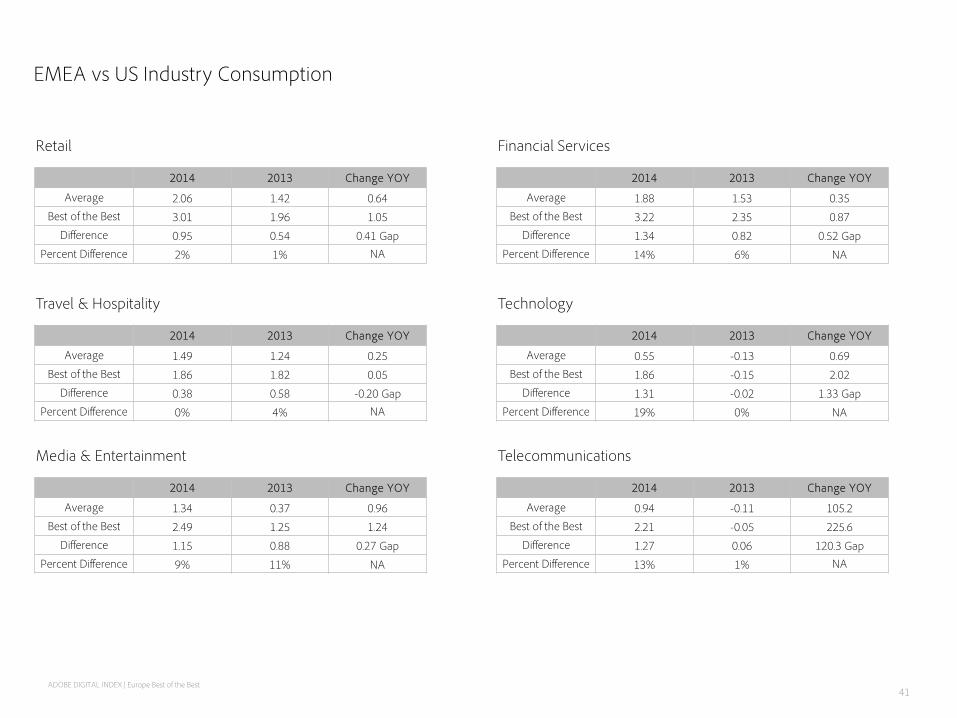
EMEA vs US Industry Consumption
Retail
2014 2013 Change YOY
Average 1.49 1.24 0.25
Best of the Best 1.86 1.82 0.05
Difference 0.38 0.58 -0.20 Gap
Percent Difference 0% 4% NA
Travel & Hospitality
2014 2013 Change YOY
Average 1.34 0.37 0.96
Best of the Best 2.49 1.25 1.24
Difference 1.15 0.88 0.27 Gap
Percent Difference 9% 11% NA
Media & Entertainment
2014 2013 Change YOY
Average 1.88 1.53 0.35
Best of the Best 3.22 2.35 0.87
Difference 1.34 0.82 0.52 Gap
Percent Difference 14% 6% NA
Financial Services
2014 2013 Change YOY
Average 0.55 -0.13 0.69
Best of the Best 1.86 -0.15 2.02
Difference 1.31 -0.02 1.33 Gap
Percent Difference 19% 0% NA
Technology
2014 2013 Change YOY
Average 0.94 -0.11 105.2
Best of the Best 2.21 -0.05 225.6
Difference 1.27 0.06 120.3 Gap
Percent Difference 13% 1% NA
Telecommunications
ADOBE DIGITAL INDEX | Europe Best of the Best 41

2014 2013 Change YOY
Average 0.9% 1.1% -0.2%
Best of the Best 0.9% 1.0% -0.1%
Difference -0.1% -0.1% 0.1% Gap
Percent Difference -27.1% -32.1% NA
EMEA vs US Industry Conversion
Retail
2014 2013 Change YOY
Average -0.7% 0.3% -1.0%
Best of the Best -1.0% 0.9% -2.0%
Difference -0.4% 0.6% -1.0% Gap
Percent Difference 4.2% 19.1% NA
Travel & Hospitality
2014 2013 Change YOY
Average NA NA NA
Best of the Best NA NA NA
Difference NA NA NA
Percent Difference NA NA NA
Media & Entertainment
2014 2013 Change YOY
Average NA NA NA
Best of the Best NA NA NA
Difference NA NA NA
Percent Difference NA NA NA
Financial Services
2014 2013 Change YOY
Average NA NA NA
Best of the Best NA NA NA
Difference NA NA NA
Percent Difference NA NA NA
Technology
2014 2013 Change YOY
Average -0.4% -1.3% 0.9%
Best of the Best -0.1% -1.0% 0.9%
Difference 0.3% 0.3% 0.0% Gap
Percent Difference 55.7% 75.8% NA
Telecommunications
ADOBE DIGITAL INDEX | Europe Best of the Best 42