ADN Prerequisite Validation Study Center for Student Success February 14 th 2002 Sacramento,...
45
ADN Prerequisite Validation Study Center for Student Success February 14 th 2002 Sacramento, California William Armstrong, Ph.D. Brad C. Phillips, Ph.D. Steve Spurling, M.A.
Transcript of ADN Prerequisite Validation Study Center for Student Success February 14 th 2002 Sacramento,...
ADN Prerequisite Validation Study
Center for Student Success
February 14th 2002
Sacramento, CaliforniaWilliam Armstrong, Ph.D.
Brad C. Phillips, Ph.D.
Steve Spurling, M.A.
Today’s Activities
Review study purposeReview salient literatureExamine ADN student cohortReview past ADN student successReview proposed modelProvide feedback and directionDetermine next steps

ADN Project Study Purpose
Review prerequisite research, emphasis on Nursing programs
Determine what is meant by ADN program completion
Examine ADN program completion in the last several years
Statistically validate the use of the most powerful prerequisites to predict successful ADN program completion
Make recommendations to the Nursing Directors whose colleges participated in the study

FSS Associate Degree Nursing PrerequisiteValidation Study
Consortium Member Schools
ADNDirector
Cabrillo College Kathie WelchCity College of San Francisco Cecile DawydiakCollege of the Canyons Sue AlbertContra Costa College Lynda SchweidCuesta College Mary ParkerFresno City College Diane MooreGlendale College Sharon HallGrossmont College Elisabeth HamelHartnell College Thomas McKayLong Beach City College Mary CallahanLos Angeles Pierce College Marcia SolomonMonterey Peninsula College Debra SchulteMt. San Antonio College Velora FerrisNapa Valley College Margaret CraigSacramento City College Dianne WelchSan Diego City College Jo-Ann RossittoSierra College Margaret WhiteSolano Community College Faith ZobelSouthwestern College Sandra ComstockVentura College Joan Beem

Review of Prior Research
35 Years of Research LiteratureLiterature Covers Era from 1964 to Present Journal Articles Professional Presentations Technical Reports Foundation Studies (Kellogg, Mellon) Institutional Research Reports
(Community Colleges) Professional Associations
Focus of Prior Research
Improve Program and Student OutcomesReduce Attrition
Improve Access
Under-represented Groups
State Licensing Exams
Accreditation

Relevance of Prior ADN Research:
Past as PrologueSimilar Issues Found Across 35 Years of
Research and Evaluation Studies and Current Project

ADN Research Data
Enhancing Student Outcomes
Patricia Cross (1981)
Taxonomy For Analysis of DataInstitutional Variables
Situational Variables
Dispositional Variables
Institutional Data
Line of Research Focusing on Programmatic Aspects of Programs that Promote or Hinder Student SuccessExample: Method of Selection
Lottery
First-Come, First Served
Full time vs. Part time requirements
Costs

Situational Data
Focus on Particular Situation of Student as Mediator of SuccessExample: Hours Worked /Week
Marital Status
Support Network
Transportation Needs
Child Care

Dispositional Data
Most Predominant Line of Research Found in Literature ReviewFocus on Prior Performance of Student
High School and College GPA
Test Scores
Completion of Prior Coursework
Relevant Work Experience in Health Field

Theoretical Considerations
Point-to-Point TheoryThe greater the correspondence between
elements found in the predictor and in the criterion
Improves the power and reliability of prediction of success in training
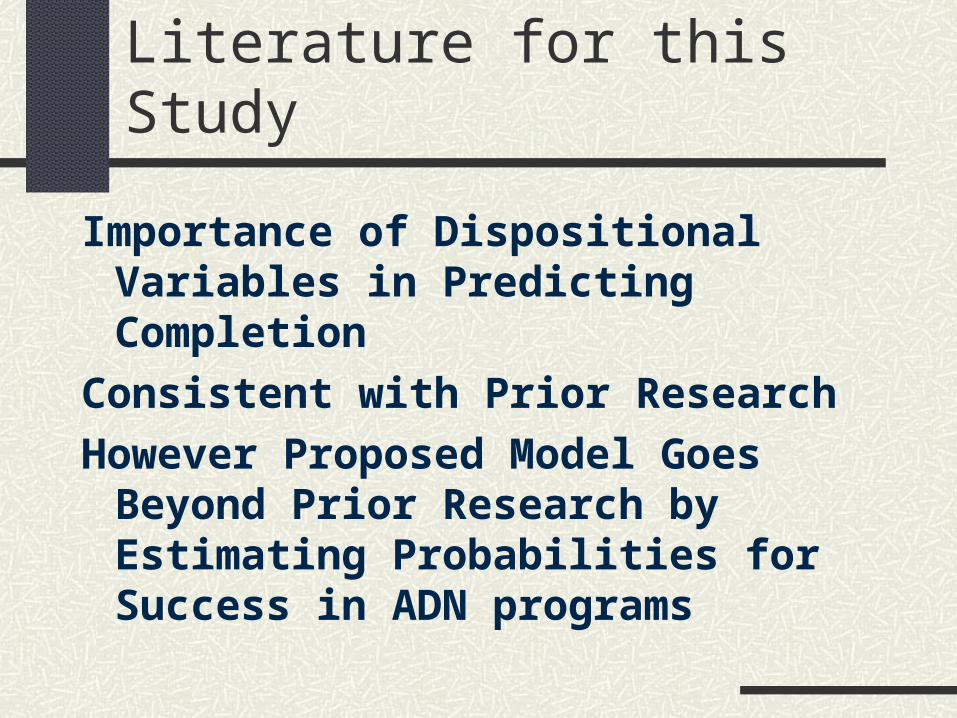
Relevance of Literature for this Study
Importance of Dispositional Variables in Predicting Completion
Consistent with Prior Research
However Proposed Model Goes Beyond Prior Research by Estimating Probabilities for Success in ADN programs
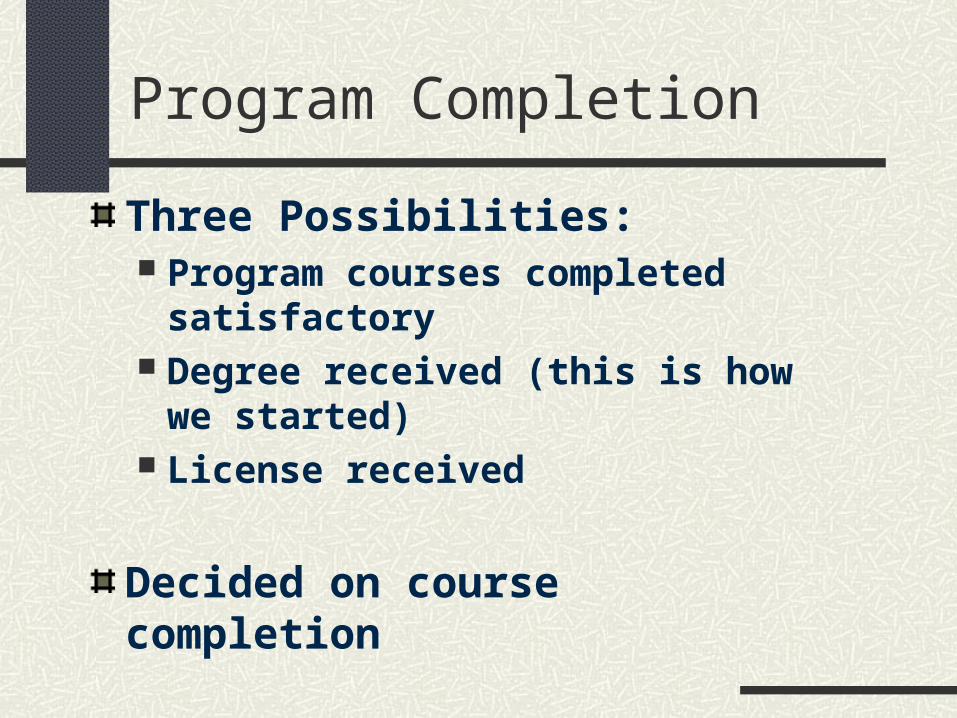
Program Completion
Three Possibilities: Program courses completed satisfactory Degree received (this is how we started) License received
Decided on course completion

Examination of ADN Completion
The cohort Demographics Success by year Success by method of selection

Nursing StudentsGender1994 - 1998
16
84
7078
0
10
20
30
40
50
60
70
80
90
In P
erce
nt
Distribution Success
Male Female

Nursing StudentsEthnicity1994 - 1998
6 914
51
20
5764
7584
69
0
10
20
30
40
50
60
70
80
90
In P
erce
nt
Distribution SuccessAf. Am. Asian Hispanic White Other
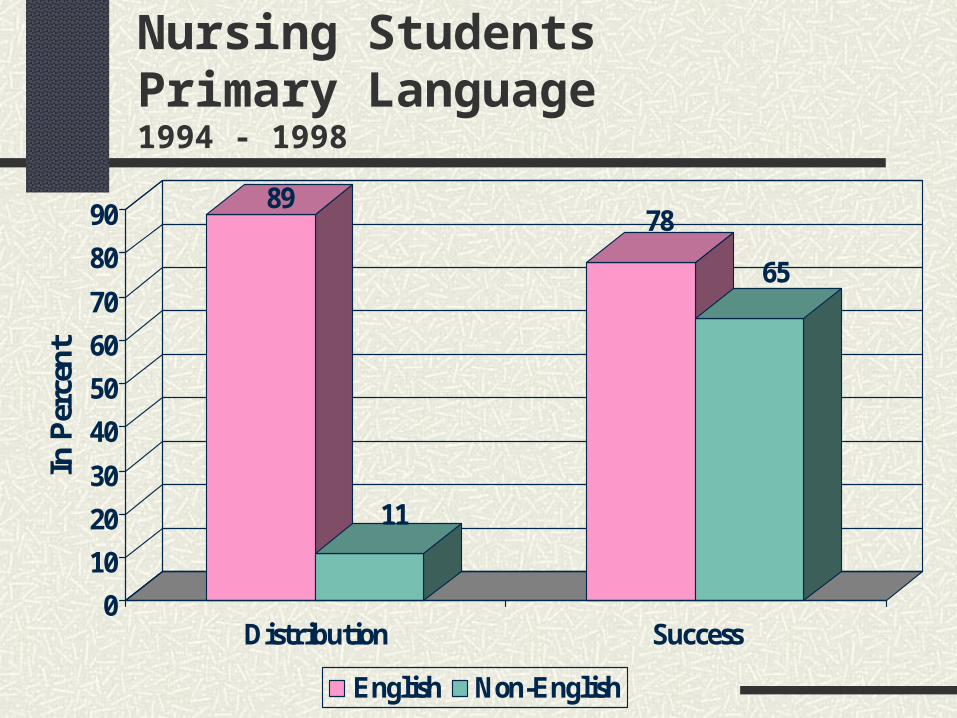
Nursing StudentsPrimary Language1994 - 1998
89
11
78
65
0
10
20
30
40
50
60
70
80
90
In P
erce
nt
Distribution Success
English Non-English

Nursing StudentsAge1994 - 1998
13
28
19 1712
73 1
76 79 80 7874 71
60
51
0
10
20
30
40
50
60
70
80
In P
erce
nt
Distribution Success
20-24 25-29 30-34 35-39 40-44 45-49 50-54 >55

Program Completion by Selection Method by Year
60
65
70
75
80
85
90
1994 1995 1996 1997 1998
Pro
gram
Su
cces
s R
ate
Fixed Ranked

Student Factors in Selection
Student factors related to program completion – within college Factors
Validity evidence
Selection models compared
Bias evidence

Topics of Discussion
Validity Evidence GPA
CollegeCore Biology (Anatomy, Physiology,
Microbiology)English
RepetitionsCore Biology (Anatomy, Physiology,
Microbiology)Minorities with No Repetitions

The Relationship Between GPA in College Courses Before the ADN Program and ADN Program Completion
0%
10%
20%
30%
40%
50%
60%
70%
80%
90%
100%
2 2.5 3 3.5 4
GPA
Perc
ent o
f Pop
ulat
ion
Com
plet
ing
ADN
Prog
ram
College
College Core Biology
College English

The Relationship Between Repetitions of Courses and ADN Program Completion
0%
10%
20%
30%
40%
50%
60%
70%
80%
90%
0 0.5 1 1.5 2
Repetitions Divided by Courses
Pe
rce
nt
of
Po
pu
lati
on
C
om
ple
tin
g A
DN
Pro
gra
m
College CoreBiologyMicrobiologyRepetitionsA&P Repetitions

Percent of Each Ethnic Group with No Core Biology Repetitions
61%
72% 72% 71%
85%
78%
0%
10%
20%
30%
40%
50%
60%
70%
80%
90%
AfricanAmerican
Asian Latino/a Other White AllEthnic Group
Pe
rce
nt
wit
h N
o R
ep
eti
tio
ns
No Core Biology Repetitions

Forming a Composite
The Variables
Relationship to Program Completion
Some Examples

Variables in the Composite
GPA Core Biology (Anatomy,
Physiology, Microbiology) College-wide English
Repetitions in Core Biology Number of Repetitions divided by
number of courses

Predicted Versus Actual Percent Completing an ADN Program
0%
10%
20%
30%
40%
50%
60%
70%
80%
90%
100%
0.2 0.3 0.4 0.5 0.6 0.7 0.8 0.9
Predicted Percent Completing Program
Act
ua
l P
erc
en
t C
om
ple
tin
g P
rog
ram
GPA + Repetitions
GPA Only

Some Examples of the Composite
StudentCollege GPA
Core Biology GPA
English GPA
Core Biology Repetitions
Computed Probability of ADN program Completion
1 2 2 2 0 61%
2 2 2 2 1 36%
3 2.5 3 2 1 47%
4 2.5 2.5 2.5 0 72%
5 2 3 2 0 68%6 2 3 2 0.5 55%7 3 3 3 0.5 71%8 3 3 3 0 80%9 4 4 4 0 91%

Selection Possibilities
Program
SelectionMethod
Not Completed
Completed
Selected B A
Unselected C D
A + B = Selected Students C + D = Unselected Students A / (A + B) = Percent of Selected Students who Complete an ADN Program
D / (C + D) = Percent of Unselected Students who Complete an ADN Program
(A+D) / (A+B+C+D) = Current Completion Rate

Selection Given the Composite of College, English, and Core Biology GPA, and Core Biology Repetitions
0%
10%
20%
30%
40%
50%
60%
70%
80%
90%
100%
Unselected Percent
Per
cen
t of P
op
ula
tion
Co
mp
letin
g
Pro
gra
m
Current CompletionRate
Selected CompletionRate
Unselected CompletionRate

Unselected Percent, Composite, and Selected Completion Rate
Unselec ted
Percent Composite
Selec ted
Completion
Rate1% 40% 78%5% 56% 79%
10% 64% 80%
15% 68% 81%
20% 71% 82%
25% 74% 83%
31% 76% 84%
41% 79% 85%
52% 82% 86%
62% 84% 88%
75% 87% 91%
85% 89% 91%
90% 90% 93%

Bias Evidence
The Composite prediction of Completion Ethnicity Gender Age Language Background
Effect on Selection
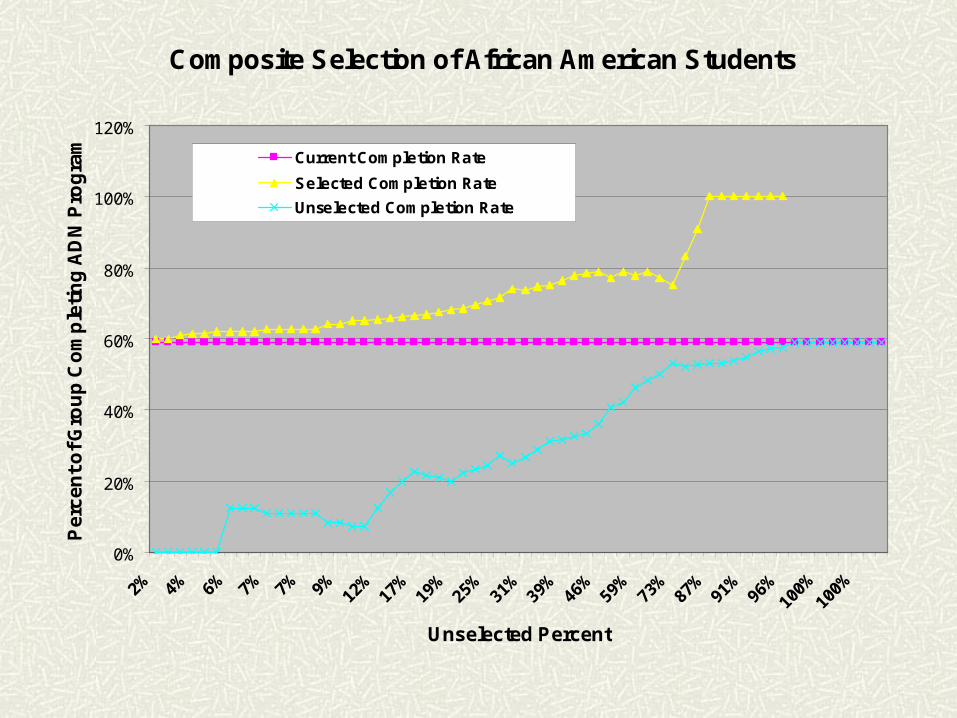
Composite Selection of African American Students
0%
20%
40%
60%
80%
100%
120%
2% 4% 6% 7% 7% 9% 12%
17%
19%
25%
31%
39%
46%
59%
73%
87%
91%
96%
100%
100%
Unselected Percent
Pe
rce
nt
of
Gro
up
Co
mp
leti
ng
AD
N P
rog
ram Current Completion Rate
Selected Completion Rate
Unselected Completion Rate
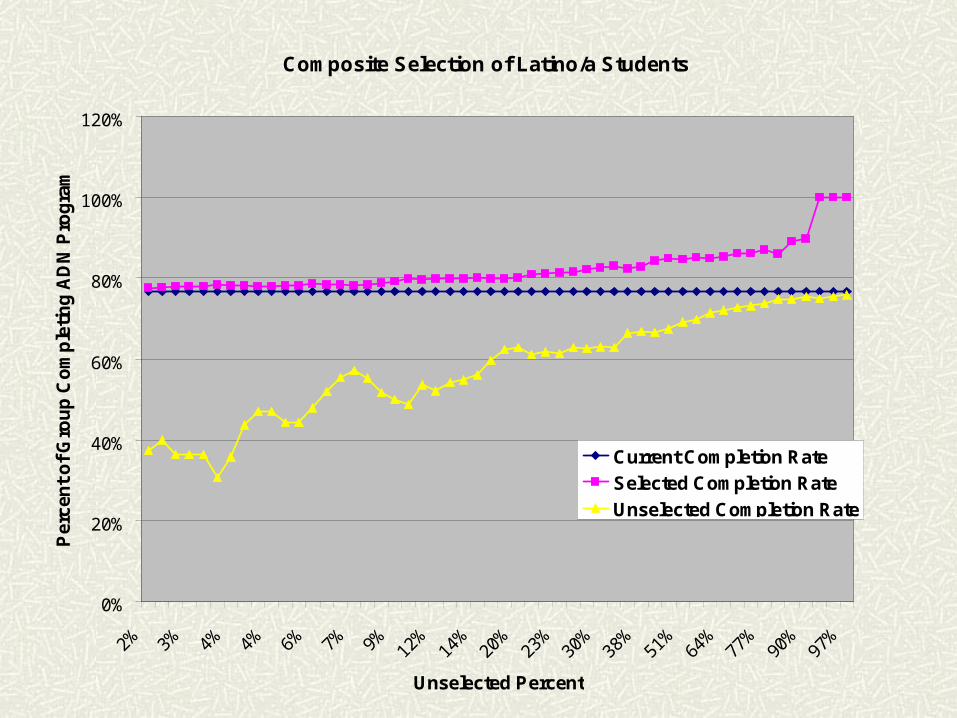
Composite Selection of Latino/a Students
0%
20%
40%
60%
80%
100%
120%
2% 3% 4% 4% 6% 7% 9% 12%
14%
20%
23%
30%
38%
51%
64%
77%
90%
97%
Unselected Percent
Per
cen
t o
f G
rou
p C
om
ple
ting
AD
N P
rog
ram
Current Completion Rate
Selected Completion Rate
Unselected Completion Rate

Original and New Completion Rates Compared at a Point That Unselects 18% of the Population
Ethnicity Original N New NOriginal Completers
New Completers
Original Completion Percent
New Completion Percent
African American 132 91 78 67 59% 74%Asian 278 219 168 144 60% 66%Latino/a 400 307 307 250 77% 81%Other 525 397 366 293 70% 74%White 1318 1171 1126 1025 85% 88%Total 2653 2185 2045 1779 77% 81%
Programmatic and Student Factors in
Selection
Future Research into Additional Selection Criteria to further improve success rates Interviews Work Experience Recommendations

Setting a Cut Score Your Part
The over-subscription to your programs
Your comfort level with the rejection of potentially successful applicants
Your target program completion rate
Your willingness to change the demographics of your entry population

Next Steps
Where do we go from here?

Additional Slides
The formula
The core biology model compared to the composite model
Program Completion as a Function of GPA and Core Biology Repetitions

The Formula
exp(-1.3907+.3465(College GPA)+.3139(English GPA)+.267(Biology GPA)-1.0279(Biology Reps))__________________________________________________________________________________
(1+exp(-1.3907+.3465(College GPA)+.3139(English GPA)+.267(Biology GPA)-1.0279(Biology Reps)))

Selection Using Core Biology GPA
0%
10%
20%
30%
40%
50%
60%
70%
80%
90%
100%
Unselected Percent
Pe
rce
nt
of
Gro
up
Co
mp
leti
ng
AD
N P
rog
ram
Current Completion Rate
Selected Completion Rate
Unselected Completion Rate
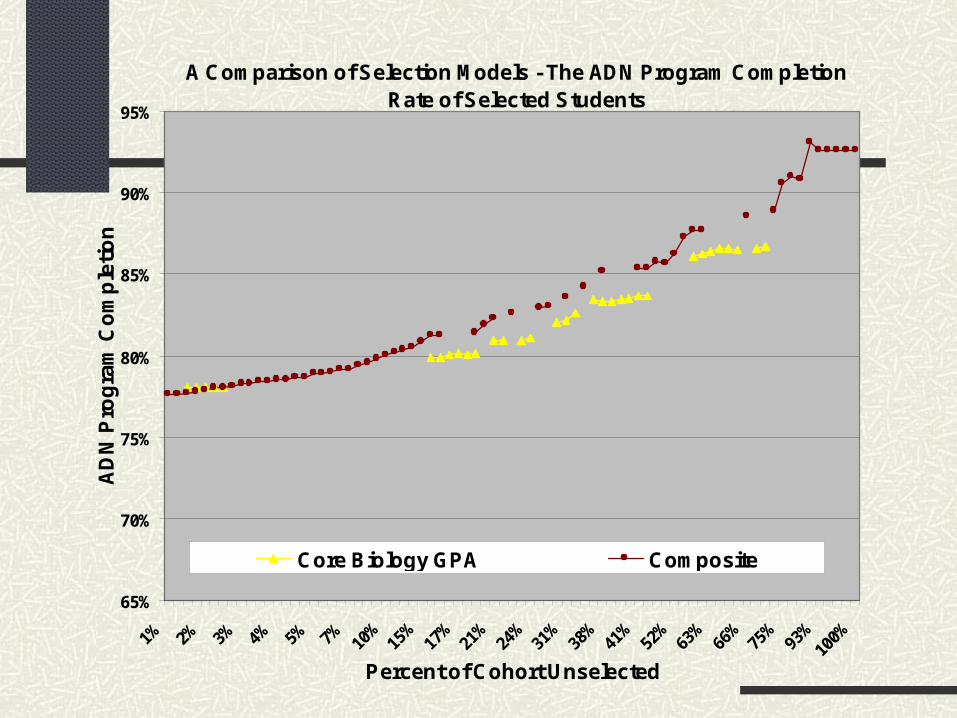
A Comparison of Selection Models - The ADN Program Completion Rate of Selected Students
65%
70%
75%
80%
85%
90%
95%
1% 2% 3% 4% 5% 7% 10%
15%
17%
21%
24%
31%
38%
41%
52%
63%
66%
75%
93%
100%
Percent of Cohort Unselected
AD
N P
rog
ram
Co
mp
leti
on
Core Biology GPA Composite

A Comparision of Selection Methods The ADN Program Completion Rate
of Unselected Students
0%
10%
20%
30%
40%
50%
60%
70%
80%
90%
1%
2%
2%
3%
4%
5%
6%
8%
10
%
14
%
16
%
17
%
21
%
24
%
28
%
33
%
38
%
40
%
44
%
57
%
63
%
64
%
69
%
80
%
93
%
10
0%
Percent of Cohort Unselected
AD
N P
rog
ram
Co
mp
leti
on
Pe
rce
nt
Core Biology GPA Composite

Average GPA needed to Offset Repetitions of Core Biology Courses in order to Achieve a 70% probability of Program
Completion
0.00
0.50
1.00
1.50
2.00
2.50
3.00
3.50
4.00
4.50
5.00
0 0.25 0.5 0.75 1 1.25 1.5 1.75
Repetitions Divided by Courses
Av
era
ge
GP
A
GPA