ADMS Testbed Capabilities - NREL · ADMS Testbed Capabilities Murali Baggu, NREL ... -1000-500 0...
25
ADMS Testbed Capabilities Murali Baggu, NREL Santosh Veda, NREL Scott Koehler, SE March 29, 2017 EPRI-Integrate Industry Day
Transcript of ADMS Testbed Capabilities - NREL · ADMS Testbed Capabilities Murali Baggu, NREL ... -1000-500 0...
ADMS Testbed Capabilities
Murali Baggu, NREL
Santosh Veda, NREL
Scott Koehler, SE
March 29, 2017
EPRI-Integrate Industry Day
2
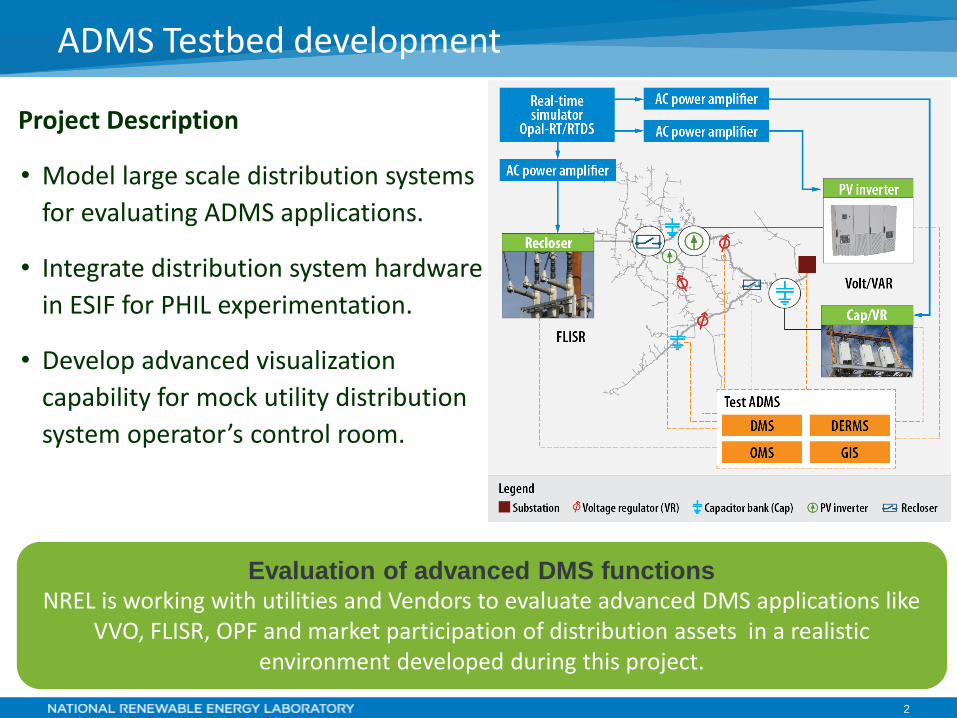
Project Description
• Model large scale distribution systems
for evaluating ADMS applications.
• Integrate distribution system hardware
in ESIF for PHIL experimentation.
• Develop advanced visualization
capability for mock utility distribution
system operator’s control room.
Evaluation of advanced DMS functions NREL is working with utilities and Vendors to evaluate advanced DMS applications like
VVO, FLISR, OPF and market participation of distribution assets in a realistic environment developed during this project.
ADMS Testbed development
3
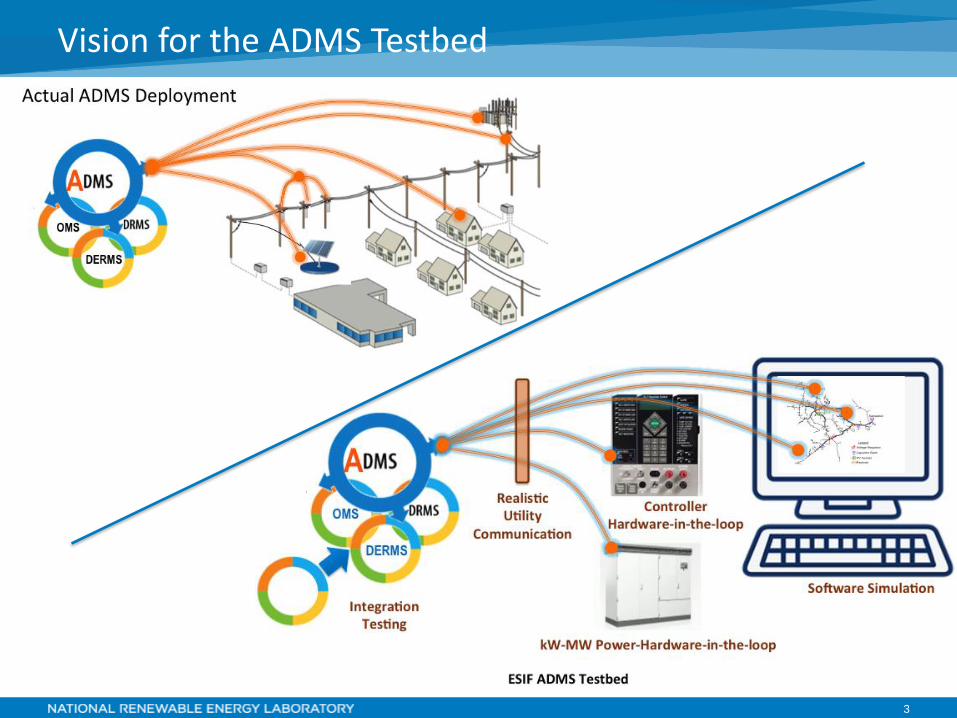
Vision for the ADMS Testbed
4
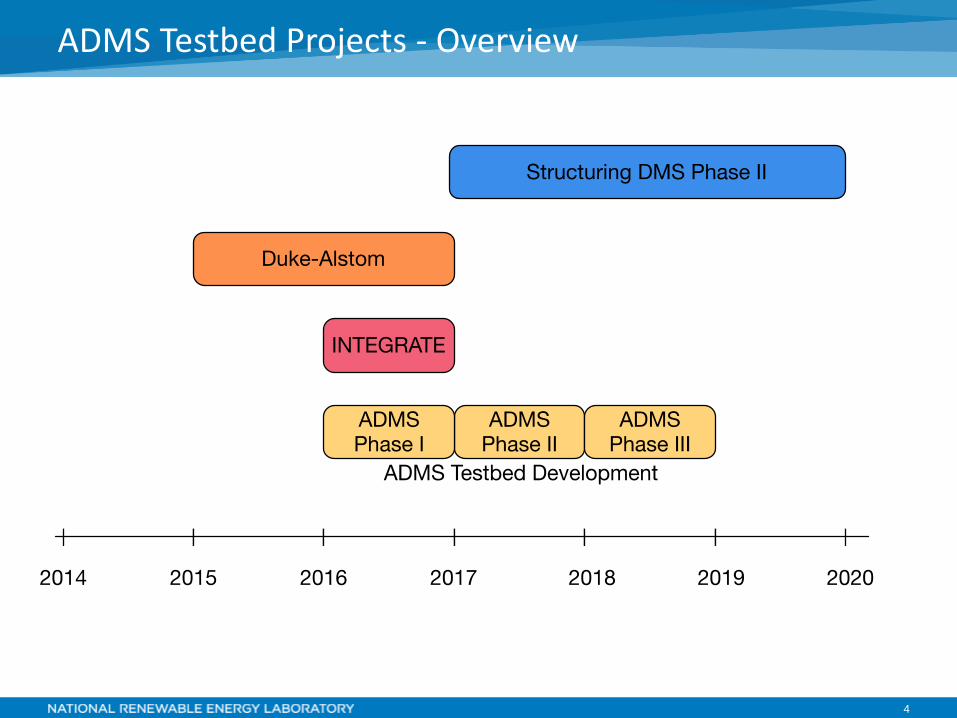
ADMS Testbed Projects - Overview
5
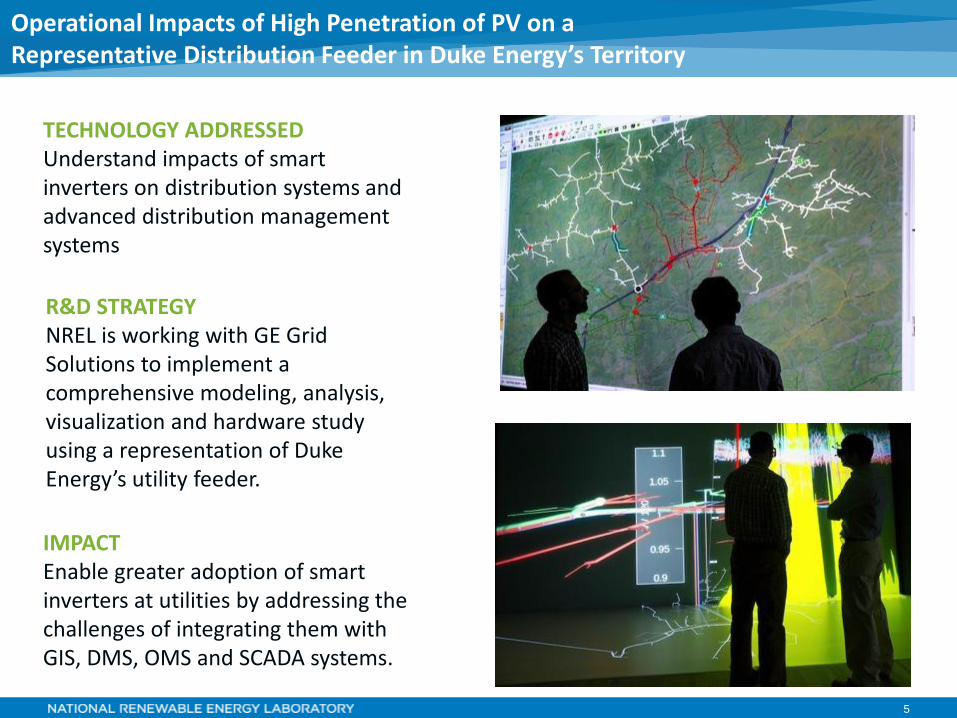
TECHNOLOGY ADDRESSED Understand impacts of smart inverters on distribution systems and advanced distribution management systems
R&D STRATEGY NREL is working with GE Grid Solutions to implement a comprehensive modeling, analysis, visualization and hardware study using a representation of Duke Energy’s utility feeder.
IMPACT Enable greater adoption of smart inverters at utilities by addressing the challenges of integrating them with GIS, DMS, OMS and SCADA systems.
Operational Impacts of High Penetration of PV on a Representative Distribution Feeder in Duke Energy’s Territory
6
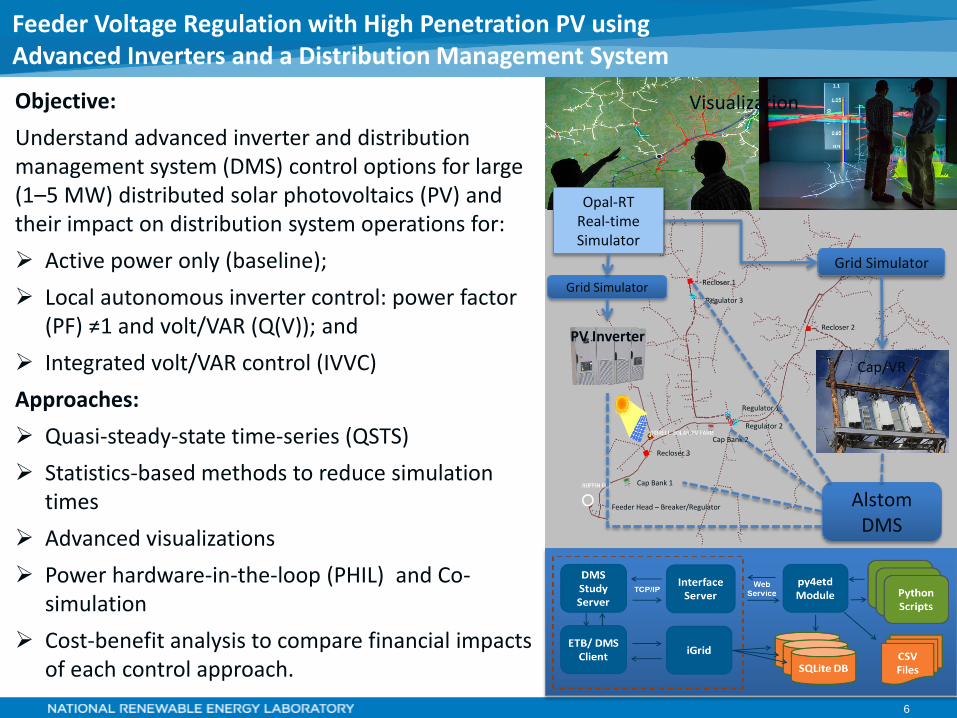
Objective:
Understand advanced inverter and distribution management system (DMS) control options for large (1–5 MW) distributed solar photovoltaics (PV) and their impact on distribution system operations for:
Active power only (baseline);
Local autonomous inverter control: power factor (PF) ≠1 and volt/VAR (Q(V)); and
Integrated volt/VAR control (IVVC)
Approaches:
Quasi-steady-state time-series (QSTS)
Statistics-based methods to reduce simulation times
Advanced visualizations
Power hardware-in-the-loop (PHIL) and Co-simulation
Cost-benefit analysis to compare financial impacts of each control approach.
Energy Systems
Integration
Recloser 1
Recloser 2
Recloser 3
Cap Bank 1
Cap Bank 2
Regulator 1
Regulator 2
Regulator 3
Feeder Head – Breaker/Regulator Alstom DMS
Opal-RT Real-time Simulator
Grid Simulator
Grid Simulator
Visualization
PV Inverter
Cap/VR
Feeder Voltage Regulation with High Penetration PV using Advanced Inverters and a Distribution Management System
7
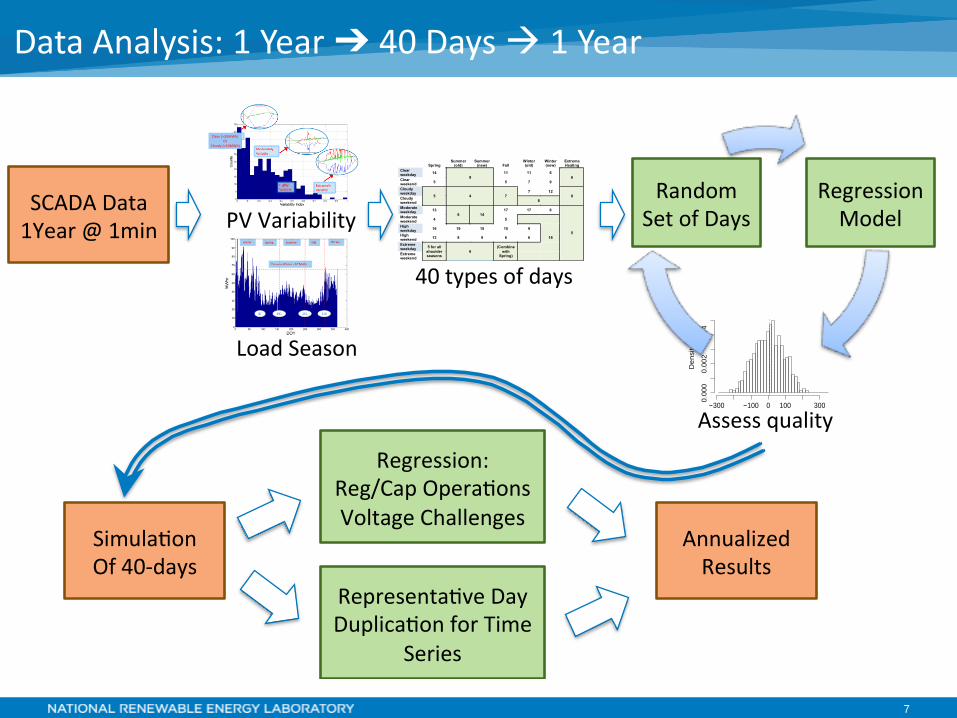
Data Analysis: 1 Year ➔ 40 Days 1 Year
Clear(>35MWh)Or
Cloudy(<10MWh)
Spring Summer
(old) Summer
(new) Fall Winter (old)
Winter (new)
Extreme Heating
Clear weekday
14
9
11 11 6
6 Clear weekend
5 5 7 9
Cloudy weekday
5 4 7
7 12
8 Cloudy weekend
8
Moderate weekday
13
6 14
17 17 6
5
Moderate weekend
4 5
High weekday
16 19 15 15 9
High weekend
13 8 9 6 6 16
Extreme weekday
5 for all
shoulder seasons
6
(Combine
with Spring)
Extreme weekend
Histogram of t
t*
De
nsity
−300 −100 0 100 300
0.0
00
0.0
02
0.0
04
−3 −2 −1 0 1 2 3
−2
00
02
00
Quantiles of Standard Nor mal
t*
SCADAData1Year@1min
RandomSetofDays
RegressionModel
Simula onOf40-days
Regression:Reg/CapOpera onsVoltageChallenges
AnnualizedResults
Representa veDayDuplica onforTime
Series
PVVariability
Assessquality
LoadSeason
40typesofdays
8
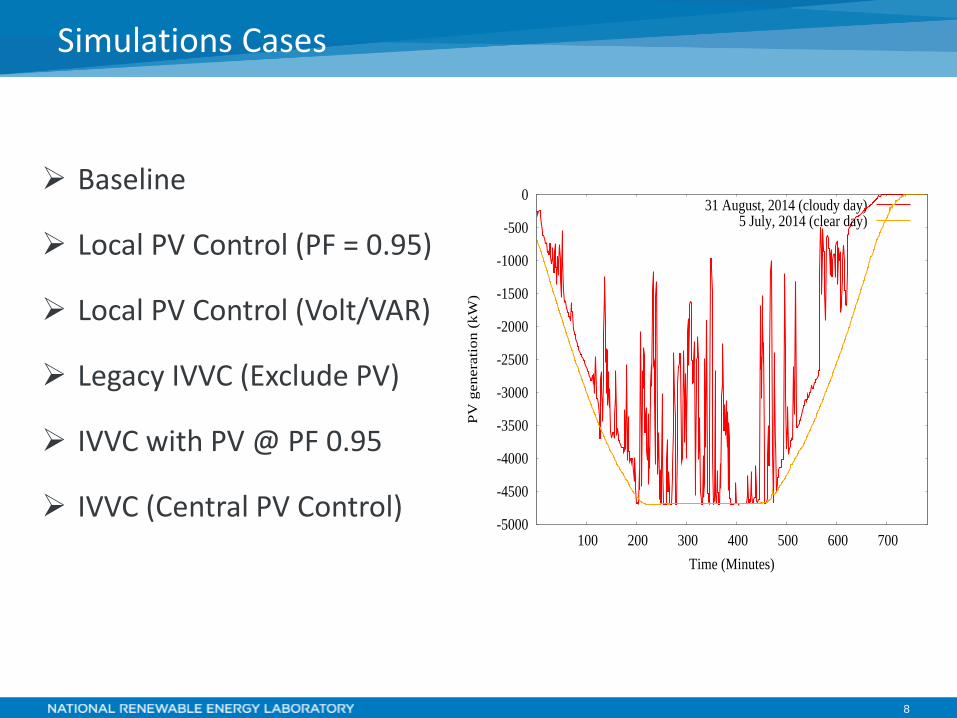
Simulations Cases
Baseline
Local PV Control (PF = 0.95)
Local PV Control (Volt/VAR)
Legacy IVVC (Exclude PV)
IVVC with PV @ PF 0.95
IVVC (Central PV Control)
-5000
-4500
-4000
-3500
-3000
-2500
-2000
-1500
-1000
-500
0
100 200 300 400 500 600 700
PV
genera
tio
n (
kW
)
Time (Minutes)
31 August, 2014 (cloudy day)5 July, 2014 (clear day)
9
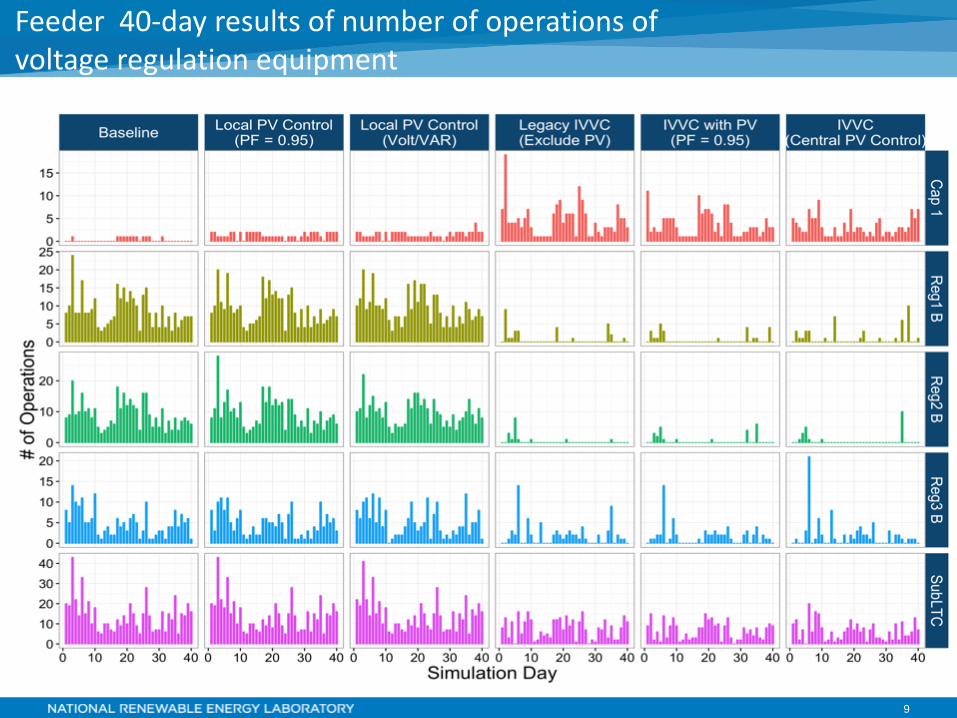
Feeder 40-day results of number of operations of voltage regulation equipment
10
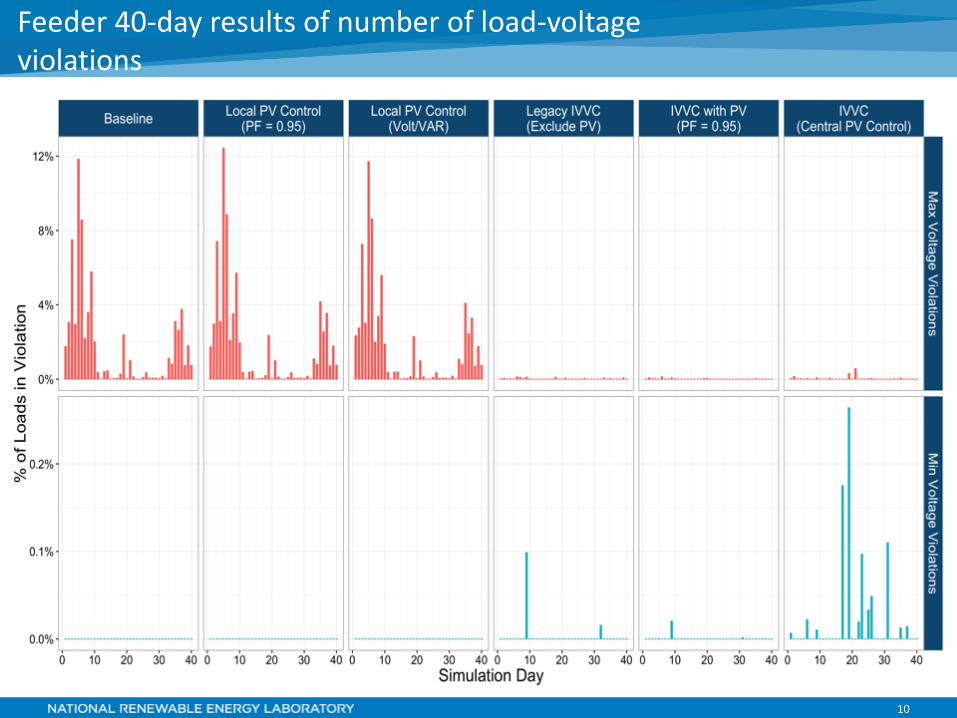
Feeder 40-day results of number of load-voltage violations
11
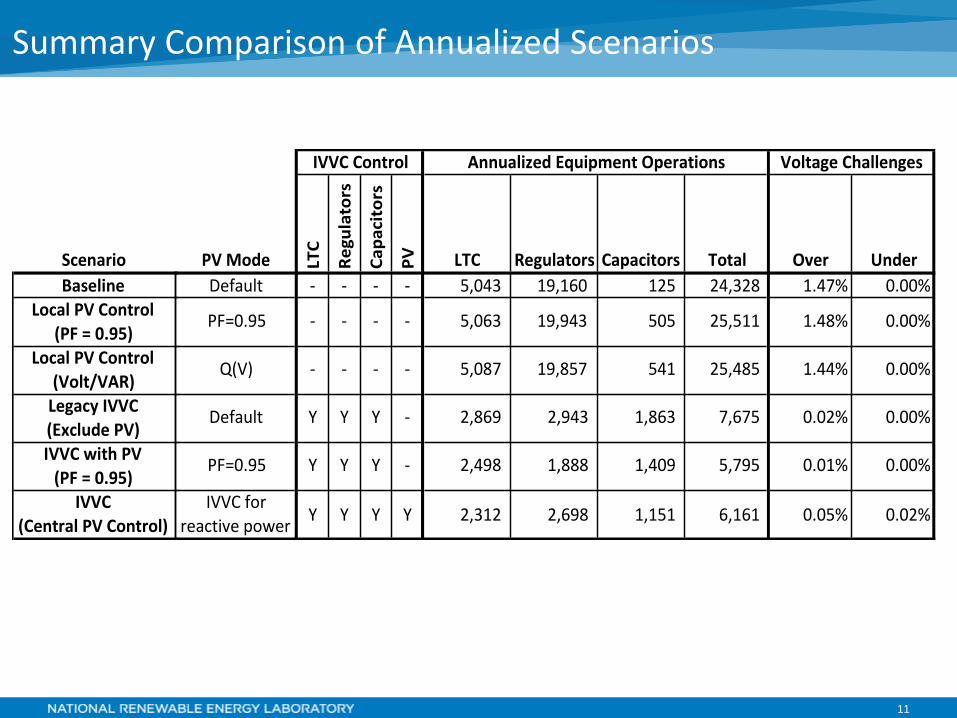
Summary Comparison of Annualized Scenarios
Scenario
BaselineLocalPVControl
(PF=0.95)
LocalPVControl(Volt/VAR)LegacyIVVC(ExcludePV)
IVVCwithPV(PF=0.95)
IVVC(CentralPVControl)
PVMode LTC
Regulators
Capacitors
PV LTC Regulators Capacitors Total Over Under
Default - - - - 5,043 19,160 125 24,328 1.47% 0.00%
PF=0.95 - - - - 5,063 19,943 505 25,511 1.48% 0.00%
Q(V) - - - - 5,087 19,857 541 25,485 1.44% 0.00%
Default Y Y Y - 2,869 2,943 1,863 7,675 0.02% 0.00%
PF=0.95 Y Y Y - 2,498 1,888 1,409 5,795 0.01% 0.00%
IVVCforreactivepower
Y Y Y Y 2,312 2,698 1,151 6,161 0.05% 0.02%
IVVCControl AnnualizedEquipmentOperations VoltageChallenges
12
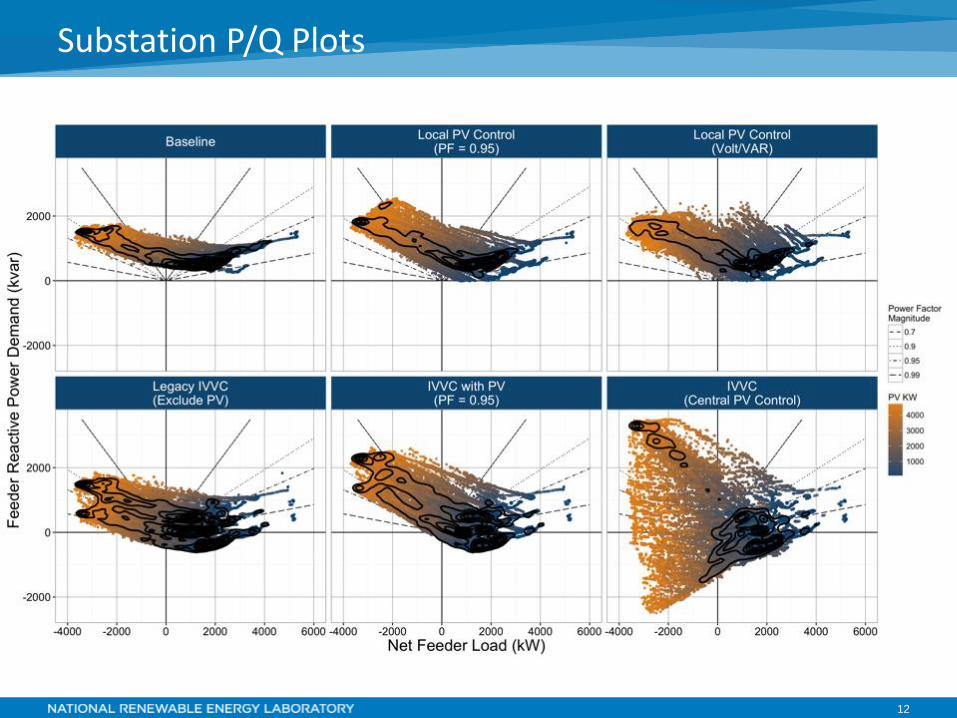
Substation P/Q Plots
13
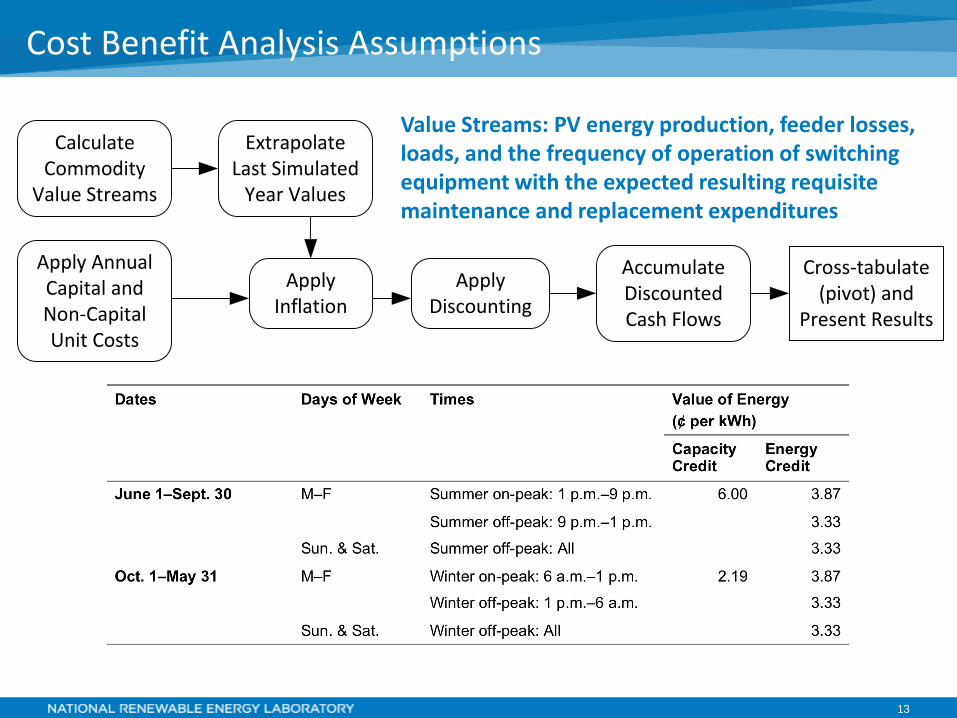
Cost Benefit Analysis Assumptions
Calculate Commodity
Value Streams
Extrapolate Last Simulated
Year Values
Apply Annual Capital and Non-Capital Unit Costs
Apply Inflation
Apply Discounting
Cross-tabulate (pivot) and
Present Results
Accumulate Discounted Cash Flows
Value Streams: PV energy production, feeder losses, loads, and the frequency of operation of switching equipment with the expected resulting requisite maintenance and replacement expenditures
14
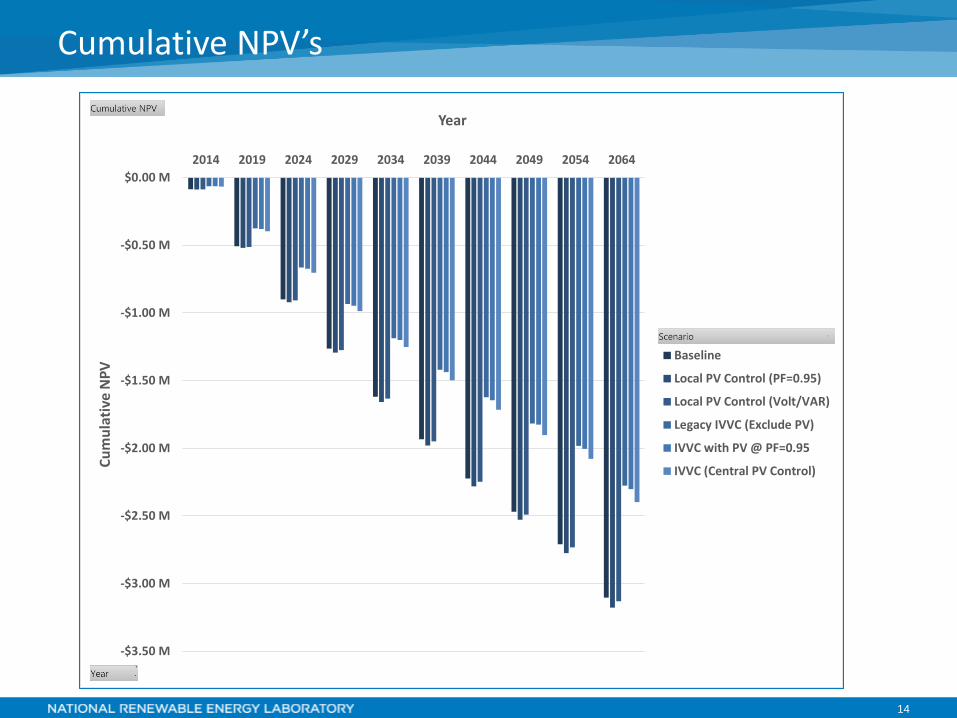
-$3.50 M
-$3.00 M
-$2.50 M
-$2.00 M
-$1.50 M
-$1.00 M
-$0.50 M
$0.00 M
2014 2019 2024 2029 2034 2039 2044 2049 2054 2064
Cu
mu
lati
ve N
PV
Year
Baseline
Local PV Control (PF=0.95)
Local PV Control (Volt/VAR)
Legacy IVVC (Exclude PV)
IVVC with PV @ PF=0.95
IVVC (Central PV Control)
Cumulative NPV’s
15
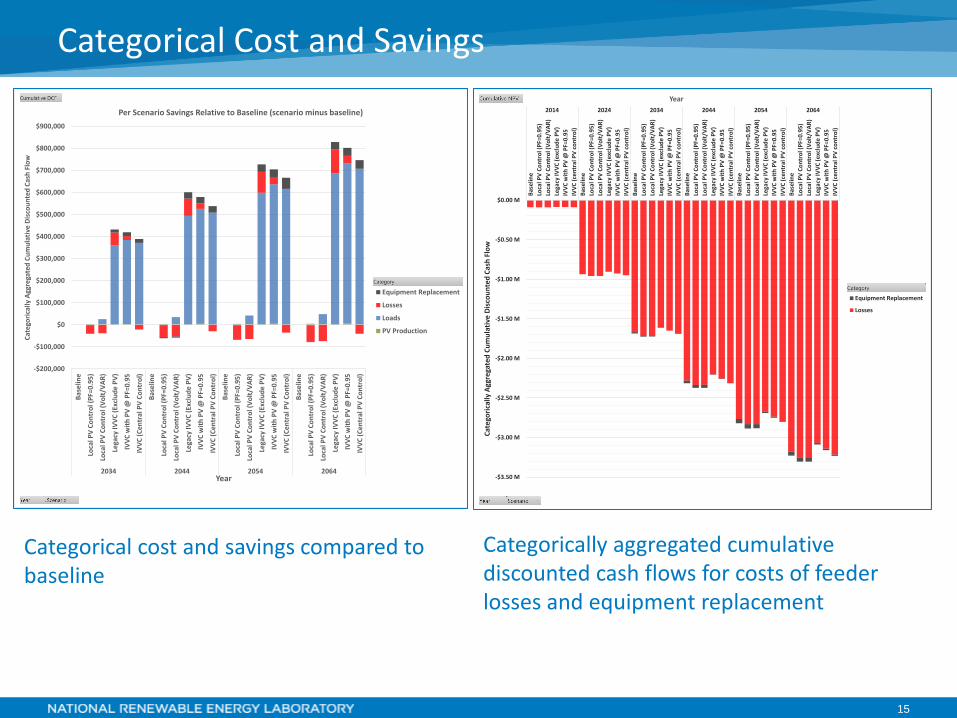
Categorical Cost and Savings
-$200,000
-$100,000
$0
$100,000
$200,000
$300,000
$400,000
$500,000
$600,000
$700,000
$800,000
$900,000
Bas
elin
e
Loca
l PV
Co
ntr
ol (
PF=
0.9
5)
Loca
l PV
Co
ntr
ol (
Vo
lt/V
AR
)
Lega
cy IV
VC
(Ex
clu
de
PV
)
IVV
C w
ith
PV
@ P
F=0.
95
IVV
C (
Cen
tral
PV
Co
ntr
ol)
Bas
elin
e
Loca
l PV
Co
ntr
ol (
PF=
0.9
5)
Loca
l PV
Co
ntr
ol (
Vo
lt/V
AR
)
Lega
cy IV
VC
(Ex
clu
de
PV
)
IVV
C w
ith
PV
@ P
F=0.
95
IVV
C (
Ce
ntr
al P
V C
on
tro
l)
Bas
elin
e
Loca
l PV
Co
ntr
ol (
PF=
0.9
5)
Loca
l PV
Co
ntr
ol (
Vo
lt/V
AR
)
Lega
cy IV
VC
(Ex
clu
de
PV
)
IVV
C w
ith
PV
@ P
F=0.
95
IVV
C (
Ce
ntr
al P
V C
on
tro
l)
Bas
elin
e
Loca
l PV
Co
ntr
ol (
PF=
0.9
5)
Loca
l PV
Co
ntr
ol (
Vo
lt/V
AR
)
Lega
cy IV
VC
(Ex
clu
de
PV
)
IVV
C w
ith
PV
@ P
F=0.
95
IVV
C (
Ce
ntr
al P
V C
on
tro
l)
2034 2044 2054 2064
Cat
ego
rica
lly A
ggre
gate
d C
um
ula
tive
Dis
cou
nte
d C
ash
Flo
w
Year
Per Scenario Savings Relative to Baseline (scenario minus baseline)
Equipment Replacement
Losses
Loads
PV Production
-$3.50 M
-$3.00 M
-$2.50 M
-$2.00 M
-$1.50 M
-$1.00 M
-$0.50 M
$0.00 M
Bas
elin
e
Loca
l PV
Co
ntr
ol (
PF=
0.9
5)
Loca
l PV
Co
ntr
ol (
Vo
lt/V
AR
)
Lega
cy IV
VC
(e
xclu
de
PV
)
IVV
C w
ith
PV
@ P
F=0
.95
IVV
C (
cen
tral
PV
co
ntr
ol)
Bas
elin
e
Loca
l PV
Co
ntr
ol (
PF=
0.9
5)
Loca
l PV
Co
ntr
ol (
Vo
lt/V
AR
)
Lega
cy IV
VC
(e
xclu
de
PV
)
IVV
C w
ith
PV
@ P
F=0
.95
IVV
C (
cen
tral
PV
co
ntr
ol)
Bas
elin
e
Loca
l PV
Co
ntr
ol (
PF=
0.9
5)
Loca
l PV
Co
ntr
ol (
Vo
lt/V
AR
)
Lega
cy IV
VC
(e
xclu
de
PV
)
IVV
C w
ith
PV
@ P
F=0
.95
IVV
C (
cen
tral
PV
co
ntr
ol)
Bas
elin
e
Loca
l PV
Co
ntr
ol (
PF=
0.9
5)
Loca
l PV
Co
ntr
ol (
Vo
lt/V
AR
)
Lega
cy IV
VC
(e
xclu
de
PV
)
IVV
C w
ith
PV
@ P
F=0
.95
IVV
C (
cen
tral
PV
co
ntr
ol)
Bas
elin
e
Loca
l PV
Co
ntr
ol (
PF=
0.9
5)
Loca
l PV
Co
ntr
ol (
Vo
lt/V
AR
)
Lega
cy IV
VC
(e
xclu
de
PV
)
IVV
C w
ith
PV
@ P
F=0
.95
IVV
C (
cen
tral
PV
co
ntr
ol)
Bas
elin
e
Loca
l PV
Co
ntr
ol (
PF=
0.9
5)
Loca
l PV
Co
ntr
ol (
Vo
lt/V
AR
)
Lega
cy IV
VC
(e
xclu
de
PV
)
IVV
C w
ith
PV
@ P
F=0
.95
IVV
C (
cen
tral
PV
co
ntr
ol)
2014 2024 2034 2044 2054 2064
Cat
ego
rica
lly A
ggre
gate
d C
um
ula
tive
Dis
cou
nte
d C
ash
Flo
w
Year
Equipment Replacement
Losses
Categorically aggregated cumulative discounted cash flows for costs of feeder losses and equipment replacement
Categorical cost and savings compared to baseline
16
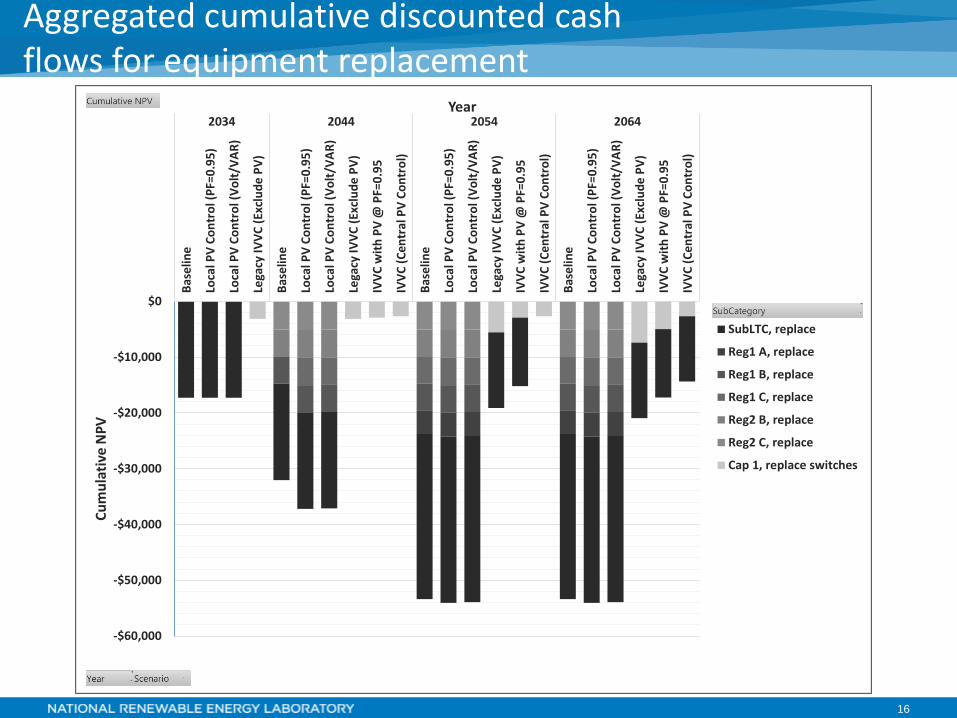
Aggregated cumulative discounted cash flows for equipment replacement
-$60,000
-$50,000
-$40,000
-$30,000
-$20,000
-$10,000
$0
Bas
elin
e
Loca
l PV
Co
ntr
ol (
PF=
0.9
5)
Loca
l PV
Co
ntr
ol (
Vo
lt/V
AR
)
Lega
cy IV
VC
(Ex
clu
de
PV
)
Bas
elin
e
Loca
l PV
Co
ntr
ol (
PF=
0.9
5)
Loca
l PV
Co
ntr
ol (
Vo
lt/V
AR
)
Lega
cy IV
VC
(Ex
clu
de
PV
)
IVV
C w
ith
PV
@ P
F=0.
95
IVV
C (
Cen
tral
PV
Co
ntr
ol)
Bas
elin
e
Loca
l PV
Co
ntr
ol (
PF=
0.9
5)
Loca
l PV
Co
ntr
ol (
Vo
lt/V
AR
)
Lega
cy IV
VC
(Ex
clu
de
PV
)
IVV
C w
ith
PV
@ P
F=0.
95
IVV
C (
Cen
tral
PV
Co
ntr
ol)
Bas
elin
e
Loca
l PV
Co
ntr
ol (
PF=
0.9
5)
Loca
l PV
Co
ntr
ol (
Vo
lt/V
AR
)
Lega
cy IV
VC
(Ex
clu
de
PV
)
IVV
C w
ith
PV
@ P
F=0.
95
IVV
C (
Cen
tral
PV
Co
ntr
ol)
2034 2044 2054 2064
Cu
mu
lati
ve N
PV
Year
SubLTC, replace
Reg1 A, replace
Reg1 B, replace
Reg1 C, replace
Reg2 B, replace
Reg2 C, replace
Cap 1, replace switches
17
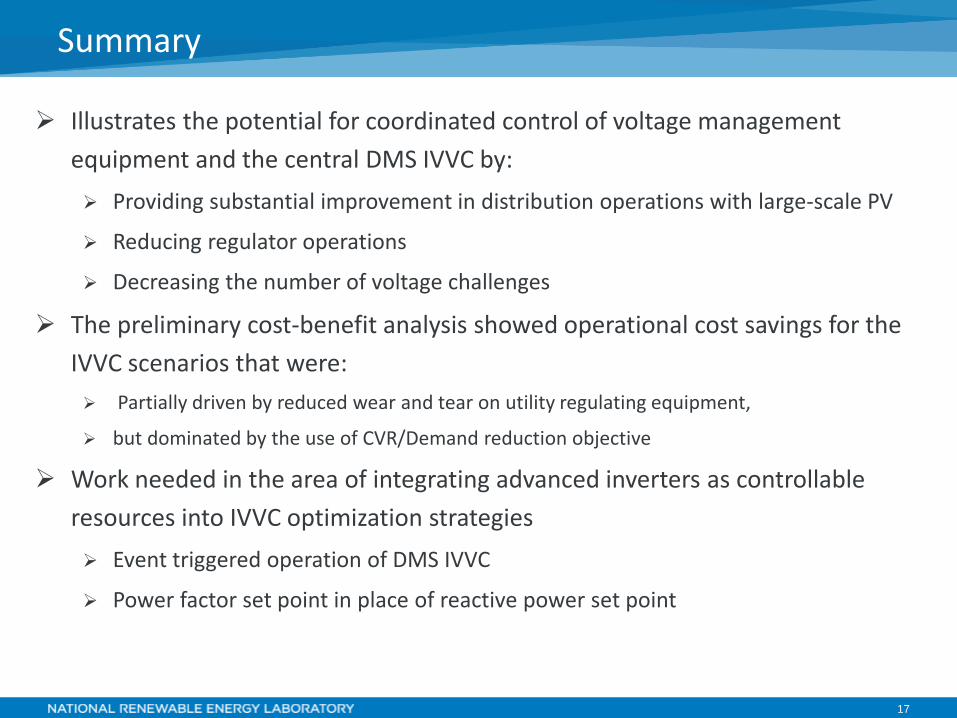
Summary
Illustrates the potential for coordinated control of voltage management
equipment and the central DMS IVVC by:
Providing substantial improvement in distribution operations with large-scale PV
Reducing regulator operations
Decreasing the number of voltage challenges
The preliminary cost-benefit analysis showed operational cost savings for the
IVVC scenarios that were:
Partially driven by reduced wear and tear on utility regulating equipment,
but dominated by the use of CVR/Demand reduction objective
Work needed in the area of integrating advanced inverters as controllable
resources into IVVC optimization strategies
Event triggered operation of DMS IVVC
Power factor set point in place of reactive power set point
18
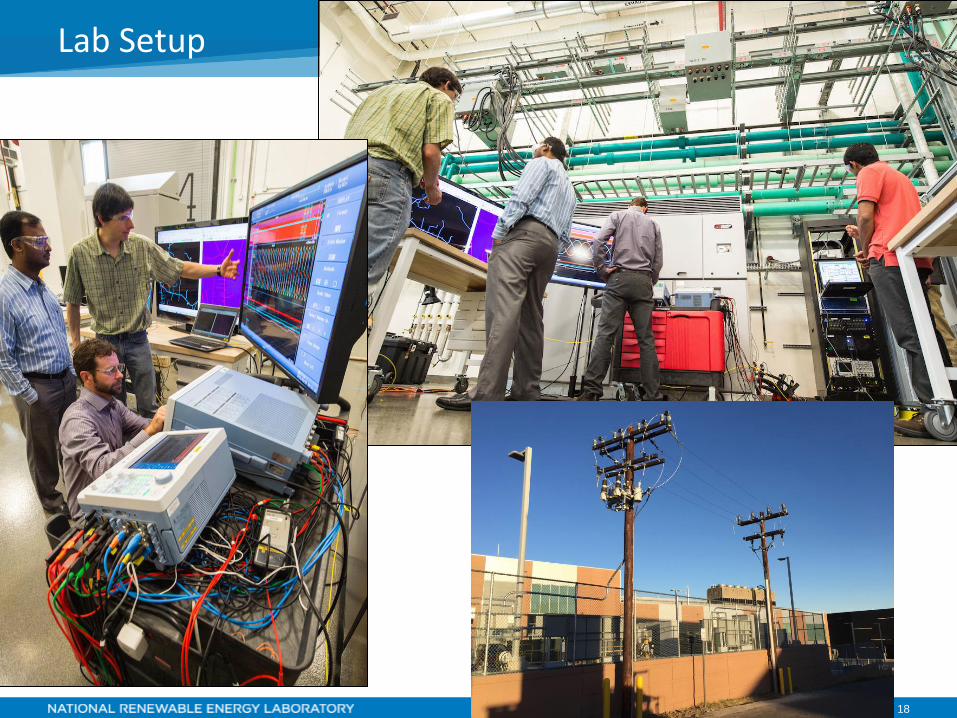
Lab Setup
19
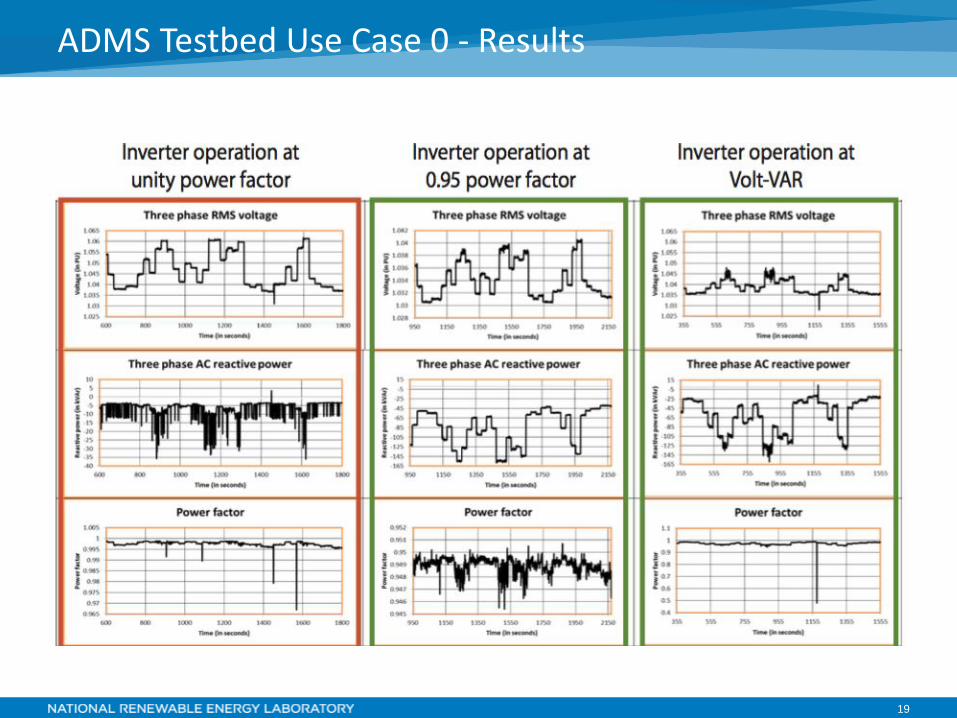
ADMS Testbed Use Case 0 - Results
20
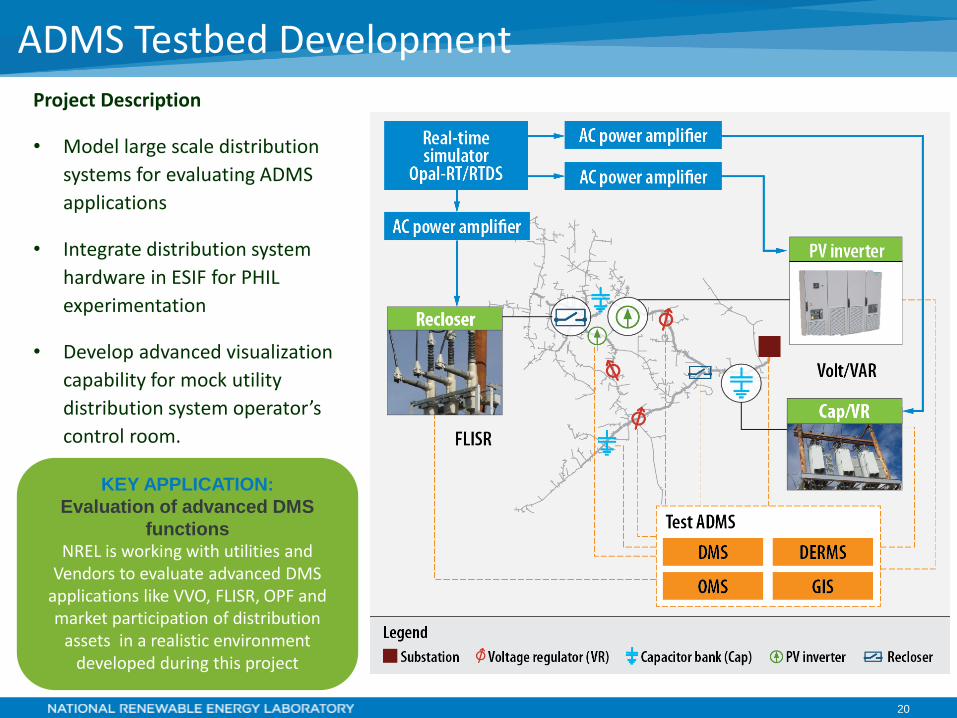
Project Description
• Model large scale distribution
systems for evaluating ADMS
applications
• Integrate distribution system
hardware in ESIF for PHIL
experimentation
• Develop advanced visualization
capability for mock utility
distribution system operator’s
control room.
ADMS Testbed Development
KEY APPLICATION:
Evaluation of advanced DMS
functions NREL is working with utilities and
Vendors to evaluate advanced DMS applications like VVO, FLISR, OPF and market participation of distribution
assets in a realistic environment developed during this project
21
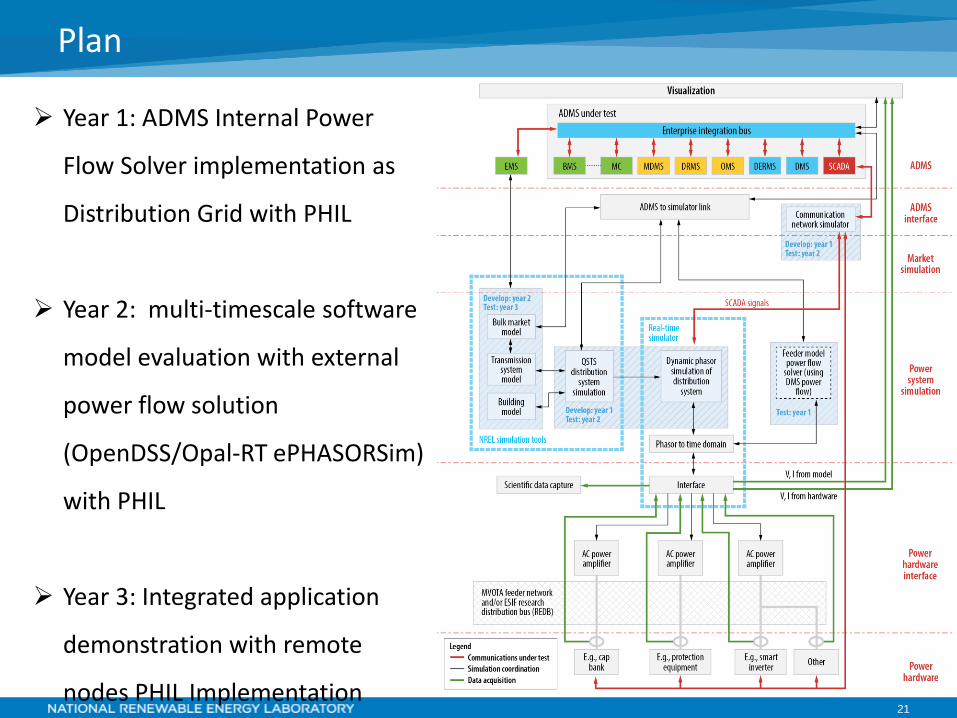
Plan
Year 1: ADMS Internal Power
Flow Solver implementation as
Distribution Grid with PHIL
Year 2: multi-timescale software
model evaluation with external
power flow solution
(OpenDSS/Opal-RT ePHASORSim)
with PHIL
Year 3: Integrated application
demonstration with remote
nodes PHIL Implementation
22
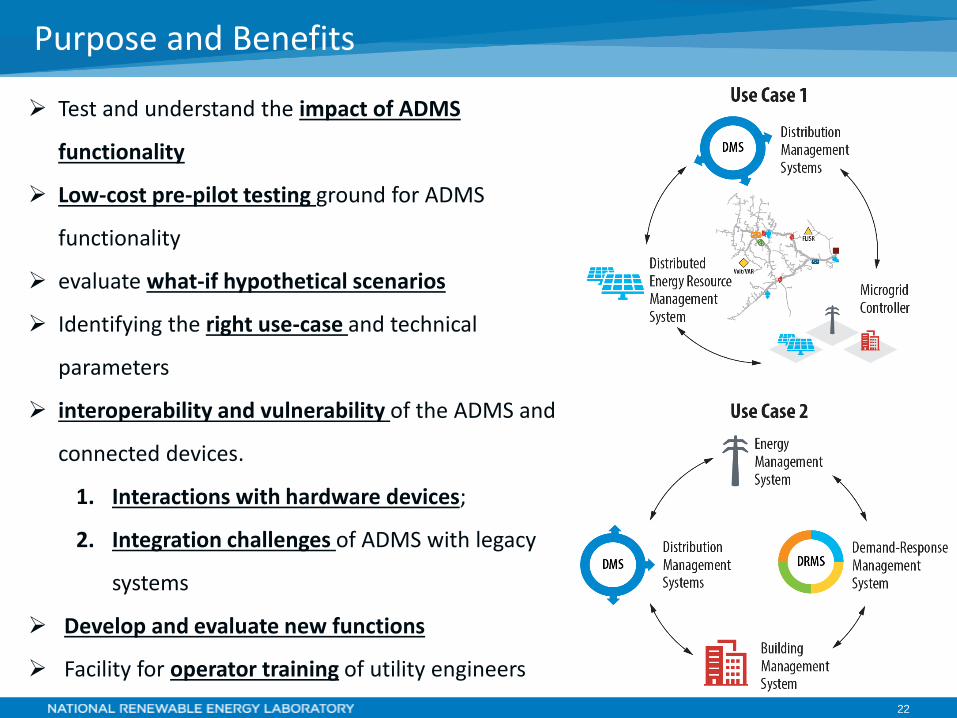
Purpose and Benefits
Test and understand the impact of ADMS
functionality
Low-cost pre-pilot testing ground for ADMS
functionality
evaluate what-if hypothetical scenarios
Identifying the right use-case and technical
parameters
interoperability and vulnerability of the ADMS and
connected devices.
1. Interactions with hardware devices;
2. Integration challenges of ADMS with legacy
systems
Develop and evaluate new functions
Facility for operator training of utility engineers
23
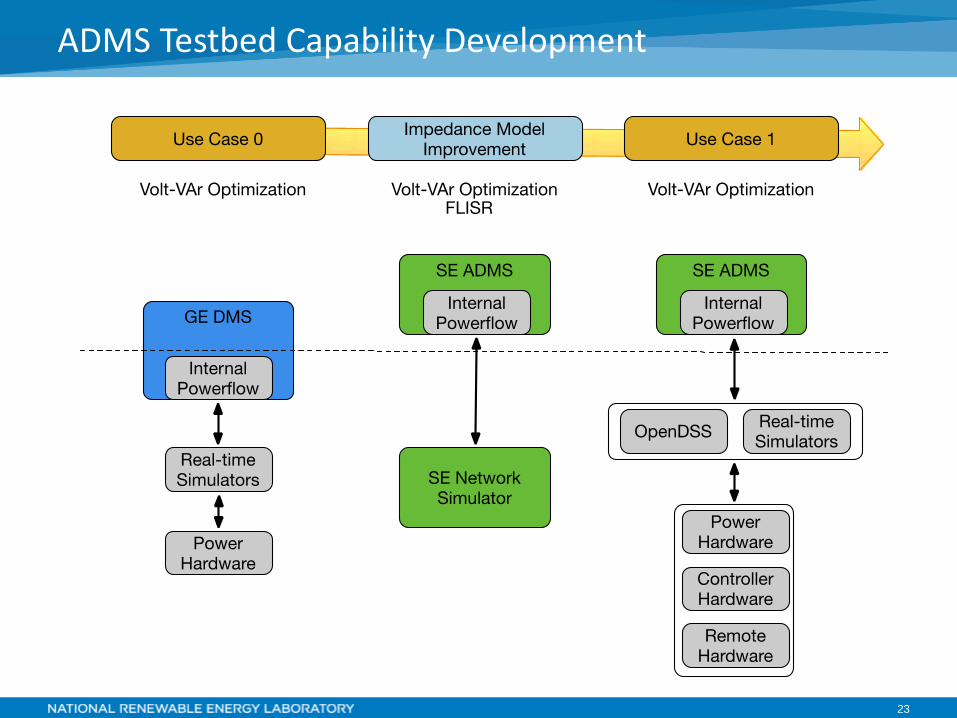
ADMS Testbed Capability Development
24
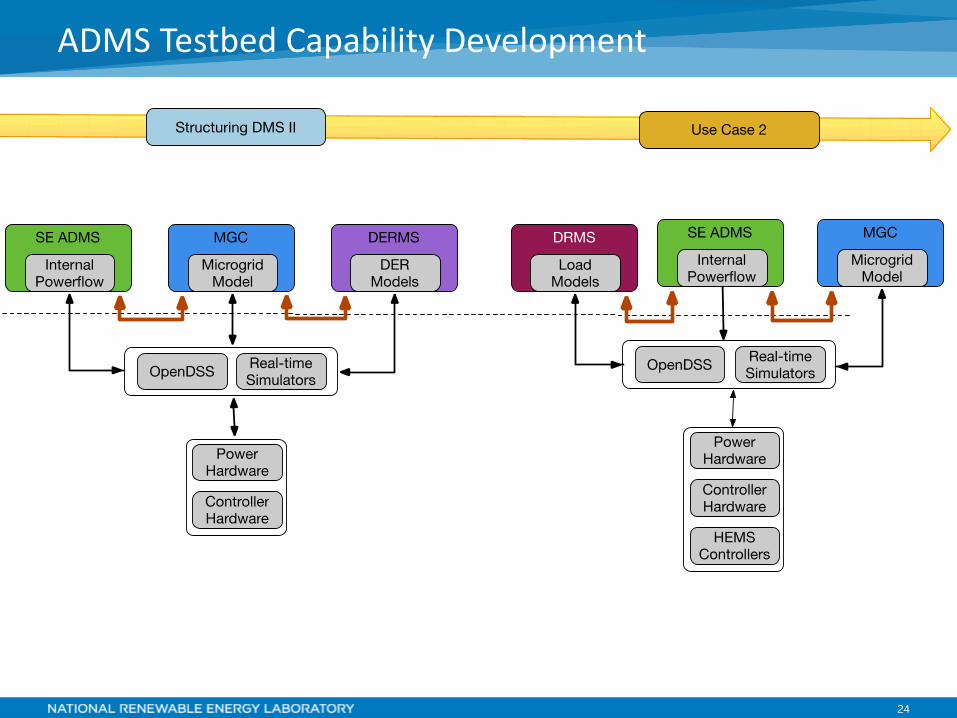
ADMS Testbed Capability Development

What other use cases can be tested using this capability?