Admixture Mapping
24
Admixture Mapping Admixture Mapping Qunyuan Zhang Qunyuan Zhang Division of Statistical Genomics Division of Statistical Genomics GEMS Course M21-621 GEMS Course M21-621 Computational Statistical Genetics Computational Statistical Genetics March 25, 2010 March 25, 2010 1
description
Admixture Mapping. Qunyuan Zhang Division of Statistical Genomics GEMS Course M21-621 Computational Statistical Genetics March 25, 2010. Three Mapping Strategies. Linkage Analysis (linkage): genotype & phenotype data from family (or families) - PowerPoint PPT Presentation
Transcript of Admixture Mapping

Admixture MappingAdmixture Mapping
Qunyuan ZhangQunyuan ZhangDivision of Statistical GenomicsDivision of Statistical Genomics
GEMS Course M21-621GEMS Course M21-621 Computational Statistical GeneticsComputational Statistical Genetics
March 25, 2010March 25, 2010
11

Linkage Analysis Linkage Analysis (linkage): genotype & (linkage): genotype & phenotype data from family (or families)phenotype data from family (or families)
Association Scan Association Scan (LD): genotype & (LD): genotype & phenotype data from population(s) or phenotype data from population(s) or families families
Admixture Mapping Admixture Mapping (LD): genotype data (LD): genotype data from admixed and ancestral populations, from admixed and ancestral populations, phenotype data from admixed populationsphenotype data from admixed populations
(1) Ancestry-phenotype association mapping(1) Ancestry-phenotype association mapping
(2) Ancestry info for population structure (2) Ancestry info for population structure controlcontrol
Three Mapping Three Mapping StrategiesStrategies
22

Genetic Genetic AdmixtureAdmixture
Ancestral Population 2
Caucasians
Ancestral Population 1
Africans
Admixed Population African Americans Admixture
Mapping
Admixture Information (Ancestry Analysis)
33

If a disease has some genetic factors, and the disease gene If a disease has some genetic factors, and the disease gene frequency in pop 2 is higher than in pop 1. After the admixture frequency in pop 2 is higher than in pop 1. After the admixture of pop 1 and 2, the diseased individuals in admixed of pop 1 and 2, the diseased individuals in admixed generations will carry disease genes/alleles that have more generations will carry disease genes/alleles that have more ancestry from pop 2 than from pop 1. ancestry from pop 2 than from pop 1.
If a marker is linked with disease genes, because of linkage If a marker is linked with disease genes, because of linkage disequilibrium, the diseased individuals will also carry the disequilibrium, the diseased individuals will also carry the marker copies that have more ancestry from pop 2 than from marker copies that have more ancestry from pop 2 than from pop 1.pop 1.
Inversely, if we find a marker/locus whose ancestry from pop Inversely, if we find a marker/locus whose ancestry from pop 2 in diseased group is significantly different from that in non-2 in diseased group is significantly different from that in non-diseased group, we consider this marker/locus to be linked with diseased group, we consider this marker/locus to be linked with (or a part of ) disease gene.(or a part of ) disease gene.
Rationale of Admixture Rationale of Admixture MappingMapping
44

Illustration of Admixture Illustration of Admixture
55
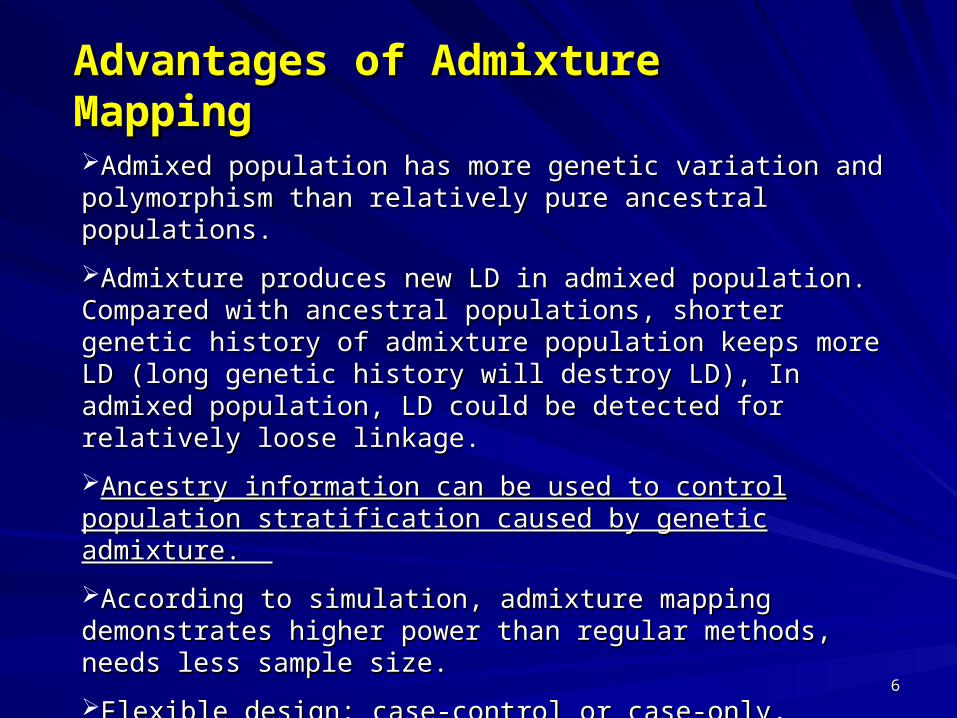
Advantages of Admixture Advantages of Admixture MappingMappingAdmixed population has more genetic variation and Admixed population has more genetic variation and polymorphism than relatively pure ancestral populations.polymorphism than relatively pure ancestral populations.
Admixture produces new LD in admixed population. Admixture produces new LD in admixed population. Compared with ancestral populations, shorter genetic Compared with ancestral populations, shorter genetic history of admixture population keeps more LD (long history of admixture population keeps more LD (long genetic history will destroy LD), In admixed population, LD genetic history will destroy LD), In admixed population, LD could be detected for relatively loose linkage.could be detected for relatively loose linkage.
Ancestry information can be used to control population Ancestry information can be used to control population stratification caused by genetic admixture. stratification caused by genetic admixture.
According to simulation, admixture mapping According to simulation, admixture mapping demonstrates higher power than regular methods, needs demonstrates higher power than regular methods, needs less sample size. less sample size.
Flexible design: case-control or case-only, qualitative or Flexible design: case-control or case-only, qualitative or quantitative traits, no need of pedigree informationquantitative traits, no need of pedigree information
66

Proportion of genetic materials descending from Proportion of genetic materials descending from each founding population each founding population
Population levelPopulation level : population admixture proportion : population admixture proportion
Individual levelIndividual level: individual admixture proportion: individual admixture proportion
Individual-locus levelIndividual-locus level: locus-specific ancestry: locus-specific ancestry
AncestryAncestry
77

Individual Ancestry (IA) can be used as a genetic Individual Ancestry (IA) can be used as a genetic background covariate for population structure background covariate for population structure controlcontrol
Phenotype= a + b * Genotype + Phenotype= a + b * Genotype + c * IA c * IA + Error+ Error
Locus-specific Ancestry (LSA) can be directly used Locus-specific Ancestry (LSA) can be directly used to detect association (admixture mapping)to detect association (admixture mapping)
Phenotype=a + Phenotype=a + b * LSA b * LSA
Two Ways of Using Ancestral Two Ways of Using Ancestral Info.Info.
88

Individual Ancestry (IA) Estimation Individual Ancestry (IA) Estimation using MLEusing MLE
G: Observed genotypes of admixed and ancestral populationsQ: Allelic frequencies in ancestral populationsP : Individual Ancestry to be estimated
Goal: obtain P that maximizes Pr(G|P,Q)
1. Assign prior values for Q (randomly or estimated from ancestral population genotype data) & P (randomly)
2. Compute P(i) by solving
3. Compute Q(i) by solving
4. Iterate Steps 1 and 2 until convergence.
Tang et al. Genetic Epidemiology, 2005(28): 289–301
0)(
),|(
P
PQG
0)(
),|(
Q
PQG
99

Locus-specific Ancestry EstimationLocus-specific Ancestry Estimationusing MCMCusing MCMCObserved G : genotypes of admixed and ancestral populations
Unknown Z : admixed individuals’ locus specific ancestries from ancestral populations
Problem: How to estimate Z ?
Maximum Likelihood Estimate(MLE):
How to obtain a Z that maximizes Pr(G|Z) ?
Z is a huge space of parameters, in which search is difficult for likelihood method.
Bayesian and Markov Chain Monte Carlo (MCMC) methods• Assume ancestral population number K• Define prior distribution Pr(Z) under K• Use MCMC to sample from posterior distribution Pr(Z|G) = Pr(Z)∙ Pr(G|Z) • Average over large number of MCMC samples to obtain estimate of Z
Falush et al. Genetics, 2003(164):1567–1587
1010

STRUCTURESTRUCTURE Falush D, Stephens M, Pritchard JK (2003) Inference of population structure using multilocus genotype data: linked loci and correlated allele frequencies. Genetics 164:1567–1587.
ADMIXMAPADMIXMAP Hoggart CJ, Parra EJ, Shriver MD, Bonilla C, Kittles RA, Clayton DG, McKeigue PM (2003) Control of confounding of genetic associations in stratified populations. Am J Hum Genet 72:1492–1504.
ANCESTRYMAPANCESTRYMAP Patterson N, Hattangadi N, Lane B, Lohmueller KE, Hafler DA, Oksenberg JR, Hauser SL, Smith MW, O’Brien SJ, Altshuler D, Daly MJ, Reich D (2004) Methods for high-density admixture mapping of disease genes. Am J Hum Genet 74:979–1000
SoftwareSoftware
1111
ReferencesReferences
D.C.Rife. Populations of hybrid origin as source material for the detection of D.C.Rife. Populations of hybrid origin as source material for the detection of linkage. Am.J.Hum.Genet. linkage. Am.J.Hum.Genet. 19541954, (6):26-33, (6):26-33
R.Chakraborty et al. Adimixture as a tool for finding linked genes and R.Chakraborty et al. Adimixture as a tool for finding linked genes and detecting that difference from allelic association between loci. detecting that difference from allelic association between loci. Proc.Natl.Acad.Sci. Proc.Natl.Acad.Sci. 19881988,Vol.85:9119-9123,Vol.85:9119-9123
N. Risch. Mapping genes for complex disease using association studies with N. Risch. Mapping genes for complex disease using association studies with recently admixed populations. Am.J.Hum.Genet.Suppl. recently admixed populations. Am.J.Hum.Genet.Suppl. 19921992, 51:13, 51:13……
P.M.McKeigue. Prospects for admixture mapping of complex traits. P.M.McKeigue. Prospects for admixture mapping of complex traits. Am.J.Hum.Genet. Am.J.Hum.Genet. 20052005, Vol.76:1-7, Vol.76:1-7
X.Zhu et al. Admixture mapping for hypertention loci with genome-scan X.Zhu et al. Admixture mapping for hypertention loci with genome-scan markers. Nature Genetics. markers. Nature Genetics. 20052005,Vol.37(2): 177-181,Vol.37(2): 177-181
Q Zhang et al. Genome-wide admixture mapping for coronary artery Q Zhang et al. Genome-wide admixture mapping for coronary artery calcification in African Americans: the NHLBI Family Heart Study. Genet calcification in African Americans: the NHLBI Family Heart Study. Genet Epidemiol. 2008 Apr;32(3):264-72.Epidemiol. 2008 Apr;32(3):264-72.
1212
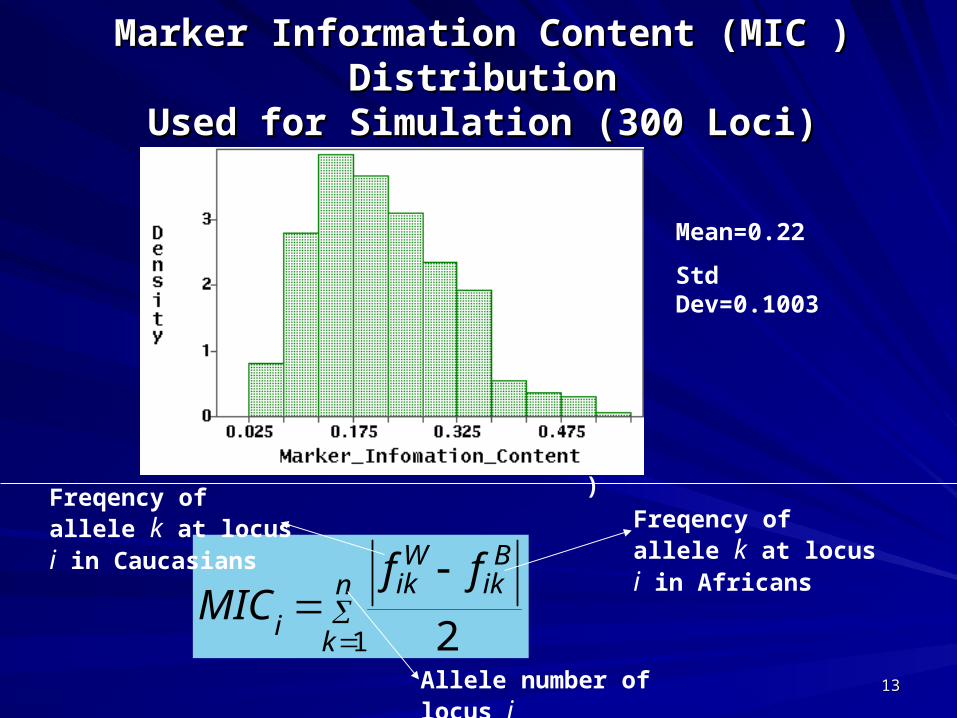
Marker Information Content (MIC ) DistributionMarker Information Content (MIC ) DistributionUsed for Simulation (300 Loci)Used for Simulation (300 Loci)
Mean=0.22
Std Dev=0.1003
(MIC)
n
k
Bik
Wik
i
ffMIC
1 2
Freqency of allele k at locus i in Caucasians Freqency of allele k at
locus i in Africans
Allele number of locus i 1313

African AmericansAfrican Americans
622 Subjects from 211 families622 Subjects from 211 families
Admixture MappingAdmixture Mapping
CAC LociCAC Loci
400 microsatellite 400 microsatellite markers markers Average distance 10 Average distance 10
cMcM
Coronary and aortic Coronary and aortic artery calcium (CAC) artery calcium (CAC)
Quantified by CTQuantified by CT
calcified plaque
1414

DataData
SamplesSamples 1672 subjects from 3 populations: 1672 subjects from 3 populations:622 African Americans (211 families) from622 African Americans (211 families) fromFHS-SCANFHS-SCAN893 Caucasians (320 families) from FHS-SCAN893 Caucasians (320 families) from FHS-SCAN157 Africans (unrelated) from Marshfield 157 Africans (unrelated) from Marshfield CenterCenter
GenotypesGenotypes302 microsatellite Loci of all subjects 302 microsatellite Loci of all subjects Average marker distance 11.9cM Average marker distance 11.9cM
PhenotypePhenotypeCoronary and aortic artery calcium (CAC) of Coronary and aortic artery calcium (CAC) of 622 African Americans, BLOM 622 African Americans, BLOM transformationtransformation
1515

Statisticl ProcedureStatisticl Procedure
Step 1Step 1Randomly draw one subject from each family to create a Randomly draw one subject from each family to create a sample of 688 unrelated subjects which comprises : sample of 688 unrelated subjects which comprises : 211 African Americans from 211 families (FHS-SCAN) 211 African Americans from 211 families (FHS-SCAN) 320 whites from 320 families (FHS-SCAN)320 whites from 320 families (FHS-SCAN)157 unrelated Africans (Marshfield Center)157 unrelated Africans (Marshfield Center)Step 2Step 2Ancestry estimation, STRUCTURE 2.1 Ancestry estimation, STRUCTURE 2.1 Step 3Step 3Ancestry-CAC association analysis, regress 211 African Ancestry-CAC association analysis, regress 211 African Americans’ CAC scores on their locus-specific ancestries from Americans’ CAC scores on their locus-specific ancestries from Africans.Africans.Step 4Step 4Repeat step1~step3 (100 times), obtain the average p-value of Repeat step1~step3 (100 times), obtain the average p-value of each locus each locus Step 5Step 5For each locus: permutation test on average p-value For each locus: permutation test on average p-value Number of random permutations: 10000 Number of random permutations: 10000
1616

RESULTSRESULTS
Sources of Variation of Ancestry-from-AfricansSources of Variation of Ancestry-from-Africans
Sources of variationSources of variation Variance Variance componentscomponents
Percent(%)Percent(%)
FamiliesFamilies
Subjects within familySubjects within family
Loci within subjectLoci within subject
Replications within Replications within locuslocus
0.010540.01054
0.004920.00492
0.005990.00599
0.000420.00042
48.1948.19
22.5022.50
27.3927.39
1.921.92
48%
23%
2%
27% Var(families)
Var(subjects/family)
Var(loci/subject)
Var(replications/locus)
1717
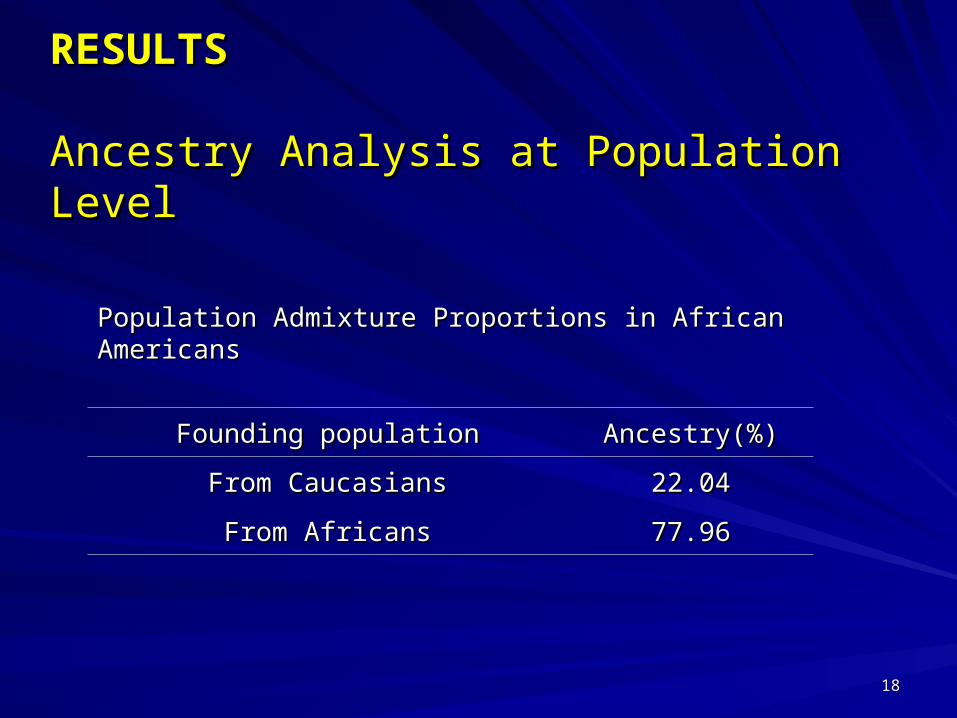
RESULTSRESULTS
Ancestry Analysis at Population LevelAncestry Analysis at Population Level
Population Admixture Proportions in African Population Admixture Proportions in African AmericansAmericans
Founding populationFounding population Ancestry(%)Ancestry(%)
From CaucasiansFrom Caucasians 22.0422.04
From AfricansFrom Africans 77.9677.96
1818
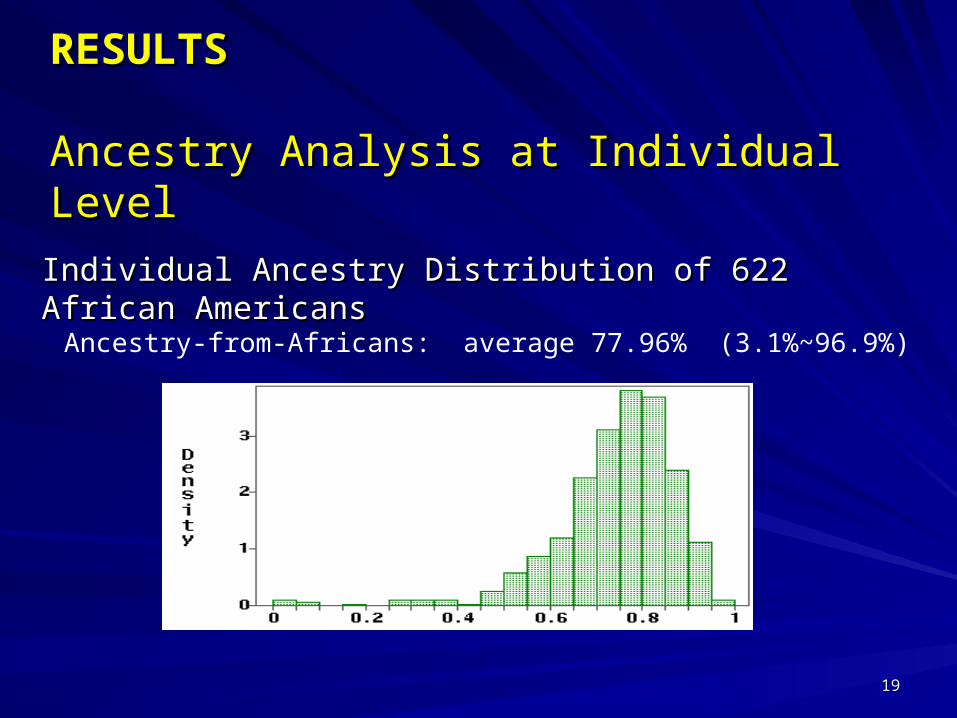
Individual Ancestry Distribution of 622 African Individual Ancestry Distribution of 622 African AmericansAmericans
Ancestry-from-Africans: average 77.96% (3.1%~96.9%)
RESULTSRESULTS
Ancestry Analysis at Individual LevelAncestry Analysis at Individual Level
1919

RESULTSRESULTSAncestry Analysis at Individual-locus Ancestry Analysis at Individual-locus LevelLevel
Distribution of Locus-specific Ancestries from AfricansAn Example African American
Ance
stry
fro
m A
fric
ans
302 Microsatellite Loci
ordered by chromosome and position
from Chrom. 1 (4.22cM) to Chrom. 23 (104.83cM) 2020

RESULTSRESULTS Locus-specific Ancestry-CAC association analysisLocus-specific Ancestry-CAC association analysis
No.No. LociLoci Chr# Chr# Pos.Pos. Permu. p Permu. p Reg. coeff. Reg. coeff. RR22
11 AFM063XF4 AFM063XF4 1010 19 .0 (10p14)19 .0 (10p14) 0.00210.0021 -1.2442-1.2442 0.03100.0310
22 GATA64D02 GATA64D02 66 80.45 (6q12)80.45 (6q12) 0.00240.0024 -2.2112-2.2112 0.02050.0205
33 GATA42H02 GATA42H02 44 181.93 (4q32)181.93 (4q32) 0.00830.0083 2.79962.7996 0.01980.0198
44 AFMB337ZH9 AFMB337ZH9 2222 60.6160.61 0.01200.0120 1.15941.1594 0.01940.0194
55 GGAA20G10 GGAA20G10 22 27.627.6 0.01330.0133 0.72710.7271 0.01660.0166
66 GATA73H09 GATA73H09 1212 78.1478.14 0.01700.0170 -1.4403-1.4403 0.01500.0150
77 GGAA3F06 GGAA3F06 77 41.6941.69 0.01730.0173 1.66521.6652 0.01630.0163
88 UT1307 UT1307 2020 69.569.5 0.01780.0178 -1.1565-1.1565 0.01750.0175
99 UT7136 UT7136 2222 52.6152.61 0.01940.0194 1.94571.9457 0.01620.0162
1010 GATA163B10 GATA163B10 66 42.2742.27 0.02670.0267 -1.3473-1.3473 0.01650.0165
1111 GATA88F09 GATA88F09 1010 4.324.32 0.03150.0315 -2.1781-2.1781 0.01530.0153
1212 GATA26D02 GATA26D02 1212 83.1983.19 0.03190.0319 -2.0880-2.0880 0.01300.0130
1313 ATA1B07 ATA1B07 1111 54.0954.09 0.03390.0339 1.15401.1540 0.01430.0143
1414 ATA4E02 ATA4E02 11 192.05192.05 0.03940.0394 0.78290.7829 0.01220.0122
1515 GATA137H02 GATA137H02 77 29.2829.28 0.04180.0418 1.31681.3168 0.01210.0121
1616 GATA4D07 GATA4D07 22 145.08145.08 0.04550.0455 -1.0065-1.0065 0.01250.0125
1717 ATA31G11 ATA31G11 1010 28.3128.31 0.04610.0461 -1.2933-1.2933 0.01340.0134 2121
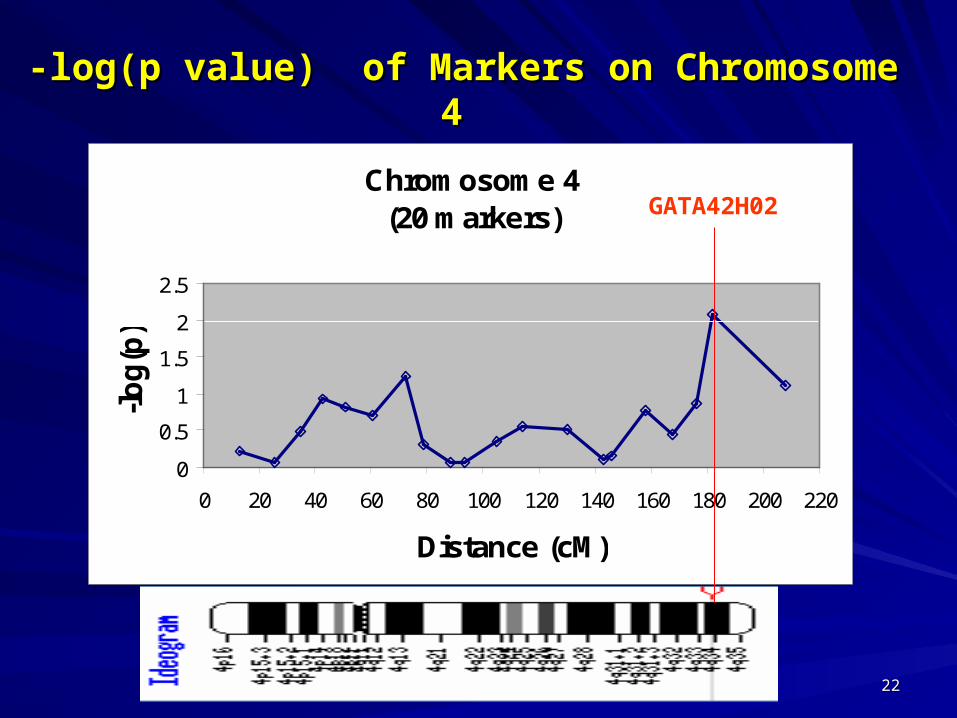
-log(p value) of Markers on Chromosome -log(p value) of Markers on Chromosome 4 4
Chromosome 4(20 markers)
0
0.5
1
1.5
2
2.5
0 20 40 60 80 100 120 140 160 180 200 220
Distance (cM)
-lo
g(p
)
GATA42H02
2222

-log(p value) of Markers on Chromosome -log(p value) of Markers on Chromosome 66
Chromosome 6(16 markers)
0
0.5
1
1.5
2
2.5
3
0 20 40 60 80 100 120 140 160 180 200
Distance (cM)
-lo
g(p
)
GATA64D02
2323

-log(p value) of Markers on Chromosome -log(p value) of Markers on Chromosome 10 10
Chromosome 10(14 markers)
0
0.5
1
1.5
2
2.5
3
0 20 40 60 80 100 120 140 160 180
Distance (cM)
-lo
g(p
)
AFM063XF4
2424