Admiral Group plc · 5 | Page SUMMARY SECTION A – BUSINESS PERFORMANCE Admiral Group plc (‘the...
106
1 | Page Admiral Group plc Group Solvency and Financial Condition Report 31 December 2018
Transcript of Admiral Group plc · 5 | Page SUMMARY SECTION A – BUSINESS PERFORMANCE Admiral Group plc (‘the...

1 | P a g e
Admiral Group plc
Group Solvency and Financial Condition
Report
31 December 2018

2 | P a g e
CONTENTS
Summary ................................................................................................................................................ 5
Statement of Directors’ Responsibilities............................................................................................... 10
Audit Opinion ........................................................................................................................................ 11
A. Business and Performance ............................................................................................................ 14
A.1. Business ................................................................................................................................. 14
A.2. Underwriting performance .................................................................................................... 19
A.3. Investment performance ....................................................................................................... 22
A.4. Performance of other activities ............................................................................................. 23
A.5. Any other information ........................................................................................................... 24
B. System of Governance .................................................................................................................. 25
B.1. General information on the system of governance ............................................................... 25
B.2. Fit and proper requirements ................................................................................................. 28
B.3. Risk management system including the own risk and solvency assessment (ORSA) ............ 28
B.4. Internal control system .......................................................................................................... 30
B.5. Compliance function .............................................................................................................. 31
B.6. Internal audit function ........................................................................................................... 31
B.7. Actuarial function .................................................................................................................. 32
B.8. Outsourcing ............................................................................................................................ 33
B.9. Any other information ........................................................................................................... 33
C. Risk Profile ..................................................................................................................................... 35
C.1. Underwriting risk ................................................................................................................... 38
C.2. Market risk ............................................................................................................................. 40
C.3. Counterparty Default risk ...................................................................................................... 42
C.4. Liquidity risk ........................................................................................................................... 42
C.5. Operational risk ...................................................................................................................... 42
C.6. Other material risks ............................................................................................................... 42
C.7. Any other information ........................................................................................................... 43
D. Valuation for Solvency Purposes (Audited) .................................................................................. 44
D.1. Assets ..................................................................................................................................... 45
D.2. Liabilities ................................................................................................................................ 46
D.3. Technical provisions .............................................................................................................. 47
D.4. Alternative methods of valuation .......................................................................................... 50
D.5. Any other information ........................................................................................................... 50
E. Capital Management (Audited) .................................................................................................... 51
E.1. Own funds .............................................................................................................................. 51
E.2. Solvency capital requirement and Minimum Capital Requirement ...................................... 55
3 | P a g e
E.3. Use of the duration-based equity sub-module in the calculation of the Solvency Capital
Requirement ................................................................................................................................. 57
E.4. Differences between the standard formula and any internal model used............................ 57
E.5. Non compliance with the Minimum Capital Requirement and non-compliance with the
Solvency Capital Requirement ...................................................................................................... 57
E.6. Any other information ........................................................................................................... 58
Appendix 1 – Glossary ........................................................................................................................... 60
Appendix 2 – Quantitative Reporting Templates ................................................................................. 61
4 | P a g e
INTRODUCTION
This Admiral Group plc Solvency and Financial Condition Report (SFCR) has been prepared in
compliance with Solvency II regulatory requirements. It contains a range of regulatory disclosures that
support the information presented in the Quantitative Reporting Templates (QRTs) shown in Appendix
2.
The report is not intended to provide a comprehensive review of the Group’s businesses and the
markets in which they operate, how these businesses are managed, or performance of these
businesses during the year. This information is detailed in the Group’s 2018 Annual Report. Where
relevant, specific references to the Annual Report are made throughout this SFCR. It can be found at:
https://admiralgroup.co.uk/sites/default/files_public/annual-report/2019/03/2018-full-year-results-
annual-report.pdf
STRUCTURE AND CONTENTS
This Group SFCR has been prepared in accordance with Article 359 and Articles 290 to 298 of the
Solvency II delegated acts. The structure of the report is in accordance with Annex XX of the delegated
acts.
The Group has obtained supervisory waivers from the Prudential Regulatory Authority (PRA) and the
Gibraltar Financial Services Commission (GFSC) to include solvency information relating to Solvency II
regulated solo entities Admiral Insurance Company Limited (AICL) and Admiral Insurance (Gibraltar)
Limited (AIGL) in this Group SFCR. The waiver was obtained as the nature of the Group’s governance
structure, with the Group Board and its Committees leading the Group’s management and control
framework, means that there is significant overlap in the disclosures for the Group and the solo
entities. The Group SFCR waiver therefore allows stakeholders to access concise disclosures for all
relevant entities in one report.
During the year the Group established and received regulatory permissions for an insurance entity in
Spain; Admiral Europe Compañía de Seguros, S.A. (AECS) to underwrite the Group’s European business
after Brexit. AECS is subject to the supervision of the Dirección General de Seguros y Fondos de
Pensiones (DGSFP) in Spain. AECS is excluded from the qualitative and quantitative disclosures in
Sections A to E as it has prepared a separate 2018 SFCR in line with the requirements of the DGSFP.
This report may be found at:
https://www.admiraleurope.com/documentacion/Situacion-Financiera-y-de-Solvencia-31-dic-
2018.pdf
All amounts in this report are presented in pounds sterling, rounded to the nearest £0.1 million, which
is the Group’s presentation currency. Unless otherwise stated, information in this report is unaudited.
5 | P a g e
SUMMARY
SECTION A – BUSINESS PERFORMANCE
Admiral Group plc (‘the Group’) is one of the UK’s largest car insurance providers. In addition to
offering car insurance in the UK, the Group also writes household, van and travel insurance business
in the UK, and car insurance in four countries outside of the UK; Italy, Spain, France and the USA. Other
Group businesses outside of insurance include Price Comparison businesses, legal companies and a
personal lending and car finance business in the UK.
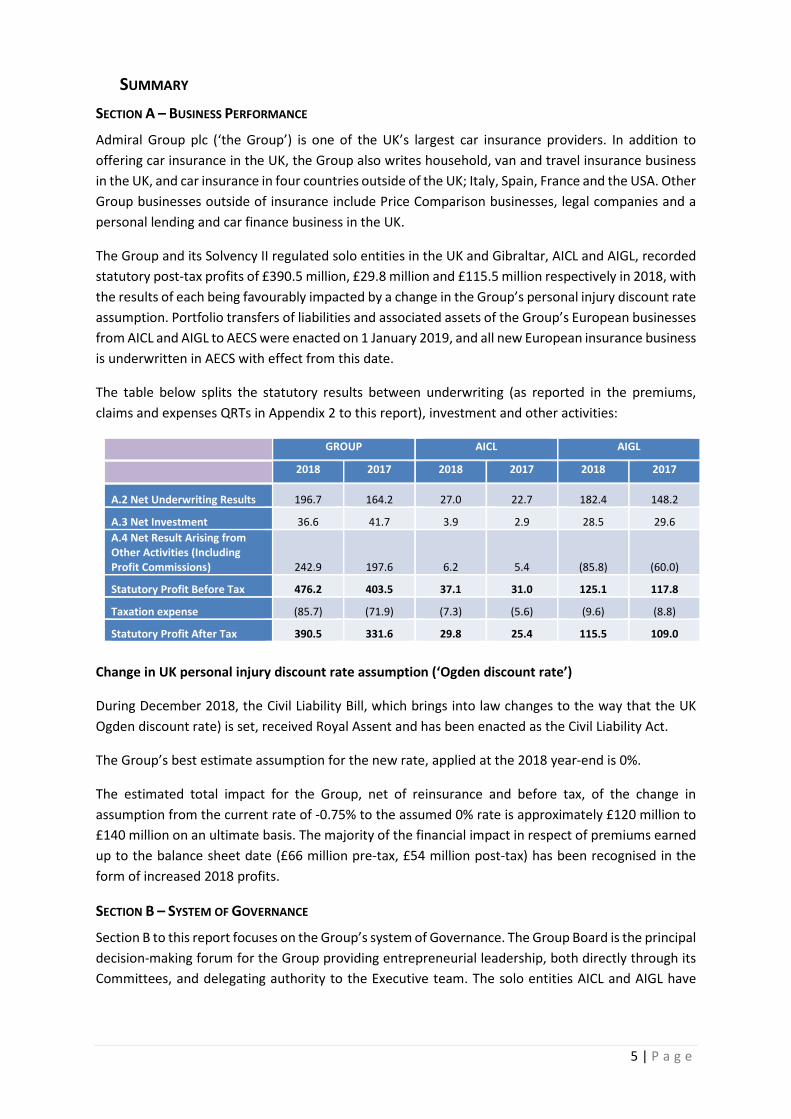
The Group and its Solvency II regulated solo entities in the UK and Gibraltar, AICL and AIGL, recorded
statutory post-tax profits of £390.5 million, £29.8 million and £115.5 million respectively in 2018, with
the results of each being favourably impacted by a change in the Group’s personal injury discount rate
assumption. Portfolio transfers of liabilities and associated assets of the Group’s European businesses
from AICL and AIGL to AECS were enacted on 1 January 2019, and all new European insurance business
is underwritten in AECS with effect from this date.
The table below splits the statutory results between underwriting (as reported in the premiums,
claims and expenses QRTs in Appendix 2 to this report), investment and other activities:
GROUP AICL AIGL
2018 2017 2018 2017 2018 2017
A.2 Net Underwriting Results 196.7 164.2 27.0 22.7 182.4 148.2
A.3 Net Investment 36.6 41.7 3.9 2.9 28.5 29.6
A.4 Net Result Arising from
Other Activities (Including
Profit Commissions) 242.9 197.6 6.2 5.4 (85.8) (60.0)
Statutory Profit Before Tax 476.2 403.5 37.1 31.0 125.1 117.8
Taxation expense (85.7) (71.9) (7.3) (5.6) (9.6) (8.8)
Statutory Profit After Tax 390.5 331.6 29.8 25.4 115.5 109.0
Change in UK personal injury discount rate assumption (‘Ogden discount rate’)
During December 2018, the Civil Liability Bill, which brings into law changes to the way that the UK
Ogden discount rate) is set, received Royal Assent and has been enacted as the Civil Liability Act.
The Group’s best estimate assumption for the new rate, applied at the 2018 year-end is 0%.
The estimated total impact for the Group, net of reinsurance and before tax, of the change in
assumption from the current rate of -0.75% to the assumed 0% rate is approximately £120 million to
£140 million on an ultimate basis. The majority of the financial impact in respect of premiums earned
up to the balance sheet date (£66 million pre-tax, £54 million post-tax) has been recognised in the
form of increased 2018 profits.
SECTION B – SYSTEM OF GOVERNANCE
Section B to this report focuses on the Group’s system of Governance. The Group Board is the principal
decision-making forum for the Group providing entrepreneurial leadership, both directly through its
Committees, and delegating authority to the Executive team. The solo entities AICL and AIGL have
6 | P a g e
respective individual Board meetings that act in the same manner as the Group Board. The Group
Board and its Committees also have oversight of AICL and AIGL.
The Board has delegated authority to a number of permanent Committees to deal with matters in
accordance with written Terms of Reference. The principal Committees of the Group Board - Audit,
Remuneration, Risk and Nomination all comply fully with the requirements of the Corporate
Governance Code.
There were no material changes in the system of governance during the year, aside from changes in
membership of the Group Board and its Committees during the usual course of business.
Section B reports in detail as to how the system of governance works in practice, including a focus on
the Group’s remuneration policy, the system of internal control and the Solvency II key functions of
Risk Management, Compliance, Internal Audit and Actuarial.
SECTION C – RISK PROFILE
The Admiral Group Board is responsible for determining risk strategy and risk appetite across the
Group, and for the Group’s system of risk management and internal control. The Board has delegated
the development, implementation and maintenance of the Group’s risk management framework to
the Group Risk Committee, which reports its activities to both the Board and also to the Group Audit
Committee, for the purposes of reviewing and reporting on the overall effectiveness of this system.
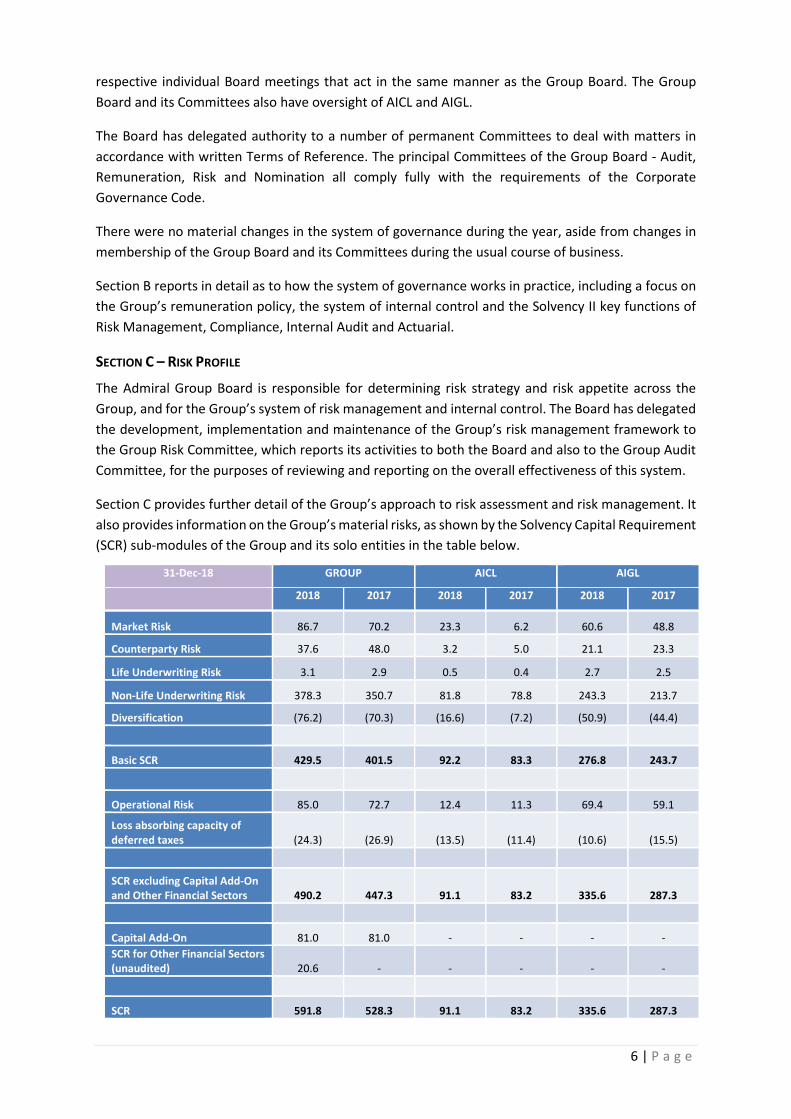
Section C provides further detail of the Group’s approach to risk assessment and risk management. It
also provides information on the Group’s material risks, as shown by the Solvency Capital Requirement
(SCR) sub-modules of the Group and its solo entities in the table below.
31-Dec-18 GROUP AICL AIGL
2018 2017 2018 2017 2018 2017
Market Risk 86.7 70.2 23.3 6.2 60.6 48.8
Counterparty Risk 37.6 48.0 3.2 5.0 21.1 23.3
Life Underwriting Risk 3.1 2.9 0.5 0.4 2.7 2.5
Non-Life Underwriting Risk 378.3 350.7 81.8 78.8 243.3 213.7
Diversification (76.2) (70.3) (16.6) (7.2) (50.9) (44.4)
Basic SCR 429.5 401.5 92.2 83.3 276.8 243.7
Operational Risk 85.0 72.7 12.4 11.3 69.4 59.1
Loss absorbing capacity of
deferred taxes (24.3) (26.9) (13.5) (11.4) (10.6) (15.5)
SCR excluding Capital Add-On
and Other Financial Sectors 490.2 447.3 91.1 83.2 335.6 287.3
Capital Add-On 81.0 81.0 - - - -
SCR for Other Financial Sectors
(unaudited) 20.6 - - - - -
SCR 591.8 528.3 91.1 83.2 335.6 287.3
7 | P a g e
As can be noted from the table, the material risk category for the Group, AICL and AIGL is non-life
insurance risk which (before diversification with other risk types) represents 66%, 90% and 73% of the
SCRs of the Group and its solo entities, AICL and AIGL respectively.
SECTION D – VALUATION FOR SOLVENCY PURPOSES
Section D focuses on the Solvency II balance sheet and the valuation of assets and liabilities. In line
with Solvency II rules, assets and liabilities on the Solvency II balance sheet are held at fair value, i.e.
the price that would be received to sell an asset or paid to transfer a liability in an orderly transaction
between market participants at the valuation date.
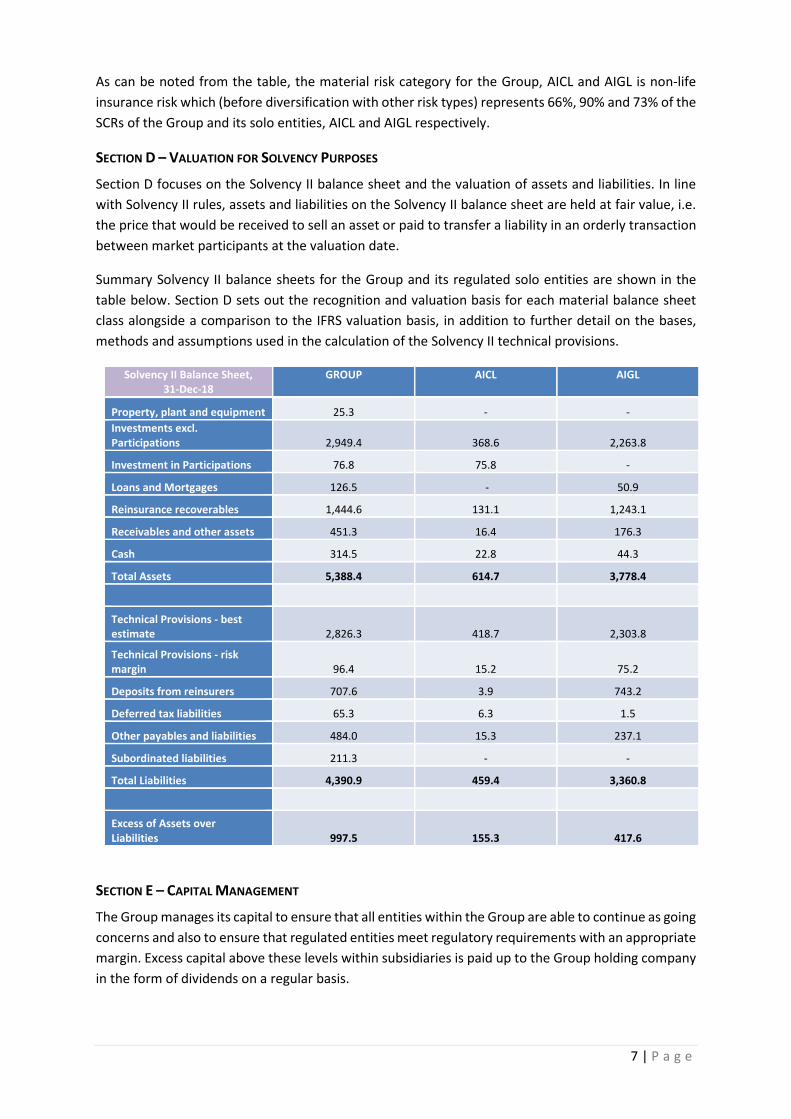
Summary Solvency II balance sheets for the Group and its regulated solo entities are shown in the
table below. Section D sets out the recognition and valuation basis for each material balance sheet
class alongside a comparison to the IFRS valuation basis, in addition to further detail on the bases,
methods and assumptions used in the calculation of the Solvency II technical provisions.
Solvency II Balance Sheet,
31-Dec-18
GROUP AICL AIGL
Property, plant and equipment 25.3 - -
Investments excl.
Participations 2,949.4 368.6 2,263.8
Investment in Participations 76.8 75.8 -
Loans and Mortgages 126.5 - 50.9
Reinsurance recoverables 1,444.6 131.1 1,243.1
Receivables and other assets 451.3 16.4 176.3
Cash 314.5 22.8 44.3
Total Assets 5,388.4 614.7 3,778.4
Technical Provisions - best
estimate 2,826.3 418.7 2,303.8
Technical Provisions - risk
margin 96.4 15.2 75.2
Deposits from reinsurers 707.6 3.9 743.2
Deferred tax liabilities 65.3 6.3 1.5
Other payables and liabilities 484.0 15.3 237.1
Subordinated liabilities 211.3 - -
Total Liabilities 4,390.9 459.4 3,360.8
Excess of Assets over
Liabilities 997.5 155.3 417.6
SECTION E – CAPITAL MANAGEMENT
The Group manages its capital to ensure that all entities within the Group are able to continue as going
concerns and also to ensure that regulated entities meet regulatory requirements with an appropriate
margin. Excess capital above these levels within subsidiaries is paid up to the Group holding company
in the form of dividends on a regular basis.
8 | P a g e
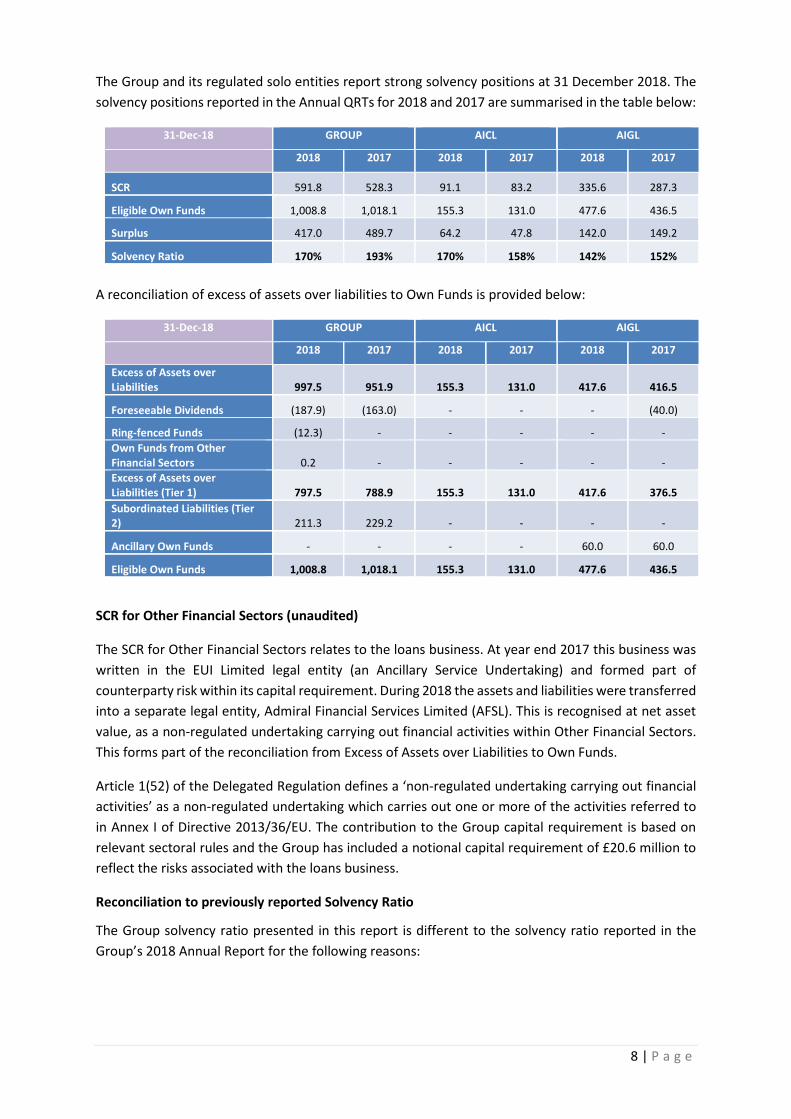
The Group and its regulated solo entities report strong solvency positions at 31 December 2018. The
solvency positions reported in the Annual QRTs for 2018 and 2017 are summarised in the table below:
31-Dec-18 GROUP AICL AIGL
2018 2017 2018 2017 2018 2017
SCR 591.8 528.3 91.1 83.2 335.6 287.3
Eligible Own Funds 1,008.8 1,018.1 155.3 131.0 477.6 436.5
Surplus 417.0 489.7 64.2 47.8 142.0 149.2
Solvency Ratio 170% 193% 170% 158% 142% 152%
A reconciliation of excess of assets over liabilities to Own Funds is provided below:
31-Dec-18 GROUP AICL AIGL
2018 2017 2018 2017 2018 2017
Excess of Assets over
Liabilities 997.5 951.9 155.3 131.0 417.6 416.5
Foreseeable Dividends (187.9) (163.0) - - - (40.0)
Ring-fenced Funds (12.3) - - - - -
Own Funds from Other
Financial Sectors 0.2 - - - - -
Excess of Assets over
Liabilities (Tier 1) 797.5 788.9 155.3 131.0 417.6 376.5
Subordinated Liabilities (Tier
2) 211.3 229.2 - - - -
Ancillary Own Funds - - - - 60.0 60.0
Eligible Own Funds 1,008.8 1,018.1 155.3 131.0 477.6 436.5
SCR for Other Financial Sectors (unaudited)
The SCR for Other Financial Sectors relates to the loans business. At year end 2017 this business was
written in the EUI Limited legal entity (an Ancillary Service Undertaking) and formed part of
counterparty risk within its capital requirement. During 2018 the assets and liabilities were transferred
into a separate legal entity, Admiral Financial Services Limited (AFSL). This is recognised at net asset
value, as a non-regulated undertaking carrying out financial activities within Other Financial Sectors.
This forms part of the reconciliation from Excess of Assets over Liabilities to Own Funds.
Article 1(52) of the Delegated Regulation defines a ‘non-regulated undertaking carrying out financial
activities’ as a non-regulated undertaking which carries out one or more of the activities referred to
in Annex I of Directive 2013/36/EU. The contribution to the Group capital requirement is based on
relevant sectoral rules and the Group has included a notional capital requirement of £20.6 million to
reflect the risks associated with the loans business.
Reconciliation to previously reported Solvency Ratio
The Group solvency ratio presented in this report is different to the solvency ratio reported in the
Group’s 2018 Annual Report for the following reasons:

9 | P a g e
• Change in valuation date: The solvency ratio in the Annual Report is prepared at a different
valuation date, taking into consideration the additional own funds generated post year end, up to
the approved dividend payment date;
• Other (including impact of proposed Capital Add-On, ‘CAO’): A different CAO is used, with the
proposed add-on reported in the 2018 Annual Report remaining subject to regulatory approval
and therefore excluded from the SFCR solvency calculations. The Annual Report solvency ratio
also excludes the impact of changes made arising from the reporting finalisation process.
The chart below shows the impact of these moves:
170%
194%
10%
14%
0%
20%
40%
60%
80%
100%
120%
140%
160%
180%
200%
YE'18 SFCR Change in Valuation Date Other (including impact of
proposed CAO)
YE'18 Annual Report
10 | P a g e
STATEMENT OF DIRECTORS’ RESPONSIBILITIES
The Directors are responsible for ensuring that the SFCR is properly prepared in all material respects
in accordance with the Prudential Regulatory Authority (PRA) rules and SII Regulations.
The PRA Rulebook for SII firms in Rule 6.1(2) and Rule 6.2(1) of the Reporting Part requires that the
Group must have in place a written policy ensuring the ongoing appropriateness of any information
disclosed and that the Group must ensure that its SFCR is subject to approval by the Directors.
The Board of Directors confirm that, to the best of their knowledge:
(a) Throughout the financial year in question, the Group and its solo insurance undertakings have
complied in all material respects with the requirements of the PRA rules and SII Regulations as
applicable; and
(b) It is reasonable to believe that, at the date of the publication of the SFCR, the Group and its solo
insurance undertakings continue to comply, and will continue so to comply in future.
By Order of the Board
Geraint Jones
Chief Financial Officer
31 May 2019
11 | P a g e
AUDIT OPINION
REPORT OF THE EXTERNAL INDEPENDENT AUDITOR TO THE DIRECTORS OF ADMIRAL
GROUP PLC (‘THE GROUP’) PURSUANT TO RULE 4.1 (2) OF THE EXTERNAL AUDIT CHAPTER
OF THE PRA RULEBOOK APPLICABLE TO SOLVENCY II FIRMS
Report on the Audit of the relevant elements of the Solvency and Financial Condition
Report (“SFCR”)
Opinion
Except as stated below, we have audited the following documents prepared by the Group as at 31 December 2018:
• The ‘Valuation for solvency purposes’ and ‘Capital Management’ sections of the Group SFCR
of the Company as at 31 December 2018, (‘the Narrative Disclosures subject to audit’);
• Group templates S.02.01.02, S.22.01.22, S.23.01.22, S.25.01.22 and S.32.01.22 (‘the
Group Templates subject to audit’); and
• Solo templates S.02.01.02, S.12.01.02, S.17.01.02, S.22.01.21, S.23.01.01, S.25.01.21
and S.28.01.01 in respect of Admiral Insurance Company Limited and Admiral Insurance
(Gibraltar) Limited (‘the Solo Templates subject to audit’).
The Narrative Disclosures subject to audit and the Group Templates and Solo Templates subject to
audit are collectively referred to as the ‘relevant elements of the Group SFCR’.
We are not required to audit, nor have we audited, and as a consequence do not express an opinion
on the Other Information which comprises:
• the ‘Executive Summary’, ‘Business and performance’, ‘System of governance’ and ‘Risk
profile’ elements of the Group SFCR;
• Group templates S.05.01.02, and S.05.02.01;
• Solo templates S.05.01.02, S.05.02.01, and S.19.01.21;
• the written acknowledgement by management of their responsibilities, including for the
preparation of the Group SFCR (‘the Responsibility Statement’);
• Information which pertains to an undertaking that is not a Solvency II undertaking and has
been prepared in accordance with PRA rules other than those implementing the Solvency II
Directive or in accordance with an EU instrument other than the Solvency II regulations (‘the
sectoral information’); and
• Elements of the Narrative Disclosures subject to audit identified as ‘unaudited’.
To the extent the information subject to audit in the relevant elements of the Group SFCR includes
amounts that are totals, sub-totals or calculations derived from the Other Information, we have
relied without verification on the Other Information.
In our opinion, the information subject to audit in the relevant elements of the Group SFCR as at 31
December 2018 is prepared, in all material respects, in accordance with the financial reporting
provisions of the PRA Rules and Solvency II regulations on which they are based, as modified by
relevant supervisory modifications, and as supplemented by supervisory approvals and
determinations.
Basis for opinion
We conducted our audit in accordance with International Standards on Auditing (UK) (ISAs (UK),
including ISA (UK) 800 and ISA (UK) 805, and applicable law. Our responsibilities under those standards are further described in the Auditor’s Responsibilities for the Audit of the relevant
elements of the Group Solvency and Financial Condition Report section of our report. We are
independent of the Company in accordance with the ethical requirements that are relevant to our
audit of the Group SFCR in the UK, including the Financial Reporting Council’s (the ‘FRC’s’) Ethical
Standard as applied to public interest entities, and we have fulfilled our other ethical responsibilities
in accordance with these requirements. We believe that the audit evidence we have obtained is
sufficient and appropriate to provide a basis for our opinion.

12 | P a g e
Emphasis of Matter – Basis of Accounting
We draw attention to the ‘Valuation for solvency purposes’ section of the Group SFCR, which describes the basis of accounting. The Group SFCR is prepared in compliance with the financial
reporting provisions of the PRA Rules and Solvency II regulations, and therefore in accordance with
a special purpose financial reporting framework. The Group SFCR is required to be published, and
intended users include but are not limited to the PRA. As a result, the Group SFCR may not be
suitable for another purpose. Our opinion is not modified in respect of these matters.
Conclusions relating to going concern
We are required by ISAs (UK) to report in respect of the following matters where:
• the Directors’ use of the going concern basis of accounting in the preparation of the Group
SFCR is not appropriate; or
• the Directors have not disclosed in the Group SFCR any identified material uncertainties that
may cast significant doubt about the Company’s ability to continue to adopt the going
concern basis of accounting for a period of at least twelve months from the date when the
Group SFCR is authorised for issue.
We have nothing to report in relation to these matters.
Other Information
The Directors are responsible for the Other Information.
Our opinion on the relevant elements of the Group SFCR does not cover the Other Information and
we do not express an audit opinion or any form of assurance conclusion thereon.
In connection with our audit of the Group SFCR, our responsibility is to read the Other Information
and, in doing so, consider whether the Other Information is materially inconsistent with the relevant
elements of the Group SFCR, or our knowledge obtained in the audit, or otherwise appears to be
materially misstated. If we identify such material inconsistencies or apparent material
misstatements, we are required to determine whether there is a material misstatement in the
relevant elements of the Group SFCR or a material misstatement of the Other Information. If, based
on the work we have performed, we conclude that there is a material misstatement of this Other
Information, we are required to report that fact.
We have nothing to report in relation to these matters.
Responsibilities of Directors for the Group Solvency and Financial Condition Report
The Directors are responsible for the preparation of the Group SFCR in accordance with the financial reporting provisions of the PRA rules and Solvency II regulations which have been modified by the modifications, and supplemented by the approvals and determinations made by the PRA under section 138A of FSMA, the PRA Rules and Solvency II regulations on which they are based.
The Directors are also responsible for such internal control as they determine is necessary to enable the preparation of a Group SFCR that is free from material misstatement, whether due to fraud or error.
Auditor’s Responsibilities for the Audit of the relevant elements of the Group Solvency and Financial Condition Report
It is our responsibility to form an independent opinion as to whether the relevant elements of the Group SFCR are prepared, in all material respects, with financial reporting provisions of the PRA Rules and Solvency II regulations on which they are based.

13 | P a g e
Our objectives are to obtain reasonable assurance about whether the relevant elements of the Group
SFCR are free from material misstatement, whether due to fraud or error, and to issue an auditor’s
report that includes our opinion. Reasonable assurance is a high level of assurance, but it is not a
guarantee that an audit conducted in accordance with ISAs (UK) will always detect a material
misstatement when it exists. Misstatements can arise from fraud or error and are considered
material if, individually or in the aggregate, they could reasonably be expected to influence the
decision making or the judgement of the users taken on the basis of the Group SFCR.
A further description of our responsibilities for the audit of the financial statements is located on the
FRC’s website at https://www.frc.org.uk/auditorsresponsibilities. The same responsibilities apply to
the audit of the Group SFCR.
Report on Other Legal and Regulatory Requirements
Sectoral Information
In our opinion, in accordance with Rule 4.2 of the External Audit Chapter of the PRA Rulebook, the
sectoral information has been properly compiled in accordance with the PRA rules and EU instruments relating to that undertaking from information provided by members of the group and
the relevant insurance group undertaking.
Other Information
In accordance with Rule 4.1 (3) of the External Audit Chapter of the PRA Rulebook for Solvency II
firms we are also required to consider whether the Other Information is materially inconsistent with our knowledge obtained in the audit of Admiral Group Plc’s statutory financial statements. If, based on the work we have performed, we conclude that there is a material misstatement of this other
information, we are required to report that fact.
We have nothing to report in relation to this matter.
Use of our Report
This report is made solely to the Directors of Admiral Group Plc in accordance with Rule 4.1 (2) of
the External Audit Chapter of the PRA Rulebook for Solvency II firms. We acknowledge that our
report will be provided to the PRA for the use of the PRA solely for the purposes set down by statute
and the PRA’s rules. Our audit work has been undertaken so that we might state to the insurer’s
Directors those matters we are required to state to them in an auditor’s report on the relevant
elements of the Group SFCR and for no other purpose. To the fullest extent permitted by law, we do
not accept or assume responsibility to anyone other than the Company and the PRA, for our audit
work, for this report or for the opinions we have formed.
Mark McQueen
For and on behalf of Deloitte LLP
Statutory Auditor
London, United Kingdom
31 May 2019
14 | P a g e
A. BUSINESS AND PERFORMANCE
A.1. BUSINESS
GENERAL INFORMATION
Admiral Group plc (‘the Group’) is one of the UK’s largest car insurance providers. In addition to
offering car insurance in the UK, the Group also writes household, van and travel business in the UK,
and car insurance in four countries outside of the UK; Italy, Spain, France and the USA.
Outside of insurance, the Group has price comparison businesses in the UK, Spain, France and the
USA, with the UK price comparison business, Confused.com, being one of the UK’s leading comparison
websites for the last 16 years. The Group also has two law firms, Admiral Law Limited and BDE Law
Limited and provides unsecured personal loans and car finance in the UK through Admiral Financial
Services Limited.
The Group is a company incorporated in the United Kingdom. Its registered office is at Tŷ Admiral,
David Street, Cardiff CF10 2EH and its shares are listed on the London Stock Exchange.
The Group and its UK regulated insurance entity, Admiral Insurance Company Limited is subject to
supervision by the Prudential Regulation Authority (PRA) and the Financial Conduct Authority (FCA) in
the UK. The contact details for these supervisory authorities are as follows:
PRA FCA
Name Prudential Regulation Authority Financial Conduct Authority
Address
Bank of England
20 Moorgate
London
EC2R 6DA
12 Endeavour Square
London
E20 1JN
Where relevant, Group subsidiaries outside of the UK are subject to financial supervision by the local
supervisory authority.
The Group’s insurance entity registered in Gibraltar, Admiral Insurance (Gibraltar) Limited ‘AIGL’ is
subject to Solvency II regulation and is supervised by the Gibraltar Financial Services Commission. The
contact details for this supervisory authority are as follows:
Name Gibraltar Financial Services Commission
Address
PO Box 940
Suite 3, Ground Floor
Atlantic Suites
Europort Avenue
GX11-1AA
Gibraltar
During the year the Group established and received regulatory permissions for an insurance entity in
Spain; Admiral Europe Compañía de Seguros, S.A. (AECS) to underwrite the Group’s European business
after Brexit. Portfolio transfers of liabilities and associated assets of the Group’s European businesses
15 | P a g e
from AICL and AIGL to AECS were enacted on 1 January 2019, and all new European insurance business
is underwritten in AECS with effect from this date.
AECS is subject to the supervision of the Dirección General de Seguros y Fondos de Pensiones (DGSFP)
in Spain. It has prepared a separate 2018 Solvency and Financial Condition Report in line with the
requirements of the DGSFP.
The contact details for this supervisory authority are as follows:
DGSFP
Name Dirección General de Seguros y Fondos
de Pensiones
Address Paseo de la Castellana, 44. 28046 Madrid
The Group’s US insurer, Elephant Insurance Company, is not subject to Solvency II regulation. The
contact details for its supervisory authority are as follows:
Name Virginia State Corporation Commission
Bureau of Insurance
Address 1300 E. Main Street
Richmond
Virginia 23219
Details of the Group’s auditor are as follows:
Name Deloitte LLP
Address 1 New Street Square
London
EC4A 3HQ
As noted above, the Group is listed on the London Stock Exchange. At 31 December 2018, the
Company's issued share capital comprised a single class of shares referred to as ordinary shares.
Details of the share capital and shares issued during the year can be found in the Group’s 2018 Annual
Report (note 12d to the Group financial statements). Major shareholders as at 31 December 2018
were as follows:
Major shareholders % Shareholding at 31-Dec-18
Munich Re 10.1%
Henry Engelhardt & Diane
Briere de l'Isle 10.1%
16 | P a g e
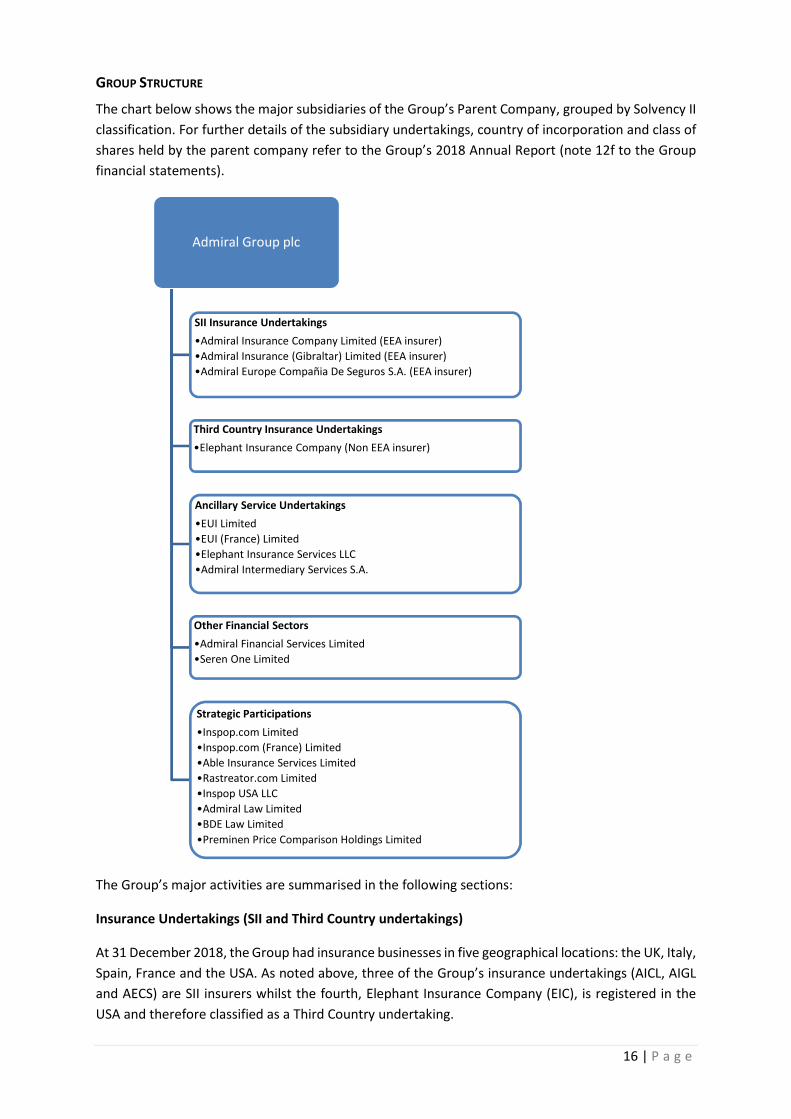
GROUP STRUCTURE
The chart below shows the major subsidiaries of the Group’s Parent Company, grouped by Solvency II
classification. For further details of the subsidiary undertakings, country of incorporation and class of
shares held by the parent company refer to the Group’s 2018 Annual Report (note 12f to the Group
financial statements).
The Group’s major activities are summarised in the following sections:
Insurance Undertakings (SII and Third Country undertakings)
At 31 December 2018, the Group had insurance businesses in five geographical locations: the UK, Italy,
Spain, France and the USA. As noted above, three of the Group’s insurance undertakings (AICL, AIGL
and AECS) are SII insurers whilst the fourth, Elephant Insurance Company (EIC), is registered in the
USA and therefore classified as a Third Country undertaking.
Admiral Group plc
SII Insurance Undertakings
•Admiral Insurance Company Limited (EEA insurer)
•Admiral Insurance (Gibraltar) Limited (EEA insurer)
•Admiral Europe Compañia De Seguros S.A. (EEA insurer)
Third Country Insurance Undertakings
•Elephant Insurance Company (Non EEA insurer)
Ancillary Service Undertakings
•EUI Limited
•EUI (France) Limited
•Elephant Insurance Services LLC
•Admiral Intermediary Services S.A.
Other Financial Sectors
•Admiral Financial Services Limited
•Seren One Limited
Strategic Participations
•Inspop.com Limited
•Inspop.com (France) Limited
•Able Insurance Services Limited
•Rastreator.com Limited
•Inspop USA LLC
•Admiral Law Limited
•BDE Law Limited
•Preminen Price Comparison Holdings Limited
17 | P a g e
Admiral Europe Compañía de Seguros, S.A. (AECS) and Admiral Intermediary Services S.A. (AIS) are
companies registered during 2017 as part of the Group’s plans to establish a new insurer and
intermediary in Spain post Brexit. These entities were granted regulatory permissions during the year,
with AECS obtaining the license to write car and household insurance in Spain in July 2018 and
subsequently obtaining the passport to write these insurance products in Italy and France under the
Freedom of Services Regime. Portfolio transfers of liabilities and associated assets of the Group’s
insurance businesses in Italy, Spain, and France from AICL and AIGL to AECS were enacted on 1 January
2019, and all new European insurance business is underwritten in AECS with effect from this date.
The table below summarises the Group’s material Solvency II lines of business:
Motor Vehicle Liability
Private motor insurance, capturing bodily injury liabilities (including liabilities that
may potentially settle by way of Periodic Payment Order in the future) and third-
party property damage.
Motor Vehicle Other Private motor insurance, capturing accident damage liabilities (including fire, theft
and windscreen liabilities).
Fire and damage to other
property
Household insurance, capturing accidental damage, escape of water, fire, weather
and subsidence liabilities.
General Liability Household insurance capturing public liability risks.
Assistance and Miscellaneous
Financial Loss
Any other risks arising from insurance products that supplement the core private
motor and household insurance products.
Annuities stemming from non-
life insurance contracts and
relating to insurance
obligations other than health
insurance obligations
Private motor insurance liabilities arising through claims settled as Periodic Payment
Orders. The Group has no non-life insurance contracts relating to health insurance
obligations.
Ancillary Services Undertakings
The Group’s insurance intermediaries are classified as Ancillary Services Undertakings for Solvency II
purposes. These entities are non-regulated (as per the definition in Article 2(4) of Directive 2002) with
principal activities that are deemed to be ancillary to the Group’s insurance undertakings. The most
material entity is EUI Limited which provides intermediary services for insurance underwriting in the
UK, Spain and Italy.
Other Financial Sectors
The Group’s loans business, Admiral Financial Services Limited (AFSL) is classified as a non-regulated
entity carrying out financial activities within Own Funds of Other Financial Sectors. It provides
unsecured personal loans and car finance in the UK.
Seren One Limited is a SPE set up by the Group in relation to the Admiral loans business, whereby the
Group has securitised certain loans by the transfer of the loans to the SPE. The securitisation enables
a subsequent issuance of debt by the SPE to investors who gain the security of the underlying assets
as collateral.
Strategic Participations
All other entities in the Group are classified as Strategic Participations. The principal activity is Price
Comparison, where Admiral’s strategy is to develop websites that allow consumers to compare a
range of general insurance, financial services and other products.
18 | P a g e
The Group’s UK price comparison site, branded as Confused.com (Inspop.com Limited) was launched
in 2002 and is one of the UK’s leading comparison websites. International price comparison operations
in Europe (Rastreator.com in Spain and Lelynx.fr in France) and in the USA (compare.com) have
subsequently been launched in 2009, 2010 and 2013 respectively. More recently, the Group has
established Preminen, a Price Comparison incubator that looks to establish price comparison
businesses in a number of new markets around the world.
The Group’s UK based law firms, Admiral Law and BDE Law, provide a range of legal services, with the
companies’ legal experts primarily specialising in road traffic accident claims, and Able Insurance
Services Limited is a public liability insurance broker.
SIGNIFICANT EVENTS DURING THE REPORTING PERIOD
Proposed Change in UK discount rate (‘Ogden discount rate’)
During December 2018, the Civil Liability Bill, which brings into law changes to the way that the Ogden
discount rate is set, received Royal Assent and has been enacted as the Civil Liability Act.
The Ogden discount rate is used for adjusting the value of lump sum personal injury compensation,
according to the amount the victims of serious personal injury can expect to earn by investing it. The
principle of the new legislation is one of fair compensation, and the changes will result in the rate
being set with reference to ‘low risk’ rather than ‘very low risk’ investments, better reflecting the
actual investment risk that claimants are prepared to take.
At the time of the announcement of the proposed legislation in 2017, the Lord Chancellor implied that
the new system would result in a rate in the region of 0% to 1%.
The enactment of the legislation marks the start of a process for setting a new rate, with a maximum
230-day timeframe meaning that we will receive a new rate during or before August 2019. As such,
the significant majority of relevant open claims at the balance sheet date will be settled under the
new rate.
The Group’s best estimate assumption for the new rate, applied at the 2018 year-end is 0%. The
setting of this assumption reflects a number of factors including current long-term economic forecasts
and analysis released by the Government Actuary Department setting out the approach it is expected
to take in recommending the new rate to the Lord Chancellor.
UK Exit from the European Union (‘Brexit’)
Admiral has adopted a prudent approach in relation to Brexit, designed to mitigate the risks to our
European businesses of a potential ‘hard Brexit’, which could have prevented those operations from
continuing to trade due to reliance on passporting rights.
The businesses that potentially would have been impacted, being the European insurers and European
price comparison businesses, have been restructured so as to fully mitigate a ‘no deal’ outcome.
This has been achieved for the European insurance intermediaries through Admiral receiving approval
to establish an intermediary company in Spain, Admiral Intermediary Services, S.A. (AIS). All of the
trade and assets of the Spanish and Italian branches of UK-based EUI Limited have been transferred
to AIS from 1 January 2019. The assets and liabilities of EUI France, EUI Limited’s subsidiary, have been

19 | P a g e
transferred to AIS via a cross border merger process such that, as of 1 January 2019, EUI France is fully
liquidated.
Admiral also received approval for an application to establish an insurance company in Spain and from
1 January 2019 all of the Group’s European insurance business is underwritten by a regulated entity
in Spain, Admiral Europe Compañía de Seguros, S.A. (AECS). All existing liabilities, assets and contracts
relating to these businesses have been transferred through portfolio transfer processes under Part VII
of the Financial Services and Markets Act 2000, also effective from 1 January 2019.
In addition, the Group’s European price comparison businesses Rastreator and LeLynx have
successfully been merged into price comparison companies established in Spain (Comparaseguros
Corredia de Seguros) and France (LeLynx SAS) respectively.
AIGL, the Group’s Gibraltar insurance entity, will be able to continue to carry on trading in an
uninterrupted manner after Brexit as a result of the passing of relevant legislation by the UK and
Gibraltar governments. In March 2018, at the Joint Ministerial Council with the government of
Gibraltar, the UK government announced that Gibraltar’s authorised financial services firms will
continue to be able to access the UK as they currently do until 2020 in a no-deal scenario. UK firms
will also continue to be able to exercise their passport rights as now in Gibraltar.
In addition, to support market access between the UK and Gibraltar, HM Treasury has published two
Statutory Instruments (SIs); The Financial Services (Gibraltar) (Amendment) (EU Exit) Regulations 2019
and The Gibraltar (Miscellaneous Amendments) (EU Exit) Regulations 2019. The first relates to the
continuation of the deemed passport rights of Gibraltar-based firms into the UK. The second preserves
the overall pre-Brexit regulatory position, notwithstanding the legislative changes made under the
EUWA.
A.2. UNDERWRITING PERFORMANCE
The tables below show the Group’s underwriting performance (premiums, claims and expenses in line
with QRTs S.05.01 and S.05.02) summarised by Solvency II line of business and by geographical
location. The tables are prepared on a financial statement basis and are reconciled to the Group
statutory profit in section A.4 below. Total Group net premiums earned of £671.8 million (which does
not form part of the profit reconciliation in section A.4) can be agreed to note 5 of the Group Financial
statements within the 2018 Annual Report.
31-Dec-18 Net
Premiums
Written
Net
Premiums
Earned
Net Claims
Incurred
Net
Expenses
Incurred
Other
Expenses*1 Total
Motor Vehicle Liability 437.4 420.5 (200.1) (96.5) 123.9
Motor Vehicle Other 179.3 173.8 (79.5) (41.7) 52.6
Fire and damage to other
property 34.5 30.9 (28.5) (4.9) (2.5)
General Liability 0.4 0.3 (0.2) (0.1) -
Assistance and Miscellaneous
Financial Loss 51.2 46.3 (27.6) (8.2) 10.5
Annuities stemming from non-
life insurance contracts (Life) - - (6.8) (0.3) (7.1)
Total 2018 702.4 671.8 (342.7) (151.7) 19.3 196.7
*1 Other expenses represent intra-group price comparison expenses that are eliminated for the purposes of the Group financial statements.
20 | P a g e
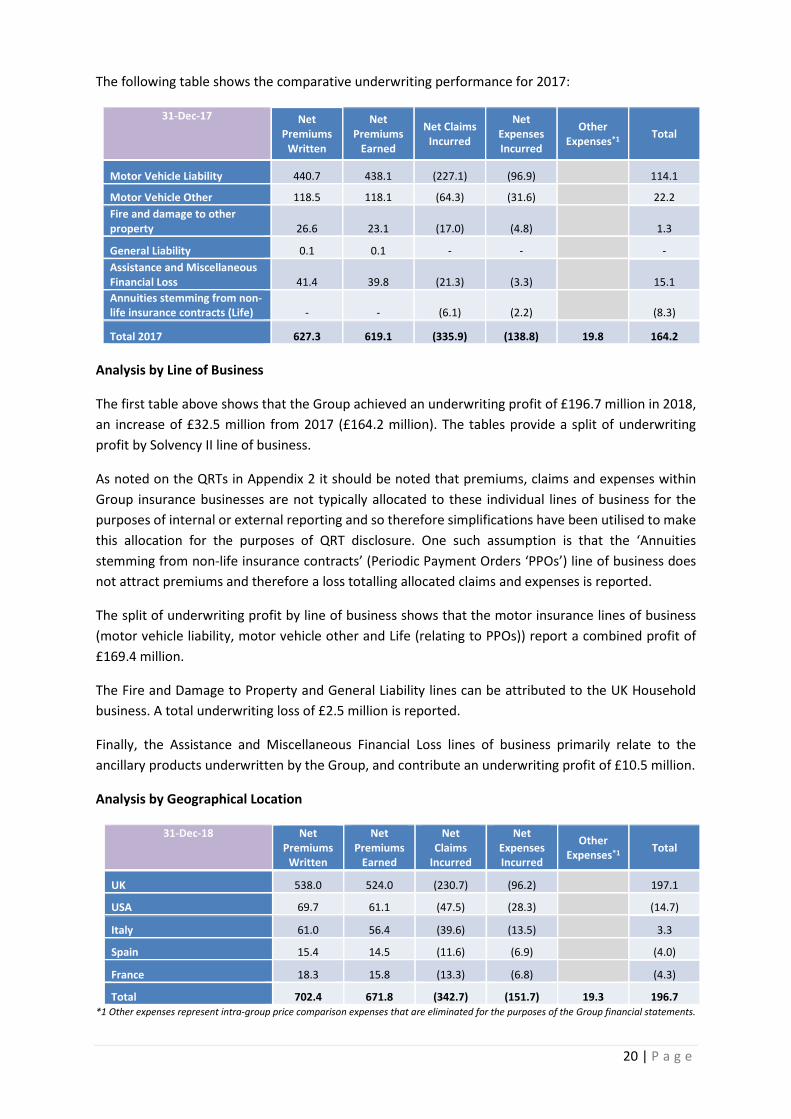
The following table shows the comparative underwriting performance for 2017:
31-Dec-17 Net
Premiums
Written
Net
Premiums
Earned
Net Claims
Incurred
Net
Expenses
Incurred
Other
Expenses*1 Total
Motor Vehicle Liability 440.7 438.1 (227.1) (96.9)
114.1
Motor Vehicle Other 118.5 118.1 (64.3) (31.6)
22.2
Fire and damage to other
property 26.6 23.1 (17.0) (4.8)
1.3
General Liability 0.1 0.1 - -
-
Assistance and Miscellaneous
Financial Loss 41.4 39.8 (21.3) (3.3)
15.1
Annuities stemming from non-
life insurance contracts (Life) - - (6.1) (2.2)
(8.3)
Total 2017 627.3 619.1 (335.9) (138.8) 19.8 164.2
Analysis by Line of Business
The first table above shows that the Group achieved an underwriting profit of £196.7 million in 2018,
an increase of £32.5 million from 2017 (£164.2 million). The tables provide a split of underwriting
profit by Solvency II line of business.
As noted on the QRTs in Appendix 2 it should be noted that premiums, claims and expenses within
Group insurance businesses are not typically allocated to these individual lines of business for the
purposes of internal or external reporting and so therefore simplifications have been utilised to make
this allocation for the purposes of QRT disclosure. One such assumption is that the ‘Annuities
stemming from non-life insurance contracts’ (Periodic Payment Orders ‘PPOs’) line of business does
not attract premiums and therefore a loss totalling allocated claims and expenses is reported.
The split of underwriting profit by line of business shows that the motor insurance lines of business
(motor vehicle liability, motor vehicle other and Life (relating to PPOs)) report a combined profit of
£169.4 million.
The Fire and Damage to Property and General Liability lines can be attributed to the UK Household
business. A total underwriting loss of £2.5 million is reported.
Finally, the Assistance and Miscellaneous Financial Loss lines of business primarily relate to the
ancillary products underwritten by the Group, and contribute an underwriting profit of £10.5 million.
Analysis by Geographical Location
31-Dec-18 Net
Premiums
Written
Net
Premiums
Earned
Net
Claims
Incurred
Net
Expenses
Incurred
Other
Expenses*1 Total
UK 538.0 524.0 (230.7) (96.2) 197.1
USA 69.7 61.1 (47.5) (28.3) (14.7)
Italy 61.0 56.4 (39.6) (13.5) 3.3
Spain 15.4 14.5 (11.6) (6.9) (4.0)
France 18.3 15.8 (13.3) (6.8) (4.3)
Total 702.4 671.8 (342.7) (151.7) 19.3 196.7
*1 Other expenses represent intra-group price comparison expenses that are eliminated for the purposes of the Group financial statements.

21 | P a g e
The table above analyses the Group underwriting performance by geographical location. The UK
Insurance business generates over 100% of the Group underwriting profit (£197.1 million), with the
Group’s International businesses in total contributing an underwriting loss of £19.7 million (all before
elimination of intra-group price comparison expenses).
The underwriting performance analysis excludes other revenue generated from the sale of additional
products alongside the core motor insurance policy. Therefore, the combined international
underwriting loss is different to the International Car Insurance segment loss of £1.1 million reported
in note 4 to the Group financial statements in the Group’s 2018 Annual Report.
Other revenue generated by the UK and International businesses is reported within Section A.4 below
(Performance of Other Activities).
Solo Entity Premiums, Claims and Expenses
31-Dec-18 Net
Premiums
Written
Net
Premiums
Earned
Net Claims
Incurred
Net
Expenses
Incurred
Other
Expenses Total 2018
AICL 190.7 186.6 (125.7) (33.9) 27.0
AIGL 442.0 424.1 (169.6) (72.1) 182.4
31-Dec-17 Net
Premiums
Written
Net
Premiums
Earned
Net Claims
Incurred
Net
Expenses
Incurred
Other
Expenses Total 2017
AICL 179.7 172.4 (116.9) (32.9) 22.7
AIGL 394.5 391.8 (176.7) (66.9) 148.2
As detailed in the QRTs in Appendix 2 to this report, total non-life and life premiums, claims for the
Group’s two SII solo entities AICL and AIGL are shown in the table above. Both entities report an
underwriting profit, with the more material underwriting profits in AIGL reflecting its higher net share
of UK motor insurance and profits generated by the motor policy upgrade products.

22 | P a g e
A.3. INVESTMENT PERFORMANCE
The tables below show a breakdown of investment income by type for both 2018 and 2017:
31-Dec-18 GROUP AICL AIGL
2018 2017 2018 2017 2018 2017
Investment return on assets
classified as FVTPL 6.5 2.1 1.4 0.5 4.9 1.6
Unrealised losses on forward
contracts (2.3) (2.3) - - - -
Investment return on debt
securities classified as FVOCI 28.0 32.4 2.2 1.8 20.8 25.4
Investment return on deposits
with credit institutions 3.1 3.4 0.5 0.7 2.2 2.3
Realised gains on sale of gilt
assets - 5.4 - - - -
Interest receivable on cash
and cash equivalents 1.3 0.8 (0.2) (0.1) 0.6 0.4
Total 2018 36.6 41.8 3.9 2.9 28.5 29.7
Group Investment and interest income in 2018 was £36.6 million.
The underlying rate of return for the year (excluding accruals related to reinsurance contract funds
withheld) on the Group’s cash and investments was 1.2% (2017: 1.3%).
In addition to the investment income recognised in the IFRS income statement, the Group also
recorded a gain of £22.9 million (2017: gain of £8.3 million) in the Fair Value reserve within Equity as
a result of unrealised gains arising on the valuation of ‘Available for Sale’ financial assets.
Investment income in the solo entities was £3.9 million and £28.5 million for AICL and AIGL
respectively.
23 | P a g e
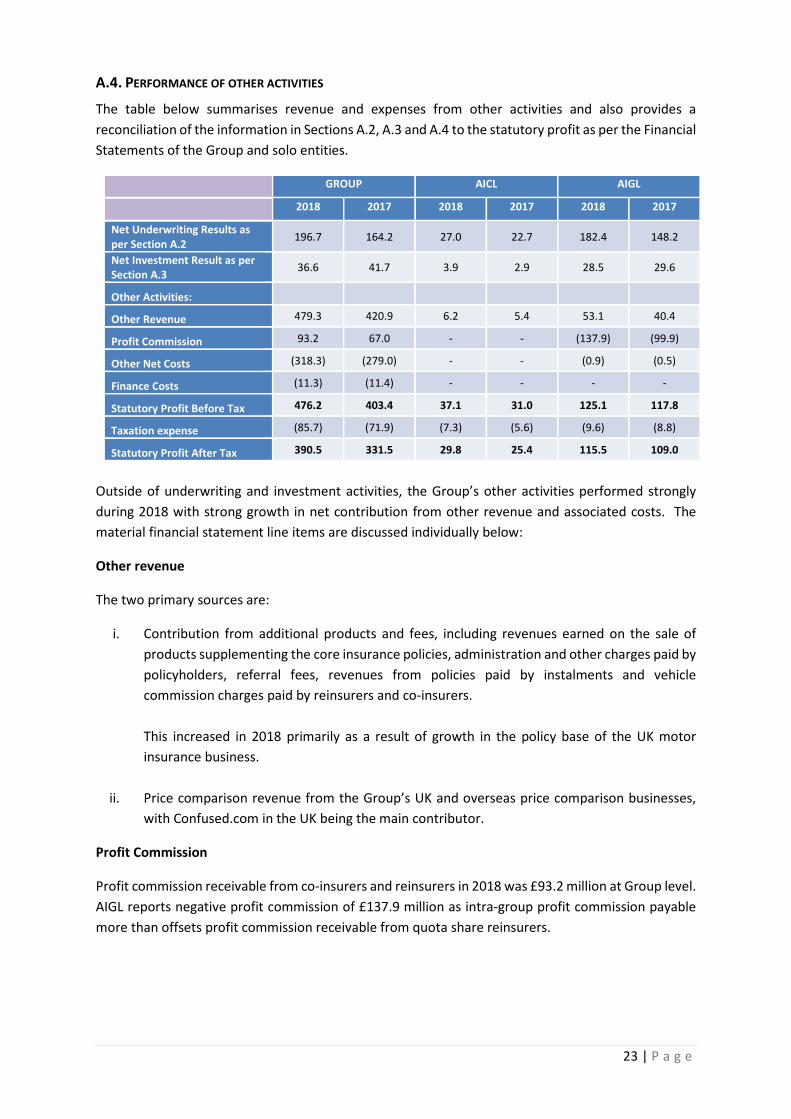
A.4. PERFORMANCE OF OTHER ACTIVITIES
The table below summarises revenue and expenses from other activities and also provides a
reconciliation of the information in Sections A.2, A.3 and A.4 to the statutory profit as per the Financial
Statements of the Group and solo entities.
GROUP AICL AIGL
2018 2017 2018 2017 2018 2017
Net Underwriting Results as
per Section A.2 196.7 164.2 27.0 22.7 182.4 148.2
Net Investment Result as per
Section A.3 36.6 41.7 3.9 2.9 28.5 29.6
Other Activities:
Other Revenue 479.3 420.9 6.2 5.4 53.1 40.4
Profit Commission 93.2 67.0 - - (137.9) (99.9)
Other Net Costs (318.3) (279.0) - - (0.9) (0.5)
Finance Costs (11.3) (11.4) - - - -
Statutory Profit Before Tax 476.2 403.4 37.1 31.0 125.1 117.8
Taxation expense (85.7) (71.9) (7.3) (5.6) (9.6) (8.8)
Statutory Profit After Tax 390.5 331.5 29.8 25.4 115.5 109.0
Outside of underwriting and investment activities, the Group’s other activities performed strongly
during 2018 with strong growth in net contribution from other revenue and associated costs. The
material financial statement line items are discussed individually below:
Other revenue
The two primary sources are:
i. Contribution from additional products and fees, including revenues earned on the sale of
products supplementing the core insurance policies, administration and other charges paid by
policyholders, referral fees, revenues from policies paid by instalments and vehicle
commission charges paid by reinsurers and co-insurers.
This increased in 2018 primarily as a result of growth in the policy base of the UK motor
insurance business.
ii. Price comparison revenue from the Group’s UK and overseas price comparison businesses,
with Confused.com in the UK being the main contributor.
Profit Commission
Profit commission receivable from co-insurers and reinsurers in 2018 was £93.2 million at Group level.
AIGL reports negative profit commission of £137.9 million as intra-group profit commission payable
more than offsets profit commission receivable from quota share reinsurers.
24 | P a g e
Other Net Costs
Other costs primarily relate to the other revenue noted above, being internal costs allocated to the
generation of contribution from other products and fees, and also price comparison expenses. These
costs increased with the growth in the revenue lines noted above.
This category also includes central group costs that are not allocated to individual businesses – net
share scheme charges being the most significant.
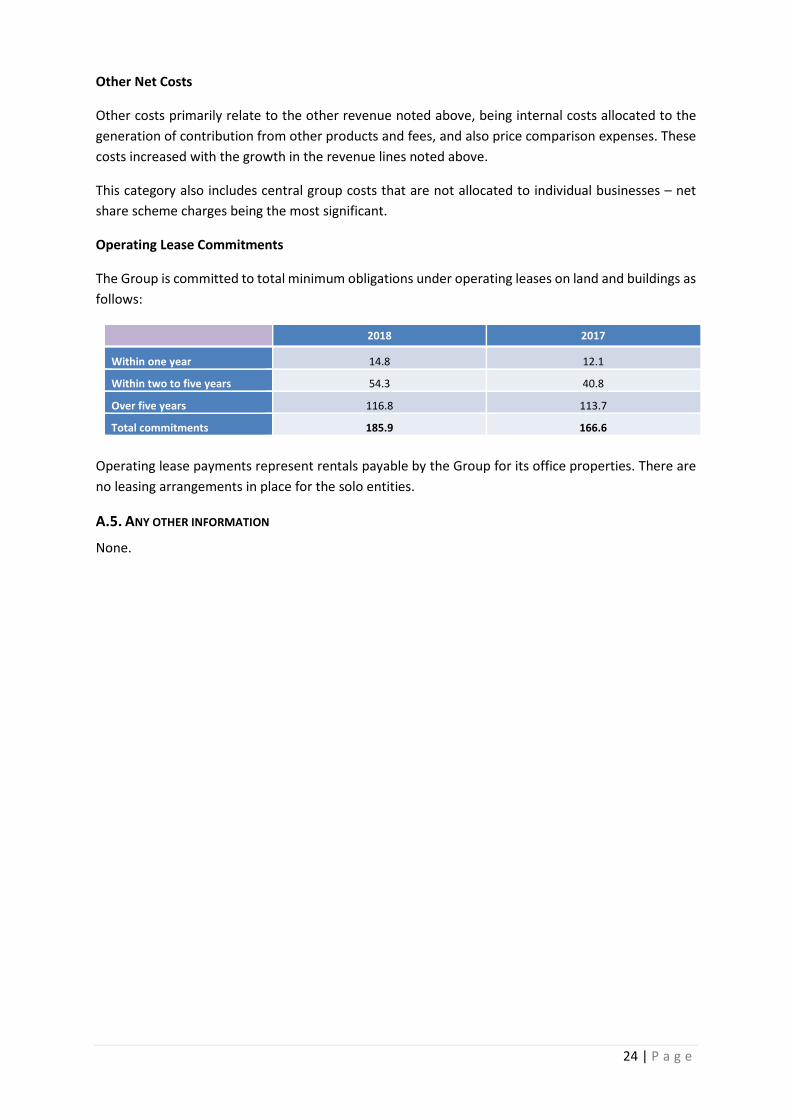
Operating Lease Commitments
The Group is committed to total minimum obligations under operating leases on land and buildings as
follows:
2018 2017
Within one year 14.8 12.1
Within two to five years 54.3 40.8
Over five years 116.8 113.7
Total commitments 185.9 166.6
Operating lease payments represent rentals payable by the Group for its office properties. There are
no leasing arrangements in place for the solo entities.
A.5. ANY OTHER INFORMATION
None.

25 | P a g e
B. SYSTEM OF GOVERNANCE
B.1. GENERAL INFORMATION ON THE SYSTEM OF GOVERNANCE
STRUCTURE OF THE ADMINISTRATIVE, MANAGEMENT OR SUPERVISORY BODY
The Board is the principal decision-making forum for the Group providing entrepreneurial leadership,
both directly and through its Committees, and delegating authority to the Executive team. The solo
entities AICL and AIGL have respective individual Board meetings that act in the same manner as the
Group Board. The Group Board and its Committees also have oversight of AICL and AIGL activities and
for AICL, the Group Audit Committee provides a review of the key accounting judgements in respect
of the annual accounts, SFCR and QRTs.
The Group’s 2018 Annual report (Governance section) provides further detail of the role of the Board
and other information such as Board activity during the period.
The Board has delegated authority to a number of permanent Committees to deal with matters in
accordance with written Terms of Reference. The principal Committees of the Group Board - Audit,
Remuneration, Risk and Nomination (as shown in the diagram below) - all comply fully with the
requirements of the Corporate Governance Code.
All Group Committees are chaired by an independent Non-Executive Director, except the Group
Nomination Committee which is chaired by the Chairman of the Board, and comprise a majority of
independent Non-Executive Directors. Appointments to the Committees are made on the
recommendation of the Group Nomination Committee and are for a period of up to three years, which
may be extended for two further three year periods, provided the Director remains independent.
The Committees are constituted with written Terms of Reference that are reviewed annually to ensure
that they remain appropriate and reflect any changes in good practice and governance. These Terms
of Reference are available on request from the Company Secretary and can also be found on the
Company’s website: www.admiralgroup.co.uk. Directors are fully informed of all Committee matters
by the Committee Chairmen reporting on the proceedings of their Committee at the subsequent
Board meeting. Copies of Committee minutes are also distributed to the Board.
The AICL and AIGL subsidiary Boards are chaired by Non-Executive Directors.
Group Board of Directors
Group Audit Committee
Group Risk Committee
Group Nomination Committee
Group Remuneration
Committee
26 | P a g e
MATERIAL CHANGES IN THE SYSTEM OF GOVERNANCE
There were no material changes in the system of governance during the year, aside from changes in
membership of the Group Board and its Committees during the usual course of business:
• Andy Crossley joined the Group Board as Non-Executive Director and a member of the Audit
Committee on 27 February 2018.
• Annette Court stepped down as a member of the Remuneration Committee on 14 May 2018.
• Owen Clarke became Chairman of the Remuneration Committee on 14 May 2018.
• Michael Brierley joined the Group Board as Non-Executive Director and a member of the Audit
Committee on 5 October 2018.
• Karen Green joined the Group Board as Non-Executive Director and Chair of the Audit
Committee on 14 December 2018.
• Colin Holmes stepped down as a Non-Executive Director, Senior Independent Director and
Chairman of the Audit Committee on 14 December 2018.
Additionally, the following changes were also made in respect of the AIGL solo entity Board during the
year:
• Pascal Gonzalvez stepped down from the AIGL Board with effect from 4 December 2018.
• Elisa De Blas joined the AIGL Board with effect from 4 December 2018.
No changes were made in respect of the AICL solo entity Board during the year.
REMUNERATION POLICY
Key Principles of Admiral Remuneration Arrangements
Admiral is committed to the primary objective of maximising shareholder value over time and ensuring
that there is a strong link between performance, risk and reward. This is reflected in the Group’s
approach of paying competitive, performance-linked and shareholder-aligned remuneration packages
comprising basic salaries coupled with participation in performance-based share schemes to generate
competitive total reward packages.
Fixed remuneration at Admiral comprises base salaries, benefits and pension. In line with the
principles outlined above, base salaries are fixed and reflect the individual’s responsibilities, role, job
size and performance. Market and economic conditions and developments in governance are also
considered when setting base salaries and determining the appropriate benefits and pension
provisions.
Longer-term performance-based reward is provided through the Discretionary Free Share Scheme
which is outlined below. The balance between fixed and variable remuneration ensures that an
element of overall reward is linked to longer-term Group Strategy and risk management as well as to
shareholder and customer value.
Two share schemes are operated within the Group, as follows:
(i) The Approved Share Incentive Plan (the SIP)
All eligible employees qualify for awards under the SIP based upon the performance of the Group in
each half-year period. The maximum award for each year is £3,600 per employee. The awards are
27 | P a g e
made with reference to the Group’s performance against prior year profit before tax. Employees must
remain in employment for the holding period (three years from the date of award) otherwise the
shares are forfeited.
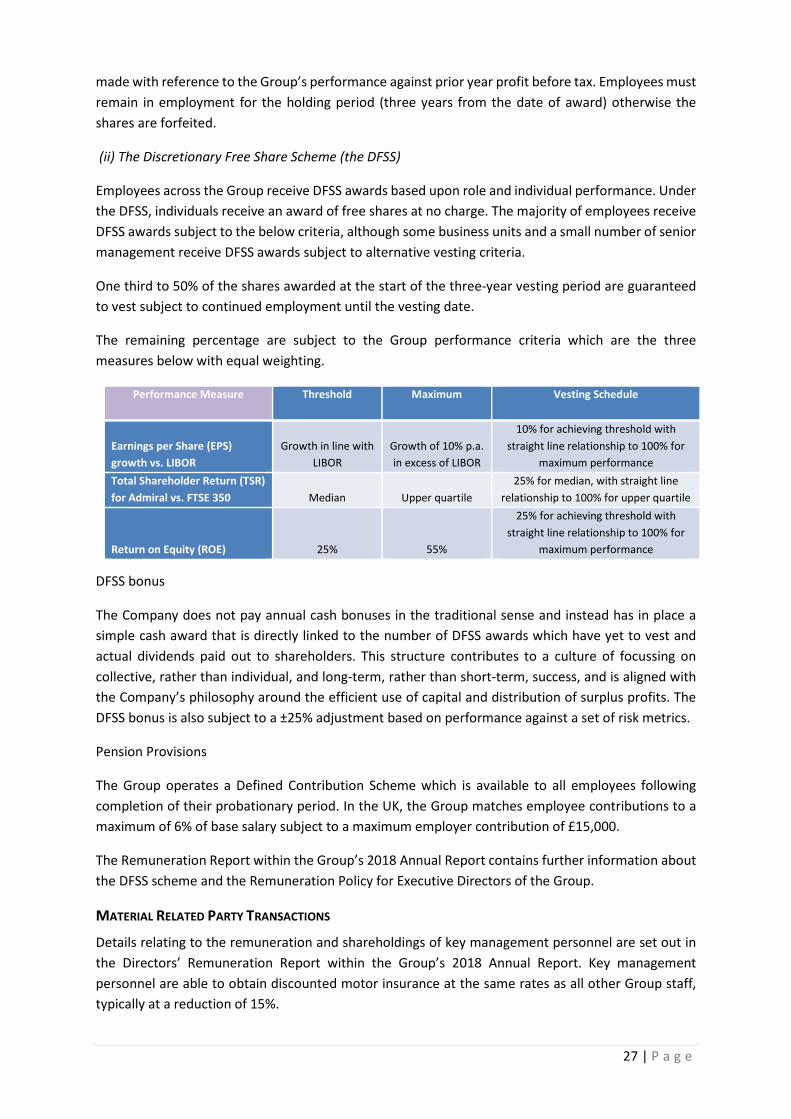
(ii) The Discretionary Free Share Scheme (the DFSS)
Employees across the Group receive DFSS awards based upon role and individual performance. Under
the DFSS, individuals receive an award of free shares at no charge. The majority of employees receive
DFSS awards subject to the below criteria, although some business units and a small number of senior
management receive DFSS awards subject to alternative vesting criteria.
One third to 50% of the shares awarded at the start of the three-year vesting period are guaranteed
to vest subject to continued employment until the vesting date.
The remaining percentage are subject to the Group performance criteria which are the three
measures below with equal weighting.
Performance Measure Threshold Maximum Vesting Schedule
Earnings per Share (EPS)
growth vs. LIBOR
Growth in line with
LIBOR
Growth of 10% p.a.
in excess of LIBOR
10% for achieving threshold with
straight line relationship to 100% for
maximum performance
Total Shareholder Return (TSR)
for Admiral vs. FTSE 350 Median Upper quartile
25% for median, with straight line
relationship to 100% for upper quartile
Return on Equity (ROE) 25% 55%
25% for achieving threshold with
straight line relationship to 100% for
maximum performance
DFSS bonus
The Company does not pay annual cash bonuses in the traditional sense and instead has in place a
simple cash award that is directly linked to the number of DFSS awards which have yet to vest and
actual dividends paid out to shareholders. This structure contributes to a culture of focussing on
collective, rather than individual, and long-term, rather than short-term, success, and is aligned with
the Company’s philosophy around the efficient use of capital and distribution of surplus profits. The
DFSS bonus is also subject to a ±25% adjustment based on performance against a set of risk metrics.
Pension Provisions
The Group operates a Defined Contribution Scheme which is available to all employees following
completion of their probationary period. In the UK, the Group matches employee contributions to a
maximum of 6% of base salary subject to a maximum employer contribution of £15,000.
The Remuneration Report within the Group’s 2018 Annual Report contains further information about
the DFSS scheme and the Remuneration Policy for Executive Directors of the Group.
MATERIAL RELATED PARTY TRANSACTIONS
Details relating to the remuneration and shareholdings of key management personnel are set out in
the Directors’ Remuneration Report within the Group’s 2018 Annual Report. Key management
personnel are able to obtain discounted motor insurance at the same rates as all other Group staff,
typically at a reduction of 15%.
28 | P a g e
The Board considers that only the Executive Directors of Admiral Group plc are key management
personnel. Aggregate compensation for the Executive Directors is disclosed in the Directors’
Remuneration Report within the Group’s 2018 Annual Report.
B.2. FIT AND PROPER REQUIREMENTS
The Admiral Group Nominations Committee owns and approves the Admiral Group plc Fit and Proper
Policy. The policy aims to ensure that all senior individuals who represent the organisation meet the
fit and proper requirements in terms of qualifications, capability, honesty and integrity. As per the
Policy, all prospective senior management appointments shall fill out a checklist prior to an offer being
made. The checklist includes details of the candidate’s knowledge, competence and experience to
perform the role, and a declaration from the senior manager responsible for the recruitment to
confirm the assessment of the candidate’s fitness and propriety was carried out in line with this Policy.
In addition, the candidate will be subject to interviews with appropriate members of staff, who will
help complete the assessment of the candidate’s fitness and propriety in relation to that role.
In order to ensure that the individuals running the organisation are fit and proper a number of checks
are undertaken including;
• Previous employment history
• Educational background check
• Professional qualifications and membership check
• Notification of appointment to regulator
• Information on potential conflicts of interest
• Criminal history checks
• Credit checks
• Identity checks
• Directorship check
• Financial sanctions checks
The Head of People Services is responsible for ensuring the Fit and Proper policy, approved by the
Admiral Group Nominations Committee, is adhered to when senior management appointments are
made by the firm. The policy is reviewed annually by Compliance to ensure it is in line with all relevant
regulations and remains fit for purpose. In addition, all senior management are subject to
requirements laid out by the UK regulators (FCA and PRA), through the Senior Insurance Management
Regime.
B.3. RISK MANAGEMENT SYSTEM INCLUDING THE OWN RISK AND SOLVENCY ASSESSMENT (ORSA)
The Group has a ‘three lines of defence’ approach to Risk Management, the scope of which also applies
to the solo entities AICL and AIGL. The ‘first line of defence’ describes the controls the Group has in
place to deal with the day-to-day business. Controls, which are designed to appropriately mitigate
risk, are managed by the business unit and overseen by the business unit Risk Management
Committees who ensure compliance and review control breakdowns, inadequacy of process and
unexpected events.
The ‘second line of defence’ describes the Committees (primarily the GRC) and functions that are in
place to provide an oversight of the effective operation of the internal control framework. These
committees review the management of risk in relation to the particular risk appetite of the business,
as determined by the Board. The ‘second line’ is reinforced by the advisory and monitoring functions
29 | P a g e
of Risk and Compliance. Risk defines and prescribes risk assessment processes for the business,
maintains risk registers and undertakes regular reviews of these risks and controls in conjunction with
line management. Compliance provides advice on all areas of regulatory principles, rules and
guidance, including reviewing any changes, and undertakes monitoring activity on key areas of
regulatory risk and policy adherence.
The ‘third line of defence’ describes the independent assurance provided by the Audit Committee and
the Group Internal Audit function that reports to that committee. Internal Audit undertakes a
programme of risk based audits covering all aspects of both the first and second lines of defence. The
findings from these audits are reported to all three lines, i.e. line management, the executive and
oversight committees and the Audit Committee.
The Group’s Enterprise Risk Management Framework is described in Section C (Risk Profile) below.
ORSA
Admiral Group plc’s Risk Strategy is directly linked to its business plan and model. The approach is
embedded in the ORSA and links to the business planning process.
The Group Risk Function defines and prescribes the financial and operational risk assessment
processes for the business; performs second line reviews, including reserving and capital modelling
processes; maintains the risk registers; undertakes regular reviews of these risks in conjunction with
line management; delivers the Own Risk and Solvency Assessment (ORSA); and records any actual
losses or near misses that occur as a consequence of the realisation of risk.
The Chief Risk Officer has responsibility for ensuring that managers are aware of their risk
management obligations, providing them with support and advice, and ensuring that the risk
management strategy is properly communicated. Reports are produced showing the most significant
risks identified and the controls in place. Internal Audit uses the risk registers to plan and inform their
programme of audits around the most significant risks to the Group to ensure that the prescribed
controls are in place and are operating effectively.
ORSA Approval Process
On an annual basis, or following significant changes in the risk profile of the business, the Group Risk
Function will produce an Own Risk and Solvency Assessment (ORSA) Report, in line with the ORSA
Policy and Solvency II regulations. The report is reviewed and challenged at the GRC prior to
submission to the Group and subsidiary Board Committees.
The report is also submitted to the PRA for information purposes, and to receive feedback on the
quality and suitability of the report.
Group Determination of Solvency Requirements
Within the ORSA, the Solvency Capital Requirement is calculated on two bases; Regulatory and
Economic (ultimate). The ORSA considers both bases in order to provide a quantification of the
differences between the two viewpoints. In addition, analyses of the key drivers of economic
(ultimate) capital needs and regulatory capital requirements are also considered.
30 | P a g e
Admiral is currently developing an internal model and intends to seek approval from the PRA and the
FSC to calculate the regulatory SCR using a Partial Internal Model (PIM) for Group and AIGL. Whilst
Admiral completes this development, the Group’s regulatory capital requirement is based on the
Solvency II standard formula with a Capital Add-On to reflect recognised limitations in the standard
formula, (predominantly in respect of profit commission arrangements within co- and reinsurance
contracts and risks arising from Periodic Payment Order (PPOs) claims).
Refer to section C for a review of the Group’s basis for calculating Regulatory capital requirements.
B.4. INTERNAL CONTROL SYSTEM
The Admiral Group Internal Control Policy documents the procedures in place within the Group (that
also cover the solo entities AICL and AIGL), to ensure there is an effective internal control system
operating. The internal control system is managed through both the effective operation of the systems
of governance in place within the Group, as well as through the three lines of defence strategy
adopted by the Group.
The Internal Control framework is broadly defined as continually operating processes, effected by the
Board of Directors, management and all levels of personnel, designed to provide reasonable assurance
regarding the achievement of objectives in the following categories:
• Effectiveness and efficiency of operations in view of its risks and objectives
• Availability and reliability of financial and non-financial information
• Compliance with applicable laws, regulations and administrative provisions
Internal control consists of four interrelated components:
• Control environment – sets the tone of an organisation through the business plan, risk
appetite and risk profile.
• Control activities – policies and procedures that help ensure necessary actions are taken to
address risks to achieve the business’ objectives.
• Information and Communication – Pertinent information must be identified, captured and
communicated in a form and timeframe that allows relevant individuals to carry out their
responsibilities.
• Monitoring – Internal control systems need to be monitored to assess the quality of the
internal control system over time. This is accomplished through ongoing monitoring activities,
with deficiencies in the internal control framework reported to senior management and the
Board.
The Group’s control environment is determined by the Admiral Group Board of Directors, supported
by a number of Committees who have set the tone of the organisation through the Admiral culture,
principles, business plan and risk appetite.
Key control activities are mapped to primary risks held within the Group’s risk universe.
Line 1 (operational functions) are responsible for monitoring all the risks facing their operation,
whether this be through call monitoring, file reviews or audit reviews. Results on monitoring activities
are provided to operation managers, and subsequently reported on through the Admiral Group
Governance structure.
31 | P a g e
Line 2 (Risk & Data Protection, Compliance and Actuarial functions) are responsible for the oversight
of the Line 1 monitoring. This is done through:
• Risk reviews – business unit risk and controls discussed at RMCs with material risks and KRIs
presented to Group Risk Committee in the Consolidated Risk Report
• Compliance Advice and Compliance Monitoring Reviews presented to Group Risk Committee
• Actuarial and validation reviews
Line 3 (Internal Audit) are responsible for conducting an objective and independent appraisal of all the
Group's activities, financial and otherwise, through a risk based plan, approved annually by the Group
Audit Committee.
External Reviewers are responsible for the oversight of specific processes within the Group, depending
on the scope of the review they are required to undertake.
B.5. COMPLIANCE FUNCTION
The Group Compliance Function sets the strategic direction for the business on Compliance matters
and provides oversight and assurance to the Board over the effectiveness of the first line areas in
delivering its regulatory responsibilities and adherence to the rules and guidelines set by the FCA and
PRA, along with other regulatory bodies as applicable.
The Group Compliance Function is responsible for the design, implementation, monitoring, and review
of the Group’s Conduct Risk Management Framework as well as the identification and communication
of any new requirements arising from changes in regulation. The Function, alongside Group Risk,
oversees the Line 1 processes for identifying, owning and ongoing management of Conduct Risk,
including the implementation of new regulatory requirements. The Head of Group Compliance
provides regular reports to the Group Risk Committee who monitor Conduct risk in relation to the
Conduct Risk appetite approved by the Group Board. Regular Compliance reporting is also provided
to the subsidiary boards including the EUI, AIGL and AICL Boards.
The Group Compliance Function works with the Group Risk Function to provide advice and resolution
to risk events as they arise. Management of customer outcome risk events is completed in line with
the Group Risk Management Policy.
B.6. INTERNAL AUDIT FUNCTION
The Group Internal Audit function is responsible for conducting an objective and independent
appraisal of the Group's activities, financial and otherwise, through a risk-based plan, approved
annually by the Group Audit Committee. It is responsible for evaluating and reporting to the Group
Board and the Group Audit Committee, and thereby providing them with assurance on the operating
effectiveness of controls that management has put in place.
Internal Audit is also responsible for providing assurance over the arrangements for risk management,
control and governance, compliance with internal policies, procedures and controls, and value for
money, where relevant to each audit assignment. The Group Internal Audit department shall report
to the relevant Board/Committee the findings and recommendations from their review, including the
time period envisaged to remedy any shortcomings, and follow up on any recommendations made on
a timely basis. It remains the duty of management to operate these arrangements, to determine
whether or not to accept audit recommendations and to recognise and accept the risks of not taking
32 | P a g e
action. Management need to provide an appropriate level of justification and where applicable
supporting documentation to justify their reasoning, when choosing to accept the given risk, or decline
a recommendation.
The Annual Audit Plan is based on a methodical risk analysis, taking into account all activities and the
complete system of governance, as well as expected developments of activities and
innovations. Significant areas of risk, per the Risk Registers, are considered for inclusion in the Annual
Audit Plan each year. Any audits graded red in colour are considered for review within a twelve month
period until they are in a non-red status.
Independence and Objectivity of the Internal Audit Function
The Group’s internal audit policy states that the Internal Audit department and all of its employees
must be functionally and organisationally independent of the business processes, events and
transactions of the company. The Internal Audit department will carry out its assignments with
impartiality and is free to express its opinions in their reports. Amongst many matters, the Internal
Audit department must have direct access to the Board of Directors, Group Audit Committee and the
Chief Executive Officer and be able to report directly to these levels when they deem this necessary.
Such independent structure should enable the internal auditor to render impartial and unbiased
judgement, essential to the proper conduct of their work.
Internal Audit activity must be free from interference in determining the scope of internal auditing,
performing work and communicating results.
Unless permission is granted by the Group Audit Committee Chair, an Internal Auditor will not perform
an audit review in an area where they had a consultancy / operational role in the previous twelve
months.
Where practical, areas under review are rotated amongst the staff in Internal Audit to avoid any
potential conflict of interest.
B.7. ACTUARIAL FUNCTION
The Actuarial Function has a number of responsibilities in the area of Technical provisions and also in
providing an opinion on the adequacy of re-insurance and underwriting.
Solvency II requirements state that the Actuarial Function shall be carried out by persons who have
knowledge of actuarial and financial mathematics, commensurate with the nature, scale and
complexity of the risks inherent in the business, and who are able to demonstrate their relevant
experience with applicable professional and other standards. The Actuarial Function should be free
from influences that may compromise its ability to undertake its duties in an objective, fair and
independent manner.
The Actuarial Function produces a written report (“The Actuarial Function Report”) which is submitted
to the Board, at least annually, documenting all tasks undertaken, identifying deficiencies and making
recommendations to remedy these deficiencies. The report is designed to include the calculation of
technical provisions, an opinion on overall underwriting policy and an opinion on the adequacy of
reinsurance arrangements.
33 | P a g e
The responsibilities that fall under the remit of the Actuarial Function are segregated from other
business activities to allow independent review and challenge, allowing the Actuarial Function to
provide an independent opinion of the areas of Technical Provisions, Reinsurance and Underwriting.
The review and challenge is carried out by the second line Group Risk Function which enables clearer
separation of activities and strengthens the independence. The Actuarial Function is made up of
suitably qualified actuaries who have the skills and knowledge to make the decisions without the
influence of others.
B.8. OUTSOURCING
The Group’s Procurement and Outsourcing Policy ensures that any third party arrangement entered
into by the Group does not lead to impairment of either the Group’s systems of governance and
internal control, or the relevant supervisory authority in monitoring compliance risks, does not unduly
increase the operational risk and does not undermine continuous and satisfactory service to
customers.
The Group outsources a number of critical and important functions across all businesses, to various
third parties. The Group Procurement and Outsourcing Policy provides a clear guide to identify and
manage outsourced relationships to a minimum standard based on the strategic risk the supplier
poses to the Group.
Material intra-group outsourcing arrangements include the provision of insurance services by the
Group’s insurance intermediaries EUI Limited, EUI (France) Limited and Elephant Insurance Services
LLC to the Group’s regulated insurance entities. In addition, the Group has shared IT development
centres in Canada, India and Spain that provide services to both the Group’s insurers and price
comparison websites. Intra-group outsourcing arrangements fall within the scope of the Group’s
outsourcing policy in a consistent manner to outsourcing arrangements external to the Group.
B.9. ANY OTHER INFORMATION
Assessment of the adequacy of the system of governance
The Board is ultimately responsible for the Group’s system of governance, including the system of risk
management and internal control.
As noted in the Group’s 2018 Annual Report, the Board confirms the Group’s compliance with the
principles and provisions of the UK Corporate Governance Code 2016 (the code) which is applicable
to the year under review, and is considered to represent best practice for UK listed companies. This
covers both the Group as a whole, and also the solo entities AIGL and AICL.
On the 28th June 2017 the FCA wrote to David Stevens regarding the Governance Arrangements at
Admiral Group (‘Admiral’). In this letter the FCA outlined its concerns under the following key
headings: Governance Structures and Approved Persons; Independent Non-Executive Directors; and
Admiral Financial Services Limited.
Admiral contracted Grant Thornton to undertake an independent review of the effectiveness and
appropriateness of the corporate governance arrangements in place at Admiral Group, with a primary
focus on the UK regulated entities. The extent of the work performed by Grant Thornton was captured
34 | P a g e
in a detailed plan, that went through extensive internal consultation as well as consultation with the
FCA.
The Draft Interim Report was provided to the Group Board for their consideration before being
submitted to the FCA in December 2017. While the Final Report, post Group Board approval was
provided to the FCA on 31st January 2018. The Governance Review made a number of
recommendations for improvement in Admiral’s governance structure and processes. These
recommendations formed the basis of a comprehensive action plan that in accordance with Admiral’s
project governance framework is overseen by a gold “Governance Implementation” project. The
Governance Implementation Project Action Plan contained 27 individual workstreams which were
completed during the year.
35 | P a g e
C. RISK PROFILE
RISK ASSESSMENT AND RISK MANAGEMENT
The Admiral Group Board is responsible for determining risk strategy and risk appetite across the
Group, and for the Group’s system of risk management and internal control. The Board has delegated
the development, implementation and maintenance of the Group’s risk management framework to
the Group Risk Committee, which reports its activities to both the Board and also to the Group Audit
Committee, for the purposes of reviewing and reporting on the overall effectiveness of this system.
The Group’s 2018 Annual Report (pages 80-84) contains detailed information on the activities of the
Group Risk Committee during the year along with the Committee’s duties and responsibilities and the
Group’s Risk Management and Internal Control statement.
Risk is an essential part of the Group’s business operations and successful risk taking is required to
achieve the Group’s business objectives, forming a core consideration when setting strategy,
formulating business plans, managing performance and rewarding management success.
The Enterprise Risk Management Framework (ERMF) at Admiral Group has been designed,
implemented and embedded to provide the Board with oversight of the risks and the management of
those risks throughout the Group. The framework operates to provide first, second and third lines of
defence for all risks whether accepted within the risk appetite process or not.
The structure of the Admiral Group Risk Appetite is as follows:
i. The Key Risks to the business are identified based on the Level 1 Risks from the Admiral Risk
Universe, with a further split to highlight other key risks on the grounds of materiality.
ii. Risk Classifications are assigned to each key risk on a materiality basis.
iii. Risk Drivers are identified for each key risk.
iv. Risk Appetite Statements are then assigned to define the approach to managing each of the
risk drivers within appetite for the key risk category.
v. Key Risk Indicators (KRIs) are monitored for each risk driver to act as early warning indicators
for the Board and Management Risk Appetite Statements.
vi. Triggers and Limits are defined to reflect early warning indicators such that a break of a trigger
of limit is not defined as a break of the Board’s risk appetite.
vii. Risk Assessment using the Group Risk Materiality Matrix following a breach of a number of
KRI limits simultaneously or an extended breach of a KRI limit for Operational and Group level
1 risks.
The Group Risk Appetite is owned by the Admiral Group Board, who approve components i) to vii).
The responsibility for the Group Risk Appetite is delegated to the Group Risk Committee who reviews
all components prior to Board approval and monitors the performance of the business against the
approved Group Risk Appetite through the Consolidated Risk Report.
MATERIAL RISKS
The material, or Key Risks to the Group are listed below, and may be mapped to the main categories
of risk within the Solvency II Solvency Capital Requirement (SCR):

36 | P a g e
Key Risk Risk Overview
Insurance, or Underwriting
Risk
Uncertainty over the occurrence, amount or timing of claims arising on insurance
contracts issued by the Group.
Market Risk Fluctuations in the value of market prices of the Group’s investment assets and
liabilities, or in the income and expenses generated from these assets and liabilities.
Counterparty, or Credit Risk The risk that counterparties (primarily either reinsurers or banks or other investment
counterparties) default on obligations.
Operational Risk
Risks arising through operational processes and procedures. These include risks
related to people, processes, IT systems, information security, business continuity
and customer outcomes.
Group Risk
Risks, other than those captured within categories above arising across the Group’s
operations. These may relate to the Group’s non insurance businesses (such as Price
Comparison) or to other risks relating to the insurance businesses (such as loss of
additional revenues from customers).
Each of these risk categories is discussed in further detail in sections C1 – C7 below, along with details
of risk mitigating actions taken by the Group Board in respect of each risk. Pages 52-57 of the Group’s
2018 Annual Report also provide further information on the Group’s ‘Principal Risks and
Uncertainties’, their impacts and the associated mitigating actions.
The Group’s Solvency II SCR reflects the profile of these material risks. The chart below evidences that
insurance, or underwriting risk is the Group’s material risk concentration, comprising 66% of the YE
2018 SCR. There has not been a material change to this risk profile over the course of 2018 and there
is not expected to be a material change during 2019.
2018 Group Solvency Capital Requirement – by risk type
The Group’s core and dominant line of business is UK motor and therefore the insurance, or
underwriting risk is concentrated on the applicable SII lines of business for UK motor (primarily, non
378.3
591.8
3.1
86.7
37.685.0
81.020.6
(76.2) (24.3)
0
50
100
150
200
250
300
350
400
450
500
550
600
650£m

37 | P a g e
life ‘liability’ and ‘other’ risks). The composition of the SCR for the solo entities AICL and AIGL is shown
in the charts below:
2018 AICL Solvency Capital Requirement – by risk type
2018 AIGL Solvency Capital Requirement – by risk type
REGULATORY SOLVENCY CAPITAL REQUIREMENTS
The Group’s Solvency Capital Requirement presented in the first chart above, is the Regulatory SCR
which is prepared on a Standard Formula (SF) plus Capital Add-On (CAO) approach, as shown by the
table below:
Regulatory SCR Calculation
Approach
GROUP AICL AIGL
SF �
SF plus Undertaking Specific
Parameters (USP) �
SF plus CAO �
81.891.1
0.5
23.3 3.2 12.4(16.6) (13.5)
0
50
100
150£m
243.3
335.6
2.7
60.621.1
69.4(50.9)(10.6)
0
50
100
150
200
250
300
350
400
£m

38 | P a g e
As previously disclosed, the Group is preparing to make a Partial Internal Model submission to the UK
and Gibraltar regulators. Ahead of the start of the Solvency II regime, the Group applied for a CAO to
the standard formula to reflect recognised limitations in the standard formula with respect to
Admiral’s risk profile. These predominately relate to profit commission arrangements in co-insurance
and reinsurance contracts and risks arising from claims including PPO claims.
The Group previously communicated a hope to apply to the PRA during 2019 for approval to use a
Partial Internal Model to calculate SCR. Whilst progress was made over the past year, the Group needs
to further enhance its application before formally applying and does not expect to submit the
application during 2019 and possibly not 2020. In the interim period before submission, the Group will
continue to use the current CAO basis to calculate its regulatory capital requirement. For further
detail, please refer to sections C6 and E2 below.
The Regulatory SCRs for the Group’s Solvency II regulated subsidiaries AICL and AIGL, are calculated
on a standard formula basis. For the UK regulated subsidiary, AICL, the Group considers the standard
formula to appropriately reflect the Company’s risk profile.
For the Gibraltar regulated subsidiary, the interaction of profit commission arrangements with
external reinsurers and intra-group profit commission arrangements means limitations of the
standard formula with respect to these risks cannot be addressed with a CAO as the add-on would
reflect a deduction to the standard formula, which is not permitted within Solvency II regulation. AIGL
has obtained approval from the Gibraltar regulator (Gibraltar Financial Services Commission) to use
Undertaking Specific Parameters (USPs) in its calculation of underwriting risk.
C.1. UNDERWRITING RISK
The Group’s underwriting risk consists of Non-life and Life components. As noted above, the material
concentration of risk is within Non-life underwriting risk, given the Group’s focus on general insurance
lines of business. Life underwriting risk arises through the settlement of claims on a Periodic Payment
Order (PPO) basis, where annual index-linked settlements to claimants exposes the Group to life risks
such as the claimant’s life expectancy (longevity) and inflation.
NON-LIFE UNDERWRITING RISKS
Non-life underwriting risk consists of the following components of risk:
• Non-life premium risk
• Non-life reserve risk
• Lapse risk
• Catastrophe risk
The valuation of Non-life underwriting risk is driven by the premium and reserve risk component, with
small contributions made by lapse and catastrophe risk.
The majority of Non-life underwriting risk is accepted by the Group’s regulated subsidiaries in the UK
and Gibraltar, AICL and AIGL. As a result, there is little difference between the sum of the components
of Non-life insurance for AICL and AIGL and the Group valuation. The key exception to this is
catastrophe risk; the difference here is driven by exposure to natural weather catastrophes (primarily
through hail and flood) in the USA due to risks underwritten within EIC.
39 | P a g e
Non-life Reserve risk is driven by adverse development in the valuation of the liabilities which is mainly
related to longer tailed bodily injury claims, arising from the Group’s UK Motor business, which have
greater uncertainty associated with the ultimate cost of claims than, for example, property damage
claims (across both Motor and Household businesses). These claims can develop over a number of
years so the reserve risk figure relates to several underwriting years.
The Group’s retention of risk across underwriting years for the core UK motor business varies
depending on the co-insurance and quota share reinsurance contracts in place for each year. The
Group has historically used reinsurance (in the form of both co-insurance and quota share reinsurance,
as well as excess of loss reinsurance) as a risk mitigation tool across all lines of business - refer to the
risk mitigation section below for further detail. In addition, the Group’s Annual Report contains further
information about the co-insurance and reinsurance arrangements in place for businesses across the
Group (page 35 for UK Insurance and page 43 for International Insurance).
Premium risk is the risk that the Group incurs losses on risks arising in the twelve months after the
valuation date. Premium risk consists of a lower proportion of bodily injury exposure, and therefore
has a higher proportion of property damage in future claims experience which increases the
diversification between claim types compared to reserve risk. This is due to premium risk considering
the future occurrence and severity of claims, rather than the development of existing claims, of which
property damage claims generally settle quickly.
LIFE UNDERWRITING RISKS
As noted above, the Group is exposed to life underwriting risks in respect of claims that have settled
by way of a PPO. The risks relevant to the Group within the standard formula calculation of life risk
are longevity risk and life expense risk. In addition, the Group’s CAO captures inflation risk (refer to
section C6).
The Group has a relatively low number of settled PPO claims, and therefore, life underwriting risk does
not reflect a significant contribution of risk. In addition to this, diversification against the significant
non-life insurance risks further reduces the element of the SCR attributable to life underwriting risk.
RISK MITIGATION
Underwriting risk is the Group’s material risk and as noted above, a key part of the Group’s risk
mitigation strategy with respect to underwriting risk is the use of Co-insurance and reinsurance (both
proportional quota share reinsurance and non-proportional excess of loss reinsurance). In the core UK
motor business, quota share reinsurance contracts are utilised to mitigate risk.
In respect to proportional risk sharing agreements, the Group’s net retained share of business after
proportional co-insurance and reinsurance arrangements, for material businesses in the 2019
underwriting year, and at 31 December 2018 in relation to 2018, 2017 and 2016 underwriting years,
is as follows:
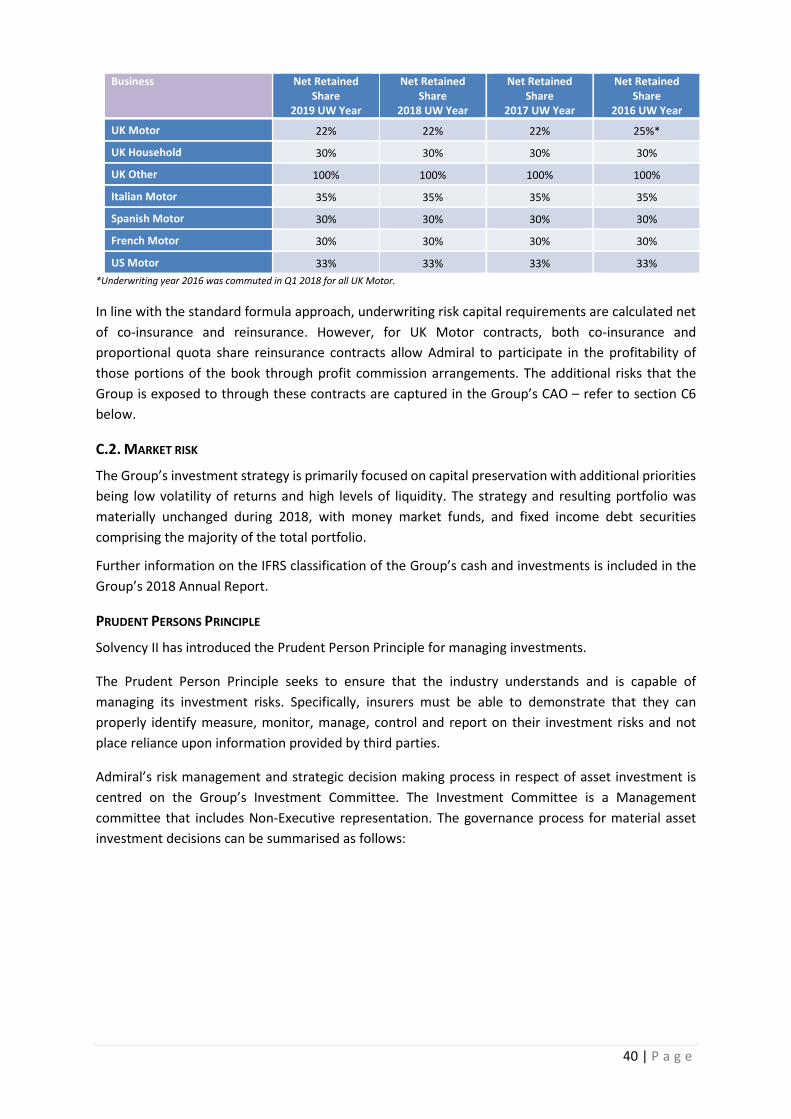
40 | P a g e
Business Net Retained
Share
2019 UW Year
Net Retained
Share
2018 UW Year
Net Retained
Share
2017 UW Year
Net Retained
Share
2016 UW Year
UK Motor 22% 22% 22% 25%*
UK Household 30% 30% 30% 30%
UK Other 100% 100% 100% 100%
Italian Motor 35% 35% 35% 35%
Spanish Motor 30% 30% 30% 30%
French Motor 30% 30% 30% 30%
US Motor 33% 33% 33% 33%
*Underwriting year 2016 was commuted in Q1 2018 for all UK Motor.
In line with the standard formula approach, underwriting risk capital requirements are calculated net
of co-insurance and reinsurance. However, for UK Motor contracts, both co-insurance and
proportional quota share reinsurance contracts allow Admiral to participate in the profitability of
those portions of the book through profit commission arrangements. The additional risks that the
Group is exposed to through these contracts are captured in the Group’s CAO – refer to section C6
below.
C.2. MARKET RISK
The Group’s investment strategy is primarily focused on capital preservation with additional priorities
being low volatility of returns and high levels of liquidity. The strategy and resulting portfolio was
materially unchanged during 2018, with money market funds, and fixed income debt securities
comprising the majority of the total portfolio.
Further information on the IFRS classification of the Group’s cash and investments is included in the
Group’s 2018 Annual Report.
PRUDENT PERSONS PRINCIPLE
Solvency II has introduced the Prudent Person Principle for managing investments.
The Prudent Person Principle seeks to ensure that the industry understands and is capable of
managing its investment risks. Specifically, insurers must be able to demonstrate that they can
properly identify measure, monitor, manage, control and report on their investment risks and not
place reliance upon information provided by third parties.
Admiral’s risk management and strategic decision making process in respect of asset investment is
centred on the Group’s Investment Committee. The Investment Committee is a Management
committee that includes Non-Executive representation. The governance process for material asset
investment decisions can be summarised as follows:
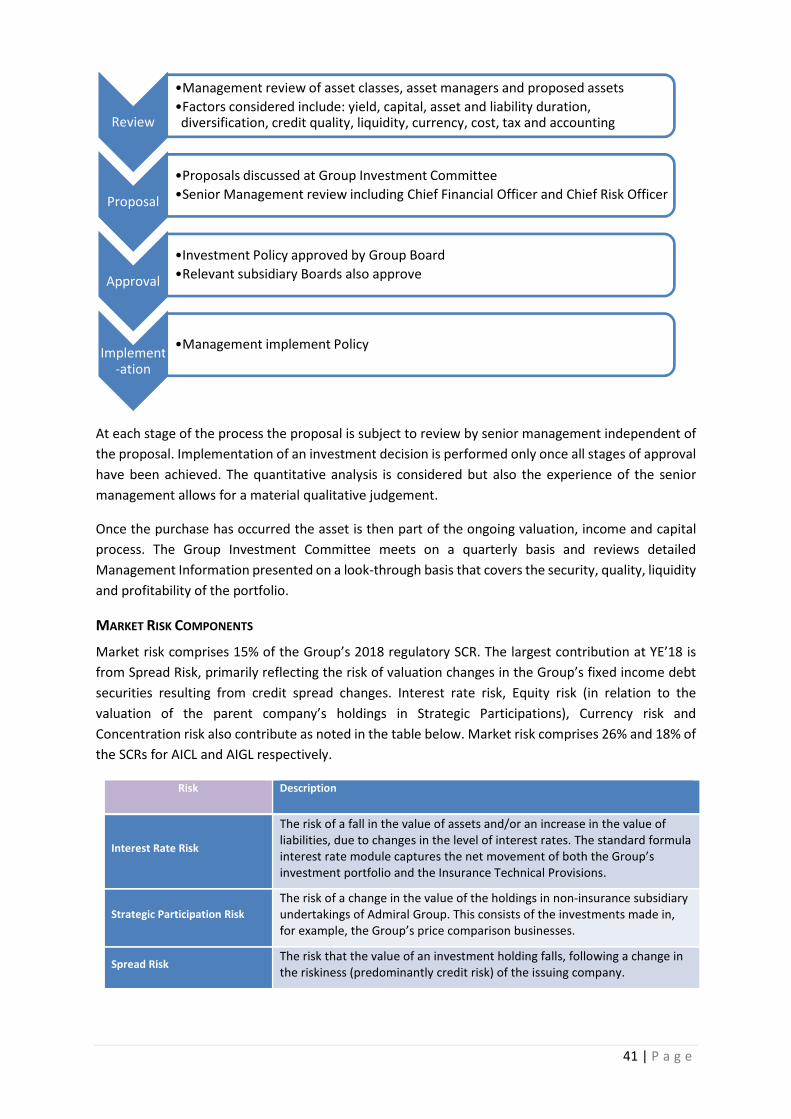
41 | P a g e
At each stage of the process the proposal is subject to review by senior management independent of
the proposal. Implementation of an investment decision is performed only once all stages of approval
have been achieved. The quantitative analysis is considered but also the experience of the senior
management allows for a material qualitative judgement.
Once the purchase has occurred the asset is then part of the ongoing valuation, income and capital
process. The Group Investment Committee meets on a quarterly basis and reviews detailed
Management Information presented on a look-through basis that covers the security, quality, liquidity
and profitability of the portfolio.
MARKET RISK COMPONENTS
Market risk comprises 15% of the Group’s 2018 regulatory SCR. The largest contribution at YE’18 is
from Spread Risk, primarily reflecting the risk of valuation changes in the Group’s fixed income debt
securities resulting from credit spread changes. Interest rate risk, Equity risk (in relation to the
valuation of the parent company’s holdings in Strategic Participations), Currency risk and
Concentration risk also contribute as noted in the table below. Market risk comprises 26% and 18% of
the SCRs for AICL and AIGL respectively.
Risk Description
Interest Rate Risk
The risk of a fall in the value of assets and/or an increase in the value of
liabilities, due to changes in the level of interest rates. The standard formula
interest rate module captures the net movement of both the Group’s
investment portfolio and the Insurance Technical Provisions.
Strategic Participation Risk
The risk of a change in the value of the holdings in non-insurance subsidiary
undertakings of Admiral Group. This consists of the investments made in,
for example, the Group’s price comparison businesses.
Spread Risk The risk that the value of an investment holding falls, following a change in
the riskiness (predominantly credit risk) of the issuing company.
Review
•Management review of asset classes, asset managers and proposed assets
•Factors considered include: yield, capital, asset and liability duration, diversification, credit quality, liquidity, currency, cost, tax and accounting
Proposal
•Proposals discussed at Group Investment Committee
•Senior Management review including Chief Financial Officer and Chief Risk Officer
Approval
•Investment Policy approved by Group Board
•Relevant subsidiary Boards also approve
Implement-ation
•Management implement Policy
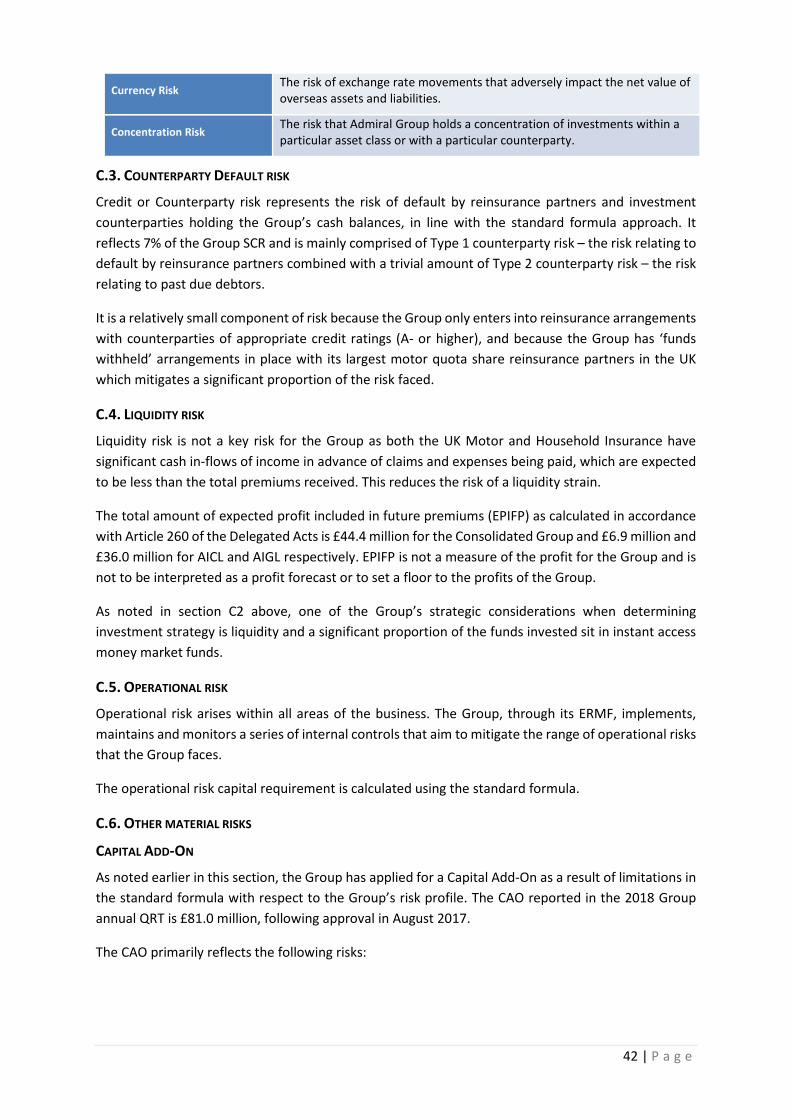
42 | P a g e
Currency Risk The risk of exchange rate movements that adversely impact the net value of
overseas assets and liabilities.
Concentration Risk The risk that Admiral Group holds a concentration of investments within a
particular asset class or with a particular counterparty.
C.3. COUNTERPARTY DEFAULT RISK
Credit or Counterparty risk represents the risk of default by reinsurance partners and investment
counterparties holding the Group’s cash balances, in line with the standard formula approach. It
reflects 7% of the Group SCR and is mainly comprised of Type 1 counterparty risk – the risk relating to
default by reinsurance partners combined with a trivial amount of Type 2 counterparty risk – the risk
relating to past due debtors.
It is a relatively small component of risk because the Group only enters into reinsurance arrangements
with counterparties of appropriate credit ratings (A- or higher), and because the Group has ‘funds
withheld’ arrangements in place with its largest motor quota share reinsurance partners in the UK
which mitigates a significant proportion of the risk faced.
C.4. LIQUIDITY RISK
Liquidity risk is not a key risk for the Group as both the UK Motor and Household Insurance have
significant cash in-flows of income in advance of claims and expenses being paid, which are expected
to be less than the total premiums received. This reduces the risk of a liquidity strain.
The total amount of expected profit included in future premiums (EPIFP) as calculated in accordance
with Article 260 of the Delegated Acts is £44.4 million for the Consolidated Group and £6.9 million and
£36.0 million for AICL and AIGL respectively. EPIFP is not a measure of the profit for the Group and is
not to be interpreted as a profit forecast or to set a floor to the profits of the Group.
As noted in section C2 above, one of the Group’s strategic considerations when determining
investment strategy is liquidity and a significant proportion of the funds invested sit in instant access
money market funds.
C.5. OPERATIONAL RISK
Operational risk arises within all areas of the business. The Group, through its ERMF, implements,
maintains and monitors a series of internal controls that aim to mitigate the range of operational risks
that the Group faces.
The operational risk capital requirement is calculated using the standard formula.
C.6. OTHER MATERIAL RISKS
CAPITAL ADD-ON
As noted earlier in this section, the Group has applied for a Capital Add-On as a result of limitations in
the standard formula with respect to the Group’s risk profile. The CAO reported in the 2018 Group
annual QRT is £81.0 million, following approval in August 2017.
The CAO primarily reflects the following risks:

43 | P a g e
Risk Description
Profit Commission
Admiral has extensive profit commission arrangements within its co-
insurance and quota share reinsurance arrangements. Under stressed
conditions, there is a risk that profit commission income recognised in the
Solvency II balance sheet will need to be de-recognised, reducing the value
of Own Funds.
PPO (Potential and Settled)
Admiral-specific parameters for both reserve and premium risk uncertainty
are derived to reflect the risk associated with both future and potential
PPOs, which is not deemed to be appropriately reflected in the standard
formula parameters. In addition, the inflation risk related to settled PPOs is
captured in recognition of the limitations of the standard formula life
underwriting risk module.
C.7. ANY OTHER INFORMATION
LOSS ABSORBING CAPACITY OF DEFERRED TAXES (LACDT)
At YE’18, the Group’s regulatory SCR is reduced by £24.3 million to reflect the tax losses arising as a
result of the 1 in 200 year event, that may be utilised against current or deferred tax liabilities. The
resulting LACDT can primarily be attributed to the Group’s regulated insurance entities in the UK and
Gibraltar. No LACDT benefit has been recognised on the basis of the potential to offset tax losses
against profits on business that will be written in the future.
TREATMENT OF ADMIRAL LOANS
At YE’18, the Group’s regulatory SCR is increased by £20.6 million to reflect the risks inherent within
the Admiral loans business. This primarily reflects credit risk on the net loans portfolio, together with
an element of operational risk.
RISK SENSITIVITY
The Group has established processes to undertake stress and scenario testing on an ongoing basis,
with testing undertaken at least annually. The stress testing processes operate in collaboration with
the Corporate Governance Committees and involve a number of members of senior and operational
management. The results of the tests undertaken improve the Boards understanding of risk, influence
business decisions and form a key part of the Enterprise Risk Management Framework.
In addition, solvency ratio sensitivities are reported to the Group Board and its Committees on a
regular basis. The following Group solvency ratio sensitivities (as reported in the 2018 Annual Report)
were reviewed for YE’18.
Solvency Ratio Sensitivities 2018 Movement in Solvency Ratio (percentage pts)
UK Motor – incurred loss ratio +5% (27%)
UK Motor – 1 in 200 catastrophe event (2%)
UK Household – 1 in 200 catastrophe event (2%)
Interest rate – yield curve down 50 bps (12%)
Credit spreads widen 100bps (5%)
Currency – 25% movement in euro and US dollar (3%)
ASHE – long term inflation assumption up 0.5% (10%)
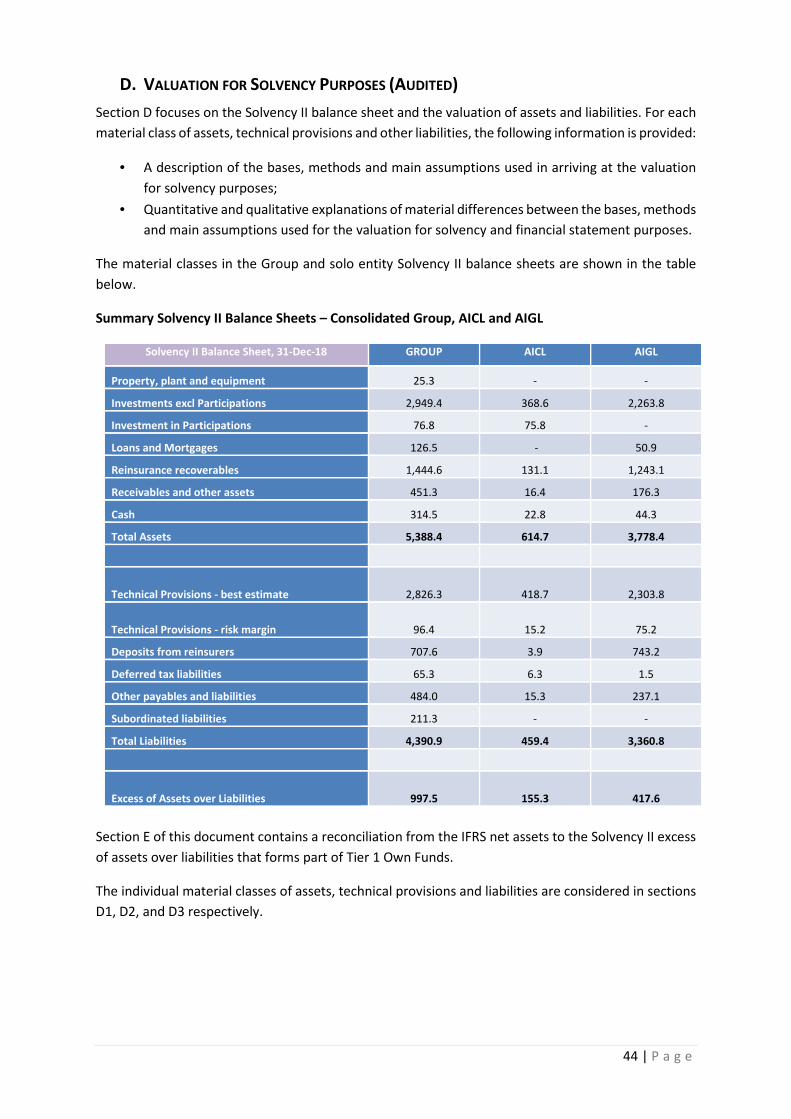
44 | P a g e
D. VALUATION FOR SOLVENCY PURPOSES (AUDITED)
Section D focuses on the Solvency II balance sheet and the valuation of assets and liabilities. For each
material class of assets, technical provisions and other liabilities, the following information is provided:
• A description of the bases, methods and main assumptions used in arriving at the valuation
for solvency purposes;
• Quantitative and qualitative explanations of material differences between the bases, methods
and main assumptions used for the valuation for solvency and financial statement purposes.
The material classes in the Group and solo entity Solvency II balance sheets are shown in the table
below.
Summary Solvency II Balance Sheets – Consolidated Group, AICL and AIGL
Solvency II Balance Sheet, 31-Dec-18 GROUP AICL AIGL
Property, plant and equipment 25.3 - -
Investments excl Participations 2,949.4 368.6 2,263.8
Investment in Participations 76.8 75.8 -
Loans and Mortgages 126.5 - 50.9
Reinsurance recoverables 1,444.6 131.1 1,243.1
Receivables and other assets 451.3 16.4 176.3
Cash 314.5 22.8 44.3
Total Assets 5,388.4 614.7 3,778.4
Technical Provisions - best estimate 2,826.3 418.7 2,303.8
Technical Provisions - risk margin 96.4 15.2 75.2
Deposits from reinsurers 707.6 3.9 743.2
Deferred tax liabilities 65.3 6.3 1.5
Other payables and liabilities 484.0 15.3 237.1
Subordinated liabilities 211.3 - -
Total Liabilities 4,390.9 459.4 3,360.8
Excess of Assets over Liabilities 997.5 155.3 417.6
Section E of this document contains a reconciliation from the IFRS net assets to the Solvency II excess
of assets over liabilities that forms part of Tier 1 Own Funds.
The individual material classes of assets, technical provisions and liabilities are considered in sections
D1, D2, and D3 respectively.

45 | P a g e
D.1. ASSETS
Material Class
1. Goodwill, DAC and
Intangible Assets
Goodwill, deferred acquisition costs and intangible assets (primarily internally
generated software assets) have no economic value and are therefore eliminated in
the transition from IFRS to Solvency II. This has a total impact of £125.8 million for
Group, and £6.1 million and £18.4 million for AICL and AIGL respectively.
2. Property, plant and
equipment
Property plant and equipment, PPE (primarily leasehold improvements) are held at
the IFRS value of cost less depreciation. This valuation is not considered to differ
materially from its economic market value.
3. Investments and 8. Cash
Financial assets and liabilities are held at Fair Value where level 1 inputs can be
obtained. Level 1 refers to the first level of the Fair Value hierarchy which categorises
valuation inputs into three levels. The hierarchy gives the highest priority (Level 1) to
quoted prices in an active market, and the lowest priority to unobservable inputs
(Level 3). Level 3 financial assets and liabilities are immaterial to the Group, AICL and
AIGL.
Level 1 inputs
Level 1 inputs are quoted prices in active markets for identical assets or liabilities
that the entity can access at the measurement date.
A quoted market price in an active market provides the most reliable evidence of fair
value and is used without adjustment to measure fair value whenever available, with
limited exceptions.
Level 2 inputs
Level 2 inputs are inputs other than quoted market prices included within Level 1
that are observable for the asset or liability, either directly or indirectly.
Level 2 inputs include:
• quoted prices for similar assets or liabilities in active markets
• quoted prices for identical or similar assets or liabilities in markets that are
not active
• inputs other than quoted prices that are observable for the asset or
liability, for example
o interest rates and yield curves observable at commonly quoted
intervals
o implied volatilities
o credit spreads
• inputs that are derived principally from or corroborated by observable
market data by correlation or other means ('market-corroborated inputs').
The Group currently categorises its valuation of investments in money market funds
fixed income debt securities, and government gilts as Level 1.
Level 1 valuations for money market funds, fixed income debt securities and
government gilts reflect the fair value (the amount a third party would pay for the
asset on the valuation date), and are obtained externally from observable market
information. This valuation is consistent with the IFRS valuation.
Cash and term deposits are held at amortised cost which is materially consistent with
as fair value. This is in line with the IFRS valuation.
4. Investments in
Participations
Participations are valued and accounted for using the adjusted net equity method for
Solvency II purposes. This is different to the IFRS valuation which is based on an
unadjusted IFRS net asset valuation – the differences therefore relate to the
adjustments noted in these valuation policies. The impact of revaluation to the
adjusted net equity method is a reduction of £18.6 million.
46 | P a g e
5. Loans and Mortgages
Loans and advances are measured at amortised cost. This is because the assets are
held in order to collect contractual cash flows, and the contractual terms of the
financial asset give rise to cash flows which are solely payments of principal and
interest on the principal amount outstanding. The amortised cost of loans and
advances is a reasonable approximation of fair value.
6. Reinsurance Recoverables Refer to Technical Provisions section (D.3).
7. Receivables and other
assets
The fair value of receivables is based on the amortised cost valuation, in line with
Level 2 of the FV hierarchy noted above. Due to the short term nature of the
receivables this amortised cost valuation approximates to fair value and therefore
there are no valuation differences between IFRS and SII valuation.
D.2. LIABILITIES
Material Class
9. Technical Provisions - best
estimate Refer to Technical Provisions section (D.3).
10. Technical Provisions - risk
margin Refer to Technical Provisions section (D.3).
11. Deposits from reinsurers
Deposits from reinsurers reflect amounts held in relation to reinsurance contracts.
The balances are valued on a historic cost basis which is materially in line with their
fair value due to the short term nature of the liabilities.
12. Deferred tax liabilities
The deferred tax liability in the Group Solvency II balance sheet reflects the net
deferred tax liability on a Solvency II basis using the valuation rules within IAS 12.
The total Group revaluation of £63.9 million reflects the deferred tax impact of the
revaluations made between IFRS and Solvency II in the other balance sheet line
items, primarily the release of margin in the Technical Provisions and Profit
Commission balances. The corresponding revaluation for AICL and AIGL is £6.4
million and £1.5 million respectively.
The IFRS deferred tax balance is a net deferred tax asset.
13. Other payables and
liabilities
Other payables and liabilities primarily reflect other balances with co-insurers and
reinsurers, not classified elsewhere and balances between the entities within the
scope of the Solvency II Group and related participations.
The balances are valued on an amortised cost basis which, due to the short term
nature of other payables, is materially consistent with fair value; this valuation is the
same as the IFRS valuation.
14. Subordinated liabilities
Subordinated liabilities reflects the Group’s 10 year subordinated bonds. For
Solvency II purposes it is included at fair value (excluding the impact of changes in
Admiral’s own credit quality). On an IFRS basis, it is held at amortised cost.

47 | P a g e
D.3. TECHNICAL PROVISIONS
TECHNICAL PROVISIONS – BEST ESTIMATE
Best estimate technical provisions for Group and solo entity material lines of business are as follows:
2018 Best estimate technical provisions - Group
31-Dec-18 Motor
Vehicle
Liability
Motor
Vehicle
Other
Fire and
Other
Damage
to
Property
General
Liability
Life Other Total
Gross - Best Estimate 2,530.6 143.0 93.5 3.0 40.0 16.2 2,826.3
Recoverable from reinsurers 1,263.5 107.4 60.2 2.0 11.1 0.4 1,444.6
Net - Best Estimate 1,267.1 35.6 33.3 1.0 28.9 15.8 1,381.7
2018 Best estimate technical provisions – AICL
31-Dec-18 Motor
Vehicle
Liability
Motor
Vehicle
Other
Fire and
Other
Damage
to
Property
General
Liability
Life Other Total
Gross - Best Estimate 380.3 32.1 - - 6.3 - 418.7
Recoverable from reinsurers 113.9 15.3 - - 1.9 - 131.1
Net - Best Estimate 266.4 16.8 - - 4.4 - 287.6
2018 Best estimate technical provisions - AIGL
31-Dec-18 Motor
Vehicle
Liability
Motor
Vehicle
Other
Fire and
Other
Damage
to
Property
General
Liability
Life Other Total
Gross - Best Estimate 2,064.7 92.3 93.5 3.0 34.1 16.2 2,303.8
Recoverable from reinsurers 1,091.3 79.8 60.2 2.0 9.4 0.4 1,243.1
Net - Best Estimate 973.4 12.5 33.3 1.0 24.7 15.8 1,060.7
Bases, Methods and Main Assumptions
Best estimate technical provisions are comprised of a claims provision and premium provision. The
claims and premium provision combined give the expected cost of settling all future claims arising
from business that the Group is contractually obliged to cover. This includes an allowance for the
expenses of both running the company and of servicing claims such as claims handling staff costs. The
allowance for future income is based on business already written, as well as business that has not yet
incepted, but where the Group is obliged to offer cover i.e. renewals already offered or quoted (Bound
But Not Incepted – BBNI).
The claims provision is the discounted best estimate of all future cash-flows relating to claim events
which occurred prior to the valuation date. These cash-flows are made up of:
48 | P a g e
Outgoing cash-flows:
• Claim payments
o Settling reported claims
o Settling claims not yet reported
• Expenses
• ENID (Events not in Data) allowance
Minus Incoming cash-flows
• Future premiums, such as uncollected/overdue premium
• Reinsurance recoveries on all claims
o with an allowance for reinsurance bad debt
The premium provision is the discounted best estimate of all future cash-flows relating to future claim
events arising from policies that the insurer is obligated to cover at the valuation date. Again these
cash-flows are made up of:
Outgoing cash-flows:
• Claim payments, including BBNI policies
• Expenses
• ENID (events not in data) allowance
• Reinsurance premium
Minus incoming cash-flows:
• Future premiums due on incepted business, from monthly premium payers, with an
allowance for cancellations
• Future premiums due on new and renewal business, as well as from BBNI policies
• Reinsurance recoveries on all claims (with an allowance for reinsurance bad debt)
• Recoveries from future salvage and subrogation
• Income from reinsurers and co-insurers to cover a portion of the expense costs
Reinsurance Recoverables
Reinsurance recoveries are a significant element within the technical provisions. The reinsurance
premium paid out, and recoveries received for both claims and expenses are required to be captured
within the technical provisions, along with the possibility of default of the reinsurers leading to a
reduction in potential recoveries.
The reinsurance recoverables within the Group Technical Provisions reflect the following contractual
reinsurance arrangements that the Group has in place:
• Excess of loss reinsurance
• Quota share reinsurance
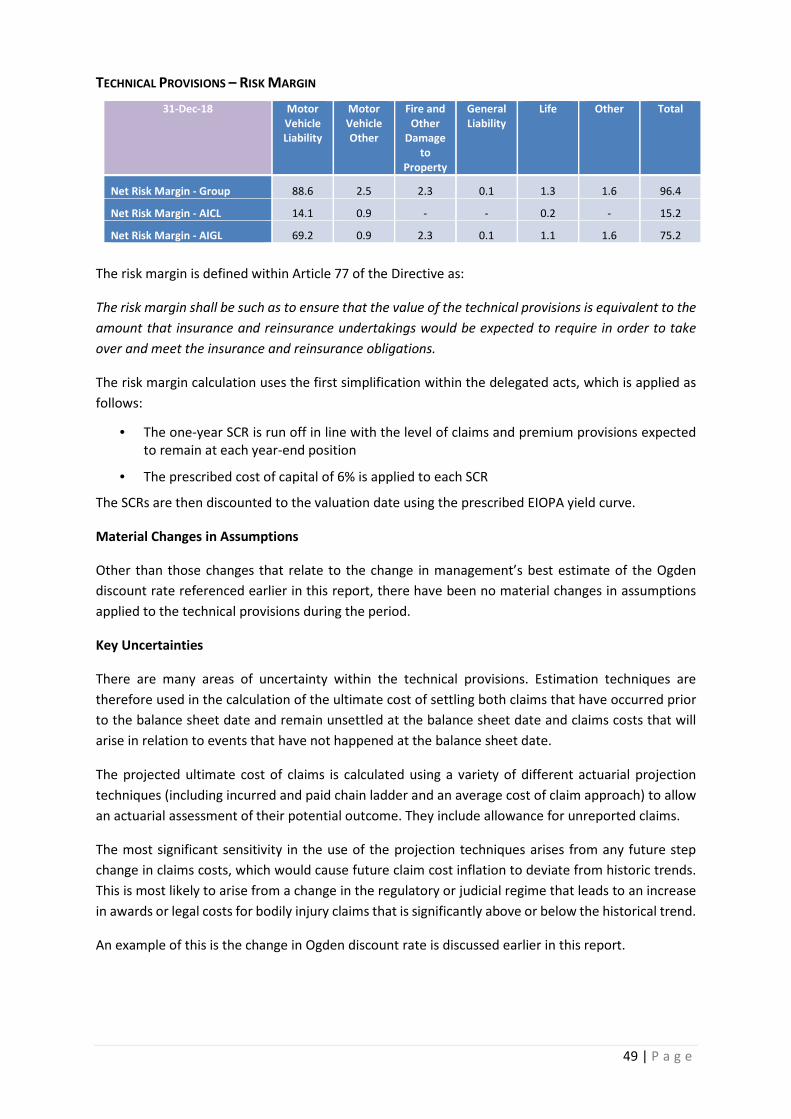
49 | P a g e
TECHNICAL PROVISIONS – RISK MARGIN
31-Dec-18 Motor
Vehicle
Liability
Motor
Vehicle
Other
Fire and
Other
Damage
to
Property
General
Liability
Life Other Total
Net Risk Margin - Group 88.6 2.5 2.3 0.1 1.3 1.6 96.4
Net Risk Margin - AICL 14.1 0.9 - - 0.2 - 15.2
Net Risk Margin - AIGL 69.2 0.9 2.3 0.1 1.1 1.6 75.2
The risk margin is defined within Article 77 of the Directive as:
The risk margin shall be such as to ensure that the value of the technical provisions is equivalent to the
amount that insurance and reinsurance undertakings would be expected to require in order to take
over and meet the insurance and reinsurance obligations.
The risk margin calculation uses the first simplification within the delegated acts, which is applied as
follows:
• The one-year SCR is run off in line with the level of claims and premium provisions expected
to remain at each year-end position
• The prescribed cost of capital of 6% is applied to each SCR
The SCRs are then discounted to the valuation date using the prescribed EIOPA yield curve.
Material Changes in Assumptions
Other than those changes that relate to the change in management’s best estimate of the Ogden
discount rate referenced earlier in this report, there have been no material changes in assumptions
applied to the technical provisions during the period.
Key Uncertainties
There are many areas of uncertainty within the technical provisions. Estimation techniques are
therefore used in the calculation of the ultimate cost of settling both claims that have occurred prior
to the balance sheet date and remain unsettled at the balance sheet date and claims costs that will
arise in relation to events that have not happened at the balance sheet date.
The projected ultimate cost of claims is calculated using a variety of different actuarial projection
techniques (including incurred and paid chain ladder and an average cost of claim approach) to allow
an actuarial assessment of their potential outcome. They include allowance for unreported claims.
The most significant sensitivity in the use of the projection techniques arises from any future step
change in claims costs, which would cause future claim cost inflation to deviate from historic trends.
This is most likely to arise from a change in the regulatory or judicial regime that leads to an increase
in awards or legal costs for bodily injury claims that is significantly above or below the historical trend.
An example of this is the change in Ogden discount rate is discussed earlier in this report.

50 | P a g e
RECONCILIATION TO IFRS VALUES
The best estimate Solvency II technical provisions for the Group and solo entities are lower than the
equivalent provisions held on an IFRS basis for financial statement purposes.
This is primarily due to the following:
• Removal of margin held above best estimate in IFRS reserves, partially offset by the
introduction of additional SII reserves for loss adjustment expenses, and Events Not in Data
• The SII approach to calculation of the premium provision (including the transfer of future
premium cash-flows into technical provisions from other financial statement line items)
• The approach to discounting, with SII technical provisions being discounted using the EIOPA
yield curve
The above disclosure is relevant for all lines of business as there are no specific transition adjustments
recognised for individual lines. The overall impact of moving from an IFRS to a Solvency II basis is
around £318.7 million excluding risk margin. The corresponding impacts for AICL and AIGL are £46.3
million and £89.1 million respectively.
The introduction of the SII risk margin reduces the net impact of the reduction in provisions on
translation from IFRS to SII by £96.4 million. The corresponding SII risk margin for AICL and AIGL is
£15.2 million and £75.2 million.
ADJUSTMENTS AND SIMPLIFICATIONS
The Matching Adjustment has not been applied in the calculation of Technical Provisions at 31
December 2018.
In February 2017, the Group obtained approval to use the Volatility Adjustment (‘VA’) in the
calculation of technical provisions for the Group and its regulated subsidiaries from the UK and
Gibraltar regulators. The impact of applying the VA adjustment to the calculation of Group Technical
Provisions (net of reinsurance recoverables) is a reduction in Own Funds of around £20.9 million (£10.7
million in 2017). The corresponding impact for AIGL is £17.8 million (2017: £9.1 million). The VA
adjustment is not applied for AICL at 31 December 2018 (2017: £1.5 million), due to investment returns
falling below the risk-free rate plus VA at this date.
The transitional risk-free interest rate term structure as per Article 308c of the Directive has not been
applied in the calculation of Technical Provisions at 31 December 2018.
The transitional deduction as per Article 308d of the Directive has not been applied in the calculation
of Technical Provisions at 31 December 2018.
D.4. ALTERNATIVE METHODS OF VALUATION
No alternative methods for valuation have been applied.
D.5. ANY OTHER INFORMATION
None.
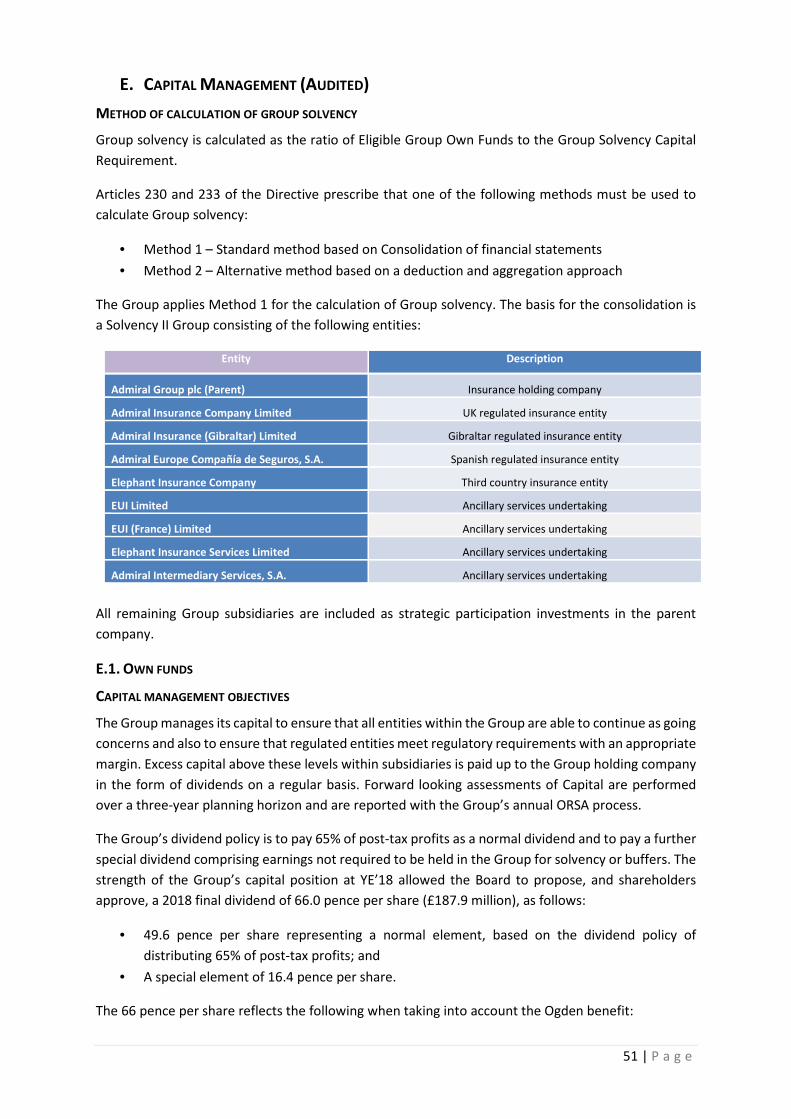
51 | P a g e
E. CAPITAL MANAGEMENT (AUDITED)
METHOD OF CALCULATION OF GROUP SOLVENCY
Group solvency is calculated as the ratio of Eligible Group Own Funds to the Group Solvency Capital
Requirement.
Articles 230 and 233 of the Directive prescribe that one of the following methods must be used to
calculate Group solvency:
• Method 1 – Standard method based on Consolidation of financial statements
• Method 2 – Alternative method based on a deduction and aggregation approach
The Group applies Method 1 for the calculation of Group solvency. The basis for the consolidation is
a Solvency II Group consisting of the following entities:
Entity Description
Admiral Group plc (Parent) Insurance holding company
Admiral Insurance Company Limited UK regulated insurance entity
Admiral Insurance (Gibraltar) Limited Gibraltar regulated insurance entity
Admiral Europe Compañía de Seguros, S.A. Spanish regulated insurance entity
Elephant Insurance Company Third country insurance entity
EUI Limited Ancillary services undertaking
EUI (France) Limited Ancillary services undertaking
Elephant Insurance Services Limited Ancillary services undertaking
Admiral Intermediary Services, S.A. Ancillary services undertaking
All remaining Group subsidiaries are included as strategic participation investments in the parent
company.
E.1. OWN FUNDS
CAPITAL MANAGEMENT OBJECTIVES
The Group manages its capital to ensure that all entities within the Group are able to continue as going
concerns and also to ensure that regulated entities meet regulatory requirements with an appropriate
margin. Excess capital above these levels within subsidiaries is paid up to the Group holding company
in the form of dividends on a regular basis. Forward looking assessments of Capital are performed
over a three-year planning horizon and are reported with the Group’s annual ORSA process.
The Group’s dividend policy is to pay 65% of post-tax profits as a normal dividend and to pay a further
special dividend comprising earnings not required to be held in the Group for solvency or buffers. The
strength of the Group’s capital position at YE’18 allowed the Board to propose, and shareholders
approve, a 2018 final dividend of 66.0 pence per share (£187.9 million), as follows:
• 49.6 pence per share representing a normal element, based on the dividend policy of
distributing 65% of post-tax profits; and
• A special element of 16.4 pence per share.
The 66 pence per share reflects the following when taking into account the Ogden benefit:
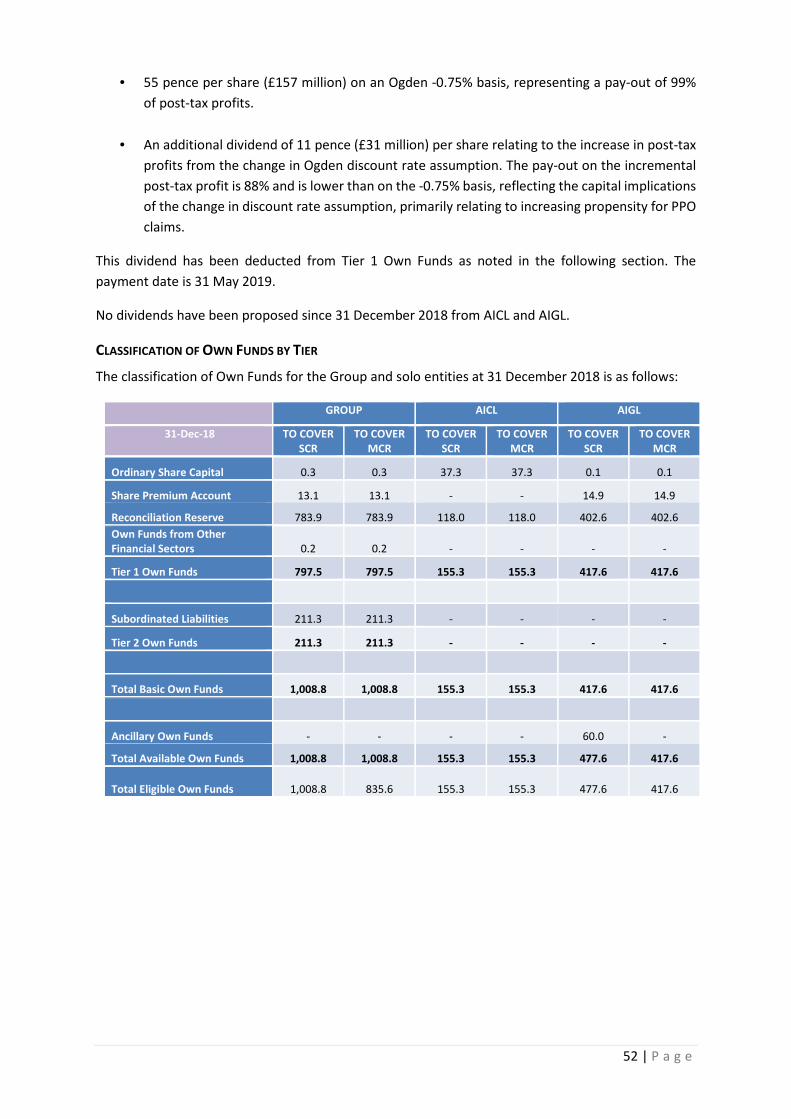
52 | P a g e
• 55 pence per share (£157 million) on an Ogden -0.75% basis, representing a pay-out of 99%
of post-tax profits.
• An additional dividend of 11 pence (£31 million) per share relating to the increase in post-tax
profits from the change in Ogden discount rate assumption. The pay-out on the incremental
post-tax profit is 88% and is lower than on the -0.75% basis, reflecting the capital implications
of the change in discount rate assumption, primarily relating to increasing propensity for PPO
claims.
This dividend has been deducted from Tier 1 Own Funds as noted in the following section. The
payment date is 31 May 2019.
No dividends have been proposed since 31 December 2018 from AICL and AIGL.
CLASSIFICATION OF OWN FUNDS BY TIER
The classification of Own Funds for the Group and solo entities at 31 December 2018 is as follows:
GROUP AICL AIGL
31-Dec-18 TO COVER
SCR
TO COVER
MCR
TO COVER
SCR
TO COVER
MCR
TO COVER
SCR
TO COVER
MCR
Ordinary Share Capital 0.3 0.3 37.3 37.3 0.1 0.1
Share Premium Account 13.1 13.1 - - 14.9 14.9
Reconciliation Reserve 783.9 783.9 118.0 118.0 402.6 402.6
Own Funds from Other
Financial Sectors 0.2 0.2 - - - -
Tier 1 Own Funds 797.5 797.5 155.3 155.3 417.6 417.6
Subordinated Liabilities 211.3 211.3 - - - -
Tier 2 Own Funds 211.3 211.3 - - - -
Total Basic Own Funds 1,008.8 1,008.8 155.3 155.3 417.6 417.6
Ancillary Own Funds - - - - 60.0 -
Total Available Own Funds 1,008.8 1,008.8 155.3 155.3 477.6 417.6
Total Eligible Own Funds
1,008.8 835.6
155.3
155.3
477.6
417.6

53 | P a g e
The equivalent classification at 31 December 2017 was as follows:
Group AICL AIGL
31-Dec-17 TO COVER
SCR
TO COVER
MCR
TO COVER
SCR
TO COVER
MCR
TO COVER
SCR
TO COVER
MCR
Ordinary Share Capital 0.3 0.3 37.3 37.3 0.1 0.1
Share Premium Account 13.1 13.1 - - 14.9 14.9
Reconciliation Reserve 775.5 775.5 93.7 93.7 361.5 361.5
Tier 1 Own Funds 788.9 788.9 131.0 131.0 376.5 376.5
Subordinated Liabilities 229.2 229.2 - - - -
Tier 2 Own Funds 229.2 229.2 - - - -
Total Basic Own Funds 1,018.1 1,018.1 131.0 131.0 376.5 376.5
Ancillary Own Funds - - - - 60.0 -
Total Available Own Funds 1,018.1 1,018.1 131.0 131.0 436.5 376.5
Total Eligible Own Funds 1,018.1 825.0 131.0 131.0 436.5 376.5
Movement in Own Funds
The main movements in Own Funds for Group, AICL and AIGL over the period are as follows:
31-Dec-18 GROUP AICL AIGL
Own Funds as at 31 Dec 2017 1,018.1 131.0 436.5
Capital generation 366.0 24.3 41.1
Dividends (357.4) - -
Valuation Movement –
Subordinated Liabilities (17.9) - -
Own Funds as at 31 Dec 2018 1,008.8 155.3 477.6
Tier 1 Own Funds
Tier 1 Own Funds consist of Ordinary Share Capital, Share Premium, the Reconciliation Reserve, which
includes a deduction for foreseeable dividends, and Own Funds from Other Financial Sectors. Total
Tier 1 Own Funds may be reconciled to the IFRS net assets and excess of assets over liabilities in the
Solvency II balance sheet (as documented in section D) as follows:
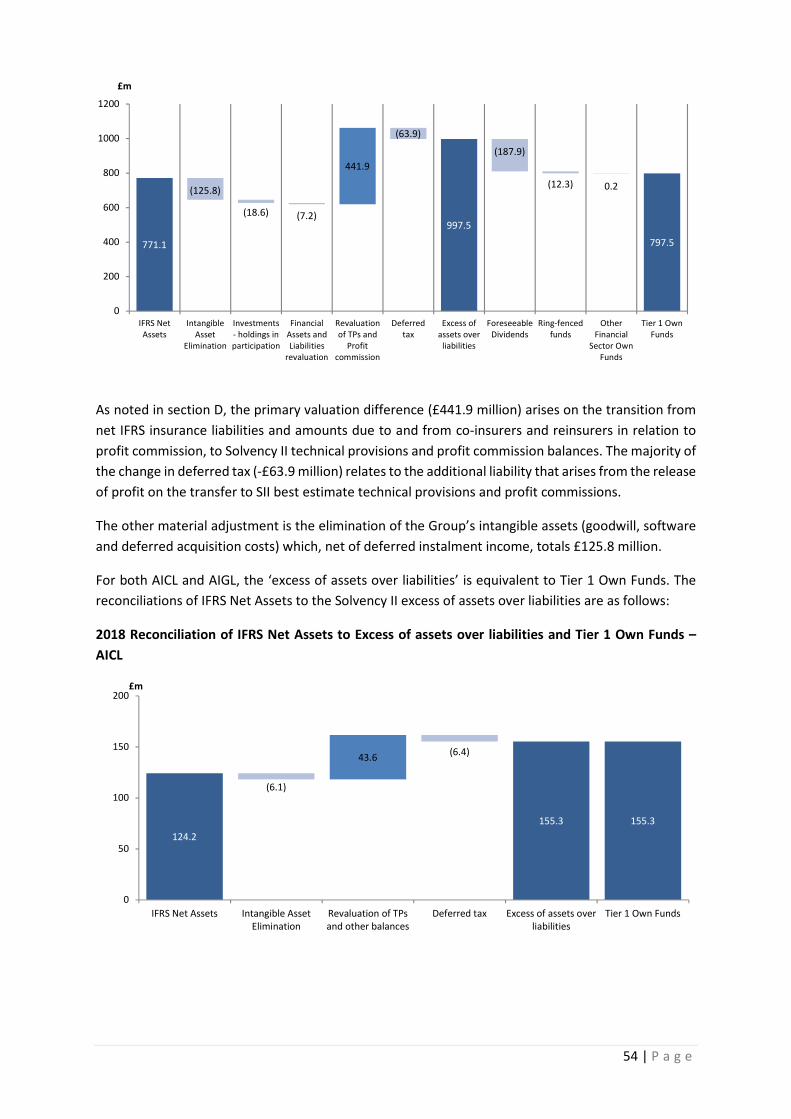
54 | P a g e
As noted in section D, the primary valuation difference (£441.9 million) arises on the transition from
net IFRS insurance liabilities and amounts due to and from co-insurers and reinsurers in relation to
profit commission, to Solvency II technical provisions and profit commission balances. The majority of
the change in deferred tax (-£63.9 million) relates to the additional liability that arises from the release
of profit on the transfer to SII best estimate technical provisions and profit commissions.
The other material adjustment is the elimination of the Group’s intangible assets (goodwill, software
and deferred acquisition costs) which, net of deferred instalment income, totals £125.8 million.
For both AICL and AIGL, the ‘excess of assets over liabilities’ is equivalent to Tier 1 Own Funds. The
reconciliations of IFRS Net Assets to the Solvency II excess of assets over liabilities are as follows:
2018 Reconciliation of IFRS Net Assets to Excess of assets over liabilities and Tier 1 Own Funds –
AICL
771.1
997.5
797.5
441.9
0.2(125.8)
(18.6) (7.2)
(63.9)
(187.9)
(12.3)
0
200
400
600
800
1000
1200
IFRS Net
Assets
Intangible
Asset
Elimination
Investments
- holdings in
participation
Financial
Assets and
Liabilities
revaluation
Revaluation
of TPs and
Profit
commission
Deferred
tax
Excess of
assets over
liabilities
Foreseeable
Dividends
Ring-fenced
funds
Other
Financial
Sector Own
Funds
Tier 1 Own
Funds
£m
124.2
155.3 155.3
43.6
(6.1)
(6.4)
0
50
100
150
200
IFRS Net Assets Intangible Asset
Elimination
Revaluation of TPs
and other balances
Deferred tax Excess of assets over
liabilities
Tier 1 Own Funds
£m
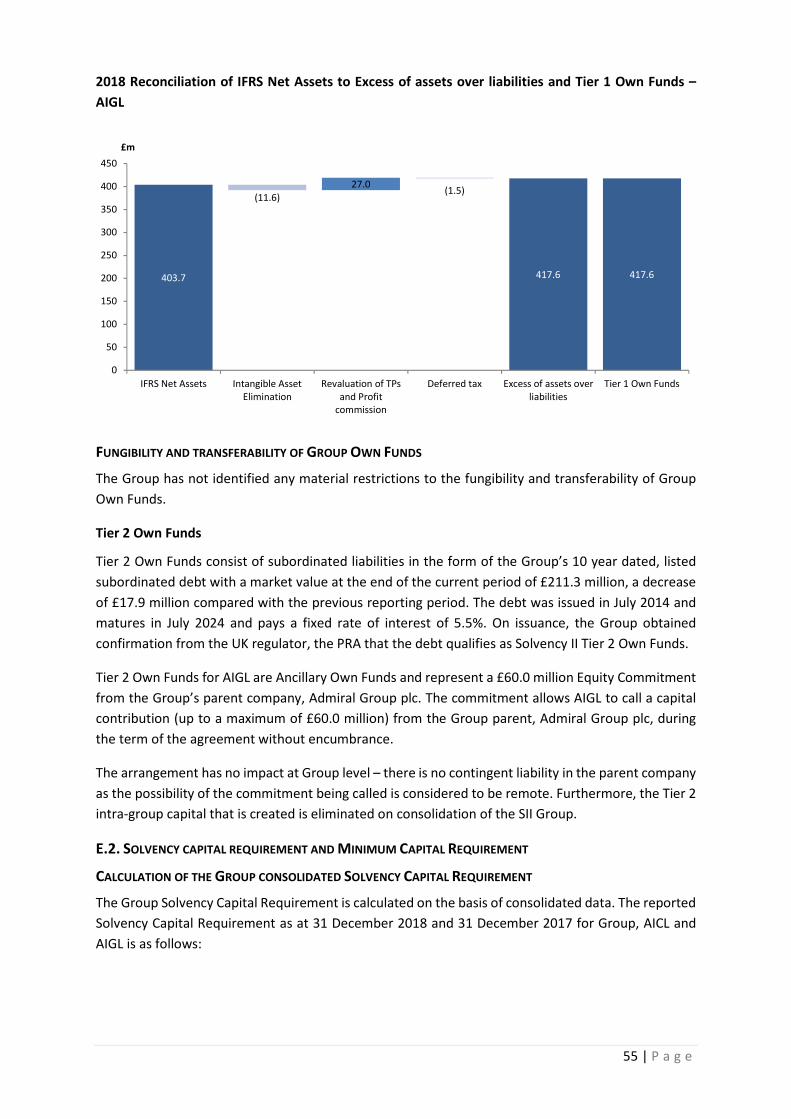
55 | P a g e
2018 Reconciliation of IFRS Net Assets to Excess of assets over liabilities and Tier 1 Own Funds –
AIGL
FUNGIBILITY AND TRANSFERABILITY OF GROUP OWN FUNDS
The Group has not identified any material restrictions to the fungibility and transferability of Group
Own Funds.
Tier 2 Own Funds
Tier 2 Own Funds consist of subordinated liabilities in the form of the Group’s 10 year dated, listed
subordinated debt with a market value at the end of the current period of £211.3 million, a decrease
of £17.9 million compared with the previous reporting period. The debt was issued in July 2014 and
matures in July 2024 and pays a fixed rate of interest of 5.5%. On issuance, the Group obtained
confirmation from the UK regulator, the PRA that the debt qualifies as Solvency II Tier 2 Own Funds.
Tier 2 Own Funds for AIGL are Ancillary Own Funds and represent a £60.0 million Equity Commitment
from the Group’s parent company, Admiral Group plc. The commitment allows AIGL to call a capital
contribution (up to a maximum of £60.0 million) from the Group parent, Admiral Group plc, during
the term of the agreement without encumbrance.
The arrangement has no impact at Group level – there is no contingent liability in the parent company
as the possibility of the commitment being called is considered to be remote. Furthermore, the Tier 2
intra-group capital that is created is eliminated on consolidation of the SII Group.
E.2. SOLVENCY CAPITAL REQUIREMENT AND MINIMUM CAPITAL REQUIREMENT
CALCULATION OF THE GROUP CONSOLIDATED SOLVENCY CAPITAL REQUIREMENT
The Group Solvency Capital Requirement is calculated on the basis of consolidated data. The reported
Solvency Capital Requirement as at 31 December 2018 and 31 December 2017 for Group, AICL and
AIGL is as follows:
403.7 417.6 417.6
27.0
(11.6)(1.5)
0
50
100
150
200
250
300
350
400
450
IFRS Net Assets Intangible Asset
Elimination
Revaluation of TPs
and Profit
commission
Deferred tax Excess of assets over
liabilities
Tier 1 Own Funds
£m
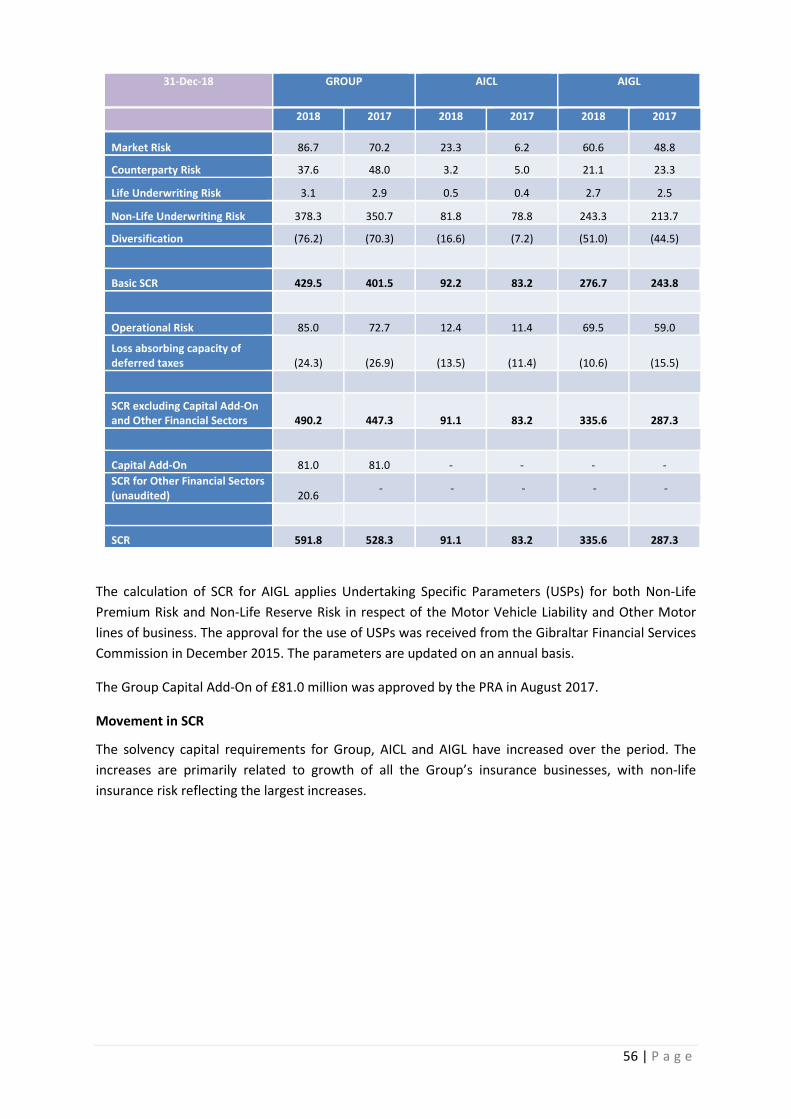
56 | P a g e
31-Dec-18 GROUP AICL AIGL
2018 2017 2018 2017 2018 2017
Market Risk 86.7 70.2 23.3 6.2 60.6 48.8
Counterparty Risk 37.6 48.0 3.2 5.0 21.1 23.3
Life Underwriting Risk 3.1 2.9 0.5 0.4 2.7 2.5
Non-Life Underwriting Risk 378.3 350.7 81.8 78.8 243.3 213.7
Diversification (76.2) (70.3) (16.6) (7.2) (51.0) (44.5)
Basic SCR 429.5 401.5 92.2 83.2 276.7 243.8
Operational Risk 85.0 72.7 12.4 11.4 69.5 59.0
Loss absorbing capacity of
deferred taxes (24.3) (26.9) (13.5) (11.4) (10.6) (15.5)
SCR excluding Capital Add-On
and Other Financial Sectors 490.2 447.3 91.1 83.2 335.6 287.3
Capital Add-On 81.0 81.0 - - - -
SCR for Other Financial Sectors
(unaudited) 20.6 - - - - -
SCR 591.8 528.3 91.1 83.2 335.6 287.3
The calculation of SCR for AIGL applies Undertaking Specific Parameters (USPs) for both Non-Life
Premium Risk and Non-Life Reserve Risk in respect of the Motor Vehicle Liability and Other Motor
lines of business. The approval for the use of USPs was received from the Gibraltar Financial Services
Commission in December 2015. The parameters are updated on an annual basis.
The Group Capital Add-On of £81.0 million was approved by the PRA in August 2017.
Movement in SCR
The solvency capital requirements for Group, AICL and AIGL have increased over the period. The
increases are primarily related to growth of all the Group’s insurance businesses, with non-life
insurance risk reflecting the largest increases.

57 | P a g e
Solvency Ratio
When combined with the Eligible Own Funds, the resulting reported solvency positions are as follows:
31-Dec-18 GROUP AICL AIGL
2018 2017 2018 2017 2018 2017
SCR 591.8 528.3 91.1 83.2 335.6 287.3
Eligible Own Funds 1,008.8 1,018.1 155.3 131.0 477.6 436.5
Surplus 417.0 489.7 64.2 47.8 142.0 149.2
Solvency Ratio 170% 194% 170% 158% 142% 152%
CALCULATION OF THE MINIMUM CAPITAL REQUIREMENT
The Group Minimum Capital Requirement at 31 December 2018 is £191.4 million. It is calculated in
line with Article 230 of the Directive as the minimum of:
• The Minimum Capital Requirement, calculated for the Group as per Article 129 of the
Directive; and
• The Group’s proportional share of the MCR of the related undertakings
The Minimum Capital Requirement for the solo entities is calculated as per Article 129 of the Directive.
The coverage of Eligible Own Funds to MCR at 31 December 2018 is as follows:
31-Dec-18 GROUP AICL AIGL
2018 2017 2018 2017 2018 2017
MCR 191.4 180.4 41.0 37.4 130.2 117.8
Eligible Own Funds 835.6 825.0 155.3 131.0 417.6 376.5
Surplus 644.2 644.6 114.3 93.6 287.4 258.7
Ratio 436% 457% 379% 350% 321% 320%
E.3. USE OF THE DURATION-BASED EQUITY SUB-MODULE IN THE CALCULATION OF THE SOLVENCY CAPITAL
REQUIREMENT
The duration based equity sub-module has not been used in the calculation of the Solvency Capital
Requirement.
E.4. DIFFERENCES BETWEEN THE STANDARD FORMULA AND ANY INTERNAL MODEL USED
Not applicable – no internal model has been used during the reporting period.
E.5. NON COMPLIANCE WITH THE MINIMUM CAPITAL REQUIREMENT AND NON-COMPLIANCE WITH THE
SOLVENCY CAPITAL REQUIREMENT
There have been no instances of non-compliance with the Minimum Capital Requirement or the
Solvency Capital Requirement during the period.
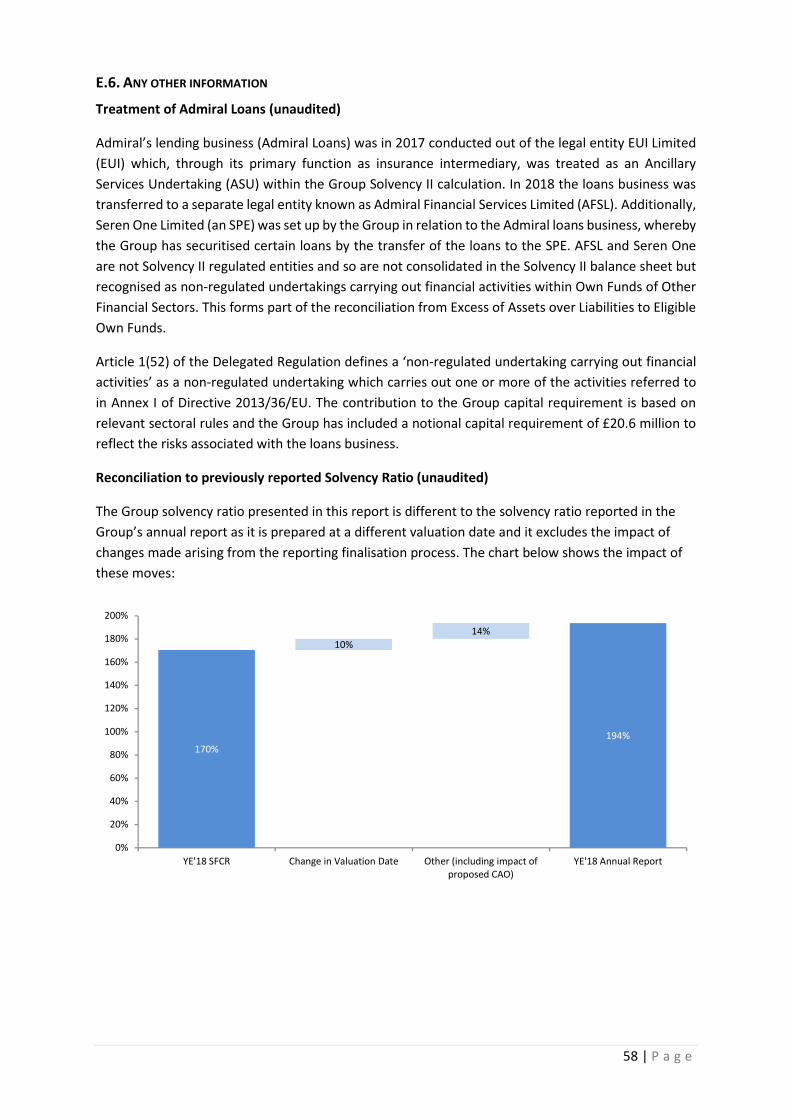
58 | P a g e
E.6. ANY OTHER INFORMATION
Treatment of Admiral Loans (unaudited)
Admiral’s lending business (Admiral Loans) was in 2017 conducted out of the legal entity EUI Limited
(EUI) which, through its primary function as insurance intermediary, was treated as an Ancillary
Services Undertaking (ASU) within the Group Solvency II calculation. In 2018 the loans business was
transferred to a separate legal entity known as Admiral Financial Services Limited (AFSL). Additionally,
Seren One Limited (an SPE) was set up by the Group in relation to the Admiral loans business, whereby
the Group has securitised certain loans by the transfer of the loans to the SPE. AFSL and Seren One
are not Solvency II regulated entities and so are not consolidated in the Solvency II balance sheet but
recognised as non-regulated undertakings carrying out financial activities within Own Funds of Other
Financial Sectors. This forms part of the reconciliation from Excess of Assets over Liabilities to Eligible
Own Funds.
Article 1(52) of the Delegated Regulation defines a ‘non-regulated undertaking carrying out financial
activities’ as a non-regulated undertaking which carries out one or more of the activities referred to
in Annex I of Directive 2013/36/EU. The contribution to the Group capital requirement is based on
relevant sectoral rules and the Group has included a notional capital requirement of £20.6 million to
reflect the risks associated with the loans business.
Reconciliation to previously reported Solvency Ratio (unaudited)
The Group solvency ratio presented in this report is different to the solvency ratio reported in the
Group’s annual report as it is prepared at a different valuation date and it excludes the impact of
changes made arising from the reporting finalisation process. The chart below shows the impact of
these moves:
170%
194%
10%
14%
0%
20%
40%
60%
80%
100%
120%
140%
160%
180%
200%
YE'18 SFCR Change in Valuation Date Other (including impact of
proposed CAO)
YE'18 Annual Report
59 | P a g e
Change in Valuation Date The solvency ratio in this report excludes the projected growth in
economic capital between the year end and the date of the Annual
Report (which was previously reported).
Other (Including the
impact of proposed CAO)
Other changes to both SCR and Own Funds calculations arising from
the reporting finalisation process.
This includes the impact of the proposed Capital Add-On (CAO). The
solvency ratio reported in the Group’s Annual Report reflected the
draft revision to the Group CAO. This was reported as ‘subject to
regulatory approval’ and ‘unaudited’. The ratio reported in this SFCR
reflects the previous CAO for which regulatory approval was in place
at the valuation date.
The proposed revision to the CAO has been approved through internal
governance and requires formal notification from the PRA. This
process is expected to be completed prior to the Group HY’19 interim
results announcement and an update will be provided at this time.
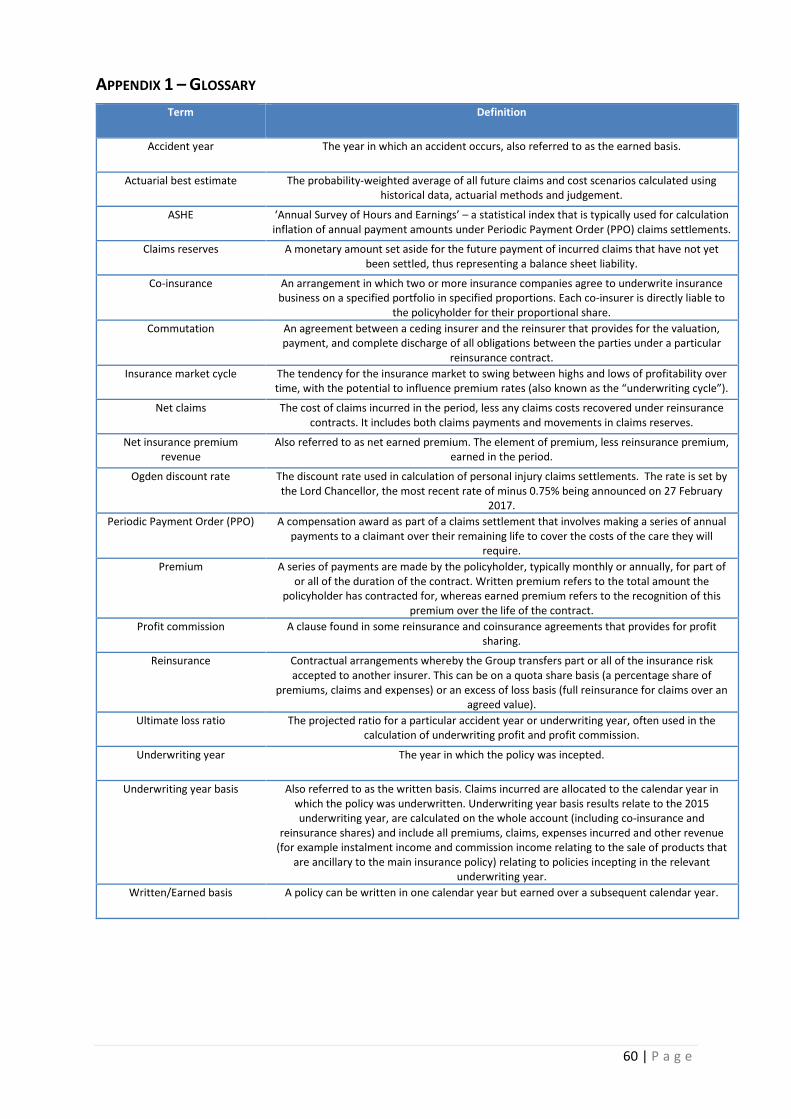
60 | P a g e
APPENDIX 1 – GLOSSARY
Term Definition
Accident year The year in which an accident occurs, also referred to as the earned basis.
Actuarial best estimate The probability-weighted average of all future claims and cost scenarios calculated using
historical data, actuarial methods and judgement.
ASHE ‘Annual Survey of Hours and Earnings’ – a statistical index that is typically used for calculation
inflation of annual payment amounts under Periodic Payment Order (PPO) claims settlements.
Claims reserves A monetary amount set aside for the future payment of incurred claims that have not yet
been settled, thus representing a balance sheet liability.
Co-insurance An arrangement in which two or more insurance companies agree to underwrite insurance
business on a specified portfolio in specified proportions. Each co-insurer is directly liable to
the policyholder for their proportional share.
Commutation An agreement between a ceding insurer and the reinsurer that provides for the valuation,
payment, and complete discharge of all obligations between the parties under a particular
reinsurance contract.
Insurance market cycle The tendency for the insurance market to swing between highs and lows of profitability over
time, with the potential to influence premium rates (also known as the “underwriting cycle”).
Net claims The cost of claims incurred in the period, less any claims costs recovered under reinsurance
contracts. It includes both claims payments and movements in claims reserves.
Net insurance premium
revenue
Also referred to as net earned premium. The element of premium, less reinsurance premium,
earned in the period.
Ogden discount rate The discount rate used in calculation of personal injury claims settlements. The rate is set by
the Lord Chancellor, the most recent rate of minus 0.75% being announced on 27 February
2017.
Periodic Payment Order (PPO) A compensation award as part of a claims settlement that involves making a series of annual
payments to a claimant over their remaining life to cover the costs of the care they will
require.
Premium A series of payments are made by the policyholder, typically monthly or annually, for part of
or all of the duration of the contract. Written premium refers to the total amount the
policyholder has contracted for, whereas earned premium refers to the recognition of this
premium over the life of the contract.
Profit commission A clause found in some reinsurance and coinsurance agreements that provides for profit
sharing.
Reinsurance Contractual arrangements whereby the Group transfers part or all of the insurance risk
accepted to another insurer. This can be on a quota share basis (a percentage share of
premiums, claims and expenses) or an excess of loss basis (full reinsurance for claims over an
agreed value).
Ultimate loss ratio The projected ratio for a particular accident year or underwriting year, often used in the
calculation of underwriting profit and profit commission.
Underwriting year The year in which the policy was incepted.
Underwriting year basis Also referred to as the written basis. Claims incurred are allocated to the calendar year in
which the policy was underwritten. Underwriting year basis results relate to the 2015
underwriting year, are calculated on the whole account (including co-insurance and
reinsurance shares) and include all premiums, claims, expenses incurred and other revenue
(for example instalment income and commission income relating to the sale of products that
are ancillary to the main insurance policy) relating to policies incepting in the relevant
underwriting year.
Written/Earned basis A policy can be written in one calendar year but earned over a subsequent calendar year.
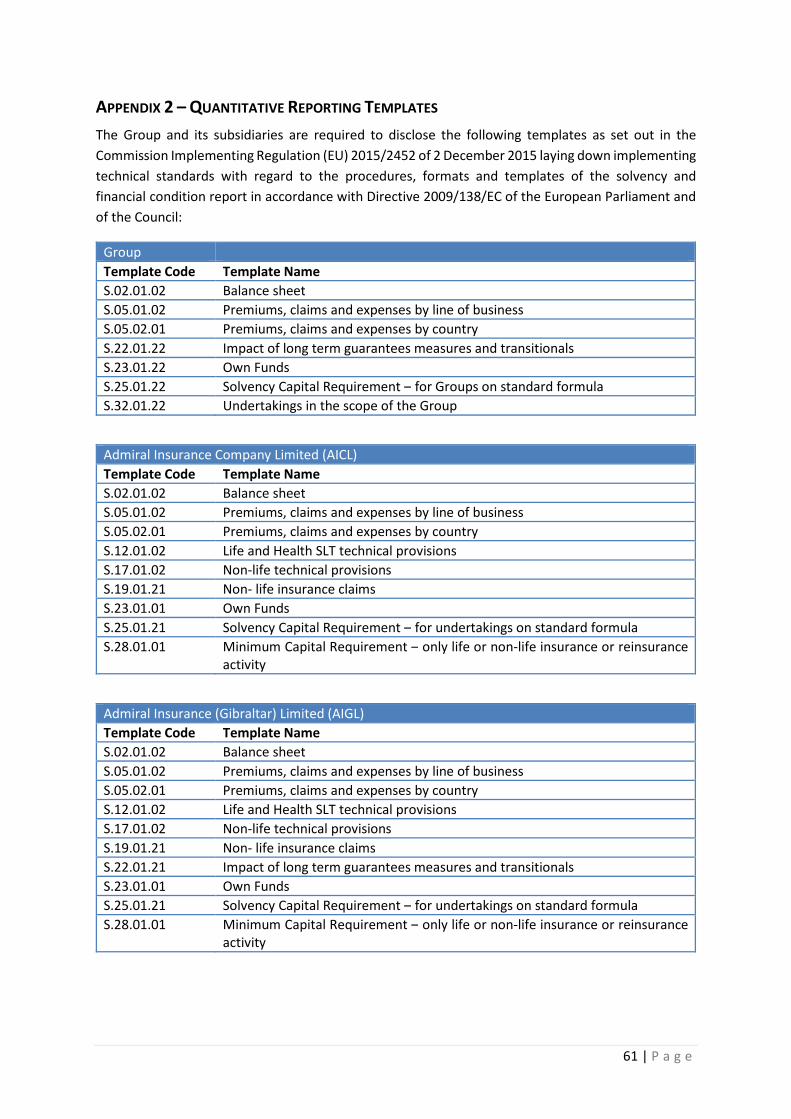
61 | P a g e
APPENDIX 2 – QUANTITATIVE REPORTING TEMPLATES
The Group and its subsidiaries are required to disclose the following templates as set out in the
Commission Implementing Regulation (EU) 2015/2452 of 2 December 2015 laying down implementing
technical standards with regard to the procedures, formats and templates of the solvency and
financial condition report in accordance with Directive 2009/138/EC of the European Parliament and
of the Council:
Group
Template Code Template Name
S.02.01.02 Balance sheet
S.05.01.02 Premiums, claims and expenses by line of business
S.05.02.01 Premiums, claims and expenses by country
S.22.01.22 Impact of long term guarantees measures and transitionals
S.23.01.22 Own Funds
S.25.01.22 Solvency Capital Requirement – for Groups on standard formula
S.32.01.22 Undertakings in the scope of the Group
Admiral Insurance Company Limited (AICL)
Template Code Template Name
S.02.01.02 Balance sheet
S.05.01.02 Premiums, claims and expenses by line of business
S.05.02.01 Premiums, claims and expenses by country
S.12.01.02 Life and Health SLT technical provisions
S.17.01.02 Non-life technical provisions
S.19.01.21 Non- life insurance claims
S.23.01.01 Own Funds
S.25.01.21 Solvency Capital Requirement – for undertakings on standard formula
S.28.01.01 Minimum Capital Requirement – only life or non-life insurance or reinsurance
activity
Admiral Insurance (Gibraltar) Limited (AIGL)
Template Code Template Name
S.02.01.02 Balance sheet
S.05.01.02 Premiums, claims and expenses by line of business
S.05.02.01 Premiums, claims and expenses by country
S.12.01.02 Life and Health SLT technical provisions
S.17.01.02 Non-life technical provisions
S.19.01.21 Non- life insurance claims
S.22.01.21 Impact of long term guarantees measures and transitionals
S.23.01.01 Own Funds
S.25.01.21 Solvency Capital Requirement – for undertakings on standard formula
S.28.01.01 Minimum Capital Requirement – only life or non-life insurance or reinsurance
activity
Admiral Group Plc
Solvency and Financial Condition Report
Disclosures
31 December
2018
(Monetary amounts in GBP thousands)
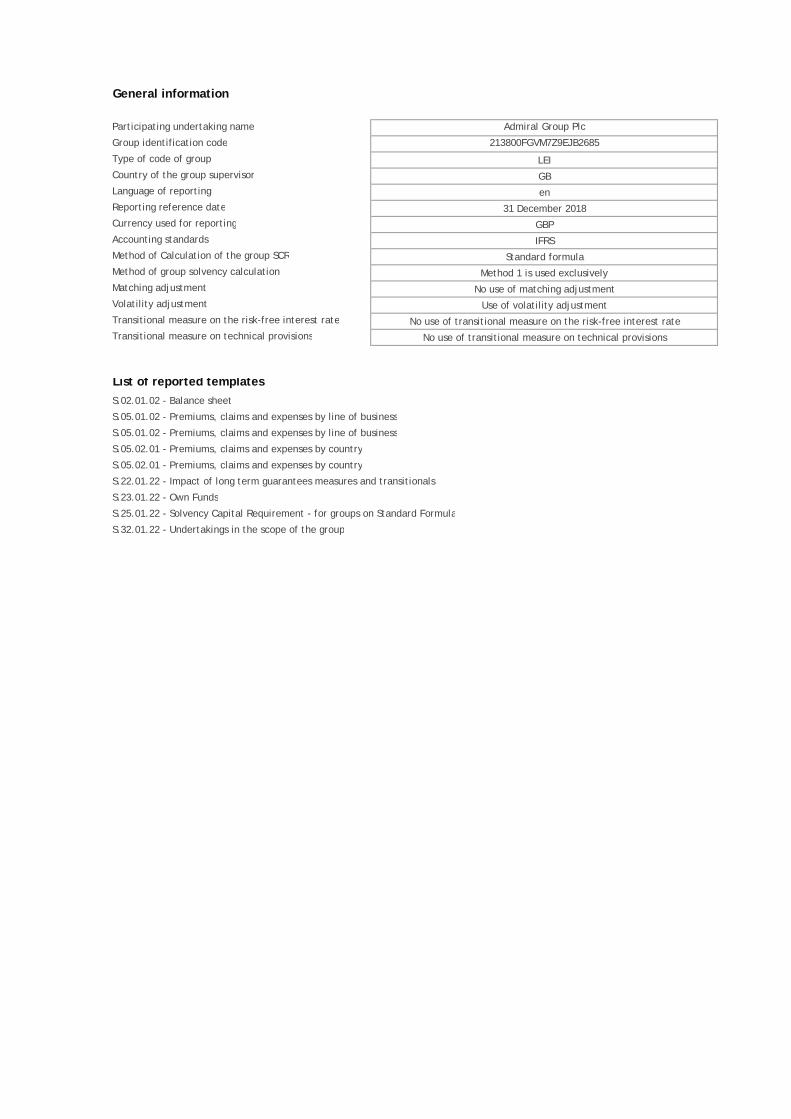
General information
Participating undertaking name Admiral Group Plc
Group identification code 213800FGVM7Z9EJB2685
Type of code of group LEI
Country of the group supervisor GB
Language of reporting en
Reporting reference date 31 December 2018
Currency used for reporting GBP
Accounting standards IFRS
Method of Calculation of the group SCR Standard formula
Method of group solvency calculation Method 1 is used exclusively
Matching adjustment No use of matching adjustment
Volatility adjustment Use of volatility adjustment
Transitional measure on the risk-free interest rate No use of transitional measure on the risk-free interest rate
Transitional measure on technical provisions No use of transitional measure on technical provisions
List of reported templates
S.02.01.02 - Balance sheet
S.05.01.02 - Premiums, claims and expenses by line of business
S.05.01.02 - Premiums, claims and expenses by line of business
S.05.02.01 - Premiums, claims and expenses by country
S.05.02.01 - Premiums, claims and expenses by country
S.22.01.22 - Impact of long term guarantees measures and transitionals
S.23.01.22 - Own Funds
S.25.01.22 - Solvency Capital Requirement - for groups on Standard Formula
S.32.01.22 - Undertakings in the scope of the group
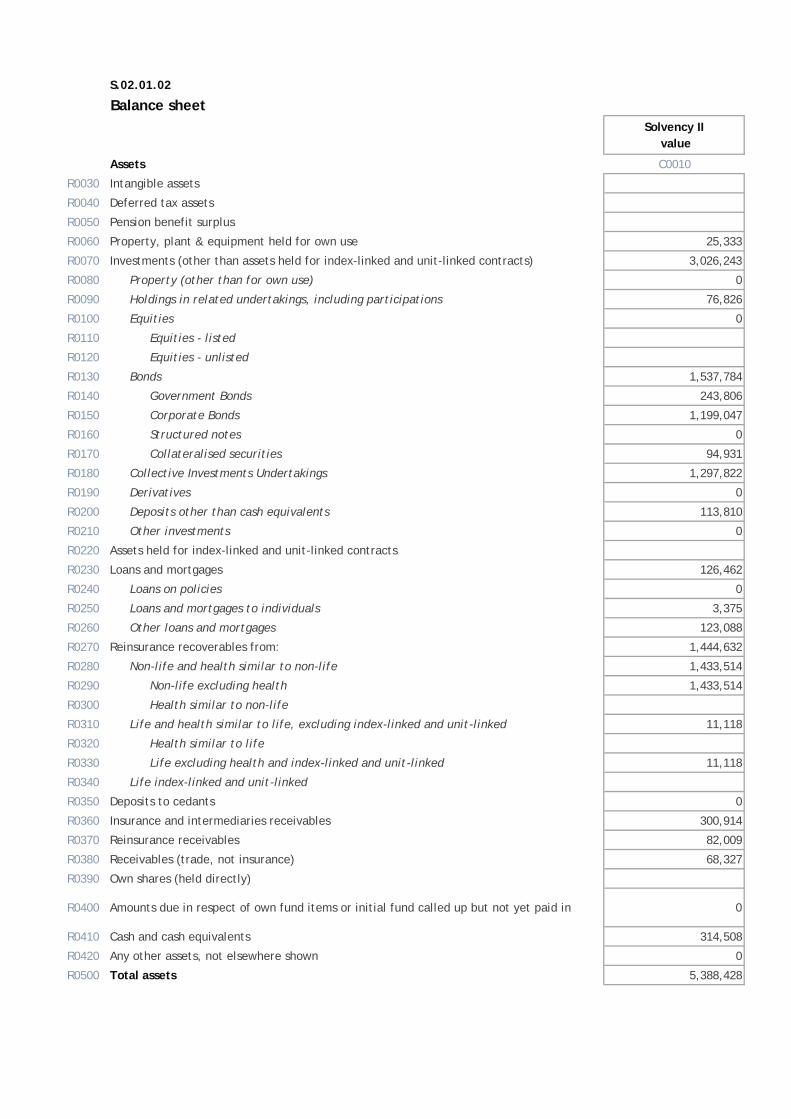
S.02.01.02
Balance sheetSolvency II
value
Assets C0010
R0030 Intangible assets
R0040 Deferred tax assets
R0050 Pension benefit surplus
R0060 Property, plant & equipment held for own use 25,333
R0070 Investments (other than assets held for index-linked and unit-linked contracts) 3,026,243
R0080 Property (other than for own use) 0
R0090 Holdings in related undertakings, including participations 76,826
R0100 Equities 0
R0110 Equities - listed
R0120 Equities - unlisted
R0130 Bonds 1,537,784
R0140 Government Bonds 243,806
R0150 Corporate Bonds 1,199,047
R0160 Structured notes 0
R0170 Collateralised securities 94,931
R0180 Collective Investments Undertakings 1,297,822
R0190 Derivatives 0
R0200 Deposits other than cash equivalents 113,810
R0210 Other investments 0
R0220 Assets held for index-linked and unit-linked contracts
R0230 Loans and mortgages 126,462
R0240 Loans on policies 0
R0250 Loans and mortgages to individuals 3,375
R0260 Other loans and mortgages 123,088
R0270 Reinsurance recoverables from: 1,444,632
R0280 Non-life and health similar to non-life 1,433,514
R0290 Non-life excluding health 1,433,514
R0300 Health similar to non-life
R0310 Life and health similar to life, excluding index-linked and unit-linked 11,118
R0320 Health similar to life
R0330 Life excluding health and index-linked and unit-linked 11,118
R0340 Life index-linked and unit-linked
R0350 Deposits to cedants 0
R0360 Insurance and intermediaries receivables 300,914
R0370 Reinsurance receivables 82,009
R0380 Receivables (trade, not insurance) 68,327
R0390 Own shares (held directly)
R0400 Amounts due in respect of own fund items or initial fund called up but not yet paid in 0
R0410 Cash and cash equivalents 314,508
R0420 Any other assets, not elsewhere shown 0
R0500 Total assets 5,388,428
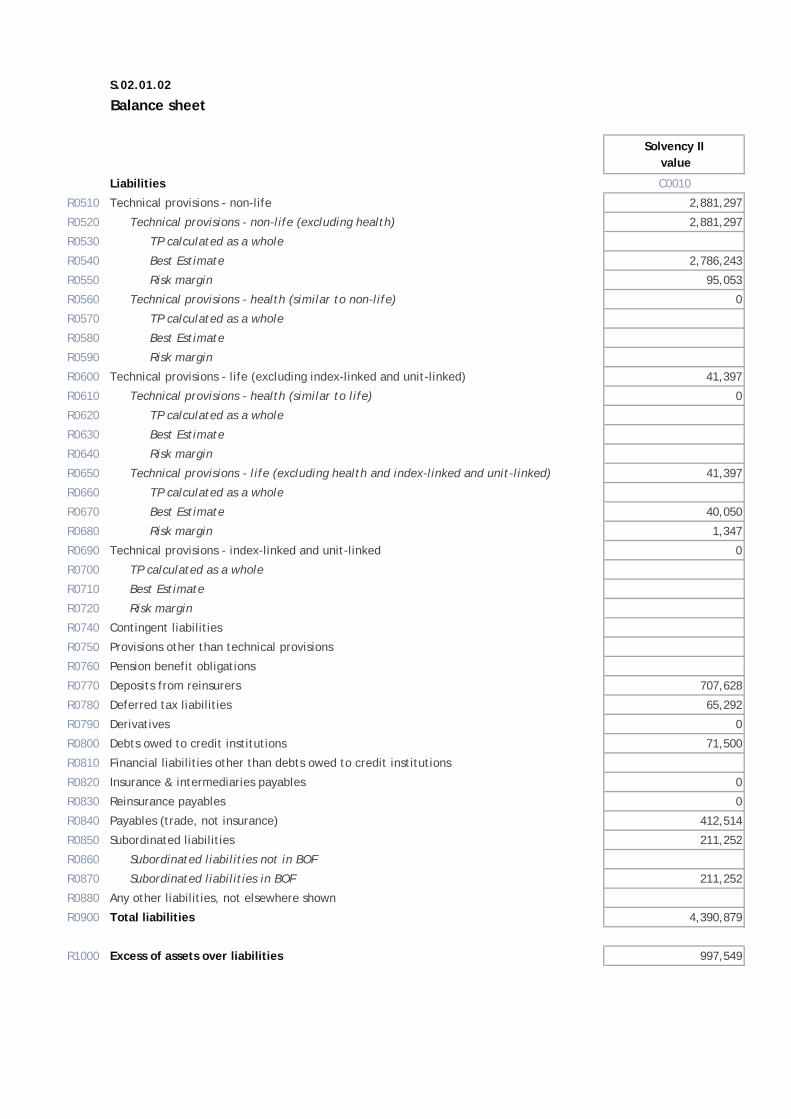
S.02.01.02
Balance sheet
Solvency II value
Liabilities C0010
R0510 Technical provisions - non-life 2,881,297
R0520 Technical provisions - non-life (excluding health) 2,881,297
R0530 TP calculated as a whole
R0540 Best Estimate 2,786,243
R0550 Risk margin 95,053
R0560 Technical provisions - health (similar to non-life) 0
R0570 TP calculated as a whole
R0580 Best Estimate
R0590 Risk margin
R0600 Technical provisions - life (excluding index-linked and unit-linked) 41,397
R0610 Technical provisions - health (similar to life) 0
R0620 TP calculated as a whole
R0630 Best Estimate
R0640 Risk margin
R0650 Technical provisions - life (excluding health and index-linked and unit-linked) 41,397
R0660 TP calculated as a whole
R0670 Best Estimate 40,050
R0680 Risk margin 1,347
R0690 Technical provisions - index-linked and unit-linked 0
R0700 TP calculated as a whole
R0710 Best Estimate
R0720 Risk margin
R0740 Contingent liabilities
R0750 Provisions other than technical provisions
R0760 Pension benefit obligations
R0770 Deposits from reinsurers 707,628
R0780 Deferred tax liabilities 65,292
R0790 Derivatives 0
R0800 Debts owed to credit institutions 71,500
R0810 Financial liabilities other than debts owed to credit institutions
R0820 Insurance & intermediaries payables 0
R0830 Reinsurance payables 0
R0840 Payables (trade, not insurance) 412,514
R0850 Subordinated liabilities 211,252
R0860 Subordinated liabilities not in BOF
R0870 Subordinated liabilities in BOF 211,252
R0880 Any other liabilities, not elsewhere shown
R0900 Total liabilities 4,390,879
R1000 Excess of assets over liabilities 997,549

S.05.01.02
Non-life
Medical expense
insurance
Income protection insurance
Workers' compensation
insurance
Motor vehicle liability
insurance
Other motor insurance
Marine, aviation and
transport insurance
Fire and other damage to property insurance
General liability
insurance
Credit and suretyship insurance
Legal expenses insurance
AssistanceMisc.
financial lossHealth Casualty
Marine, aviation and
transportProperty
C0010 C0020 C0030 C0040 C0050 C0060 C0070 C0080 C0090 C0100 C0110 C0120 C0130 C0140 C0150 C0160 C0200
Premiums written
R0110 Gross - Direct Business 1,402,506 584,632 125,325 1,420 18,418 34,354 2,166,656
R0120 Gross - Proportional reinsurance accepted 0
R0130 Gross - Non-proportional reinsurance accepted 0
R0140 Reinsurers' share 965,201 405,419 90,909 1,030 1,377 260 1,464,196
R0200 Net 437,305 179,213 34,417 390 17,041 34,094 702,460
Premiums earned
R0210 Gross - Direct Business 1,349,896 567,467 113,160 1,283 16,990 30,796 2,079,591
R0220 Gross - Proportional reinsurance accepted 0
R0230 Gross - Non-proportional reinsurance accepted 0
R0240 Reinsurers' share 929,415 393,662 82,317 933 1,183 260 1,407,770
R0300 Net 420,481 173,805 30,843 350 15,807 30,536 671,822
Claims incurred
R0310 Gross - Direct Business 934,496 389,982 95,369 1,081 9,743 19,013 1,449,684
R0320 Gross - Proportional reinsurance accepted 0
R0330 Gross - Non-proportional reinsurance accepted 0
R0340 Reinsurers' share 734,427 310,478 66,881 758 1,183 0 1,113,727
R0400 Net 200,069 79,504 28,488 323 8,561 19,013 335,958
Changes in other technical provisions
R0410 Gross - Direct Business 0
R0420 Gross - Proportional reinsurance accepted 0
R0430 Gross - Non-proportional reinsurance accepted 0
R0440 Reinsurers' share 0
R0500 Net 0 0 0 0 0 0 0
R0550 Expenses incurred 96,494 41,720 4,877 55 1,118 7,116 151,381
R1200 Other expenses -19,301
R1300 Total expenses 132,080
Premiums, claims and expenses by line of business
Line of Business for: non-life insurance and reinsurance obligations (direct business and accepted proportional reinsurance)Line of business for: accepted non-proportional
reinsurance
Total
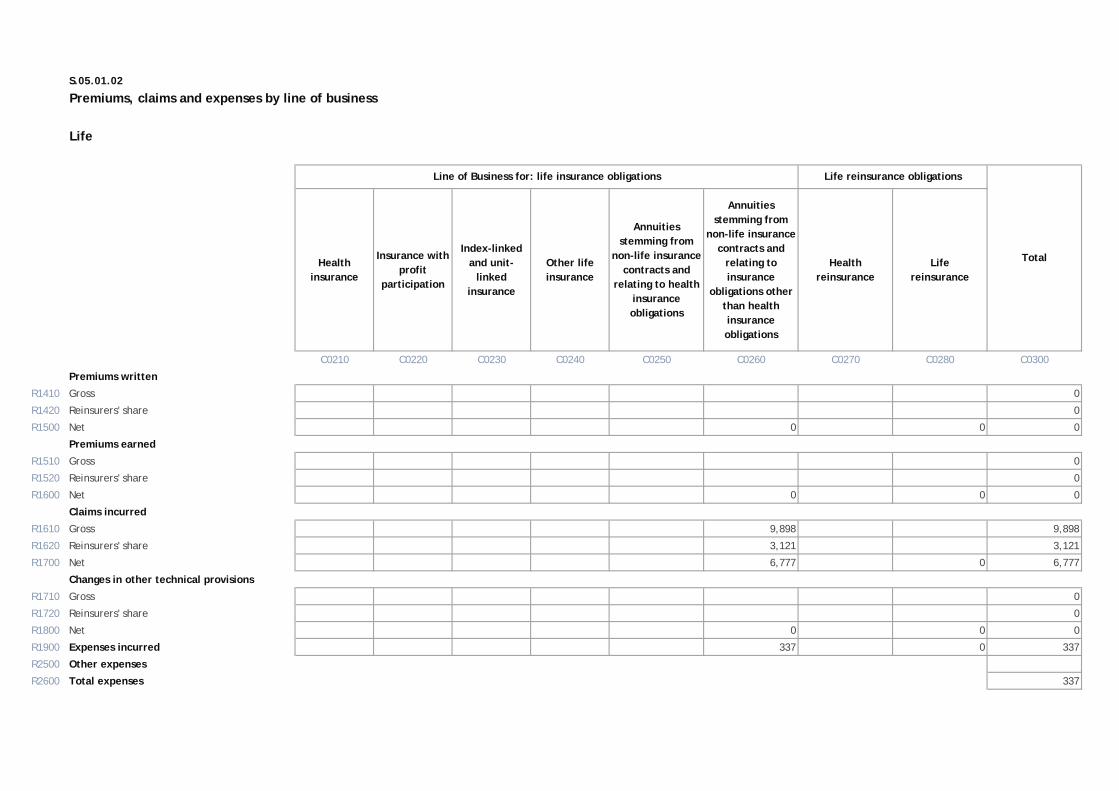
S.05.01.02
Life
Health insurance
Insurance with profit
participation
Index-linked and unit-
linked insurance
Other life insurance
Annuities stemming from
non-life insurance contracts and
relating to health insurance obligations
Annuities stemming from
non-life insurance contracts and
relating to insurance
obligations other than health insurance obligations
Health reinsurance
Life reinsurance
C0210 C0220 C0230 C0240 C0250 C0260 C0270 C0280 C0300
Premiums written
R1410 Gross 0
R1420 Reinsurers' share 0
R1500 Net 0 0 0
Premiums earned
R1510 Gross 0
R1520 Reinsurers' share 0
R1600 Net 0 0 0
Claims incurred
R1610 Gross 9,898 9,898
R1620 Reinsurers' share 3,121 3,121
R1700 Net 6,777 0 6,777
Changes in other technical provisions
R1710 Gross 0
R1720 Reinsurers' share 0
R1800 Net 0 0 0
R1900 Expenses incurred 337 0 337
R2500 Other expenses
R2600 Total expenses 337
Premiums, claims and expenses by line of business
Line of Business for: life insurance obligations Life reinsurance obligations
Total
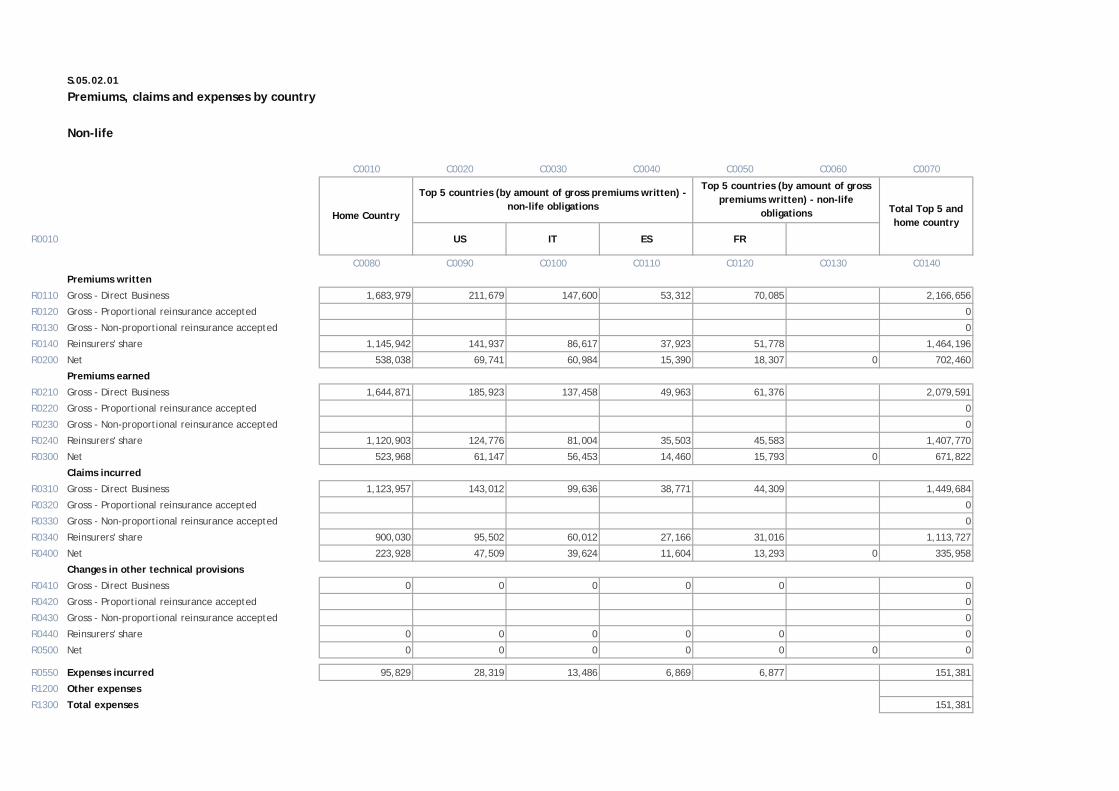
S.05.02.01
Premiums, claims and expenses by country
Non-life
C0010 C0020 C0030 C0040 C0050 C0060 C0070
R0010 US IT ES FR
C0080 C0090 C0100 C0110 C0120 C0130 C0140
Premiums written
R0110 Gross - Direct Business 1,683,979 211,679 147,600 53,312 70,085 2,166,656
R0120 Gross - Proportional reinsurance accepted 0
R0130 Gross - Non-proportional reinsurance accepted 0
R0140 Reinsurers' share 1,145,942 141,937 86,617 37,923 51,778 1,464,196
R0200 Net 538,038 69,741 60,984 15,390 18,307 0 702,460
Premiums earned
R0210 Gross - Direct Business 1,644,871 185,923 137,458 49,963 61,376 2,079,591
R0220 Gross - Proportional reinsurance accepted 0
R0230 Gross - Non-proportional reinsurance accepted 0
R0240 Reinsurers' share 1,120,903 124,776 81,004 35,503 45,583 1,407,770
R0300 Net 523,968 61,147 56,453 14,460 15,793 0 671,822
Claims incurred
R0310 Gross - Direct Business 1,123,957 143,012 99,636 38,771 44,309 1,449,684
R0320 Gross - Proportional reinsurance accepted 0
R0330 Gross - Non-proportional reinsurance accepted 0
R0340 Reinsurers' share 900,030 95,502 60,012 27,166 31,016 1,113,727
R0400 Net 223,928 47,509 39,624 11,604 13,293 0 335,958
Changes in other technical provisions
R0410 Gross - Direct Business 0 0 0 0 0 0
R0420 Gross - Proportional reinsurance accepted 0
R0430 Gross - Non-proportional reinsurance accepted 0
R0440 Reinsurers' share 0 0 0 0 0 0
R0500 Net 0 0 0 0 0 0 0
R0550 Expenses incurred 95,829 28,319 13,486 6,869 6,877 151,381
R1200 Other expenses
R1300 Total expenses 151,381
Home Country
Top 5 countries (by amount of gross premiums written) - non-life obligations
Top 5 countries (by amount of gross premiums written) - non-life
obligations Total Top 5 and home country
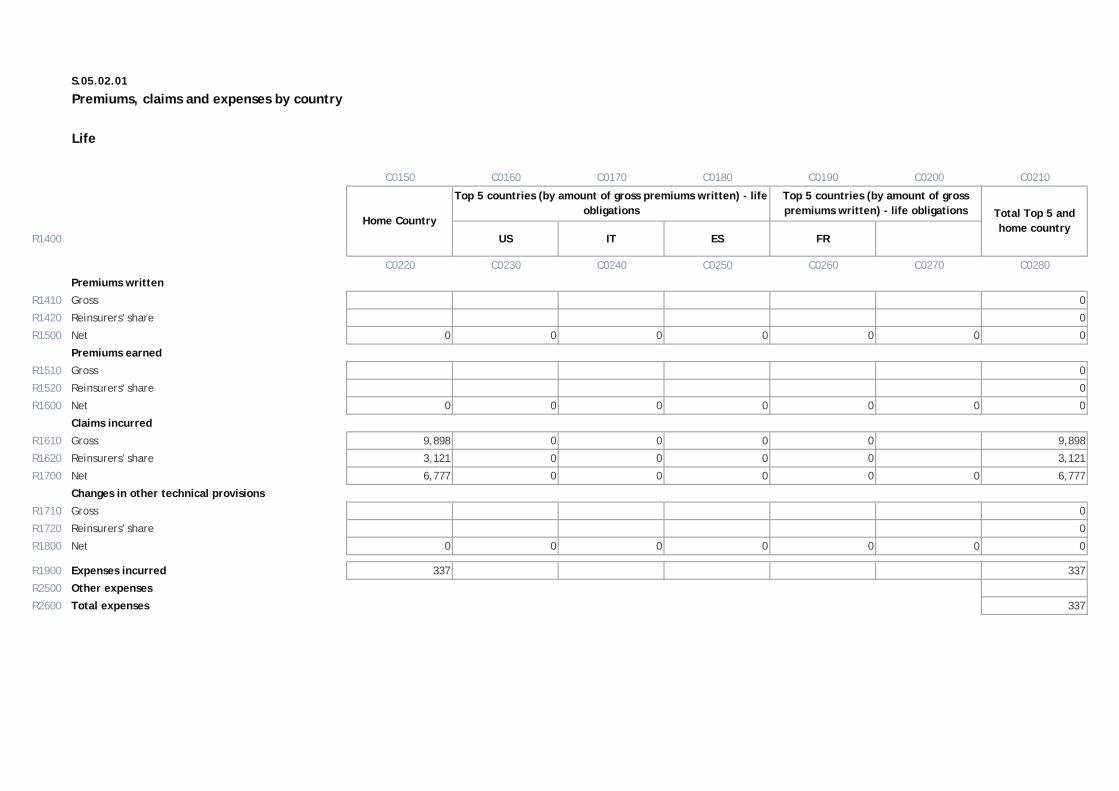
S.05.02.01
Premiums, claims and expenses by country
Life
C0150 C0160 C0170 C0180 C0190 C0200 C0210
R1400 US IT ES FR
C0220 C0230 C0240 C0250 C0260 C0270 C0280
Premiums written
R1410 Gross 0
R1420 Reinsurers' share 0
R1500 Net 0 0 0 0 0 0 0
Premiums earned
R1510 Gross 0
R1520 Reinsurers' share 0
R1600 Net 0 0 0 0 0 0 0
Claims incurred
R1610 Gross 9,898 0 0 0 0 9,898
R1620 Reinsurers' share 3,121 0 0 0 0 3,121
R1700 Net 6,777 0 0 0 0 0 6,777
Changes in other technical provisions
R1710 Gross 0
R1720 Reinsurers' share 0
R1800 Net 0 0 0 0 0 0 0
R1900 Expenses incurred 337 337
R2500 Other expenses
R2600 Total expenses 337
Home Country
Top 5 countries (by amount of gross premiums written) - life obligations
Top 5 countries (by amount of gross premiums written) - life obligations Total Top 5 and
home country
S.22.01.22
Impact of long term guarantees measures and transitionals
Amount with Long Term Guarantee
measures and transitionals
Impact of transitional on
technical provisions
Impact of transitional on interest rate
Impact of volatility
adjustment set to zero
Impact of matching
adjustment set to zero
C0010 C0030 C0050 C0070 C0090
R0010 Technical provisions 2,922,694 0 0 36,781 0
R0020 Basic own funds 1,008,599 0 0 -20,910 0
R0050 Eligible own funds to meet Solvency Capital Requirement 1,008,761 0 0 -20,910 0
R0090 Solvency Capital Requirement 591,817 0 0 6,670 0
S.23.01.22
Own Funds
Basic own funds before deduction for participations in other financial sector TotalTier 1
unrestrictedTier 1
restrictedTier 2 Tier 3
C0010 C0020 C0030 C0040 C0050
R0010 Ordinary share capital (gross of own shares) 291 291 0
R0020 Non-available called but not paid in ordinary share capital at group level 0
R0030 Share premium account related to ordinary share capital 13,145 13,145 0
R0040 Initial funds, members' contributions or the equivalent basic own-fund item for mutual and mutual-type undertakings 0 0 0
R0050 Subordinated mutual member accounts 0 0 0 0
R0060 Non-available subordinated mutual member accounts at group level 0
R0070 Surplus funds 0 0
R0080 Non-available surplus funds at group level 0 0
R0090 Preference shares 0 0 0 0
R0100 Non-available preference shares at group level 0
R0110 Share premium account related to preference shares 0 0 0 0
R0120 Non-available share premium account related to preference shares at group level 0
R0130 Reconciliation reserve 783,912 783,912
R0140 Subordinated liabilities 211,252 0 211,252 0
R0150 Non-available subordinated liabilities at group level 0
R0160 An amount equal to the value of net deferred tax assets 0 0
R0170 The amount equal to the value of net deferred tax assets not available at the group level 0 0
R0180 Other items approved by supervisory authority as basic own funds not specified above 0 0 0 0 0
R0190 Non available own funds related to other own funds items approved by supervisory authority 0
R0200 Minority interests (if not reported as part of a specific own fund item) 0
R0210 Non-available minority interests at group level 0
R0220 Own funds from the financial statements that should not be represented by the reconciliation reserve and do not meet the criteria to be classified as Solvency II own funds
R0230 Deductions for participations in other financial undertakings, including non-regulated undertakings carrying out financial activities 0
R0240 whereof deducted according to art 228 of the Directive 2009/138/EC 0
R0250 Deductions for participations where there is non-availability of information (Article 229) 0
R0260 Deduction for participations included by using D&A when a combination of methods is used 0
R0270 Total of non-available own fund items 0 0 0 0 0
R0280 Total deductions 0 0 0 0 0
R0290 Total basic own funds after deductions 1,008,599 797,347 0 211,252 0
Ancillary own funds
R0300 Unpaid and uncalled ordinary share capital callable on demand 0
R0310 Unpaid and uncalled initial funds, members' contributions or the equivalent basic own fund item for mutual and mutual - type undertakings, callable on demand 0
R0320 Unpaid and uncalled preference shares callable on demand 0
R0330 A legally binding commitment to subscribe and pay for subordinated liabilities on demand 0
R0340 Letters of credit and guarantees under Article 96(2) of the Directive 2009/138/EC 0
R0350 Letters of credit and guarantees other than under Article 96(2) of the Directive 2009/138/EC 0
R0360 Supplementary members calls under first subparagraph of Article 96(3) of the Directive 2009/138/EC 0
R0370 Supplementary members calls - other than under first subparagraph of Article 96(3) of the Directive 2009/138/EC 0
R0380 Non available ancillary own funds at group level 0
R0390 Other ancillary own funds 0
R0400 Total ancillary own funds 0 0 0
Own funds of other financial sectors
R0410 Credit Institutions, investment firms, financial institutions, alternative investment fund managers, UCITS management companies 0
R0420 Institutions for occupational retirement provision 0
R0430 Non regulated entities carrying out financial activities 161 161
R0440 Total own funds of other financial sectors 161 161 0 0 0
S.23.01.22
Own Funds
Basic own funds before deduction for participations in other financial sector TotalTier 1
unrestrictedTier 1
restrictedTier 2 Tier 3
C0010 C0020 C0030 C0040 C0050Own funds when using the D&A, exclusively or in combination of method 1
R0450 Own funds aggregated when using the D&A and combination of method 0
R0460 Own funds aggregated when using the D&A and combination of method net of IGT 0
R0520 Total available own funds to meet the consolidated group SCR (excluding own funds from other financial sector and from the undertakings included via D&A ) 1,008,599 797,347 0 211,252 0
R0530 Total available own funds to meet the minimum consolidated group SCR 1,008,599 797,347 0 211,252
R0560 Total eligible own funds to meet the consolidated group SCR (excluding own funds from other financial sector and from the undertakings included via D&A ) 1,008,599 797,347 0 211,252 0
R0570 Total eligible own funds to meet the minimum consolidated group SCR (group) 835,636 797,347 0 38,288
R0610 Minimum consolidated Group SCR 191,442
R0650 Ratio of Eligible own funds to Minimum Consolidated Group SCR 436.49%
R0660 Total eligible own funds to meet the group SCR (including own funds from other financial sector and from the undertakings included via D&A ) 1,008,761 797,509 0 211,252 0
R0680 Group SCR 591,817
R0690 Ratio of Eligible own funds to group SCR including other financial sectors and the undertakings included via D&A 170.45%
Reconcilliation reserve C0060
R0700 Excess of assets over liabilities 997,549
R0710 Own shares (held directly and indirectly)
R0720 Forseeable dividends, distributions and charges 187,900
R0730 Other basic own fund items 13,435
R0740 Adjustment for restricted own fund items in respect of matching adjustment portfolios and ring fenced funds 12,302
R0750 Other non available own funds
R0760 Reconciliation reserve 783,912
Expected profits
R0770 Expected profits included in future premiums (EPIFP) - Life business
R0780 Expected profits included in future premiums (EPIFP) - Non- life business 44,384
R0790 Total Expected profits included in future premiums (EPIFP) 44,384
S.25.01.22
Solvency Capital Requirement - for groups on Standard Formula
Gross solvency capital
requirementUSP Simplifications
C0110 C0090 C0120
R0010 Market risk 86,716
R0020 Counterparty default risk 37,602
R0030 Life underwriting risk 3,102
R0040 Health underwriting risk 0
R0050 Non-life underwriting risk 378,341
R0060 Diversification -76,181
R0070 Intangible asset risk 0
R0100 Basic Solvency Capital Requirement 429,580
Calculation of Solvency Capital Requirement C0100
R0130 Operational risk 84,956
R0140 Loss-absorbing capacity of technical provisions 0
R0150 Loss-absorbing capacity of deferred taxes -24,312
R0160 Capital requirement for business operated in accordance with Art. 4 of Directive 2003/41/EC 0
R0200 Solvency Capital Requirement excluding capital add-on 490,224
R0210 Capital add-ons already set 81,000
R0220 Solvency capital requirement for undertakings under consolidated method 571,224
Other information on SCR
R0400 Capital requirement for duration-based equity risk sub-module 0
R0410 Total amount of Notional Solvency Capital Requirements for remaining part 0
R0420 Total amount of Notional Solvency Capital Requirements for ring fenced funds 0
R0430 Total amount of Notional Solvency Capital Requirements for matching adjustment portfolios 0
R0440 Diversification effects due to RFF nSCR aggregation for article 304 0
R0470 Minimum consolidated group solvency capital requirement 191,442
Information on other entities
R0500 Capital requirement for other financial sectors (Non-insurance capital requirements) 20,592
R0510Credit institutions, investment firms and financial institutions, alternative investment funds managers, UCITS management companies
0
R0520 Institutions for occupational retirement provisions 0
R0530 Capital requirement for non- regulated entities carrying out financial activities 20,592
R0540 Capital requirement for non-controlled participation requirements 0
R0550 Capital requirement for residual undertakings 0
Overall SCR
R0560 SCR for undertakings included via D&A 0
R0570 Solvency capital requirement 591,817
USP Key
For life underwriting risk:1 - Increase in the amount of annuity benefits9 - None
For health underwriting risk:1 - Increase in the amount of annuity benefits2 - Standard deviation for NSLT health premium risk3 - Standard deviation for NSLT health gross premium risk4 - Adjustment factor for non- proportional reinsurance5 - Standard deviation for NSLT health reserve risk9 - None
For non-life underwriting risk:4 - Adjustment factor for non- proportional reinsurance6 - Standard deviation for non-life premium risk7 - Standard deviation for non-life gross premium risk
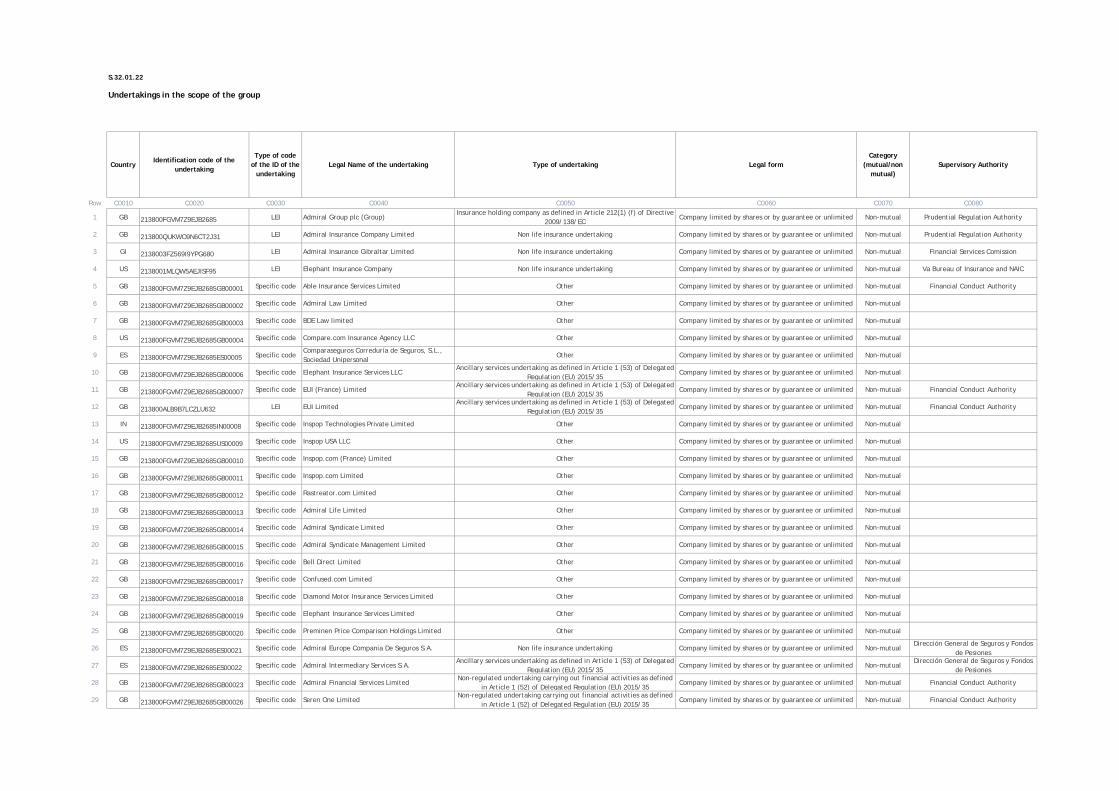
S.32.01.22
Undertakings in the scope of the group
CountryIdentification code of the
undertaking
Type of code of the ID of the
undertakingLegal Name of the undertaking Type of undertaking Legal form
Category (mutual/non
mutual)Supervisory Authority
Row C0010 C0020 C0030 C0040 C0050 C0060 C0070 C0080
1 GB 213800FGVM7Z9EJB2685 LEI Admiral Group plc (Group)Insurance holding company as defined in Article 212(1) (f) of Directive
2009/138/ECCompany limited by shares or by guarantee or unlimited Non-mutual Prudential Regulation Authority
2 GB 213800QUKWO9N6CT2J31 LEI Admiral Insurance Company Limited Non life insurance undertaking Company limited by shares or by guarantee or unlimited Non-mutual Prudential Regulation Authority
3 GI 2138003FZ569I9YPG680 LEI Admiral Insurance Gibraltar Limited Non life insurance undertaking Company limited by shares or by guarantee or unlimited Non-mutual Financial Services Comission
4 US 2138001MLQW5AEJISF95 LEI Elephant Insurance Company Non life insurance undertaking Company limited by shares or by guarantee or unlimited Non-mutual Va Bureau of Insurance and NAIC
5 GB 213800FGVM7Z9EJB2685GB00001 Specific code Able Insurance Services Limited Other Company limited by shares or by guarantee or unlimited Non-mutual Financial Conduct Authority
6 GB 213800FGVM7Z9EJB2685GB00002 Specific code Admiral Law Limited Other Company limited by shares or by guarantee or unlimited Non-mutual
7 GB 213800FGVM7Z9EJB2685GB00003 Specific code BDE Law limited Other Company limited by shares or by guarantee or unlimited Non-mutual
8 US 213800FGVM7Z9EJB2685GB00004 Specific code Compare.com Insurance Agency LLC Other Company limited by shares or by guarantee or unlimited Non-mutual
9 ES 213800FGVM7Z9EJB2685ES00005 Specific codeComparaseguros Correduría de Seguros, S.L., Sociedad Unipersonal
Other Company limited by shares or by guarantee or unlimited Non-mutual
10 GB 213800FGVM7Z9EJB2685GB00006 Specific code Elephant Insurance Services LLCAncillary services undertaking as defined in Article 1 (53) of Delegated
Regulation (EU) 2015/35Company limited by shares or by guarantee or unlimited Non-mutual
11 GB 213800FGVM7Z9EJB2685GB00007 Specific code EUI (France) LimitedAncillary services undertaking as defined in Article 1 (53) of Delegated
Regulation (EU) 2015/35Company limited by shares or by guarantee or unlimited Non-mutual Financial Conduct Authority
12 GB 213800ALB9B7LCZLU632 LEI EUI LimitedAncillary services undertaking as defined in Article 1 (53) of Delegated
Regulation (EU) 2015/35Company limited by shares or by guarantee or unlimited Non-mutual Financial Conduct Authority
13 IN 213800FGVM7Z9EJB2685IN00008 Specific code Inspop Technologies Private Limited Other Company limited by shares or by guarantee or unlimited Non-mutual
14 US 213800FGVM7Z9EJB2685US00009 Specific code Inspop USA LLC Other Company limited by shares or by guarantee or unlimited Non-mutual
15 GB 213800FGVM7Z9EJB2685GB00010 Specific code Inspop.com (France) Limited Other Company limited by shares or by guarantee or unlimited Non-mutual
16 GB 213800FGVM7Z9EJB2685GB00011 Specific code Inspop.com Limited Other Company limited by shares or by guarantee or unlimited Non-mutual
17 GB 213800FGVM7Z9EJB2685GB00012 Specific code Rastreator.com Limited Other Company limited by shares or by guarantee or unlimited Non-mutual
18 GB 213800FGVM7Z9EJB2685GB00013 Specific code Admiral Life Limited Other Company limited by shares or by guarantee or unlimited Non-mutual
19 GB 213800FGVM7Z9EJB2685GB00014 Specific code Admiral Syndicate Limited Other Company limited by shares or by guarantee or unlimited Non-mutual
20 GB 213800FGVM7Z9EJB2685GB00015 Specific code Admiral Syndicate Management Limited Other Company limited by shares or by guarantee or unlimited Non-mutual
21 GB 213800FGVM7Z9EJB2685GB00016 Specific code Bell Direct Limited Other Company limited by shares or by guarantee or unlimited Non-mutual
22 GB 213800FGVM7Z9EJB2685GB00017 Specific code Confused.com Limited Other Company limited by shares or by guarantee or unlimited Non-mutual
23 GB 213800FGVM7Z9EJB2685GB00018 Specific code Diamond Motor Insurance Services Limited Other Company limited by shares or by guarantee or unlimited Non-mutual
24 GB 213800FGVM7Z9EJB2685GB00019 Specific code Elephant Insurance Services Limited Other Company limited by shares or by guarantee or unlimited Non-mutual
25 GB 213800FGVM7Z9EJB2685GB00020 Specific code Preminen Price Comparison Holdings Limited Other Company limited by shares or by guarantee or unlimited Non-mutual
26 ES 213800FGVM7Z9EJB2685ES00021 Specific code Admiral Europe Compania De Seguros S.A. Non life insurance undertaking Company limited by shares or by guarantee or unlimited Non-mutualDirección General de Seguros y Fondos
de Pesiones
27 ES 213800FGVM7Z9EJB2685ES00022 Specific code Admiral Intermediary Services S.A.Ancillary services undertaking as defined in Article 1 (53) of Delegated
Regulation (EU) 2015/35Company limited by shares or by guarantee or unlimited Non-mutual
Dirección General de Seguros y Fondos de Pesiones
28 GB 213800FGVM7Z9EJB2685GB00023 Specific code Admiral Financial Services LimitedNon-regulated undertaking carrying out financial activities as defined
in Article 1 (52) of Delegated Regulation (EU) 2015/35Company limited by shares or by guarantee or unlimited Non-mutual Financial Conduct Authority
29 GB 213800FGVM7Z9EJB2685GB00026 Specific code Seren One LimitedNon-regulated undertaking carrying out financial activities as defined
in Article 1 (52) of Delegated Regulation (EU) 2015/35Company limited by shares or by guarantee or unlimited Non-mutual Financial Conduct Authority
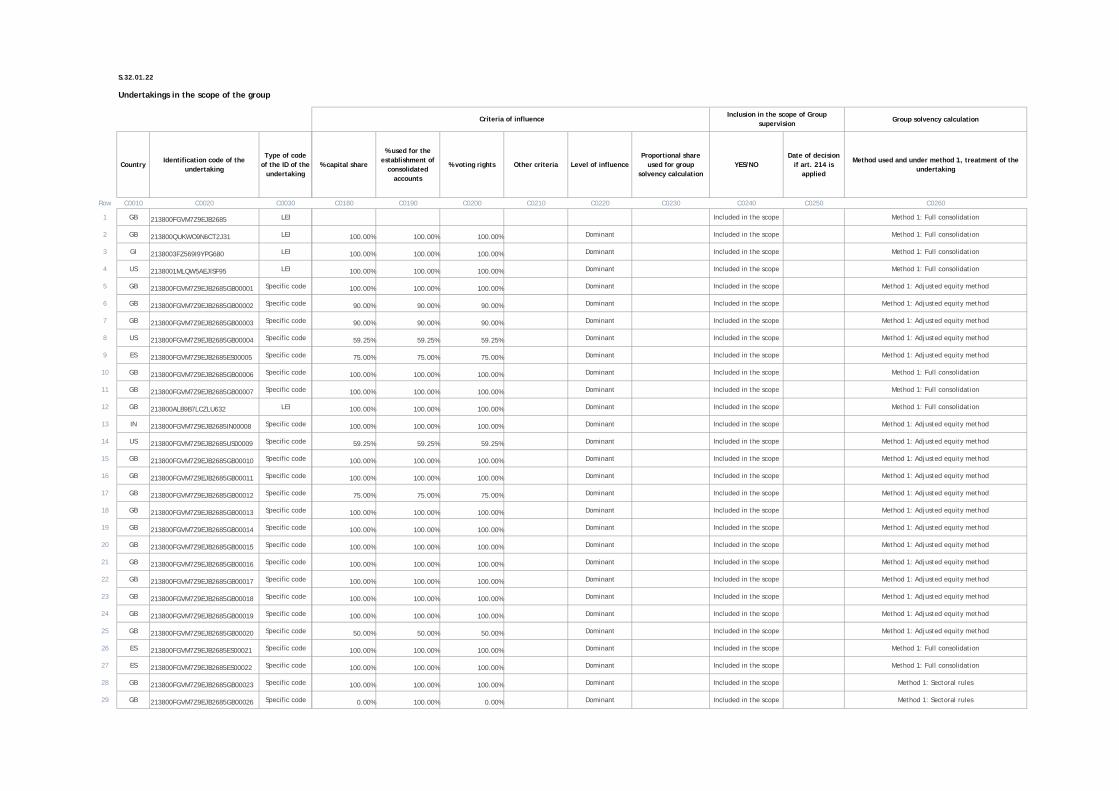
S.32.01.22
Undertakings in the scope of the group
CountryIdentification code of the
undertaking
Type of code of the ID of the
undertaking
Row C0010 C0020 C0030
1 GB 213800FGVM7Z9EJB2685 LEI
2 GB 213800QUKWO9N6CT2J31 LEI
3 GI 2138003FZ569I9YPG680 LEI
4 US 2138001MLQW5AEJISF95 LEI
5 GB 213800FGVM7Z9EJB2685GB00001 Specific code
6 GB 213800FGVM7Z9EJB2685GB00002 Specific code
7 GB 213800FGVM7Z9EJB2685GB00003 Specific code
8 US 213800FGVM7Z9EJB2685GB00004 Specific code
9 ES 213800FGVM7Z9EJB2685ES00005 Specific code
10 GB 213800FGVM7Z9EJB2685GB00006 Specific code
11 GB 213800FGVM7Z9EJB2685GB00007 Specific code
12 GB 213800ALB9B7LCZLU632 LEI
13 IN 213800FGVM7Z9EJB2685IN00008 Specific code
14 US 213800FGVM7Z9EJB2685US00009 Specific code
15 GB 213800FGVM7Z9EJB2685GB00010 Specific code
16 GB 213800FGVM7Z9EJB2685GB00011 Specific code
17 GB 213800FGVM7Z9EJB2685GB00012 Specific code
18 GB 213800FGVM7Z9EJB2685GB00013 Specific code
19 GB 213800FGVM7Z9EJB2685GB00014 Specific code
20 GB 213800FGVM7Z9EJB2685GB00015 Specific code
21 GB 213800FGVM7Z9EJB2685GB00016 Specific code
22 GB 213800FGVM7Z9EJB2685GB00017 Specific code
23 GB 213800FGVM7Z9EJB2685GB00018 Specific code
24 GB 213800FGVM7Z9EJB2685GB00019 Specific code
25 GB 213800FGVM7Z9EJB2685GB00020 Specific code
26 ES 213800FGVM7Z9EJB2685ES00021 Specific code
27 ES 213800FGVM7Z9EJB2685ES00022 Specific code
28 GB 213800FGVM7Z9EJB2685GB00023 Specific code
29 GB 213800FGVM7Z9EJB2685GB00026 Specific code
Group solvency calculation
% capital share
% used for the establishment of
consolidated accounts
% voting rights Other criteria Level of influenceProportional share
used for group solvency calculation
YES/NODate of decision
if art. 214 is applied
Method used and under method 1, treatment of the undertaking
C0180 C0190 C0200 C0210 C0220 C0230 C0240 C0250 C0260
Included in the scope Method 1: Full consolidation
100.00% 100.00% 100.00% Dominant Included in the scope Method 1: Full consolidation
100.00% 100.00% 100.00% Dominant Included in the scope Method 1: Full consolidation
100.00% 100.00% 100.00% Dominant Included in the scope Method 1: Full consolidation
100.00% 100.00% 100.00% Dominant Included in the scope Method 1: Adjusted equity method
90.00% 90.00% 90.00% Dominant Included in the scope Method 1: Adjusted equity method
90.00% 90.00% 90.00% Dominant Included in the scope Method 1: Adjusted equity method
59.25% 59.25% 59.25% Dominant Included in the scope Method 1: Adjusted equity method
75.00% 75.00% 75.00% Dominant Included in the scope Method 1: Adjusted equity method
100.00% 100.00% 100.00% Dominant Included in the scope Method 1: Full consolidation
100.00% 100.00% 100.00% Dominant Included in the scope Method 1: Full consolidation
100.00% 100.00% 100.00% Dominant Included in the scope Method 1: Full consolidation
100.00% 100.00% 100.00% Dominant Included in the scope Method 1: Adjusted equity method
59.25% 59.25% 59.25% Dominant Included in the scope Method 1: Adjusted equity method
100.00% 100.00% 100.00% Dominant Included in the scope Method 1: Adjusted equity method
100.00% 100.00% 100.00% Dominant Included in the scope Method 1: Adjusted equity method
75.00% 75.00% 75.00% Dominant Included in the scope Method 1: Adjusted equity method
100.00% 100.00% 100.00% Dominant Included in the scope Method 1: Adjusted equity method
100.00% 100.00% 100.00% Dominant Included in the scope Method 1: Adjusted equity method
100.00% 100.00% 100.00% Dominant Included in the scope Method 1: Adjusted equity method
100.00% 100.00% 100.00% Dominant Included in the scope Method 1: Adjusted equity method
100.00% 100.00% 100.00% Dominant Included in the scope Method 1: Adjusted equity method
100.00% 100.00% 100.00% Dominant Included in the scope Method 1: Adjusted equity method
100.00% 100.00% 100.00% Dominant Included in the scope Method 1: Adjusted equity method
50.00% 50.00% 50.00% Dominant Included in the scope Method 1: Adjusted equity method
100.00% 100.00% 100.00% Dominant Included in the scope Method 1: Full consolidation
100.00% 100.00% 100.00% Dominant Included in the scope Method 1: Full consolidation
100.00% 100.00% 100.00% Dominant Included in the scope Method 1: Sectoral rules
0.00% 100.00% 0.00% Dominant Included in the scope Method 1: Sectoral rules
Criteria of influenceInclusion in the scope of Group
supervision
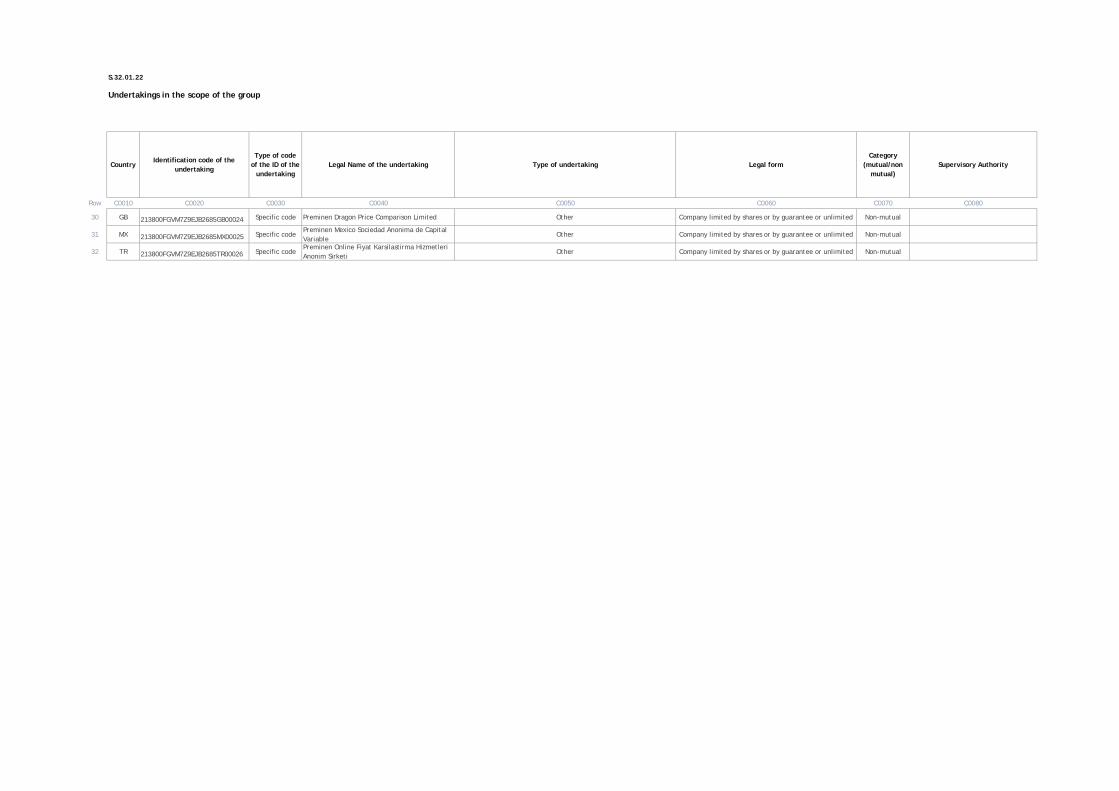
S.32.01.22
Undertakings in the scope of the group
CountryIdentification code of the
undertaking
Type of code of the ID of the
undertakingLegal Name of the undertaking Type of undertaking Legal form
Category (mutual/non
mutual)Supervisory Authority
Row C0010 C0020 C0030 C0040 C0050 C0060 C0070 C0080
30 GB 213800FGVM7Z9EJB2685GB00024 Specific code Preminen Dragon Price Comparison Limited Other Company limited by shares or by guarantee or unlimited Non-mutual
31 MX 213800FGVM7Z9EJB2685MX00025 Specific codePreminen Mexico Sociedad Anonima de Capital Variable
Other Company limited by shares or by guarantee or unlimited Non-mutual
32 TR 213800FGVM7Z9EJB2685TR00026 Specific codePreminen Online Fiyat Karsilastirma Hizmetleri Anonim Sirketi
Other Company limited by shares or by guarantee or unlimited Non-mutual

S.32.01.22
Undertakings in the scope of the group
CountryIdentification code of the
undertaking
Type of code of the ID of the
undertaking
Row C0010 C0020 C0030
30 GB 213800FGVM7Z9EJB2685GB00024 Specific code
31 MX 213800FGVM7Z9EJB2685MX00025 Specific code
32 TR 213800FGVM7Z9EJB2685TR00026 Specific code
Group solvency calculation
% capital share
% used for the establishment of
consolidated accounts
% voting rights Other criteria Level of influenceProportional share
used for group solvency calculation
YES/NODate of decision
if art. 214 is applied
Method used and under method 1, treatment of the undertaking
C0180 C0190 C0200 C0210 C0220 C0230 C0240 C0250 C0260
Criteria of influenceInclusion in the scope of Group
supervision
50.00% 50.00% 50.00% Dominant Included in the scope Method 1: Adjusted equity method
51.25% 51.25% 51.25% Dominant Included in the scope Method 1: Adjusted equity method
50.00% 50.00% 50.00% Dominant Included in the scope Method 1: Adjusted equity method

Admiral Insurance
Company Limited
Solvency and Financial
Condition Report
Disclosures
31 December
2018
(Monetary amounts in GBP thousands)

General information
Undertaking name Admiral Insurance Company Limited
Undertaking identification code 213800QUKWO9N6CT2J31
Type of code of undertaking LEI
Type of undertaking Non-life undertakings
Country of authorisation GB
Language of reporting en
Reporting reference date 31 December 2018
Currency used for reporting GBP
Accounting standards IFRS
Method of Calculation of the SCR Standard formula
Matching adjustment No use of matching adjustment
Volatility adjustment No use of volatility adjustment
Transitional measure on the risk-free interest rate No use of transitional measure on the risk-free interest rate
Transitional measure on technical provisions No use of transitional measure on technical provisions
List of reported templates
S.02.01.02 - Balance sheet
S.05.01.02 - Premiums, claims and expenses by line of business
S.05.01.02 - Premiums, claims and expenses by line of business
S.05.02.01 - Premiums, claims and expenses by country
S.05.02.01 - Premiums, claims and expenses by country
S.12.01.02 - Life and Health SLT Technical Provisions
S.17.01.02 - Non-Life Technical Provisions
S.19.01.21 - Non-Life insurance claims
S.23.01.01 - Own Funds
S.25.01.21 - Solvency Capital Requirement - for undertakings on Standard Formula
S.28.01.01 - Minimum Capital Requirement - Only life or only non-life insurance or reinsurance activity
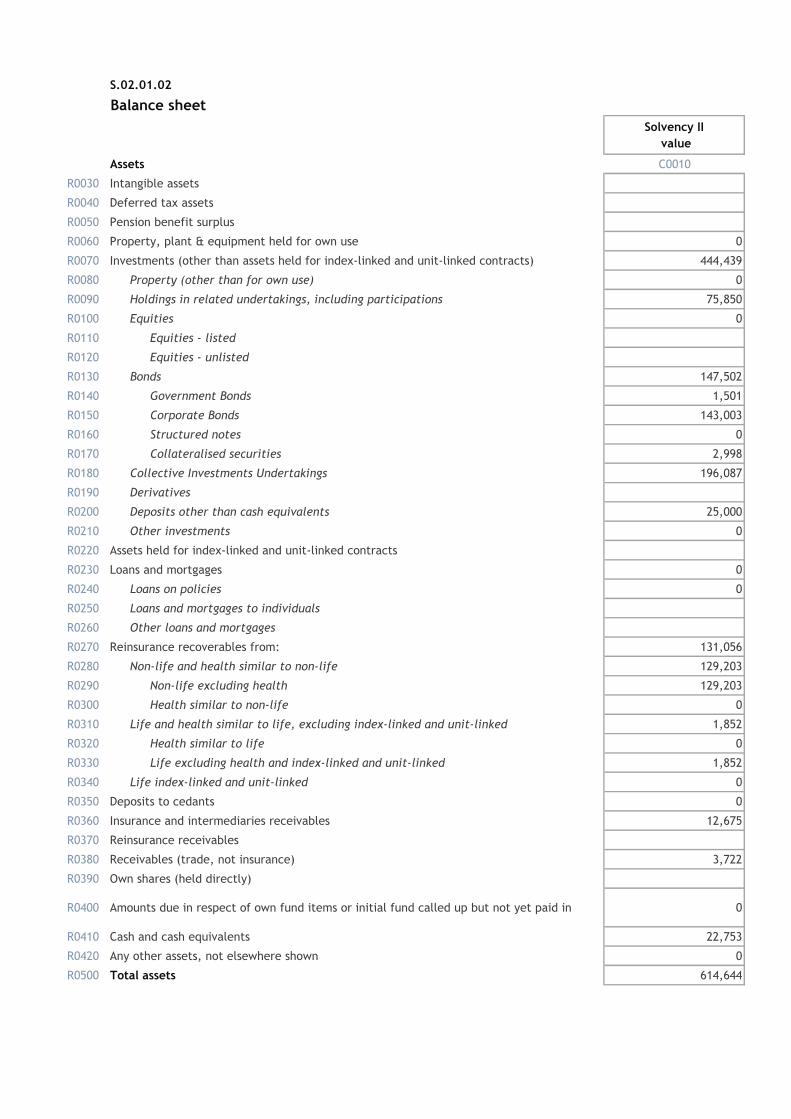
S.02.01.02
Balance sheet
Solvency II
value
Assets C0010
R0030 Intangible assets
R0040 Deferred tax assets
R0050 Pension benefit surplus
R0060 Property, plant & equipment held for own use 0
R0070 Investments (other than assets held for index-linked and unit-linked contracts) 444,439
R0080 Property (other than for own use) 0
R0090 Holdings in related undertakings, including participations 75,850
R0100 Equities 0
R0110 Equities - listed
R0120 Equities - unlisted
R0130 Bonds 147,502
R0140 Government Bonds 1,501
R0150 Corporate Bonds 143,003
R0160 Structured notes 0
R0170 Collateralised securities 2,998
R0180 Collective Investments Undertakings 196,087
R0190 Derivatives
R0200 Deposits other than cash equivalents 25,000
R0210 Other investments 0
R0220 Assets held for index-linked and unit-linked contracts
R0230 Loans and mortgages 0
R0240 Loans on policies 0
R0250 Loans and mortgages to individuals
R0260 Other loans and mortgages
R0270 Reinsurance recoverables from: 131,056
R0280 Non-life and health similar to non-life 129,203
R0290 Non-life excluding health 129,203
R0300 Health similar to non-life 0
R0310 Life and health similar to life, excluding index-linked and unit-linked 1,852
R0320 Health similar to life 0
R0330 Life excluding health and index-linked and unit-linked 1,852
R0340 Life index-linked and unit-linked 0
R0350 Deposits to cedants 0
R0360 Insurance and intermediaries receivables 12,675
R0370 Reinsurance receivables
R0380 Receivables (trade, not insurance) 3,722
R0390 Own shares (held directly)
R0400 Amounts due in respect of own fund items or initial fund called up but not yet paid in 0
R0410 Cash and cash equivalents 22,753
R0420 Any other assets, not elsewhere shown 0
R0500 Total assets 614,644
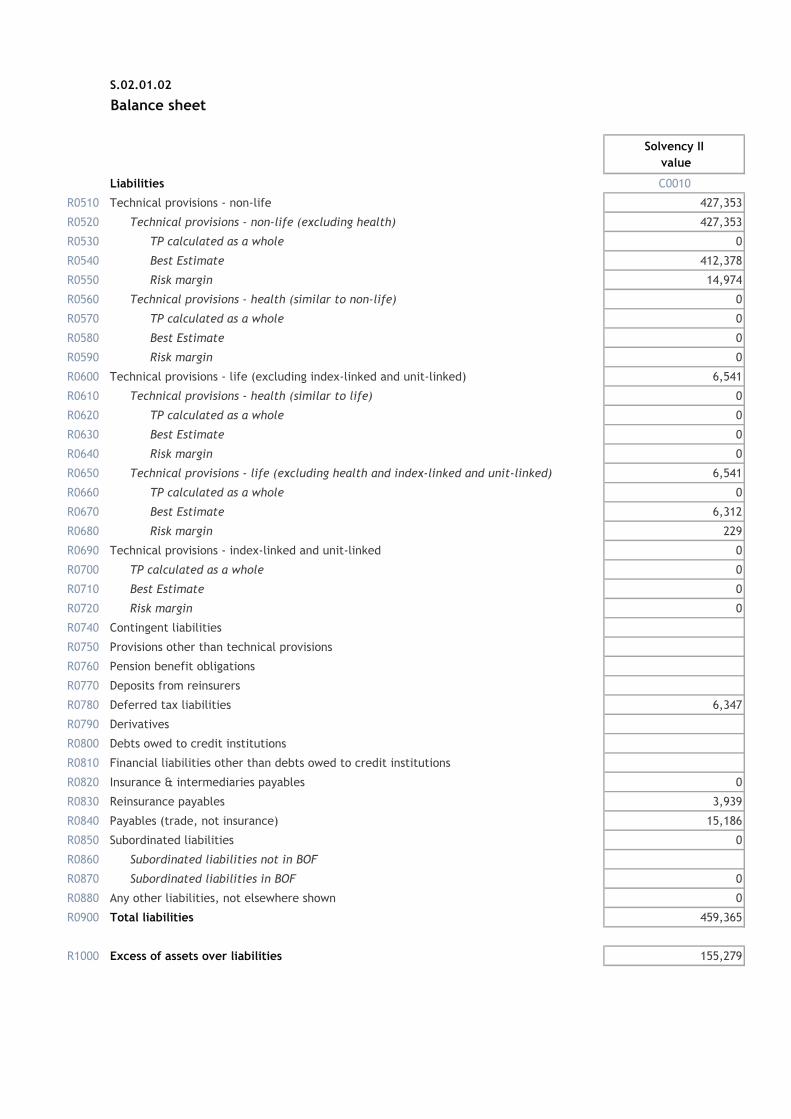
S.02.01.02
Balance sheet
Solvency II
value
Liabilities C0010
R0510 Technical provisions - non-life 427,353
R0520 Technical provisions - non-life (excluding health) 427,353
R0530 TP calculated as a whole 0
R0540 Best Estimate 412,378
R0550 Risk margin 14,974
R0560 Technical provisions - health (similar to non-life) 0
R0570 TP calculated as a whole 0
R0580 Best Estimate 0
R0590 Risk margin 0
R0600 Technical provisions - life (excluding index-linked and unit-linked) 6,541
R0610 Technical provisions - health (similar to life) 0
R0620 TP calculated as a whole 0
R0630 Best Estimate 0
R0640 Risk margin 0
R0650 Technical provisions - life (excluding health and index-linked and unit-linked) 6,541
R0660 TP calculated as a whole 0
R0670 Best Estimate 6,312
R0680 Risk margin 229
R0690 Technical provisions - index-linked and unit-linked 0
R0700 TP calculated as a whole 0
R0710 Best Estimate 0
R0720 Risk margin 0
R0740 Contingent liabilities
R0750 Provisions other than technical provisions
R0760 Pension benefit obligations
R0770 Deposits from reinsurers
R0780 Deferred tax liabilities 6,347
R0790 Derivatives
R0800 Debts owed to credit institutions
R0810 Financial liabilities other than debts owed to credit institutions
R0820 Insurance & intermediaries payables 0
R0830 Reinsurance payables 3,939
R0840 Payables (trade, not insurance) 15,186
R0850 Subordinated liabilities 0
R0860 Subordinated liabilities not in BOF
R0870 Subordinated liabilities in BOF 0
R0880 Any other liabilities, not elsewhere shown 0
R0900 Total liabilities 459,365
R1000 Excess of assets over liabilities 155,279
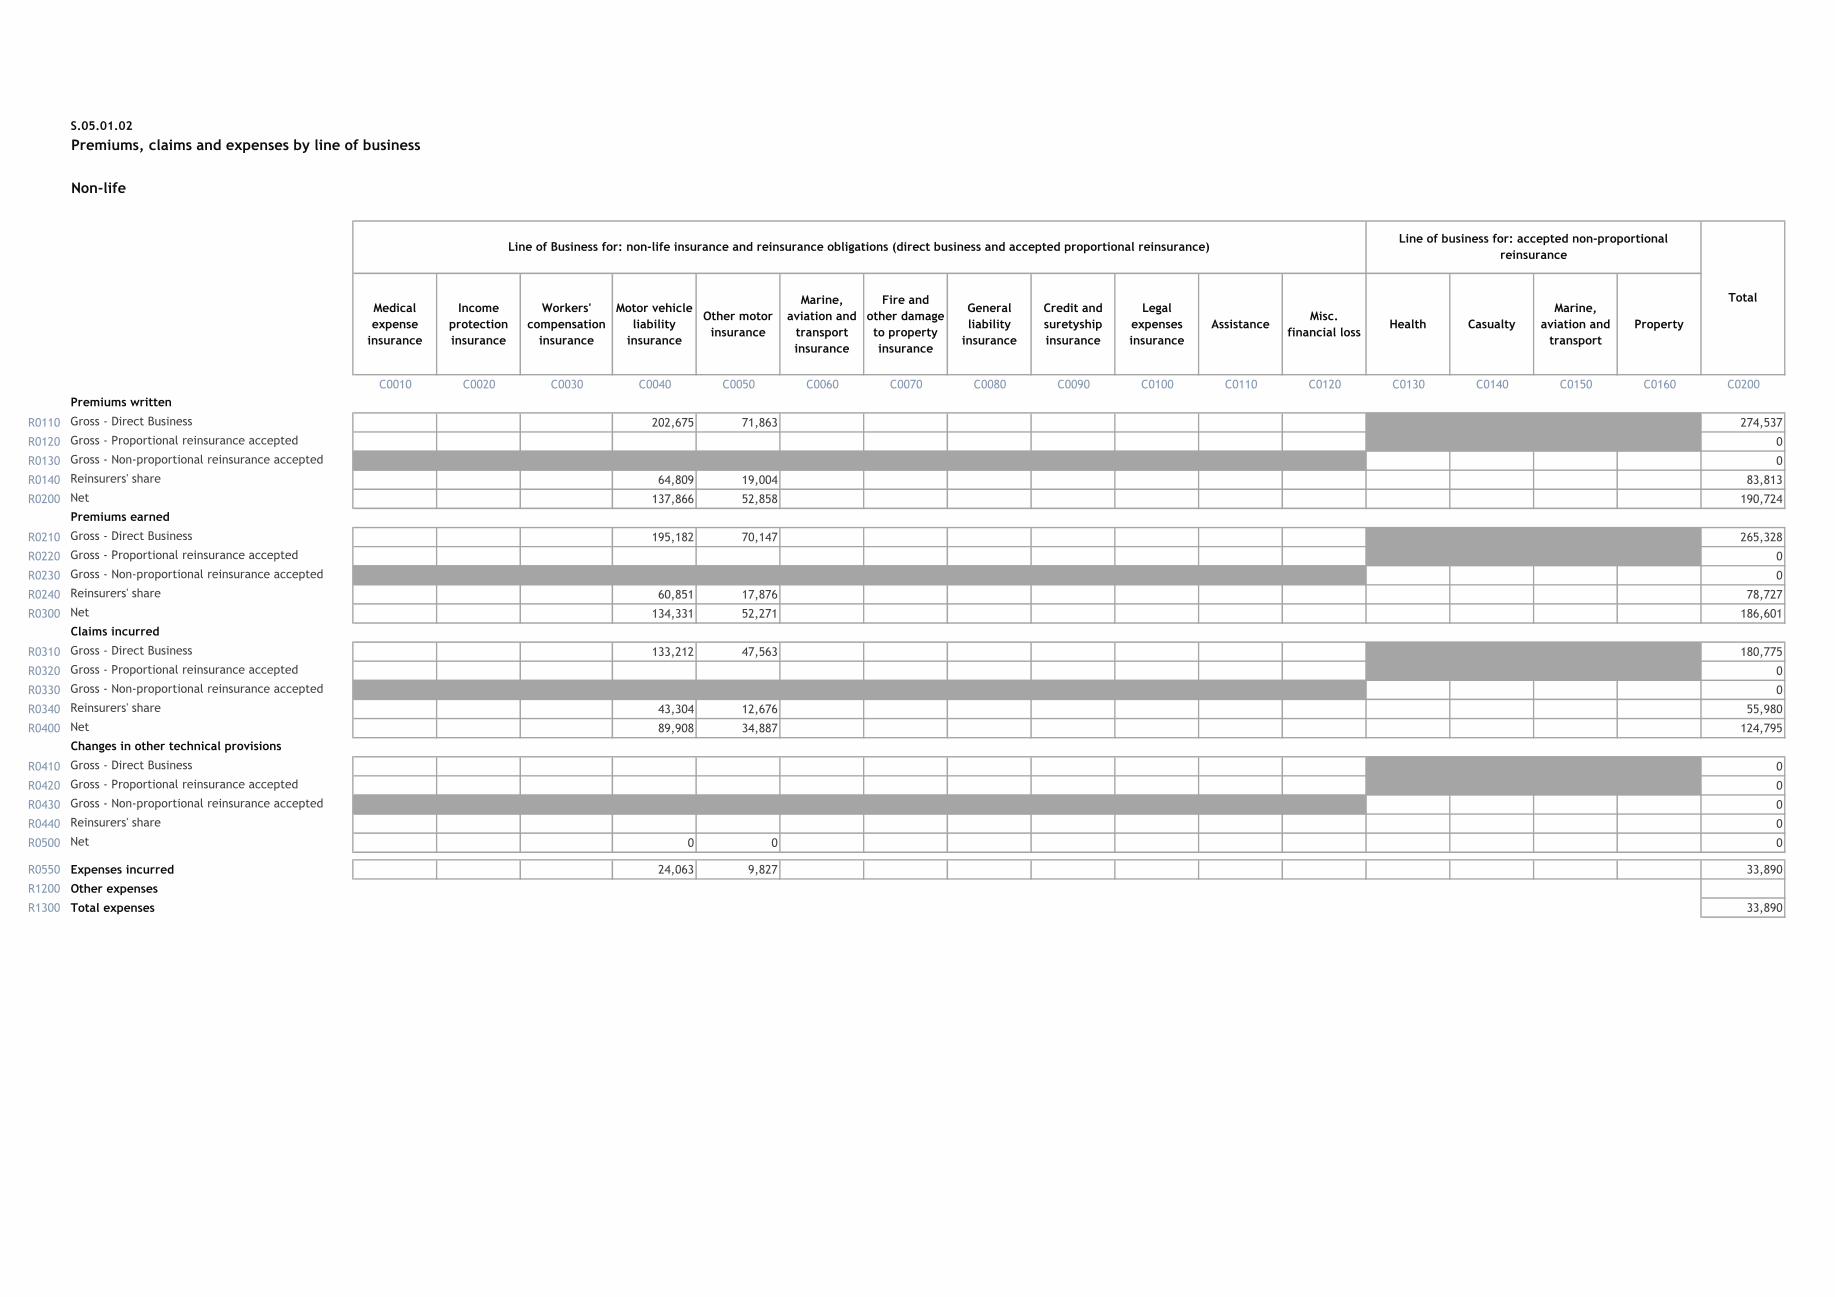
S.05.01.02
Non-life
Medical
expense
insurance
Income
protection
insurance
Workers'
compensation
insurance
Motor vehicle
liability
insurance
Other motor
insurance
Marine,
aviation and
transport
insurance
Fire and
other damage
to property
insurance
General
liability
insurance
Credit and
suretyship
insurance
Legal
expenses
insurance
AssistanceMisc.
financial lossHealth Casualty
Marine,
aviation and
transport
Property
C0010 C0020 C0030 C0040 C0050 C0060 C0070 C0080 C0090 C0100 C0110 C0120 C0130 C0140 C0150 C0160 C0200
Premiums written
R0110 Gross - Direct Business 202,675 71,863 274,537
R0120 Gross - Proportional reinsurance accepted 0
R0130 Gross - Non-proportional reinsurance accepted 0
R0140 Reinsurers' share 64,809 19,004 83,813
R0200 Net 137,866 52,858 190,724
Premiums earned
R0210 Gross - Direct Business 195,182 70,147 265,328
R0220 Gross - Proportional reinsurance accepted 0
R0230 Gross - Non-proportional reinsurance accepted 0
R0240 Reinsurers' share 60,851 17,876 78,727
R0300 Net 134,331 52,271 186,601
Claims incurred
R0310 Gross - Direct Business 133,212 47,563 180,775
R0320 Gross - Proportional reinsurance accepted 0
R0330 Gross - Non-proportional reinsurance accepted 0
R0340 Reinsurers' share 43,304 12,676 55,980
R0400 Net 89,908 34,887 124,795
Changes in other technical provisions
R0410 Gross - Direct Business 0
R0420 Gross - Proportional reinsurance accepted 0
R0430 Gross - Non-proportional reinsurance accepted 0
R0440 Reinsurers' share 0
R0500 Net 0 0 0
R0550 Expenses incurred 24,063 9,827 33,890
R1200 Other expenses
R1300 Total expenses 33,890
Premiums, claims and expenses by line of business
Line of Business for: non-life insurance and reinsurance obligations (direct business and accepted proportional reinsurance)Line of business for: accepted non-proportional
reinsurance
Total

S.05.01.02
Life
Health
insurance
Insurance with
profit
participation
Index-linked
and unit-
linked
insurance
Other life
insurance
Annuities
stemming from
non-life insurance
contracts and
relating to health
insurance
obligations
Annuities
stemming from
non-life insurance
contracts and
relating to
insurance
obligations other
than health
insurance
obligations
Health
reinsurance
Life
reinsurance
C0210 C0220 C0230 C0240 C0250 C0260 C0270 C0280 C0300
Premiums written
R1410 Gross 0
R1420 Reinsurers' share 0
R1500 Net 0 0 0
Premiums earned
R1510 Gross 0
R1520 Reinsurers' share 0
R1600 Net 0 0 0
Claims incurred
R1610 Gross 1,241 1,241
R1620 Reinsurers' share 397 397
R1700 Net 844 0 844
Changes in other technical provisions
R1710 Gross 0
R1720 Reinsurers' share 0
R1800 Net 0 0 0
R1900 Expenses incurred 34 0 34
R2500 Other expenses
R2600 Total expenses 34
Premiums, claims and expenses by line of business
Line of Business for: life insurance obligations Life reinsurance obligations
Total

S.05.02.01
Premiums, claims and expenses by country
Non-life
C0010 C0020 C0030 C0040 C0050 C0060 C0070
R0010 IT ES
C0080 C0090 C0100 C0110 C0120 C0130 C0140
Premiums written
R0110 Gross - Direct Business 151,731 69,494 53,312 274,537
R0120 Gross - Proportional reinsurance accepted 0
R0130 Gross - Non-proportional reinsurance accepted 0
R0140 Reinsurers' share 3,271 42,620 37,923 83,813
R0200 Net 148,460 26,874 15,390 0 0 0 190,724
Premiums earned
R0210 Gross - Direct Business 150,294 65,071 49,963 265,328
R0220 Gross - Proportional reinsurance accepted 0
R0230 Gross - Non-proportional reinsurance accepted 0
R0240 Reinsurers' share 3,314 39,911 35,503 78,727
R0300 Net 146,980 25,160 14,460 0 0 0 186,601
Claims incurred
R0310 Gross - Direct Business 94,589 47,416 38,771 180,775
R0320 Gross - Proportional reinsurance accepted 0
R0330 Gross - Non-proportional reinsurance accepted 0
R0340 Reinsurers' share -601 29,415 27,166 55,980
R0400 Net 95,189 18,001 11,604 0 0 0 124,795
Changes in other technical provisions
R0410 Gross - Direct Business 0 0 0 0
R0420 Gross - Proportional reinsurance accepted 0
R0430 Gross - Non-proportional reinsurance accepted 0
R0440 Reinsurers' share 0 0 0 0
R0500 Net 0 0 0 0 0 0 0
R0550 Expenses incurred 26,150 3,763 3,978 33,890
R1200 Other expenses
R1300 Total expenses 33,890
Home Country
Top 5 countries (by amount of gross premiums written) -
non-life obligations
Top 5 countries (by amount of gross
premiums written) - non-life
obligations Total Top 5 and
home country
S.05.02.01
Premiums, claims and expenses by country
Life
C0150 C0160 C0170 C0180 C0190 C0200 C0210
R1400
C0220 C0230 C0240 C0250 C0260 C0270 C0280
Premiums written
R1410 Gross 0
R1420 Reinsurers' share 0
R1500 Net 0 0 0 0 0 0 0
Premiums earned
R1510 Gross 0
R1520 Reinsurers' share 0
R1600 Net 0 0 0 0 0 0 0
Claims incurred
R1610 Gross 1,241 0 0 1,241
R1620 Reinsurers' share 397 0 0 397
R1700 Net 844 0 0 0 0 0 844
Changes in other technical provisions
R1710 Gross 0
R1720 Reinsurers' share 0
R1800 Net 0 0 0 0 0 0 0
R1900 Expenses incurred 34 34
R2500 Other expenses
R2600 Total expenses 34
Home Country
Top 5 countries (by amount of gross premiums written) - life
obligations
Top 5 countries (by amount of gross
premiums written) - life obligations Total Top 5 and
home country

S.12.01.02
Life and Health SLT Technical Provisions
Contracts
without
options and
guarantees
Contracts
with options
or guarantees
Contracts
without
options and
guarantees
Contracts
with options
or guarantees
Contracts
without
options and
guarantees
Contracts
with options
or
guarantees
C0020 C0030 C0040 C0050 C0060 C0070 C0080 C0090 C0100 C0150 C0160 C0170 C0180 C0190 C0200 C0210
R0010 Technical provisions calculated as a whole 0
R0020
Total Recoverables from reinsurance/SPV and Finite Re after
the adjustment for expected losses due to counterparty default
associated to TP calculated as a whole 0
Technical provisions calculated as a sum of BE and RM
Best estimate
R0030 Gross Best Estimate 6,312 6,312
R0080
Total Recoverables from reinsurance/SPV and Finite Re after
the adjustment for expected losses due to counterparty default 1,852 1,852
R0090Best estimate minus recoverables from reinsurance/SPV
and Finite Re4,459 4,459
R0100 Risk margin 229 229
Amount of the transitional on Technical Provisions
R0110 Technical Provisions calculated as a whole 0
R0120 Best estimate 0
R0130 Risk margin 0
R0200 Technical provisions - total 6,541 6,541
Health insurance (direct business)
Annuities
stemming from
non-life
insurance
contracts and
relating to
health
insurance
obligations
Health
reinsurance
(reinsurance
accepted)
Total (Health
similar to life
insurance)
Insurance
with profit
participation
Index-linked and unit-linked insurance Other life insurance Annuities
stemming from
non-life
insurance
contracts and
relating to
insurance
obligation other
than health
insurance
obligations
Accepted
reinsurance
Total
(Life other
than health
insurance,
including
Unit-Linked)

S.17.01.02
Non-Life Technical Provisions
Medical
expense
insurance
Income
protection
insurance
Workers'
compensation
insurance
Motor vehicle
liability
insurance
Other motor
insurance
Marine,
aviation and
transport
insurance
Fire and other
damage to
property
insurance
General
liability
insurance
Credit and
suretyship
insurance
Legal expenses
insuranceAssistance
Miscellaneous
financial loss
Non-
proportional
health
reinsurance
Non-
proportional
casualty
reinsurance
Non-
proportional
marine,
aviation and
transport
reinsurance
Non-
proportional
property
reinsurance
C0020 C0030 C0040 C0050 C0060 C0070 C0080 C0090 C0100 C0110 C0120 C0130 C0140 C0150 C0160 C0170 C0180
R0010 Technical provisions calculated as a whole 0 0 0
R0050
Total Recoverables from reinsurance/SPV and Finite Re after
the adjustment for expected losses due to counterparty default
associated to TP calculated as a whole
0
Technical provisions calculated as a sum of BE and RM
Best estimate
Premium provisions
R0060 Gross 79,730 24,318 104,048
R0140
Total recoverable from reinsurance/SPV and Finite Re
after the adjustment for expected losses due to
counterparty default
30,754 8,331 39,085
R0150 Net Best Estimate of Premium Provisions 48,976 15,987 64,963
Claims provisions
R0160 Gross 300,572 7,758 308,330
R0240
Total recoverable from reinsurance/SPV and Finite Re
after the adjustment for expected losses due to
counterparty default
83,106 7,012 90,118
R0250 Net Best Estimate of Claims Provisions 217,466 746 218,212
R0260 Total best estimate - gross 380,302 32,076 412,378
R0270 Total best estimate - net 266,442 16,733 283,175
R0280 Risk margin 14,089 885 14,974
Amount of the transitional on Technical Provisions
R0290 Technical Provisions calculated as a whole 0
R0300 Best estimate 0
R0310 Risk margin 0
R0320 Technical provisions - total 394,392 32,961 427,353
R0330
Recoverable from reinsurance contract/SPV and
Finite Re after the adjustment for expected losses due to
counterparty default - total
113,860 15,343 129,203
R0340Technical provisions minus recoverables from
reinsurance/SPV and Finite Re - total280,532 17,618 298,150
Direct business and accepted proportional reinsurance Accepted non-proportional reinsurance
Total Non-Life
obligation
S.19.01.21
Non-Life insurance claims
Total Non-life business
Z0020 Accident year / underwriting year
Gross Claims Paid (non-cumulative)
(absolute amount)
C0010 C0020 C0030 C0040 C0050 C0060 C0070 C0080 C0090 C0100 C0110 C0170 C0180
Year
0 1 2 3 4 5 6 7 8 9 10 & +
R0100 Prior 150 150 150
R0160 2009 12,741 27,933 7,518 3,898 3,149 1,785 387 706 122 113 113 58,354
R0170 2010 16,566 36,825 10,101 6,126 3,723 1,791 757 602 403 403 76,894
R0180 2011 21,607 43,771 12,050 6,445 4,246 3,841 1,437 915 915 94,312
R0190 2012 21,672 43,851 12,597 5,868 5,183 2,577 2,074 2,074 93,823
R0200 2013 20,049 46,150 13,691 7,953 4,280 3,449 3,449 95,572
R0210 2014 23,613 48,847 15,736 8,286 8,499 8,499 104,981
R0220 2015 22,465 49,120 14,616 7,669 7,669 93,870
R0230 2016 27,649 56,868 14,732 14,732 99,249
R0240 2017 31,314 66,397 66,397 97,711
R0250 2018 35,956 35,956 35,956
R0260 Total 140,357 850,872
Gross Undiscounted Best Estimate Claims Provisions
(absolute amount)
C0360
C0200 C0210 C0220 C0230 C0240 C0250 C0260 C0270 C0280 C0290 C0300
Year
0 1 2 3 4 5 6 7 8 9 10 & +
R0100 Prior 4,213 4,297
R0160 2009 0 0 0 0 0 0 0 3,581 2,230 2,389 1,972
R0170 2010 0 0 0 0 0 0 7,144 4,600 4,826 4,346
R0180 2011 0 0 0 0 0 15,841 9,702 6,896 6,707
R0190 2012 0 0 0 0 24,729 13,790 11,435 9,057
R0200 2013 0 0 0 34,290 21,776 14,718 13,329
R0210 2014 0 0 60,216 39,203 23,486 22,483
R0220 2015 0 86,992 46,645 34,659 33,329
R0230 2016 67,044 81,006 55,753 51,870
R0240 2017 70,069 100,034 91,934
R0250 2018 73,250 69,006
R0260 Total 308,330
Underwriting Year
Development year In Current
year
Sum of years
(cumulative)
Year end
(discounted
data)
Development year
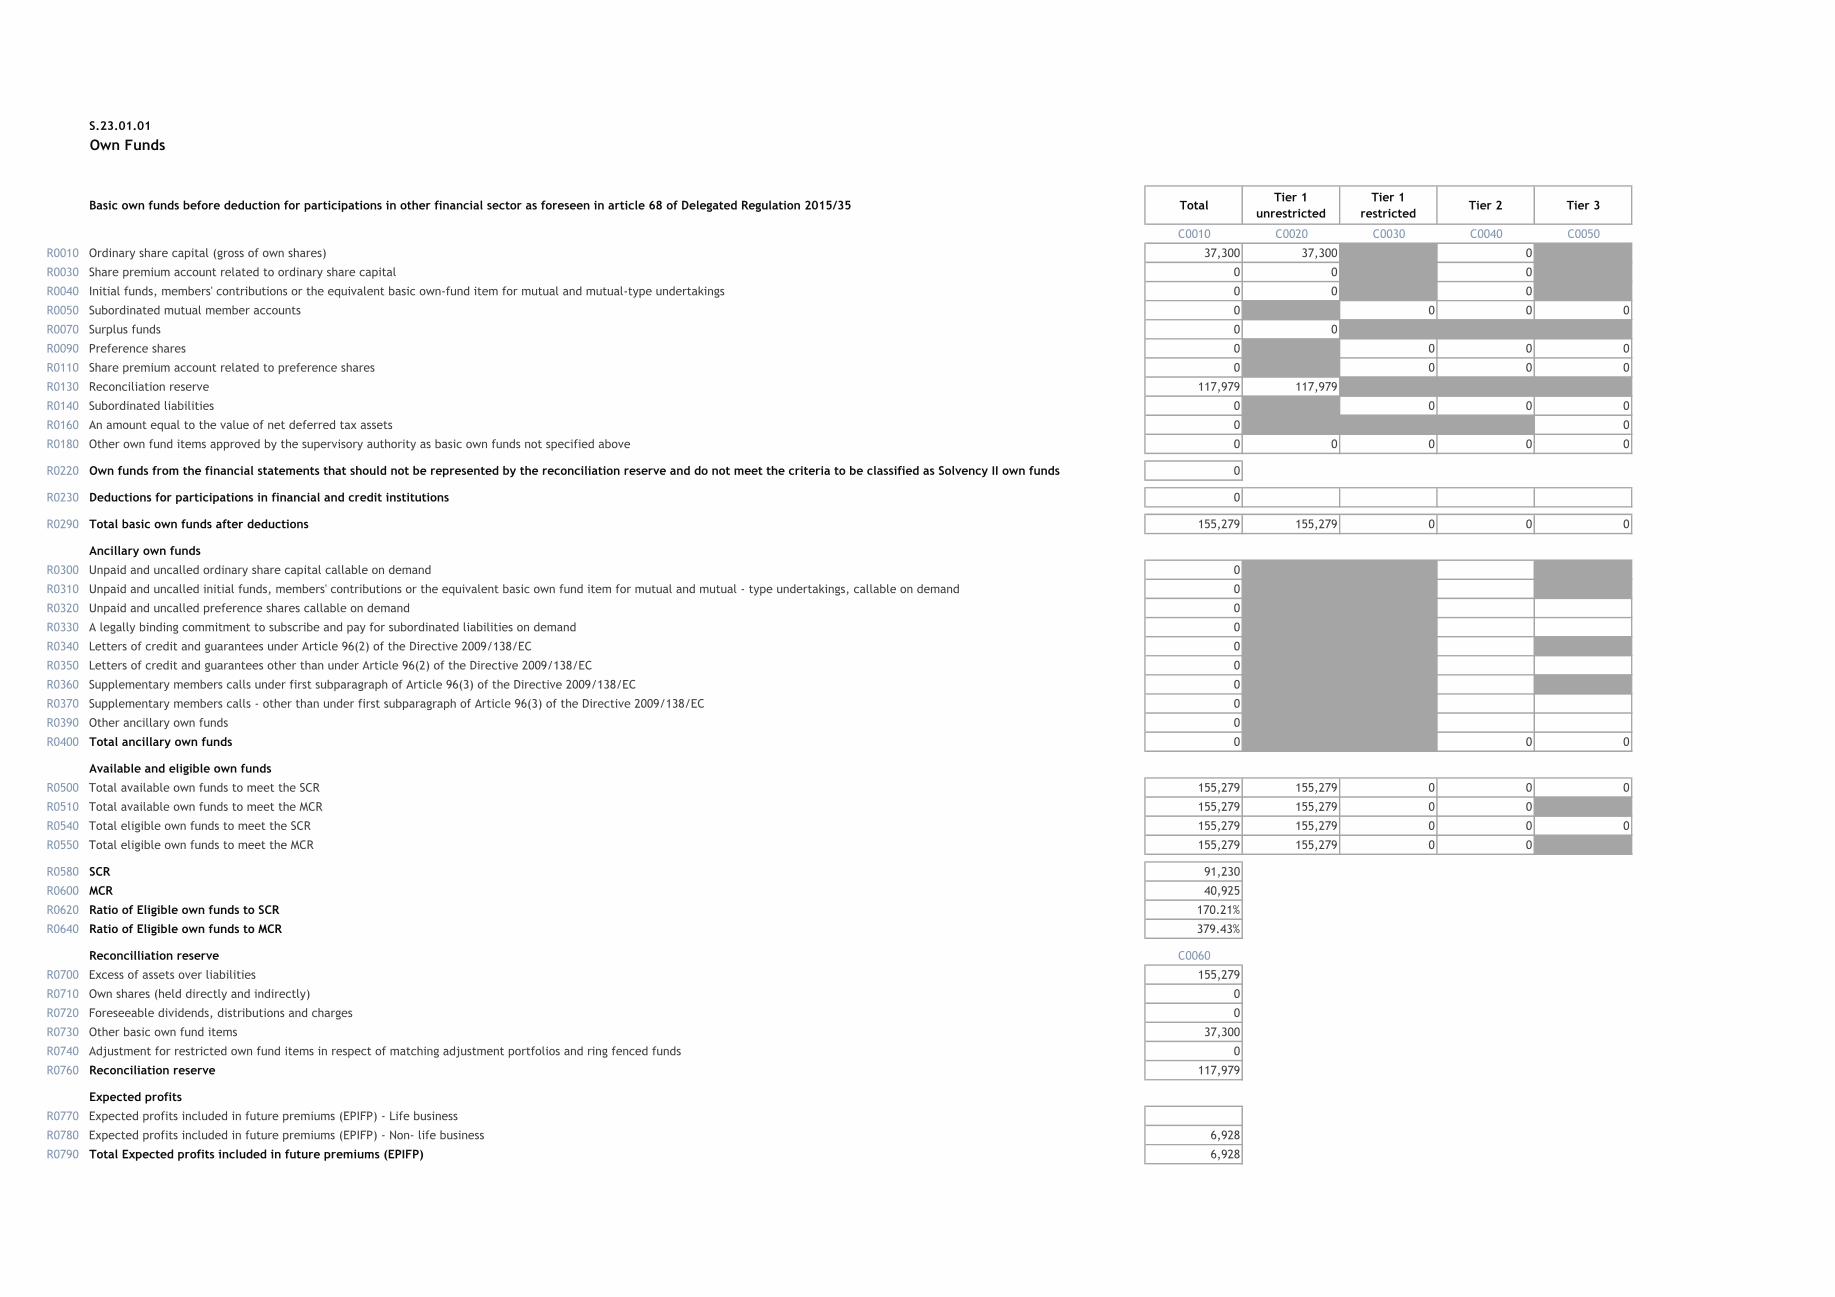
S.23.01.01
Own Funds
Basic own funds before deduction for participations in other financial sector as foreseen in article 68 of Delegated Regulation 2015/35 TotalTier 1
unrestricted
Tier 1
restrictedTier 2 Tier 3
C0010 C0020 C0030 C0040 C0050
R0010 Ordinary share capital (gross of own shares) 37,300 37,300 0
R0030 Share premium account related to ordinary share capital 0 0 0
R0040 Initial funds, members' contributions or the equivalent basic own-fund item for mutual and mutual-type undertakings 0 0 0
R0050 Subordinated mutual member accounts 0 0 0 0
R0070 Surplus funds 0 0
R0090 Preference shares 0 0 0 0
R0110 Share premium account related to preference shares 0 0 0 0
R0130 Reconciliation reserve 117,979 117,979
R0140 Subordinated liabilities 0 0 0 0
R0160 An amount equal to the value of net deferred tax assets 0 0
R0180 Other own fund items approved by the supervisory authority as basic own funds not specified above 0 0 0 0 0
R0220 Own funds from the financial statements that should not be represented by the reconciliation reserve and do not meet the criteria to be classified as Solvency II own funds 0
R0230 Deductions for participations in financial and credit institutions 0
R0290 Total basic own funds after deductions 155,279 155,279 0 0 0
Ancillary own funds
R0300 Unpaid and uncalled ordinary share capital callable on demand 0
R0310 Unpaid and uncalled initial funds, members' contributions or the equivalent basic own fund item for mutual and mutual - type undertakings, callable on demand 0
R0320 Unpaid and uncalled preference shares callable on demand 0
R0330 A legally binding commitment to subscribe and pay for subordinated liabilities on demand 0
R0340 Letters of credit and guarantees under Article 96(2) of the Directive 2009/138/EC 0
R0350 Letters of credit and guarantees other than under Article 96(2) of the Directive 2009/138/EC 0
R0360 Supplementary members calls under first subparagraph of Article 96(3) of the Directive 2009/138/EC 0
R0370 Supplementary members calls - other than under first subparagraph of Article 96(3) of the Directive 2009/138/EC 0
R0390 Other ancillary own funds 0
R0400 Total ancillary own funds 0 0 0
Available and eligible own funds
R0500 Total available own funds to meet the SCR 155,279 155,279 0 0 0
R0510 Total available own funds to meet the MCR 155,279 155,279 0 0
R0540 Total eligible own funds to meet the SCR 155,279 155,279 0 0 0
R0550 Total eligible own funds to meet the MCR 155,279 155,279 0 0
R0580 SCR 91,230
R0600 MCR 40,925
R0620 Ratio of Eligible own funds to SCR 170.21%
R0640 Ratio of Eligible own funds to MCR 379.43%
Reconcilliation reserve C0060
R0700 Excess of assets over liabilities 155,279
R0710 Own shares (held directly and indirectly) 0
R0720 Foreseeable dividends, distributions and charges 0
R0730 Other basic own fund items 37,300
R0740 Adjustment for restricted own fund items in respect of matching adjustment portfolios and ring fenced funds 0
R0760 Reconciliation reserve 117,979
Expected profits
R0770 Expected profits included in future premiums (EPIFP) - Life business
R0780 Expected profits included in future premiums (EPIFP) - Non- life business 6,928
R0790 Total Expected profits included in future premiums (EPIFP) 6,928
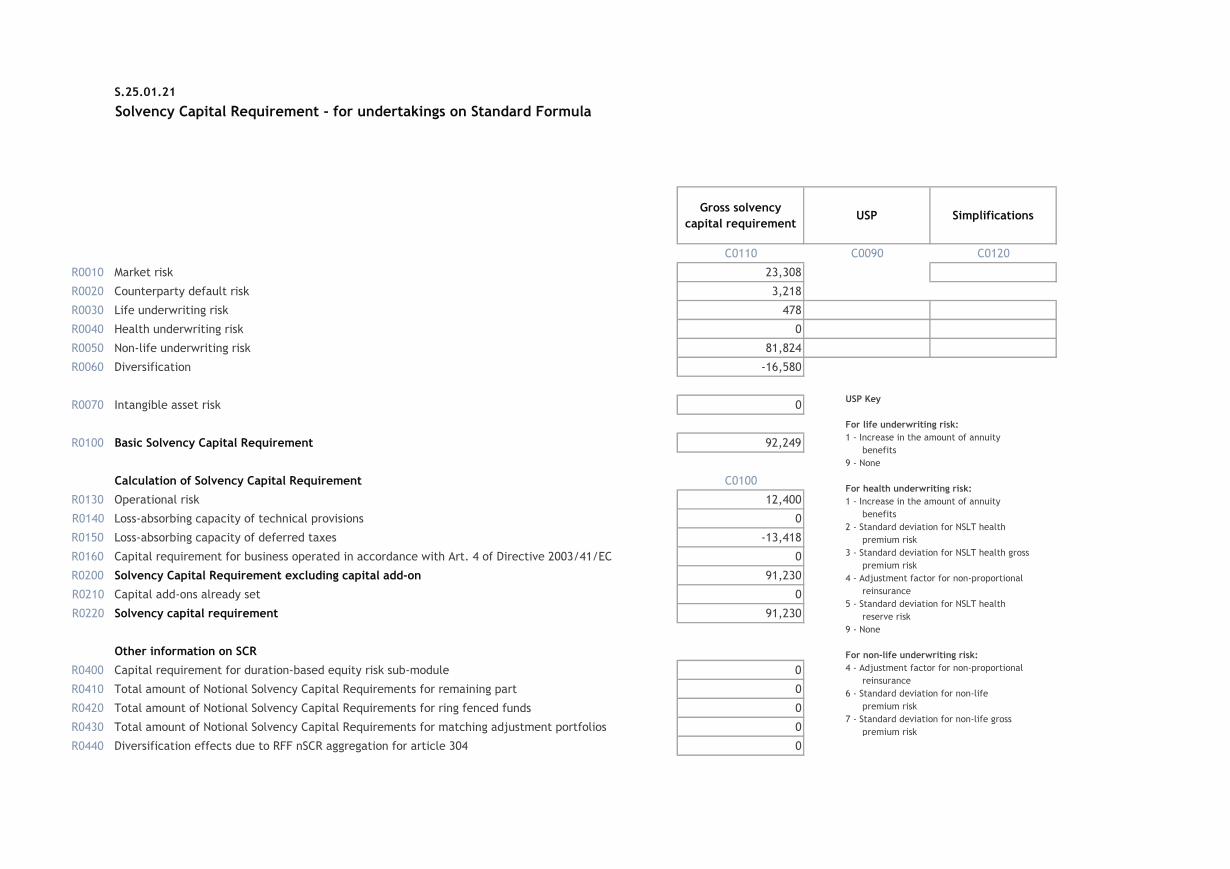
S.25.01.21
Solvency Capital Requirement - for undertakings on Standard Formula
Gross solvency
capital requirementUSP Simplifications
C0110 C0090 C0120
R0010 Market risk 23,308
R0020 Counterparty default risk 3,218
R0030 Life underwriting risk 478
R0040 Health underwriting risk 0
R0050 Non-life underwriting risk 81,824
R0060 Diversification -16,580
R0070 Intangible asset risk 0
R0100 Basic Solvency Capital Requirement 92,249
Calculation of Solvency Capital Requirement C0100
R0130 Operational risk 12,400
R0140 Loss-absorbing capacity of technical provisions 0
R0150 Loss-absorbing capacity of deferred taxes -13,418
R0160 Capital requirement for business operated in accordance with Art. 4 of Directive 2003/41/EC 0
R0200 Solvency Capital Requirement excluding capital add-on 91,230
R0210 Capital add-ons already set 0
R0220 Solvency capital requirement 91,230
Other information on SCR
R0400 Capital requirement for duration-based equity risk sub-module 0
R0410 Total amount of Notional Solvency Capital Requirements for remaining part 0
R0420 Total amount of Notional Solvency Capital Requirements for ring fenced funds 0
R0430 Total amount of Notional Solvency Capital Requirements for matching adjustment portfolios 0
R0440 Diversification effects due to RFF nSCR aggregation for article 304 0
USP Key
For life underwriting risk:
1 - Increase in the amount of annuity
benefits
9 - None
For health underwriting risk:
1 - Increase in the amount of annuity
benefits
2 - Standard deviation for NSLT health
premium risk
3 - Standard deviation for NSLT health gross
premium risk
4 - Adjustment factor for non-proportional
reinsurance
5 - Standard deviation for NSLT health
reserve risk
9 - None
For non-life underwriting risk:
4 - Adjustment factor for non-proportional
reinsurance
6 - Standard deviation for non-life
premium risk
7 - Standard deviation for non-life gross
premium risk
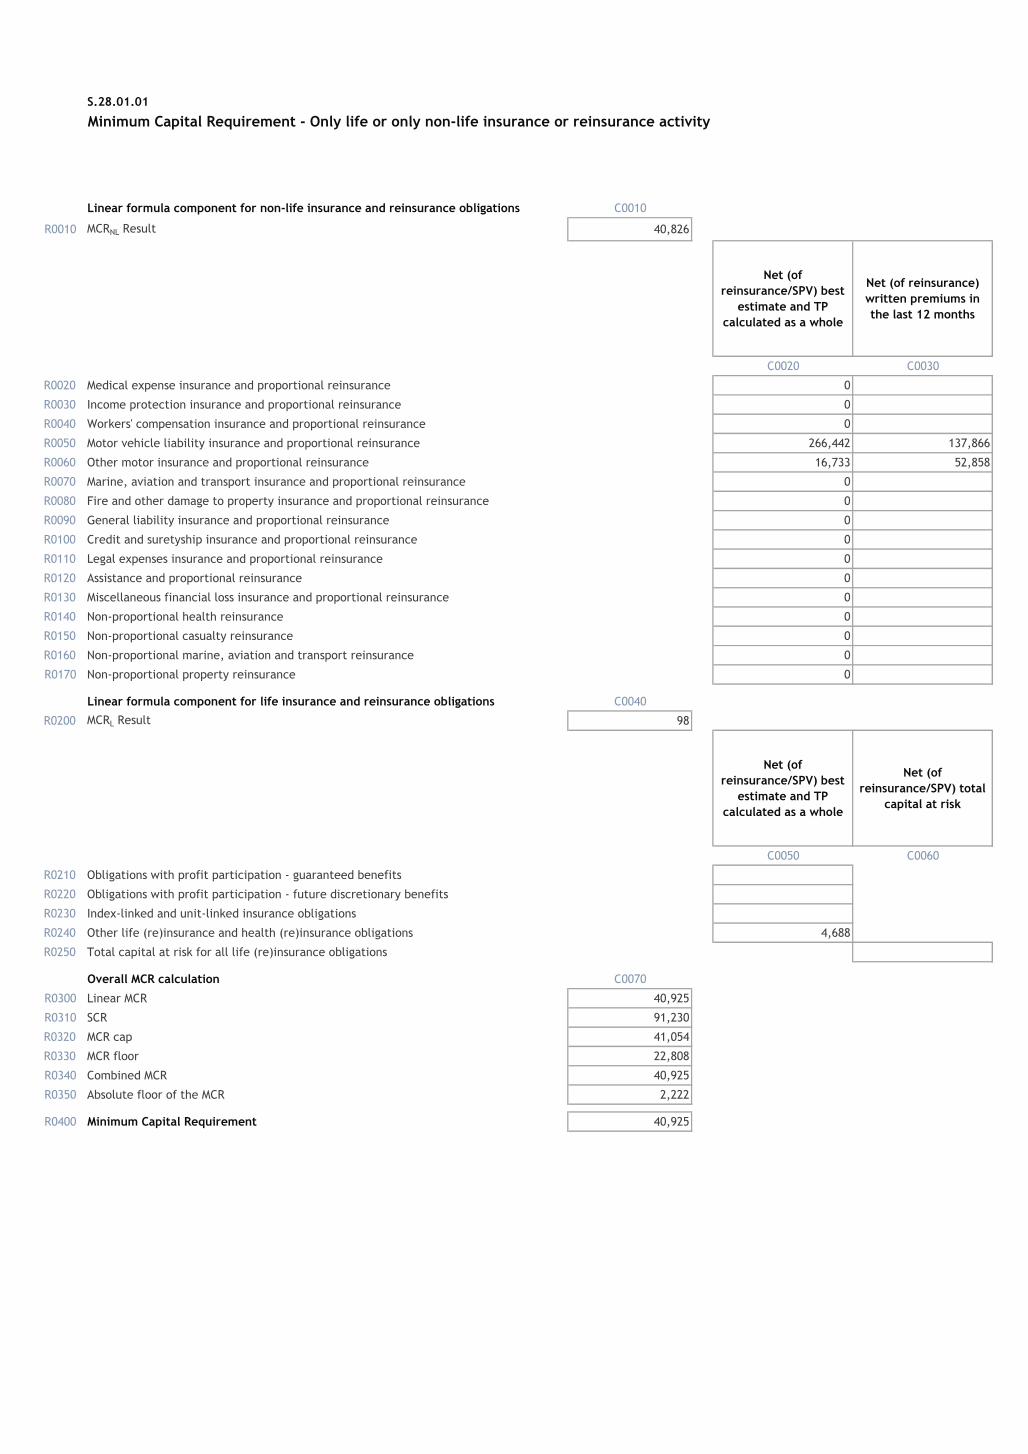
S.28.01.01
Minimum Capital Requirement - Only life or only non-life insurance or reinsurance activity
Linear formula component for non-life insurance and reinsurance obligations C0010
R0010 MCRNL Result 40,826
Net (of
reinsurance/SPV) best
estimate and TP
calculated as a whole
Net (of reinsurance)
written premiums in
the last 12 months
C0020 C0030
R0020 Medical expense insurance and proportional reinsurance 0
R0030 Income protection insurance and proportional reinsurance 0
R0040 Workers' compensation insurance and proportional reinsurance 0
R0050 Motor vehicle liability insurance and proportional reinsurance 266,442 137,866
R0060 Other motor insurance and proportional reinsurance 16,733 52,858
R0070 Marine, aviation and transport insurance and proportional reinsurance 0
R0080 Fire and other damage to property insurance and proportional reinsurance 0
R0090 General liability insurance and proportional reinsurance 0
R0100 Credit and suretyship insurance and proportional reinsurance 0
R0110 Legal expenses insurance and proportional reinsurance 0
R0120 Assistance and proportional reinsurance 0
R0130 Miscellaneous financial loss insurance and proportional reinsurance 0
R0140 Non-proportional health reinsurance 0
R0150 Non-proportional casualty reinsurance 0
R0160 Non-proportional marine, aviation and transport reinsurance 0
R0170 Non-proportional property reinsurance 0
Linear formula component for life insurance and reinsurance obligations C0040
R0200 MCRL Result 98
Net (of
reinsurance/SPV) best
estimate and TP
calculated as a whole
Net (of
reinsurance/SPV) total
capital at risk
C0050 C0060
R0210 Obligations with profit participation - guaranteed benefits
R0220 Obligations with profit participation - future discretionary benefits
R0230 Index-linked and unit-linked insurance obligations
R0240 Other life (re)insurance and health (re)insurance obligations 4,688
R0250 Total capital at risk for all life (re)insurance obligations
Overall MCR calculation C0070
R0300 Linear MCR 40,925
R0310 SCR 91,230
R0320 MCR cap 41,054
R0330 MCR floor 22,808
R0340 Combined MCR 40,925
R0350 Absolute floor of the MCR 2,222
R0400 Minimum Capital Requirement 40,925
Admiral Insurance
Gibraltar Limited
Solvency and Financial
Condition Report
Disclosures
31 December
2018
(Monetary amounts in GBP thousands)
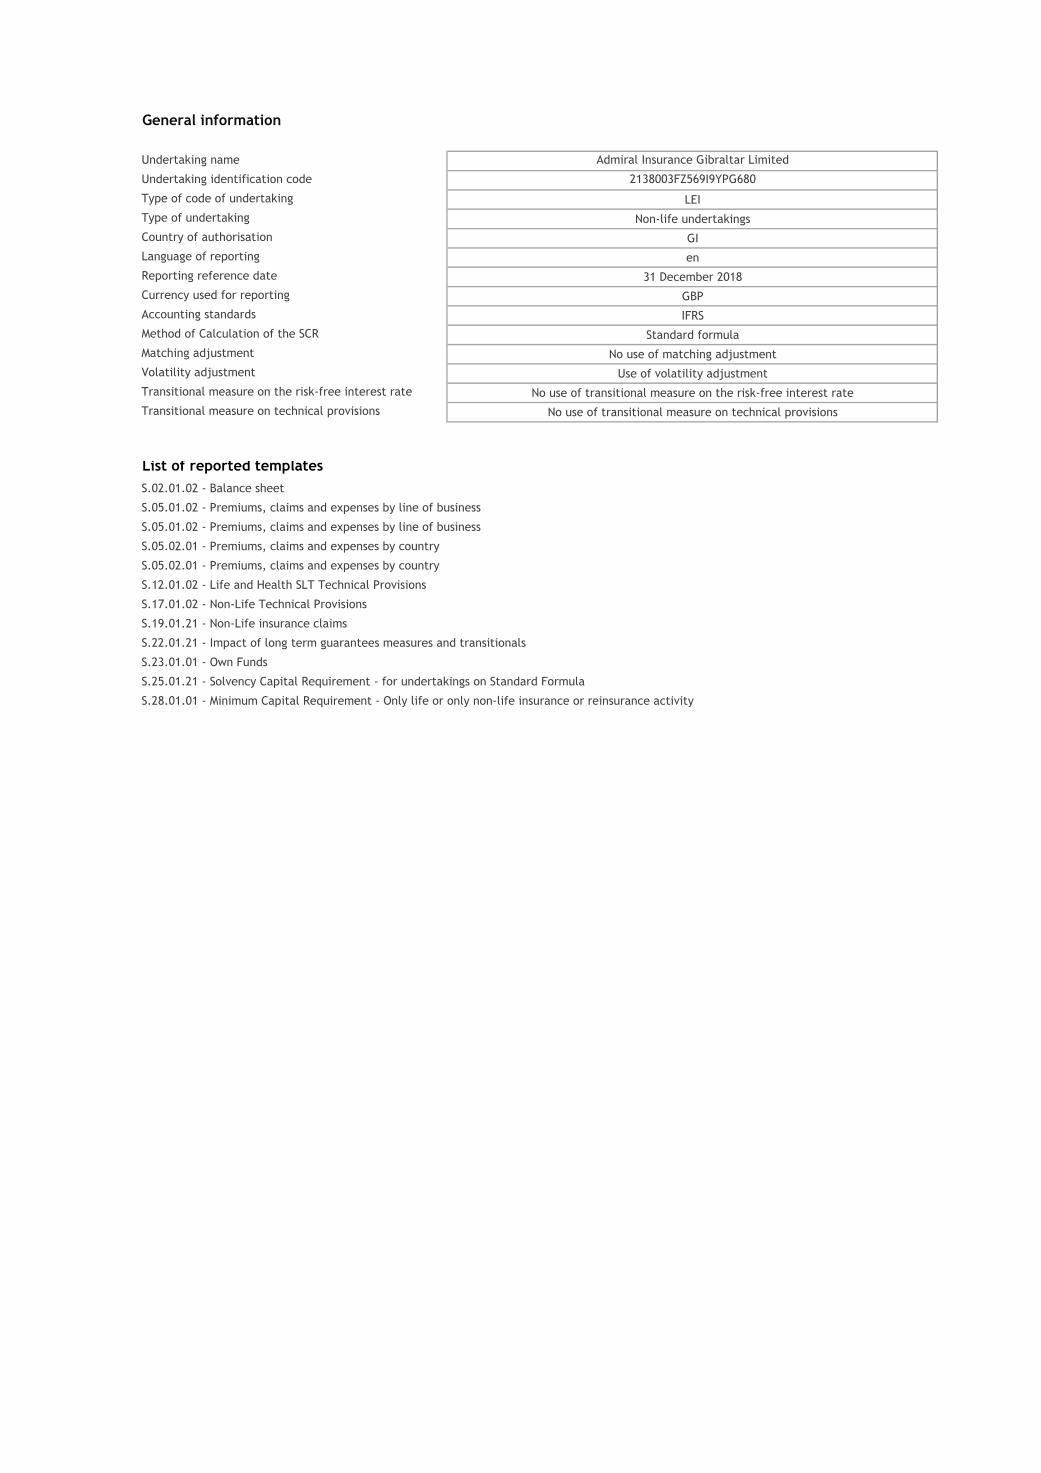
General information
Undertaking name Admiral Insurance Gibraltar Limited
Undertaking identification code 2138003FZ569I9YPG680
Type of code of undertaking LEI
Type of undertaking Non-life undertakings
Country of authorisation GI
Language of reporting en
Reporting reference date 31 December 2018
Currency used for reporting GBP
Accounting standards IFRS
Method of Calculation of the SCR Standard formula
Matching adjustment No use of matching adjustment
Volatility adjustment Use of volatility adjustment
Transitional measure on the risk-free interest rate No use of transitional measure on the risk-free interest rate
Transitional measure on technical provisions No use of transitional measure on technical provisions
List of reported templates
S.02.01.02 - Balance sheet
S.05.01.02 - Premiums, claims and expenses by line of business
S.05.01.02 - Premiums, claims and expenses by line of business
S.05.02.01 - Premiums, claims and expenses by country
S.05.02.01 - Premiums, claims and expenses by country
S.12.01.02 - Life and Health SLT Technical Provisions
S.17.01.02 - Non-Life Technical Provisions
S.19.01.21 - Non-Life insurance claims
S.22.01.21 - Impact of long term guarantees measures and transitionals
S.23.01.01 - Own Funds
S.25.01.21 - Solvency Capital Requirement - for undertakings on Standard Formula
S.28.01.01 - Minimum Capital Requirement - Only life or only non-life insurance or reinsurance activity
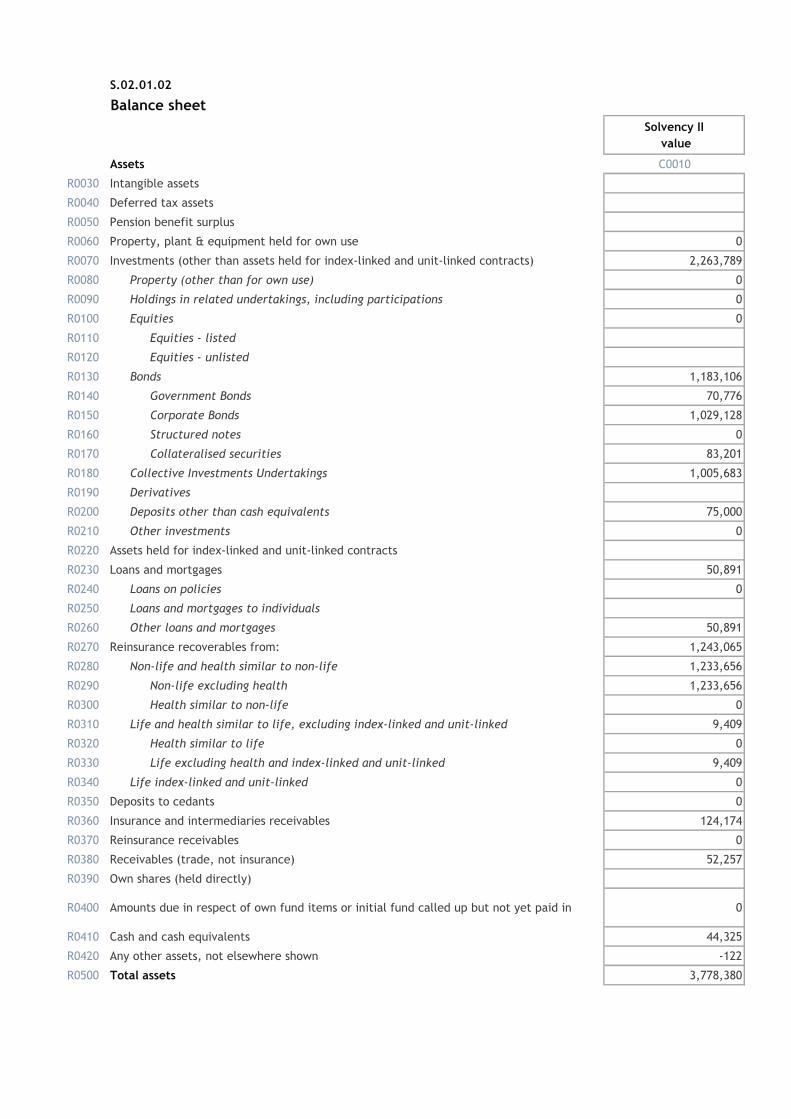
S.02.01.02
Balance sheet
Solvency II
value
Assets C0010
R0030 Intangible assets
R0040 Deferred tax assets
R0050 Pension benefit surplus
R0060 Property, plant & equipment held for own use 0
R0070 Investments (other than assets held for index-linked and unit-linked contracts) 2,263,789
R0080 Property (other than for own use) 0
R0090 Holdings in related undertakings, including participations 0
R0100 Equities 0
R0110 Equities - listed
R0120 Equities - unlisted
R0130 Bonds 1,183,106
R0140 Government Bonds 70,776
R0150 Corporate Bonds 1,029,128
R0160 Structured notes 0
R0170 Collateralised securities 83,201
R0180 Collective Investments Undertakings 1,005,683
R0190 Derivatives
R0200 Deposits other than cash equivalents 75,000
R0210 Other investments 0
R0220 Assets held for index-linked and unit-linked contracts
R0230 Loans and mortgages 50,891
R0240 Loans on policies 0
R0250 Loans and mortgages to individuals
R0260 Other loans and mortgages 50,891
R0270 Reinsurance recoverables from: 1,243,065
R0280 Non-life and health similar to non-life 1,233,656
R0290 Non-life excluding health 1,233,656
R0300 Health similar to non-life 0
R0310 Life and health similar to life, excluding index-linked and unit-linked 9,409
R0320 Health similar to life 0
R0330 Life excluding health and index-linked and unit-linked 9,409
R0340 Life index-linked and unit-linked 0
R0350 Deposits to cedants 0
R0360 Insurance and intermediaries receivables 124,174
R0370 Reinsurance receivables 0
R0380 Receivables (trade, not insurance) 52,257
R0390 Own shares (held directly)
R0400 Amounts due in respect of own fund items or initial fund called up but not yet paid in 0
R0410 Cash and cash equivalents 44,325
R0420 Any other assets, not elsewhere shown -122
R0500 Total assets 3,778,380

S.02.01.02
Balance sheet
Solvency II
value
Liabilities C0010
R0510 Technical provisions - non-life 2,343,815
R0520 Technical provisions - non-life (excluding health) 2,343,815
R0530 TP calculated as a whole 0
R0540 Best Estimate 2,269,684
R0550 Risk margin 74,130
R0560 Technical provisions - health (similar to non-life) 0
R0570 TP calculated as a whole 0
R0580 Best Estimate 0
R0590 Risk margin 0
R0600 Technical provisions - life (excluding index-linked and unit-linked) 35,227
R0610 Technical provisions - health (similar to life) 0
R0620 TP calculated as a whole 0
R0630 Best Estimate 0
R0640 Risk margin 0
R0650 Technical provisions - life (excluding health and index-linked and unit-linked) 35,227
R0660 TP calculated as a whole 0
R0670 Best Estimate 34,131
R0680 Risk margin 1,096
R0690 Technical provisions - index-linked and unit-linked 0
R0700 TP calculated as a whole 0
R0710 Best Estimate 0
R0720 Risk margin 0
R0740 Contingent liabilities 0
R0750 Provisions other than technical provisions
R0760 Pension benefit obligations
R0770 Deposits from reinsurers 743,164
R0780 Deferred tax liabilities 1,542
R0790 Derivatives
R0800 Debts owed to credit institutions
R0810 Financial liabilities other than debts owed to credit institutions
R0820 Insurance & intermediaries payables 108,096
R0830 Reinsurance payables 0
R0840 Payables (trade, not insurance) 128,975
R0850 Subordinated liabilities 0
R0860 Subordinated liabilities not in BOF
R0870 Subordinated liabilities in BOF 0
R0880 Any other liabilities, not elsewhere shown
R0900 Total liabilities 3,360,819
R1000 Excess of assets over liabilities 417,561

S.05.01.02
Non-life
Medical
expense
insurance
Income
protection
insurance
Workers'
compensation
insurance
Motor vehicle
liability
insurance
Other motor
insurance
Marine,
aviation and
transport
insurance
Fire and
other damage
to property
insurance
General
liability
insurance
Credit and
suretyship
insurance
Legal
expenses
insurance
AssistanceMisc.
financial lossHealth Casualty
Marine,
aviation and
transport
Property
C0010 C0020 C0030 C0040 C0050 C0060 C0070 C0080 C0090 C0100 C0110 C0120 C0130 C0140 C0150 C0160 C0200
Premiums written
R0110 Gross - Direct Business 1,071,985 428,937 125,325 1,420 18,418 34,354 1,680,440
R0120 Gross - Proportional reinsurance accepted 0
R0130 Gross - Non-proportional reinsurance accepted 0
R0140 Reinsurers' share 814,668 330,203 90,909 1,030 1,377 260 1,238,446
R0200 Net 257,318 98,734 34,417 390 17,041 34,094 441,994
Premiums earned
R0210 Gross - Direct Business 1,042,423 423,688 113,160 1,283 16,990 30,796 1,628,340
R0220 Gross - Proportional reinsurance accepted 0
R0230 Gross - Non-proportional reinsurance accepted 0
R0240 Reinsurers' share 793,203 326,370 82,317 933 1,183 260 1,204,266
R0300 Net 249,220 97,318 30,843 350 15,807 30,536 424,074
Claims incurred
R0310 Gross - Direct Business 714,699 285,992 95,369 1,081 9,743 19,013 1,125,898
R0320 Gross - Proportional reinsurance accepted 0
R0330 Gross - Non-proportional reinsurance accepted 0
R0340 Reinsurers' share 633,444 259,978 66,881 758 1,183 0 962,244
R0400 Net 81,255 26,014 28,488 323 8,561 19,013 163,654
Changes in other technical provisions
R0410 Gross - Direct Business 0 0 0 0 0 0 0
R0420 Gross - Proportional reinsurance accepted 0
R0430 Gross - Non-proportional reinsurance accepted 0
R0440 Reinsurers' share 0 0 0 0 0 0 0
R0500 Net 0 0 0 0 0 0 0
R0550 Expenses incurred 42,462 16,186 4,877 55 1,118 7,116 71,815
R1200 Other expenses
R1300 Total expenses 71,815
Premiums, claims and expenses by line of business
Line of Business for: non-life insurance and reinsurance obligations (direct business and accepted proportional reinsurance)Line of business for: accepted non-proportional
reinsurance
Total
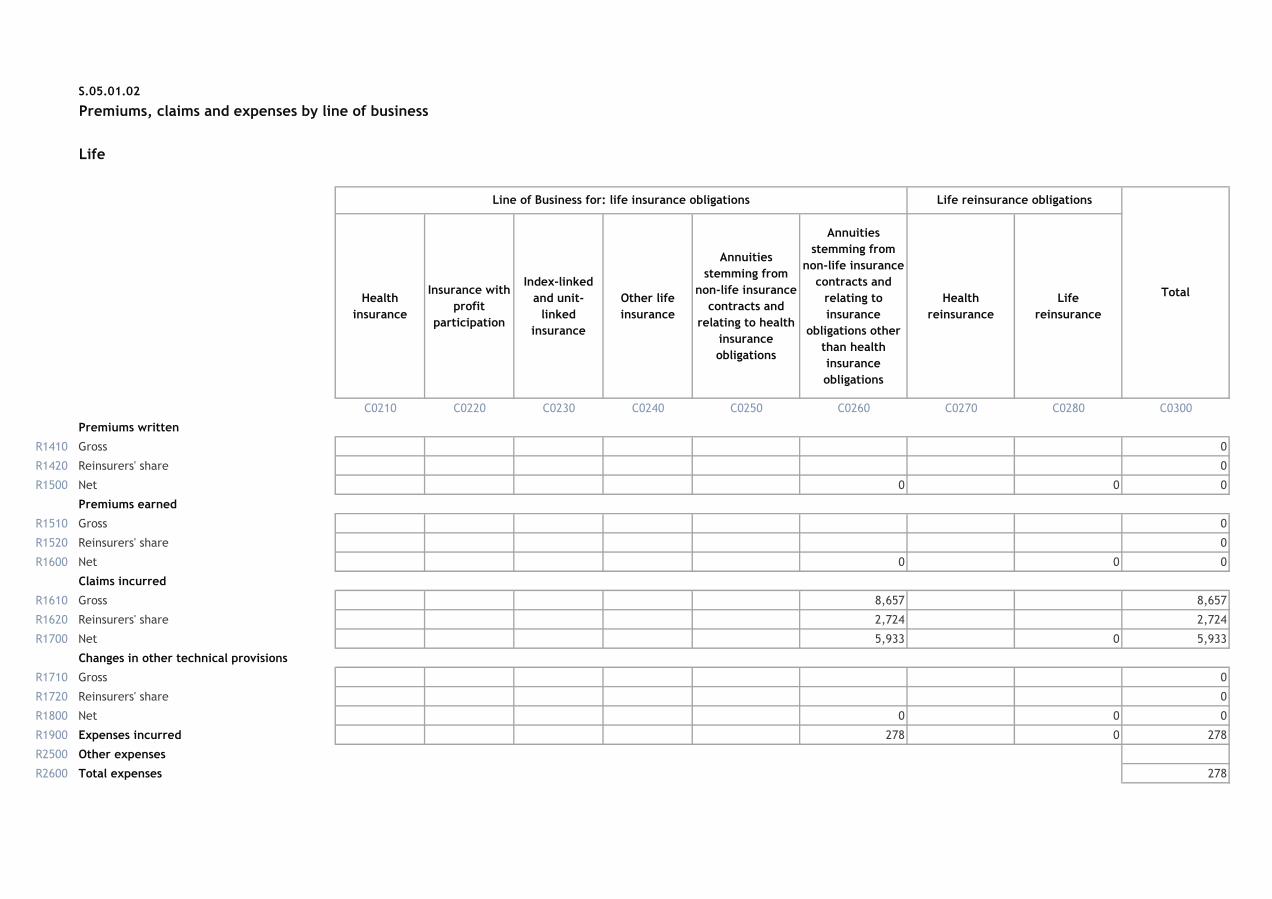
S.05.01.02
Life
Health
insurance
Insurance with
profit
participation
Index-linked
and unit-
linked
insurance
Other life
insurance
Annuities
stemming from
non-life insurance
contracts and
relating to health
insurance
obligations
Annuities
stemming from
non-life insurance
contracts and
relating to
insurance
obligations other
than health
insurance
obligations
Health
reinsurance
Life
reinsurance
C0210 C0220 C0230 C0240 C0250 C0260 C0270 C0280 C0300
Premiums written
R1410 Gross 0
R1420 Reinsurers' share 0
R1500 Net 0 0 0
Premiums earned
R1510 Gross 0
R1520 Reinsurers' share 0
R1600 Net 0 0 0
Claims incurred
R1610 Gross 8,657 8,657
R1620 Reinsurers' share 2,724 2,724
R1700 Net 5,933 0 5,933
Changes in other technical provisions
R1710 Gross 0
R1720 Reinsurers' share 0
R1800 Net 0 0 0
R1900 Expenses incurred 278 0 278
R2500 Other expenses
R2600 Total expenses 278
Premiums, claims and expenses by line of business
Line of Business for: life insurance obligations Life reinsurance obligations
Total
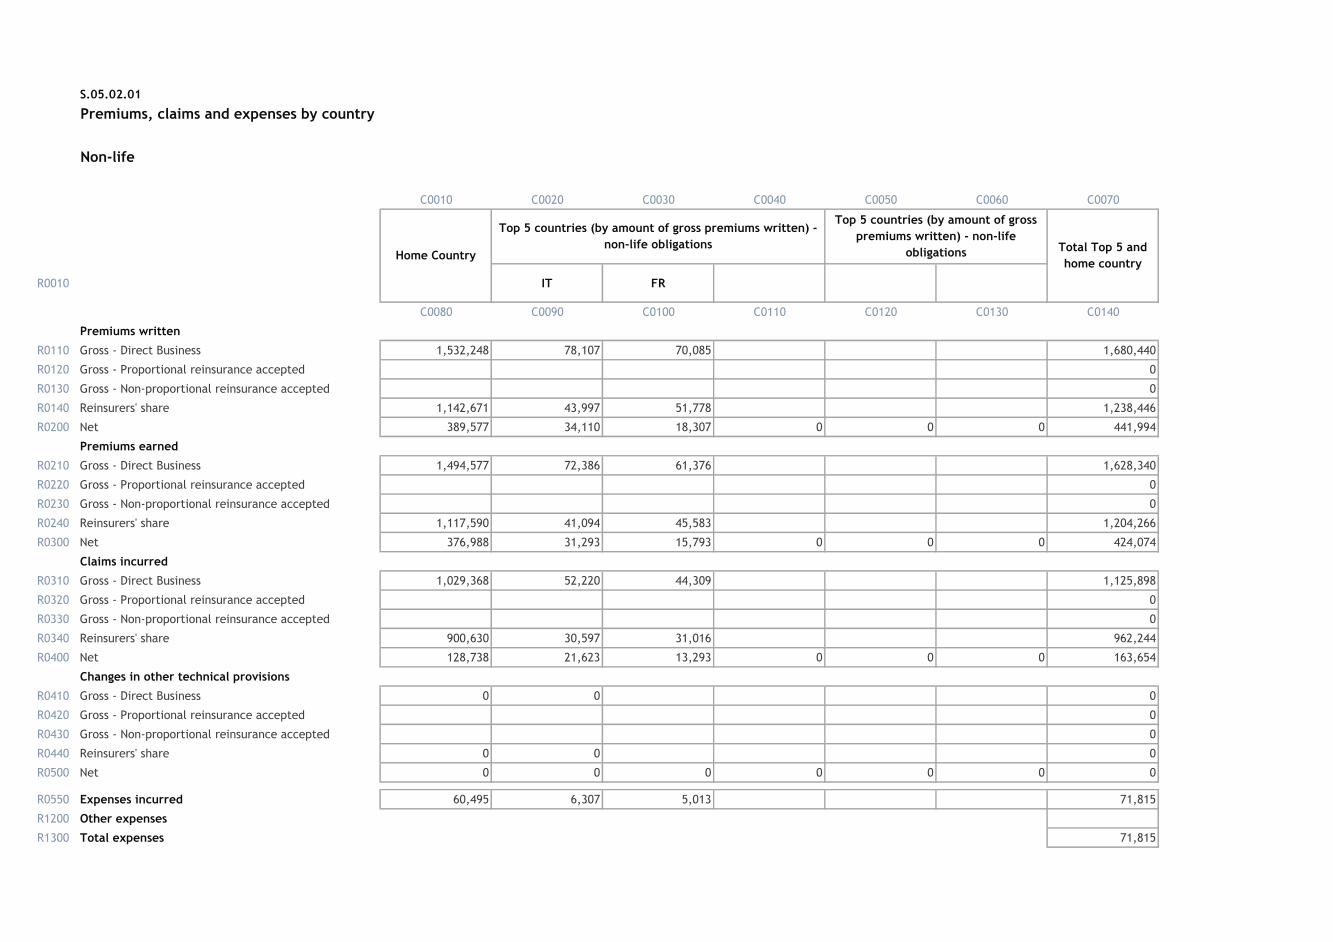
S.05.02.01
Premiums, claims and expenses by country
Non-life
C0010 C0020 C0030 C0040 C0050 C0060 C0070
R0010 IT FR
C0080 C0090 C0100 C0110 C0120 C0130 C0140
Premiums written
R0110 Gross - Direct Business 1,532,248 78,107 70,085 1,680,440
R0120 Gross - Proportional reinsurance accepted 0
R0130 Gross - Non-proportional reinsurance accepted 0
R0140 Reinsurers' share 1,142,671 43,997 51,778 1,238,446
R0200 Net 389,577 34,110 18,307 0 0 0 441,994
Premiums earned
R0210 Gross - Direct Business 1,494,577 72,386 61,376 1,628,340
R0220 Gross - Proportional reinsurance accepted 0
R0230 Gross - Non-proportional reinsurance accepted 0
R0240 Reinsurers' share 1,117,590 41,094 45,583 1,204,266
R0300 Net 376,988 31,293 15,793 0 0 0 424,074
Claims incurred
R0310 Gross - Direct Business 1,029,368 52,220 44,309 1,125,898
R0320 Gross - Proportional reinsurance accepted 0
R0330 Gross - Non-proportional reinsurance accepted 0
R0340 Reinsurers' share 900,630 30,597 31,016 962,244
R0400 Net 128,738 21,623 13,293 0 0 0 163,654
Changes in other technical provisions
R0410 Gross - Direct Business 0 0 0
R0420 Gross - Proportional reinsurance accepted 0
R0430 Gross - Non-proportional reinsurance accepted 0
R0440 Reinsurers' share 0 0 0
R0500 Net 0 0 0 0 0 0 0
R0550 Expenses incurred 60,495 6,307 5,013 71,815
R1200 Other expenses
R1300 Total expenses 71,815
Home Country
Top 5 countries (by amount of gross premiums written) -
non-life obligations
Top 5 countries (by amount of gross
premiums written) - non-life
obligations Total Top 5 and
home country
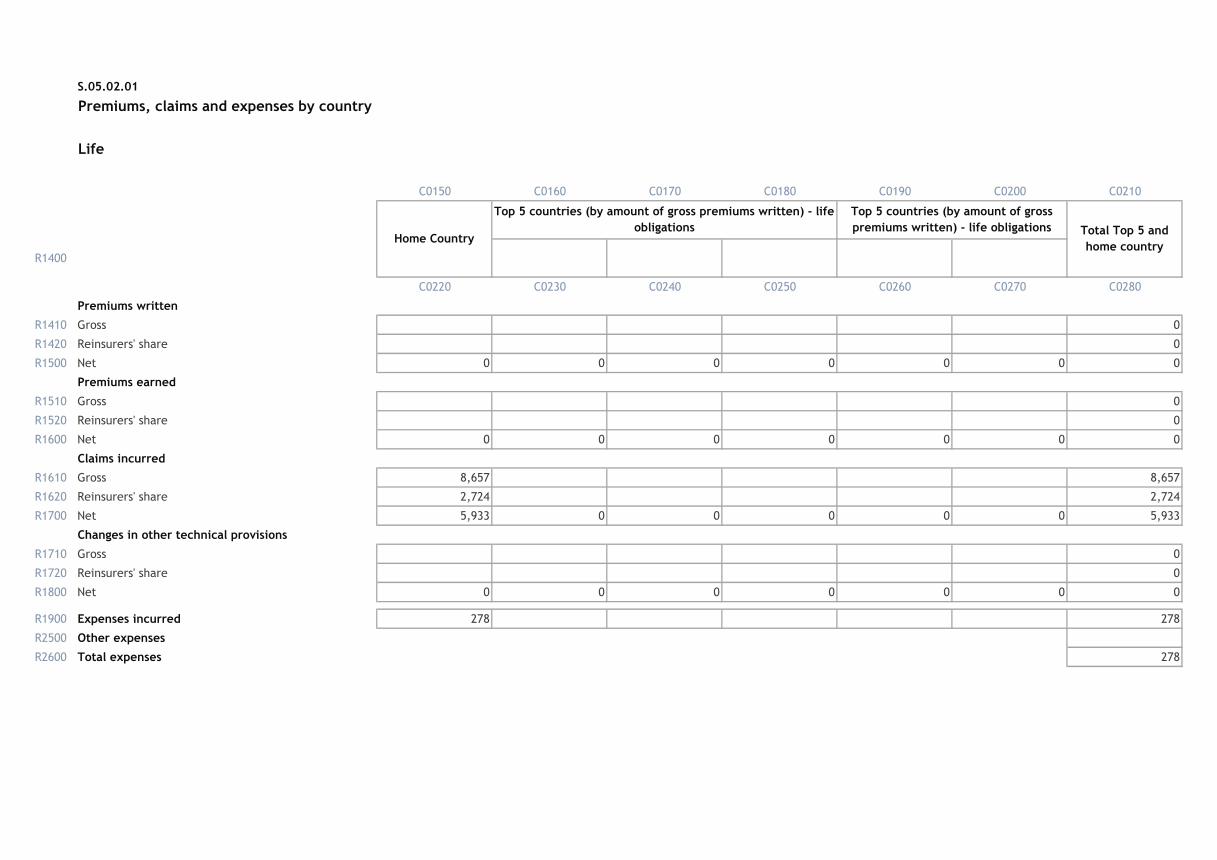
S.05.02.01
Premiums, claims and expenses by country
Life
C0150 C0160 C0170 C0180 C0190 C0200 C0210
R1400
C0220 C0230 C0240 C0250 C0260 C0270 C0280
Premiums written
R1410 Gross 0
R1420 Reinsurers' share 0
R1500 Net 0 0 0 0 0 0 0
Premiums earned
R1510 Gross 0
R1520 Reinsurers' share 0
R1600 Net 0 0 0 0 0 0 0
Claims incurred
R1610 Gross 8,657 8,657
R1620 Reinsurers' share 2,724 2,724
R1700 Net 5,933 0 0 0 0 0 5,933
Changes in other technical provisions
R1710 Gross 0
R1720 Reinsurers' share 0
R1800 Net 0 0 0 0 0 0 0
R1900 Expenses incurred 278 278
R2500 Other expenses
R2600 Total expenses 278
Home Country
Top 5 countries (by amount of gross premiums written) - life
obligations
Top 5 countries (by amount of gross
premiums written) - life obligations Total Top 5 and
home country
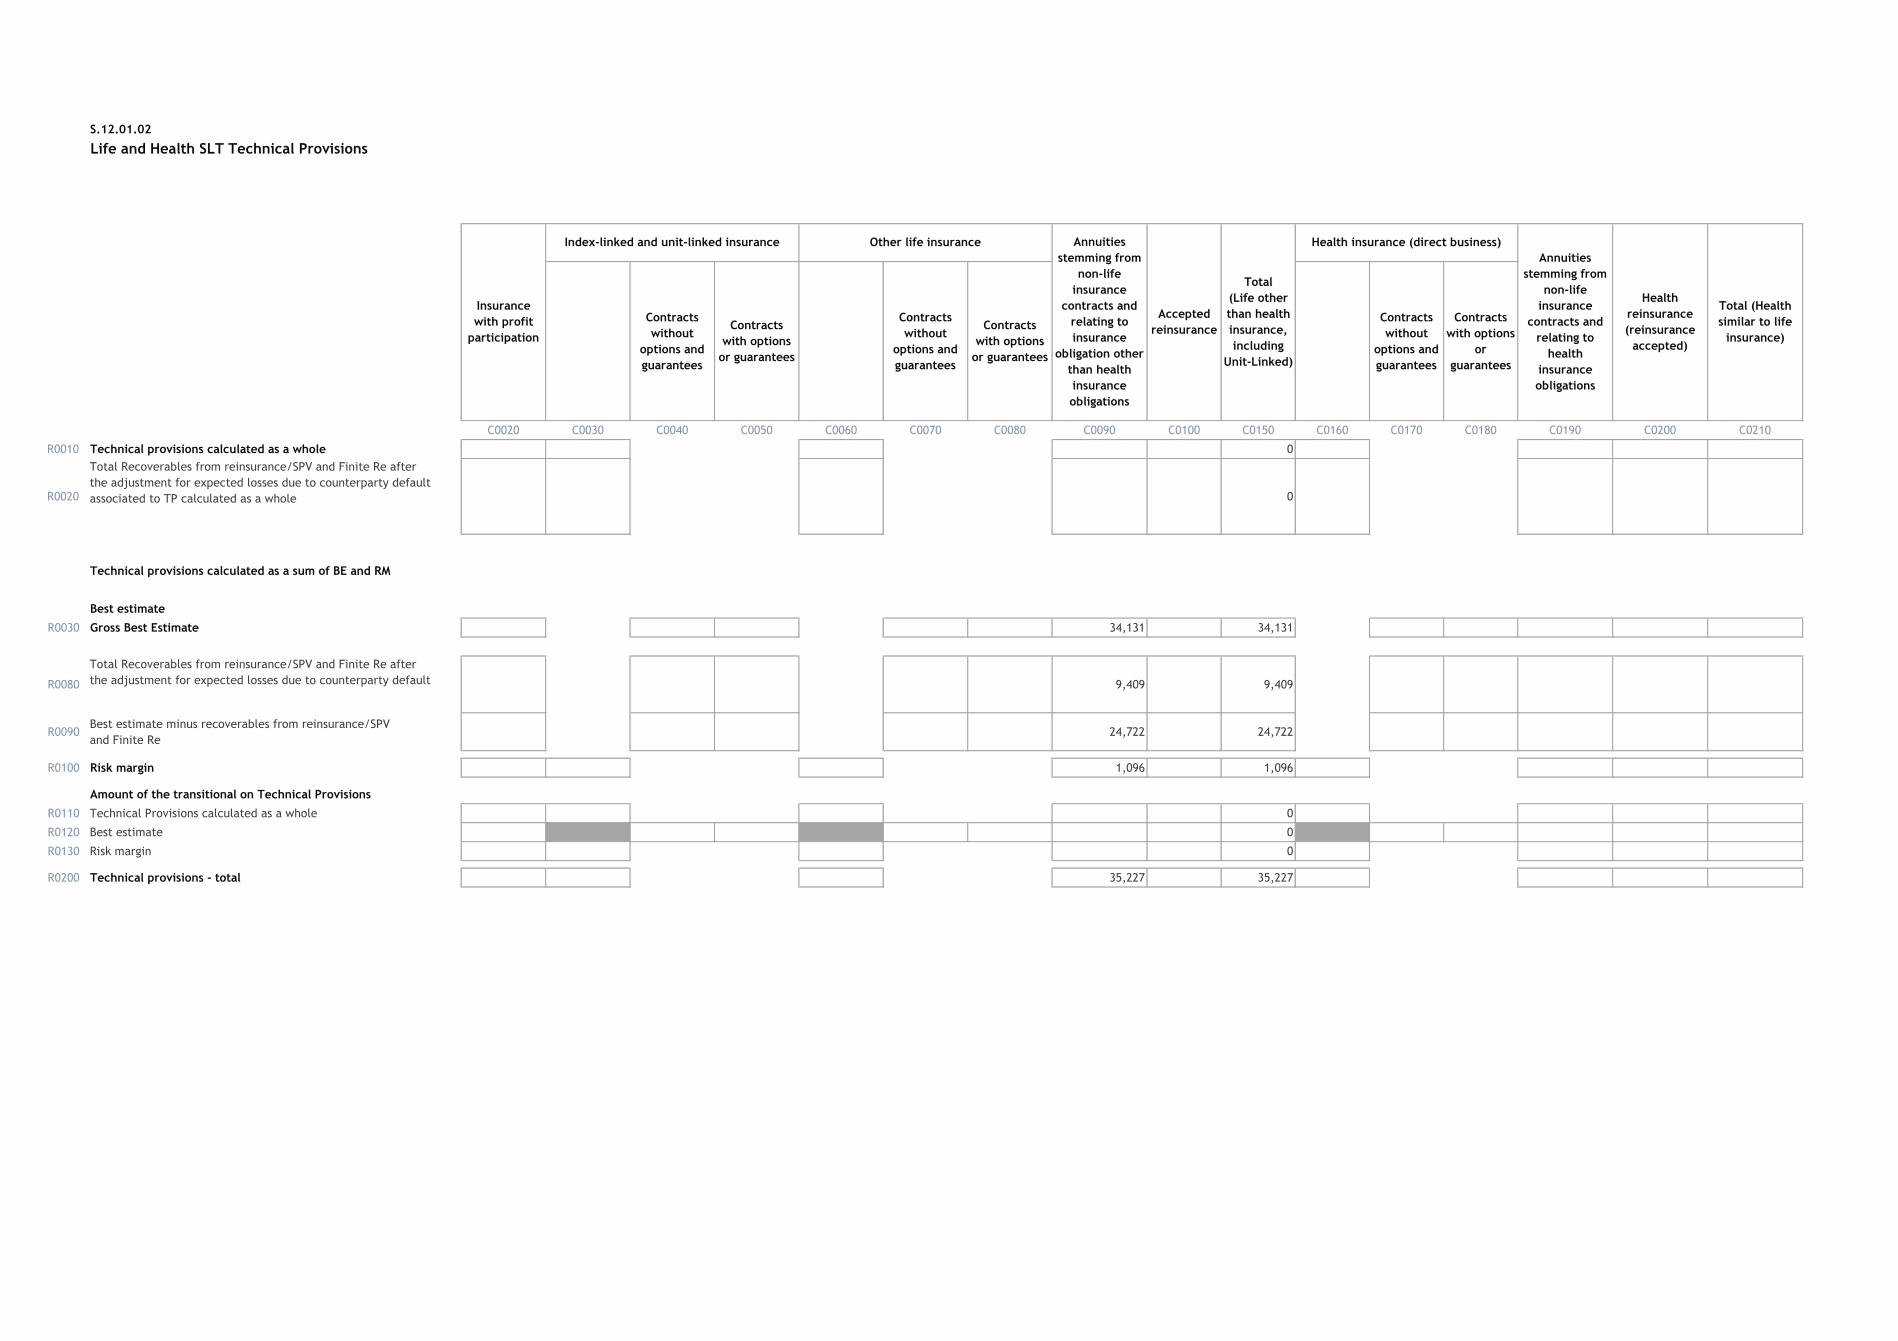
S.12.01.02
Life and Health SLT Technical Provisions
Contracts
without
options and
guarantees
Contracts
with options
or guarantees
Contracts
without
options and
guarantees
Contracts
with options
or guarantees
Contracts
without
options and
guarantees
Contracts
with options
or
guarantees
C0020 C0030 C0040 C0050 C0060 C0070 C0080 C0090 C0100 C0150 C0160 C0170 C0180 C0190 C0200 C0210
R0010 Technical provisions calculated as a whole 0
R0020
Total Recoverables from reinsurance/SPV and Finite Re after
the adjustment for expected losses due to counterparty default
associated to TP calculated as a whole 0
Technical provisions calculated as a sum of BE and RM
Best estimate
R0030 Gross Best Estimate 34,131 34,131
R0080
Total Recoverables from reinsurance/SPV and Finite Re after
the adjustment for expected losses due to counterparty default 9,409 9,409
R0090Best estimate minus recoverables from reinsurance/SPV
and Finite Re24,722 24,722
R0100 Risk margin 1,096 1,096
Amount of the transitional on Technical Provisions
R0110 Technical Provisions calculated as a whole 0
R0120 Best estimate 0
R0130 Risk margin 0
R0200 Technical provisions - total 35,227 35,227
Health insurance (direct business)
Annuities
stemming from
non-life
insurance
contracts and
relating to
health
insurance
obligations
Health
reinsurance
(reinsurance
accepted)
Total (Health
similar to life
insurance)
Insurance
with profit
participation
Index-linked and unit-linked insurance Other life insurance Annuities
stemming from
non-life
insurance
contracts and
relating to
insurance
obligation other
than health
insurance
obligations
Accepted
reinsurance
Total
(Life other
than health
insurance,
including
Unit-Linked)
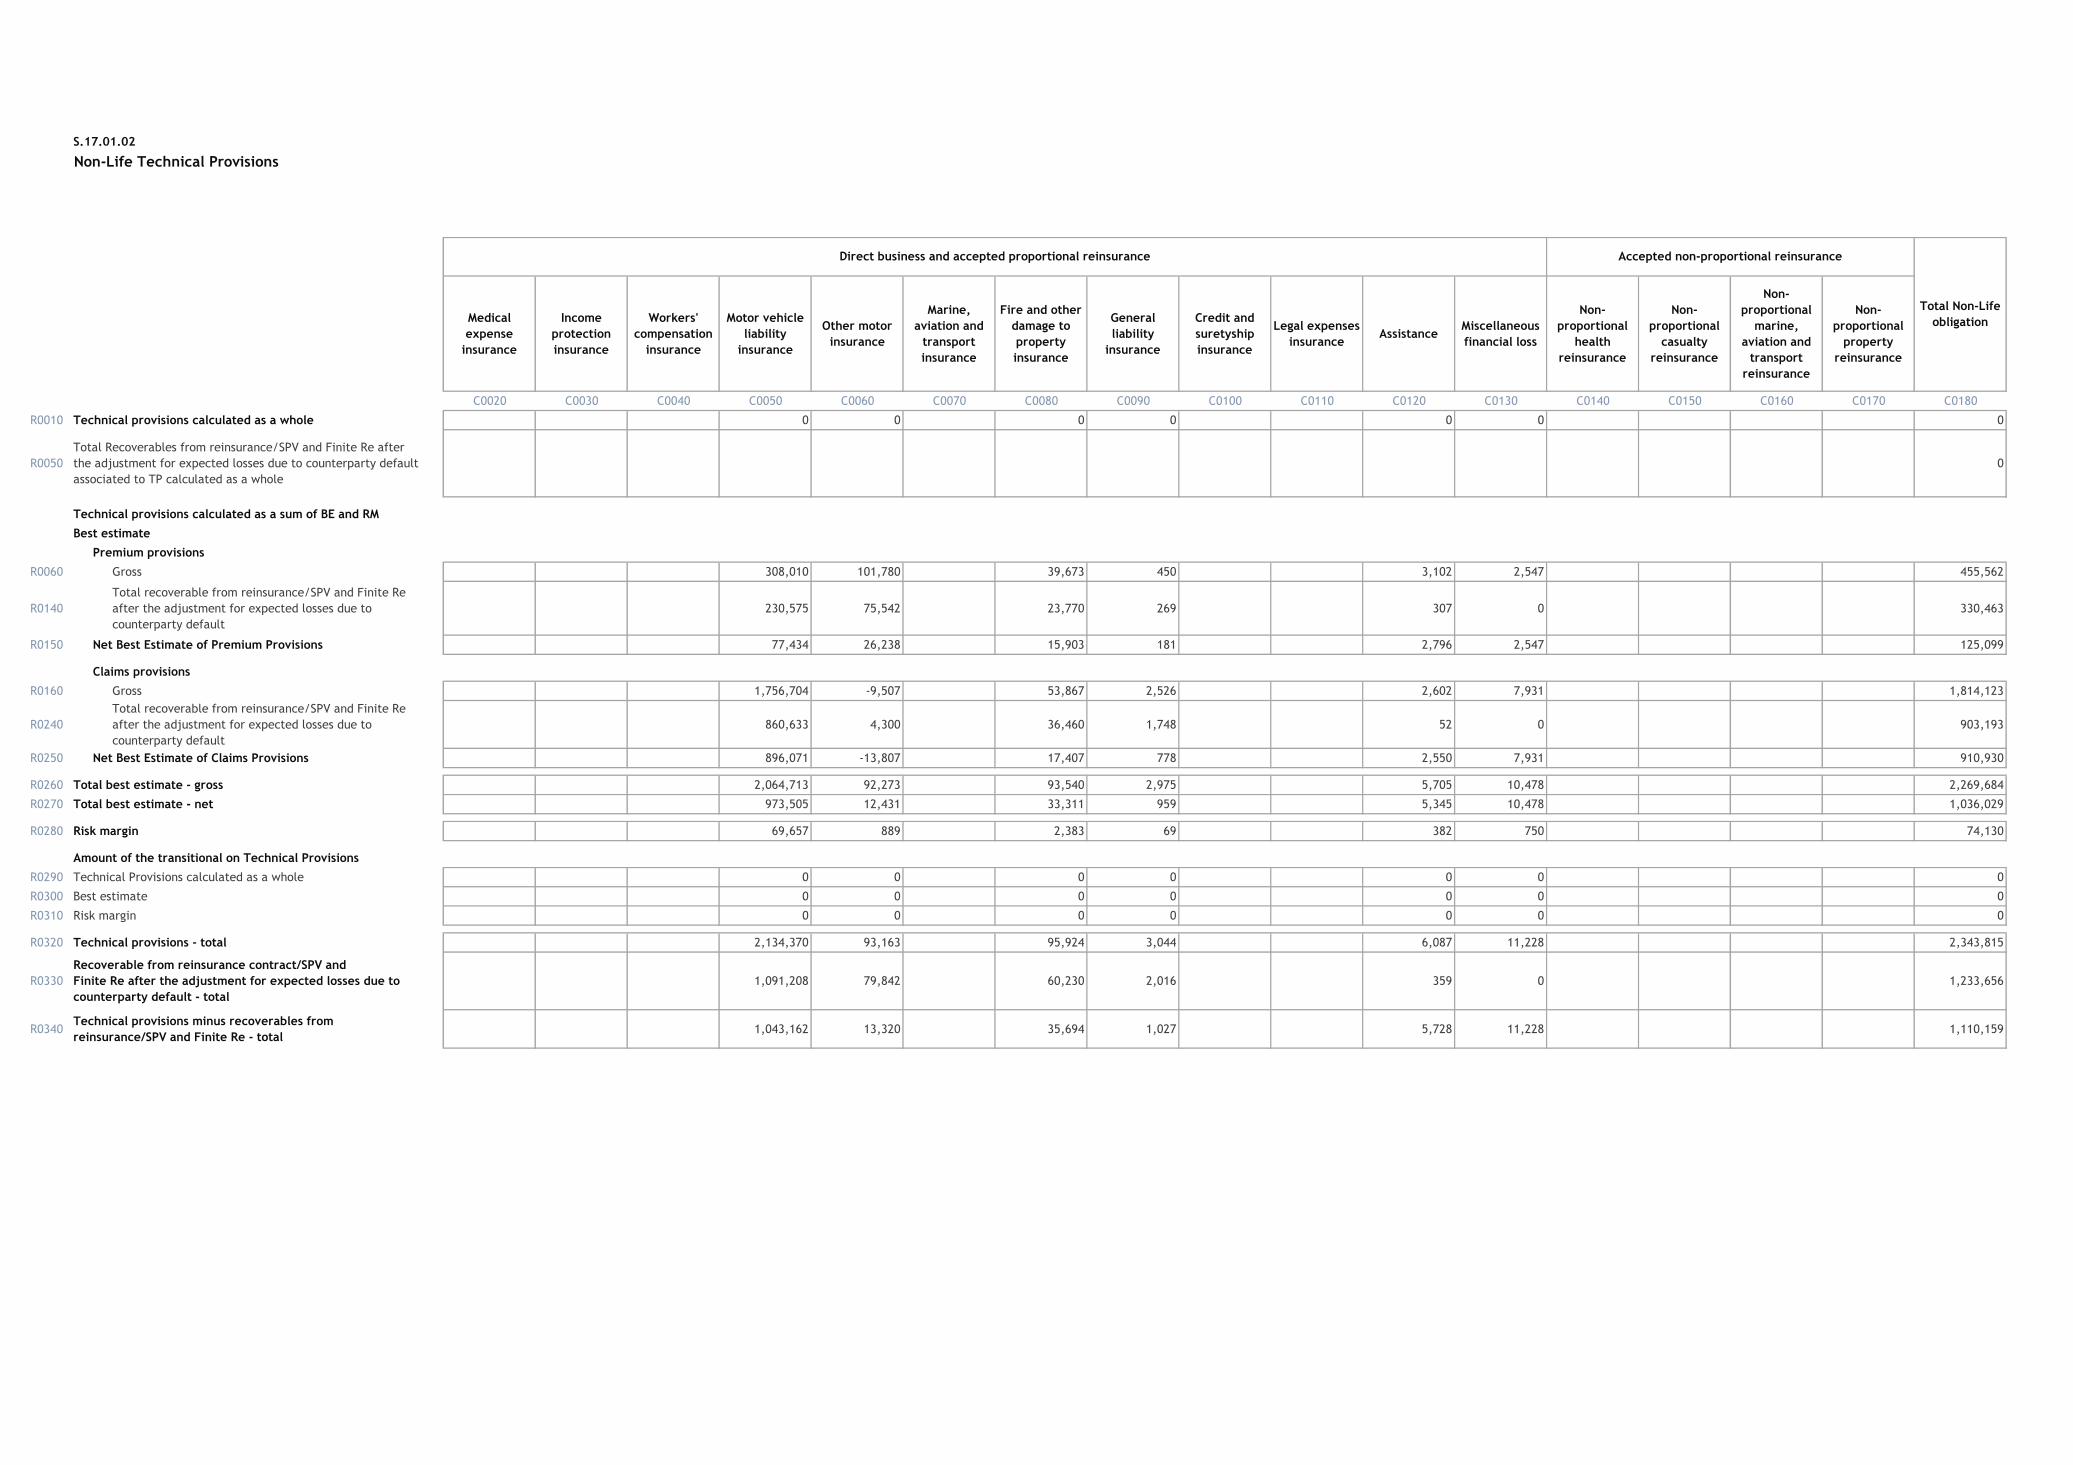
S.17.01.02
Non-Life Technical Provisions
Medical
expense
insurance
Income
protection
insurance
Workers'
compensation
insurance
Motor vehicle
liability
insurance
Other motor
insurance
Marine,
aviation and
transport
insurance
Fire and other
damage to
property
insurance
General
liability
insurance
Credit and
suretyship
insurance
Legal expenses
insuranceAssistance
Miscellaneous
financial loss
Non-
proportional
health
reinsurance
Non-
proportional
casualty
reinsurance
Non-
proportional
marine,
aviation and
transport
reinsurance
Non-
proportional
property
reinsurance
C0020 C0030 C0040 C0050 C0060 C0070 C0080 C0090 C0100 C0110 C0120 C0130 C0140 C0150 C0160 C0170 C0180
R0010 Technical provisions calculated as a whole 0 0 0 0 0 0 0
R0050
Total Recoverables from reinsurance/SPV and Finite Re after
the adjustment for expected losses due to counterparty default
associated to TP calculated as a whole
0
Technical provisions calculated as a sum of BE and RM
Best estimate
Premium provisions
R0060 Gross 308,010 101,780 39,673 450 3,102 2,547 455,562
R0140
Total recoverable from reinsurance/SPV and Finite Re
after the adjustment for expected losses due to
counterparty default
230,575 75,542 23,770 269 307 0 330,463
R0150 Net Best Estimate of Premium Provisions 77,434 26,238 15,903 181 2,796 2,547 125,099
Claims provisions
R0160 Gross 1,756,704 -9,507 53,867 2,526 2,602 7,931 1,814,123
R0240
Total recoverable from reinsurance/SPV and Finite Re
after the adjustment for expected losses due to
counterparty default
860,633 4,300 36,460 1,748 52 0 903,193
R0250 Net Best Estimate of Claims Provisions 896,071 -13,807 17,407 778 2,550 7,931 910,930
R0260 Total best estimate - gross 2,064,713 92,273 93,540 2,975 5,705 10,478 2,269,684
R0270 Total best estimate - net 973,505 12,431 33,311 959 5,345 10,478 1,036,029
R0280 Risk margin 69,657 889 2,383 69 382 750 74,130
Amount of the transitional on Technical Provisions
R0290 Technical Provisions calculated as a whole 0 0 0 0 0 0 0
R0300 Best estimate 0 0 0 0 0 0 0
R0310 Risk margin 0 0 0 0 0 0 0
R0320 Technical provisions - total 2,134,370 93,163 95,924 3,044 6,087 11,228 2,343,815
R0330
Recoverable from reinsurance contract/SPV and
Finite Re after the adjustment for expected losses due to
counterparty default - total
1,091,208 79,842 60,230 2,016 359 0 1,233,656
R0340Technical provisions minus recoverables from
reinsurance/SPV and Finite Re - total1,043,162 13,320 35,694 1,027 5,728 11,228 1,110,159
Direct business and accepted proportional reinsurance Accepted non-proportional reinsurance
Total Non-Life
obligation
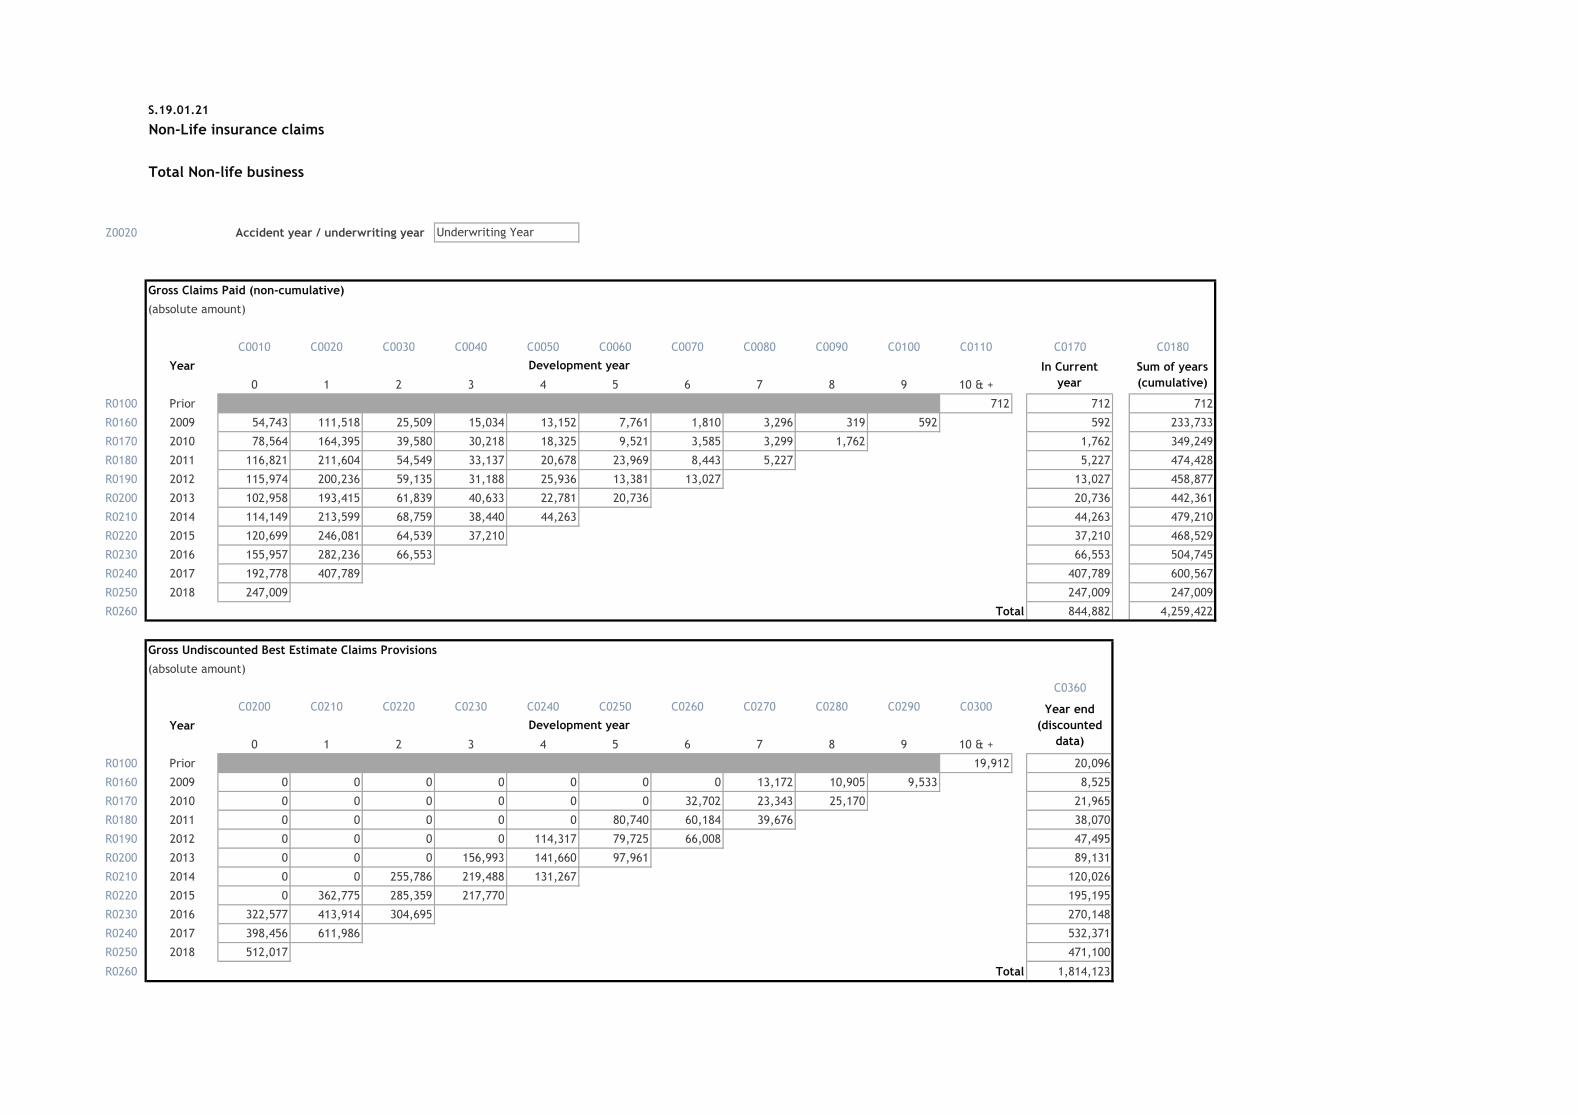
S.19.01.21
Non-Life insurance claims
Total Non-life business
Z0020 Accident year / underwriting year
Gross Claims Paid (non-cumulative)
(absolute amount)
C0010 C0020 C0030 C0040 C0050 C0060 C0070 C0080 C0090 C0100 C0110 C0170 C0180
Year
0 1 2 3 4 5 6 7 8 9 10 & +
R0100 Prior 712 712 712
R0160 2009 54,743 111,518 25,509 15,034 13,152 7,761 1,810 3,296 319 592 592 233,733
R0170 2010 78,564 164,395 39,580 30,218 18,325 9,521 3,585 3,299 1,762 1,762 349,249
R0180 2011 116,821 211,604 54,549 33,137 20,678 23,969 8,443 5,227 5,227 474,428
R0190 2012 115,974 200,236 59,135 31,188 25,936 13,381 13,027 13,027 458,877
R0200 2013 102,958 193,415 61,839 40,633 22,781 20,736 20,736 442,361
R0210 2014 114,149 213,599 68,759 38,440 44,263 44,263 479,210
R0220 2015 120,699 246,081 64,539 37,210 37,210 468,529
R0230 2016 155,957 282,236 66,553 66,553 504,745
R0240 2017 192,778 407,789 407,789 600,567
R0250 2018 247,009 247,009 247,009
R0260 Total 844,882 4,259,422
Gross Undiscounted Best Estimate Claims Provisions
(absolute amount)
C0360
C0200 C0210 C0220 C0230 C0240 C0250 C0260 C0270 C0280 C0290 C0300
Year
0 1 2 3 4 5 6 7 8 9 10 & +
R0100 Prior 19,912 20,096
R0160 2009 0 0 0 0 0 0 0 13,172 10,905 9,533 8,525
R0170 2010 0 0 0 0 0 0 32,702 23,343 25,170 21,965
R0180 2011 0 0 0 0 0 80,740 60,184 39,676 38,070
R0190 2012 0 0 0 0 114,317 79,725 66,008 47,495
R0200 2013 0 0 0 156,993 141,660 97,961 89,131
R0210 2014 0 0 255,786 219,488 131,267 120,026
R0220 2015 0 362,775 285,359 217,770 195,195
R0230 2016 322,577 413,914 304,695 270,148
R0240 2017 398,456 611,986 532,371
R0250 2018 512,017 471,100
R0260 Total 1,814,123
Underwriting Year
Development year In Current
year
Sum of years
(cumulative)
Year end
(discounted
data)
Development year

S.22.01.21
Impact of long term guarantees measures and transitionals
Amount with
Long Term
Guarantee
measures and
transitionals
Impact of
transitional on
technical
provisions
Impact of
transitional on
interest rate
Impact of
volatility
adjustment
set to zero
Impact of
matching
adjustment
set to zero
C0010 C0030 C0050 C0070 C0090
R0010 Technical provisions 2,379,041 0 0 32,553 0
R0020 Basic own funds 417,561 0 0 -17,758 0
R0050 Eligible own funds to meet Solvency Capital Requirement 477,561 0 0 -17,758 0
R0090 Solvency Capital Requirement 335,658 0 0 5,066 0
R0100 Eligible own funds to meet Minimum Capital Requirement 417,561 0 0 -17,758 0
R0110 Minimum Capital Requirement 130,229 0 0 2,162 0

S.23.01.01
Own Funds
Basic own funds before deduction for participations in other financial sector as foreseen in article 68 of Delegated Regulation 2015/35 TotalTier 1
unrestricted
Tier 1
restrictedTier 2 Tier 3
C0010 C0020 C0030 C0040 C0050
R0010 Ordinary share capital (gross of own shares) 58 58 0
R0030 Share premium account related to ordinary share capital 14,944 14,944 0
R0040 Initial funds, members' contributions or the equivalent basic own-fund item for mutual and mutual-type undertakings 0 0 0
R0050 Subordinated mutual member accounts 0 0 0 0
R0070 Surplus funds 0 0
R0090 Preference shares 0 0 0 0
R0110 Share premium account related to preference shares 0 0 0 0
R0130 Reconciliation reserve 402,559 402,559
R0140 Subordinated liabilities 0 0 0 0
R0160 An amount equal to the value of net deferred tax assets 0 0
R0180 Other own fund items approved by the supervisory authority as basic own funds not specified above 0 0 0 0 0
R0220 Own funds from the financial statements that should not be represented by the reconciliation reserve and do not meet the criteria to be classified as Solvency II own funds 0
R0230 Deductions for participations in financial and credit institutions 0
R0290 Total basic own funds after deductions 417,561 417,561 0 0 0
Ancillary own funds
R0300 Unpaid and uncalled ordinary share capital callable on demand 0
R0310 Unpaid and uncalled initial funds, members' contributions or the equivalent basic own fund item for mutual and mutual - type undertakings, callable on demand 0
R0320 Unpaid and uncalled preference shares callable on demand 0
R0330 A legally binding commitment to subscribe and pay for subordinated liabilities on demand 0
R0340 Letters of credit and guarantees under Article 96(2) of the Directive 2009/138/EC 0
R0350 Letters of credit and guarantees other than under Article 96(2) of the Directive 2009/138/EC 0
R0360 Supplementary members calls under first subparagraph of Article 96(3) of the Directive 2009/138/EC 0
R0370 Supplementary members calls - other than under first subparagraph of Article 96(3) of the Directive 2009/138/EC 0
R0390 Other ancillary own funds 60,000 60,000
R0400 Total ancillary own funds 60,000 60,000 0
Available and eligible own funds
R0500 Total available own funds to meet the SCR 477,561 417,561 0 60,000 0
R0510 Total available own funds to meet the MCR 417,561 417,561 0 0
R0540 Total eligible own funds to meet the SCR 477,561 417,561 0 60,000 0
R0550 Total eligible own funds to meet the MCR 417,561 417,561 0 0
R0580 SCR 335,658
R0600 MCR 130,229
R0620 Ratio of Eligible own funds to SCR 142.28%
R0640 Ratio of Eligible own funds to MCR 320.64%
Reconcilliation reserve C0060
R0700 Excess of assets over liabilities 417,561
R0710 Own shares (held directly and indirectly) 0
R0720 Foreseeable dividends, distributions and charges
R0730 Other basic own fund items 15,002
R0740 Adjustment for restricted own fund items in respect of matching adjustment portfolios and ring fenced funds 0
R0760 Reconciliation reserve 402,559
Expected profits
R0770 Expected profits included in future premiums (EPIFP) - Life business
R0780 Expected profits included in future premiums (EPIFP) - Non- life business 36,013
R0790 Total Expected profits included in future premiums (EPIFP) 36,013

S.25.01.21
Solvency Capital Requirement - for undertakings on Standard Formula
Gross solvency
capital requirementUSP Simplifications
C0110 C0090 C0120
R0010 Market risk 60,584
R0020 Counterparty default risk 21,131
R0030 Life underwriting risk 2,650
R0040 Health underwriting risk 0
R0050 Non-life underwriting risk 243,290 6,8
R0060 Diversification -50,937
R0070 Intangible asset risk 0
R0100 Basic Solvency Capital Requirement 276,719
Calculation of Solvency Capital Requirement C0100
R0130 Operational risk 69,433
R0140 Loss-absorbing capacity of technical provisions 0
R0150 Loss-absorbing capacity of deferred taxes -10,494
R0160 Capital requirement for business operated in accordance with Art. 4 of Directive 2003/41/EC 0
R0200 Solvency Capital Requirement excluding capital add-on 335,658
R0210 Capital add-ons already set 0
R0220 Solvency capital requirement 335,658
Other information on SCR
R0400 Capital requirement for duration-based equity risk sub-module 0
R0410 Total amount of Notional Solvency Capital Requirements for remaining part 0
R0420 Total amount of Notional Solvency Capital Requirements for ring fenced funds 0
R0430 Total amount of Notional Solvency Capital Requirements for matching adjustment portfolios 0
R0440 Diversification effects due to RFF nSCR aggregation for article 304 0
USP Key
For life underwriting risk:
1 - Increase in the amount of annuity
benefits
9 - None
For health underwriting risk:
1 - Increase in the amount of annuity
benefits
2 - Standard deviation for NSLT health
premium risk
3 - Standard deviation for NSLT health gross
premium risk
4 - Adjustment factor for non-proportional
reinsurance
5 - Standard deviation for NSLT health
reserve risk
9 - None
For non-life underwriting risk:
4 - Adjustment factor for non-proportional
reinsurance
6 - Standard deviation for non-life
premium risk
7 - Standard deviation for non-life gross
premium risk
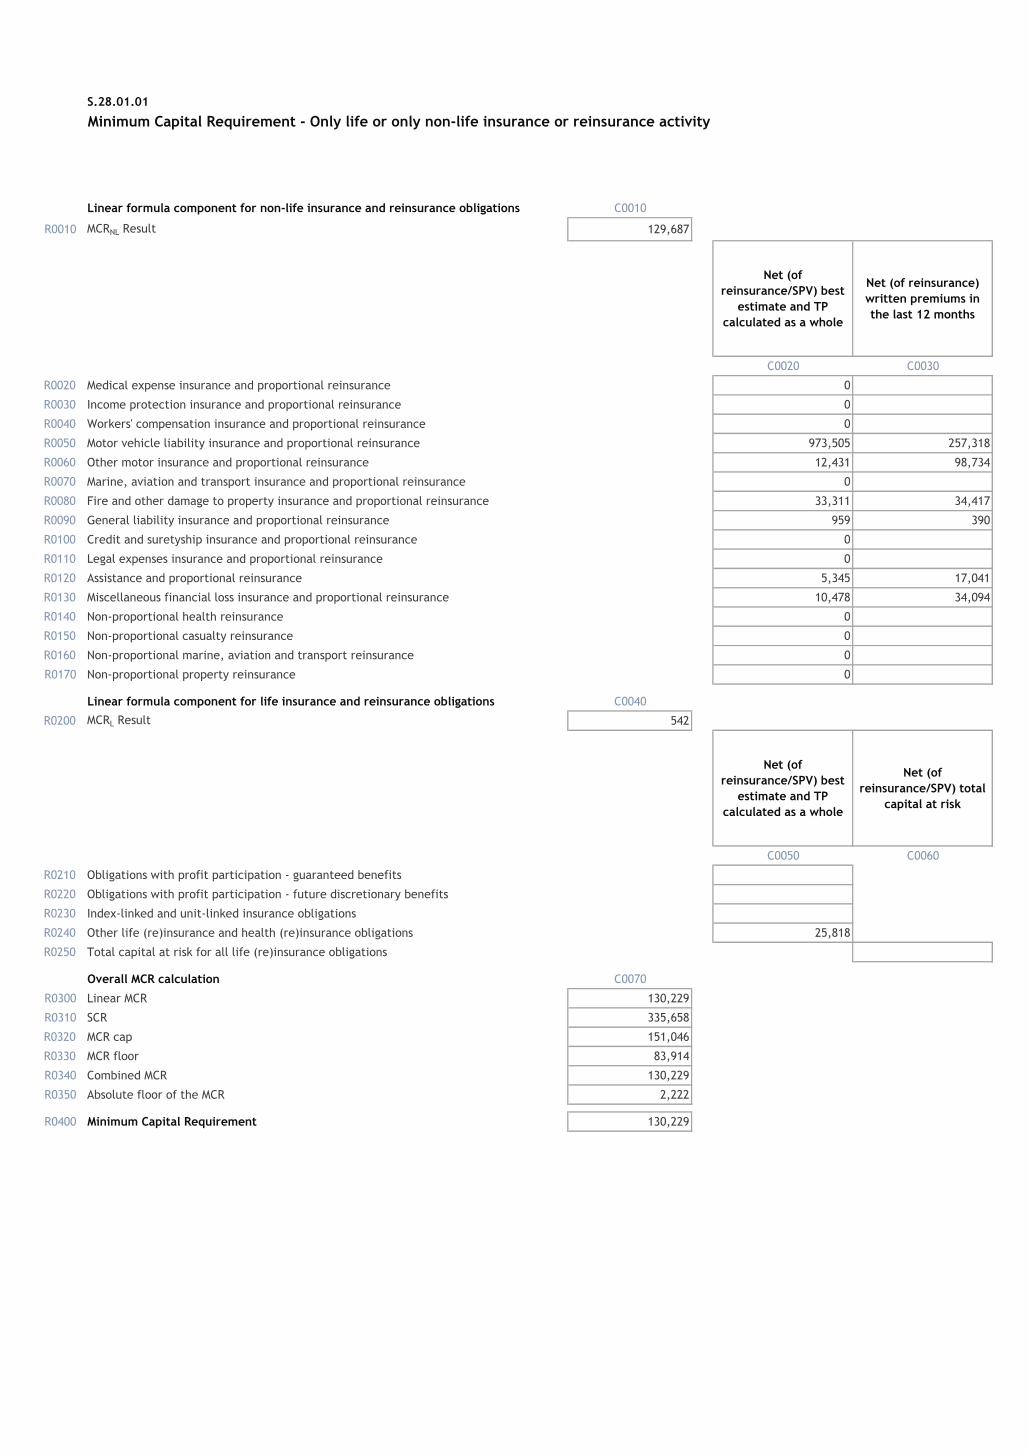
S.28.01.01
Minimum Capital Requirement - Only life or only non-life insurance or reinsurance activity
Linear formula component for non-life insurance and reinsurance obligations C0010
R0010 MCRNL Result 129,687
Net (of
reinsurance/SPV) best
estimate and TP
calculated as a whole
Net (of reinsurance)
written premiums in
the last 12 months
C0020 C0030
R0020 Medical expense insurance and proportional reinsurance 0
R0030 Income protection insurance and proportional reinsurance 0
R0040 Workers' compensation insurance and proportional reinsurance 0
R0050 Motor vehicle liability insurance and proportional reinsurance 973,505 257,318
R0060 Other motor insurance and proportional reinsurance 12,431 98,734
R0070 Marine, aviation and transport insurance and proportional reinsurance 0
R0080 Fire and other damage to property insurance and proportional reinsurance 33,311 34,417
R0090 General liability insurance and proportional reinsurance 959 390
R0100 Credit and suretyship insurance and proportional reinsurance 0
R0110 Legal expenses insurance and proportional reinsurance 0
R0120 Assistance and proportional reinsurance 5,345 17,041
R0130 Miscellaneous financial loss insurance and proportional reinsurance 10,478 34,094
R0140 Non-proportional health reinsurance 0
R0150 Non-proportional casualty reinsurance 0
R0160 Non-proportional marine, aviation and transport reinsurance 0
R0170 Non-proportional property reinsurance 0
Linear formula component for life insurance and reinsurance obligations C0040
R0200 MCRL Result 542
Net (of
reinsurance/SPV) best
estimate and TP
calculated as a whole
Net (of
reinsurance/SPV) total
capital at risk
C0050 C0060
R0210 Obligations with profit participation - guaranteed benefits
R0220 Obligations with profit participation - future discretionary benefits
R0230 Index-linked and unit-linked insurance obligations
R0240 Other life (re)insurance and health (re)insurance obligations 25,818
R0250 Total capital at risk for all life (re)insurance obligations
Overall MCR calculation C0070
R0300 Linear MCR 130,229
R0310 SCR 335,658
R0320 MCR cap 151,046
R0330 MCR floor 83,914
R0340 Combined MCR 130,229
R0350 Absolute floor of the MCR 2,222
R0400 Minimum Capital Requirement 130,229