ADMINISTRATION - Salt Lake Community College...ADMINISTRATION Cynthia A. Bioteau, Ph.D. President...
74
Transcript of ADMINISTRATION - Salt Lake Community College...ADMINISTRATION Cynthia A. Bioteau, Ph.D. President...


ADMINISTRATION Cynthia A. Bioteau, Ph.D.
President
Christopher L. Picard, Ph.D. Provost
Dennis R. Klaus
Vice President of Business Services Tim Sheehan
Vice President of Government and Community Relations Alison McFarlane
Vice President of Institutional Advancement
Deneece Huftalin, Ph.D. Vice President of Student Services
BOARD OF TRUSTEES Jesselie B. Anderson, Chair Gail Miller, Vice Chair Clint Ensign Larry Hancock Ashok Joshi, Ph.D. Stanley B. Parrish Richard R. Tranter Anna Kay Waddoups Aaron Starks, Student Association President Annie V. Schwemmer, SLCC Alumni Association President

SALT LAKE COMMUNITY COLLEGE 2012-2013 FACT BOOK
INTRODUCTION ................................................................................................................... 1 SLCC Vision, Mission, and Strategic Priorities ................................................ 2 TAB A. STUDENT ENROLLMENT
STEP AHEAD – Student Enrollment ................................................................. 3
GRAPH 1 Salt Lake Community College Enrollment Trends .......................... 4
TABLE 1 Salt Lake Community College Enrollment Trends .......................... 5
TABLE 2A Enrollment Summary - Summer Term ............................................. 6
TABLE 2 Enrollment by Academic Dept - Summer Term FTE’s ..................... 7 TABLE 3A Enrollment Summary - Fall Semester .............................................. 8
TABLE 3 Enrollment by Academic Dept - Fall Semester FTE’s ...................... 9
TABLE 4A Enrollment Summary - Spring Semester ....................................... 10
TABLE 4 Enrollment by Academic Dept – Spring Semester FTE’s .............. 11 TABLE 5 2011-2012 Enrollment by Summer Term - Fall & Spring
End of Term (Annualized FTE’s) ................................................... 12
TABLE 6 Enrollment by Academic Dept - Annualized FTE’s ........................ 13 GRAPH 7 Student Headcount Enrollment per Credit Hour ............................ 14
TABLE 7 Student Headcount Enrollment per Credit Hour ............................ 15
TABLE 8 Average Credit Hours Taken ......................................................... 16
TABLE 9 Average Class Size – Fall 2008-2009 to 2012-2013 ..................... 17

TABLE OF CONTENTS -Continued-
TAB B. STUDENT DEMOGRAPHICS
STEP AHEAD – DEMOGRAPHICS .................................................................... 18
TABLE 10 Student Enrollment by Majors ........................................................ 19
TABLE 11 Student Enrollment by Majors and by Gender ............................... 20
GRAPH 12 Where Students Live by Zip Code ................................................. 21
TABLE 12 Where Students Live by Zip Code ................................................. 22 TABLE 13 Student Distribution by Age and Gender ....................................... 23
TABLE 14 Student Distribution by Racial Background and Gender ................ 24
TABLE/ GRAPH 15 Male to Female Ratios ................................................................... 25
TABLE/ Veterans Currently Eligible to Receive Benefits GRAPH 16 by Academic Classification ............................................................ 26
TABLE 17 Average Age of Students ............................................................... 27
TAB C. FACULTY/STAFF INFORMATION
STEP AHEAD – FACULTY/STAFF .................................................................... 28
TABLE 18 2011-2012 Student/Faculty Ratios ................................................ 29
GRAPH 19 Student/Faculty & Student/Staff Ratios - Salt Lake Community College ....................................................... 30
TABLE 19 Student/Faculty & Student/Staff Ratios -
Salt Lake Community College ....................................................... 31
TABLE 20 Salaried Personnel Budgeted FTE by Index Codes, by Gender, and by Faculty/Staff (Ed and General Indexes) ............................. 32

TABLE OF CONTENTS -Continued-
TAB C. FACULTY/STAFF INFORMATION
TABLE 21 Salaried Personnel Budgeted FTE by Index Codes, by Gender, and by Faculty/Staff (Service Enterprises/Auxiliary, Designated, Restricted, Agency Funds, and Skills Center Funded Indexes) ..... 37
TABLE 22 2012-2013 Faculty Information including Tenure, Ranking, Educational Credentials and Male/Female Ratios ......................... 39
TAB D. DEGREES AND AWARDS
STEP AHEAD – DEGREES AND AWARDS ...................................................... 40 TABLE 23 Distribution of Graduates by Degree and by Major ........................ 41
TABLE 24 Distribution of Graduates by Degree,
by Major and by Gender ................................................................ 42 TAB E. FINANCIAL INFORMATION
STEP AHEAD – FINANCIAL INFORMATION .................................................... 43
TABLE 25 Current and Historical Tuition and Fee Schedule for Salt Lake Community College ....................................................... 44
TABLE 26 Cost Per Student Credit Hour by Department
(Instructional Cost) ......................................................................... 45
TABLE 27 Cost Per FTE by Department (Instructional Cost) ......................... 46
TABLE 28 Costs Per FTE - Current and Adjusted for Inflation ....................... 47
TABLE 29 Financial Aid Information ............................................................... 48
TABLE/ GRAPH 30 2011-2012 Revenue Sources & Expenditures (E & G) .................. 49
TABLE/ GRAPH 31 2011-2012 Revenue Sources & Expenditures (Total) ................... 50

TABLE OF CONTENTS -Continued-
TAB F. FACILITIES
STEP AHEAD – FACILITIES .............................................................................. 51
TABLE/ Building Profile Instructional Buildings GRAPH 32 Taylorsville Redwood Campus ...................................................... 52
TABLE/ Building Profile GRAPH 33 All Campus Locations .................................................................... 53
TAB G. STUDENT INPUT STEP AHEAD – STUDENT INPUT ..................................................................... 54
Explanation of Student Follow-Up Systems ................................... 55
TABLE 34 New Student Survey - 2011-2012 Summary ................................. 56
TABLE 35 Non-Returning Survey - 2011-2012 Summary ............................... 58 TABLE 36 Graduating Student Survey - 2011-2012 Summary ....................... 60
TAB H. NON-CREDIT ACTIVITY STEP AHEAD – NON-CREDIT ACTIVITY .......................................................... 61
Division of Applied Technology - Mission and Operating Characteristics .......................................... 62
TABLE 37 Division of Applied Technology Enrollment Trends ....................... 63
TABLE 38 Division of Applied Technology Student Demographics ................ 64
TABLE 39 Division of Applied Technology - Distribution of Graduates by Program and by Gender ................... 65
TABLE/ 2011-2012 Division of Applied Technology Revenue Sources GRAPH 40 & Expenditures (Total) ................................................................... 66
TABLE 41 School of Professional and Economic Development - Non-Credit Student Enrollment Trends .......................................... 67

1
I N T R O D U C T I O N
The purpose of the Fact Book is to provide official information about
Salt Lake Community College (SLCC). Where possible, several years of
historical data has been presented to provide perspective and to show trends.
It should be noted that given the complexities and size of SLCC and the
multiple special databases that are being used, when interpreting data appearing
in this book, care should be taken to ensure the database is correct for the
purpose for which the data is used. The Fact Book represents the official
numbers of Salt Lake Community College.
The organization of the data is as follows:
Tab A. Student Enrollment
Tab B. Student Demographics
Tab C. Faculty/Staff Information
Tab D. Degrees and Awards
Tab E. Financial Information
Tab F. Facilities
Tab G. Student Input
Tab H. Non-Credit
The Fact Book was prepared by Debbie Summers and Annette Lowe from the Office of Institutional Research.

2
SALT LAKE COMMUNITY COLLEGE
VISION STATEMENT
Salt Lake Community College will be the premier comprehensive community college in the nation.
MISSION STATEMENT Salt Lake Community College is a public, open-access, comprehensive community college committed to serving the broader community. Its mission is to provide quality higher education and lifelong learning to people of diverse cultures, abilities, and ages, and to serve the needs of community and government agencies, business, industry and employers. The College fulfills its mission by:
• offering associate degrees, certificate programs, career and technical education, developmental education, transfer education, and workforce training to prepare individuals for career opportunities and an enriched lifetime of learning and growing;
• offering programs and student support services that provide students
opportunities to acquire knowledge and critical thinking skills, develop self-confidence, experience personal growth, and value cultural enrichment;
• maintaining an environment committed to teaching and learning, collegiality, and
the respectful and vigorous dialogue that nourishes active participation and service in a healthy democracy.
STRATEGIC PRIORITIES
• Enhance Quality Higher Education • Improve Student Access and Success • Advance a Culture of Evidence & Accountability • Strengthen Institutional Support • Advance Partnerships/Relationships with the Community and Business

TAB A. STEP AHEAD
STUDENT ENROLLMENT Salt Lake Community College has seen a slight decrease in both
headcount and FTE (One Full-Time Equivalent equals 15 Credit Hours)
throughout the 2012-2013 year. SLCC continues to maximize resources to
teach and train as many students as possible while maintaining instructional
quality.
3
Fast Facts
(Budget Related Figures)
• Fall 12-13 Headcount = 26,161 • Fall 12-13 FTE = 15,361
• Fall 12-13 Average Credit Hours taken = 8.81
• Fall 12-13 Average Class Size = 21.08

GRAPH 1.
4
0
2,000
4,000
6,000
8,000
10,000
12,000
14,000
16,000
18,000
20,000
22,000
24,000
26,000
28,000
30,000
32,000
SALT LAKE COMMUNITY COLLEGE ENROLLMENT TRENDS
Fall HC including Division of Applied Tech Fall HC Fall FTE Annualized FTE

TABLE 1.
SALT LAKE COMMUNITY COLLEGEENROLLMENT TRENDS
FALL HEADCOUNT FALL FTETHIRD WEEK THIRD WEEK ANNUALIZED
NON- NON- UNDUPLICATED YEARS RESIDENTS RESIDENTS TOTAL RESIDENTS RESIDENTS TOTAL AFTE'S HEADCOUNT
ACTUALS
1980-81 5853 84 5937 3984 91 4075 4238
1981-82 6313 70 6383 4105 74 4179 4573 12240
1982-83 7045 63 7108 4854 58 4912 5341 13152
1983-84 7308 52 7360 5127 49 5176 5522 14459
1984-85 8244 45 8289 5280 37 5317 5563 13981
1985-86 8243 64 8307 5402 53 5455 5720 13712
1986-87 8756 59 8815 5511 43 5554 5845 13388
* 1987-88 9389 47 9436 5808 40 5848 6073 15297
1988-89 9294 73 9367 5840 53 5893 6530 15769
1989-90 10900 103 11003 6733 86 6819 7584 18843
1990-91 13028 316 13344 7745 173 7918 8596 22256
1991-92 15089 285 15374 9337 232 9569 10243 24794
1992-93 15558 304 15862 9937 243 10180 10775 25018
1993-94 15980 384 16364 10253 322 10575 11449 26365
1994-95 16765 447 17212 10816 378 11194 11846 27956
1995-96 18351 537 18888 11664 432 12096 12431 30643
1996-97 18948 634 19582 11964 488 12452 13002 32652
1997-98 19017 674 19691 12189 542 12731 13216 31816
** 1998-99 17816 637 18453 9949 452 10401 12220 29192
1999-00 19910 673 20583 11304 495 11799 13131 32845
2000-01 20593 701 21294 11718 509 12227 14004 34447
2001-02 22551 863 23414 13011 593 13604 15351 35225
2002-03 22552 602 23154 13689 373 14062 16223 35953
2003-04 22928 849 23777 13624 589 14213 16571 36021
2004-05 23384 1356 24740 13645 675 14320 16520 35757
2005-06 23518 1049 24567 13255 688 13943 15802 35703
2006-07 22671 1151 23822 12954 740 13694 15496 35007
2007-08 22425 1399 23824 12749 861 13610 15322 35410
2008-09 23088 1379 24467 13227 867 14094 16152 36384
2009-10 26510 1213 27723 15341 813 16154 18514 39690
2010-11 27244 1199 28443 15754 813 16567 19179 40348
2011-12 25937 1104 27041 15129 727 15856 18732 392462012-13 25122 1039 26161 14661 700 15361
NOTE: * 1987-88 to 2012-13 actuals are "Budget Related Totals", not the "Institution FTE and HC Totals"
** Semester Conversion
SOURCE: 1980-81 to 1984-85 Utah Board of Regents' Recommended Operating Budgets
1985-86 to 2012-13 Utah Board of Regents' Official Reports
5
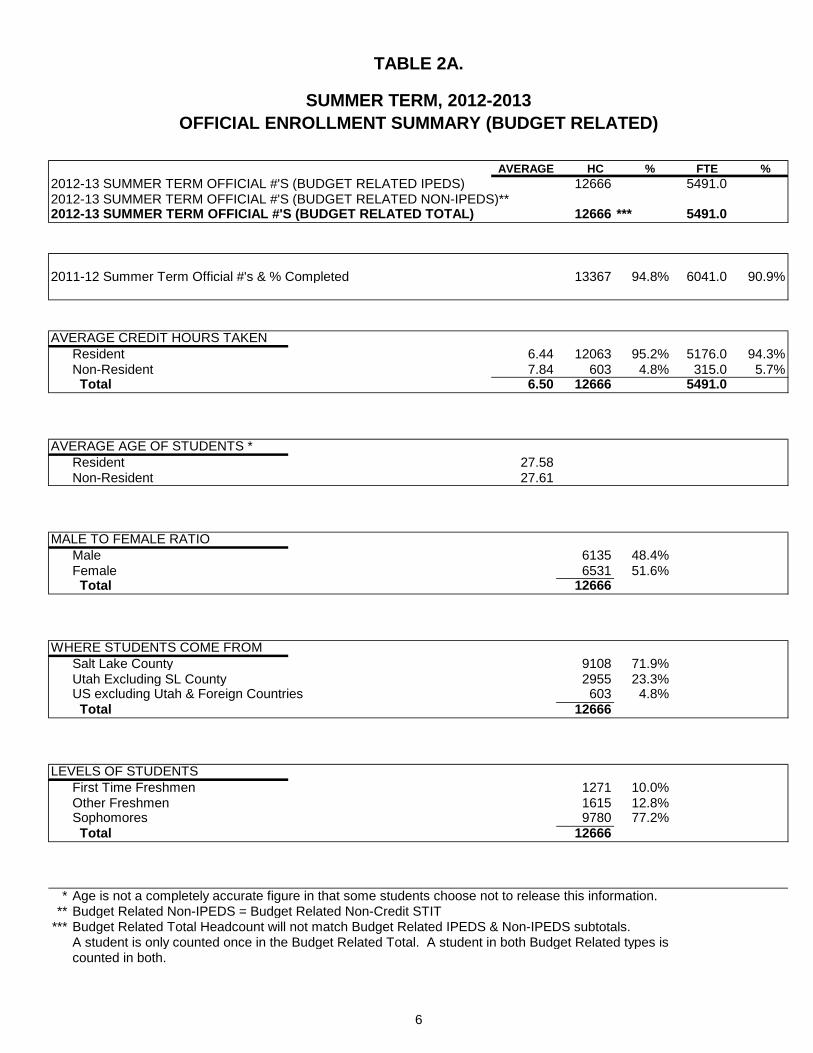
TABLE 2A.
SUMMER TERM, 2012-2013OFFICIAL ENROLLMENT SUMMARY (BUDGET RELATED)
AVERAGE HC % FTE %2012-13 SUMMER TERM OFFICIAL #'S (BUDGET RELATED IPEDS) 12666 5491.02012-13 SUMMER TERM OFFICIAL #'S (BUDGET RELATED NON-IPEDS)** 2012-13 SUMMER TERM OFFICIAL #'S (BUDGET RELATED TOTAL) 12666 *** 5491.0
2011-12 Summer Term Official #'s & % Completed 13367 94.8% 6041.0 90.9%
AVERAGE CREDIT HOURS TAKENResident 6.44 12063 95.2% 5176.0 94.3%Non-Resident 7.84 603 4.8% 315.0 5.7% Total 6.50 12666 5491.0
AVERAGE AGE OF STUDENTS *Resident 27.58Non-Resident 27.61
MALE TO FEMALE RATIOMale 6135 48.4%Female 6531 51.6% Total 12666
WHERE STUDENTS COME FROMSalt Lake County 9108 71.9%Utah Excluding SL County 2955 23.3%US excluding Utah & Foreign Countries 603 4.8% Total 12666
LEVELS OF STUDENTSFirst Time Freshmen 1271 10.0%Other Freshmen 1615 12.8%Sophomores 9780 77.2% Total 12666
* Age is not a completely accurate figure in that some students choose not to release this information.** Budget Related Non-IPEDS = Budget Related Non-Credit STIT
*** Budget Related Total Headcount will not match Budget Related IPEDS & Non-IPEDS subtotals.A student is only counted once in the Budget Related Total. A student in both Budget Related types iscounted in both.
6

TABLE 2.
ENROLLMENT BY ACADEMIC DEPARTMENT - SUMMER TERM FTE'S
DEPARTMENT 08-09 09-10 10-11 11-12 12-13Accounting 54.7 62.3 82.7 99.4 85.7Apprenticeship/Carpentry-Millwright 0.3Apprenticeship/Culinary Arts 18.9 0.4Apprenticeship/Electricity-Instrumentation 35.2 18.0 15.0 8.3 8.3Apprenticeship/General 8.0 7.1 6.4 3.8 4.1Apprenticeship/HVAC 0.3 0.3Apprenticeship/Plumbers-Pipefitters 11.3 7.3 2.0 0.7 4.3Apprenticeship/Stage Hands 3.0 0.3Architectural Tech 4.2 8.7 14.0 12.5 13.3Architectural Tech (Prison) 13.6 5.7ASL/Interpreting 15.0 19.7 16.3 12.4 13.1Automotive Technician 14.0 12.4Automotive Technician (Prison) 8.8 7.6Aviation Technology/Aviation Maintenance Tech 15.5 13.9 34.9 51.3 43.6Aviation Technology/Professional Pilot 6.1 9.3 15.3 20.3 18.9Barbering/Cosmetology 171.6 137.8 130.9 114.6 88.8Biology 268.4 331.2 434.0 346.5 367.9Biotechnology 6.7 1.7 5.3 0.7 0.8Bldg Construction (Prison) 44.1 5.4Bldg Construction/Construction Mgt 4.2 5.4 8.9 12.1 11.5Business Economics 97.6 109.4 140.8 121.6 119.0Business Management 108.2 125.6 152.7 127.8 104.5Chemistry 214.4 261.4 291.6 241.1 230.7Communication 151.7 185.7 208.4 210.5 185.0Computer Info Systems 164.3 165.6 218.8 246.8 155.9Computer Science 31.5 33.5 43.1 57.6 71.5Criminal Justice 76.7 115.9 154.2 173.3 115.0Culinary Arts 31.7 52.3 36.9 40.9Culinary Arts (Prison) 31.3 11.3Dental Hygiene 1.0 1.2Developmental Education 417.4 512.6 664.4 723.3Developmental Math 361.2Developmental Reading 76.5Developmental Writing 109.6Education 15.3 24.4 29.8 35.2 34.8Electronics & Instrumentation Tech 26.8 17.6 6.2Electronics (Prison) 30.4Engineering 40.9 37.3 61.1 74.3 71.4Engineering Design/Drafting Tech 10.8 16.8 12.6 17.4 19.4Engineering Design/Drafting Tech (Prison) 1.6English 364.1 386.3 452.0 499.7 558.3English Second Language 35.1 38.2 33.6 40.1 32.1Environmental Technology 7.1 7.0 4.8Family & Human Studies 38.4 38.1 46.8 42.0 43.8Fashion Institute 8.2 11.2 19.5 16.0 25.6Finance and Credit 34.0 33.1 50.5 53.7 53.9Fine Arts 154.3 172.7 205.2 228.0 185.2Geosciences 48.0 71.9 91.5 91.7 96.8Health & Lifetime Activities 205.2 237.3 298.9 357.9 268.8History/Anthropology 119.8 131.8 156.2 203.2 159.2Humanities 110.5 145.8 171.6 196.4 167.0Interior Design 13.6 9.8 17.4 12.9 14.5Languages 41.4 40.3 40.1 59.6 45.9Learning Enhancements 121.5Marketing 8.4 16.6 23.0 25.1 25.3Mathematics 475.6 577.2 672.0 648.9 557.2Medical Assistant 38.9 62.0 90.8 71.5 76.6Medical Lab Technology 1.0Mortuary Science 6.8Nursing 27.8 22.7 27.4 19.3 25.1Occupational Therapy Asst 3.5 3.6 3.3 4.1 4.9Paralegal Studies 32.7 34.6 40.1 49.1 33.4Physical Therapist Asst 14.7 15.3 14.7 14.0 14.0Physics 88.5 94.0 99.0 88.1 85.7Political Science 38.6 41.3 52.3 50.3 50.1Psychology 125.0 152.0 166.4 197.7 178.0Radiologic Technology 20.4 26.4 20.9 24.1 18.5Social Work 8.8 15.6 16.6 21.2 12.4Sociology 66.0 74.8 77.4 66.8 56.4Surgical Technology 3.2 4.4 3.2 2.8 2.8Surveying 0.8 2.8 1.8 0.6Visual Art & Design 107.3 116.6 158.3 169.9 182.1Visual Art & Design (Prison) 7.0Welding 8.6 11.6 14.7 22.4 20.4Total 4363.0 4884.0 5876.0 6041.0 5491.0
NOTE: Index code (ACBSSP) is included in the different departments.SOURCE: Official End of Term Enrollment Summary by Departments, 2008-2009 to 2012-2013
7

TABLE 3A.
FALL SEMESTER, 2012-2013OFFICIAL ENROLLMENT SUMMARY (BUDGET RELATED)
AVERAGE HC % FTE %2012-13 FALL SEMESTER OFFICIAL #'S (BUDGET RELATED IPEDS) 26042 15361.02012-13 FALL SEMESTER OFFICIAL #'S (BUDGET RELATED NON-IPEDS)** 160 2012-13 FALL SEMESTER OFFICIAL #'S (BUDGET RELATED TOTAL) 26161 *** 15361.0
2011-12 Fall Semester Official #'s & % Completed 27041 96.7% 15856.0 96.9%
AVERAGE CREDIT HOURS TAKENResident 8.75 25122 96.0% 14661.0 95.4%Non-Resident 10.11 1039 4.0% 700.0 4.6% Total 8.81 26161 15361.0
AVERAGE AGE OF STUDENTS *Resident 27.23Non-Resident 27.24
MALE TO FEMALE RATIO
Male 13012 49.7% Female 13149 50.3% Total 26161
WHERE STUDENTS COME FROMSalt Lake County 19298 73.8%Utah Excluding SL County 5824 22.3%US Excluding Utah/Foreign Countries 1039 3.9% Total 26161
LEVELS OF STUDENTSFirst Time Freshmen 3186 12.2%Other Freshmen 5590 21.4%Sophomores 17385 66.4% Total 26161
* Age is not a completely accurate figure in that some students choose not to release this information.** Budget Related Non-IPEDS = Budget Related Non-Credit STIT
*** Budget Related Total Headcount will not match Budget Related IPEDS & Non-IPEDS subtotals.A student is only counted once in the Budget Related Total. A student in both Budget Related types iscounted in both.
8

TABLE 3.
ENROLLMENT BY ACADEMIC DEPARTMENT - FALL SEMESTER FTE'S
DEPARTMENT 08-09 09-10 10-11 11-12 12-13Accounting 208.4 208.3 244.7 252.4 253.5Apprenticeship/Carpentry-Millwright 45.0 8.3 3.0Apprenticeship/Culinary Arts 64.8 1.3Apprenticeship/Electricity-Instrumentation 140.3 102.9 76.3 69.3 62.3Apprenticeship/General 33.6 17.3 16.2 6.9 7.4Apprenticeship/HVAC 13.3 10.3 9.7 5.7 7.0Apprenticeship/Lineman 25.7 16.7Apprenticeship/Plumbers-Pipefitters 186.3 160.5 117.5 84.1 76.7Apprenticeship/Stage Hands 6.7 4.7 9.3 7.3 5.7Architectural Tech 83.7 84.4 83.1 71.2 65.0Architectural Tech (Prison) 38.6ASL/Interpreting 77.4 97.2 75.4 61.0 56.1Automotive Collision Repair & Painting 25.6 29.6 25.6 30.7 28.0Automotive Technician 70.4 109.7 123.9 111.2 102.6Automotive Technician (Prison) 26.4Aviation Technology/Aviation Maintenance Tech 59.7 74.4 102.9 115.0 109.9Aviation Technology/Professional Pilot 43.3 50.6 68.7 65.1 72.1Barbering/Cosmetology 340.3 230.1 219.8 217.3 183.7Biology 861.7 1022.4 1008.3 969.3 936.0Biotechnology 13.8 16.5 22.3 31.9 24.6Bldg Construction (Prison) 56.3Bldg Construction/Construction Mgt 57.1 53.0 64.1 57.4 47.1Business Economics 239.2 249.0 295.6 257.6 252.6Business Management 350.6 346.1 374.5 315.3 284.7Chemistry 429.2 486.5 460.1 398.3 382.1Communication 585.0 653.4 756.0 694.2 652.1Computer Info Systems 576.3 645.9 718.8 684.5 425.4Computer Science 79.2 113.3 129.5 142.8 179.6Criminal Justice 173.6 255.3 310.4 340.4 279.1Culinary Arts 88.0 127.0 106.6 95.4Culinary Arts (Prison) 24.4Dental Hygiene 47.9 51.2 36.0 27.9 25.8Developmental Education 1489.7 1968.6 1847.2 1773.6Developmental Math 896.5Developmental Reading 233.1Developmental Writing 340.1Diesel Systems Technology 13.8 30.4 44.6 40.1 40.1Education 64.4 97.3 134.7 123.7 125.5Electronics & Instrumentation Tech 48.1 25.4 6.8Electronics (Prison) 28.7Engineering 77.2 106.3 122.3 150.4 146.3Engineering Design/Drafting Tech 49.2 56.9 64.1 69.1 62.5Engineering Design/Drafting Tech (Prison) 2.0English 809.7 1142.7 869.3 891.9 1032.4English Second Language 78.1 88.3 70.7 75.5 88.3Environmental Technology 19.8 18.5 11.2Family & Human Studies 179.1 238.1 292.1 201.7 170.7Fashion Institute 51.5 86.7 99.6 116.5 113.2Finance and Credit 136.9 141.9 162.6 144.5 143.5Fine Arts 485.2 552.9 673.6 635.6 644.6Geosciences 195.3 220.3 240.7 222.8 246.5Health & Lifetime Activities 562.5 635.6 745.4 738.2 696.4History/Anthropology 523.6 581.0 642.6 568.7 638.6Humanities 466.9 486.2 499.6 559.3 531.1Interior Design 57.7 58.7 73.3 80.3 56.5Languages 239.1 250.0 269.0 275.3 261.8Learning Enhancement 310.2Marketing 54.8 83.0 109.2 95.2 112.2Mathematics 1259.9 1487.9 1423.8 1445.5 1400.1Medical Assistant 86.1 146.0 154.1 98.8 93.1Mortuary Science 11.7Non-Destructive Testing Tech 19.7 23.6 24.0 23.7 14.4Nursing 212.0 236.1 225.3 232.9 222.3Occupational Therapy Asst 32.2 35.6 38.7 39.2 43.4Paralegal Studies 81.0 104.2 120.2 114.4 100.4Physical Therapist Asst 57.5 63.4 59.2 61.4 60.3Physics 218.5 255.2 251.0 238.5 248.1Political Science 142.7 155.5 179.1 160.6 157.4Psychology 476.7 576.3 561.1 527.7 529.6Radiologic Technology 69.3 67.7 65.5 57.1 53.7Social Work 66.4 71.9 99.0 92.1 84.0Sociology 231.4 261.1 280.6 265.4 240.2Surgical Technology 21.2 21.6 22.1 32.1 22.0Surveying 33.8 26.2 21.8 23.6 15.3Visual Art & Design 438.5 482.0 495.9 479.1 485.7Visual Art & Design (Prison) 9.8Welding 45.9 75.0 71.6 78.1 74.7COLLEGE GRAND TOTALS 14094.0 16154.0 16567.0 15856.0 15361.0
NOTE: Index code (ACBSSP) is included in the different departments.SOURCE: Official Third Week Enrollment Summary by Departments, 2008-2009 to 2012-2013
9

TABLE 4A.
SPRING SEMESTER, 2012-2013OFFICIAL ENROLLMENT SUMMARY (BUDGET RELATED)
AVERAGE HC % FTE %2012-13 SPRING SEMESTER OFFICIAL #'S (BUDGET RELATED IPEDS) 25788 15065.02012-13 SPRING SEMESTER OFFICIAL #'S (BUDGET RELATED NON-IPEDS)** 118 2012-13 SPRING SEMESTER OFFICIAL #'S (BUDGET RELATED TOTAL) 25873 *** 15065.0
2011-12 Spring Semester Official #'s & % Completed 27022 95.7% 15815.0 95.3%
AVERAGE CREDIT HOURS TAKENResident 8.68 24970 96.5% 14445.0 95.9%Non-Resident 10.30 903 3.5% 620.0 4.1% Total 8.73 25873 15065.0
AVERAGE AGE OF STUDENTS *Resident 26.22Non-Resident 26.27
MALE TO FEMALE RATIOMale 13018 50.3%Female 12855 49.7% Total 25873
WHERE STUDENTS COME FROMSalt Lake County 19088 73.8%Utah Excluding SL County 5882 22.7%US Excluding Utah & Foreign Countries 903 3.5% Total 25873
LEVELS OF STUDENTSFirst Time Freshmen 1614 6.2%Other Freshmen 6036 23.3%Sophomores 18223 70.5% Total 25873
* Age is not a completely accurate figure in that some students choose not to release this information.** Budget Related Non-IPEDS = Budget Related Non-Credit STIT
*** Budget Related Total Headcount will not match Budget Related IPEDS & Non-IPEDS subtotals.A student is only counted once in the Budget Related Total. A student in both Budget Related types iscounted in both.
10

TABLE 4.
ENROLLMENT BY ACADEMIC DEPARTMENT - SPRING SEMESTER FTE'S
DEPARTMENT 08-09 09-10 10-11 11-12 12-13Accounting 207.2 230.0 243.8 251.7 246.1Apprenticeship/Carpentry-Millwright 11.0 35.3 27.3 20.0Apprenticeship/Culinary Arts 58.0Apprenticeship/Electricity-Instrumentation 117.4 94.3 78.3 69.7 66.3Apprenticeship/General 31.9 7.9 9.1 8.8 2.0Apprenticeship/HVAC 11.7 8.7 7.3 6.0 5.0Apprenticeship/Lineman 22.3 18.3 20.3Apprenticeship/Plumbers-Pipefitters 178.3 142.5 115.7 75.1 81.5Apprenticeship/Stage Hands 4.0 5.0 6.3 5.7 4.0Architectural Tech 72.3 75.7 73.9 53.3 63.9Architectural Tech (Prison) 23.8ASL/Interpreting 87.0 102.6 75.3 66.3 63.9Automotive Collision Repair & Painting 21.3 26.4 26.5 34.3 27.1Automotive Technician 59.8 113.1 111.8 110.8 101.5Automotive Technician (Prison) 28.0Aviation Technology/Aviation Maintenance Tech 56.1 91.5 115.9 136.4 119.5Aviation Technology/Professional Pilot 35.0 54.0 64.3 56.4 100.1Barbering/Cosmetology 323.0 255.8 225.3 200.0 149.0Biology 862.3 1116.9 1037.8 1023.3 945.3Biotechnology 15.6 27.7 25.1 26.5 27.4Bldg Construction/Construction Mgt 56.3 50.6 58.7 50.7 46.9Bldg Construction (Prison) 60.7Business Economics 238.6 257.4 269.2 243.8 229.8Business Management 345.0 348.9 344.3 323.0 309.0Chemistry 442.5 453.8 441.5 431.5 405.6Communication 523.4 623.7 705.4 708.7 651.6Computer Info Systems 541.9 624.3 625.8 593.5 338.5Computer Science 89.5 127.6 153.5 168.8 197.7Criminal Justice 208.5 282.0 319.9 278.7 273.6Culinary Arts 101.2 109.3 97.9 82.1Culinary Arts (Prison) 32.2Dental Hygiene 45.0 46.7 32.9 25.0 25.1Developmental Education 1415.6 1754.1 1667.8 1741.6Developmental Math 916.1Developmental Reading 198.5Developmental Writing 286.5Diesel Systems Technology 14.5 28.4 41.5 44.1 36.2Education 83.3 117.0 125.4 127.9 123.9Electronics & Instrumentation Tech 36.8 15.9 7.9Electronics (Prison) 9.2Engineering 97.8 114.8 146.5 164.8 149.2Engineering Design/Drafting Tech 41.3 60.3 63.9 61.9 63.5Engineering Design/Drafting Tech (Prison) 5.6English 874.6 1155.8 941.7 1008.2 1141.9English Second Language 75.3 70.0 71.1 72.8 64.7Environmental Technology 19.9 17.3 14.0Family & Human Studies 132.1 162.2 176.8 148.9 150.5Fashion Institute 62.9 85.0 94.9 109.3 108.2Finance and Credit 127.1 133.7 121.3 143.6 129.3Fine Arts 486.5 572.2 684.6 674.4 637.4Geosciences 185.6 223.3 245.5 264.9 253.5Health Information Technology 22.1Health & Lifetime Activities 591.1 693.9 772.7 705.1 662.9History/Anthropology 520.8 585.1 640.4 648.8 599.6Humanities 449.0 512.4 551.0 499.0 429.8Interior Design 49.1 53.7 70.7 66.6 54.4Languages 219.1 255.8 258.5 208.5 195.1Learning Enhancement 266.1Marketing 64.2 78.6 88.6 84.2 104.7Mathematics 1257.6 1511.4 1408.6 1428.1 1478.9Medical Assistant 93.5 145.6 112.1 117.7 93.3Mortuary Science 9.3 13.5Non-Destructive Testing Tech 15.9 22.3 16.2 16.0 23.2Nursing 220.3 203.2 223.7 221.2 229.7Occupational Therapy Asst 37.5 35.6 41.2 46.7 45.8Paralegal Studies 79.7 104.4 109.7 104.6 93.1Physical Therapist Asst 39.2 41.7 41.0 35.2 38.5Physics 247.6 284.6 285.7 257.7 245.4Political Science 151.8 152.2 157.8 154.7 167.5Psychology 452.1 559.7 548.2 535.1 499.1Radiologic Technology 65.9 61.7 65.0 58.6 58.8Social Work 66.1 73.9 87.9 86.4 97.1Sociology 223.4 237.2 261.8 246.6 200.6Surgical Technology 12.9 12.8 11.2 12.0 9.6Surveying 27.3 25.7 22.3 23.4 16.4Visual Art & Design 440.1 482.6 481.0 523.4 526.1Visual Art & Design (Prison) 4.7Welding 47.7 73.0 71.3 77.5 71.8TOTAL 13832.0 16043.0 16052.0 15815.0 15065.0
NOTE: Index Code (ACBSSP) is included in the different departments.SOURCE: Official Third Week Enrollment Summary by Departments, 2008-2009 to 2012-2013
11

TABLE 5.
2011-2012 ENROLLMENT BY ACADEMIC DEPARTMENT - ANNUALIZED FTE'SSUMMER FALL SPRING ANNUALIZED
END OF TERM END OF TERM END OF TERM FTE'S (AFTE'S)DEPARTMENT 2011-2012 2011-2012 2011-2012 2011-2012
Accounting 99.4 249.5 248.5 298.7Apprenticeship/Carpentry-Millwright 20.0 10.0Apprenticeship/Electricity-Instrumentation 8.3 69.0 69.7 73.5Apprenticeship/General 3.8 5.7 9.4 9.4Apprenticeship/HVAC 6.3 6.3 6.3Apprenticeship/Lineman 20.3 10.2Apprenticeship/Plumbers-Pipefitters 0.7 84.0 76.2 80.5Apprenticeship/Stage Hands 0.3 8.7 5.7 7.3Architectural Tech 12.5 69.9 53.1 67.8ASL/Interpreting 12.4 60.0 66.0 69.2Automotive Collision Repair & Painting 29.9 35.7 32.8Automotive Technician 14.0 105.5 106.6 113.1Aviation Technology/Aviation Maintenance Tech 51.3 115.7 136.4 151.7Aviation Technology/Professional Pilot 20.3 64.3 57.2 70.9Barbering/Cosmetology 114.6 214.1 200.7 264.7Biology 346.5 958.2 1010.9 1157.8Biotechnology 0.7 32.0 26.3 29.5Bldg Construction/Construction Mgt 12.1 58.3 54.6 62.5Business Economics 121.6 254.2 242.8 309.3Business Management 127.8 311.3 320.7 379.9Chemistry 241.1 394.4 428.5 532.0Communication 210.5 693.8 704.1 804.1Computer Info Systems 246.8 671.4 584.3 751.3Computer Science 57.6 144.3 167.3 184.6Criminal Justice 173.3 336.0 277.7 393.5Culinary Arts 36.9 104.4 95.3 118.3Dental Hygiene 27.1 25.1 26.1Developmental Education 723.3 1748.2 1724.2 2097.8Diesel Systems Technology 43.3 45.1 44.2Education 35.2 122.3 127.3 142.4Engineering 74.3 149.2 163.3 193.4Engineering Design/Drafting Tech 17.4 69.3 60.1 73.4English 499.7 891.9 1002.8 1197.1English Second Language 40.1 76.7 71.8 94.3Family & Human Studies 42.0 202.4 153.0 198.7Fashion Institute 16.0 115.7 108.9 120.3Finance and Credit 53.7 143.9 142.0 169.8Fine Arts 228.0 628.0 675.6 765.8Geosciences 91.7 222.5 263.9 289.0Health & Lifetime Activities 357.9 732.9 702.2 896.5History/Anthropology 203.2 562.4 639.9 702.8Humanities 196.4 552.9 496.4 622.9Interior Design 12.9 79.7 66.4 79.5Languages 59.6 266.5 207.5 266.8Marketing 25.1 94.3 83.3 101.3Mathematics 648.9 1428.5 1415.3 1746.4Medical Assistant 71.5 98.1 116.4 143.0Mortuary Science 9.1 4.6Non-Destructive Testing Tech 21.0 14.9 17.9Nursing 19.3 231.6 219.1 235.0Occupational Therapy Asst 4.1 45.7 47.2 48.5Paralegal Studies 49.1 113.6 104.6 133.6Physical Therapist Asst 14.0 55.1 35.6 52.4Physics 88.1 238.5 257.1 291.8Political Science 50.3 159.2 156.3 182.9Psychology 197.7 517.7 531.3 623.4Radiologic Technology 24.1 57.1 58.6 69.9Short-Term Intensive Training 20.0 10.0Social Work 21.2 91.5 87.3 100.0Sociology 66.8 263.0 243.6 286.7Surgical Technology 2.8 31.3 12.1 23.1Surveying 1.8 22.9 22.5 23.6Visual Art & Design 169.9 469.3 520.1 579.7Welding 22.4 76.8 77.8 88.5COLLEGE GRAND TOTALS 6041.0 15711.0 15712.0 18732.0
SOURCE: Official Enrollment Summary by Departments, Summer, Fall, & Spring End of Term, 2011-2012
12

TABLE 6.
ENROLLMENT BY ACADEMIC DEPARTMENT - ANNUALIZED FTE'S
DEPARTMENT 2007-2008 2008-2009 2009-2010 2010-2011 2011-2012Accounting 250.6 232.9 247.7 282.8 298.7Apprenticeship/Carpentry-Millwright 54.2 28.0 22.0 15.2 10.0Apprenticeship/Culinary Arts 54.6 76.1 1.0Apprenticeship/Electricity-Instrumentation 160.5 146.7 107.8 84.5 73.5Apprenticeship/General 68.0 36.7 17.6 16.2 9.4Apprenticeship/HVAC 11.4 12.7 9.5 9.2 6.3Apprenticeship/Ironworkers 5.7Apprenticeship/Lineman 24.0 17.8 10.2Apprenticeship/Plumbers-Pipefitters 225.0 197.4 155.6 118.2 80.5Apprenticeship/Stage Hands 5.7 5.4 5.9 9.5 7.3Architectural Tech 87.8 79.4 83.5 84.1 67.8Architectural Tech (Prison) 34.3 2.9ASL/Interpreting 87.4 89.0 112.0 83.5 69.2Automotive Collision Repair & Painting 16.6 22.9 29.0 26.1 32.8Automotive Technician 50.6 66.2 107.3 115.2 113.1Automotive Technician (Prison) 39.0 33.4 3.8Aviation Technology/Aviation Maintenance Tech 71.4 66.3 91.3 128.8 151.7Aviation Technology/Professional Pilot 46.5 42.6 57.2 73.6 70.9Barbering/Cosmetology 447.3 421.8 309.2 287.1 264.7Biology 963.5 984.4 1224.6 1230.8 1157.8Biotechnology 16.9 17.9 23.1 26.0 29.5Bldg Construction/Construction Mgt 79.6 61.3 55.0 65.3 62.5Bldg Construction (Prison) 92.8 79.6 2.7Business Economics 285.7 285.8 306.9 354.4 309.3Business Management 382.0 399.5 408.7 435.6 379.9Chemistry 531.7 540.5 597.3 591.1 532.0Communication 574.8 625.0 731.8 828.5 804.1Computer Info Systems 594.0 634.8 714.2 780.1 751.3Computer Science 73.6 100.9 134.8 161.2 184.6Criminal Justice 218.1 228.9 324.2 389.5 393.5Culinary Arts 109.2 142.7 118.3Culinary Arts (Prison) 45.2 47.7 5.7Dental Hygiene 39.0 46.8 50.1 34.5 26.1Developmental Education 1293.0 1656.0 2118.7 2078.6 2097.8Diesel Systems Technology 19.5 15.4 30.2 43.3 44.2Education 59.8 80.5 118.5 143.6 142.4Electrical & Instrumentation Tech 27.8Electronics 26.0Electronics & Instrumentation Tech 55.6 29.2 10.4Electronics (Prison) 35.1 30.9Engineering 117.5 107.7 129.3 164.3 193.4Engineering Design/Drafting Tech 83.1 51.2 67.3 69.4 73.4Engineering Design/Drafting Tech (Prison) 3.6Engineer Des/Draft Tech/Arch Tech (Prison) 64.9English 955.7 1017.9 1331.3 1125.1 1197.1English Second Language 90.3 96.1 97.4 87.7 94.3Environmental Technology 21.3 23.3 21.4 14.8Family & Human Studies 221.5 205.4 232.4 267.6 198.7Fashion Institute 45.0 61.0 91.2 106.5 120.3Finance and Credit 159.4 149.1 153.3 167.8 169.8Fine Arts 536.0 563.9 653.0 779.3 765.8Geosciences 208.8 214.3 259.0 289.1 289.0Health & Lifetime Activities 584.6 675.0 781.5 903.0 896.5History/Anthropology 554.3 577.9 647.4 713.8 702.8Humanities 477.4 514.7 572.2 606.8 622.9Interior Design 53.4 59.8 61.2 79.4 79.5Languages 251.7 246.2 269.1 277.8 266.8Marketing 70.5 63.3 89.0 109.4 101.3Mathematics 1330.9 1484.5 1774.4 1739.9 1746.4Medical Assistant 95.0 117.2 176.6 181.6 143.0Medical Lab Technology 5.9 0.5Mortuary Science 4.6Non-Destructive Testing Tech 18.4 17.0 23.0 20.5 17.9Nursing 197.6 228.9 232.9 237.2 235.0Occupational Therapy Asst 42.6 39.1 37.7 41.2 48.5Paralegal Studies 95.0 96.5 121.0 134.3 133.6Physical Therapist Asst 54.2 52.9 59.4 56.7 52.4Physics 277.3 275.6 317.3 316.1 291.8Political Science 161.6 165.4 173.3 195.5 182.9Psychology 489.3 521.5 640.6 636.3 623.4Radiologic Technology 85.1 78.2 77.4 75.7 69.9Short-Term Intensive Training 18.5 21.5 22.0 17.0 10.0Social Work 78.4 70.8 80.5 101.7 100.0Sociology 270.7 258.3 283.9 309.6 286.7Surgical Technology 19.0 18.7 19.4 19.4 23.1Surveying 31.0 26.4 23.9 23.6Telecommunications 46.2 Visual Art & Design 447.8 501.4 540.1 564.1 579.7Visual Art & Design (Prison) 11.3 10.5Welding 40.9 48.3 79.9 79.1 88.5COLLEGE GRAND TOTALS 15321.5 16151.5 18514.0 19179.0 18732.0
SOURCE: Official Enrollment Summary by Departments, 2007-2008 to 2011-2012
13

GRAPH 7.
14
0
3,000
6,000
9,000
12,000
15,000
08-09 09-10 10-11 11-12 12-13
STUDENT HC ENROLLMENT PER CREDIT HOUR FALL SEMESTER
0 - 6 CREDIT HOURS 7 - 12 CREDIT HOURS
13 - 18 CREDIT HOURS 19 & OVER CREDIT HOURS

TABLE 7.
STUDENT HEADCOUNT ENROLLMENT PER CREDIT HOUR
FALL HEADCOUNT
2008-2009 2009-2010 2010-2011 2011-2012 2012-2013Credit Hours HC % of Total HC % of Total HC % of Total HC % of Total HC % of Total
0 - 3 6563 21.97% 6993 20.71% 6291 18.51% 6031 18.19% 4933 16.38%
4 - 6 7368 24.67% 8040 23.80% 8141 23.96% 8195 24.71% 7093 23.56%
7 - 9 5557 18.61% 6317 18.70% 6584 19.37% 6617 19.95% 6216 20.64%
10 - 12 5265 17.63% 6383 18.90% 6909 20.33% 6721 20.26% 6365 21.14%
13 - 15 3825 12.81% 4483 13.27% 4626 13.61% 4275 12.89% 4202 13.95%
16 - 18 1108 3.71% 1374 4.07% 1233 3.63% 1151 3.47% 1099 3.65%
19 - 21 161 0.54% 175 0.52% 186 0.55% 163 0.49% 190 0.63%
Over 21 19 0.06% 9 0.03% 13 0.04% 14 0.04% 14 0.05%
Total 29866 33774 33983 33167 30112
NOTE: Totals = Institution Grand TotalsSOURCE: Utah Board of Regents' Official Reports, Fall Semester, 2008-2009 to 2012-2013
15

TABLE 8.
SALT LAKE COMMUNITY COLLEGEAVERAGE CREDIT HOURS TAKEN
RESIDENTS NON-RESIDENTS TOTALSUMMER TERM
1998-99 8.15 12.49 8.391999-00 5.16 7.43 5.292000-01 5.69 7.37 5.782001-02 5.92 7.75 6.042002-03 6.26 7.33 6.322003-04 6.44 7.42 6.492004-05 6.47 7.56 6.532005-06 6.32 7.59 6.402006-07 6.22 7.38 6.292007-08 6.14 6.96 6.192008-09 6.22 7.32 6.302009-10 6.43 7.28 6.472010-11 6.67 7.61 6.722011-12 6.73 7.74 6.782012-13 6.44 7.84 6.50
FALL SEMESTER1998-99 8.38 10.64 8.451999-00 8.52 11.03 8.602000-01 8.54 10.89 8.612001-02 8.02 10.71 8.722002-03 9.10 9.29 9.112003-04 8.91 10.41 8.972004-05 8.75 7.47 8.682005-06 8.45 9.84 8.512006-07 8.57 9.64 8.622007-08 8.53 9.23 8.572008-09 8.59 9.43 8.642009-10 8.68 10.05 8.742010-11 8.67 10.17 8.742011-12 8.75 9.88 8.802012-13 8.75 10.11 8.81
SPRING SEMESTER1998-99 8.42 10.78 8.511999-00 8.20 10.94 8.282000-01 8.65 10.33 8.102001-02 8.71 9.85 8.752002-03 9.03 10.04 9.062003-04 8.81 10.19 8.862004-05 8.81 9.87 8.852005-06 8.56 9.85 8.612006-07 8.47 9.32 8.512007-08 8.45 9.18 8.492008-09 8.58 9.71 8.642009-10 8.79 9.84 8.832010-11 8.79 9.93 8.832011-12 8.73 10.03 8.782012-13 8.68 10.30 8.73
SOURCE: Utah Board of Regents' Official Reports, 1998-99 to 2012-2013
16

TABLE 9.
FALL 2008-2009 TO 2012-2013 AVERAGE CLASS SIZE
D E P A R T M E N T 2008-2009 2009-2010 2010-2011 2011-2012 2012-2013 *** AverageAccounting 18.05 19.75 22.57 23.35 21.61 21.07Apprenticeship/Carpentry-Millwright 15.00 8.33 9.00 10.78Apprenticeship/Culinary Arts 17.00 1.00 9.00Apprenticeship/Electricity-Instrumentation 16.19 11.88 15.27 13.87 14.54 14.30Apprenticeship/General 9.87 3.81 9.00 6.00 6.00 6.94Apprenticeship/HVAC 8.00 6.20 5.80 4.25 9.50 6.75Apprenticeship/Lineman 2.17 2.17Apprenticeship/Plumbers-Pipefitters 12.85 12.72 11.67 8.88 9.49 11.12Apprenticeship/Stage Hands 5.00 8.50 7.00 7.33 5.67 6.70Architectural Technology 17.68 17.17 17.00 14.78 15.55 16.44Architectural Technology (Prison) ** 21.75 21.75ASL/Interpreting 10.38 12.47 11.33 10.57 10.85 11.12Automotive Collision Repair & Painting 16.00 18.50 16.00 19.25 17.50 17.45Automotive Technician 12.36 19.14 22.11 18.06 19.00 18.13Automotive Technician (Prison) ** 9.92 9.92Aviation Technology/Aviation Maintenance Tech 11.18 11.38 16.75 17.85 17.92 15.02Aviation Technology/Professional Pilot 10.79 14.47 13.34 12.96 15.26 13.36Barbering/Cosmetology 16.53 17.92 16.77 16.19 13.73 16.23Biology 24.52 26.44 25.99 24.94 23.77 25.13Biotechnology 7.88 6.42 9.79 9.55 7.55 8.24Bldg Construction/Construction Mgt 9.83 10.67 14.10 15.12 11.74 12.29Bldg Construction (Prison) ** 6.78 6.78Business Economics 21.36 23.47 27.89 26.29 26.31 25.06Business Management 20.51 19.44 21.28 18.99 17.05 19.45Chemistry 24.40 25.42 25.84 22.71 22.94 24.26Communication 19.18 21.46 23.12 22.14 20.44 21.27Computer Info Systems 21.66 23.61 25.86 25.20 19.76 23.22Computer Science 14.16 15.08 15.92 18.44 17.65 16.25Criminal Justice 11.76 16.26 19.99 19.73 17.68 17.08Culinary Arts 20.85 26.65 19.54 17.67 21.18Culinary Arts (Prison) ** 10.91 10.91Dental Hygiene 26.50 27.69 19.38 15.62 14.62 20.76Developmental Math 20.79 20.79Developmental Reading 19.10 19.10Developmental Writing 19.28 19.28Developmental Education 19.86 23.00 20.75 20.88 21.12Diesel Systems Technology 11.50 14.17 22.13 17.78 17.78 16.67Education 16.80 23.27 27.08 27.08 27.42 24.33Electronics & Instrumentation Tech ** 8.92 7.59 3.75 6.75Electronics (Prison) ** 16.67 16.67Engineering 8.54 9.97 10.69 11.51 13.32 10.81Engineering Design/Drafting Tech 11.52 13.32 13.52 14.47 13.59 13.28Engineering Design/Drafting Tech (Prison) ** 15.00 15.00English 21.67 23.32 21.86 21.88 22.18 22.18English Second Language 14.29 20.18 14.92 17.50 21.60 17.70Environmental Technology ** 13.13 13.71 11.20 12.68Family & Human Studies 14.66 15.79 17.92 15.82 24.37 * 17.71Fashion Institute 12.08 19.26 19.03 18.38 14.56 16.66Finance and Credit 19.94 22.03 23.71 23.68 24.90 22.85Fine Arts 13.16 16.39 18.85 15.25 24.82 17.69Geosciences 19.15 18.68 23.13 23.88 24.13 21.79Health & Lifetime Activities 16.64 18.46 21.29 20.26 21.55 19.64History/Anthropology 23.19 26.45 30.89 29.00 29.32 27.77Humanities * 23.85 28.06 29.39 29.48 27.71 27.70Interior Design 12.00 14.10 16.05 16.42 13.38 14.39Languages 15.19 18.34 19.47 19.51 19.27 18.36Learning Enhancement 22.71 22.71Marketing 12.29 13.14 18.78 17.60 19.09 16.18Mathematics 26.47 29.44 28.97 29.16 27.06 28.22Medical Assistant 13.21 22.20 22.26 19.10 20.38 19.43Mortuary Science 11.50 11.50Non-Destructive Testing Tech 16.33 23.29 13.75 18.75 13.25 17.07Nursing 16.06 16.29 17.63 17.88 17.52 17.08Occupational Therapy Asst 12.68 14.21 14.70 14.80 17.16 14.71Paralegal Studies 13.00 16.55 16.67 16.26 15.15 15.53Physical Therapist Asst 13.71 16.08 14.75 17.14 16.63 15.66Physics 20.20 22.28 23.20 24.51 24.38 22.91Political Science 23.03 26.60 30.43 30.00 30.27 28.07Psychology 25.65 28.85 29.23 29.32 28.79 28.37Radiologic Technology 26.53 24.94 23.88 21.19 20.67 23.44Short-Term Intensive Training (Non-credit) 9.00 5.29 4.67 4.39 6.14 5.90Social Work 17.05 23.12 27.11 28.59 24.72 24.12Sociology 28.22 31.95 31.89 30.86 28.60 30.30Surgical Technology 9.13 9.88 11.29 11.89 9.25 10.29Surveying 14.92 11.08 10.25 12.18 6.85 11.06Visual Art & Design 13.74 14.35 14.23 14.92 17.78 15.00Visual Art & Design (Prison) ** 16.33 16.33Welding 8.23 13.05 11.50 15.65 14.90 12.67COLLEGE AVERAGE CLASS SIZE 18.30 20.40 21.36 20.87 21.08 20.40
NOTE: Index code (ACBSSP) is distributed throughout the appropriate index code/department. Courses with "0" enrollment were excluded. * FHS 0010/0020 were excluded. ** Program eliminated. *** Cross-listed courses are combined.
17

TAB B. STEP AHEAD
STUDENT DEMOGRAPHICS
Salt Lake Community College served 30,112 students in credit and non-
credit programs during Fall Semester 2012 (not including the Division of Applied
Technology). This is 18% of all students reported by the Utah System of Higher
Education. (This does not include the counts within workshops and specialized
training programs offered by the Division of Applied Technology.)
Salt Lake Community College’s Non-white population is the largest of all
USHE institutions. One notable change in SLCC’s demographics is an increase in
female students attending the College. Since Fall Semester 2003-2004, the
number of female students attending the College has increased by 14.4%, while
the number of male students has increased by 6.0%.
18
Fast Facts
• Fall 12-13 Average Age = 27.23 • Fall 12-13 Non-white Population = 19.9%
• Fall 12-13 Female to Male Ratio = 1.01:1

TABLE 10.
STUDENT ENROLLMENT BY MAJORSFall Headcount (Credit Students)
DEPARTMENT 08-09 09-10 10-11 11-12 12-13Accounting 245 287 318 267 312Air-Conditioning, Refrigeration & Heating 44 37 32 19 21Apprenticeship (all) 1020 764 601 498 439Architectural Technology 296 229 227 207 185ASL/Interpreting 128 131 139 119 106Automotive Collision Repair & Painting 28 47 34 60 54Automotive Technician 158 168 182 146 149Aviation Technology/Aviation Maintenance Tech 90 106 123 150 139Aviation Technology/Professional Pilot 148 188 224 237 253Barbering/Cosmetology 504 365 345 330 227Biology 269 309 374 410 466Biotechnology 55 70 99 127 131Broadcast Video/Audio Production 6 20 24 16 12Building Construction/Construction Mgt (all) 351 258 226 169 130Business 1427 1563 1574 1785 1750Business Management 357 362 382 350 393Chemistry 162 199 188 214 193Communication (all) 267 190 281 246 322Computer Info Systems 238 298 332 311 311Computer Science 332 339 366 508 590Continuing Ed Programs 59 55 39 33 25Criminal Justice 447 560 677 700 657Culinary Arts 162 174 237 224 229Dental Hygiene 55 57 40 33 29Diesel Systems Technology 56 51 66 55 61Economics 41 41 53 54 53Education 426 554 507 571 587Electrical & Instrumentation Tech *** 25Electronics & Instrumentation Tech 81 34 27 2Electronics Technology 84Energy Management 31 30 23Engineering (all) 452 646 724 757 867Engineering Design/Drafting Tech 92 110 135 197 174English 194 246 259 314 286Environmental Technology 28 37 19 10 7Family & Human Studies 55 65 69 133 129Fashion Institute 43 86 111 138 175Film Production Technician 57 71 96 111 142Finance and Credit 69 74 71 65 66Fitness Technician 43 80 112 102 93General Studies * 14372 17135 16429 14767 11622Geosciences 36 51 59 83 85Health Sciences ** 2577 3326 3571 3458 3516History 107 123 129 140 142Humanities 56 66 74 145 120Interior Design 50 71 98 107 93International Studies 68 83 72 85 56Marketing Mgt 76 91 94 109 87Mathematics 17 41 76 94 101Medical Assistant 138 230 279 268 238Medical Lab Technology 7 2 2 2Mortuary Science 1 52Music 96 107 130 112 117Non-Destructive Testing Tech 32 37 26 17 19Nursing ** 472 468 372 474 477Occupational Therapy Asst 37 44 44 49 47Para Education 21 12 41 29 24Paralegal Studies 172 237 241 227 215Physical Therapist Asst 59 57 51 50 51Physics 36 43 50 63 68Political Science 79 81 75 84 78Psychology 354 429 479 517 495Radiologic Technology 86 84 79 68 65Social Sciences 2 1 1Social Work 210 224 278 329 341Sociology 95 120 140 172 149Surgical Technology 21 33 26 24 20Surveying 70 52 46 40 34Unknown 4 5Visual Art & Design (all) 474 590 555 682 797Welding 52 72 74 79 70 COLLEGE GRAND TOTALS 28385 32831 32947 31999 28967
NOTE: Due to the reporting procedures, the report equals "IPEDS Total" or credit students, not the "Budget Related or the Institution Total".* Due to the reporting procedures, concurrent enrollment students are in the report for third week, starting 2008-2009.
** Health Sciences includes students with an AAS in a specific area earning an AS in Health Science, and students in all health-related programs prior to their formal admittance into those specific programs. Nursing numbers previously included all health science students and are now separately identified.
*** Students are combined with Apprenticeship/Electricity-Instrumentation. Studies have found this report to be about 80% accurate.
SOURCE: Utah Board of Regents' Official Reports, Fall Semester, 2008-2009 to 2012-2013
19

TABLE 11.STUDENT ENROLLMENT BY MAJORS AND BY GENDER
Fall Headcount (Credit Students) 2008-09 2009-10 2010-11 2011-12 2012-13
Department Male Female Male Female Male Female Male Female Male FemaleAccounting 94 151 108 179 119 199 101 166 103 209Air-Conditioning, Refrigeration & Heating 43 1 37 0 31 1 19 0 21 0Apprenticeship (all) 995 25 745 19 584 17 484 14 430 9Architectural Technology 245 51 183 46 191 36 171 36 144 41ASL/Interpreting 11 117 14 117 15 124 14 105 15 91Automotive Collision Repair & Painting 26 2 43 4 33 1 58 2 50 4Automotive Technician 153 5 158 10 172 10 142 4 143 6Aviation TechnologyAviation Maintenance Tech 87 3 104 2 117 6 143 7 127 12Aviation Technology/Professional Pilot 133 15 166 22 202 22 218 19 232 21Barbering/Cosmetology 28 476 14 351 25 320 20 310 15 212Biology 149 120 158 151 220 154 219 191 226 240Biotechnology 26 29 36 34 53 46 61 66 77 54Broadcast Video/Audio Production 4 2 14 6 21 3 13 3 10 2Building Construction/Construction Mgt (all) 320 31 244 14 216 10 161 8 119 11Business 935 492 977 586 957 617 1096 689 1073 677Business Management 230 127 228 134 219 163 219 131 230 163Chemistry 105 57 128 71 123 65 130 84 122 71Communication (all) 146 121 97 93 152 129 111 135 165 157Computer Info Systems 197 41 247 51 279 53 260 51 262 49Computer Science 301 31 311 28 328 38 460 48 528 62Continuing Ed Programs 24 35 14 41 15 24 16 17 8 17Criminal Justice 261 186 354 206 416 261 432 268 397 260Culinary Arts 86 76 91 83 130 107 120 104 101 128Dental Hygiene 1 54 1 56 0 40 1 32 1 28Diesel Systems Technology 56 0 50 1 64 2 54 1 59 2Economics 34 7 31 10 43 10 45 9 44 9Education 95 331 124 430 93 414 116 455 118 469Electrical & Instrumentation Tech *** 24 1Electronics & Instrumentation Tech 77 4 31 3 26 1 2 0Electronics Technology 82 2Energy Management 27 4 25 5 20 3Engineering (all) 414 38 591 55 649 75 681 76 772 95Engineering Design/Drafting Tech 73 19 92 18 117 18 179 18 159 15English 65 129 80 166 100 159 110 204 88 198Environmental Technology 15 13 24 13 14 5 7 3 6 1Family & Human Studies 5 50 6 59 7 62 17 116 17 112Fashion Institute 2 41 12 74 10 101 8 130 11 164Film Production Technician 41 16 56 15 81 15 85 26 106 36Finance and Credit 34 35 42 32 43 28 35 30 43 23Fitness Technician 20 23 41 39 65 47 59 43 46 47General Studies * 7139 7233 8403 8732 7907 8522 6984 7783 5565 6057Geosciences 26 10 34 17 37 22 54 29 57 28Health Sciences ** 512 2065 722 2604 864 2707 848 2610 875 2641History 58 49 76 47 79 50 74 66 79 63Humanities 18 38 23 43 32 42 48 97 43 77Interior Design 1 49 4 67 2 96 4 103 7 86International Studies 47 21 47 36 37 35 46 39 31 25Marketing Mgt 42 34 55 36 56 38 56 53 48 39Mathematics 10 7 24 17 37 39 48 46 55 46Medical Assistant 25 113 33 197 41 238 44 224 28 210Medical Lab Technology 3 4 1 1 0 2 0 2 Mortuary Science 0 1 17 35Music 57 39 67 40 74 56 73 39 78 39Non-Destructive Testing Tech 27 5 30 7 23 3 16 1 19 0Nursing ** 94 378 98 370 68 304 88 386 91 386Occupational Therapy Asst 6 31 7 37 10 34 10 39 9 38Para Education 3 18 3 9 8 33 7 22 5 19Paralegal Studies 31 141 53 184 48 193 39 188 42 173Physical Therapist Asst 18 41 14 43 9 42 10 40 11 40Physics 27 9 36 7 41 9 51 12 59 9Political Science 50 29 57 24 50 25 55 29 49 29Psychology 115 239 146 283 145 334 159 358 165 330Radiologic Technology 25 61 33 51 28 51 22 46 23 42Social Sciences 0 2 0 1 0 1Social Work 39 171 44 180 80 198 89 240 85 256Sociology 33 62 37 83 43 97 55 117 46 103Surgical Technology 6 15 11 22 3 23 9 15 6 14Surveying 65 5 50 2 43 3 37 3 32 2Unknown 4 0 1 4Visual Art & Design (all) 205 269 308 282 266 289 346 336 414 383Welding 49 3 70 2 72 2 74 5 66 4COLLEGE GRAND TOTALS 14291 14094 16188 16643 16066 16881 15462 16537 14095 14872
NOTE: Due to the reporting procedures, the report equals "IPEDS Total" or credit students, not the "Budget Related or the Institution total".* Due to the reporting procedures, concurrent enrollment students are in the report for third week, starting 2008-2009.
** Health Sciences includes students with an AAS in a specific area earning an AS in Health Science, and students in all health-related programs priorto their formal admittance into those specific programs. Nursing numbers previously included all health science students and are now separately identified.
*** Students are combined with Apprenticeship/Electricity-Instrumentation.Studies have found this report to be about 80% accurate.
SOURCE: Utah Board of Regents' Official Reports, Fall Semester, 2008-2009 to 2012-2013
20

GRAPH 12.
21
0 500 1000 1500 2000
South Jordan - 84095West Jordan - 84081
Bennion/Kearns - 84118West Valley City (Granger) - 84119
Riverton - 84065Taylorsville/Murray - 84123
West Jordan - 84088West Valley City (Hunter) - 84120
Cottonwood Heights - 84121Draper - 84020
West Jordan - 84084Murray - 84107
Granite/Millcreek - 84106Sandy Central - 84094
Sandy South East - 84092Herriman - 84096
West Valley City (Hunter West) - 84128Midvale - 84047
Bountiful - 84010Taylorsville - 84129
Sandy West - 84070Rose Park/Airport Area - 84116
South Salt Lake - 84115Magna - 84044
Sandy North East - 84093Holladay - 84117
East Millcreek - 84109Sugarhouse - 84105
North And East Holladay - 84124Downtown East - 84102
Glendale/West Salt Lake City - 84104Avenues/North Downtown - 84103
Tooele - 84074East Salt Lake City - 84108
Downtown - 84111Lehi - 84043
North Salt Lake - 84054Woods Cross - 84087
Eagle Mountain - 84005Kaysville - 84037
Centerville - 84014Layton - 84041
Clearfield - 84015Farmington - 84025
Park City - 84098American Fork - 84003
Saratoga Springs - 84045Downtown West - 84101Pleasant Grove - 84062
Layton - 84040Grantsville - 84029
Orem (Vineyard West) - 84058Syracuse - 84075
Orem (Vineyard North) - 84057
WHERE STUDENTS LIVE BY ZIP CODE FALL 2012-2013 HEADCOUNT
ZIP CODES WITH 50 OR MORE STUDENTS

TABLE 12.
WHERE STUDENTS LIVE BY ZIP CODE
Fall 2012-2013 HeadcountZip Codes with 50 or more students
NUMBER OF PERCENT OF
ZIP CODE LOCATION STUDENTS TOTAL84095 South Jordan 1,669 5.54%84081 West Jordan (New Zip Code as of July 2008) 1,273 4.23%84118 Bennion/Kearns 1,173 3.90%84119 West Valley City (Granger) 1,092 3.63%84065 Riverton 1,078 3.58%84123 Taylorsville/Murray 1,077 3.58%84088 West Jordan 1,072 3.56%84120 West Valley City (Hunter) 1,065 3.54%84121 Cottonwood Heights 893 2.97%84020 Draper 866 2.88%84084 West Jordan 865 2.87%84107 Murray 827 2.75%84106 Granite/Millcreek 785 2.61%84094 Sandy Central 778 2.58%84092 Sandy South East 742 2.46%84096 Herriman 703 2.33%84128 West Valley City (Hunter West) 692 2.30%84047 Midvale 688 2.28%84010 Bountiful 676 2.24%84129 Taylorsville 670 2.23%84070 Sandy West 602 2.00%84116 Rose Park/Airport Area 593 1.97%84115 South Salt Lake 561 1.86%84044 Magna 541 1.80%84093 Sandy North East 533 1.77%84117 Holladay 516 1.71%84109 East Millcreek 464 1.54%84105 Sugarhouse 449 1.49%84124 North and East Holladay 445 1.48%84102 Downtown East 427 1.42%84104 Glendale/West Salt Lake City 422 1.40%84103 Avenues/North Downtown 416 1.38%84074 Tooele 384 1.28%84108 East Salt Lake City 279 0.93%84111 Downtown 258 0.86%84043 Lehi 255 0.85%84054 North Salt Lake 237 0.79%84087 Woods Cross 205 0.68%84005 Eagle Mountain 192 0.64%84037 Kaysville 169 0.56%84014 Centerville 164 0.54%84041 Layton 143 0.47%84015 Clearfield 140 0.46%84025 Farmington 136 0.45%84098 Park City 132 0.44%84003 American Fork 131 0.44%84045 Saratoga Springs 111 0.37%84101 Downtown West 97 0.32%84062 Pleasant Grove 96 0.32%84040 Layton 68 0.23%84029 Grantsville 66 0.22%84058 Orem (Vineyard West) 66 0.22%84075 Syracuse 66 0.22%84057 Orem (Vineyard North) 63 0.21%
Total of this list 28,111 93.35%Total in other zip codes & Unknown 2,001 6.65%
College Total, Fall Semester, 2012-2013 30,112 100.00%
NOTE: The report equals "Institution Total"SOURCE: Utah Board of Regents' Official Report, Fall Semester, 2012-2013
22

TABLE 13.
STUDENT DISTRIBUTION BY AGE AND GENDER
Fall Headcount
Number of StudentsA G E GENDER 08-09 * 09-10 * 10-11 * 11-12 * 12-13 *
Under 18 Males 1746 2412 2135 2067 452Females 2475 3321 3098 2969 731Total 4221 ** 5733 ** 5233 ** 5036 ** 1183
18 - 19 Males 2161 2346 2346 2133 1726 Females 2670 2906 2973 2856 2269
Total 4831 5252 5319 4989 3995
20 - 21 Males 2007 2206 2075 1970 1862 Females 2205 2418 2459 2360 2648
Total 4212 4624 4534 4330 4510
22 - 24 Males 3202 3271 3227 3028 3097 Females 2004 2312 2360 2330 2574
Total 5206 5583 5587 5358 5671
25 - 29 Males 2794 3160 3226 3056 3377Females 1851 2242 2399 2326 2615Total 4645 5402 5625 5382 5992
30 - 34 Males 1077 1357 1528 1587 1714 Females 1018 1267 1345 1422 1550
Total 2095 2624 2873 3009 3264
35 - 39 Males 538 604 647 691 832 Females 628 776 887 864 912
Total 1166 1380 1534 1555 1744
Over 39 Males 752 810 864 907 1031Females 1234 1379 1349 1399 1569Total 1986 2189 2213 2306 2600
Unknown Males 14 22 18 23 4 Females 9 22 11 11 4 Total 23 44 29 34 8
Total Males 14291 16188 16066 15462 14095
Females 14094 16643 16881 16537 14872
TotalStudents 28385 32831 32947 31999 28967
NOTE: * Due to the reporting procedures, the report equals "IPEDS Total".** Due to changes in reporting procedures, a higher number of concurrent enrollment students were captured in 3rd week.
SOURCE: Utah Board of Regents' Official Reports, Fall Semester, 2008-2009 to 2012-2013
23

TABLE 14.
STUDENT DISTRIBUTION BY RACIAL BACKGROUND AND GENDER
Fall Headcount
Number of StudentsRace Gender * 08-09 * 09-10 * 10-11 * 11-12 * 12-13 *
Non-Resident/ Males 193 217 204 197 207Alien Females 164 190 174 157 147
Total 357 407 378 354 354% of Total 1.26% 1.24% 1.15% 1.11% 1.22%
Black Non- Males 276 331 350 350 336Hispanic Females 198 274 285 300 282
Total 474 605 635 650 618% of Total 1.67% 1.84% 1.93% 2.03% 2.13%
Amer. Indian/ Males 152 157 131 113 99Alaskan Nat Females 172 209 204 164 141
Total 324 366 335 277 240% of Total 1.14% 1.11% 1.02% 0.87% 0.83%
Asian/Pac. Males 603 741 708 642 580Islander Females 700 840 826 796 756
Total 1,303 1,581 1,534 1,438 1,336% of Total 4.59% 4.82% 4.66% 4.49% 4.61%
Hispanic Males 1,158 1,338 1,433 1,558 1,608Females 1,290 1,509 1,667 1,854 1,958
Total 2,448 2,847 3,100 3,412 3,566% of Total 8.62% 8.67% 9.41% 10.66% 12.31%
White Non- Males 10,809 12,313 11,695 10,697 9,913Hispanic Females 10,568 12,541 11,834 10,828 9,758
Total 21,377 24,854 23,529 21,525 19,671% of Total 75.31% 75.71% 71.41% 67.27% 67.92%
More Than Males 123 190One Race Females 141 216
Total 264 406% of Total 0.83% 1.40%
Race/Ethnicity Males 1,100 1,091 1,545 1,782 1,162Unknown Females 1,002 1,080 1,891 2,297 1,614
Total 2,102 2,171 3,436 4,079 2,776% of Total 7.41% 6.61% 10.42% 12.74% 9.58%
College Males 14,291 16,188 16,066 15,462 14,095Totals Females 14,094 16,643 16,881 16,537 14,872
Total 28,385 32,831 32,947 31,999 28,967
NOTE: * Due to the reporting procedures, the report equals "IPEDS Total" or "Total Credit Students", not the "Budget Related" or the "Institution Total".
SOURCE: Utah Board of Regents' Official Reports, 2008-2009 to 2012-2013
24

GRAPH/TABLE 15.
MALE TO FEMALE RATIOSFALL SEMESTER
MALE TO FEMALE RATIOSFALL SEMESTER
03-04 04-05 05-06 06-07 07-08 08-09 09-10 10-11 11-12 12-13MALE 12280 12771 12528 12241 12530 12678 14094 14185 13404 13012
FEMALE 11497 11969 12039 11581 11294 11789 13629 14258 13637 13149TOTAL 23777 24740 24567 23822 23824 24467 27723 28443 27041 26161
MALE 51.65% 51.62% 51.00% 51.39% 52.59% 51.82% 50.84% 49.87% 49.57% 49.74%
FEMALE 48.35% 48.38% 49.00% 48.61% 47.41% 48.18% 49.16% 50.13% 50.43% 50.26%
NOTE: Totals equal "Total of All Budget Related", not the "IPEDS" or the "Institution Total".SOURCE: Utah Board of Regents' Official Reports, 2003-2004 to 2012-2013
25
40%
45%
50%
55%
60%
03-04 04-05 05-06 06-07 07-08 08-09 09-10 10-11 11-12 12-13
MALE FEMALE

TABLE/GRAPH 16.
VETERANS CURRENTLY ELIGIBLE TO RECEIVE BENEFITSBY ACADEMIC CLASSIFICATION
FALL HEADCOUNT
AcademicClassification 04-05 05-06 06-07 07-08 08-09 09-10 10-11 11-12 12-13
Vocational orTechnical 212 224 240 250 205 322 260 354 339
Non-Vocationalor Non-Technical 174 228 252 193 193 277 310 317 337
TOTAL 386 452 492 443 398 599 570 671 676
All Other Students 25325 25099 24637 24701 29468 33175 33413 32496 29436
GRAND TOTAL 25711 25551 25129 25144 29866 33774 33983 33167 30112
Percent Veterans 1.5% 1.8% 2.0% 1.8% 1.3% 1.8% 1.7% 2.0% 2.2%
VETERANS CURRENTLY ELIGIBLE TO RECEIVE BENEFITSFALL HEADCOUNT
BY PERCENT
NOTE: Totals = "Institution Total"SOURCE: Utah Board of Regents' Official Reports, Fall Semester, 2004-2005 to 2012-2013
26
0.0%
0.5%
1.0%
1.5%
2.0%
2.5%
3.0%
04-05 05-06 06-07 07-08 08-09 09-10 10-11 11-12 12-13

TABLE 17.
SALT LAKE COMMUNITY COLLEGEAVERAGE AGE OF STUDENTS
RESIDENTS NON-RESIDENTSMALE FEMALE TOTAL MALE FEMALE TOTAL
SUMMER TERM 1998-99 27.71 27.08 27.39 27.74 27.12 27.41 1999-00 26.96 26.21 26.59 27.03 26.29 26.63 2000-01 26.93 26.35 26.64 26.98 26.43 26.68 2001-02 27.70 26.87 27.31 27.58 26.86 27.29 2002-03 27.08 26.85 26.97 27.06 26.77 26.99 2003-04 26.94 27.06 27.03 26.85 27.12 27.05 2004-05 26.79 27.03 26.92 26.82 27.04 26.89 2005-06 26.90 26.80 26.86 26.87 26.71 26.84 2006-07 27.26 26.97 27.08 27.18 27.02 27.12 2007-08 27.20 26.99 26.98 27.16 26.99 27.01 2008-09 26.95 27.09 27.03 26.92 27.04 27.01 2009-10 26.88 27.04 26.96 26.84 27.08 26.99 2010-11 27.24 27.21 27.22 27.28 27.21 27.23 2011-12 27.53 27.50 27.52 27.49 27.54 27.50 2012-13 27.54 57.62 27.58 27.47 27.65 27.61
FALL SEMESTER
1998-99 27.48 26.48 27.01 27.45 26.43 27.04 1999-00 26.07 25.59 25.85 26.06 25.63 25.90 2000-01 25.48 25.39 25.44 25.55 25.34 25.49 2001-02 25.56 25.42 25.54 25.48 25.68 25.60 2002-03 25.76 25.86 25.81 25.72 25.85 25.79 2003-04 25.18 25.66 25.45 25.15 25.65 25.48 2004-05 25.63 26.14 25.93 25.67 26.11 25.91 2005-06 26.05 26.70 26.46 26.08 26.76 26.45 2006-07 25.92 26.32 26.19 25.90 26.27 26.18 2007-08 26.02 26.48 26.27 26.04 26.51 26.23 2008-09 25.51 25.42 25.43 25.52 25.37 25.41 2009-10 24.97 25.11 25.04 24.96 25.14 25.12 2010-11 25.39 25.30 25.35 25.43 25.29 25.31 2011-12 25.80 25.48 25.64 25.82 25.39 25.62 2012-13 27.35 27.13 27.23 27.30 27.03 27.24
SPRING SEMESTER 1998-99 25.88 25.67 25.78 25.84 25.65 25.81 1999-00 N/A N/A N/A N/A N/A N/A 2000-01 25.85 25.78 25.81 25.65 25.90 25.85 2001-02 25.64 25.72 25.68 25.54 25.83 25.75 2002-03 24.80 24.92 24.85 24.76 24.92 24.81 2003-04 25.69 26.09 25.89 25.61 26.10 25.90 2004-05 25.74 26.35 26.06 25.76 26.38 26.05 2005-06 25.84 26.52 26.27 25.88 26.46 26.25 2006-07 26.01 26.58 26.32 26.06 26.60 26.33 2007-08 26.08 26.39 26.23 26.11 26.42 26.24 2008-09 25.99 26.14 26.05 25.96 26.13 26.07 2009-10 26.13 26.50 26.31 26.15 26.51 26.28 2010-11 26.14 26.41 26.28 26.16 26.48 26.31 2011-12 26.21 26.11 26.16 26.21 26.13 26.20 2012-13 26.11 26.34 26.22 26.10 26.34 26.27
NOTE: Age is not a completely accurate figure, in that some students choose not to release this information.SOURCE: Utah Board of Regents' Official Reports, 1998-1999 to 2012-2013
27
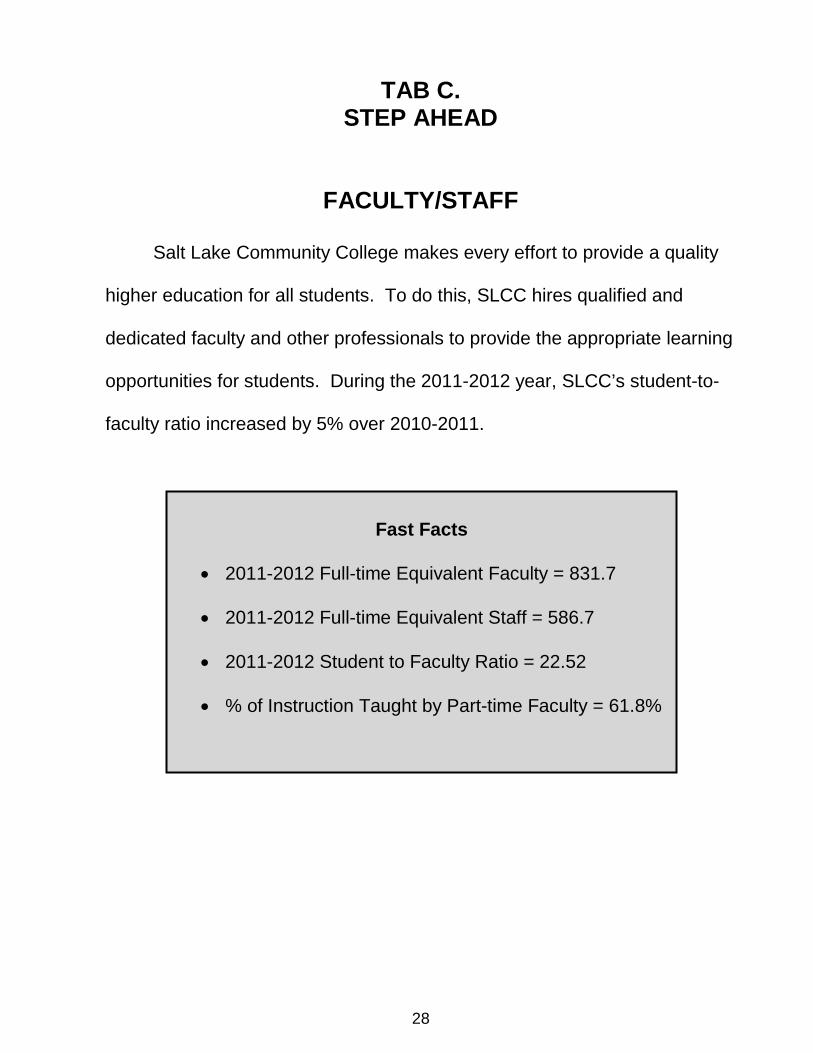
TAB C. STEP AHEAD
FACULTY/STAFF
Salt Lake Community College makes every effort to provide a quality
higher education for all students. To do this, SLCC hires qualified and
dedicated faculty and other professionals to provide the appropriate learning
opportunities for students. During the 2011-2012 year, SLCC’s student-to-
faculty ratio increased by 5% over 2010-2011.
28
Fast Facts
• 2011-2012 Full-time Equivalent Faculty = 831.7 • 2011-2012 Full-time Equivalent Staff = 586.7
• 2011-2012 Student to Faculty Ratio = 22.52
• % of Instruction Taught by Part-time Faculty = 61.8%

TABLE 18.
D E P A R T M E N T 2011-2012Accounting 25.16Apprenticeship (all) 16.44Architectural Technology 10.34ASL/Interpreting 10.89Automotive Collision Repair & Painting 12.56Automotive Technician 9.74Aviation Technology/Aviation Maintenance Tech 13.89Aviation Technology/Professional Pilot 11.03Barbering/Cosmetology 7.90Biology 27.97Biotechnology 9.85Bldg Construction/Construction Mgt 10.78Business Economics 29.72Business Management 23.18Chemistry 26.18Communication 26.69Computer Info Systems 28.35Computer Science 17.43Criminal Justice 24.21Culinary Arts 11.01Dental Hygiene 3.59Developmental Education 23.45Diesel Systems Technology 13.91Education 35.75Engineering 13.63Engineering Design/Drafting Tech 9.98English 24.77English Second Language 32.96Family & Human Studies 30.02Fashion Institute 22.15Finance and Credit 26.33Fine Arts 29.98Geosciences 26.74Health & Lifetime Activities 24.92History/Anthropology 33.41Humanities 33.41Interior Design 20.67Languages 20.93Marketing 17.80Mathematics 32.96Medical Assistant 16.09Mortuary Science 5.74Non-Destructive Testing Tech 12.00Nursing 12.00Occupational Therapy Asst 12.52Paralegal Studies 17.37Physical Therapist Asst 11.36Physics 31.20Political Science 30.43Psychology 32.33Radiologic Technology 15.91Short-Term Intensive Training 3.35Social Work 34.20Sociology 32.30Surgical Technology 12.39Surveying 8.77Visual Art & Design 14.08Welding 9.40COLLEGE STUDENT TO FACULTY RATIO 22.52
NOTE: A formula is used to determine the FTE equivalent for hourly faculty.
29
2011-2012 STUDENT TO FACULTY RATIOS (ANNUALIZED)
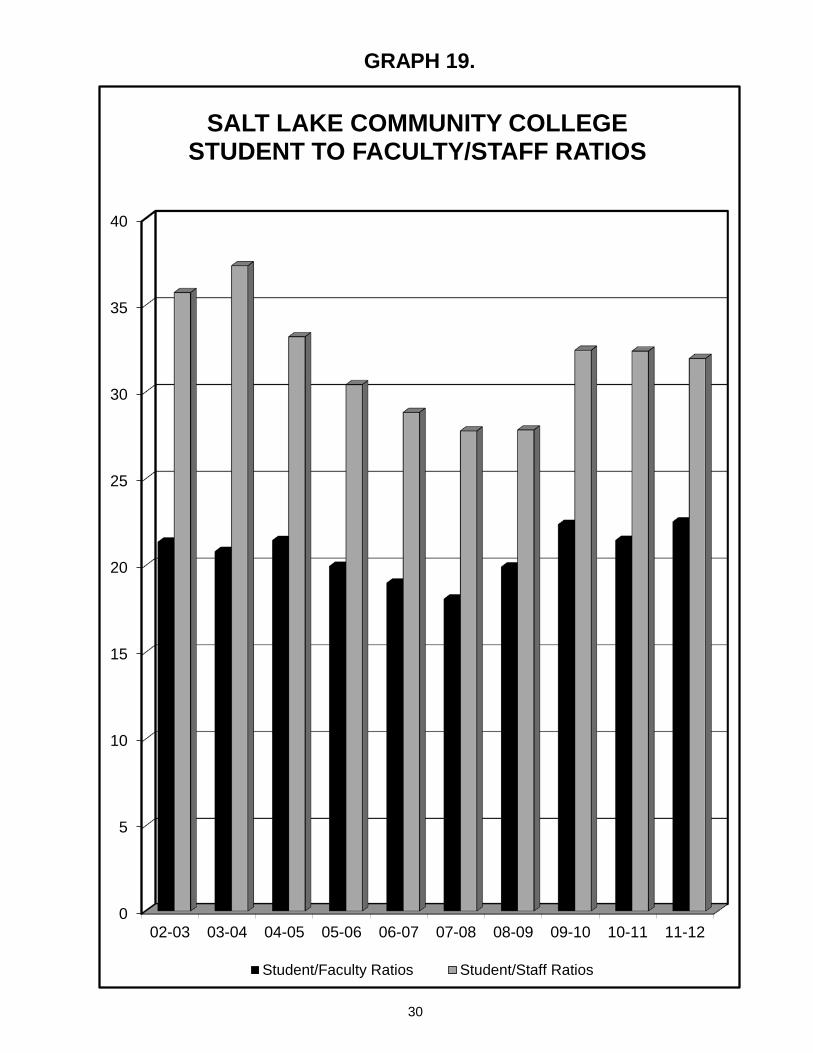
GRAPH 19.
30
0
5
10
15
20
25
30
35
40
02-03 03-04 04-05 05-06 06-07 07-08 08-09 09-10 10-11 11-12
SALT LAKE COMMUNITY COLLEGE STUDENT TO FACULTY/STAFF RATIOS
Student/Faculty Ratios Student/Staff Ratios
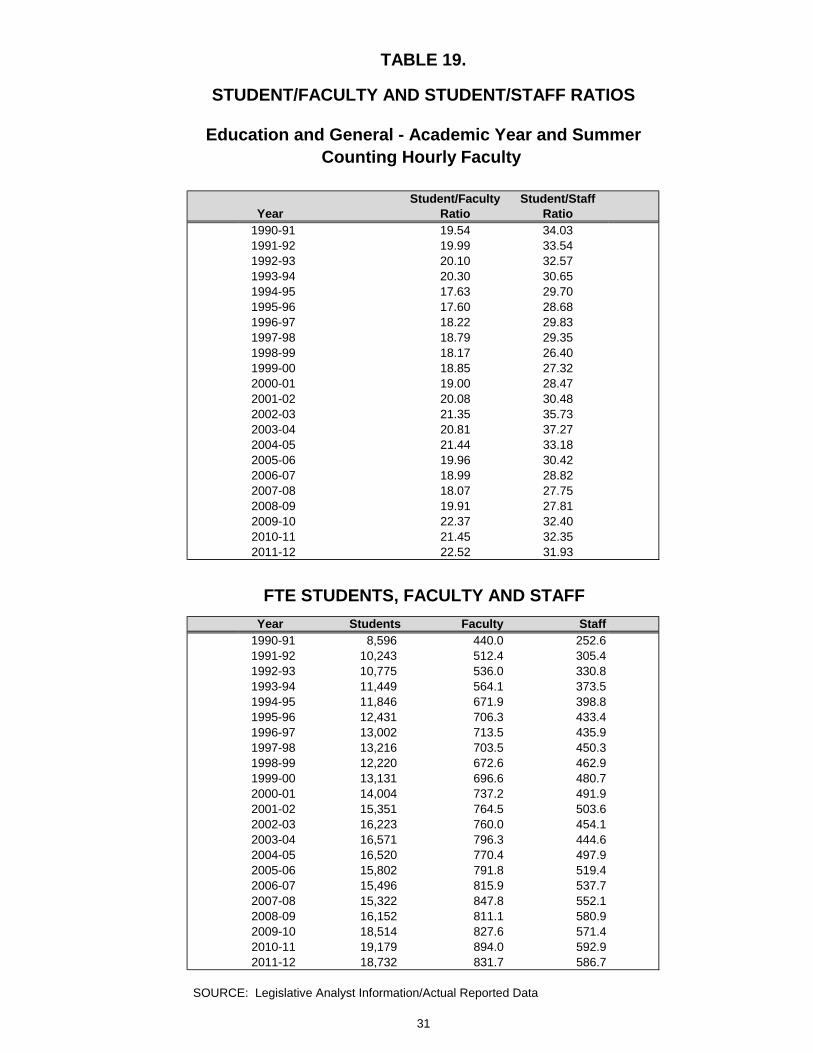
TABLE 19.
STUDENT/FACULTY AND STUDENT/STAFF RATIOS
Education and General - Academic Year and SummerCounting Hourly Faculty
Student/Faculty Student/StaffYear Ratio Ratio
1990-91 19.54 34.03 1991-92 19.99 33.54 1992-93 20.10 32.57 1993-94 20.30 30.65 1994-95 17.63 29.70 1995-96 17.60 28.68 1996-97 18.22 29.83 1997-98 18.79 29.35 1998-99 18.17 26.40 1999-00 18.85 27.32 2000-01 19.00 28.47 2001-02 20.08 30.48 2002-03 21.35 35.73 2003-04 20.81 37.27 2004-05 21.44 33.18 2005-06 19.96 30.42 2006-07 18.99 28.82 2007-08 18.07 27.75 2008-09 19.91 27.81 2009-10 22.37 32.40 2010-11 21.45 32.35 2011-12 22.52 31.93
FTE STUDENTS, FACULTY AND STAFFYear Students Faculty Staff
1990-91 8,596 440.0 252.6 1991-92 10,243 512.4 305.4 1992-93 10,775 536.0 330.8 1993-94 11,449 564.1 373.5 1994-95 11,846 671.9 398.8 1995-96 12,431 706.3 433.4 1996-97 13,002 713.5 435.9 1997-98 13,216 703.5 450.3 1998-99 12,220 672.6 462.9 1999-00 13,131 696.6 480.7 2000-01 14,004 737.2 491.9 2001-02 15,351 764.5 503.6 2002-03 16,223 760.0 454.1 2003-04 16,571 796.3 444.6 2004-05 16,520 770.4 497.9 2005-06 15,802 791.8 519.4 2006-07 15,496 815.9 537.7 2007-08 15,322 847.8 552.1 2008-09 16,152 811.1 580.9 2009-10 18,514 827.6 571.4 2010-11 19,179 894.0 592.9 2011-12 18,732 831.7 586.7
SOURCE: Legislative Analyst Information/Actual Reported Data
31

TABLE 20.
Male Female Total Male Female Total Male Female Total
President's Office President's Office 3.00 3.00 3.00 3.00
Provost for Academic Affairs Provost Office 1.00 1.00 2.00 1.00 1.00 2.00
Assoc. Provost for Education &Community Partnerships
Assoc. Provost Office 1.00 1.00 2.00 1.00 1.00 2.00 Distance Education 5.00 6.00 11.00 5.00 6.00 11.00 Educational Initiatives 1.00 1.00 1.00 1.00 ePortfolio 1.00 1.00 1.00 1.00 Instructional Media 3.00 1.00 4.00 3.00 1.00 4.00 Tutoring Initiative/Learning Center 1.00 2.75 3.75 1.00 2.75 3.75 University Center 1.00 1.00 1.00 1.00
Academic & Community Services 3.00 3.00 6.00 3.00 3.00 6.00 Scheduling 4.00 4.00 4.00 4.00 Student Success Initiatives 1.00 1.00 1.00 1.00
Asst. Provost for InstitutionalEffectiveness
Asst Provost's Office 2.00 2.00 2.00 2.00 Assessment, Accred & Planning 1.00 1.00 1.00 1.00 Center for Innovation & Prof Dvlpmt 1.00 2.00 3.00 1.00 2.00 3.00 Faculty Senate 1.00 1.00 1.00 1.00 Faculty Services & Study Abroad 2.00 2.00 2.00 2.00 Faculty Development Support 0.54 0.54 0.54 0.54 Institutional Research 1.00 4.00 5.00 1.00 4.00 5.00
Learning Resources Library/Jordan 1.00 1.00 2.00 1.00 1.00 2.00 Library/South 2.00 2.00 2.00 2.00 Library/Taylorsville Redwood 3.00 6.00 9.00 3.00 6.00 9.00
School of Arts, Communicationand New Media
Dean's Office 2.00 2.00 2.00 2.00
Div of Communication & Performing Arts 1.00 1.00 2.00 1.00 1.00 2.00 Communication 5.26 5.00 10.26 5.26 5.00 10.26 Fine Arts 5.00 1.00 6.00 5.00 1.00 6.00
Div of Visual Art & Design 1.00 1.00 2.00 1.00 1.00 2.00 Architectural Technology 3.00 3.00 3.00 3.00 Fashion Institute/Interior Design 1.00 1.00 1.00 1.00 2.00 2.00 Visual Art & Design 8.00 5.00 13.00 8.00 5.00 13.00
32
Full-time Faculty Full-time Admin/Staff All Full-time
SALARIED PERSONNEL: POSITION FTESBY DEPARTMENT/PROGRAM, BY GENDER, AND BY FACULTY/STAFF
ED & GENERAL INDEXES (10000 Fund)(FILLED POSITIONS AS OF 10/31/12)

Personnel FTE's by Organization/Index Codes (-continued-) Page 2 of 5
Male Female Total Male Female Total Male Female Total
School of Business Dean's Office 1.00 1.00 2.00 1.00 1.00 2.00
Div of Accounting, Finance & Economics 1.00 1.00 2.00 1.00 1.00 2.00 Accounting 2.00 5.00 7.00 1.00 1.00 2.00 6.00 8.00 Business Economics 3.50 2.00 5.50 3.50 2.00 5.50 Finance & Credit 2.50 2.50 2.50 2.50
Div of Mgmt, Mktg & Culinary Institute 1.00 1.00 2.00 1.00 1.00 2.00 Business Management 7.00 2.00 9.00 7.00 2.00 9.00 Culinary Arts 2.00 1.00 3.00 2.00 1.00 3.00 Marketing 2.00 2.00 4.00 2.00 2.00 4.00
Div of Computer Sci & Info Systems 2.00 2.00 2.00 2.00 Computer Information Systems 6.60 2.00 8.60 6.60 2.00 8.60 Computer Science 4.00 2.00 6.00 4.00 2.00 6.00 Paralegal Studies 2.00 1.00 3.00 2.00 1.00 3.00
School of Health SciencesDean's Office 3.00 3.00 3.00 3.00
Division of Allied Health 2.00 2.00 2.00 2.00 Medical Assistant 4.00 4.00 4.00 4.00 Mortuary Science 1.24 1.24 1.24 1.24 Occupational Therapy Assistant 2.00 2.00 2.00 2.00 Physical Therapist Assistant 1.00 1.00 2.00 1.00 1.00 2.00 Radiologic Technology 1.00 2.00 3.00 1.00 2.00 3.00 Surgical Technology 1.00 0.50 1.50 1.00 0.50 1.50
Dental Hygiene 2.00 2.00 2.00 2.00 4.00 4.00
Division of Nursing 2.27 2.27 2.27 2.27 Nursing * 18.99 18.99 1.00 1.00 19.99 19.99
School of Humanities and Social Sciences Dean's Office 1.00 1.00 2.00 1.00 1.00 2.00
Div of Psychology & Sociology 1.00 1.00 2.00 1.00 1.00 2.00 Psychology 2.00 5.00 7.00 2.00 5.00 7.00 Sociology 1.00 2.00 3.00 1.00 2.00 3.00
English * 4.00 16.38 20.38 1.00 1.00 2.00 5.00 17.38 22.38 ESL 2.00 1.00 3.00 2.00 1.00 3.00 Developmental Reading 3.00 4.00 7.00 3.00 4.00 7.00 Developmental Writing 2.00 6.00 8.00 1.00 1.00 3.00 6.00 9.00
Div of Family & Human Studies & Social Wk 1.00 1.00 2.00 1.00 1.00 2.00 Family & Human Studies 2.00 2.00 2.17 2.17 4.17 4.17 Learning Enhancement 3.00 1.00 4.00 3.00 1.00 4.00 Pre Teacher Education 2.00 2.00 2.00 2.00 Social Work 1.00 1.00 2.00 1.00 1.00 2.00
Div of History, Anthropology & Political Sci 2.00 2.00 2.00 2.00 History/Anthropology 5.00 2.00 7.00 5.00 2.00 7.00 Political Science 2.00 1.00 3.00 2.00 1.00 3.00
Dept of Humanities, Lang & Culture 1.00 1.00 2.00 1.00 1.00 2.00 ASL 1.00 1.00 2.00 1.00 1.00 2.00 Humanities 3.00 3.00 6.00 3.00 3.00 6.00 Languages 2.00 3.00 5.00 1.00 1.00 3.00 3.00 6.00
33
Full-time Faculty Full-time Admin/Staff All Full-time

Personnel FTE's by Organization/Index Codes (-continued-) Page 3 of 5
Male Female Total Male Female Total Male Female Total
School of Science, Math and Engineering Dean's Office 1.00 2.00 3.00 1.00 2.00 3.00
Biology 4.50 8.00 12.50 1.00 4.00 5.00 5.50 12.00 17.50
Biotechnology 1.00 1.00 2.00 4.50 3.00 7.50 5.50 4.00 9.50
Div of Natural Sciences 1.00 1.00 2.00 1.00 1.00 2.00 Chemistry 4.00 1.00 5.00 0.94 0.94 4.00 1.94 5.94 Engineering 5.00 2.00 7.00 1.00 1.00 6.00 2.00 8.00 Engineering Design/Draft Tech 3.00 3.00 3.00 3.00 Geosciences 2.00 1.00 3.00 2.00 1.00 3.00 Physics 2.00 1.00 3.00 0.94 0.94 2.00 1.94 3.94 Surveying 1.00 1.00 1.00 1.00
Health & Lifetime Activities 4.00 5.00 9.00 1.00 1.00 4.00 6.00 10.00
Developmental Math 6.00 6.00 12.00 6.00 6.00 12.00 Math 13.00 7.00 20.00 1.00 1.00 2.00 14.00 8.00 22.00
School of Technical Specialties Dean's Office 1.00 1.00 2.00 1.00 1.00 2.00
Div of Technical Specialties 1.00 1.00 2.00 1.00 1.00 2.00 Auto Collision Repair 2.00 2.00 2.00 2.00 Automotive Tech 7.00 7.00 7.00 7.00 Bldg Contr/Construction Mgmnt 3.00 3.00 1.00 1.00 4.00 4.00 Diesel Systems Technology 2.00 2.00 2.00 2.00 Welding 1.00 1.00 1.00 1.00
Barbering/Cosmetology 1.00 3.00 4.00 2.00 2.00 1.00 5.00 6.00
Apprenticeship Office 1.00 1.00 1.00 1.00 Apprenticeship/General 1.00 1.00 1.00 1.00
Div of Aviation & Related Tech 2.00 2.00 2.00 2.00 Professional Pilot/Aviation Tech 3.00 3.00 3.00 3.00 Aviation Maintenance 5.00 5.00 5.00 5.00 Non-Destructive Test Technology 1.00 1.00 1.00 1.00
Assoc. Provost for Business Partnerships & Dean of the School of Professional & Econ. Dev.
Dean's Office 1.00 1.00 1.00 1.00
Financial Services 0.50 0.50 0.50 0.50 Miller Conferencing 0.45 0.45 0.45 0.45
Continuing Education 0.63 0.63 0.63 0.63 Computer Training Program 0.48 0.48 0.48 0.48 Paralegal Self Support 1.00 1.00 1.00 1.00
Business Employer Outreach 0.72 0.72 0.72 0.72 Small Bus Devlopment Regional 1.00 1.00 1.00 1.00 Custom Fit 1.50 2.00 3.50 1.50 2.00 3.50 ATE Operations 1.00 1.00 1.00 1.00
Instit of Public Safety 0.92 0.92 0.92 0.92 Criminal Justice 3.00 3.00 3.00 3.00
34
Full-time Faculty Full-time Admin/Staff All Full-time

Personnel FTE's by Organization/Index Codes (-continued-) Page 4 of 5
Male Female Total Male Female Total Male Female Total
Vice President of Business Services Vice President's Office 1.00 1.00 2.00 1.00 1.00 2.00 Accounting Systems 2.00 2.00 2.00 2.00 Accounts Payable 6.00 6.00 6.00 6.00 Budget Services 1.00 4.00 5.00 1.00 4.00 5.00 Business Office 2.00 2.00 4.00 2.00 2.00 4.00 Cashiering 5.00 5.00 5.00 5.00 Collections 4.00 4.00 4.00 4.00 EEO Administration 2.00 2.00 2.00 2.00 Emerg Resp/Campus Security 2.00 2.00 2.00 2.00 Human Resources 5.00 9.00 14.00 5.00 9.00 14.00 Inventory 1.00 1.00 1.00 1.00 Payroll 4.00 4.00 4.00 4.00 Purchasing 5.00 5.00 5.00 5.00 Risk Management 2.00 2.00 2.00 2.00
Office of Information Technology Academic Computing 7.13 2.00 9.13 7.13 2.00 9.13 Administrative Computing Services 8.08 3.00 11.08 8.08 3.00 11.08 Chief Information Officer Office 6.00 1.00 7.00 6.00 1.00 7.00 Desktop Computing 5.00 2.00 7.00 5.00 2.00 7.00 Help Desk 4.00 4.00 4.00 4.00 Network Services 9.53 4.00 13.53 9.53 4.00 13.53 Technical Services 2.00 1.00 3.00 2.00 1.00 3.00 Web Applications 4.00 4.00 4.00 4.00
Facilities Services Asst Vice Pres Facilities Services 2.00 1.00 3.00 2.00 1.00 3.00 Arch/Proj Services 5.00 1.00 6.00 5.00 1.00 6.00 Cabinetmakers 2.00 2.00 2.00 2.00 Carpenters 9.00 0.33 9.33 9.00 0.33 9.33 Custodial Services 35.00 13.00 48.00 35.00 13.00 48.00 Distribution 3.00 3.00 3.00 3.00 Electricians 4.00 0.34 4.34 4.00 0.34 4.34 Environmental Health & Safety 1.00 1.00 1.00 1.00 Facilities Support 3.00 3.00 3.00 3.00 Grounds Maintenance 10.00 10.00 10.00 10.00 HVAC Systems 20.00 0.33 20.33 20.00 0.33 20.33 Interior Design 1.00 1.00 1.00 1.00 Key Office 1.50 0.50 2.00 1.50 0.50 2.00 Mail Services 2.00 2.00 2.00 2.00 Moving Services 7.00 7.00 7.00 7.00 Operation & Maintenance/Miller 1.41 1.41 1.41 1.41 Painters 5.00 5.00 5.00 5.00 Plumbers 4.00 4.00 4.00 4.00 PM System 2.00 2.00 2.00 2.00 Signage 1.50 1.50 1.50 1.50 Space Inv/Energy 0.50 0.50 0.50 0.50 Vehicle Maintenance 1.00 1.00 2.00 1.00 1.00 2.00
Vice President ofInstitutional Advancement
Vice President's Office 2.00 2.00 2.00 2.00 Institutional Marketing 6.00 9.40 15.40 6.00 9.40 15.40 Contact Center/Switchboard 1.00 6.00 7.00 1.00 6.00 7.00 Development Office 2.00 4.44 6.44 2.00 4.44 6.44 Events Coordinator 0.64 0.64 0.64 0.64 Media Operations 4.00 4.00 4.00 4.00
Vice President for Government & Community RelationsVice President's Office 1.00 1.00 1.00 1.00 Grants Office 1.00 1.00 1.00 1.00 Internal Audit 3.00 3.00 3.00 3.00
35
Full-time Faculty Full-time Admin/Staff All Full-time

Personnel FTE's by Organization/Index Codes (-continued-) Page 5 of 5
Male Female Total Male Female Total Male Female Total
Vice President of Student Services Vice President's Office 2.25 2.25 2.25 2.25
Athletics 1.00 1.00 1.00 1.00
Grand Theatre 2.00 2.00 2.00 2.00
Asst Vice Pres of Student Plan & Support 2.00 2.00 2.00 2.00 Academic Advising 6.00 21.00 27.00 6.00 21.00 27.00 Academic Advising/Formal 3.00 3.00 3.00 3.00 Degree Works 1.00 1.00 1.00 1.00 Disability Resource Center 3.14 8.59 11.73 3.14 8.59 11.73 Hearing Impaired 0.36 0.36 0.36 0.36 Orientation 1.00 1.00 1.00 1.00 Prospective Students 5.75 5.75 5.75 5.75 Cooperative Education 2.00 3.75 5.75 2.00 3.75 5.75 Student Placement 1.00 1.00 1.00 1.00
Asst Vice Pres of Student Enrollment Services 1.00 1.00 2.00 1.00 1.00 2.00 Data Center 2.00 2.00 2.00 2.00 Enrollment Services 4.00 4.00 4.00 4.00 Financial Aid 3.00 17.00 20.00 3.00 17.00 20.00 International Students 1.30 1.47 2.77 1.30 1.47 2.77 Registration 3.00 9.00 12.00 3.00 9.00 12.00 Student Services - North 2.00 2.00 2.00 2.00 Student Services - South 3.00 3.00 3.00 3.00 Testing Services 2.00 4.00 6.00 2.00 4.00 6.00 Veterans Services 2.00 2.00 2.00 2.00
Asst Vice Pres of Student Life & Dean of Students 1.53 1.00 2.53 1.53 1.00 2.53 Health & Wellness 1.89 1.89 1.89 1.89 Multi-Cultural 2.00 2.00 2.00 2.00 Community Service 0.57 2.35 2.92 0.57 2.35 2.92 Student Involvment Center 0.25 0.25 0.25 0.25
* * * * * * * * * * * * * * * * * * * * * * * * * * * * * * * * * * * * * * * * * * * * * * * * * * * * * * * * * * * * * * * * * * * * * * *COLLEGE WIDE SUMMARY
Male Female Total Male Female Total Male Female Total
Totals 161.60 144.87 306.47 270.16 309.98 580.14 431.76 454.84 886.60
* * * * * * * * * * * * * * * * * * * * * * * * * * * * * * * * * * * * * * * * * * * * * * * * * * * * * * * * * * * * * * * * * * * * * * *
Prepared by: Arlene Asay, Budget Office *Reduced FTE due to sabbatical leave
36
Full-time Faculty Full-time Admin/Staff All Full-time
Full-time Faculty Full-time Admin/Staff All Full-time

Male Female Total Male Female Total Male Female Total
Assoc. Provost for Education &Community Partnerships
Concurrent Enrollment 4.00 6.00 10.00 4.00 6.00 10.00 Online Course Fees/Testing Ctr 1.00 1.00 1.00 1.00 UBEST Project 1.00 1.00 1.00 1.00 Utah WERKS 1.00 1.00 1.00 1.00
Asst. Provost for InstitutionalEffectiveness
Curriculum Development 0.46 0.46 0.46 0.46
School of Arts, Communicationand New Media
Digital Arts 2.00 2.00 1.00 1.00 2.00 3.00 1.00 4.00 Fine Arts 1.00 1.00 1.00 1.00 Media Council 1.00 1.00 1.00 1.00
School of BusinessCapitol Dining 2.00 1.00 3.00 2.00 1.00 3.00
School of Health Sciences Nursing Partnerships 1.00 2.00 3.00 0.73 0.73 1.00 2.73 3.73 Surgical Technology 0.50 0.50 0.50 0.50
School of Humanities and Social Sciences
Eccles Lab School 0.71 0.71 0.71 0.71 Humanities 1.00 1.00 1.00 1.00
School of Science, Math and Engineering
Biology 0.50 0.50 0.50 0.50 Biotechnology 0.50 1.00 1.50 0.50 1.00 1.50 Math 1.00 1.00 1.00 1.00 NISGTC TAACCT 1.00 1.00 1.00 1.00 Rocky Mtn Solar Training 1.00 1.00 1.00 1.00
School of Technicial SpecialtiesNDT Training 1.00 1.00 1.00 1.00
Division of Applied Technology Grants/Fees 2.50 0.50 3.00 2.50 0.50 3.00 State Appropriated 12.00 11.00 23.00 12.74 18.75 31.49 24.74 29.75 54.49
Assoc. Provost for Business Partnerships &Dean of the School of Professional & Econ. Dev.
Assoc Provost Self Support 1.00 1.00 2.00 1.00 1.00 2.00 Accelerated Business Degree 0.50 0.50 0.50 0.50 ACCE/AC Marketing 1.00 1.00 1.00 1.00 ACT Testing Center 0.40 0.40 0.40 0.40 Autocad Non Credit 0.40 0.40 0.40 0.40
37
TABLE 21.
SALARIED PERSONNEL: POSITION FTE'SBY DEPARTMENT/PROGRAM, BY GENDER, AND BY FACULTY/STAFF
SERVICE ENTERPRISES, AUXILIARY, DESIGNATED, RESTRICTED
(FILLED POSITIONS AS OF 10/31/12)& DIVISION OF APPLIED TECHNOLOGY INDEXES
Full-time Admin/Staff All Full-timeFull-time Faculty

Personnel FTE's by Organization/Index Codes (-continued-) Page 2 of 2
Male Female Total Male Female Total Male Female Total
Assoc. Provost for Business Partnerships &Dean of the School of Profess. & Econ. Dev. (-cont-)
Business & Industry Training 1.00 1.00 1.00 1.00 Business Employer Outreach Ed 0.28 1.00 1.28 0.28 1.00 1.28 CE Admin. Self Support 1.37 1.37 1.37 1.37 Composite Training Program 0.50 0.50 0.50 0.50 Computer Training Program 0.52 0.52 0.52 0.52 Corporate Training & Testing 0.50 0.50 0.50 0.50 Energy Sector & Smart Grid 5.20 2.00 7.20 5.20 2.00 7.20 Encore Institute 1.00 1.00 1.00 1.00 Energy Management 0.50 0.50 0.50 0.50 Fiscal Services Self Support 1.00 1.00 1.00 1.00 Ford Grant 1.00 1.00 1.00 1.00 Goldman Sachs 2.00 1.00 3.00 2.00 1.00 3.00 MBIC 1.00 1.00 1.00 1.00 Miller Business Innovation 1.00 1.00 1.00 1.00 Miller Conferencing/Events 2.55 1.00 3.55 2.55 1.00 3.55 Miller Financial Services 3.50 3.50 3.50 3.50 Program & Course Development 5.00 5.00 5.00 5.00 Public Safety/Homeland Security 1.00 1.00 0.08 1.00 1.08 1.08 1.00 2.08 Small Business Regional 1.00 1.00 1.00 1.00 Small Business State 2.00 2.00 2.00 2.00 STIT 1.00 1.00 1.00 1.00 Women Business Institute 1.00 1.00 1.00 1.00
Vice President of Business Services Accounting Systems 1.00 1.00 1.00 1.00 Auxiliary Custodians 4.00 3.00 7.00 4.00 3.00 7.00 Accounts Receivable 1.00 3.00 4.00 1.00 3.00 4.00 Cashiering 2.00 6.00 8.00 2.00 6.00 8.00 Parking Services/Public Safety 6.00 3.00 9.00 6.00 3.00 9.00 SC Computer Lab Aides 2.50 2.50 2.50 2.50
Vice President of Governance & Comm. Rela. Vice President's Office 1.00 1.00 1.00 1.00 Grants Administration 1.00 3.36 4.36 1.00 3.36 4.36
Vice President of Student Services Vice President's Office 0.75 0.75 0.75 0.75 Academic & Career Advising 1.00 1.00 1.00 1.00 Athletics 4.00 7.17 11.17 4.00 7.17 11.17 Child Care Center 1.00 1.00 1.00 1.00 College Store 2.00 9.00 11.00 2.00 9.00 11.00 Community Service 0.43 2.65 3.08 0.43 2.65 3.08 Disability Resources 1.16 1.16 1.16 1.16 Financial Aid 1.00 2.00 3.00 1.00 2.00 3.00 Food Services 3.00 3.00 6.00 3.00 3.00 6.00 Grand Theatre 1.00 1.00 2.00 1.00 1.00 2.00 Health & Wellness 2.00 6.12 8.12 2.00 6.12 8.12 ID Center 1.00 1.00 2.00 1.00 1.00 2.00 International Students 0.70 0.53 1.23 0.70 0.53 1.23 Multi Cultural Affairs 1.00 1.00 1.00 1.00 Printing Services 2.00 1.00 3.00 2.00 1.00 3.00 Prospective Students/Outreach 2.00 1.00 3.00 2.00 1.00 3.00 Student Center/Taylorsville Redwood 2.59 7.00 9.59 2.59 7.00 9.59 Student Center/South 1.00 1.00 2.00 1.00 1.00 2.00 Student Life & Leadership 3.00 4.75 7.75 3.00 4.75 7.75 Student Services - Offsite 2.00 2.00 2.00 2.00 Student Support Services/TRIO 1.00 4.00 5.00 1.00 4.00 5.00 Veterans Affairs 1.00 1.00 1.00 1.00
* * * * * * * * * * * * * * * * * * * * * * * * * * * * * * * * * * * * * * * * * * * * * * * * * * * * * * * * * * * * * * * * * * * * * * * *
COLLEGE WIDE SUMMARY
Male Female Total Male Female Total Male Female Total
Totals 17.50 16.50 34.00 90.84 134.04 224.87 108.34 150.54 258.87
* * * * * * * * * * * * * * * * * * * * * * * * * * * * * * * * * * * * * * * * * * * * * * * * * * * * * * * * * * * * * * * * * * * * * * * * Prepared by: Arlene Asay, Budget Office
38
Full-time Faculty Full-time Admin/Staff All Full-time
Full-time Faculty Salaried Admin/Staff All Full-time
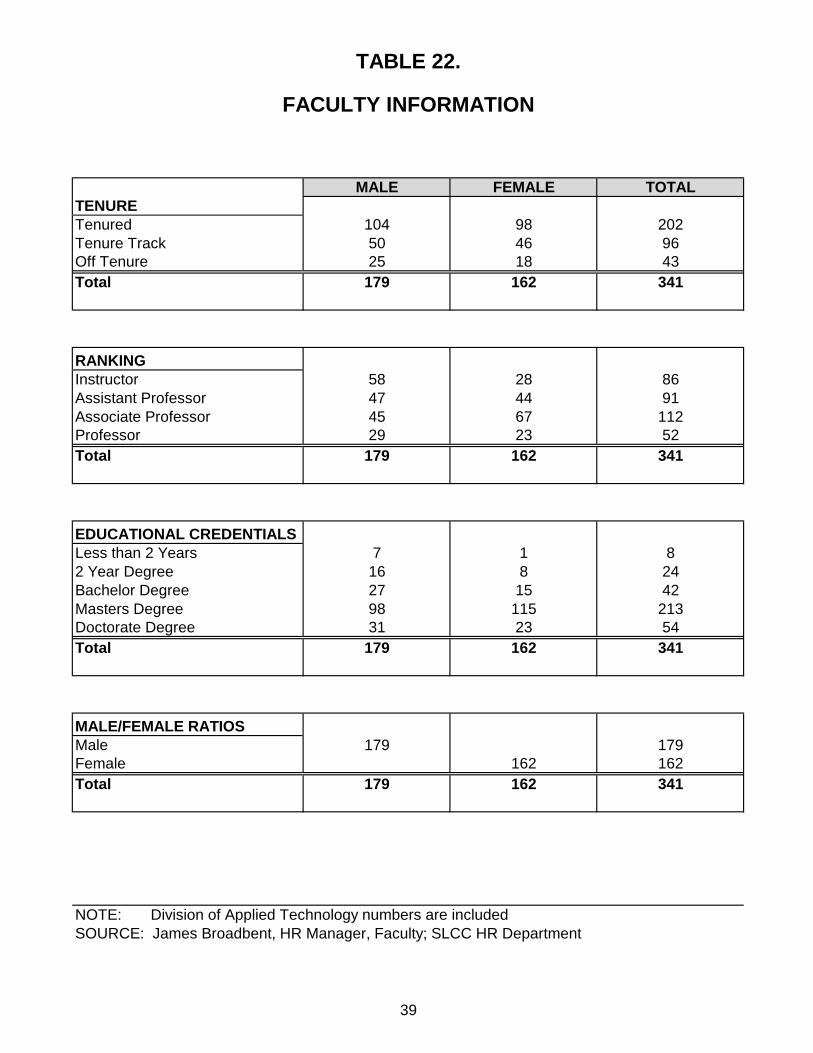
MALE FEMALE TOTALTENURETenured 104 98 202Tenure Track 50 46 96Off Tenure 25 18 43Total 179 162 341
RANKINGInstructor 58 28 86Assistant Professor 47 44 91Associate Professor 45 67 112Professor 29 23 52Total 179 162 341
EDUCATIONAL CREDENTIALSLess than 2 Years 7 1 82 Year Degree 16 8 24Bachelor Degree 27 15 42Masters Degree 98 115 213Doctorate Degree 31 23 54Total 179 162 341
MALE/FEMALE RATIOSMale 179 179Female 162 162Total 179 162 341
NOTE: Division of Applied Technology numbers are includedSOURCE: James Broadbent, HR Manager, Faculty; SLCC HR Department
39
FACULTY INFORMATION
TABLE 22.

TAB D. STEP AHEAD
DEGREES AND AWARDS
In 2011-2012, Salt Lake Community College awarded 3,550 Associate
Degrees. SLCC had 33.4% of all Associate Degrees in the Utah System of
Higher Education. Community College Week recognized SLCC as being
3rd in the nation for the number of Associate Degrees awarded out of all
two-year community colleges.
40
Fast Facts
Number of Degrees Awarded 2011-2012
• AS = 2,652 • AAS = 752
• AA = 77
• APE = 69
• Certificates = 150
• Diplomas = 23

TABLE 23.
DISTRIBUTION OF GRADUATESBY DEGREE AND BY MAJOR
2 0 0 9 - 1 0 2 0 1 0 - 1 1 2 0 1 1 - 1 2PROGRAM AREA APE AA AS AAS CERT DIP APE AA AS AAS CERT DIP APE AA AS AAS CERT DIP
Accounting 9 10 12 9 16 1Apprenticeship (all) 32 47 40Architectural Technology 23 10 22 9 17 2ASL/Interpreting 12 13 13Automotive Collision Repair & Painting 4 1 4 4 2Automotive Technician 7 16 14Aviation Maintenance Technician 7 1 10 1 16 1Aviation Technology/Professional Pilot 9 9 13 1Barbering/Cosmetology 50 47 36 55 12 23 48 22 21Biology 11 9 13Biotechnology/Biomanufacturing 4 1 8 5 1 6 7 2 1Bldg Construction/Construction Mgt (all) 8 9 5 9 2Business 36 254 32 226 26 208Business Mgt/Log Mgt/Prod Mgt/SBO (all) 4 1 1 9 1Chemistry 26 16 12Communications (all) 21 18 22Computer Info Systems (all) 15 1 13 5 15 9Computer Science 23 21 23 3Criminal Justice 51 3 70 3 67 3Culinary Arts 13 16 21Dental Hygiene 32 22 16Diesel Systems Technology 5 11 11Economics 11 15 13Education 19 29 38Electrical and Instrumentation Tech 9 6 8 2 2Electronics 4 16 2 6Energy Management 10 11Engineering (all) 42 44 69Engineering Design/Drafting Tech 10 8 27 8 2 12 12 14 11English 14 16 16 6 1 17 4Environmental Technology 5 2 2Family & Human Studies 1 1 7Fashion Institute 5 4 19 3Film Production Tech 6 2 4Finance and Credit 4 1 2 4Fitness Technician 12 8 11General Studies 1769 1805 1968Geosciences (all) 2 1 4 3 2 2 2 11Health Science 83 93 64History 14 21 14Humanities 3 7 3Interior Design 10 6 22International Studies (all) 9 4 3Marketing Mgt 5 1 7 1 1Mathematics 3 6 7Medical Assistant 58 62 64Music 3 8 4Non-Destructive Testing Tech 9 9 5Nursing 284 260 232Occupational Therapy Asst 15 15 19Paraeducation 2Paralegal Studies 38 36 48Physical Therapist Asst 23 22 21Physics 3 1 3Political Science 25 20 18Psychology 54 73 54Radiologic Technology 41 31 39Social Work 4 17 3 25 1 12Sociology 46 39 39Surgical Technology 61 32 32Surveying 13 10 6Telecommunications 4Visual Art & Design (all) 3 44 1 6 43 2 63 1Welding 9 1 9 7COLLEGE TOTALS 42 92 2509 741 220 38 44 96 2563 710 140 24 69 77 2652 752 150 23
41

TABLE 24.
DISTRIBUTION OF GRADUATES BY DEGREEBY MAJOR AND BY GENDER
MALE FEMALE TOTAL 2 0 1 1 - 1 2 2 0 1 1 - 1 2 2 0 1 1 - 1 2
PROGRAM AREA APE AA AS AAS CERT DIP APE AA AS AAS CERT DIP APE AA AS AAS CERT DIPAccounting 1 15 1 16 1Apprenticeship (all) 38 2 40Architectural Technology 13 1 4 1 17 2ASL/Interpreting 1 12 13Automotive Collision Repair & Painting 3 2 1 4 2Automotive Technician 14 14Aviation Maintenance Technician 16 1 16 1Aviation Technology/Professional Pilot 11 1 2 13 1Barbering/Cosmetology 1 48 22 20 48 22 21Biology 8 5 13Biotechnology/Biomanufacturing 4 1 2 6 2 1 6 7 2 1Bldg Construction/Construction Mgt (all) 9 1 1 9 2Business 18 111 8 97 26 208Business Mgt/Log Mgt/Prod Mgt/SBO (all) 3 6 1 9 1Chemistry 8 4 12Communications (all) 11 11 22Computer Info Systems (all) 10 6 5 3 15 9Computer Science 23 3 23 3Criminal Justice 37 2 30 1 67 3Culinary Arts 12 9 21Dental Hygiene 16 16Diesel Systems Technology 11 11Economics 12 1 13Education 2 36 38Electrical and Instrumentation Tech 2 2Energy Management 9 2 11Engineering (all) 66 3 69Engineering Design/Drafting Tech 11 13 10 1 1 1 12 14 11English 6 2 11 2 17 4Environmental Technology 1 1 2Family and Human Studies 7 7Fashion Institute 1 18 3 19 3Film Production Tech 4 4Finance and Credit 1 3 4Fitness Technician 2 9 11General Studies 927 1041 1968Geosciences (all) 1 9 1 2 2 2 2 11Health Science 13 51 64History 8 6 14Humanities 2 1 3Interior Design 1 21 22International Studies (all) 2 1 3Marketing Mgt 1 1Mathematics 5 2 7Medical Assistant 5 59 64Music 2 2 4Non-Destructive Testing Tech 5 5Nursing 39 193 232Occupational Therapy Asst 3 16 19Paralegal Studies 7 41 48Physical Therapist Asst 3 18 21Physics 2 1 3Political Science 10 8 18Psychology 23 31 54Radiologic Technology 12 27 39Social Work 4 1 8 1 12Sociology 12 27 39Surgical Technology 10 22 32Surveying 6 6Visual Art & Design (all) 26 37 1 63 1Welding 7 7COLLEGE TOTALS 66 37 1272 255 36 2 3 40 1380 497 114 21 69 77 2652 752 150 23
42

TAB E. STEP AHEAD
FINANCIAL INFORMATION
Salt Lake Community College strives to keep higher education
affordable for the residents of its service area. In a climate of state budget
reductions, Salt Lake Community College increased tuition and fees by only
3.9% for 2012-2013.
Salt Lake Community College provides assistance when possible
through Federal grants, student loans, and outside scholarships. The
amount of Pell Grants awarded to SLCC students increased 2% over 2010-
2011.
43
Fast Facts
• 2012-2013 Full-time Tuition and Fees
(per semester) = $1,585 • 2011-2012 Cost per FTE = $2,657
• 2011-2012 Estimated Students with Financial
Aid = 24,792

TABLE 25.
2012-2013 CURRENT SEMESTER TUITION AND FEE SCHEDULE
2012-2013 2012-2013TUITION AND FEE SCHEDULE TUITION AND FEE SCHEDULE
RESIDENT STUDENTS NON-RESIDENT STUDENTSTOTAL TOTAL TOTAL TOTAL
CREDIT REGULAR MISC. TUITION REGULAR MISC. TUITIONHOURS TUITION FEES & FEES TUITION FEES & FEES
1 114.50 52.50 167.00 400.50 52.50 453.002 229.50 69.50 299.00 800.50 69.50 870.003 344.50 86.50 431.00 1200.50 86.50 1287.004 459.50 103.50 563.00 1600.50 103.50 1704.005 574.50 120.50 695.00 2000.50 120.50 2121.006 689.50 137.50 827.00 2400.50 137.50 2538.007 804.50 154.50 959.00 2800.50 154.50 2955.008 919.50 171.50 1091.00 3200.50 171.50 3372.009 1034.50 188.50 1223.00 3600.50 188.50 3789.0010 1149.50 205.50 1355.00 4000.50 205.50 4206.0011 1264.50 205.50 1470.00 4400.50 205.50 4606.0012 1379.50 205.50 1585.00 4800.50 205.50 5006.0013 1379.50 205.50 1585.00 4800.50 205.50 5006.0014 1379.50 205.50 1585.00 4800.50 205.50 5006.0015 1379.50 205.50 1585.00 4800.50 205.50 5006.0016 1379.50 205.50 1585.00 4800.50 205.50 5006.0017 1379.50 205.50 1585.00 4800.50 205.50 5006.0018 1379.50 205.50 1585.00 4800.50 205.50 5006.0019 1494.50 205.50 1700.00 5200.50 205.50 5406.0020 1609.50 205.50 1815.00 5600.50 205.50 5806.0021 1724.50 205.50 1930.00 6000.50 205.50 6206.0022 1839.50 205.50 2045.00 6400.50 205.50 6606.0023 1954.50 205.50 2160.00 6800.50 205.50 7006.0024 2069.50 205.50 2275.00 7200.50 205.50 7406.0025 2184.50 205.50 2390.00 7600.50 205.50 7806.00
HISTORICAL TUITION AND FEE RATES
2005-06 2006-07 2007-08 2008-09 2009-10 2010-11 2011-12 2012-13CREDIT TUITION/ TUITION/ TUITION/ TUITION/ TUITION/ TUITION/ TUITION/ TUITION/HOURS FEES FEES FEES FEES FEES FEES FEES FEES
5RESIDENT 556.50 581.25 607.00 634.50 638.00 646.00 671.00 695.00
NON-RES 1658.50 1710.75 1791.00 1881.50 1935.00 1946.00 2036.00 2121.00
10RESIDENT 999.00 1038.75 1093.25 1145.75 1203.00 1256.00 1306.00 1355.00
NON-RES 3071.00 3188.25 3367.25 3552.75 3695.00 3856.00 4036.00 4206.00
15RESIDENT 1156.00 1201.75 1267.25 1329.75 1395.00 1466.00 1526.00 1585.00
NON-RES 3616.00 3759.25 3977.25 4186.75 4365.00 4586.00 4802.00 5006.00
44

TABLE 26.
COST PER STUDENT CREDIT HOUR BY DEPARTMENT (ANNUALIZED FTE)INSTRUCTIONAL COST
08-09 09-10 10-11 11-12DEPARTMENT AFTE $/SCH AFTE $/SCH AFTE $/SCH AFTE $/SCHAccounting 232 119 248 101 283 102 299 99Apprenticeship (all) 503 76 345 74 271 72 197 102Architectural Technology 79 186 87 199 84 177 68 199Architectural Technology (Prison) 34 161ASL/Interpreting 89 160 112 128 84 137 69 168Automotive Collision Repair & Painting 23 238 29 204 26 221 33 200Automotive Technician 66 308 111 226 115 211 113 259Automotive Technician (Prison) 33 205Aviation Technology/Aviation Maintenance Tech 66 287 91 245 129 217 152 163Aviation Technology/Professional Pilot 43 192 57 178 74 151 71 153Barbering/Cosmetology 422 158 309 153 287 170 265 198Biology 984 65 1225 58 1231 61 1158 64Biotechnology 18 1309 * 23 1234 * 26 1056 * 29 976 *Bldg Construction/Construction Mgt 61 216 58 292 65 230 62 257Bldg Construction (Prison) 80 308Business Economics 286 65 307 59 354 59 309 72Business Management 400 96 409 92 436 80 380 96Chemistry 541 54 597 58 591 64 532 69Communication 625 74 732 62 829 66 804 63Computer Info Systems 635 85 714 69 780 62 751 66Computer Science 101 336 135 228 161 112 185 110Criminal Justice 229 54 324 51 390 65 394 65Culinary Arts 115 144 143 167 118 175Culinary Arts (Prison) 48 135Dental Hygiene 47 367 50 431 34 553 26 770Developmental Education 1656 83 2119 72 2079 78 2098 82Diesel Systems Technology 15 545 30 278 43 362 44 203Education 81 60 119 47 144 45 142 60Electronics (Prison) 31 209Electronics & Instrumentation Tech 56 324 29 127 10 192 **Engineering 108 306 129 275 164 227 193 218Engineering Design/Drafting Tech 51 272 67 287 69 221 73 201Engineering Design/Drafting Tech (Prison) 4 287English 1018 88 1331 73 1125 83 1197 83English Second Language 96 80 97 91 88 83 94 73Environmental Technology 23 261 21 20 15 71 ** Family & Human Studies 205 79 232 72 268 69 199 81Fashion Institute 61 65 91 68 106 65 120 64Finance and Credit 149 90 153 88 168 78 170 81Fine Arts 564 72 653 60 779 61 766 58Geosciences 214 66 259 66 289 61 289 59Health & Lifetime Activities 675 83 782 73 903 74 897 66History/Anthropology 578 63 647 58 714 52 703 56Humanities 515 53 572 50 607 50 623 51Interior Design 59 87 61 64 79 65 79 71Languages 246 98 269 81 278 88 267 95Marketing 63 246 89 174 109 147 101 150Mathematics 1485 54 1775 48 1740 52 1746 54Medical Assistant 117 119 177 89 182 111 143 144Medical Lab Technology 1 N/AMortuary Science 5 1310 ***Non-Destructive Testing Tech 17 252 23 205 20 177 18 232Nursing 229 259 233 313 237 258 235 277Occupational Therapy Asst 39 186 38 197 41 184 48 176Paralegal Studies 97 128 121 98 134 107 134 109Physical Therapist Asst 53 216 59 202 57 217 52 222Physics 276 59 317 52 316 57 292 59Political Science 165 63 173 60 195 54 183 69Psychology 522 64 641 55 636 57 623 60Radiologic Technology 78 134 77 155 76 150 70 161Short-Term Intensive Training 22 345 22 643 17 392 10 757Social Work 71 72 81 52 102 51 100 52Sociology 258 67 284 59 310 54 287 63Surgical Technology 19 235 19 233 19 238 23 209Surveying 31 141 26 168 24 196 24 177Visual Art & Design 501 126 540 128 564 135 580 126Visual Art & Design (Prison) 10 70Welding 48 229 80 156 79 171 89 163INSTRUCTIONAL TOTALS 16152 97 18514 85 19179 85 18732 89
NOTE: * Biotechnology includes partnership funding. ** Program discontinued *** Start up costs
45

TABLE 27.
COST PER FULL-TIME EQUIVALENT (FTE) BY DEPARTMENT (ANNUALIZED FTE)
08-09 09-10 10-11 11-12DEPARTMENT AFTE $/FTE AFTE $/FTE AFTE $/FTE AFTE $/FTEAccounting 232 3564 248 3028 283 3054 299 2966Apprenticeship (all) 503 2290 345 2223 271 2160 197 3058Architectural Technology 79 5591 87 5963 84 5297 68 5984Architectural Technology (Prison) 34 4837ASL/Interpreting 89 4806 112 3843 84 4112 69 5046Automotive Collision Repair & Painting 23 7153 29 6115 26 6615 33 5988Automotive Technician 66 9254 111 6777 115 6325 113 7756Automotive Technician (Prison) 33 6157Aviation Technology/AviationMaintenance Tech 66 8605 91 7342 129 6507 152 4902Aviation Technology/Professional Pilot 43 5755 57 5326 74 4533 71 4590Barbering/Cosmetology 422 4741 309 4591 287 5091 265 5941Biology 984 1952 1225 1732 1231 1838 1158 1927Biotechnology 18 39281 * 23 37008 * 26 31676 * 29 29267 *Bldg Construction/Construction Mgt 61 6470 58 8757 65 6893 62 7706Bldg Construction (Prison) 80 9241Business Economics 286 1942 307 1781 354 1779 309 2149Business Management 400 2866 409 2745 436 2407 380 2893Chemistry 541 1624 597 1746 591 1927 532 2055Communication 625 2211 732 1857 829 1968 804 1903Computer Info Systems 635 2560 714 2064 780 1856 751 1989Computer Science 101 10086 135 6849 161 3373 185 3300Criminal Justice 229 1619 324 1515 390 1959 394 1943Culinary Arts 115 4318 143 5019 118 5251Culinary Arts (Prison) 48 4056Dental Hygiene 47 11014 50 12920 34 16577 26 23087Developmental Education 1656 2504 2119 2172 2079 2350 2098 2468Diesel Systems Technology 15 16348 30 8326 43 10863 44 6095Education 81 1786 119 1400 144 1357 142 1790Electronics (Prison) 31 6279Electronics & Instrumentation Tech 56 9727 29 3796 10 5769 ** Engineering 108 9187 129 8255 164 6805 193 6539Engineering Design/Drafting Tech 51 8165 67 8606 69 6629 73 6024Engineering Design/Drafting Tech (Prison) 4 8603English 1018 2640 1331 2186 1125 2488 1197 2482English Second Language 96 2402 97 2716 88 2477 94 2189Environmental Technology 23 7819 21 596 15 2126 ** Family & Human Studies 205 2361 232 2147 268 2066 199 2444Fashion Institute 61 1941 91 2041 106 1945 120 1911Finance and Credit 149 2696 153 2628 168 2354 170 2444Fine Arts 564 2154 653 1791 779 1817 766 1727Geosciences 214 1974 259 1987 289 1825 289 1782Health & Lifetime Activities 675 2499 782 2203 903 2220 897 1971History/Anthropology 578 1896 647 1750 714 1557 703 1682Humanities 515 1597 572 1506 607 1496 623 1521Interior Design 59 2621 61 1909 79 1955 79 2115Languages 246 2931 269 2435 278 2634 267 2847Marketing 63 7383 89 5233 109 4403 101 4493Mathematics 1485 1614 1775 1436 1740 1568 1746 1626Medical Assistant 117 3569 177 2664 182 3334 143 4317Medical Lab Technology 1 N/AMortuary Science 5 39315 ***Non-Destructive Testing Tech 17 7553 23 6163 20 5323 18 6959Nursing 229 7774 233 9395 237 7749 235 8308Occupational Therapy Asst 39 5594 38 5911 41 5513 48 5293Paralegal Studies 97 3829 121 2932 134 3221 134 3259Physical Therapist Asst 53 6491 59 6056 57 6514 52 6670Physics 276 1785 317 1568 316 1703 292 1764Political Science 165 1878 173 1803 195 1613 183 2085Psychology 522 1908 641 1664 636 1715 623 1790Radiologic Technology 78 4027 77 4658 76 4508 70 4835Short-Term Intensive Training 22 10346 22 19287 17 11771 10 22703Social Work 71 2158 81 1545 102 1532 100 1569Sociology 258 2010 284 1775 310 1619 287 1883Surgical Technology 19 7055 19 6976 19 7127 23 6284Surveying 31 4222 26 5042 24 5870 24 5317Visual Art & Design 501 3792 540 3852 564 4037 580 3767Visual Art & Design (Prison) 10 2087Welding 48 6872 80 4680 79 5139 89 4883INSTRUCTIONAL TOTALS 16152 2900 18514 2558 19179 2552 18732 2657
NOTE: $'s/FTE reflect actual costs * Biotechnology includes partnership funding. ** Program discontinued *** Start up costs
46

TABLE 28.
COSTS PER FTE (Full-Time Equivalent) STUDENT AT SLCC(Current and Adjusted for Inflation)
AdjustedCost Per Inflation Cost Per
Academic Year Student Rate (CPI) Student1990-91 3545.00 130.70 2712.321991-92 3693.00 136.20 2711.451992-93 3959.00 140.30 2821.811993-94 4016.00 144.50 2779.241994-95 4319.00 148.20 2914.301995-96 4478.00 152.40 2938.321996-97 4432.00 156.90 2824.731997-98 4367.00 160.50 2720.871998-99 4856.00 163.00 2979.141999-00 4788.00 166.60 2873.952000-01 4887.00 172.20 2837.982001-02 4913.00 177.10 2774.142002-03 4550.00 179.90 2529.182003-04 4641.00 184.00 2522.282004-05 4881.00 188.90 2583.912005-06 5412.00 195.30 2771.122006-07 5886.00 201.60 2919.642007-08 6569.00 207.30 3168.842008-09 6751.00 215.30 3135.622009-10 5790.00 214.50 2699.302010-11 5839.00 218.10 2677.212011-12 5912.00 224.90 2628.72
SOURCE: 1990-91 to 2011-12, Reported E & G Actuals(Includes tuition waivers and excludes transfers)
United States Consumer Price Index (CPI),1982-1984 = 100
47

TABLE 29.
DEPARTMENT OF FINANCIAL AID
TYPES OF % INCREASE/FINANCIAL ASSISTANCE 2001-2002 2011-2012 DECREASE
* Pell Grant $8,663,733 $42,317,307 388.44%
* Supplemental Educational $317,978 $532,942 67.60% Opportunity Grant
* Federal Work Study $293,616 $393,290 33.95%
* Perkins Student Loans $884,163 $562,385 -36.39%
* Stafford Direct Loan Program $4,759,111 $36,440,624 665.70%
Estimate: 24,792 students received some form of Aid in 2011-2012.
In 2011-2012, approximately 171,827 student contacts were made throughthe Financial Aid Department.
In 2011-2012, $1,857,144 student tuition waivers were granted.
In 2011-2012, $966,392 outside scholarships were disbursed.
In 2011-2012, $1,444,730 State Aid was disbursed.
SOURCE: Cristi Millard, Director, Financial Aid
48

TABLE/GRAPH 30.
2011-2012 EDUCATION AND GENERALREVENUE SOURCES AND EXPENDITURES
REVENUE SOURCES EXPENDITURES Tuition and Fees $ 55,832,394 Instruction $ 54,184,954 State Appropriations 56,805,491 Public Service 140,343 Other Sources 415,920 Academic Support 6,300,954
Student Services 9,836,612 Institutional Support 18,978,450 Plant Operations 17,438,437 Scholarships 580,252
TOTAL $ 113,053,805 TOTAL $ 107,460,002
49
Tuition and Fees
49.4%
State Appropriations
50.2%
Other Sources 0.4%
EDUCATION & GENERAL REVENUE SOURCES - FY 2011-2012
Instruction 50.4%
Public Service 0.1%
Academic Support
5.9%
Student Services
9.2%
Institutional Support 17.7%
Plant Operations
16.2%
Scholarships 0.5%
EDUCATION & GENERAL EXPENDITURES - FY 2011-2012

TABLE/GRAPH 31.
2011-2012 TOTAL CURRENT FUNDSREVENUE SOURCES AND EXPENDITURES
REVENUE SOURCES EXPENDITURES Tuition and Fees $ 57,926,892 Instruction $ 78,699,619 State Appropriations 64,714,457 Public Service 2,163,217 Govt. Contracts & Grants 52,063,334 Academic Support 8,600,076 Auxiliary Enterprises 13,910,413 Student Services 18,929,232 Other Sources 7,944,660 Institutional Support 23,726,459
Plant Operations 17,141,852 Scholarships 25,846,102 Auxiliary Enterprises 15,457,302
TOTAL $ 196,559,756 TOTAL $ 190,563,859
50
Tuition and Fees
29.5%
State Appropriations
32.9%
Govt. Contracts & Grants
26.5%
Auxiliary Enterprises
7.1% Other Sources
4.0%
TOTAL CURRENT FUNDS REVENUE SOURCES - FY 2011-2012
Instruction 41.3%
Public Service 1.1% Academic
Support 4.5%
Student Services
9.9%
Institutional Support 12.5%
Plant Operations
9.0%
Scholarships 13.6%
Auxiliary Enterprises
8.1%
TOTAL CURRENT FUNDS EXPENDITURES - FY 2011-2012

TAB F. STEP AHEAD
FACILITIES
Salt Lake Community College facilities have been modified to meet the
needs of growth and a changing community. A new classroom and
administrative building is under construction; when complete, it will replace
the current Nelson Administration Building on the Taylorsville Redwood
Campus. The College opened the Westpointe Center, which will serve the
Northwest part of the Salt Lake valley.
51
Fast Facts
• Taylorsville Redwood Campus -
Total Square Footage = 1,072,196
• South City Campus - Total Square Footage = 387,144
• Miller Campus -
Total Square Footage = 330,882
• Jordan Campus - Total Square Footage = 267,120
• Meadowbrook Campus - Total Square Footage = 72,383
• Leased Properties -
Total Square Footage = 138,316

TABLE/GRAPH 32.
BUILDING PROFILEINSTRUCTIONAL BUILDINGS - TAYLORSVILLE REDWOOD CAMPUS
BASED ON GROSS SQUARE FEET
GROSSBUILDING SQ. FEETLifetime Activity Center 179,637Rampton Technology Bldg 135,562Science & Industry Bldg 116,000Construction Trades Bldg 114,658Nelson Administration Bldg 106,817Markosian Library 62,000Applied Technology Center 51,905Business Building 49,500Portable Classrooms (5-12) 10,678Child Development Lab 7,510T O T A L 834,267
52
Applied Tech Center (6.2%) Lifetime Activity
Center (21.5%)
Business Bldg (5.9%)
Construction Trades Bldg
(13.7%) Markosian Library (7.4%)
Child Dev Lab (.9%)
Nelson Admin Bldg (12.9%)
Rampton Tech Bldg (16.3%)
Portable Classrooms
(1.3%)
Science & Industry Bldg
(13.9%)
BUILDING PROFILE INSTRUCTIONAL BUILDINGS (GROSS SQUARE FEET)

TABLE/GRAPH 33.
CAPITAL FACILITIES PROFILEALL CAMPUS LOCATIONS
BASED ON GROSS SQUARE FEET
GROSS GROSSBUILDING SQ. FEET BUILDING SQ. FEET
TAYLORSVILLE REDWOOD CAMPUS SOUTH CITY CAMPUS Lifetime Activity Center 179,637 Main Building 340,185 Student Center 166,088 Shop Building 24,762 Rampton Technology Bldg 135,562 South City Annex 20,867 Science & Industry Bldg 116,000 Portable Office 1,330 Construction Trades Bldg 114,658 TOTAL 387,144 Nelson Administration Bldg 106,817 Markosian Library 62,000 Applied Technology Center 51,905 Business Building 49,500 Gundersen Facilities Services Building 16,800 Facilities Complex 048 13,600 LEASED PROPERTIES Facilities Complex 049 9,000 Westpointe Center 35,700 Institutional Residence 8,343 Highland Center 31,554 Portable Classrooms (8-12) 7,840 South City Utility Storage Unit 30,000 Heating Plant 7,580 Library Square Center 21,194 Child Development Lab 7,510 International Aerospace Aviation Education Center 15,563 Physical Plant Storage 3,593 Airport Hangers (3) 2,760 Portable Offices (1-3) 3,032 Community Writing Center 1,545 Portable Classrooms (5-7) 2,838 TOTAL 138,316 Facilities Complex 052 2,000 Alder Amphitheater 1,607 Professional Lab 1,456 Facilities Complex 056 1,200 Facilities Complex 057 1,200 Athletic Restrooms 750 Softball Storage (1-3) 520 MEADOWBROOK CAMPUS Concession/Scorebooth 350 Building A 26,954 Tennis Court Storage 268 Building C 25,844 Irrigation Pump Building 240 Building B 17,608 ATC Hazardous Storage Building 162 MBC Portable #1 Flight Simulation 1,008 STC Kiosk 100 MBC Portable #2 Flight Program 969 STC Ticket Booth 40 TOTAL 72,383 TOTAL 1,072,196
MILLER CAMPUS Larry & Gail Miller Public Safety Ed. & Training Cntr. 73,221 Auto Training Center 48,820 Miller Free Enterprise Center 48,650 Corporate Partnership Center 43,750 JORDAN CAMPUS Miller Professional Development Center - 37,935 Jordan Health Science 151,000 Karen Gail Miller Conference Center Jordan High Tech Center 89,819 Miller DPS Dormitory 36,870 Student Pavilion 14,055 Miller Culinary Institute 24,480 Jordan Distribution Center (Includes Tunnel) 11,270 Miller DPS Firing Range 16,166 Ballfield Out Buildings (5) 826 Shop Storage Building 990 Pump House 150 TOTAL 330,882 TOTAL 267,120
SOURCE: Kathy Shipley, Access & Resource Manager
53
Taylorsville Redwood Campus (47.3%)
South City Campus (17.0%)
Miller Campus (14.6%)
Jordan Campus (11.8%)
Meadowbrook Campus (3.2%)
Leased Properties (6.1%)
CAPITAL FACILITIES PROFILE ALL CAMPUS LOCATIONS (GROSS SQUARE FEET)
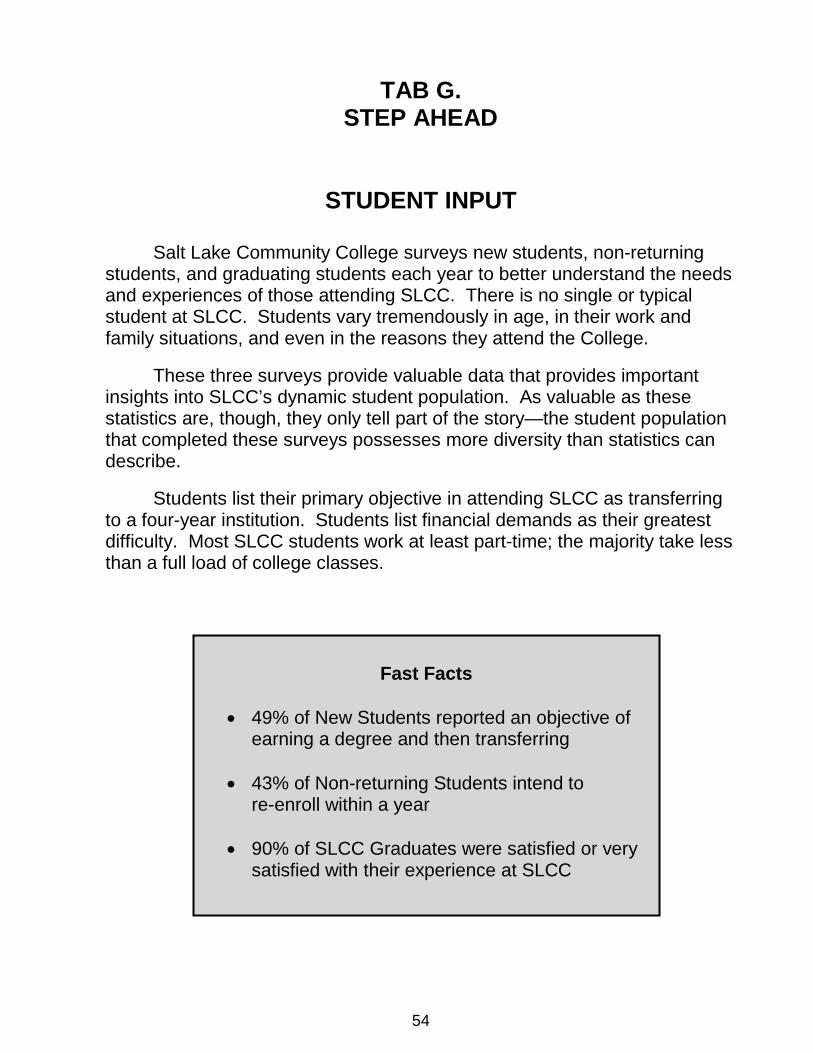
TAB G. STEP AHEAD
STUDENT INPUT
Salt Lake Community College surveys new students, non-returning students, and graduating students each year to better understand the needs and experiences of those attending SLCC. There is no single or typical student at SLCC. Students vary tremendously in age, in their work and family situations, and even in the reasons they attend the College.
These three surveys provide valuable data that provides important insights into SLCC’s dynamic student population. As valuable as these statistics are, though, they only tell part of the story—the student population that completed these surveys possesses more diversity than statistics can describe.
Students list their primary objective in attending SLCC as transferring to a four-year institution. Students list financial demands as their greatest difficulty. Most SLCC students work at least part-time; the majority take less than a full load of college classes.
54
Fast Facts
• 49% of New Students reported an objective of
earning a degree and then transferring
• 43% of Non-returning Students intend to re-enroll within a year
• 90% of SLCC Graduates were satisfied or very satisfied with their experience at SLCC

EXPLANATION OF THE STUDENT FOLLOW-UP SYSTEMS
On a yearly basis Salt Lake Community College (SLCC) conducts
anonymous student surveys asking certain kinds of information about the
College. Three surveys are conducted annually.
• The NEW STUDENT SURVEY is sent to students enrolled Fall
Semester who have not previously attended SLCC.
• The NON-RETURNING STUDENT SURVEY is sent to those
students who attended SLCC during Fall Semester but who were not
enrolled Spring Semester.
• The GRADUATING STUDENT SURVEY is mailed to students who
graduate during the school year.
Data from each survey is entered into a statistical software package,
analyzed, and the resulting information is published here. The results that are
included present each question that was asked of each of the respondents
followed by the resulting percentages.
If you have any questions concerning any facet of the Student Follow-Up
system, please contact the Office of Institutional Research at Salt Lake
Community College.
55

56
TABLE 34.
2011-2012 NEW STUDENT SURVEY SUMMARY
SATISFACTION RESPONSE PERCENTAGES FOR SELECTED SLCC PROGRAMS AND SERVICES
(Percentages are of those using the service.)
ALL NEW FALL SEMESTER STUDENTS - 970 Responses
Very
Satisfied
Satisfied
Neutral Dis-
satisfied Very
dis-satisfied Overall SLCC Experience 30% 57% 10% 2% 1% Academic Advising 28% 40% 21% 8% 3% Career Information 20% 38% 35% 5% 2% Financial Aid 38% 32% 20% 7% 3% Registration 33% 46% 15% 4% 2% Student Express 27% 40% 29% 2% 2% Appearance of Buildings/Classrooms 37% 42% 18% 2% 1% Availability of Desired Classes 11% 40% 28% 18% 3% Instructor’s Use of Class Time 28% 51% 16% 4% 1% Class Sizes 28% 55% 15% 1% 1% Quality of Instruction 26% 53% 17% 2% 2% Friendliness of Faculty/Response 31% 49% 15% 3% 2% to Need

57
TABLE 34.
2011-2012 NEW STUDENT SURVEY SUMMARY (Continued) Primary educational objective in attending? 49% Earn degree and transfer 23% Earn degree and work in that field 13% Take courses/transfer before
degree 4% Take some courses and get a
new job 2% Upgrade skills in present job 9% Other
Total semesters (including the one) planning to attend SLCC?
5% 1 7% 2 6% 3
17% 4 9% 5 8% 6 2% 7
11% 8 and above 30% Haven’t decided 5% No Response
What is your current credit hour enrollment? 18% 1 – 5 40% 6 – 11 31% 12 – 14 10% 15+ 1% No Response
What is your highest degree earned?
2% Less that HS Diploma 73% HS Diploma/GED 8% One-year Certificate of Completion 6% AS/AAS/APE/AA 8% BS/BA 2% Graduate+ 1% No Response
Current status at SLCC? 48% First time college student 16% Earned college credits through
Concurrent, AP, etc. 36% Previously attended another
college 10% Previously attended SLCC
What is your ethnic origin?
1% American Indian/Alaskan Native 4% Asian/Pacific Islander 1% Black/Non-Hispanic 9% Hispanic
80% White/Non-Hispanic 3% Other 2% No Response
How many hours a week were you employed while also attending college? 28% None 14% 1 – 19 hours 28% 20 – 39 hours 17% 40 hours 10% 41+ 3% No Response
What is your age group? 40% 18 – 21 19% 22 – 26 19% 27 – 35 14% 36 – 50 5% Over 50 3% No Response
Are you? 35% Male 64% Female 1% No Response

58
TABLE 35.
2011-2012 STUDENT FOLLOW-UP SURVEY SUMMARY (NON-RETURNING) Students who attended SLCC Fall Semester 2011,
but did not return Spring Semester 2012
ALL NON-RETURNING STUDENTS - (764 Responses)
What was your primary objective in attending SLCC? 38% Earn degree/transfer to a 4 year
institution 13% Take courses/transfer before earning a
degree at SLCC 20% Earn a degree/certificate at SLCC and
work in that field 3% Take some courses to upgrade skills in
present job 5% Take some courses and apply for a new
job 21% Other Why did I not re-enroll at SLCC in the Spring semester? 18% Financial reasons 12% Personal problems 13% Completed the courses I wanted 12% Transferred 4% Military/Church Mission 6% Graduated 4% Dissatisfied with SLCC
27% Other 4% No response
How many semesters did you complete at SLCC? 22% 1 13% 2 12% 3 9% 4 9% 5 8% 6 4% 7
16% 8 and above 7% No response
What was your total general grade point average?
5% Less than 2.0 23% 2.1 – 3.0 20% 3.1 – 3.5 33% Greater than 3.5 19% Do not know/No Response
Do you intend to return and re-enroll at SLCC? 43% Yes, within a year 16% Yes, but don’t know exactly when 18% Uncertain about whether or not 19% Do not plan to return 4% No response
What was your credit hour enrollment last semester? 42% 1 – 5 credit hours 34% 6 – 11 credit hours 17% 12 – 14 credit hours 3% 15+ credit hours 4% No response
How many hours do you work in a week? 15% None 11% 1 – 19 23% 20 – 35 39% 36 – 45 9% 46 and over 3% No response
What is your age group? 32% 18 – 23 30% 24 – 30 11% 31 – 35 23% 36 and over 4% No response
Are you? 39% Male 56% Female 5% No response

59
TABLE 35.
2011-2012 STUDENT FOLLOW-UP SURVEY SUMMARY (NON-RETURNING)
(Continued)
While you were attending SLCC, were you affected by any of the following situations?
Not a Problem
Minor Problem
Problem
Major Problem
No Response
I experienced financial difficulties. 18% 13% 52% 15% 2% Family responsibilities made it difficult to attend 59% 20% 12% 8% 1% Attendance conflicted with my work schedule 56% 24% 12% 6% 2% Classes were not available when 42% 23% 20% 9% 6% I needed them. Courses were not challenging enough. 78% 11% 3% 1% 7% I found the course work too difficult. 68% 18% 6% 2% 6% I couldn’t decide on a major/field 69% 14% 6% 5% 6% of study. I experienced health or other personal 67% 10% 8% 9% 6% problems. I felt out of place at SLCC. 77% 10% 4% 3% 6% I could not find time for classes 59% 22% 10% 2% 7% and assignments. I lacked motivation to study and 62% 21% 8% 3% 6% complete assignments. Taking only a few courses at a time 61% 19% 10% 4% 6% is slow and discouraging.
Evaluate the areas that apply to you (Percentages are those using the services.)
Very
Satisfied
Satisfied
Neutral
Dis-satisfied Very
Dis-satisfied Overall SLCC experience 31% 47% 17% 3% 2% Academic Advising 20% 29% 32% 12% 7% Quality of Instruction 28% 46% 18% 5% 3% Career Information 18% 27% 42% 10% 3% Timely Feedback from Instructors 27% 45% 18% 7% 3% Instructor Availability Outside of Class 27% 36% 29% 6% 2% Availability of Classes at Preferred Campus 20% 27% 24% 21% 8% Distance Education Offerings 16% 24% 53% 5% 2%

60
TABLE 36.
2011-2012 GRADUATING STUDENT SURVEY
(673 Responses)
(More than one response accepted.) What was your primary objective in attending SLCC? 52% University/College transfer credit 21% Preparation for a job to be obtained 13% Try to get a college degree as quickly as
possible 25% Other What are your plans after graduation? 50% Begin in Fall 2012 at a 4 year college/university 22% Transfer to a 4 year college/university at some
point in time in the future 23% Try to obtain a job in the field I studied at SLCC 6% Obtain a job in any field now that I have a
college degree 16% Other Which statement best describes your feelings about your educational experience at SLCC? 41% Very Satisfied 49% Satisfied 7% Neutral 2% Disappointed 1% Very Disappointed
What is your age group? 37% 24 years and under 40% 25 - 34 12% 35 - 44 9% 45 and over 2% Unknown
Are you? 33% Male 65% Female 2% No Response
At the present time, are you married? 50% Yes 48% No 2% No Response
Rate the college services below according to how well they fulfilled your individual needs. (Percentages are those using the services.) Very Very Poor Poor Avg Good Good Academic/ Career Advising
3%
14%
23%
37%
23%
Student Express
1%
2%
33%
45%
19%
Child Care Center
2%
6%
40%
22%
30%
Bookstore (not Including textbook prices)
2%
27%
50%
21%
Computer Labs
2%
22%
48%
28%
Disability Resource Cntr
2%
7%
30%
34%
27%
Financial Aid
2%
8%
19%
39%
32%
Library Services
1%
2%
18%
51%
28%
Library Web Resources
3%
4%
21%
47%
25%
Student Employment
3%
14%
22%
27%
34%
Tutor/Learning Center
2%
6%
22%
37%
33%
Veteran’s Services
4%
5%
32%
25%
34%
Registration
1%
3%
19%
49%
28%
Rate the instructional services according to how well they fulfilled your individual needs. Very Very Poor Poor Avg Good Good N/A Physical Classroom
4%
26%
48%
21%
1%
Typical Class Size
1%
17%
46%
35%
1%
Location of Classes
3%
19%
54%
24%
Availability of Classes to Choose From
1%
11%
28%
37%
21%
2%
Instructor’s Concern for Student Needs
1%
4%
26%
44%
23%
2%
Grading/ Testing
1%
25%
54%
19%
1%
Price of Textbooks
14%
26%
43%
13%
3%
1%
Overall Quality of Instruction
1%
3%
16%
58%
21%
1%
Instructor’s Knowledge of Subject
1%
11%
50%
37%
1%
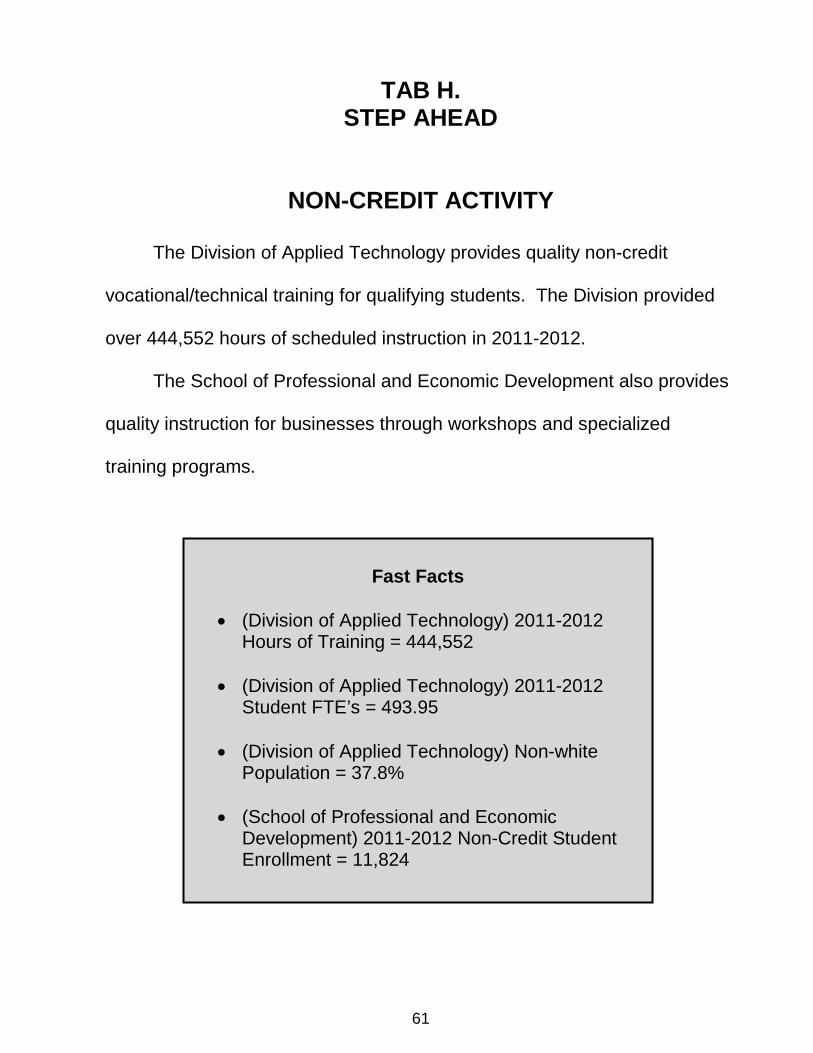
TAB H. STEP AHEAD
NON-CREDIT ACTIVITY
The Division of Applied Technology provides quality non-credit
vocational/technical training for qualifying students. The Division provided
over 444,552 hours of scheduled instruction in 2011-2012.
The School of Professional and Economic Development also provides
quality instruction for businesses through workshops and specialized
training programs.
61
Fast Facts
• (Division of Applied Technology) 2011-2012
Hours of Training = 444,552
• (Division of Applied Technology) 2011-2012 Student FTE’s = 493.95
• (Division of Applied Technology) Non-white
Population = 37.8%
• (School of Professional and Economic Development) 2011-2012 Non-Credit Student Enrollment = 11,824
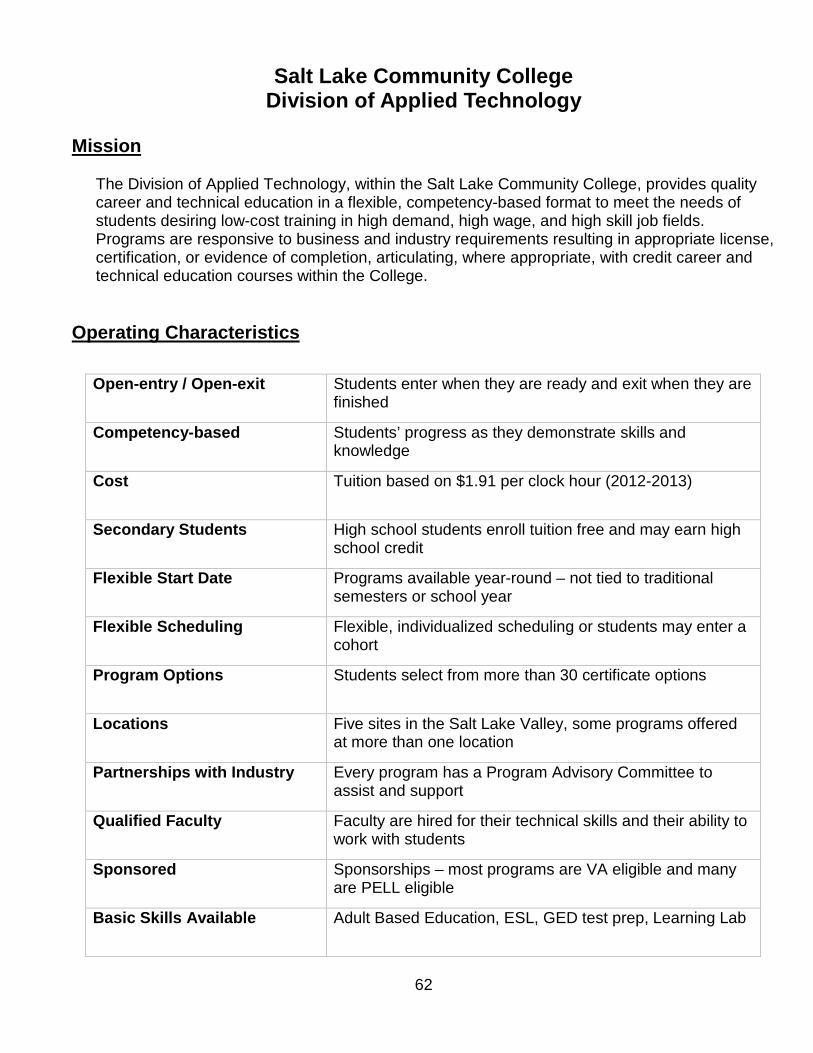
Salt Lake Community College Division of Applied Technology
Mission
The Division of Applied Technology, within the Salt Lake Community College, provides quality career and technical education in a flexible, competency-based format to meet the needs of students desiring low-cost training in high demand, high wage, and high skill job fields. Programs are responsive to business and industry requirements resulting in appropriate license, certification, or evidence of completion, articulating, where appropriate, with credit career and technical education courses within the College.
Operating Characteristics
62
Open-entry / Open-exit Students enter when they are ready and exit when they are finished
Competency-based Students’ progress as they demonstrate skills and knowledge
Cost Tuition based on $1.91 per clock hour (2012-2013)
Secondary Students High school students enroll tuition free and may earn high school credit
Flexible Start Date Programs available year-round – not tied to traditional semesters or school year
Flexible Scheduling Flexible, individualized scheduling or students may enter a cohort
Program Options Students select from more than 30 certificate options
Locations Five sites in the Salt Lake Valley, some programs offered at more than one location
Partnerships with Industry Every program has a Program Advisory Committee to assist and support
Qualified Faculty Faculty are hired for their technical skills and their ability to work with students
Sponsored Sponsorships – most programs are VA eligible and many are PELL eligible
Basic Skills Available Adult Based Education, ESL, GED test prep, Learning Lab

TABLE 37.
DIVISION OF APPLIED TECHNOLOGYHEADCOUNT, SCHEDULED HOURS, AND FTE ENROLLMENT
2011-2012(Includes Carry-Ins From Fiscal Year to Fiscal Year)
Department Program/Course HEADCOUNT SCHEDULED HRS FTE'S
Adult Basic Education Adult Basic Eucation 135 18,994.00 21.10Adult Basic Skills - Reading 3 496.00 0.55Adult Basic Skills - Both 11 1,244.00 1.38ASVAB Test Preparation 2 328.00 0.36GED Test Preparation 27 5,327.00 5.92
Air Conditioning, Heating and RefrigerationAir Conditioning, Heating and Refrigeration 124 35,345.00 39.27
Automotive and Related TechnologiesAuto General Service Tech 2 457.00 0.51Automotive Technician 3 867.00 0.96Automotive Undercar Technician 3 150.00 0.17
Computer TechnologyComputer Applications 2 30.00 0.03Computer Learning Center 81 9,591.00 10.66Computer Support Specialist (A+) 138 29,064.00 32.29Graphic Designer 9 2,012.00 2.24Internet Technician Networking 1 90.00 0.10Linux Network Administrator 1 3.00 0.00Media Design Technology 30 5,399.00 6.00Network Administrator 14 2,622.00 2.91Network Engineer (MCSE) 4 728.00 0.81Network Engineer 56 10,604.00 11.78Network Infrastucture Technician 31 5,468.00 6.08Networking Technician (Net+) 1 16.00 0.02Web Site Designer 11 2,263.00 2.51Web Programmer 20 6,307.00 7.01
Diesel Systems TechnologyHeavy Duty Diesel Maintenance 15 2,485.00 2.76Heavy Duty Diesel Tech 8 676.00 0.75
ElectronicsElectromechanical Assembly Technician 18 3,332.00 3.70Electronics Assembly Technician 12 991.00 1.10Electronics Comm Technician 18 5,311.00 5.90Electronics Engineering Technician 11 2,711.00 3.01
Electronics Technician 59 14,998.00 16.66English as a Second Language (ESL) English as a Second Language (ESL) 446 111,800.00 124.22Health Care Industry
Certified Nursing Assistant 186 13,724.00 15.25Clinical Lab Assistant 9 1,451.00 1.61Clinical Medical Assisting 103 23,506.00 26.12Health Information Specialist 25 5,953.00 6.61Health Unit Clerk/Coordinator 12 1,144.00 1.27
Medical Coding and Billing 200 41,672.00 46.30Medical Office Laboratory Technician 5 317.00 0.35Medical Office Administrator 21 3,658.00 4.06Nutrition Assistant 3 143.00 0.16Phlebotomy Technician 7 470.00 0.52Pharmacy Technician 1 45.00 0.05
Machinist Machinist/Manual Machinist 34 7,739.00 8.60Office Information Systems
Accounting Clerk 71 11,587.00 12.87Administrative Office Specialist 80 11,782.00 13.09Administrative Clerk 2 222.00 0.25Business Administrative Support I 3 385.00 0.43Business Administrative Support II 1 30.00 0.03Customer Service/Receptionist 24 3,360.00 3.73Office Clerk 3 514.00 0.57
Professional Truck DrivingCDL Learners Permit 17 2,045.00 2.27
Professional Truck Driving 65 12,925.00 14.36Welding
Welding 73 21,930.00 24.37Other
Fork Lift Training 7 49.00 0.05Undecided 1 174.00 0.19Youth Building Construction 1 18.00 0.02TOTALS 444,552.00 493.95
63

TABLE 38.
DIVISION OF APPLIED TECHNOLOGYSTUDENT INFORMATION JULY 1, 2011 THROUGH JUNE 30, 2012
(Unduplicated Headcount)
GENDER NOT TOTAL % OF FEMALE MALE REPORTED NUMBER TOTAL
ETHNICITY Caucasian 469 597 2 1068 47.8% Hispanic 303 226 1 530 23.7% Asian 90 62 152 6.8% Black 41 57 98 4.4% Native American 21 14 35 1.6% Pacific Islander 13 17 30 1.3% Two or more races 10 8 18 0.8% Non Resident Alien 71 57 1 129 5.8% Unknown 82 95 1 178 7.9% Totals 1100 1133 5 2238 100.0%
TRAINING STATUS Completed Training Objectives 419 369 1 789 35.3% Left Prior to Completing Training Objectives 307 411 3 721 32.2% Continuing Training/Education 374 353 1 728 32.5% Totals 1100 1133 5 2238 100.0%
STUDENTS RECEIVING ASSISTANCE2,238 Surveyed Supplemental Security Income 10 7 17 0.8% Food Stamps 53 39 1 93 4.2% Totals 63 46 1 110 5.0%
OTHER ASSISTANCE2,238 Surveyed(Students can be in more than one category) Displaced Homemakers 23 1 24 1.1% Limited English Proficiency 297 198 1 496 22.2% Economically Disadvantaged 256 253 1 510 22.8% Single Heads of Household 65 7 72 3.2%
64
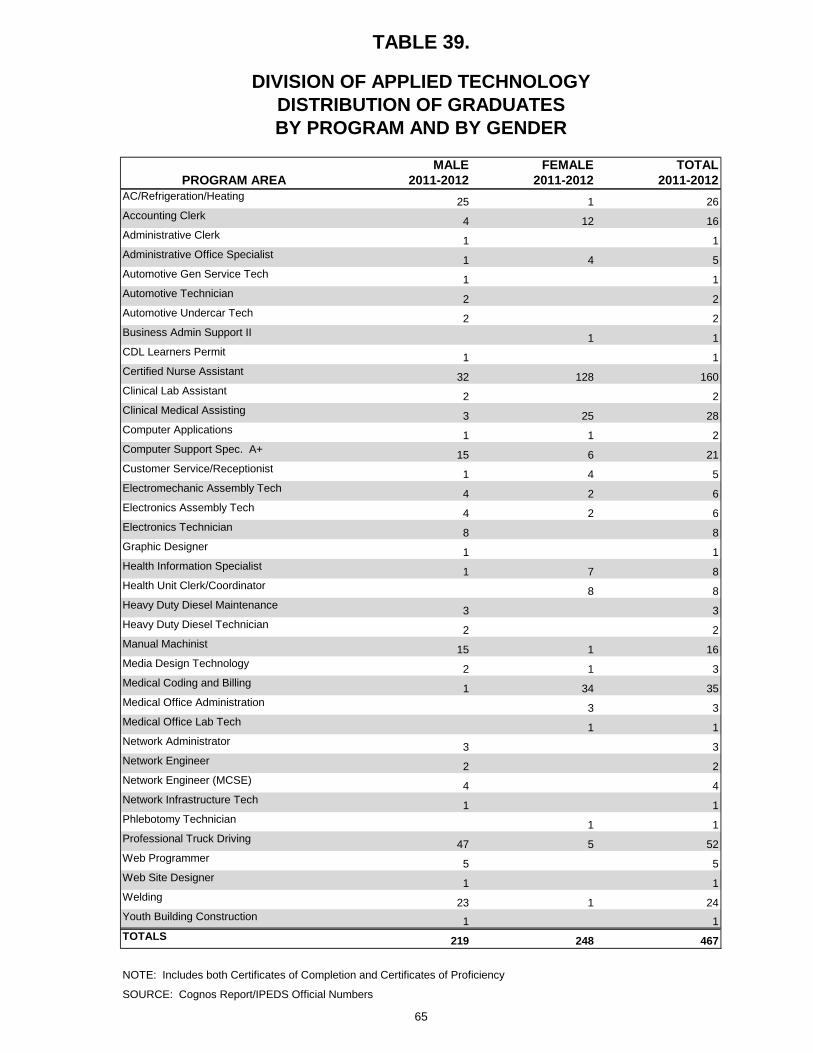
TABLE 39.
DIVISION OF APPLIED TECHNOLOGYDISTRIBUTION OF GRADUATESBY PROGRAM AND BY GENDER
MALE FEMALE TOTALPROGRAM AREA 2011-2012 2011-2012 2011-2012
AC/Refrigeration/Heating 25 1 26Accounting Clerk 4 12 16Administrative Clerk 1 1Administrative Office Specialist 1 4 5Automotive Gen Service Tech 1 1Automotive Technician 2 2Automotive Undercar Tech 2 2Business Admin Support II 1 1CDL Learners Permit 1 1Certified Nurse Assistant 32 128 160Clinical Lab Assistant 2 2Clinical Medical Assisting 3 25 28Computer Applications 1 1 2Computer Support Spec. A+ 15 6 21Customer Service/Receptionist 1 4 5Electromechanic Assembly Tech 4 2 6Electronics Assembly Tech 4 2 6Electronics Technician 8 8Graphic Designer 1 1Health Information Specialist 1 7 8Health Unit Clerk/Coordinator 8 8Heavy Duty Diesel Maintenance 3 3Heavy Duty Diesel Technician 2 2Manual Machinist 15 1 16Media Design Technology 2 1 3Medical Coding and Billing 1 34 35Medical Office Administration 3 3Medical Office Lab Tech 1 1Network Administrator 3 3Network Engineer 2 2Network Engineer (MCSE) 4 4Network Infrastructure Tech 1 1Phlebotomy Technician 1 1Professional Truck Driving 47 5 52Web Programmer 5 5Web Site Designer 1 1Welding 23 1 24Youth Building Construction 1 1TOTALS 219 248 467
NOTE: Includes both Certificates of Completion and Certificates of Proficiency
SOURCE: Cognos Report/IPEDS Official Numbers
65

TABLE/GRAPH 40.
DIVISION OF APPLIED TECHNOLOGY2011-2012 TOTAL REVENUE SOURCES AND EXPENDITURES
REVENUE SOURCES EXPENDITURES State Appropriations $ 5,793,300 Instruction $ 4,397,160 Tuition 1,049,323 Student Services 1,044,821 Non-tuition Revenue 72,192 Academic Support 165,317
Institutional Support 539,295 Plant Operations 482,268
TOTAL $ 6,914,815 TOTAL $ 6,628,861
66
State Appropriations
83.79%
Tuition 15.17%
Non-tuition Revenue
1.04%
TOTAL REVENUE SOURCES FY 2011-2012
Instruction 66.33% Student
Services 15.76%
Academic Support 2.49%
Institutional Support 8.14%
Plant Operations
7.28%
TOTAL EXPENDITURES FY 2011-2012

TABLE 41.
SCHOOL OF PROFESSIONAL AND ECONOMIC DEVELOPMENT
NON-CREDIT STUDENT ENROLLMENT
PROGRAM OR COURSE 2007-08 2008-09 2009-10 2010-11 2011-12NON-CREDIT BY PROGRAM SUBJECT CODE
CEAB - Accelerated Business Program Fee 140 149CEAL - ARL 126 157 143 109 75CEAS - ASL 206 159 271 60CEAT - ATE - CTE 167 37 27 30 33CEBC - Small Business Center Training 189 223 527 528 646CECD - CAD 60 49 35 94 93CECO - Composites 2CECT - Contractor's License Renewal 29 418 661 46 578CECW - Computer Workshops 917 597 561 662 562CEDM - Digital Media 3 29 21CEEI - Encore Institute 7 164 94CEEM - Energy Management 22CEEU - CEU's 59 87 70CEGA - Green Academy 5CEGN - Genealogy 2 11 5CEHI - Health Information Technology 97 86CEHS - Human Services 6 17 40CEHW - Health Wellness 24 6 53CEHZ - Alternative Energy Sources 110 120 216 179 140CEIB - International Business 10 3 1 3 1CEIP - Motorcycle Safety 990 1,130 831 562 655CEIP - Public Safety 150 203 246 259 239CELN - Lineman 16CELS - Library Information Science 2CEMG - Ed-2-Go 30 29 7CEMS - Notary Training 229 254 207 94 104CEPD - Professional Development 122 180 332CEPW - Professional Workshops (Summit) 57 47 29CERA - Real Estate 40 4CESB - Small Bus Dev Ctr (State) 20 12 8CESG - Smart Grid/Electric Sector 176CESO - Sonography 89CESP - State Energy Sector Partnership Grant 320 1,226CESS - Safety & Emissions 9 447 530CESU - Sustainability 29 1 4 5CETG - Ed to Go/Computer Training 192 331 292 470 512CETR - Transportation Training UDOT/UTA/UPR 1,772 3,419 1,265 1,096 1,221CETS - Health Info Tech Support 53 13CEWB - Women's Business Institute 67 173 145
CEST - STIT 672 739 853 481 685
CUSTOM FIT TRAINING 1,129 1,514 1,277 1,774 2,045
NON-CREDIT NON PROGRAM SUBJECT CODEProgram Events 1,137 1,205 222TSA Training 27Small Business Assistance 912 388 599 824 948Salt Lake Airport Training 159Ford Training Center (Outreach) 563 600 427 557 469
NON-CREDIT ACADEMIC OFFERINGS 27 14
COMBINED TOTALS 8,490 10,820 10,158 10,957 11,824
NOTE: Some duplication may occur within Program Subject Code.
67

SLCCLOCATIONS
Community Writing Center (CWC)in Library Square
210 East 400 SouthSalt Lake City, Utah 84111
(801) 957-2192
Highland Center (HLDC)3760 South Highland DriveSalt Lake City, Utah 84110
(801) 957-2100
International Aerospace/Aviation Education Center (AP)551 North 2200 West
Salt Lake City, Utah 84116(801) 957-2050
Jordan Campus (JC)3491 West Wights Fort Road
West Jordan, Utah 84088-8818(801) 957-2600
Library Square Center (LSC)231 East 400 South
Salt Lake City, Utah 84111(801) 957-2000
Meadowbrook Campus (MBC)250 West 3900 South
Salt Lake City, Utah 84107(801) 957-5821
Miller Campus (LHM) 9750 South 300 WestSandy, Utah 84070
(801) 957-5200
SLCC Onlinewww.slcc.edu/online
(801) 957-4406
South City Campus (SCC)1575 South State Street
Salt Lake City, Utah 84115(801) 957-4111
Taylorsville Redwood Campus (RRC)4600 South Redwood RoadSalt Lake City, Utah 84123
P.O. Box 30808Salt Lake City, Utah 84130-0808
(801) 957-4111
Westpointe Center (WPC) 2150 West Dauntless Avenue
Salt Lake City, Utah 84116(801) 957-2150
IA/A EducationCenter
South CityCampus
TaylorsvilleRedwoodCampus
MeadowbrookCampus
JordanCampus
PlannedHerriman Campus
MillerCampus
WestpointeCenter
www.slcc.eduMAP NOT TO SCALE
15
1512300 S.
Riverton
15
Library SquareCenter
CWC
AP
LSC
SCC
MBC
RRC
JC
LHM
HighlandCenter
WPC
HLDC
STEP AHEAD.