Administering Oracle Profitability and Cost … Maintenance Time 2-9 Viewing Performance Activity...
199
Oracle ® Cloud Administering Oracle Profitability and Cost Management Cloud E93970-10
Transcript of Administering Oracle Profitability and Cost … Maintenance Time 2-9 Viewing Performance Activity...

Oracle® CloudAdministering Oracle Profitability and CostManagement Cloud
E93970-10

Oracle Cloud Administering Oracle Profitability and Cost Management Cloud,
E93970-10
Copyright © 2017, 2019, Oracle and/or its affiliates. All rights reserved.
Primary Author: EPM Information Development Team
This software and related documentation are provided under a license agreement containing restrictions onuse and disclosure and are protected by intellectual property laws. Except as expressly permitted in yourlicense agreement or allowed by law, you may not use, copy, reproduce, translate, broadcast, modify,license, transmit, distribute, exhibit, perform, publish, or display any part, in any form, or by any means.Reverse engineering, disassembly, or decompilation of this software, unless required by law forinteroperability, is prohibited.
The information contained herein is subject to change without notice and is not warranted to be error-free. Ifyou find any errors, please report them to us in writing.
If this is software or related documentation that is delivered to the U.S. Government or anyone licensing it onbehalf of the U.S. Government, then the following notice is applicable:
U.S. GOVERNMENT END USERS: Oracle programs, including any operating system, integrated software,any programs installed on the hardware, and/or documentation, delivered to U.S. Government end users are"commercial computer software" pursuant to the applicable Federal Acquisition Regulation and agency-specific supplemental regulations. As such, use, duplication, disclosure, modification, and adaptation of theprograms, including any operating system, integrated software, any programs installed on the hardware,and/or documentation, shall be subject to license terms and license restrictions applicable to the programs.No other rights are granted to the U.S. Government.
This software or hardware is developed for general use in a variety of information management applications.It is not developed or intended for use in any inherently dangerous applications, including applications thatmay create a risk of personal injury. If you use this software or hardware in dangerous applications, then youshall be responsible to take all appropriate fail-safe, backup, redundancy, and other measures to ensure itssafe use. Oracle Corporation and its affiliates disclaim any liability for any damages caused by use of thissoftware or hardware in dangerous applications.
Oracle and Java are registered trademarks of Oracle and/or its affiliates. Other names may be trademarks oftheir respective owners.
Intel and Intel Xeon are trademarks or registered trademarks of Intel Corporation. All SPARC trademarks areused under license and are trademarks or registered trademarks of SPARC International, Inc. AMD, Opteron,the AMD logo, and the AMD Opteron logo are trademarks or registered trademarks of Advanced MicroDevices. UNIX is a registered trademark of The Open Group.
This software or hardware and documentation may provide access to or information about content, products,and services from third parties. Oracle Corporation and its affiliates are not responsible for and expresslydisclaim all warranties of any kind with respect to third-party content, products, and services unless otherwiseset forth in an applicable agreement between you and Oracle. Oracle Corporation and its affiliates will not beresponsible for any loss, costs, or damages incurred due to your access to or use of third-party content,products, or services, except as set forth in an applicable agreement between you and Oracle.

Contents
Documentation Accessibility
Documentation Feedback
1 Getting Started with Oracle Profitability and Cost ManagementCloud
About Oracle Profitability and Cost Management Cloud 1-1
User Types and Documentation 1-1
Architecture 1-3
About Oracle Profitability and Cost Management Cloud Applications 1-3
Essential Concepts 1-3
Guidelines for Working With an Oracle Profitability and Cost Management CloudApplication 1-4
Launching Oracle Profitability and Cost Management Cloud 1-5
Oracle Profitability and Cost Management Cloud Home Page 1-6
Common Feature Controls 1-8
Activating Accessibility Features 1-9
Using Oracle Profitability and Cost Management Cloud Library 1-9
2 Overview of Administration and Security
About Managing Access and Data Security 2-1
Administrative Tasks and Predefined Roles 2-2
Controlling Application Access 2-4
Granting Access to Data 2-4
About Data Grants 2-4
Data Grant Group Considerations 2-5
Creating Data Grants 2-6
Assigning Data Grants to Individuals and Groups 2-7
Repairing Data Grants 2-8
Customizing Home Page Appearance 2-8
iii

Setting Maintenance Time 2-9
Viewing Performance Activity Reports 2-9
3 Dimensions in Oracle Profitability and Cost Management CloudApplications
About Oracle Profitability and Cost Management Cloud Dimensions 3-1
Dimension Requirements 3-2
Dimension Types 3-2
System Dimensions 3-2
Rule Dimension 3-3
Balance Dimension 3-3
Oracle Profitability and Cost Management Cloud Business Dimensions 3-3
Oracle Profitability and Cost Management Cloud POV Dimensions 3-3
Oracle Profitability and Cost Management Cloud Attribute Dimensions 3-4
Oracle Profitability and Cost Management Cloud Alias Dimensions 3-4
4 Creating and Migrating Oracle Profitability and Cost ManagementCloud Applications
Using the Profitability Application Console and Other Application Features 4-1
Profitability Application Console Tabs 4-2
Creating, Importing, and Exporting Applications in the Profitability ApplicationConsole 4-4
Creating Applications with Dimensions from Flat Files 4-4
Building Applications by Importing Template Files 4-5
Accessing the Sample Application 4-6
Preparing Flat Files and Templates for Application Updates 4-7
Preparing Flat Files for Each Dimension 4-7
Exporting Template Files 4-13
Migrating an Application from Profitability and Cost Management to OracleProfitability and Cost Management Cloud 4-13
Backing Up, Restoring, and Replicating Applications Using the Migration Features 4-14
Working with an Application in the Profitability Application Console 4-15
Editing an Application’s Description and Default Dimension Settings 4-15
Performing Other Application Tasks 4-16
Updating Application Dimensions with Flat Files 4-18
Viewing, Creating, and Editing Dimensions with Dimension Management 4-19
Viewing Application Dimensions 4-20
Editing Dimensions with Dimension Management 4-24
Creating Dimensions with Dimension Management 4-26
Adding Alias Tables 4-28
iv

Viewing Tasks in the Application Job Library 4-29
Transferring Files with the File Explorer 4-32
5 Working with Application Points of View (POVs)
Introducing Points of View 5-1
About POVs 5-1
POV Dimensions 5-2
Managing POVs 5-3
Viewing the Points of View Screen 5-3
Adding POVs 5-5
Modifying the POV State 5-5
Copying POVs 5-6
Clearing Selected Artifacts from POVs 5-7
Clearing Selected Input Data from POVs 5-8
Deleting POVs and All Artifacts 5-9
6 Working with Oracle Profitability and Cost Management CloudRules
About Rules 6-1
Creating and Managing Rules 6-2
About the Rules Screen 6-2
Defining Global Contexts for Rules 6-3
Working with Rule Sets 6-4
Defining Rule Sets 6-5
Managing Rule Sets 6-6
Defining and Managing Rule Set Contexts 6-6
About Rules in Applications 6-9
Creating Allocation Rules 6-9
Defining a Source for Allocation Rules 6-10
Defining a Destination for Allocation Rules 6-14
Defining a Driver Basis for Allocation Rules 6-15
Defining an Allocation Offset for Allocation Rules 6-17
Viewing Contexts for Rules 6-18
Creating Custom Calculation Rules 6-19
Defining a Target for Custom Calculation Rules 6-20
Formulas and Syntax for Custom Calculation Rules 6-21
Viewing Contexts for Custom Calculation Rules 6-22
Managing Rules 6-23
Express Editing for Rules 6-23
v
About the Rules Express Editing Screen 6-24
Searching For and Filtering Rules 6-26
Replacing Members in Rules 6-26
Adding Members to Rules 6-27
Copying Rules to a New Rule Set 6-28
Copying Rules to a Different Point of View (POV) 6-29
Enabling and Disabling Rules 6-30
Displaying Rules as a Hierarchy 6-30
Tracing Allocations 6-31
About Tracing Allocations 6-31
Performing an Allocation Trace 6-32
Viewing Allocation Trace Results 6-33
7 Using Model Views and Validating Applications
About Validating Applications 7-1
Creating and Managing Model Views 7-1
Creating Model Views 7-1
Managing Model Views 7-3
Rule Balancing for Application Validation 7-4
Viewing the Rule Balancing Screen 7-4
Performing Rule Balancing Tasks 7-5
Performing Validation Analysis for Oracle Profitability and Cost Management Cloud 7-6
8 Deploying and Loading Data into an Application Database
Deploying Databases 8-1
Loading Data into Essbase 8-3
Restarting Essbase 8-5
9 Calculating an Application
About Oracle Profitability and Cost Management Cloud Calculations 9-1
Performing Basic Calculations Using the Navigator 9-4
10
Monitoring Oracle Profitability and Cost Management Cloud JobStatus
vi

11
Working with Oracle Profitability and Cost Management CloudAnalytics Features
About the Oracle Profitability and Cost Management Cloud Analytics Features 11-1
Working with Analysis Views 11-4
Creating and Editing Analysis Views 11-5
Using Member Functions 11-7
Generating Analysis View Results 11-8
Working with Dashboards 11-10
Creating Dashboards 11-10
Editing Dashboards 11-13
Displaying Dashboards 11-13
Working with Scatter Analysis Graphs 11-13
Defining Scatter Analysis Graphs 11-14
Scatter Analysis Graph Example 11-15
Generating Scatter Analysis Graphs 11-17
Working with Profit Curves 11-17
Defining Profit Curves 11-18
Generating Profit Curves 11-21
Running Queries from the Intelligence Panel 11-21
Working with Key Performance Indicators 11-23
Defining Key Performance Indicators 11-24
Generating Key Performance Indicators 11-28
Setting User Preferences 11-29
Working With Oracle Profitability and Cost Management Cloud Financial Reports 11-30
Defining Financial Reports within Oracle Profitability and Cost ManagementCloud 11-31
Defining Financial Reports within Financial Reporting 11-31
Running Financial Reports 11-32
12
Managing Oracle Profitability and Cost Management Cloud Queries
Creating Custom Queries in Applications 12-1
Running Queries from the Administer and Manage Menus 12-4
Formatting Query Results in Smart View 12-6
Editing and Deleting Custom Queries in Oracle Profitability and Cost ManagementCloud Applications 12-7
13
Working with Oracle Profitability and Cost Management CloudSystem Reports
Generating Oracle Profitability and Cost Management Cloud System Reports 13-1
vii

Program Documentation Report Example 13-2
Dimension Statistics Report Example 13-3
Rule Data Validation Report Examples 13-3
Execution Statistics Report Example 13-5
A Business Scenario: Streamlining Your General Ledger with OracleProfitability and Cost Management Cloud
The Issue A-1
The Solution, and How It Works A-1
The Results A-3
Key Concepts A-5
B Business Scenario: IT Financial Management
IT Financial Management in EPM Cloud B-1
C Essbase Naming Conventions
Generated Calculation Script Naming Conventions C-1
Essbase Naming Restrictions for Applications and Databases C-2
Essbase Naming Restrictions for Dimensions, Members, and Aliases C-3
Essbase Naming Conventions for Attribute Calculations Dimension C-6
D Syntax for Custom Calculation Rule Formulas
About Custom Calculation Rule Formula Syntax D-1
Skipping Empty Tuples to Optimize Custom Calculations D-2
viii
Documentation Accessibility
For information about Oracle's commitment to accessibility, visit the OracleAccessibility Program website at http://www.oracle.com/pls/topic/lookup?ctx=acc&id=docacc.
Access to Oracle Support
Oracle customers that have purchased support have access to electronic supportthrough My Oracle Support. For information, visit http://www.oracle.com/pls/topic/lookup?ctx=acc&id=info or visit http://www.oracle.com/pls/topic/lookup?ctx=acc&id=trsif you are hearing impaired.
ix

Documentation Feedback
To provide feedback on this documentation, send email to [email protected],or, in an Oracle Help Center topic, click the Feedback button located beneath theTable of Contents (you may need to scroll down to see the button).
Follow EPM Information Development on these social media sites:
LinkedIn - http://www.linkedin.com/groups?gid=3127051&goback=.gmp_3127051
Twitter - http://twitter.com/hyperionepminfo
Facebook - http://www.facebook.com/pages/Hyperion-EPM-Info/102682103112642
Google+ - https://plus.google.com/106915048672979407731/#106915048672979407731/posts
YouTube - https://www.youtube.com/oracleepminthecloud
Documentation Feedback
x

1Getting Started with Oracle Profitability andCost Management Cloud
This guide introduces the Oracle Profitability and Cost Management Cloud, itsarchitecture, the basics of its use, and administering the system.
See the following topics to learn about Oracle Profitability and Cost ManagementCloud and start using its many features:
• About Oracle Profitability and Cost Management Cloud
• About Oracle Profitability and Cost Management Cloud Applications
• Launching Oracle Profitability and Cost Management Cloud
• Oracle Profitability and Cost Management Cloud Home Page
• Activating Accessibility Features
• Using Oracle Profitability and Cost Management Cloud Library
About Oracle Profitability and Cost Management CloudTools to manage cost and revenue allocations, and to compute the profitability ofsegments. Decomposition and consumption-based costing for effective planning.
To maximize profitability, a business must be able to accurately measure, allocate,and manage costs and revenue. Oracle Profitability and Cost Management Cloud is ananalytic software tool that manages the cost and revenue allocations that arenecessary to compute profitability for a business segment, such as a product,customer, region, or branch. Oracle Profitability and Cost Management Cloud enablesyou to use cost decomposition, consumption-based costing and scenario-playing tomeasure profitability for effective planning and decision support.
Watch this video for a tour of Oracle Profitability and Cost Management Cloud
Overview Tour Video
User Types and DocumentationMany of the features of Oracle Profitability and Cost Management Cloud are designedfor specialized use, reflected in the accompanying documentation:
1-1

Table 1-1 Documentation, Contents, and Target Audience
Title Contents TargetAudience
Getting Started with Oracle Enterprise PerformanceManagement Cloud for Administrators
How to launchand navigateOracleProfitability andCostManagementCloud; how toinstall clientsoftware; how todefine users;how to performother securityand setup tasks
Identity DomainAdministratorsand ServiceAdministratorswho will addusers to thesystem andperform otherpreliminarysystemadministrationtasks
Getting Started with Oracle Enterprise PerformanceManagement Cloud for Users
How to launchand navigateOracleProfitability andCostManagementCloud; how toinstall clientsoftware
Power Users,Users, andViewers who willdesign, create,and use OracleProfitability andCostManagementCloudapplications
Administering Oracle Profitability and Cost ManagementCloud
How toadminister dataaccess, managedata, create andmanageapplications foranalyzing costand revenueallocations, andset up analyticstools
ServiceAdministratorsand Power Userswith design-levelsecurityprovisioning
Working with Oracle Profitability and Cost ManagementCloud
How to launchand navigateOracleProfitability andCostManagementCloud, and viewanalytics results,queries, andreports
Users or Viewerswho need toenter or viewdata, andanalyze cost andrevenueallocations
Additional documentation is available for code developers and those requiringaccessibility accommodations. See Activating Accessibility Features and Using OracleProfitability and Cost Management Cloud Library.
Chapter 1About Oracle Profitability and Cost Management Cloud
1-2

ArchitectureOracle Profitability and Cost Management Cloud uses an Oracle Essbase cube fordata storage and uses other related software to handle and calculate a variety of data.
The application data and calculated results can be output in a variety of reporting andanalysis tools, including Oracle Smart View for Office and Financial Reporting.
About Oracle Profitability and Cost Management CloudApplications
Oracle Profitability and Cost Management Cloud supports those with more knowledgeof domain analysis than scripting.
Oracle Profitability and Cost Management Cloud applications are designed for use byanalysts who have deep domain experience in the computation and reporting methodsof management reporting, but who may not have much experience with OracleEssbase and scripting syntax or programming languages.
Data for Oracle Profitability and Cost Management Cloud applications is housed inboth Essbase multidimensional databases and relational databases. Users withService Administrator security provisioning can create and populate an application inthe Profitability Application Console. Those with Service Administrator and Power Userroles can define the hierarchy of accounts, activities, and operations within theorganization using dimensions and dimension members.
Essential ConceptsTo model cost and revenue flows with Oracle Profitability and Cost ManagementCloud, you must understand the following essential concepts:
• Dimensions—Data categories in an underlying database used to organize datafor retrieval and preservation of values. Dimensions usually contain hierarchies ofrelated members grouped within them. For example, a Period dimension oftenincludes members for each time period, such as Quarter or Month.
• Application—A related set of dimensions and dimension members that is used tomeet a specific set of analytical or reporting requirements.
• Modeling elements—Application parts used in a Oracle Profitability and CostManagement Cloud application that apply allocation logic to dimensions andmembers. Modeling elements include cost allocation rules and analysis definitionsthat reflect existing or proposed business cases.
Together these elements organize the allocation points in the application into alogical flow. Careful modeling can capture the actual processes and activities,enabling you to realistically allocate costs and revenues.
An Oracle Profitability and Cost Management Cloud application is a representation ofpart or all of an organization, and contains costs and revenue categories that aresimilar to the organization's chart of accounts and general ledger. Oracle Profitabilityand Cost Management Cloud applications enable you to accurately trace theprocesses and activities that contribute to costs and revenue within the organization.
Chapter 1About Oracle Profitability and Cost Management Cloud Applications
1-3

Guidelines for Working With an Oracle Profitability and CostManagement Cloud Application
Overview
This topic describes an approach to designing and building applications based on yoursecurity role and the tasks it enables you to perform.
For a video overview, view the following:
Overview: Modeling Data in Oracle Profitability and Cost Management Cloud
For Service Administrators and Power Users
Service Administrators and Power Users of Oracle Profitability and Cost ManagementCloud can perform the following steps to set up an application (only ServiceAdministrators can actually create an application):
1. Define the requirements and the allocation methods required before creating theapplication.
You should establish the business requirements for the application and thereporting expectations. Using pencil and paper, discussion among stakeholders,flowcharting, diagramming software and other tools, draft the conception of whatthe application needs to contain in order to accomplish the goals. In someinstances, it may be useful to identify the results you want to achieve first, andthen work backwards to formulate the best strategy to meet these goals.
When designing the dimension outline, carefully define the reporting objectivesand requirements. The effort expended in designing the outline is rewarded whengenerating reports.
2. Define dimensions (such as Rule, Balance, business dimensions, POVdimensions, and so on) using Profitability Application Console to build the mainobjects within the application.
3. Deploy the Oracle Profitability and Cost Management Cloud database.
After an application is deployed, users with appropriate security provisioning canperform modeling tasks to show the flow of funds to specific cost and revenueallocations. Both the source and destination ranges of allocations are defined asallocation and custom calculation rules using the Oracle Profitability and CostManagement Cloud user interface. Points of view (POVs) represent specificmodeling conditions and can be used, for example, to view values for differentmonths or quarters, to compare budget versus actual figures, or to play scenariosto measure the impact of various changes on the bottom line.
4. Populate the underlying Oracle Essbase database with cost and revenue data,through Oracle Profitability and Cost Management Cloud or directly into thedatabase.
5. Identify drivers to specify how to calculate cost and revenue data. These will beadded as you define allocations (rules).
6. Create rule sets and rules.
Chapter 1About Oracle Profitability and Cost Management Cloud Applications
1-4

All modeling structure is controlled through the organization of rule sets and rulesunder POVs. For each POV, rules are organized into groups that run against thesame or similar region of the database and at the same or similar time. Thesegroups are called rule sets. They determine the order in which rules run. Rules caninherit default member selections from the POV or rule set level so users candefine a region of the database once and use it many times without having tospecify it each time. These defaults are called "contexts".
7. Validate the Oracle Profitability and Cost Management Cloud application structureto ensure that the application structure conforms to validation rules.
The modeling structure of the application is validated after creation to ensure thatall allocations are have been accounted for, and calculations are balanced.Following validation, you deploy the database, and then calculate the application,and analyze the results.
8. Set up analysis views and other analytic tools so those with User and Viewer rolescan use them.
9. Calculate the application.
For Users and Viewers
All users, including Users and Viewers, can do most of the following:
• Analyze the calculated results. You can use the trace allocation feature to visuallyfollow the flow of funds throughout the entire application, either forward orbackward.
• Use the analytics features to track and report on revenue and cost allocations.
Tip:
Descriptions are an important way to document the allocation process andare used in the Program Documentation report. They are also guides toUsers and Viewers when selecting analysis views and other analytic tools.For easy of use, include a meaningful and complete description wheneveryou can.
Launching Oracle Profitability and Cost Management CloudTo open Oracle Profitability and Cost Management Cloud:
1. In the Web browser, click the link provided by Oracle.
2. Enter your user name and password.
If requested, select an application.
Note:
The password is case-sensitive.
3. Click Sign In.
Chapter 1Launching Oracle Profitability and Cost Management Cloud
1-5

The Oracle Profitability and Cost Management Cloud Home Page opens.
Oracle Profitability and Cost Management Cloud HomePage
When you log in, you see the Oracle Profitability and Cost Management Cloud Homepage.
Figure 1-1 Oracle Profitability and Cost Management Cloud
The Home page contains these main areas:
• The Navigator Screen, accessed with
• The Welcome Area, with space for messages, favorite links, recent files opened,and other information
• The Home Page Icons
Other Home page contents include:
• , Home Page icon (jumps to the Home page from other locations)
• , Accessibility icon (displays accessibility settings), see Activating AccessibilityFeatures
• The Settings and Actions menu with your name in the header ( ).Click it to view online help and other information. You can also download clientsoftware, such as Oracle Smart View for Office, from this menu. Click Downloadsand select from available software.
Chapter 1Oracle Profitability and Cost Management Cloud Home Page
1-6

For more information about help and learning assistance, see Using OracleProfitability and Cost Management Cloud Library.
Note:
What you see and the features you can use are determined by your securityprovisioning, so your Home page may look different from what is describedand shown here.
Navigator Screen
Click to display the Navigator screen. This screen serves as a sitemap of theapplication features and displays links to all of the pages you can access. Use theNavigator screen to navigate among the processes required to build, validate, andcalculate the application, and to report results. You can also use Navigator to installclient applications such as Smart View or Financial Reporting.
Welcome Area
The Welcome area displays a greeting and any posted announcements. You canupload a photo (Setting User Preferences), view recently-accessed files (Recent tab),and add favorite links to analytics charts or views (Favorites tab). You can also run aTour video about key features.
To add items to Favorites:
1. Select a dashboard, an analysis view, a scatter analysis graph, or a profit curve.
2. Click Actions, , and then select Add as Favorite.
Note:
For information about the items you can select as Favorites, see theAnalytics chapter of Administering Oracle Profitability and Cost ManagementCloud or Working with Oracle Profitability and Cost Management Cloud.
Home Page Icons
Use the icons to view and analyze data and related information.
Figure 1-2 Oracle Profitability and Cost Management Cloud Home Page Icons
Table 1 shows the Home page icons and their uses.
Chapter 1Oracle Profitability and Cost Management Cloud Home Page
1-7

Table 1-2 Home Page Icons
Icon Name Icon Uses
Dashboards Create, modify, or viewdashboards
Intelligence Create, modify, or viewanalysis views, scatteranalysis graphs, profit curves,allocation traces, queries, andkey performance indicators
Reports Create, modify, or viewfinancial reports
Application Create and modify anapplication, import and exportartifacts
Tools Customize Home pagebackground and logos, setdaily maintenance time,control application access
Academy View documentation andvideos
Common Feature ControlsMany feature screens in Oracle Profitability and Cost Management Cloud include anyor all of the following controls:
Table 1-3 Common Controls on the Oracle Profitability and Cost ManagementCloud Feature Screens
Control Name Action
Search box Searches for the entered text
Create button Creates a new item of thedisplayed type
Delete button Removes the selected itemfrom the list
Edit button Opens the selected item forediting
Copy button Copies the selected item forpasting with another name
Inspect button Displays information about theselected item, such as a job inthe Job Library
Refresh button Updates displayed items withthe latest data
Chapter 1Common Feature Controls
1-8

Table 1-3 (Cont.) Common Controls on the Oracle Profitability and CostManagement Cloud Feature Screens
Control Name Action
Sort box Sorts the displayed tableaccording to your selection; forexample, in the Job Library,you can sort these columns:Start Date, End Date, User,or Job Type; the upward-pointing triangle sorts inascending order and thedownward-pointing trianglesorts in descending order
Actions button Offers a menu of actions forthe selected item
Activating Accessibility FeaturesTo activate visual accessibility features of Oracle Profitability and Cost ManagementCloud:
1. On the Home page, click .
2. In the Accessibility Settings window, select from the following:
• Screen Reader Mode, to enable a screen reader to read the text on thescreen
• High Contrast, to sharpen screen contrast
To learn more about about Oracle Profitability and Cost Management Cloudaccessibility features, see the Accessibility Guide for Oracle Profitability and CostManagement Cloud.
Using Oracle Profitability and Cost Management CloudLibrary
The Oracle Profitability and Cost Management Cloud Library offers a variety of freeinstructional content developed by Oracle subject-matter experts.
To access the Library, on the Oracle Profitability and Cost Management Cloud Home
page, click the Settings and Actions menu, , in the screen header.
Use the links in the navigation pane to locate content. To view overview and tutorialvideos, click Videos. Click Books to view and download complete Oracle Profitabilityand Cost Management Cloud documentation in HTML, PDF, MOBI, and EPUBformats. The Books tab also contains documents for Financial Reporting and OracleSmart View for Office as well as other relevant documentation.
Chapter 1Activating Accessibility Features
1-9

2Overview of Administration and Security
There are a number of ways to manage access and data security.
Related Topics
• About Managing Access and Data Security
• Administrative Tasks and Predefined Roles
• Controlling Application Access
• Granting Access to Data
• Customizing Home Page Appearance
• Setting Maintenance Time
• Viewing Performance Activity Reports
About Managing Access and Data SecurityOracle Profitability and Cost Management Cloud has two levels of security that controlaccess to the service, its data, and its functionality. These are granted through theApplication icon.
The first level of security in Oracle Profitability and Cost Management Cloud is grantedthrough Access Control (Controlling Application Access). Service users are grantedone of four predefined roles that control access to service functionality: ServiceAdministrator, Power User, User, and Viewer (Administrative Tasks and PredefinedRoles). Another role, Identity Control Administrator, works with Access Control tocreate other users and groups.
The second level of security determines the data that users with various roles can viewor work with. The second level of security is defined with access groups and datagrants. There are predefined access groups, such as Users and Viewers, and nativegroups, created by Identity Domain Administrators (Granting Access to Data).
Identity Domain Administrators and Service Administrators can assign these levels asfollows:
1. Identity Domain Administrators use Access Control to create users and assignthem to predefined roles and predefined access groups (Controlling ApplicationAccess).
2. Identity Domain Administrators use Access Control to create native groups, alsocalled Native Directory groups (Controlling Application Access).
3. Service Administrators create data grants to restrict access for those with Userand Viewer roles (Creating Data Grants).
4. Service Administrators assign those with User and Viewer roles to native groups(Controlling Application Access).
2-1

5. Service Administrators assign data grants to native groups. They can also assigndata grants to individuals in special cases, but must not assign data grants topredefined groups (Assigning Data Grants to Individuals and Groups).
Administrative Tasks and Predefined Roles summarizes the functional user roles andthe types of tasks they can perform.
See Getting Started with Oracle Enterprise Performance Management Cloud forAdministrators for information about setting up service-level security.
Administrative Tasks and Predefined RolesBasic access to Oracle Profitability and Cost Management Cloud instances is grantedby assigning users to predefined functional roles. For example, to permit users to viewreports belonging to a test instance, they should be assigned to the Viewer role for theinstance.
Except for the Identity Domain Administrator role, Oracle Profitability and CostManagement Cloud roles are cumulative. For example, Service Administrators canperform the same tasks as those with Power User and Viewer roles, plus their ownexclusive tasks.
Security and setup tasks are managed as follows:
• Identity Domain Administrators administer service-level security. They performinitial setup and service access tasks.
• Service Administrators perform the following application-level security tasks andapplication setup tasks:
– Create and manage applications and their dimensions and members using theProfitability Application Console.
– Migrate application artifacts from on-premise to Cloud environments, test toproduction environments, and perform backup and restore tasks..
– Perform any actions available to the other three functional roles
• In addition, Power Users and Service Administrators can perform the followingtasks:
– Create, update, and delete modeling rules and points of view (POVs).
– Set up a variety of modeling analyses, including analysis views, dashboards,scatter analysis charts, profit curves, key performance indicators, and reports.
– Load data.
– Calculate and re-calculate the application.
– View and modify modeled data.
– Trace allocations.
The following table summarizes these tasks.
Chapter 2Administrative Tasks and Predefined Roles
2-2

Table 2-1 Oracle Profitability and Cost Management Cloud Roles
Role Description
Identity Domain Administrator Uses the Security page of My Services toperform all identity domain management tasks,including creating users and assigning them toroles.
See Identity Domain Administrator role inGetting Started with Oracle Cloud for adetailed description of this role.
Identity Domain Administrator is not afunctional role; it does not inherit accessprivileges granted through functional roles. Toaccess service features, the Identity DomainAdministrator must be granted one of the fourfunctional roles.
Service Administrator Performs all functional activities in OracleProfitability and Cost Management Cloud.
This role should be granted to OracleProfitability and Cost Management Cloudexperts who need to create and administerapplication and service components.
Power User Views and interacts with data. This role grantshigh-level access to several Oracle Profitabilityand Cost Management Cloud functional areasand should be granted to senior financialanalysts among others.
Like Service Administrators, Power Users cancreate and administer service componentssuch as rule sets, rules, analysis views,dashboards, scatter analysis charts, profitcurves, key performance indicators, andreports.
User Enters data and runs analyses for dimensionmembers to which they have access. Designsreports and other analytic outputs.
Note: Data grants can affect write access forthose with the User role. See the notes in DataGrant Group Considerations.
Viewer Views and analyzes data using variousanalytic features.
Note: Users with the Viewer role are nevergranted Write Access.
For a detailed description of setting up security and assigning roles, see GettingStarted with Oracle Enterprise Performance Management Cloud for Administrators.
View this video for an overview of security in Oracle Profitability and CostManagement Cloud:
Security Overview Video
Chapter 2Administrative Tasks and Predefined Roles
2-3

Controlling Application AccessAbout Managing Access and Data Security summarizes the Oracle Profitability andCost Management Cloud security model. Basic access to service components iscontrolled by the identity domain role (predefined role)granted to users.
Additionally, Identity Domain Administrators can create Native Directory groups, alsocalled native groups, made up of identity domain users or other groups. Provisioningsuch groups enables Service Administrators to grant roles to many users at once,thereby reducing administrative overheads.
Application-level provisioning can only enhance the access rights of users; none of theprivileges granted by an Oracle Identity Administrator role can be reduced byapplication-level provisioning.
To display the access control features of Oracle Profitability and Cost Management
Cloud, on the Home page, click Tools, , and then Access Control, ).
For information about assigning users to roles and creating Native Directory groups,see Getting Started with Oracle Enterprise Performance Management Cloud forAdministrators and Administering Access Control for Oracle Enterprise PerformanceManagement Cloud.
Granting Access to DataRelated Topics
• About Data Grants
• Data Grant Group Considerations
• Creating Data Grants
• Assigning Data Grants to Individuals and Groups
• Repairing Data Grants
About Data GrantsAbout Managing Access and Data Security summarizes security features for OracleProfitability and Cost Management Cloud.
Those with Service Administrator or Power User roles must have access to all data.However, Service Administrators can restrict those with User and Viewer roles tospecific data slices, such as regions, departments, and products. This is done bycreating and then assigning data grants -- sets of data slices that can be assigned tousers or groups to limit their access only to granted data within a dimension.
• Access groups are of two types:
– Predefined groups, such as the User and Viewer groups.
– Native groups, created by Identity Domain Administrators to group certainusers for a variety of business purposes. The native groups should havemeaningful names related to their purpose.
Chapter 2Controlling Application Access
2-4

• Data grants define data slices that can be assigned to users or groups to enablethem to access the data in the defined data slice.
Caution:
Service Administrators now can create and assign data grants to control dataaccess of Users and Viewers to a certain slice of the cube. By default, usersin these groups have no data grants and can see no data. With a data grantassigned, they can see the slice of data defined by the data grant. Thosewith the predefined User role can edit the data in their assigned data slice.
Data grants should include all dimensions where you want to restrict themembers for which Users and Viewers can see data. Any dimension notincluded in the data grant will allow complete access for that dimension. Thefinal view of the data for a User or Viewer is limited based on the dimensionsselected in the data grant definition.
Also see Data Grant Group Considerations.
These topics define data grant management tasks:
• Creating Data Grants
• Assigning Data Grants to Individuals and Groups
• Repairing Data Grants
Data Grant Group ConsiderationsAs described in About Data Grants, there are two kinds of access groups within OracleProfitability and Cost Management Cloud, predefined groups and native groups.
Note:
The following concepts are very important, particularly with respect to one-way inheritance of rights and privileges.
When creating native groups and associating them with predefined groups to assignprivilege levels, the privileges must be inherited. Inheritance goes in only one direction,from parent to child.
Avoid assigning predefined groups to native groups. For example, suppose you createa native group named MyUserGroup. To associate it with the predefined User group,you must open the predefined User group, and then assign the native groupMyUserGroup to it. Then, MyUserGroup and all who are assigned to it can inheritprivileges from the predefined User group. (Note that the predefined User group mightbe named something like pcmcs-test User or pcmcs-User.)
The following considerations apply to groups generally and native groups specifically,as indicated:
Chapter 2Granting Access to Data
2-5

• Before users with a User or Viewer role can be assigned to a native group, theyshould first be assigned to one of the provided groups: User or Viewer. Thatassignment typically occurs when the user is created.
• When a user belongs to several groups, access is combined. For example,suppose the following:
– You create a user named "user1", assigned to the "Finance 01" native group.
– You create a native group "Accounts 01" and assign "user1" to it.
– You create a data grant "FinRules1" with data slice R0001 selected andassign it to the Finance 01 group.
– You create a data grant "Accounts2" with data slice NoAccount selected andassign it to the Accounts 01 group.
Now, "user1" has access to both data slices R0001 and NoAccount.
• You can redeploy the underlying data cube without affecting data grantassignments.
Caution:
For most effective security, you must assign data grants only to nativegroups and not the predefined Viewer or User groups originally provided withOracle Profitability and Cost Management Cloud.
Note:
Starting with this release, if users are assigned the User role and their DataGrant assignments give them read access to a data slice, then those usersare able to edit data using Smart View for cells within that data slice.
Important! If users are assigned to the User role who should NOT havewrite access to their assigned data slice, you need to remove them from theUser role and reassign them to the Viewer role. Users with the Viewer rolecontinue to have only read access to their assigned data slice.
To enable the new write capability for existing users assigned to the Userrole, perform the Repair Data Grants operation from the Application screen.
Note: Deploying the data cube also redeploys the Data Grant filters for eachuser, so this new functionality is enabled by default the next time you run theDeploy Cube job.
Creating Data GrantsData grants are sets of dimensions and members that define what can be seen byassigned users for those dimensions. After a data grant is created, it can be assignedindividually to those with User and Viewer roles or, most often, native groupscontaining those with User and Viewer roles. Data grants cannot be assigned toService Administrators or Power Users.
Chapter 2Granting Access to Data
2-6

To create a data grant:
1. On the Home page, click Application, , Application again ( ), and then
click Data Grants, ).
2. Click Create.
3. In Create Data Grant, enter a unique Data Grant Name and an optionalDescription.
4. Click Add Dimension and do the following:
a. Select a dimension to add, such as Department.
b. Click Select a Member.
c. In the Member Selector, select a member and drill down to select the specificmember to include.
d. Optional: Click to define a Member Function (Using Member Functions).
As you work, you can click next to Selections to remove one or more selected
members, or click at the other side of the screen to filter, show alias or membercount, or to refresh the data.
5. When member selection is complete for that dimension, click OK.
The Create Data Grant screen is displayed again.
6. Optional: Click Add Dimension to add another dimension to the data grant.
7. When the data grant definition is complete, click Save or Save and Close.
Now the definition is ready to assign to one or more users with User or Viewer roles.For instructions, see Assigning Data Grants to Individuals and Groups.
Note:
If you select a parent member but none of its children, users who areassigned that data grant can see only aggregate data for the parent and notthe individual children.
Assigning Data Grants to Individuals and GroupsRoles define what users can do with application data – create, edit, or view it, forexample, as described in Controlling Application Access. Data grants define the datathat users can access. You can assign data grants to individual users or native groupsof users, defined through Access Control features.
To assign data grants:
1. On the Home page, click Application, , Application again ( ), and then
click Data Grant Assignments, .
2. In Data Grant Assignments, select the group or user you want to assign to a datagrant, and then click (Actions).
Chapter 2Granting Access to Data
2-7

Note:
You may need to scroll to the right to see the icon.
3. Click Add Data Grant.
4. In Add Data Grant select the data grant to add, and then click OK.
You can use the drop-down list and the search box to find the data grant.
Caution:
You must assign data grants only to native groups and not the predefinedViewers or Users groups originally provided with Oracle Profitability and CostManagement Cloud.
Removing Data Grant Assignments
To remove a data grant assignment, follow steps 1 and 2 in the previous list. For step3, click Remove Data Grant.
Repairing Data GrantsData grants are applied as Oracle Essbase filters. Should an error occur, you canrepair the data grants as follows:
1. Select Application, and then Application again to display the ProfitabilityApplication Console.
2. In the Application tab, click Actions.
3. Click Repair Data Grants.
Customizing Home Page AppearanceIn place of those provided by Oracle, you can include your own logo and backgroundimage on the Oracle Profitability and Cost Management Cloud Home page. You canalso choose a background color theme and upload a photo to the Welcome area.
To upload a photo, see Setting User Preferences.
To customize the logo, background image, and background color:
1. Log in to Oracle Profitability and Cost Management Cloud.
2. On the Home page, click Tools, , and then click Appearance, .
3. Optional: Enter the location of a logo file and background image file, and thenclick Apply.
4. Optional: Select a background color from the menu.
Chapter 2Customizing Home Page Appearance
2-8

Note:
You can click Discard Changes to cancel the operation, or ResetDefaults to restore the original Oracle images.
Setting Maintenance TimeA service instance requires one hour every day to perform routine maintenance.Administrators can select the most convenient time to start the hour-long maintenancewindow. In addition to routine maintenance, Oracle applies required patches to theservice instance during this maintenance window.
Because the service instance is not available to users during the maintenance window,the Service Administrator should identify a one-hour period when no one uses theservice. Any connected user will be logged off and will lose unsaved data.
To manage the maintenance window:
1. Access a service instance (log in to Oracle Profitability and Cost ManagementCloud).
2. On the Home page, click Tools, and then click Daily Maintenance.
3. To configure the backup schedule for this service instance, complete these steps:
a. In Start Time, select the time for maintenance to begin, using a 24-hour clock.
b. In the next field, select the time zone to use for the service maintenanceschedule.
4. Click Apply.
Viewing Performance Activity ReportsYou can display activity logs with information about performance of various OracleProfitability and Cost Management Cloud tasks. To view an activity report:
1. In the Settings and Actions menu, , in the screen header, clickProvide Feedback.
2. Enter a brief description, such as "Generating activity report.", and then clickSubmit.
3. Wait about 20 minutes, and then, in an open Oracle Profitability and Cost
Management Cloud application, click Application, .
4. Be sure Application is selected, , and then click Performance, .
Select a report to view.
Chapter 2Setting Maintenance Time
2-9

3Dimensions in Oracle Profitability and CostManagement Cloud Applications
Related Topics
• About Oracle Profitability and Cost Management Cloud Dimensions
• Dimension Requirements
• Dimension Types
About Oracle Profitability and Cost Management CloudDimensions
Oracle Profitability and Cost Management Cloud uses dimensions and memberscreated in Oracle Essbase and imported into Oracle Profitability and CostManagement Cloud using flat files or the Data Management feature available throughthe Navigator. The dimensions and members are used to represent many of thestructural elements of business applications:
• System dimensions that are reserved for use by Oracle Profitability and CostManagement Cloud for system requirements (System Dimensions)
• Business dimensions that reflect the business-specific elements of the application,such as departments, accounts, activities, customers, or products (OracleProfitability and Cost Management Cloud Business Dimensions)
• Point of View (POV) dimensions that identify a specific point of view or version ofthe application, such as year, scenario, period, and version; version dimensionsenable you to maintain multiple versions of a application and can be used tocreate alternate, or what-if, scenarios of the application, or different perspectives(Oracle Profitability and Cost Management Cloud POV Dimensions)
• Attribute dimensions that enable analysis based on the attributes or qualities ofdimension members. Attributes describe characteristics of data, such as the sizeor color of products
• Alias dimensions (optional), used to assign alternate names, descriptions,languages, or other items that help to define dimensions (Oracle Profitability andCost Management Cloud Alias Dimensions)
See Dimension Requirements for information about dimensions that must be includedin valid Oracle Profitability and Cost Management Cloud applications.
3-1

Note:
You can use Dimension Management to view the dimension-memberstructure of most types of dimensions within Oracle Profitability and CostManagement Cloud (Viewing, Creating, and Editing Dimensions withDimension Management).
Dimension RequirementsThe database outline provides the data structure for the application, and includescalculation instructions and formulas. Dimensions in the Oracle Essbase outline arehierarchical. Data is stored at dimension intersections The following are OracleProfitability and Cost Management Cloud dimension requirements:
• Applications must contain at least one POV dimension and can have up to fourPOV dimensions.
• Applications must contain one and only one system dimension named Rule.
• Applications must contain one and only one system dimension named Balance.
System dimension members in the Balance dimension cannot be edited.
• There must be at least one business dimension.
Caution:
Members must not be repeated within the same dimension. However,members can be repeated across several dimensions.
Dimension TypesRelated Topics
• System Dimensions
• Oracle Profitability and Cost Management Cloud Business Dimensions
• Oracle Profitability and Cost Management Cloud POV Dimensions
• Oracle Profitability and Cost Management Cloud Attribute Dimensions
• Oracle Profitability and Cost Management Cloud Alias Dimensions
System DimensionsOracle Profitability and Cost Management Cloud applications must contain two systemdimensions: Rule and Balance. These system dimensions are populated from OracleEssbase into Oracle Profitability and Cost Management Cloud. For additionalinformation about the Rule and Balance dimensions, see the following topics:
• Rule Dimension
• Balance Dimension
Chapter 3Dimension Requirements
3-2

For more information about creating and maintaining the dimensions and members,see Creating, Importing, and Exporting Applications in the Profitability ApplicationConsole.
Rule DimensionThe Rule dimension contains definitions of rules for Oracle Profitability and CostManagement Cloud applications. Users can import data to the NoRule member of thisdimension, but the remaining members are reserved for the system.
Balance DimensionUsers can add data to the Input member of the Net Balance member of thisdimension. The remainder of the members reflect outputs determined by rule sets andrules. Adjustments are the result of driver calculations, allocations are the result of ruleallocations, and offsets result from rule offset definitions. See Working with OracleProfitability and Cost Management Cloud Rules, for information about rule sets, rules,and their definitions. Also see About Oracle Profitability and Cost Management CloudCalculations.
Data held in intersections with these members is visible in the Rule Balancing screen(Viewing the Rule Balancing Screen). The Rule Balancing topics also describe theBalance dimension members more fully.
Oracle Profitability and Cost Management Cloud Business DimensionsThe business dimensions in the application contain members that store informationthat is specifically related to the requirements of the business or organization, such asproduct types, sales regions, manufacturing processes, general ledger, payroll,departments, cost centers, and so on.
At least one Business Dimension type must be defined by the user for the application.Business dimensions are created to describe elements within the application, such asbusiness-specific departments, general ledger accounts, activities, locations,customers, and products.
Oracle Profitability and Cost Management Cloud POV DimensionsA Point of View (POV) dimension is used to present a specific version or perspectiveof the application. Each application requires at least one dimension to be designatedas a POV dimension. The POV dimensions can be whatever is required for theparticular application. The following list represents some common sample POVdimensions: :
• Period — Enables you to analyze strategies and changes over time. Because aapplication can be based on any unit of time (quarters, months, annual, years, andso on), you can analyze strategies over time, and monitor inventory ordepreciation.
• Year — Identifies the calendar year in which the data has been gathered
• Scenario — Identifies a version of the application for a specific time period and setof conditions
Chapter 3Dimension Types
3-3

Version Dimension
Using a specific POV, you can create a POV version that enables you to maintainseparate versions of the same POV to monitor the impact of changes to theapplication, or track different versions of the same application.
Use the Version dimension for the following tasks:
• Create multiple iterations of a application, with slight variations
• Model possible outcomes based on assumptions, or “what-if” scenarios todetermine best or worst case scenarios
• Facilitate target setting
By modifying different elements within the Version dimension, you can examine resultsof the changes, without modifying the original application.
Oracle Profitability and Cost Management Cloud Attribute DimensionsAn attribute dimension is a special type of dimension that is associated with abusiness dimension. Attributes describe characteristics of data, such as the size andcolor of products.
You can use the attribute feature to retrieve and analyze data not only from theperspective of dimensions, but also in terms of characteristics, or attributes, of thosedimensions. For example, you can analyze product profitability based on size orpackaging, and you can make more effective conclusions by incorporating into theanalysis market attributes such as the population size of each market region.
User-defined attributes (UDAs) can be associated with members of an outline todescribe a characteristic of the members. Users can use UDAs to return lists ofmembers that have the specified UDA associated with them. A UDA is like a text tagand can be added to a member easily, unlike an attribute which requires both creationof the attribute member in the attribute dimension as well as associating the attributewith the member.
Oracle Profitability and Cost Management Cloud Alias DimensionsAliases are alternate names, descriptions, languages, or other items that help to definedimensions. For example, you may refer to a customer number in the system, but youcan assign an alias that displays the company name on the screen, to make it easierto identify that client. You can assign one or more aliases to accounts, currencies,entities, scenarios, periods, versions, years, and user-defined dimension members.
Note:
Duplicate member names or aliases are not allowed.
Chapter 3Dimension Types
3-4

4Creating and Migrating Oracle Profitabilityand Cost Management Cloud Applications
The listed topics describe how to create, import, and export Oracle Profitability andCost Management Cloud applications using the Profitability Application Console andmigration features.
• Using the Profitability Application Console and Other Application Features
• Creating, Importing, and Exporting Applications in the Profitability ApplicationConsole
• Migrating an Application from Profitability and Cost Management to OracleProfitability and Cost Management Cloud
• Backing Up, Restoring, and Replicating Applications Using the Migration Features
• Working with an Application in the Profitability Application Console
• Viewing, Creating, and Editing Dimensions with Dimension Management
• Viewing Tasks in the Application Job Library
• Transferring Files with the File Explorer
Using the Profitability Application Console and OtherApplication Features
The Application features enable you to use the Profitability Application Console andrelated tools to create, manage, and use an application.
To explore available application features, on the Oracle Profitability and Cost
Management Cloud Home page, click Application, . Additional icons aredisplayed (Table 1:
Table 4-1 Application Icon Actions
Icon Name Action
Application Displays the ProfitabilityApplication Console (Creating,Importing, and ExportingApplications in the ProfitabilityApplication Console)
Dimension Management Displays a list of dimensionswithin the application and theirmembers (Viewing, Creating,and Editing Dimensions withDimension Management)
4-1

Table 4-1 (Cont.) Application Icon Actions
Icon Name Action
Calculation Rules Displays the Rules ExpressEditing screen for basic editsto one or more rules; currentedits include adding,replacing, and removing rulemembers and more (ExpressEditing for Rules)
Job Library Displays the Job Library fortracking job progress andsuccess (Viewing Tasks in theApplication Job Library)
Migration Accesses Migrationfunctionality for handlingapplication artifacts (BackingUp, Restoring, and ReplicatingApplications Using theMigration Features)
The Profitability Application Console, opened with the Application icon, is a frequentlyused feature. See Profitability Application Console Tabs.
Profitability Application Console TabsWith appropriate security provisioning, you can use the Profitability ApplicationConsole to add and manage an application. The Console displays as follows with theActions menu opened:
Figure 4-1 Profitability Application Console, Application Tab
To open and view the Profitability Application Console:
Chapter 4Using the Profitability Application Console and Other Application Features
4-2

1. On the Oracle Profitability and Cost Management Cloud Home page, click
Application, .
Additional icons are displayed.
2. Click Application, again.
The Profitability Application Console is displayed (Figure 1).
You see the following tabs, depending on your role:
Table 4-2 Profitability Application Console Tabs
Name Icon Action
Application Describes an existingapplication, enablesapplication creation if onedoesn't exist, indicateswhether the application isready for use with a greencheck mark (CommonFeature Controls)
Data Grant Assignments Assigning Data Grants toIndividuals and Groups
Data Grants Creating Data Grants
File Explorer Transferring Files with theFile Explorer
Performance Viewing Performance ActivityReports
The Application tab lists the application, its creation date, and modification date.
The Application tab contains any or all of the controls listed here: the followingcontrols:
3. Optional: If no application exists yet, click Create, , to create a new application.
Then, select one of the following:
• Application, to create a new application by creating a new application shell,and then importing specially formaed flat files containing dimension definitions(Creating Applications with Dimensions from Flat Files)
• Sample Application, to import the BksML30 sample application snapshot
• Import Template, to import an application template, often used for migratingfrom on-premise Oracle Hyperion Profitability and Cost Management (BuildingApplications by Importing Template Files)
4. Optional: Click Edit, , to change the application description and preferences(Editing an Application’s Description and Default Dimension Settings).
5. Optional: Click other available icons to perform additional actions (CommonFeature Controls).
Chapter 4Using the Profitability Application Console and Other Application Features
4-3

6. Optional: Click Actions to perform a variety of operations on the application:Update Dimensions, Metadata Validation, Export Template, Repair DataGrants, Export Supplemental Diagnostics, and Enable Diagnostics.
See Creating, Importing, and Exporting Applications in the Profitability ApplicationConsole, Working with an Application in the Profitability Application Console, and Viewing Tasks in the Application Job Library.
Creating, Importing, and Exporting Applications in theProfitability Application Console
To display the Profitability Application Console, see Using the Profitability ApplicationConsole and Other Application Features.
With appropriate security provisioning, you can use the Profitability ApplicationConsole to add an Oracle Profitability and Cost Management Cloud application inseveral ways. See the following sections for more information:
• Create an application shell. Then, import specially formatted flat files containingdimension definitions (see Creating Applications with Dimensions from Flat Files).
• Add a previously exported application using a template file. Template files containdimensions, metadata, and other artifacts created by exporting templates fromexisting Oracle Profitability and Cost Management Cloud applications (see Building Applications by Importing Template Files and Migrating an Applicationfrom Profitability and Cost Management to Oracle Profitability and CostManagement Cloud).
• Import the provided sample application (BksML30). See Accessing the SampleApplication.
Note:
You can only create an application if one doesn't exist yet.
To open and view the Profitability Application Console, see Using the ProfitabilityApplication Console and Other Application Features.
For additional actions you can perform in the Profitability Application Console, see Working with an Application in the Profitability Application Console.
For an overview of how to create and work with applications in Oracle Profitability andCost Management Cloud, view this video:
Overview: Getting Started Video
Creating Applications with Dimensions from Flat FilesThe following steps describe how to create an application in the ProfitabilityApplication Console and add dimensions from flat files. To migrate or restore anapplication by importing an exported template, see Building Applications by ImportingTemplate Files.
Chapter 4Creating, Importing, and Exporting Applications in the Profitability Application Console
4-4

Note:
These instructions assume that no application exists in the OracleProfitability and Cost Management Cloud instance.
To create an application in the Profitability Application Console using flat files:
1. Open the Profitability Application Console (Using the Profitability ApplicationConsole and Other Application Features).
2. Determine needed dimensions and prepare flat files (Preparing Flat Files andTemplates for Application Updates).
3. Prepare flat files of the required format (Preparing Flat Files for Each Dimension).
4. Select Create, , or select Actions, and then Create Application to create anew application.
5. In the New Application window, enter the following information and then selectNext:
• Application Name for the application
• Optional: Description of the application
6. Enter a name for the Rule dimension and for the Balance dimension, and thenclick Finish. The application is added to the Application tab.
When the job starts running, you can view results in the Job Library,
(Viewing Tasks in the Application Job Library).
7. Perform the steps in Updating Application Dimensions with Flat Files to adddimension definitions to the application.
8. When dimensions are complete, deploy the application so you can add rules(Deploying Databases).
Building Applications by Importing Template FilesExporting Template Files describes how to export Oracle Profitability and CostManagement Cloud applications to template files for application migration and backuppurposes. This section describes how to import those files, mainly to import on-premise Oracle Hyperion Profitability and Cost Management applications into OracleProfitability and Cost Management Cloud.
While you can use templates to backup and restore an application in OracleProfitability and Cost Management Cloud, it is good practice to use the migrationfeatures provided for lifecycle management. See Backing Up, Restoring, andReplicating Applications Using the Migration Features for an overview.
Chapter 4Creating, Importing, and Exporting Applications in the Profitability Application Console
4-5

Note:
The following instructions assume that no application exists in the OracleProfitability and Cost Management Cloud instance.
For another way to migrate Oracle Profitability and Cost Management Cloudartifacts, see Backing Up, Restoring, and Replicating Applications Using theMigration Features.
To migrate files from on-premise Profitability and Cost Management, see Migrating an Application from Profitability and Cost Management to OracleProfitability and Cost Management Cloud.
To migrate or restore an application with a template file:
1. Export a template file as described in Exporting Template Files.
If you are migrating an application from on-premise Profitability and CostManagement, follow the instructions in Migrating an Application from Profitabilityand Cost Management to Oracle Profitability and Cost Management Cloud.
2. Follow the instructions in Transferring Files with the File Explorer to download thetemplate file to your local drive and upload back to the File Explorer Inbox.
If you are migrating an on-premise application, make sure you can browse to thelocation of the template file on your local computer.
3. Open the Profitability Application Console (Using the Profitability ApplicationConsole and Other Application Features).
4. On the Application tab, select Actions, and then Import Template.
5. Click Select File, and then select one of the following as the location of the file:Sample Templates, Server, or Client.
6. Browse to select the file, with .zip extension.
7. Click OK.
If the file is a valid format, the import begins. Otherwise, an error message isdisplayed.
8. Optional: You can click the Job Library icon,
, and then Refresh to check import status.
Accessing the Sample ApplicationA sample application is available in the product installation which is used for testingand self-led exploration of functional areas. The sample application includes a smalldata set and a fully built out modeling structure that illustrates allocations and otherproduct features. Before attempting to load the sample application, you must ensurethat no other applications are loaded.
To load the sample application:
Chapter 4Creating, Importing, and Exporting Applications in the Profitability Application Console
4-6

1. On the Oracle Profitability and Cost Management Cloud Home page, click
Application, , and then Application, again.
2. On the Application tab, , click .
3. Select Sample Application.
4. Optional: Check the status of the import. Click Migration ,
, and then click Reports, and then Migration Status.
Preparing Flat Files and Templates for Application UpdatesYou can add or update dimensions in an existing application by importing flat files. Youalso can export template files for application migration and backup/restore operations.
The following topics describe how to prepare flat files and templates:
• Preparing Flat Files for Each Dimension
• Exporting Template Files
Preparing Flat Files for Each DimensionYou can use dimension flat files to update an existing or new Oracle Profitability andCost Management Cloud application. If existing members are omitted from the file,they are removed during the update. See the following topics for information aboutcreating flat files:
• About Flat File Properties
• About Flat File Comments
• Flat File Sample
To add or replace dimensions in an Oracle Profitability and Cost Management Cloudapplication using flat files, prepare the files as follows:
1. In a text editor, create one flat file for each dimension, following the formatdescribed in this section. Each flat file most completely define the dimension. Toimport the files see Creating Applications with Dimensions from Flat Files.
Dimension flat files are text files that contain the following rows::
• First row: A header record that specifies the order of dimension and memberproperties
• Second row: A dimension data record with values for the properties
• Third through last row: Individual member data records with values for theproperties
Chapter 4Creating, Importing, and Exporting Applications in the Profitability Application Console
4-7

Note:
Because member entries need to be in the same order as the finaloutline, parent members must be defined before their children. Theorder of the members in the file will be the same order as thedimension tree is displayed within Oracle Profitability and CostManagement Cloud (for example, in the Member Selector).
2. Create dimension and member header records following these rules:
• You can specify the properties in any order, separated by commas.
• Multi-value properties should be enclosed in double quotes, with the individualvalues of the multi-value property separated by commas. For example, a user-defined attribute (UDA) property can have multiple values:
,"myUDA1, myUDA2, myUDA3",
• Commas are not allowed within any single value. Do not use them in membernames, do not use them in UDA values, and so on.
• For other naming conventions, see Essbase Naming Conventions.
• As explained previously, double quotes are used to delimit multi-valueproperties in flat files. For this reason, do not use double quotes to delimitmember names within an aggregate storage (ASO) formula definition. Instead,you should use square brackets, [ ], to delimit member names wherenecessary.
• Property names are not case-sensitive: For example, the following names areall handled the same: name, NAME, Name.
• Not all properties are required for every row in the flat file. Properties can beignored or null, indicated by no value between the commas where thatproperty would ordinarily be listed, such as: ,,
For example, in a member record, any dimension properties from the headerwould be ignored.
• Properties without a value or with an invalid value will be defaulted for requiredproperties.
• Comments are supported (see About Flat File Comments).
• You don’t need to import a file for the Rule and Balance dimensions; membersare created automatically. You cannot specify aliases for any Rule dimensionmembers. The dimension member names for Rule and Balance dimensionmembers are defined programmatically and translated.
• The dimension sort and solve order precedence is handled as follows:Processing is based on alphabetical order using Dimension Name, except thatAttribute dimensions are always last (and ordered alphabetically from there). Ifthe Member Solve Order property is used, it overrides other considerations.
3. Before importing to update dimensions, upload the flat files into the Outbox usingFile Explorer (Transferring Files with the File Explorer.
Chapter 4Creating, Importing, and Exporting Applications in the Profitability Application Console
4-8

About Flat File PropertiesTable 1 describes the format of each property in a dimension flat file. For an exampleof a flat file, see Flat File Sample.
You can include the Essbase Member Solve Order property for a member, but youmust add it to the first line of the flat file to show its position.
Note:
The dimension name is given in the first row after any comment rows.
Table 4-3 Properties Defined in a Dimension Flat File
Property Name Property Type Dimension Types Default Value Description
Dimension Type Dimension All Regular Identifies thedimension type. Validexamples are:Account, Period,Year, Version,Scenario, POV1,POV2, POV3, POV4,Dimension, Attribute,Rule. If there is noproperty name fromthis list the default willbe “Regular”. Thisposition representsthe Dimension Name(if Gen1 row) orMember Name. POVorders are as follows:Year/POV1 = 1,Period/POV2 = 2,Scenario/POV3 = 3,Version/POV4 = 4
Storage Type Dimension Regular, Account,Entity, POV
Sparse Sparse and Dense
Chapter 4Creating, Importing, and Exporting Applications in the Profitability Application Console
4-9

Table 4-3 (Cont.) Properties Defined in a Dimension Flat File
Property Name Property Type Dimension Types Default Value Description
Dimension Name (asAttribute)
Dimension, Member Regular none When you provide anAttribute DimensionName in the header,that positionrepresents anassociated attributedimension for thedimension beingloaded. Any String inthat position istreated as an“attribute member”.For example,suppose you specify"My AttributeDimension" in theheader. In the datarows of that file, aString in the sameposition is assumedto be a member ofthat attributedimension. So, youcould specify "MyAttribute Member1"on the data row for"All Products" and theloader would assignthat member to "AllProducts" as anattribute association.
Comment Dimension, Member Regular, Account,Entity, Country, POV
none
Hierarchy Type Dimension, Member Regular, Account,Entity, Country, POV
Stored Enabled, Stored,Dynamic, Disabled
BSO Data Storage Dimension, Member Regular, Account,Entity, Country, POV
Never Share Label Only, Store,Never Share, Shared,Dynamic Calc AndStore, Dynamic Calc
ASO Data Storage Dimension, Member Regular, Account,Entity, Country, POV
Never Share Label Only, Store,Never Share, Shared
Two Pass Calculation Dimension, Member Regular, Account,Entity, Country, POV
N True or False areacceptable values (Nor Y).
ASO DimensionFormula
Dimension, Member Regular, Account,Entity, Country, POV
none
Chapter 4Creating, Importing, and Exporting Applications in the Profitability Application Console
4-10

Table 4-3 (Cont.) Properties Defined in a Dimension Flat File
Property Name Property Type Dimension Types Default Value Description
Member Solve Order Member Regular, Account,Entity, Country, POV
none In Essbase, the solveorder numberdetermines the orderby which membersare evaluated in thedimension. You canenter a numberbetween 1 and 127.The member with thehighest solve ordernumber is evaluatedfirst (for example, aformula with a solveorder number of 20 isevaluated before aformula with a solveorder number of 5).
Members with thesame solve ordernumber areevaluated in the orderin which theirdimensions appear inthe database outline.Members with nosolve order numberare evaluated after allmembers with solveorder members.
Consolidation Type Member Regular, Account,Entity, Country
Not Used Add, Subtract,Multiply, Divide,Percent, Ignore, NotUsed
UDA Dimension, Member Regular, Account,Entity, Country
none Single text value or alist of text values(enclosed bycomma). WhenDimension, the valueis a Dimension Nameof Type = UDA.When Member, it is aMember of thespecified UDAdimension. Forexample:
myUda1“myUda1,myUda2”
Chapter 4Creating, Importing, and Exporting Applications in the Profitability Application Console
4-11

Table 4-3 (Cont.) Properties Defined in a Dimension Flat File
Property Name Property Type Dimension Types Default Value Description
Parent Member Regular, Account,Entity, Country, POV,Attribute
Identifies the parentmember name. If nullit means the memberis Generation 2.Order matters; areferenced parentmust be definedpreviously.
Alias:Alias table Dimension, Member All Examples: “Alias:Default”, “Alias: T1”
Description Dimension, Member All Optional – no default.
About Flat File CommentsFor single line comments, place the hash character as the first character on the line.Blank lines are ignored.
Block comments are delineated by a start comment block indicator (#!) and terminatedon a separate line with an end block indicator (#--!). Intervening lines need not becommented.
For example:
#!—start of comment block
Comment within block
Another comment within block
#--!
Flat File SampleFigure 1 shows a sample file for dimension Customers.
Figure 4-2 Customers.txt Flat File Sample
Chapter 4Creating, Importing, and Exporting Applications in the Profitability Application Console
4-12

Exporting Template FilesTemplate files are created by exporting an entire Oracle Profitability and CostManagement Cloud application — including application metadata, dimensionmetadata, and program artifacts — in a single operation to create one application"template" file. Exporting and importing template files can be useful, for updatingapplications and migrating applications from on-premise to the Cloud. Full backupsand restorations are handled best by using the migration features for lifecyclemanagement (Backing Up, Restoring, and Replicating Applications Using theMigration Features}.
Note:
Use Export Template to export application input data that is noncalculatedand less than 5 million cells.
To export a template file:
1. Open the Profitability Application Console and select the application (Using theProfitability Application Console and Other Application Features).
2. Click Actions, and then Export Template.
3. Review the file name and change it if you want. Extension .zip is added toexported template files.
4. If POV data is displayed, select whether to export all POV data or clearcheckboxes for data that shouldn't be exported.
5. Click OK to start the export.
The file is created in the Outbox. You can download it to local storage for futureuploading and import. See Transferring Files with the File Explorer. for moreinformation.
6. You can click the Job Library icon, , and then Refresh to check export status.
Once created, a template file can be imported to create a new Oracle Profitability andCost Management Cloud application as described in Building Applications byImporting Template Files.
Migrating an Application from Profitability and CostManagement to Oracle Profitability and Cost ManagementCloud
You can migrate a Management Ledger application from on-premise Oracle HyperionProfitability and Cost Management to Oracle Profitability and Cost Management Cloud.The migration includes the following:
• Dimensions, whether file-based or managed in Oracle Hyperion EPM Architect oran Oracle Essbase cube
Chapter 4Migrating an Application from Profitability and Cost Management to Oracle Profitability and Cost Management Cloud
4-13
• Rules and rule sets
• Queries and model views
• POV settings
• Optionally, input values but not calculated values
No other content outside of the Management Ledger application is included. Forexample, reports produced using Oracle Hyperion Financial Reporting are notincluded.
On-premise Profitability and Cost Management must be release 11.1.2.4.110 or morerecent.
Note:
You can also create a custom application.
To migrate a Management Ledger application from on-premise Profitability and CostManagement to Oracle Profitability and Cost Management Cloud, begin by exportingthe on-premise application template file:
1. Log into Profitability and Cost Management and select the application to migrate.
2. Click Actions, and then Export Template.
3. In Export Template, enter an Export File Name, and then indicate whether toInclude Input Data.
4. Click OK to start the export. You can track progress in the Job Library.
When the template has been exported, log into Oracle Profitability and CostManagement Cloud and import the template (Building Applications by ImportingTemplate Files).
Backing Up, Restoring, and Replicating Applications Usingthe Migration Features
Oracle Profitability and Cost Management Cloud offers flexible lifecycle managementfeatures to help with a number of maintenance and migration tasks:
• Backing up to create a full snapshot. Snapshots Snapshots can be downloadedand saved for recovering the full application in the event of catastrophic failure.They can also be use for cloning an environment -- for example, to migrate anapplication from test to production.
• Downloading snapshots to save them for backups.
• Importing a full snapshot to recover the application.
• Exporting to create a backup of specific artifacts in the application. For example,you can export all the calculation rules for an old POV before removing it from theapplication.
• Importing only selected artifacts or artifact types from a snapshot. For example,you may want to migrate only analytic artifacts from one test environment toanother.
Chapter 4Backing Up, Restoring, and Replicating Applications Using the Migration Features
4-14

To access migration features within Oracle Profitability and Cost Management Cloud,
on the Home page, click Application, , and then Migration, .
For instructions, see Administering Migration for Oracle Enterprise PerformanceManagement Cloud.
Also see Exporting Template Files and Loading Data into Essbase.
Note:
You can import an entire snapshot into an empty Oracle Profitability andCost Management Cloud service where no application currently exists. Ingeneral, artifacts in an Oracle Profitability and Cost Management Cloudapplication snapshot can be imported individually (separately) into anexisting application. The exception to this is the Dimensions artifact.Dimension metadata cannot be re-imported into an existing application usingan Application Snapshot. Use the Update Dimension job of the EPMAutomate loaddimdata command to update the dimension's metadata in anexisting application.
Note:
To migrate an application from on-premise Oracle Hyperion Profitability andCost Management, see Migrating an Application from Profitability and CostManagement to Oracle Profitability and Cost Management Cloud.
Working with an Application in the Profitability ApplicationConsole
You can edit an application's description and select the number of calculation threadsto use. You can also select default calendar settings to use in analysis views, profitcurves, and wherever member functions support the Current option.
With sufficient security provisioning, you also can perform the following tasks using theActions menu and Create button: Update Dimensions, Metadata Validation,Export Template, Re-Order Dimensions, Repair Data Grants, ExportSupplemental Diagnostics, and Enable Diagnostics. If no application exiis, you canselect Create Application or Import Template.
For more information, see Editing an Application’s Description and Default DimensionSettings and Performing Other Application Tasks.
Editing an Application’s Description and Default Dimension SettingsYou can edit an application's Description, select the default number of calculationthreads to use, set the numeric rounding precision for allocations, and set the defaultcalendar to use in the member selector for analytic features.
Chapter 4Working with an Application in the Profitability Application Console
4-15

To edit these application settings:
1. Open the Profitability Application Console (Using the Profitability ApplicationConsole and Other Application Features).
2. On the Application tab, click Edit, .
3. View and modify information as required:
• On the Definition tab, modify the Description, if required
• Optional: Set a different number of Calculation Threads.
• Optional: Change the Allocation Precision, the decimal precision forcalculated allocation results. Precision is calculated by rounding, nottruncation. The default is 2 decimal places. Values can range from 7 to -6.
• On the Dimension Settings tab, select a dimension to use at the Year andPeriod level whenever Current is offered as a dimension member option, andthen click the links following Current Year and Current Period to set thoseoptions.
For example, you can set these as follows: Year Dimension to Year, CurrentYear to 2016, Period Dimension to Period, and Current Period to June.
• Following Fiscal Period Start Member, type the period that starts the fiscalyear, for example, January if you use the calendar year for your fiscal year.
• Select a Scenario Dimension and an Account Dimension as defaults forthose dimension types.
4. Click Save.
Performing Other Application TasksYou can update and order dimensions, validate metadata, export and importtemplates, and access diagnostics.
To perform these tasks:
1. Open the Profitability Application Console (Using the Profitability ApplicationConsole and Other Application Features).
2. Optional: To delete the current application, click .
Ensure no other users require this application before deleting it.
Note:
If you want to delete an application, delete it using the ServiceAdministrator user that created the application.
3. Optional: Click Actions, and then select one of the following options:
• Update Dimensions—Add or remove dimension members for the selectedapplication
For details, see Updating Application Dimensions with Flat Files.
• Metadata Validation—Runs cross-dimension validations on the deployeddata for the selected application but does not enable valid applications
Chapter 4Working with an Application in the Profitability Application Console
4-16

Results are displayed in the Job Library ( ). If a validation error occurred,click the link for details. You can create a file of errors for easier correction.
• Export Template—Create a zip file of an entire application for backup ormigration (Exporting Template Files)
• Import Template—Only available if no application exists yet; create a newapplication by loading an exported template file (Building Applications byImporting Template Files)
• Re-Order Dimensions—Move dimensions up or down the dimension outline
• Repair Data Grants—Push all data grant assignments to Essbase where theyare enforced, in case a synchronization error occurs.
• Export Supplemental Diagnostics—Submit a job that collects variousdiagnostic information in the form of .csv files, text files, and reports and zipsthem into a single file. This file is saved in the Oracle Profitability and CostManagement Cloud File Explorer, where you can download it. When workingwith Oracle Support to diagnose a problem, you may be requested to providethis file.
Note:
The general types of information collected are metadata, aggregate,and statistical, related to the structure of the application and itsexecution characteristics. Information is collected for diagnosis andsupport. No sensitive information or actual data is collected.
• Enable Diagnostics—Enable diagnostic logging for error debugging.
4. Respond to any confirmation prompts.
The selected action is performed.
Tip:
View and refresh the Job Library, , to check the current status of aProfitability Application Console job (Viewing Tasks in the Application JobLibrary).
Chapter 4Working with an Application in the Profitability Application Console
4-17

Updating Application Dimensions with Flat Files
Note:
You can use Dimension Management to list and view most currentdimensions and members in the application (Viewing, Creating, and EditingDimensions with Dimension Management). You can also edit dimensionsdirectly.
Updating with flat files, described in this section, is most useful for updatingin a more automated way when many updates are required.
When you update a dimension with flat files, you import a flat file containing a newdefinition of that dimension (Preparing Flat Files for Each Dimension). You mustupload the flat file to the Inbox before beginning the update (Transferring Files withthe File Explorer).
You can view this video to learn how to update dimensions with flat files:
Updating Metadata in Oracle Profitability and Cost Management Cloud
To update Oracle Profitability and Cost Management Cloud dimensions with flat files:
1. Open the Profitability Application Console (Using the Profitability ApplicationConsole and Other Application Features).
2. On the Application tab, click Actions, and then select Update Dimensions.
Typically, you would perform a Pre-Update Analysis and then select UpdateDimensions.
3. Optional: Perform a Pre-Update Analysis:
a. Optional: Under Pre-Update Analysis, select Validate Dimensions to verifythat each of the selected changes are valid. This option does not update thedimensions. If all dimensions have been selected, this option also runs theapplication level dimensions validations.
Validation errors and the results of the impact analysis are displayed in theJob Library.
b. Under Pre Update Analysis, select Impact Analysis to perform acomparison between the application being deployed and the existingapplication in Oracle Profitability and Cost Management Cloud. If ImpactAnalysis is selected, the Validate Dimensions option is selectedautomatically.
c. Click OK.
The modified dimensions are validated but not updated. The followinginformation is displayed:
• New Members
• Deleted Members
Chapter 4Working with an Application in the Profitability Application Console
4-18

• Re-Parented Members
• Members with Level 0 change
• Impacts on referencing application artifacts
Validation errors and the results of the impact analysis are displayed in theJob Library.
4. Optional: Check Update Dimensions to update the selected dimensions with thechanges.
a. Under Dimensions, browse to the Inbox and select a flat file for thedimension to update.
b. Click OK.
Any exceptions are reported in the Job Library. The selected dimensionmembers are added, updated, or deleted according to dimension selections,or the selected flat file is imported.
Note:
Repeat necessary steps until flat files for all updated diimensions have beenimported. Then, deploy the application as described in Deploying Databases.
Tip:
Whenever the Profitability Application Console is used to update dimensions,a Job entry is automatically created in the Job Library to validate and updatethe application (Viewing Tasks in the Application Job Library).
Following a dimension update, you must log out of Oracle Profitability andCost Management Cloud and then log in again to see the updates inDimension Management or elsewhere in the service.
Viewing, Creating, and Editing Dimensions with DimensionManagement
Note:
Updating Application Dimensions with Flat Files describes a way to updatedimensions with files when many edits are required. The method describedin this section is less automated, more direct, and most useful for a smallnumber of edits.
You can use the Dimension Management feature of Oracle Profitability and CostManagement Cloud to view members and properties for Business, Attribute, and Point
Chapter 4Viewing, Creating, and Editing Dimensions with Dimension Management
4-19

of View dimensions within an application. You can also edit dimension properties,create dimensions, assign members to different parent members, and add alias tables.
Note:
Only properties relevant for Essbase aggregate storage (ASO) cubes aredisplayed.
For more information and instructions, see:
• Viewing Application Dimensions
• Editing Dimensions with Dimension Management
• Creating Dimensions with Dimension Management
• Adding Alias Tables
Viewing Application DimensionsViewing, Creating, and Editing Dimensions with Dimension Management describes theDimension Management feature of Oracle Profitability and Cost Management Cloud.You can use Dimension Management to view dimension members and properties.You can also edit dimension properties and assign members to different parentmembers (Editing Dimensions with Dimension Management).
To view a list of Business, Attribute, and Point of View dimensions included in theapplication:
1. In the Home page, click Application, , and then click Dimension
Management, .
By default, the Dimensions tab of the Dimension Management screen opens.
Chapter 4Viewing, Creating, and Editing Dimensions with Dimension Management
4-20

Figure 4-3 Dimensions Tab of the Dimension Management Screen
The Dimensions tab of the Dimension Management screen contains the followingcontrols for viewing the dimension hierarchy. As you point to each control on thescreen, its name is displayed.
Table 4-4 Dimensions Tab Controls for Viewing
Control Name Action
Search box Searches for the entered text
Create Dimension Click to create a dimensionand set its properties
Chapter 4Viewing, Creating, and Editing Dimensions with Dimension Management
4-21

Table 4-4 (Cont.) Dimensions Tab Controls for Viewing
Control Name Action
Delete Dimension button When enabled, deletes theselected dimension
Note:
This setting isenabled onlybefore anycalculation rulesor analyticartifacts arecreated.
If an attributedimension isdeleted, allattributeassociations thatreference it arealso deleted.
Refresh button Updates displayed items withthe latest data
Inspect button When enabled, displays theselected dimensionproperties in a Propertiespane on the right side of thewindow. To collapse the
Properties pane, click .
Sort box Sorts the displayed tableaccording to your selection;for example, in the JobLibrary, you can sort thesecolumns: Start Date, EndDate, User, or Job Type;the upward-pointing trianglesorts in ascending order andthe downward-pointingtriangle sorts in descendingorder
Download arrow Saves the dimensiondefinition as a CSV (comma-separated values) file
2. Click a dimension name to view its member structure.
• Click triangles that point to the right to display the next level of members belowthat level.
• Click triangles that point downward to collapse levels below that level.
Chapter 4Viewing, Creating, and Editing Dimensions with Dimension Management
4-22

• Select members to display member information (properties).
Note:
Member names in italics indicate shared members.
Figure 4-4 The Dimensions Tab, Expanded to Show Member Levels andProperties
Note:
You can edit any properties within edit boxes, or select a different settingfrom a drop-down list.
If the application includes more than one alias table, you can edit eachalias property separately. For example, in the previous figure, aliasesfrom the Default and English alias tables are displayed. Each table couldcontain a different alias for the selected member.
To add alias tables, see Adding Alias Tables.
3. Optional: Click the arrow at the end of a dimension row to download a comma-separated (CSV) flat file containing the definition of that dimension. You can load itinto Microsoft Excel for member analysis or into a text editor to create a new flatfile to import and create another dimension or to make mass changes and re-import the file using Update Dimension.
Chapter 4Viewing, Creating, and Editing Dimensions with Dimension Management
4-23

Note:
You can use a text editor to edit dimension CSV files downloaded fromDimension Management. Then, you can re-import them using UpdateDimension (Updating Application Dimensions with Flat Files). Do notedit them using Microsoft Excel. When Excel saves an edited CSV file, itdoes not retain the formatting that enables Update Dimension to parsethe file correctly.
Editing Dimensions with Dimension ManagementFor an overview of Dimension Management, see Viewing, Creating, and EditingDimensions with Dimension Management.
Tip:
Following a dimension update, you must log out of Oracle Profitability andCost Management Cloud and then log in again to see the updates inDimension Management or elsewhere in the service.
You also should redeply the application, which validates it and updates thedatabase.
To edit a dimension in Dimension Management, do the following:
1. In the Home page, click Application, , and then click Dimension
Management, .
2. In Dimensions, click the name of a dimension to modify.
You can use the controls listed in Table 1 to display lower levels of the memberhierarchy.
The screen for the selected dimension contains the following controls for editing:
Tip:
Select a member and then click an editing button.
Chapter 4Viewing, Creating, and Editing Dimensions with Dimension Management
4-24

Table 4-5 Dimensions Tab Controls for Editing
Control Name Action
Add Child button Adds a child memberbeneath the selectedmember; enter the name ofthe new child, and then editits properties
Note:
If you check theShared Memberbox, the MemberName mustalready exist.When saving ashared member,set Data Storageto Shared on theproperties pane.
You can't add a member to ashared member.
Copy Member button Copies the selected memberafter the last member underits parent at the same levelas the copied member
Reparent button Moves the selected memberunder another member ofthat dimension so that itbecomes the child of the newparent; enter the name of thenew parent dimension for theselected member
You can't reparent sharedmembers.
Delete Member button Deletes the selectedmember
Move Up and Move Downbuttons
Moves the selected memberup or down at the same levelunder the same parent
3. When edits are complete, follow the steps in Deploying Databases to redeploy theapplication's metadata to the Essbase cube. Any validation errors are displayed inthe Job Library.
Chapter 4Viewing, Creating, and Editing Dimensions with Dimension Management
4-25

Creating Dimensions with Dimension ManagementFor an overview of Dimension Management, see Viewing, Creating, and EditingDimensions with Dimension Management.
Tip:
After you create new dimensions, you should redeploy the application, whichvalidates the dimensions and updates the database.
To create a dimension in Dimension Management:
1. In the Home page, click Application, , and then click Dimension
Management, .
2. In Dimensions, click .
3. On the Create Dimension page, set the dimension's properties:
Table 4-6 Dimension Properties
Property Description
Name See Essbase Naming Conventions.
Dimension Type Select the type of dimension. See Dimension Types.
• Business• Point of View• Attribute
Attribute Dimensions Optional: Select an attribute dimensionfrom the list of existing attribute dimensionsthat aren't yet associated with anotherdimension. See Oracle Profitability and CostManagement Cloud Attribute Dimensions.
POV Dimension Order Optional: Set the display order of the POVdimensions. For example, to set the displayorder in the POV as Year first, then Period,and then Scenario, set Year as 1, Period as2, and Scenario as 3.
Comment Optional: Describe the dimension'sintended use
Chapter 4Viewing, Creating, and Editing Dimensions with Dimension Management
4-26

Table 4-6 (Cont.) Dimension Properties
Property Description
Data Storage For aggregate storage (ASO) cubes, selectthe type of data storage:
• Store Data: The default. Store Dataaggregates the values of its members.
• Label Only: Label only dimensions arevirtual dimensions; they're typicallyused for navigation and have noassociated data. Although a label onlydimension has no data associated withit, the dimension displays the value ofits first direct child.
Hierarchy Type For aggregation storage (ASO) cubes,select the type of hierarchy:
• Stored: The default. The storedhierarchy type is the simplest hierarchyand provides the fastest aggregation.The entire dimension is treated as asingle hierarchy. This hierarchy typedoesn't allow shared members, memberformulas, nor alternate consolidationoperators (other than +).
Dynamic: The most customizablehierarchy type, but provides the slowestaggregation performance. The entiredimension is treated as a dynamichierarchy, which allows sharedmembers, members with formulas, andall consolidation symbols. Use dynamichierarchies carefully to preventperformance degradation.
• Enabled: In an enabled hierarchy type,the dimension is treated as multiplehierarchies, one for each of thegeneration 2 children (the children ofthe root). Each generation 2 child is thetop of a unique hierarchy. The firsthierarchy must be stored and can'tcontain shared members or useconsolidation operators other than +.The second through the last hierarchiesmay be Dynamic or Stored. Storedhierarchies other than the first one maycontain shared members.
Dimension Sort Order Optional: With the increment counter, setthe order of dimensions in the database; thelowest number is sorted first. This optionalso sets the default evaluation order whenDimension Sort Order and DimensionSolve Order are the same. Duplicates ofnumerical sort order values aren't allowed.
Chapter 4Viewing, Creating, and Editing Dimensions with Dimension Management
4-27

Table 4-6 (Cont.) Dimension Properties
Property Description
Dimension Solve Order Optional: With the increment counter, setthe evaluation order of dimensions; thelowest number is evaluated first. Multipledimensions can have the same solve ordervalue. Zero is the default.
Aliases - <alias table name> fields Enter the alias you want to use for thisdimension, for each defined alias table. See Oracle Profitability and Cost ManagementCloud Alias Dimensions.
4. When you make changes to dimensions, you must push those changes to thedatabase by redeploying the application. You can redeploy now or, if you’rechanging or adding multiple dimensions, you can redeploy the application aftermaking multiple changes. Follow the steps in Deploying Databases to redeploy theapplication's metadata to the Essbase cube. Any validation errors are displayed inthe Job Library.
Adding Alias TablesFor an overview of Dimension Management, see Viewing, Creating, and EditingDimensions with Dimension Management.
Tip:
Following a dimension update, you must log out of Oracle Profitability andCost Management Cloud and then log in again to see the updates inDimension Management or elsewhere in the service.
You also should redeploy the application, which validates it and updates thedatabase.
If you use aliases, multiple alias tables can be useful, for example to support differentlanguages.
Note:
The following steps describe how to add an alias table. To delete an aliastable, first remove any alias values that you have assigned to any membersof that alias table, and then follow these steps, but select a table and then
click .
You can click Refresh, at any time to update displayed information.
To add dimension tables in Dimension Management, do the following:
Chapter 4Viewing, Creating, and Editing Dimensions with Dimension Management
4-28

1. In the Home page, click Application, , and then click Dimension
Management, .
2. Click Aliases.
3. In Aliases, click .
4. Enter the Name and optional Description of the new alias table.
5. When edits are complete, follow the steps in Deploying Databases to redeploy theapplication's metadata to the Essbase cube. Any validation errors are displayed inthe Job Library.
Note:
You can populate new alias tables by adding or editing the alias in theproperties pane for a member (Figure 2). You can also import flat filescontaining alias records (Updating Application Dimensions with FlatFiles).
Viewing Tasks in the Application Job LibraryThe Job Library provides a list of all jobs created in the Profitability ApplicationConsole.
Note:
As the number of jobs in the list increases, screen refresh speed can slowdown. To reduce the list and restore reasonable performance, you can usethe Export to Excel button to archive the job list and then delete the oldjobs.
To view the Job Library:
1. In the Home page, click Application, , to display the Profitability Application
Console. Then, click Job Library, . You can also click , Navigator, on theHome page and then click Job Library.
Chapter 4Viewing Tasks in the Application Job Library
4-29

Figure 4-5 The Profitability Application Console Job Library Screen
The Job Library screen contains the controls in Table 1 plus those in the followingtable.
Table 4-7 Specific Controls on the Application Job Library Screen
Control Name Action
Stop button Cancels the selected job
Note:
If a job is locked inan iterativeprocess orexceptionally longcalculation, aServiceAdministrator canstop and restartEssbase. Fordetails, see RestartingEssbase. All otherwork must bestopped first.
Save Errors to File button Saves the error window textto error.txt, a text file
Export to Excel button Saves the Job Library tableto a Microsoft Excel file
Chapter 4Viewing Tasks in the Application Job Library
4-30

Table 4-7 (Cont.) Specific Controls on the Application Job Library Screen
Control Name Action
Run Execution StatisticsReport button
Runs the Execution Statisticsreport with information aboutthe application name andtype, number of threads,POV, job ID, job type, jobstatus, start and end time,user ID, rule set name, rulename, iteration number,elapsed time, threadnumber, potential sources,potential destinations, andpotential allocations for theselected job; report outputformats are PDF or MicrosoftExcel.
Actions button Displays actions for theselected job: Delete orInspect, described in thetext that follows this table
Note:
This button maybe hidden whenthe Propertiespane is open.
2. View the information for each job:
• Job Id is a sequential identification number assigned by the system.
• Job Type displays the type of task that is being performed, such as CreateApplication or Update Dimensions.
• Status displays the current state of the job, such as Running, AwaitingPermissions, Success, or Failure.
• Elapsed Time displays the length of time since the job started (until itfinishes).
• Start Date displays the date and time on which the job was submitted or isscheduled to be run.
• End Date displays the date and time when the job stopped, successful or not.
• Comment shows a user-entered note or details about a specific job. TheComment is entered when the task is submitted.
3. Optional:View job details or properties in the Properties pane (Figure 2).
By default, the Properties pane opens when you click on a job. You can close the
pane by clicking the Hide Properties button ( ). To show the Properties pane
again, click or click , and then Inspect to review additional summary leveldetail about the selected job in the Properties pane.
Chapter 4Viewing Tasks in the Application Job Library
4-31

The Properties pane includes a job ID, the user name, comments if entered, otherinformation about the job, and may include a hyperlink that you can click to viewmore detail, such as error or impact analysis information. If a hyperlink is offered,as in Figure 2, you can save the information to a file.
Note:
Task Flow ID is the system-generated task ID for the specific task,displayed in the format <application name>:<task name><generatedtaskflow number>.
For example, the generated taskflow number may be displayed asAppMgmt_DeployApplication_D20120824T08520_5ed, whereAppMgmt is the application name, DeployApplication is the task, andD20120824T08520_5ed is the generated taskflow instance ID.
Figure 4-6 Job Properties for Status of Success with Warnings
4. Optional: If required, click Stop to end the selected task in Running state.
Caution:
While the task flow stops quickly after the button is pressed, activitiesthat affect results may require additional time to ensure that the state ofthe data is consistent.
5. Optional: Click , or click , and then Delete to remove the selected job fromthe list.
Transferring Files with the File ExplorerYou can use the Oracle Profitability and Cost Management Cloud File Explorer to viewlogs and sample files, export and import application files for backup and migration, andupdate dimensions with flat files.
Chapter 4Transferring Files with the File Explorer
4-32

To open the File Explorer, open the Profitability Application Console (Using the
Profitability Application Console and Other Application Features). Then, click .
Figure 4-7 The File Explorer Tab
Figure 1 shows the File Explorer with four files, one in the Inbox and the others in theOutbox.
The Inbox holds files that have been uploaded from local folders (your computer ormapped drives). The Outbox holds files that are generated by the system (log files),created by export (template files), or uploaded from your computer or mapped drives.
Typically, you upload files in the Inbox for import, such as flat files for updatingdimensions or template files to create an application. When you perform an import taskand select server, you can select from the contents of the Inbox. When you performan export, or need to view a log file, the File Explorer shows that it is contained in theOutbox.
You can use the following buttons to work with files in the File Explorer:button to load afile into either the Inbox or Outbox from your computer or mapped drives. Use Refreshto ensure that the list of files is current.
• Upload -- Enables you to browse for a file and load it into either the Inbox orOutbox
• Download -- Enables you to either open or save the selected file
• Refresh -- Ensures that the list of files is current
For other controls, see the following table:
Table 4-8 File Explorer Controls
Control Name Action
Search box Searches for the entered text
Chapter 4Transferring Files with the File Explorer
4-33

Table 4-8 (Cont.) File Explorer Controls
Control Name Action
Delete button Deletes the selected file
Note: To delete more thanone file at once, select themwith Ctrl+Click and then click
Sort box Sorts the displayed tableaccording to your selection
You can sort by Name, Type,Folder, Last Updated Date,or Size. The upward-pointingtriangle sorts in ascendingorder and the downward-pointing triangle sorts indescending order.
Chapter 4Transferring Files with the File Explorer
4-34

5Working with Application Points of View(POVs)
Related Topics
• Introducing Points of View
• Managing POVs
Introducing Points of ViewPoints of view (POVs) for an Oracle Profitability and Cost Management Cloudapplication act as containers for data and allocation rules. They provide a specific viewof application information for a selected time period. For example, POV dimensionscan include year, period, scenario, and version. Members for POV dimensions areuser-defined, and can provide a rich array of POV combinations for modeling andwhat-if analysis.
You can use points of view (POVs) to create various versions of an application; forexample, to hold budget versus actual figures, or to play scenarios to measure theimpact of various changes on the bottom line.
You specify POVs for each application. See the following sections for detailedinformation about POVs:
• About POVs
• POV Dimensions
• Managing POVs
• Viewing the Points of View Screen
• Adding POVs
• Modifying the POV State
• Copying POVs
• Clearing Selected Artifacts from POVs
• Clearing Selected Input Data from POVs
• Deleting POVs and All Artifacts
About POVsA POV displays a particular version of an application for a selected snapshot, such asyear, period, and scenario.
You must have at least one POV dimension, and you can have up to four. You definethe POV dimensions and their names. Calculations are performed using the specificdata and rules for that POV for different months or situations.
5-1

A typical POV includes the Year, Period, and Scenario. The first step for almost everyactivity in Oracle Profitability and Cost Management Cloud is the selection of a POV.
Note:
Rules in an Oracle Profitability and Cost Management Cloud applications arePOV-specific. For a rule or rule set or global context definition to exist withina POV, there must be a unique definition of that artifact within the POV.
An application can be edited only if the POV is set to “Draft” status (Modifying the POVState). You can modify the POV to reflect new drivers, criteria, or members, enablingyou to create alternative scenarios. By comparing these scenarios, you can evaluatehow changes affect the processes or bottom line.
You can also create separate versions of the same POV to monitor the impact ofchanges to the application, or track different versions of the same application.
Related topics:
• POV Dimensions
• Managing POVs
POV DimensionsA Point of View (POV) dimension is used to present a specific version or perspectiveof the application. Each application requires at least one dimension to be designatedas a POV dimension. The POV dimensions can be whatever is required for theparticular application. The following list represents some common sample POVdimensions: :
• Period — Enables you to analyze strategies and changes over time. Because anapplication can be based on any unit of time (quarters, months, annual, years, andso on), you can analyze strategies over time, and monitor inventory ordepreciation.
• Year — Identifies the calendar year in which the data has been gathered
• Scenario — Identifies a version of the application for a specific time period andset of conditions
Version Dimension
Using a specific POV, you can create a POV version that enables you to maintainseparate versions of the same POV to monitor the impact of changes to theapplication, or track different versions of the same application.
Use the Version dimension for the following tasks:
• Create multiple iterations of an application, with slight versions
• Model possible outcomes based on assumptions, or “what-if” scenarios todetermine best or worst case scenarios
• Facilitate target setting
Chapter 5Introducing Points of View
5-2

By modifying different elements within the Version dimension, you can examine resultsof changes, without modifying the original application.
Managing POVsThe POV dimension defined for an application determines the potential POVsavailable for an application, but all POVs are not automatically available forassignment or data input. You cannot assign drivers or load data for a POV until it hasbeen added to the application.
You can also copy a POV, to begin an application for a new reporting period or adifferent scenario. See Copying POVs.
When a new POV is added, the status is automatically set to “Draft” so the POV canbe edited.
Use the Points of View screen to create, modify, and delete POVs.
Use the following procedures to work with POVs:
• Viewing the Points of View Screen
• Adding POVs
• Modifying the POV State
• Copying POVs
• Clearing Selected Artifacts from POVs
• Deleting POVs and All Artifacts
Viewing the Points of View ScreenThe Points of View screen enables you to create, modify, and delete POVs.
To display the Points of View screen:
1. On the Home page, click , and then select Points of View.
The Points of View screen lists all available POVs.
Chapter 5Managing POVs
5-3

Figure 5-1 Points of View Screen
2. Use the Actions menu and buttons to perform the following actions:
Table 5-1 POV Management Actions
Actions Menu Option Button Details
Create Point of View Adding POVs
Delete Point of View Deleting POVs and AllArtifacts
Change Point of View State Modifying the POV State
Clear Point of View Clearing Selected Artifactsfrom POVs
Copy Point of View Copying POVs
3. Optional: Use the View menu and buttons to perform the following tasks:
• Columns—Show all or selected dimension columns
• Detach and Attach the table of POVs,
• Reorder Columns—Use the arrow controls to move the selected dimensioncolumn toward the beginning or end of the POV table
• Query By Example—Select to filter data using Query by Example (QBE), :
– Click Query By Example, .
– Enter the first few letters of the target value in one or more QBE fields thatappear above each data column.
Chapter 5Managing POVs
5-4

– Click again.
Only matching members are displayed. To show all members again, followthese steps and clear all fields.
Adding POVsYou can add a POV to view the information and calculations for an application for aselected snapshot of the application, such as a year, period, scenario and status.
The values of the parameters available for an application are set in the OracleHyperion EPM Architect application.
Note:
You cannot access a POV from other task windows until the POV has beenadded in POV Management.
To add POVs:
1. Click , and then Points of View (Figure 1).
2. Click or select Actions and then Create Point of View.
The Create Point of View dialog box is displayed.
3. Select the parameters in the application to identify the new POV.
Because this is a new POV, the Year and Period parameters are offered andState is set automatically to Draft to enable you to build and edit the application.
4. Click OK.
The POV is added to the list.
Modifying the POV StateWhen an application is created, its status (State) is set to Draft. This indicates that theapplication can be viewed and edited. When the application is final, change the POVstate to ensure it cannot be modified. The status is not an Oracle Essbase dimension.
The POV state can be set to one of the following: Draft, Published, or Archived.
Only the POV status can be changed. To modify any other parameters, you mustcreate a new POV.
To change the POV state:
1. Click , and then Points of View (Figure 1).
2. Select a POV to modify.
3. Select Actions, and then Change Point of View State, .
4. Under Status, select the new state:
Chapter 5Managing POVs
5-5

• Draft — Build or edit the application, and generate dynamic reports.
• Published — View the application, and generate dynamic reports
• Archived— View the application and generate dynamic reports.
You can change the state back to Draft at any time to edit the application.
Note:
If you modify the POV, only the state is changed. You are no longer beable to calculate the application if the status has been set to “Published”or “Archived.”
5. Click OK.
Copying POVsIf the database has been deployed, you can copy a POV to provide a starting point fora new period or scenario, or to create what-if scenarios for an existing application.
For example, you can begin a period by copying rules and input data from the previousperiod, or you can create seed data for a forecast scenario by copying data from anactual scenario.
To copy POVs:
1. Click , and then Points of View.
2. Select the POV to copy.
3. Select Actions, and then Copy Point of View, .
Figure 5-2 Copy Point of View Window
Chapter 5Managing POVs
5-6

4. In Copy Point of View (Figure 1), enter POV dimensions for the new POV(Destination). Under Copy Configuration, select the elements of the POV thatare to be copied.
Note:
If the outline for the application is too large, you are prompted to select amodel view to define a subset of the POV input data to be copied. Ifnecessary, you can perform multiple copy POV operations usingdifferent model views to cover the full set of input data you need to copy.
5. Click OK to start copying.
You can view the Job Library to check the status of the copy.
Caution:
Depending on the size and complexity of the application, this operationmay take a significant amount of time.
6. When the copy is complete, review the copied information in the new POV.
Clearing Selected Artifacts from POVsYou can clear or delete selected objects (artifacts) from a POV, described in thissection. You can also create a query and clear a specific slice of input data from aPOV (Clearing Selected Input Data from POVs).
To delete an entire POV, including its associated assignments and driver selections,see Deleting POVs and All Artifacts.
To clear (delete) selected artifacts from a POV:
1. Ensure that no other users require the POV and its contents.
2. Click , and then Points of View (Figure 1).
3. Select the POV that contains the artifacts to clear.
4. Select Actions, and then Clear Point of View, .
Chapter 5Managing POVs
5-7

Figure 5-3 Clear Point of View Dialog Box
5. Click Comprehensive.
6. Select the artifacts to clear.
Note:
All artifacts of the selected type are cleared. If you want to clear only acertain type of input data, for example, and leave driver data, perform aTargeted clear (Clearing Selected Input Data from POVs).
7. Click OK to clear the selected artifacts.
See the Job Library to view a record of the operation.
Clearing Selected Input Data from POVsYou can clear or delete selected objects (artifacts) from a POV. This is called aComprehensive clear and deletes all artifacts of the selected type (Clearing SelectedArtifacts from POVs). You can also create a query and perform a Targeted clear,described in this section, which deletes a specific slice of input data. This is useful, forexample, when you want to delete other input data without deleting drivers.
To delete an entire POV, including its associated assignments and driver selections,see Deleting POVs and All Artifacts.
To clear specific input data from a POV:
1. Ensure that no other users require the POV and its current data.
2. Create a query that returns the data you want to clear (Managing OracleProfitability and Cost Management Cloud Queries).
Chapter 5Managing POVs
5-8

Since only input data is cleared, the Rule dimension must be set to NoRule. Forthe Balance dimension, selected members must be only Input, identifed by themember name.
3. Click , and then Points of View (Figure 1).
4. Select the POV that contains the data to clear.
5. Select Actions, and then Clear Point of View, .
6. In the Clear Point of View screen, click Targeted.
7. Select the Query to locate the data you want to clear.
8. Click OK to clear the data returned by the query.
See the Job Library to view a record of the operation.
Deleting POVs and All ArtifactsTo erase data in Oracle Essbase, before deleting the POV, perform the “Clear All”function for the selected POV. See Clearing Selected Artifacts from POVs.
To delete POVs and their associated artifacts (such as rules and rule sets):
1. Ensure that no other users require the POV and its contents.
2. Optional: To erase data in Essbase, select Clear All data as described in Clearing Selected Artifacts from POVs.
3. Click , and then Points of View (Figure 1).
4. Select the POV to delete.
5. Select Actions, and then Delete Point of View, .
The Delete Point of View dialog box displays POV dimensions for the selectedPOV.
6. Click OK to delete the POV.
The POV is removed from the list and is no longer available for selection.
Chapter 5Managing POVs
5-9

6Working with Oracle Profitability and CostManagement Cloud Rules
Related Topics
• About Rules
• Creating and Managing Rules
• Express Editing for RulesYou can use the Rules Express Editing screen to create models more efficiently.
• Tracing Allocations
About RulesIn Oracle Profitability and Cost Management Cloud, rules control how costs andrevenues are distributed throughout the application to specified accounts or elements.A driver can used to determine how the funds are allocated. The calculated results areassigned from a source to a destination as the funds flow through the application.
You set up distribution allocations for a single POV by creating rule sets and rules:
• Rule sets are groups of Oracle Profitability and Cost Management Cloud rulesthat help to organize calculation logic definitions, to calculate similar rulestogether, and to simplify the definition of manay rules that share commondimension members. Rule sets run in a set order, determined by the rule setsequence number, and may also contain options specific to the execution of ruleswithin that rule set.
• Rules define the calculation logic of Oracle Profitability and Cost ManagementCloud applications and enable them to reflect the cost assignments within themodeled situations. Rules within rule sets are executed in the order of theirsequence numbers within that rule set. There are two types of rules, allocation andcustom calculation. You can define allocation source, destination, driver basis, andoffset for each allocation rule in a rule set (Creating Allocation Rules). Customcalculation rules contain formulas in MDX format and are primarily used foradjusting data (Creating Custom Calculation Rules).
You can set up defaults, called contexts, for each level of allocations for a POV inOracle Profitability and Cost Management Cloud applications:
• The Global context enables you to define default definitions for dimensions thatwill be used in all rule definitions for that POV.
• Rule Set contexts enable you to define default dimension definitions for all rulesin a given rule set.
See Creating and Managing Rules for rule management details.
6-1

Creating and Managing RulesThe topics in this section describe how to create and manage rule sets and rules in anOracle Profitability and Cost Management Cloud application so that data, such asrevenue and expenses, can be pulled from a source location in Oracle Essbase andassigned to an allocation destination according to an applied driver. The followingtopics describe these procedures:
• About the Rules Screen
• Defining Global Contexts for Rules
• Working with Rule Sets
• About Rules in Applications
• Creating Allocation Rules
• Creating Custom Calculation Rules
• Managing Rules
About the Rules ScreenYou define allocation logic for applications in the Rules screen. You can define globaland rule set contexts (dimension defaults), define rule sets, and define rules thataccess data sources, data destinations, drivers, and offsets.
Each group of rule sets and rules applies to a single POV.
Note:
There are allocation rules and custom calculation rules. The same contextand rule set information applies to both rule types.
To define allocations for an Oracle Profitability and Cost Management Cloudapplication:
1. On the Home page of an application with data, click .
2. Click Rules .
The Rules screen opens, similar to Figure 1.
Chapter 6Creating and Managing Rules
6-2

Figure 6-1 The Rules Screen
See the following sections for information about defining and managing allocations inan Oracle Profitability and Cost Management Cloud application:
• Defining Global Contexts for Rules
• Working with Rule Sets
• About Rules in Applications
See Performing Basic Calculations Using the Navigator for information about runningcalculations and performing allocations.
Defining Global Contexts for RulesSetting a global context enables you to define default definitions for dimensions thatwill be used in all rule definitions for the selected POV.
Note:
Define a global context before defining rule sets for the selected POV.
To define a global context for one POV of an Oracle Profitability and CostManagement Cloud application:
1. On the Home page, click , and then select Rules (About the Rules Screen).
2. In the Rules screen, enter the year and period for a valid POV, and then click
Refresh , .
Chapter 6Creating and Managing Rules
6-3

3. Click Edit, , in the Global Context area to display the Global Context Definitionarea.
Figure 6-2 Defining a Global Context
4. Optional: In the Global Context Definition box, enter a description of the globalcontext default.
5. The Dimensions area displays all dimensions for the selected application that arenot required system dimensions. Select one to apply to all rules as a default and
then click or select Actions, and then select Add Member in the MemberSelection area.
6. Select one member to include in the global context default for that POV, and thenclick OK.
7. Optional: Repeat steps 5 and 6 for other dimensions.
8. When the global context definition is complete, click (Save).
Now, all selected dimension-member combinations will be applied to new rulescreated for the selected POV.
Figure 1 shows a global context definition that applies the NoDriver member to theDrivers dimension for all rules created for that POV. The global context was definedbefore any rule sets and rules were created.
The next step is to define and manage rule sets (Working with Rule Sets).
Working with Rule SetsRule sets enable users to group related rules together to better organize the definitionof calculation logic, to execute similar rules together, and to simplify the definition ofrules that share common dimension members. Rule sets have a set order, determined
Chapter 6Creating and Managing Rules
6-4

by the rule set sequence number, and may also contain options specific to theexecution of rules within that rule set. Rule sets apply to the specified POV.
Setting a rule set context enables you to define default definitions for dimensions thatwill be used in all rules included in the selected rule set for the selected POV.
The following topics describe how to create and manage rule sets and rule setcontexts:
• Defining Rule Sets
• Managing Rule Sets
• Defining and Managing Rule Set Contexts
For a tutorial about rule sets, see this video:
Managing Rule Sets in Oracle Profitability and Cost Management Cloud
Defining Rule SetsRule sets help organize allocation and calculation rules in several ways (Working withRule Sets).
To define a rule set for one POV of an application:
1. In the Rules screen (Figure 1, enter the year and period for a valid POV, and then
click the Refresh button,
2. In the Rule Sets area, click or select Actions and then select Create Rule Set(Figure 1).
Figure 6-3 Rule Set Definition Area
3. Enter a name for the rule set.
4. Optional: In the Description box, enter a description of the rule set. Using cleardescriptions is highly recommended.
Chapter 6Creating and Managing Rules
6-5

5. Enter a Sequence number to determine the order in which the rule set runs.
6. Optional: Select Enabled to indicate that the rule set is active when thecalculation is performed.
7. Select an execution type to indicate how the rule set calculations should run:
• Serial Execution, the default, runs all rules in the rule set sequentially,depending on their sequence number.
• Parallel Execution runs rules with the same sequence number at the sametime if computer hardware supports that.
• Iterative Execution runs the rule set multiple times in sequence; Number ofIterations indicates the number of iterations to run.
These settings support reciprocal allocations.
8. If selected, Use Global Context indicates that the global context should beapplied to the current rule set, if one hs been defined.
9. Optional: Define a rule set context to apply dimension defaults to all rules in therule set (Defining and Managing Rule Set Contexts).
10. When the rule set definition is complete, click (Save).
• To edit and delete rule sets, see Managing Rule Sets.
• To define a rule set context and set defaults for all rules in the rule set, see Defining and Managing Rule Set Contexts.
Managing Rule SetsDefining Rule Sets describes how to create a rule set. You can also delete and copyrule sets.
To delete a rule set:
1. Open a application and display the Rules screen (About the Rules Screen).
2. Enter a POV and select a rule set.
3. Click or select Actions and then Delete Rule Set.
4. Confirm that you want to delete the rule set and all its rules.
5. Click .
To copy a rule set:
1. In the Rules content area, enter a POV and select a rule set.
2. Click or select Actions and then Copy Rule Set.
3. Enter a name for the new rule set. Optionally, select Copy rules to add existingrules to the new rule set.
4. Click OK, and then click (Save).
Defining and Managing Rule Set ContextsYou can define a rule set context to specify default dimensions and members for usein all rules included in the selected rule set for the selected POV.
Chapter 6Creating and Managing Rules
6-6

To define a rule set for one POV of an application:
1. On the Home page, display the Rules screen (Figure 1), enter the year and period
for a valid POV, and then click (Refresh).
2. In the Rule Sets area, select a rule set and then click the Context tab (Figure 1).
Figure 6-4 Rule Set Context Definition Area
3. On the Context tab (Figure 1), select a dimension that applies to all rules in thatrule set.
Note:
POV dimensions and any dimensions defined in the global context arenot available for selection.
4. In the Member Selection area, click or select Actions, and then select AddMember (Figure 2).
Figure 6-5 Select Dimension Members Dialog Box
Chapter 6Creating and Managing Rules
6-7

5. In the Select Dimension Members dialog box, click the symbol in front of listedmembers to open them to their lowest level.
6. Select members to apply to all rules and use the shuttle control arrows to movethem into the selected list on the right side of the Select Dimension Membersdialog box.
7. When the rule set context definition is complete, click OK and then click (Save).
Now, all selected dimension-member combinations will be applied to new rulescreated for the selected POV.
Figure 3 shows that the Customer dimensions has been enabled as rule set contextfor the Product Sustaining Activity Charge Out rule set, sequence number 5.
Figure 6-6 An Example Rule Set Context Defined for the Product SustainingActivity Charge Out Rule Set
Managing Rule Set Contexts
You can add members to and delete them from dimensions already added to a rule setcontext.
To add members to a rule set context:
1. Open the Rules content area for a selected POV.
2. Select a rule set and display its Context tab.
3. Follow steps 4 through 7 in the previous instructions for adding a member(Defining and Managing Rule Set Contexts).
To delete members from a rule set context:
1. Select a rule set and open its Context tab.
Chapter 6Creating and Managing Rules
6-8

2. Select a dimension and member, and then click or select Actions and thenselect Delete Member.
The member is deleted without confirmation.
3. Click (Save).
About Rules in ApplicationsIn an Oracle Profitability and Cost Management Cloud application, there are two typesof rules:
• Allocation rules, which determine the source and destination of allocated data,which drivers are applied to that data, and where offsets are placed to balanceaccounts (Creating Allocation Rules)
• Custom calculation rules, which contain formulas in MDX format and areprimarily used for adjusting data or creating driver basis values used insubsequent allocation rules (Creating Custom Calculation Rules)
Both types of rules are organized under rule sets. Rule sets run in their sequencenumber order, and then the rules within a set run in the order of their sequencenumbers. Rules with the same sequence number can run at the same time, providedthe computer hardware allows for parallel execution of processes. Rules can becopied within rule sets.
You can use contexts to define dimension and member defaults for both types of rules,either for all rules in a POV (Defining Global Contexts for Rules) or for all rules in arule set (Defining and Managing Rule Set Contexts). For information about managingand running allocation rules and custom calculation rules, see Calculating anApplication.
Creating Allocation RulesAllocation rules form the core of an Oracle Profitability and Cost Management Cloudapplication. They determine how allocated data flows and how drivers determineallocation amounts.
For a tutorial about creating and managing rules, see this video:
Managing Rules in Oracle Profitability and Cost Management Cloud
To define allocation rules for one POV in an application:
1. On the Home page, click , and then select Rules. (About the Rules Screen).
2. In the Rules screen (Figure 1), enter the year and period for a valid POV, and then
click (Refresh).
3. In the Rule Sets area, select a rule set.
4. Do one of the following.
• In the Rules area, click , and then select Allocation, or
• Select Actions, then select Create Rule, and then select Create AllocationRule (Figure 1)
Chapter 6Creating and Managing Rules
6-9

Figure 6-7 The Description Tab of the Rule Definition Area
5. Enter a name for the rule.
6. Optional: In the Description box, enter a description of the rule set.
7. Optional: Select Enabled to indicate that the rule is active when the calculation isperformed.
8. Enter a Sequence number to determine the order in which the rule runs within therule set.
Rules with the same sequence number will run at the same time if parallelcalculation is enabled for the rule set and the computer hardware supports it.
9. If selected, Use Rule Set Context indicates that the rule set context is applied tothe current rule, if one was defined.
If a global context has been enabled for the rule set, it will also be applied.
10. When the rule set definition is complete, click Save, .
Tip:
The next step is to define a funding source for the allocation rule (Defining aSource for Allocation Rules).
• To edit and delete rules, see Managing Rules.
• To create a custom calculation rule, see Creating Custom Calculation Rules.
Defining a Source for Allocation RulesCreating Allocation Rules describes how to create and describe a new allocation rule.The next step is to define an allocation source, the dimensions with the expense orother data you are assigning to an allocation destination.
To define the source from which the rule will retrieve data to be allocated:
1. In an open allocation rule, click the Source tab (Figure 1).
Chapter 6Creating and Managing Rules
6-10

Figure 6-8 The Source Tab of the Allocation Rule Definition Area
2. Select the dimension and member that holds the data to be allocated. If you selecta parent member, all of its descendants are selected also.
3. Optional: Filter the members in the Member Selection area. See FilteringDimension Members.
Note:
You can enter dimension-member combinations as text. This could beuseful if you had them in a spreadsheet, for example. See AddingDimension-Member Combinations by Pasting Text.
4. Optional: Click Options to select a Calculation Segmentation Method for use ifvery large models cause scalability issues (Using Calculation Segmentation).
If Oracle recommends that you use this feature, click one of the following:
• Auto, to have the system decide the dimension and level to use
• Manual, to decide the dimension and level to use yourself
None (the default), to not use segmentation
5. When the rule source information is complete, click (Save).
6. The next step is to enter a Destination for the allocated data.
Figure 2 shows that Machined brake parts in the Manufacturing COGs RelatedExpense Assignment rule set will pull data from the Net Income member of theAccounts dimension plus some members of the CostCenters dimension.
Chapter 6Creating and Managing Rules
6-11

Figure 6-9 Allocation Source Definition Example
Tip:
The next step is to define a destination for the allocation rule that describeswhere funds are being assigned ( Defining a Destination for AllocationRules).
To edit and delete rules, see Managing Rules.
Filtering Dimension Members
Note:
Filtering is useful only if the filtered member is a parent. The filter is based onits descendants.
Follow these steps to filter members in the Member Selection area of the RuleDefinition screen:
1. At the bottom of the Rule Definition area, click the arrow in front of Filter toexpand the Filter area.
2. To add a filter, click or select Actions and then select Add Filter.
Chapter 6Creating and Managing Rules
6-12

Select a parameter such as Name or Attribute or UDA, an Operator such as = or<>, and then enter a Value to match. Click OK to display members that matchValue and add the filter to the table.
3. To edit a filter, select it and click . Change the filter as you want and then clickOK.
4. To delete a filter, select it and click . The filter is deleted.
Adding Dimension-Member Combinations by Pasting TextYou can now paste dimension-member combinations from Microsoft Excel into theDimensions area of the following Rule Definition screen tabs: Source, Destination,and Driver Basis. This feature reduces the keystrokes needed to create new rules ormodify existing rules. It is helpful for cases where users manually generate rules, forexample, by using a spreadsheet or downloading dimension files through DimensionManagement (Viewing, Creating, and Editing Dimensions with DimensionManagement).
To use this feature, click Text Entry in the Dimensions area. Then, copy and pastedimension-member combinations for that tab into the Dimension Member Editor boxusing the following format:
"DimensionName", "MemberName"
Use one row per member. You can include combinations for multiple dimensions in thesame box. When entries are complete, click OK.
If you try to input a dimension or member that does not exist or one that is notavailable for that tab, an error message is displayed.
Note:
You must use the Member Selection area to remove dimension-membercombinations created by pasting.
Using Calculation SegmentationA rule’s source range is the combination of all member selections at level 0. For verylarge models, source ranges can exceed the Essbase limits on query ranges. In thosecases, the rule fails unless segmentation is used to break the rule into smaller piecesthat can fit within the Essbase limitation.
Profitability and Cost Management Cloud performs segmentation by taking onedimension’s member selections and creating a separate script for each member at alower level of that dimension. For example, if a member has ten immediate children,the segmentation method would create a separate script for each of the ten children.The results of the calculation are the same.
To use this feature, generally when recommended by Oracle, see Defining a Sourcefor Allocation Rules.
Chapter 6Creating and Managing Rules
6-13
Defining a Destination for Allocation RulesDefining a Source for Allocation Rules describes how to enter the source memberselections for an allocation. The next step is to define an allocation destination, thedimension member selections to receive the expense or other data you are distributingfrom the allocation source.
To define the destination to which the allocation rule will assign data:
1. In an open rule, click the Destination tab.
2. For each dimension, select the members that are to receive the allocated data. Ifyou select a parent member, the allocation will go to its level 0 descendants.
3. Optional: Instead of specifying an explicit member selection, you can select SameAs Source if you want to define the destination member set for a destination to bethe same as the source member set for that dimension. In this case, when the ruleruns, members in the destination dimension are selected for allocation bymatching to the member selection in the source. Members in the source selectionthat are not level 0 are resolved to level 0 members and then are matched withlevel 0 members in the destination.
When setting a dimension to Same As Source in the Destination tab, you canselect up to two different source dimension to match it to. In this case, when therule runs, members in the destination dimension are selected for allocation bymatching to the member selection in the selected source dimensions.
4. Optional: Select a dimension from the Same As Dimension drop down, to selecta different source dimension than the destination dimension.
If you select a dimension from Same As Dimension, the source and destinationmust have at least one dimension in common. When the rule is executed,members in the destination dimension are selected for allocation by matching tothe member selection in the selected source dimension.
5. Optional: For up to two Same-As-Source dimensions, you can select a differentsource dimension from the Same As Dimension list to match the destinationdimension to a different source dimension. When the rule runs, members in thedestination dimension are selected for allocation by matching to the memberselection in the selected source dimension. Note that for this to work, thedestination dimension must also contain the members from the source dimension'smember selection so that they can match.
6. Optional: Filter the data as described in Defining a Source for Allocation Rules,step 3.
7. When the rule destination information is complete, click (Save).
Figure 1 shows one of the destinations of allocated data for the Machined brakeparts rule—the Products dimension and various members named B followed by anumber.
Chapter 6Creating and Managing Rules
6-14

Figure 6-10 Allocation Destination Definition Example
Tip:
The next step is to enter a driver basis for the rule, the location of informationthat controls the cost being allocated ( Defining a Driver Basis for AllocationRules).
To edit and delete rules, see Managing Rules.
Defining a Driver Basis for Allocation RulesDefining a Destination for Allocation Rules describes how to enter the data destinationfor an allocation. The next step is to define an allocation driver basis, the memberwhere driver values are found.
Note:
Oracle Profitability and Cost Management Cloud assumes a focus on thedestination. The dimension and member selection on the Driver Basis tabrepresents a change to the destination that defines where the driver islocated.
For example, if the allocation destination is the intersection of the Salesdepartment and Salaries account, the Driver Basis definition is theHeadcount account member.
By default, data is allocated to the destination proportionally, using the ratio of thedriver value for that member divided by the sum of all driver values. You can choose toallocate data evenly, which is the same as if the driver ratio was 1.
Typically, systems are set up so that one member from one dimension, usually theAccounts dimension, contains the statistical members associated with anyintersection. Only one member can be selected for each dimension.
Chapter 6Creating and Managing Rules
6-15

To define the driver basis for an allocation rule:
1. In an open rule, click the Driver Basis tab (Figure 1).
Figure 6-11 The Driver Basis Tab of the Allocation Rule Definition Area
2. Select whether data should be allocated by ratio (Specify Driver Location) orallocated evenly (Allocate Evenly).
3. If you selected Specify Driver Location, select the dimension and member thatholds the driver data, for example Headcount.
4. Optional: Filter the data as described in Defining a Source for Allocation Rules,step 3.
5. When the rule source information is complete, click (Save).
Figure 1 shows the location of a driver to be applied when allocating data for theMachined brake parts rule, the DRIV1001 member of the Drivers dimension.
Chapter 6Creating and Managing Rules
6-16

Figure 6-12 Driver Location Selection Example
Tip:
The next optional step is to enter an offset for the rule, the member to holdan increase to balance a corresponding decrease in the allocation source(Defining an Allocation Offset for Allocation Rules).
To edit and delete rules, see Managing Rules.
Defining an Allocation Offset for Allocation RulesDefining a Driver Basis for Allocation Rules describes how to select drivers thatdetermine allocation amounts. The next step is to define an allocation offset location,the member to hold an increase to balance a corresponding decrease in the allocationsource. This step is optional.
Note:
By default, offsets are written to the source but you can specify anotherlocation.
The offset location definition assumes a focus on the source with the option to selectan alternate location. For example, suppose the allocation source is the Salesdepartment intersecting the Salaries account. The default location for the offset wouldbe the intersection of Salaries and Sales. However, you could specify Outbound
Chapter 6Creating and Managing Rules
6-17

Allocations of the Sales department instead. By specifying that single change, you areinstructing the system to write the offset entry at the source, except you are changingthe target location so the offset is written to the intersection of Outbound Allocationsand Sales dimension instead of the source.
To define the offset for an allocation rule:
1. In an open allocation rule, click the Offset tab (Figure 1).
Figure 6-13 The Offset Tab of the Allocation Rule Definition Area
2. Select whether offset data should be written to the Source intersection, or to anAlternate Offset Location.
3. If you selected Alternate Offset Location, select the dimension and member tohold the driver data.
Note:
For all dimensions where a member selection is NOT made, the samemember as the source is used. Enter members to show how the offsetlocation should DIFFER from the source.
4. When the rule source information is complete, click (Save).
To view any context definitions for a rule, see Viewing Contexts for Rules.
To edit and delete rules, see Managing Rules.
Viewing Contexts for RulesDefining Global Contexts for Rules and Defining and Managing Rule Set Contextsdescribe how to select default dimensions and members to be applied to rules for agiven POV.
To view contexts applied to a selected rule:
Chapter 6Creating and Managing Rules
6-18

1. If a rule is not already selected and open, open one.
2. Click the Rule Context tab.
The displayed information is not editable.
To perform other rule definition tasks, see About Rules in Applications.
To edit and delete rules, see Managing Rules.
Creating Custom Calculation RulesRules form the core of an Oracle Profitability and Cost Management Cloud application.There are two types: allocation rules and custom calculation rules. Creating AllocationRules describes how to create allocation rules. They determine how allocated dataflows and how drivers determine allocation amounts. This section describes how tocreate custom calculation rules.
Unlike allocation rules, custom calculation rules do not have a defined source anddestination with options for defining a driver basis and accounting offset. Instead,custom calculation rules enable users to define calculations to be performed in acertain region of the database with results posted to a specific member. Customcalculation rules are used primarily for adjusting existing data to create a scenario,creating custom driver values for use in other allocation rules, or to accommodatereporting requirements. Other uses include clearing data from custom ranges,developing data sets, anonymizing data, and complex standard rate application.
Custom calculation rules have the following components that correspond to the tabs inthe Rule Definition area:
• Description — Rule name and number, text description, and rule-level options(described later in this topic)
• Target — The target range in the database that the rule will affect (Defining aTarget for Custom Calculation Rules)
• Formula — The member to which results of the calculation are written and themathematical expression of the calculation (Formulas and Syntax for CustomCalculation Rules)
• Rule Context — Enables you to view any Global or Rule Set contexts defined forthe custom calculation rule (Viewing Contexts for Custom Calculation Rules
Like allocation rules, custom calculation rules belong to rule sets, have sequencenumbers, inherit contexts, can be activated or deactivated with the Enabled setting,and have the same rule set execution options (serial, parallel, iterative). Customcalculation rules can be copied and deleted in the same way as allocation rules(Managing Rules).
To define custom calculation rules for one POV in an application:
1. On the Home page, click and then select Rules .
2. In the Rules screen (Figure 1), enter the year and period for a valid POV, and then
click (Refresh).
3. In the Rule Sets area, select a rule set.
4. Do one of the following:
• In the Rules area, click , and then select Custom Calculation, or
Chapter 6Creating and Managing Rules
6-19

• Select Actions, then select Create Rule, and then select Create CustomRule.
The Description tab of the Rule Definition area is displayed (Figure 1)
Figure 6-14 The Description Tab of the Custom Calculation Rule DefinitionArea
5. Enter a name for the rule.
6. Optional: In the Description box, enter a description of the rule set.
7. Optional: Select Enabled to indicate that the rule is active when the calculation isperformed.
8. Enter a Sequence number to determine the order in which the rule runs within therule set.
Rules with the same sequence number will run at the same time if parallelcalculation is enabled for the rule set and the computer hardware supports it.
9. If selected, Use Rule Set Context indicates that the rule set context is applied tothe current rule, if one was defined.
If a global context has been enabled for the rule set, it will also be applied.
10. When the rule set definition is complete, click Save, .
Tip:
The next step is to define a calculation target for the rule ( Defining a Targetfor Custom Calculation Rules).
To edit and delete rules, see Managing Rules.
Defining a Target for Custom Calculation RulesCreating Custom Calculation Rules describes how to complete the Description tab fora custom calculation rule. The next step is to define a calculation target, the range ofdimensions that are affected by the custom calculation rule.
Chapter 6Creating and Managing Rules
6-20

To define the target which the custom calculation rule will affect:
1. In an open custom calculation rule, click the Target tab (Figure 1).
Figure 6-15 The Target Tab of the Custom Calculation Rule Definition Area
2. Select the Result Dimension, used in the formula to specify the member to holdthe result.
3. Select the members in each that define the target range that will be affected by thecustom calculation formula.
4. Optional: Filter the data as described in Defining a Source for Allocation Rules.
5. When the rule target information is complete, click (Save).
Tip:
The next step is to enter a formula for the custom calculation rule (Formulasand Syntax for Custom Calculation Rules).
To edit and delete rules, see Managing Rules.
Formulas and Syntax for Custom Calculation RulesDefining a Target for Custom Calculation Rules describes how to enter a range ofdimensions and members that are affected by a custom calculation rule. The next stepis to define the calculation formula for the rule.
To define the formula for a custom calculation rule:
1. In an open custom calculation rule, click the Formula tab (Figure 1).
Chapter 6Creating and Managing Rules
6-21

Figure 6-16 The Formula Tab of the Custom Calculation Rule DefinitionArea
2. Enter the formula as a text string (see About Custom Calculation Rule FormulaSyntax for format information).
3. Select Validate Formula to determine if the formula is valid.
Note:
Custom calculation rules are validated against the data cube. If you haverecently added or changed dimensions or members, the customcalculation rules may not validate correctly until you have redeployed thecube to propagate the changes.
4. When the formula is complete, click (Save).
Note:
Following rule calculation, you can define appropriate model views and usethe Rule Balancing or Manage Queries tasks to view custom calculationrule results.
To view context definitions for the custom calculation rule, see Viewing Contexts forCustom Calculation Rules.
To edit and delete rules, see Managing Rules.
Viewing Contexts for Custom Calculation RulesDefining Global Contexts for Rules and Defining and Managing Rule Set Contextsdescribe how to select default dimensions and members to be applied to rules for agiven POV.
To view contexts applied to a selected custom calculation rule:
1. If a custom calculation rule is not already selected and open, open one.
2. Click the Rule Context tab.
The displayed information is not editable.
Chapter 6Creating and Managing Rules
6-22
For general information about custom calculation rules, see About Rules inApplications
To edit and delete allocation and custom calculation rules, see Managing Rules.
Managing RulesPrevious sections describe how to create rules. You can also delete and copy rules.
To delete a rule:
1. Display the Rules screen (About the Rules Screen).
2. Enter a POV and select a rule set.
3. In the Rules area, select a rule.
4. Click or select Actions and then Delete Rule.
5. Confirm that you want to delete the rule.
6. Click (Save).
To copy a rule:
1. In the Rules content area, enter a POV and select a rule set.
2. In the Rules area, select a rule.
3. Click or select Actions and then Copy Rule.
4. Enter a name for the new rule.
5. Click OK, and then click (Save).
Note:
You can make multiple copies of a rule by selecting the number of copies tomake. A sequence number is appended to the New Rule Name value foreach copy, to make the resulting rule names unique.
For additional, more flexible rule management options, see Express Editingfor Rules.
Express Editing for RulesYou can use the Rules Express Editing screen to create models more efficiently.
The following topics explain available features:
• About the Rules Express Editing Screen
• Searching For and Filtering Rules
• Replacing Members in Rules
• Adding Members to Rules
• Copying Rules to a New Rule Set
Chapter 6Express Editing for Rules
6-23

• Copying Rules to a Different Point of View (POV)
• Enabling and Disabling Rules
• Displaying Rules as a Hierarchy
About the Rules Express Editing ScreenYou can use the Rules Express Editing screen to perform several actions on multiplerules at once.
:You can:
• Replace members in multiple rules with one Find and Replace action (ReplacingMembers in Rules)
• Add members to dimensions in a tab for multiple rules (Adding Members to Rules)
• Copying Rules to a New Rule Set
• Copying Rules to a Different Point of View (POV)
• Enabling and Disabling Rules
Displaying the Rules Express Editing Screen
To display the Rules Express Editing screen, do one of the following:
• In Oracle Profitability and Cost Management Cloud, click Navigator, , and thenclick Calculation Rules, OR
• On the Oracle Profitability and Cost Management Cloud Home page, click
Modeling, , and then click Calculation Rules, .
The Rules Express Editing screen opens (Figure 1).
Chapter 6Express Editing for Rules
6-24

The Rules Express Editing Screen
Figure 6-17 Rules Express Editing Screen
Most of the controls on this screen are described in Common Feature Controls. Formore information on the robust Search features, see Searching For and FilteringRules. You can inspect the detail of a rule by highlighting it, and then clicking the
Inspect icon . The Inspect region stays open and refreshes as you highlight adifferent rule.
The Sort box, to the right above the rules list, offers the following sort orders: ModelCalculation Sequence (the default), Name, Rule Set Name, and Rule Sequence.
Note:
Model Calculation Sequence is determined by the rule set order and thenrule sequence within the rule set.
You can use the POV bar to select a set of rules for editing, for example:
The Actions menu contains the following options:
• Replace Member in Rules, Replacing Members in Rules
• Add Member to Rules, Adding Members to Rules
• Copy Rules to New Rule Set, Copying Rules to a New Rule Set
Chapter 6Express Editing for Rules
6-25

• Copy Rules to Point of View, Copying Rules to a Different Point of View (POV)
• Enable Rules, Disable Rules, Enabling and Disabling Rules
Searching For and Filtering RulesYou can use the searching and filtering features of the Rules Express Editing screento explore rules for a particular point of view (POV) or to display rules for furtheroperations such as replacing or adding members.
Follow these guidelines for searching and filtering:
1. Display the Rules Express Editing screen (About the Rules Express EditingScreen).
2. Optional: Enter all or part of a rule name into the Search control
( ).
You can use asterisks (*) as wildcards in searches. They can represent part of aname, or the operator "and" when used between two strings. For example, My*matches to Myname and Myother. My*name matches to Myname and Mynewname.
3. Select a Rule Set and Rule Type for the search, or use All if that category isn'trelevant to your search.
4. Enter a POV for the search.
5. Optional: Use the Sort box to arrange the selected rules. You can sort by ModelCalculation Sequence (the default), Name, Rule Set Name, and RuleSequence. Click an arrow to sort in ascending or descending order. You can clickRefresh, , at any time to display the latest results.
6. Optional: Click Add Filter to create a custom filter to further limit the rule namesavailable for selection.
In the Custom Filter screen, enter a target Dimension, the tab to search for thetarget member (Source, Destination, or Target), the filter Operator (Contains orDoes Not Contain), and the target Find Member . For the Find Member, you canstart typing the name to display matches, or click the Search symbol to display alist for selection. When you click OK, only marching names display in the RulesExpress Editing screen. You can add additional filters if you want.
7. Click the box at the beginning of a rule row to select that rule for further actions,such as the following:
• Replacing Members in Rules
• Adding Members to Rules
• Copying Rules to a New Rule Set
• Copying Rules to a Different Point of View (POV)
• Enabling and Disabling Rules
Replacing Members in RulesYou can use the Replace command in the Rules Express Editing screen to replacedimension members in one or more rules with one action.
Chapter 6Express Editing for Rules
6-26

Note:
This action cannot be undone. Oracle recommends that you use theMigration tools for backups if necessary.
To replace members in rules:
1. Display the Rules Express Editing screen (About the Rules Express EditingScreen).
2. Search to find rules to modify (Searching For and Filtering Rules).
3. Check the box before the names of target rules to select them, or select all.
4. Click Actions, and then Replace Member in Rules.
5. Complete the Find and Replace information:
• Select a Dimension.
• Select a Find Member, the member to locate and replace in the selectedrules.
Attribute dimensions are included in the Dimension list. If a dimension has auser-defined attribute (UDA) associated with it, then there is a UDA entry for it,such as Product -- UDA or Customer -- UDA. Selected attribute and UDAmembers are replaced in the filters defined for each selected rule.
• Optional: Select one or more Replace With Member(s), the member ormembers to appear in the selected rules after replacement.
Note:
If a Replace With Member isn't selected, the Find Member will beremoved instead of replaced.
• Select a Target Rule Tab, the tab where the selected Find Member will bereplaced.
Note:
You can select from among Source, Destination, and Target tabs.
• Optional: Check Preserve Filters to keep any filters on the target memberwhen it is replaced.
• Optional: Add a Job Comment to display in the Job Library list.
6. When settings are complete, click Run.
Adding Members to RulesYou can use the Add command in the Rules Express Editing screen to add dimensionmembers to one or more rules with one action.
Chapter 6Express Editing for Rules
6-27

Note:
This action cannot be undone. Oracle recommends that you use theMigration tools for backups if necessary.
To add members to rules:
1. Display the Rules Express Editing screen (About the Rules Express EditingScreen).
2. Search to find rules to modify (Searching For and Filtering Rules).
3. Check the box before the names of target rules to select them, or select all.
4. Click Actions, and then Add Member to Rules.
5. Complete the Express Add Member information:
• Select a Dimension to receive the member.
• Select a Member to add to the selected dimension.
Note:
– You can add POV members only to the Driver Basis tab.
– You can add multiple members to the rule by typing membernames, selecting them from the list which is displayed as youtype, or pressing enter on an exact match; or you can click thesearch icon to use the member selector. Selected members aredisplayed in the box above the search box. You can also selectmembers for deletion from the list so they are not added to therule.
• Select a Rule Tab, the tab where the selected Member will be added.
Note:
If you select Offset as the tab, there can be only one member, atLevel 0. The Driver Basis tab also can have only one member, atany level.
6. When settings are complete, click Run.
Copying Rules to a New Rule SetThis feature is useful if you need to include identical or similar rules in several rulesets. You can copy the rule with a slightly different name and leave it unchanged ormodify it. You can select multiple rules to copy at one time to the same rule set.
To copy successfully, the rules must meet these requirements:
Chapter 6Express Editing for Rules
6-28

• If a rule uses a rule set context and the rule has dimension memberss that conflictwith members in the target rule set, the rule is not copied. An error displays in theJob log.
• If a rule with the same name as the selected rule already exists in the target ruleset, the rule is copied with a prefix or suffix added to the name to make it unique.
Note:
This action cannot be undone. Oracle recommends that you use theMigration tools for backups if necessary.
To copy a rule to a new rule set:
1. Display the Rules Express Editing screen (About the Rules Express EditingScreen).
2. Search to find rules to modify (Searching For and Filtering Rules.
3. Check the box before the names of target rules to select them, or select all.
4. Click Actions, and then Copy Rules to New Rule Set.
5. Select the New Rule Set to receive the copy or copies.
6. Optional:Enter a Job Comment to display in the Job log.
7. When settings are complete, click Run.
Copying Rules to a Different Point of View (POV)This feature is useful if you need to include identical or similar rules in several POVs.You can copy the rule with a slightly different name and leave it unchanged or modifyit. You can select multiple rules to copy at one time to the same existing POV.
To copy successfully, the rules and POVs must meet these requirements:
• The selected POV must be valid and different from the POV selected in the RulesExpress Editing screen.
• If a rule uses a rule set context or global context and the rule has dimensionmembers that conflict with context members in the target POV, the rule is notcopied. An error displays in the Job log.
• If a rule with the same name as the selected rule already exists in the target POV,you can select Overwrite to overwrite the old rule with the copy. Otherwise, therule is copied with a prefix or suffix added to the name to make it unique.
Note:
This action cannot be undone. Oracle recommends that you use theMigration tools for backups if necessary.
To copy a rule to a new rule set:
Chapter 6Express Editing for Rules
6-29

1. Display the Rules Express Editing screen (About the Rules Express EditingScreen).
2. Search to find rules to modify (Searching For and Filtering Rules.
3. Check the box before the names of target rules to select them, or select all.
4. Click Actions, and then Copy Rules to Point of View.
5. Select a Year, Period, and Scenario for the POV to receive the copy or copies.
6. Optional:Select Overwrite to overwrite rules with the same name with the copy.Leave unchecked to copy with a unique name.
7. Optional:Enter a Job Comment to display in the Job log.
8. When settings are complete, click Run.
Enabling and Disabling RulesYou can use the Rules Express Editing screen to disable and enable multiple rules ina POV at one time. This feature is useful if you need to modify a number of rules atonce, or make other changes that would affect the validity of enabled rules.
Note:
This action cannot be undone. Oracle recommends that you use theMigration tools for backups if necessary.
To enable or disable multiple rules in a POV:
1. Display the Rules Express Editing screen (About the Rules Express EditingScreen).
2. Enter POV data and then Search to find rules to modify (Searching For andFiltering Rules.
3. Check the box before the names of target rules to select them, or select all.
4. Click Actions, and then Enable Rules or Disable Rules.
5. Confirm the selected action. You can check the Job Library for status information.
Displaying Rules as a HierarchyDisplaying calculation rules as a hierarchy allows you to:
• Create a rule outline
• Quickly find rules and rule sets within the hierarchy
• Quickly edit names, descriptions, and sequence values for rules and rule sets
Displaying the Rules Outline Screen
To display the Rules Outline screen, do one of the following:
• In Oracle Profitability and Cost Management Cloud, click Navigator, , thenclick Calculation Rules, and then click the Rules Outline link, OR
Chapter 6Express Editing for Rules
6-30

• .On the Oracle Profitability and Cost Management Cloud Home page, click
Modeling, , then click Calculation Rules, , and then click the RulesOutline link.
Figure 6-18 Rules Outline Screen
Tracing AllocationsYou can use the Trace Allocations feature to select a model view and POV and thentrace forward or back from that point to see allocation inputs and outputs for a selecteddimension. While rule balancing, described in Rule Balancing for ApplicationValidation, presents some similar information in a grid format, tracing allocationsshows graphically how allocation amounts are flowing in and out of applicationelements. You can use this information for evaluation and validation. When you trace,you can select a particular generation level or always roll up data to the top. Fordetails, see the listed topics.
Note:
To trace allocations in Oracle Profitability and Cost Management Cloud, acompatible version of Adobe Flash Player must be installed for your browser.Currently Flash Player 10 or higher is required. The current location fordownloading Adobe Flash Player is:
http://get.adobe.com/flashplayer/
About Tracing AllocationsYou begin an allocation trace by selecting a focal node, defined by the POV and modelview entered into the Trace Parameters screen. You can trace forward or back fromthe focal node.
Chapter 6Tracing Allocations
6-31

When you trace back, you display allocations that contribute to the selected dimensionof the focal node. The first level back from the focal node is the rule node, whichshows the contribution from each rule. The next level back from the rule node is thedimension node. Dimension nodes show the contribution from each member for theselected dimension at the top level or the selected generation or level (Figure 1).
Note:
This figure is a "zoomed out" view to display many nodes. You can zoom into view details and can move the chart around the screen to focus ondifferent parts (Performing an Allocation Trace).
Figure 6-19 Trace Allocations Area with Nodes, Tracing Back
In default layout, the nodes display in columns. The single focal node is followed by acolumn of rule nodes, and then by a column of dimension nodes for the expanded rulenode. The rule nodes and dimension nodes display the percentage of their contributionto the value in the focal node.
When you trace forward from the focal node, the rule nodes and dimension nodesdisplay contributions (Allocations Out) from their predecessors — from the focal nodeto the rule nodes, and then from the rule nodes to the dimension nodes.
Performing an Allocation TraceTo perform a trace:
Chapter 6Tracing Allocations
6-32
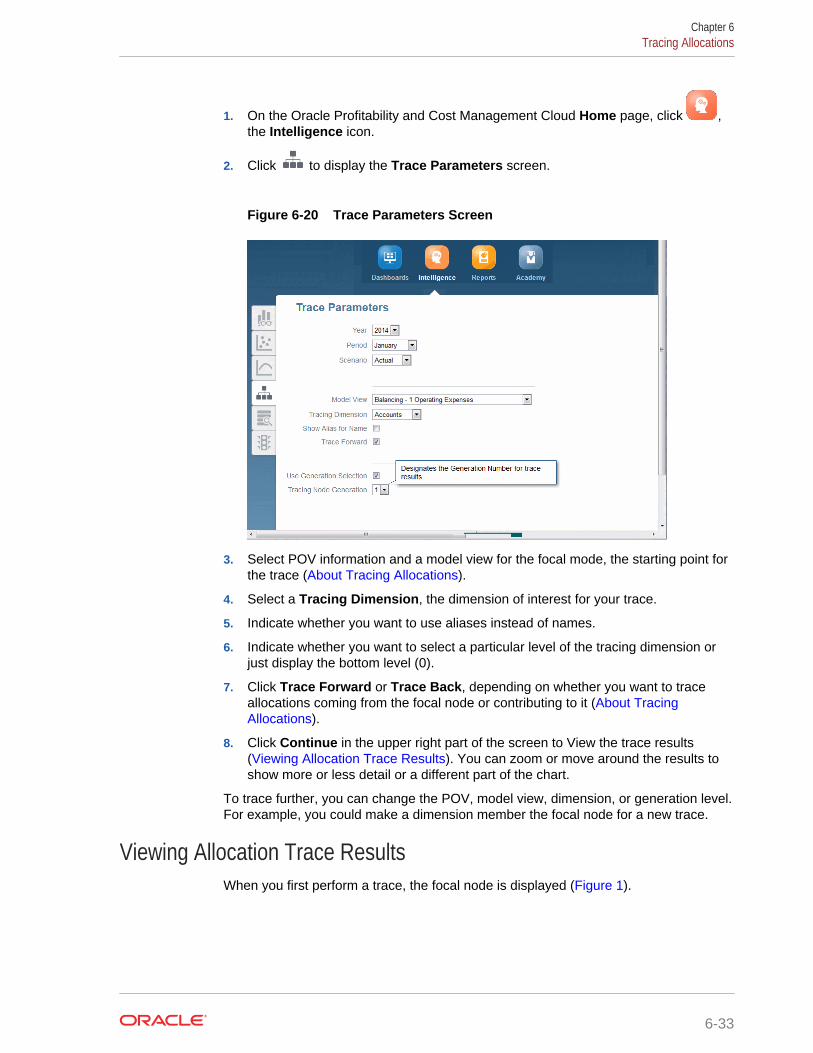
1. On the Oracle Profitability and Cost Management Cloud Home page, click ,the Intelligence icon.
2. Click to display the Trace Parameters screen.
Figure 6-20 Trace Parameters Screen
3. Select POV information and a model view for the focal mode, the starting point forthe trace (About Tracing Allocations).
4. Select a Tracing Dimension, the dimension of interest for your trace.
5. Indicate whether you want to use aliases instead of names.
6. Indicate whether you want to select a particular level of the tracing dimension orjust display the bottom level (0).
7. Click Trace Forward or Trace Back, depending on whether you want to traceallocations coming from the focal node or contributing to it (About TracingAllocations).
8. Click Continue in the upper right part of the screen to View the trace results(Viewing Allocation Trace Results). You can zoom or move around the results toshow more or less detail or a different part of the chart.
To trace further, you can change the POV, model view, dimension, or generation level.For example, you could make a dimension member the focal node for a new trace.
Viewing Allocation Trace ResultsWhen you first perform a trace, the focal node is displayed (Figure 1).
Chapter 6Tracing Allocations
6-33

Figure 6-21 Allocation Trace Focal Node Example
At full size (100% "zoom"), the focal node shows the following: model view, dimensionmembers, balance, input, adjustment in, adjustment out, allocation in, allocation out,and allocation offset amount.
If the focal node is only partially visible, you can use the Zoom and Center tool tomove it:
Click the dot in the center to center the chart. Click the arrows to move the chartbackground. This has the effect of moving the chart in the opposite direction.
When you point to the middle of the right edge of the focal node, a + (plus) sign isdisplayed:
You can click the + sign to expand the chart and show the rule nodes (Figure 2).
Figure 6-22 Allocation Trace Rule Node
Chapter 6Tracing Allocations
6-34

At 100% zoom, a rule node shows the rule number, name, and rule set. It also showsthe allocation driver, allocation in (back trace, allocation out (forward trace), and thecontribution to the total allocation shown in the focal node.
If you point to the right edge of the rule node, you can click the + sign to show thedimension nodes (Figure 3). If you click the symbol on the left side, the rule nodedetaches and is displayed without the rest of the chart. Click the arrow symbol toreturn to the chart view.
Figure 6-23 Allocation Trace Dimension Node
At 100% zoom, the dimension nodes show the member name, allocation out (backtrace), allocation in (forward trace), and percent of contributin to or from the focalnode. If you click the symbol on the left edge of the node, it detaches from the rest ofthe chart. Click the arrow to restore it.
Additional Chart Controls
The remaining chart controls perform the following actions:
• — Changes the configuration of the node tree
• — Zooms out to display as much of the chart as possible. Up to ten rule anddimension nodes are displayed; arrows following the last node of each typeindicate that there are more to display.
• — When clicked, enlarges the chart by a step (zooms in)
• — When clicked, shrinks the chart by a step (zooms out)
Note:
As you zoom in and out, an arrow moves between the two Zoom icons toshow the relative degree of "zoom".
• — Hides the control panel; click to show it again
For Zoom levels of 100%, 75%, and 50%, hyperlinks display for AllocationIn andAllocationOut amounts on the focal node and rule nodes. You can click these tolaunch Oracle Smart View for Office , similar to the way ilinks work in the RuleBalancing screen.
Chapter 6Tracing Allocations
6-35

7Using Model Views and ValidatingApplications
The following topics describe how to create and work with application slices calledmodel views and how to validate the logic of an application to determine if allocationsare working the way that you expect:
• About Validating Applications
• Creating and Managing Model Views
• Rule Balancing for Application Validation
• Performing Validation Analysis for Oracle Profitability and Cost ManagementCloud
About Validating ApplicationsThe following Oracle Profitability and Cost Management Cloud features help youvalidate an application:
• Rule balancing enables you to view dimension/member combinations within anapplication to confirm that allocations are working the way you expect (RuleBalancing for Application Validation).
• Validation and system reports enable you to identify and diagnose logic andsystem issues (Performing Validation Analysis for Oracle Profitability and CostManagement Cloud).
Tracing allocations, Performing an Allocation Trace, can help focus on details of datapresented by rule balancing.
Model views assist with rule balancing and queries (Creating and Managing ModelViews).
Creating and Managing Model ViewsThe Model Views feature of Oracle Profitability and Cost Management Cloud enablesusers to define a slice of an application that can be saved, copied, and modified.These slices, called model views, are similar to queries. They can be used in othertasks, such as rule balancing and the trace screen, to identify dimensions andmembers to retrieve.
For more information, see Creating Model Views and Managing Model Views.
Creating Model ViewsTo create a model view:
1. On the Home page, click and then select Model Views.
7-1

2. In the Model Views screen, click or select Create Model View in the Actionsmenu.
3. In the Model View area, enter a Model View Name and an optional Description(Figure 1).
Figure 7-1 Information Required to Create a Model View
4. For your convenience, use the up and down arrows in the Dimensions area tomove selected dimensions toward the top or the bottom of the list.
Note:
If there are many, you may find it helpful to move the most useddimensions toward the top.
5. To add dimension members to the view, select a dimension and click in theMember Selection area, or select Add Member in the Actions menu.
6. In the Select Dimension Members dialog box, select members and use the rightand left arrows of the shuttle control to move members from the list of availablemembers at the left to the list of selected members at the right (Figure 2).
Chapter 7Creating and Managing Model Views
7-2

Note:
To search for dimensions, enter part of the name in the box next toView. You also can do the following:
• Click Detach, , to enlarge the list.
• Use to go up or down a level or show the currentselection as the top level.
• Use the View menu to hide, show, and change the order of columns.
Figure 7-2 Select Dimension Members Dialog Box for Model Views
7. When members have been selected, click OK.
8. Optional: Click or use the Action menu in the Member Selection area of theModel View panel to remove previously added members.
9. When changes are complete, click .
To delete, copy, or modify a model view, see Managing Model Views.
Managing Model ViewsTo create a model view, see Creating Model Views.
To delete, copy, or modify a model view:
1. On the Home page, click and then select Model Views.
2. In the Model Views screen, select a model view.
3. Optional: To delete the selected model view, click or select Delete ModelView in the Actions menu and confirm the deletino.
4. Optional: To copy the selected model view, click or select Copy Model Viewin the Actions menu and enter a name for the new model view.
5. Optional: To modify the selected model view, change appropriate information forit in the Model View panel at the right side of the screen.
Chapter 7Creating and Managing Model Views
7-3

6. When changes are complete, click .
Rule Balancing for Application ValidationRelated Topics
• About Validating Applications
• Performing Validation Analysis for Oracle Profitability and Cost ManagementCloud
• Viewing the Rule Balancing Screen
• Performing Rule Balancing Tasks
Viewing the Rule Balancing ScreenThe Rule Balancing screen shows how all rules affect the selected slice of thedatabase (Figure 1).
Caution:
Users and Viewers with data grants may see incomplete data when using theRule Balancing screen. Service Administrators should make sure that usersaccessing the Rule Balancing screen have appropriate data grants to allowthem to see the data required for their investigation.
Figure 7-3 Rule Balancing Screen with Data
The layout illustrates the sequence of rule sets and rules that ran, the correspondingrule numbers, and the specific impacts of a rule displayed across columns. Thecolumns include input values, additions and subtractions, running total, and finalbalances. By default, the following data displays: the POV members selected in thePOV bar, the POV's global context, the tops of all other business dimensions, and thebalance and rule members corresponding to the rows (rules) and columns (balances)displayed in the table. You can change this view by creating model views that showdifferent slices of data, and then selecting one in the Model View list at the top of thetask area.
Chapter 7Rule Balancing for Application Validation
7-4

By default, table columns are as follows (use the scroll bar and the View menu todisplay and rearrange the columns):
• Rules — Displays the calculation program as a hierarchy of rule sets and the rulescontained within each rule set. You can expand or contract rule sets to see or hidethe rules contained within each. The rule sets and rules are displayed in the sameorder as in the Rules screen when sorted by sequence number. If rule sets orrules have the same sequence number, the secondary sort for this column is thesame secondary sort used in the Rules screen.
• Rule Number — Displays the rule dimension member corresponding to the rule.
• Input — Displays the value of the input member corresponding to the sliceindicated by the combination of POV and the rule number of the row. For all rowsexcept the first, Input is typically blank.
• Adjustment In — Displays the Adjustment In member corresponding to the sliceindicated by the combination of POV and rule number of the row.
• Adjustment Out — Displays the Adjustment Out member corresponding to theslice indicated by the combination of the POV and rule number of the row.
• AllocationIn — Displays the AllocationIn member corresponding to the sliceindicated by the combination of the POV and the rule number of the row.
• AllocationOut — Displays the AllocationOut member corresponding to the sliceindicated by the combination of the POV and the rule number of the row.
• Allocation Offset Amount — Displays an amount that further reduces anAllocationIn member, if one was used in addition to the AllocationOut.
• Net Change — Displays the Net Change member corresponding to the sliceindicated by the combination of the POV and the rule number of the row.
• Remainder — Displays the difference between AllocationIn and AllocationOutplus Allocation Offset Amount, if any, for each row.
• Running Remainder — Displays the sum of the prior row's running remainderand the current row's net change column. This column serves like a checkbookregister to indicate the remainder as of the execution of the rule corresponding tothe current row. For rule set summary rows, this column shows the same runningremainder as the last rule within that rule set.
• Balance — The amount resulting when adjustments, allocations, and offsets aretaken into account. It should equal the Input.
• Running Balance — Displays the sum of the prior row's running balance and thecurrent row's net change column. This column is similar to a checkbook register toindicate the balance as of the execution of the rule corresponding to the currentrow. For rule set summary rows, this column shows the same running balance asthe last rule within that rule set.
For information about actions you can perform in this screen, see Performing RuleBalancing Tasks.
Performing Rule Balancing TasksTo display the Rule Balancing screen, see Viewing the Rule Balancing Screen.
You can use the Rule Balancing menus and tool bar buttons to perform the followingtasks:
Chapter 7Rule Balancing for Application Validation
7-5

• Click View to display and rearrange the columns.
• Click Refresh or select Actions, and then Refresh to reload calculation results.
• Click , or select Actions, and then Export To Excel to export data in the tableto a Microsoft Excel file.
• Select Actions, and then Format to indicate the number of decimal places todisplay in the table.
• Use Detach, , to display the table in its own window.
• Use the level buttons, , to go up or down a level or show the currentselection as the top level.
If a value in the Rule Balancing table is displayed in blue and underlined when youpoint to it, this indicates a Oracle Smart View for Office hyperlink. You can click thesehyperlinks to launch Smart View and drill down further on input or allocation data.
Note:
For a description of the Rule Balancing screen, see Viewing the RuleBalancing Screen.
Performing Validation Analysis for Oracle Profitability andCost Management Cloud
After an Oracle Profitability and Cost Management Cloud application is deployed, itcan become invalid if changes are made to dimensions that are used in applicationartifacts. Errors display if an invalid condition is created. You can learn more aboutthese errors and search for validation errors in the Model Validation screen.
To check for and analyze validation errors:
1. On the Home page, click and then select Model Validation.
2. In the Model Validation screen, for each type of validation, enter POV information(such as Year, Period, and Scenario), and click Run.
Errors, if present, display in a Model Validation table. The default tab is for rulesets and rules (Figure 1).
Chapter 7Performing Validation Analysis for Oracle Profitability and Cost Management Cloud
7-6

Figure 7-4 Model Validation Results for the Rule Sets and Rules Tab
The error table for rule sets and rules contains the following information:
• Error Type (location) — Global Context, Rule Set Context, Rule Source, RuleDestination, Rule Driver, or Rule Offset.
• Name and number of the rule or rule set involved.
• Status of the rule or rule set, usually Disabled.
• A description of the error.
3. Review the Model Views, Queries, and Analytics tabs. Display the tab and clickRun.
Note that hese tabs apply to all POVs, so you do not need to select a POV.
4. Note errors on any tab. You can click ] or select Actions, and then Export toExcel to export data in the table to a Microsoft Excel file.
5. Repair the errors and validate again.
Note:
You can fix rule set and rule errors in the Rules screen (Working with RuleSets). If a rule has an invalid member, you can remove it by selecting the
rule and clicking .
Chapter 7Performing Validation Analysis for Oracle Profitability and Cost Management Cloud
7-7

8Deploying and Loading Data into anApplication Database
After validating the structure and data of an Oracle Profitability and Cost ManagementCloud application (Using Model Views and Validating Applications), you must deploythe database to create the metadata outline. The topics in this section are used todeploy dimension metadata to the Oracle Essbase calculation cube, and to load datainto Essbase.
Topics include:
• Deploying Databases
• Loading Data into Essbase
• Restarting Essbase
Deploying DatabasesYou should deploy the database with application metadata whenever you add ormodify dimensions or perform other structural changes. For the first deployment of anOracle Profitability and Cost Management Cloud database, you should select theReplace Database option to create the database in its entirety. After the firstdeployment, when you need to redeploy the calculation database, you can selectdeployment options to retain data already in the cube or to discard it upon restructure.
Any errors in the deployment are reported.
To deploy an Oracle Profitability and Cost Management Cloud database:
1. Click , and then Database.
The Database screen is displayed (Figure 1).
8-1

Figure 8-1 Essbase Deploy Screen
2. Confirm that the Essbase Deploy tab is selected.
3. Under Essbase Information, review the following information:
• Cluster displays the name of the Oracle Essbase database server thatcontains the application.
• Calculation Application displays the name of the application being deployed.
• Calculation Database displays the name of the Essbase database to whichthe application is being deployed.
4. Under Deploy Options, select appropriate Database Options for deploying thedatabase:
• For the first deployment of a database, all selections are grayed out. Thisoption creates the entire database for the first time.
• To redeploy an existing database, select Update Database to retain existingartifacts and property settings in the new database, and change the outline toreflect current metadata.
Note:
Those with Service Administrator or Power User roles can use thisoption.
Optional: Select Preserve Data to build and restructure the Essbase cubewhile preserving data. This option can be time-consuming, based on the sizeof the outline and the amount of data present.
Chapter 8Deploying Databases
8-2

• Alternatively, select Create/Replace Database to remove the database andapplications completely, and recreate them.
Caution:
Only those with Service Administrator roles can use this option. Ifyou plan to select this option, you must first back up your data andthen reload it yourself once the database is recreated.
5. Optional: Enter a comment in the Job Comment box. The comment will displayin the Job Library.
6. Optional: Under Last Database Deployment, review the date and time of theprevious deployment.
7. Click Deploy Now to deploy the database.
A confirmation message is displayed, indicating that the job has been submitted.
Caution:
Depending on the size and complexity of an application, this operationmay take a significant amount of time.
8. Monitor the progress of the deployment on the Job Status page using the taskflowID.
Any validation errors are displayed in the Job Library screen.
9. Calculate the application (Calculating an Application).
Loading Data into EssbaseThere are several ways to load data into Oracle Profitability and Cost ManagementCloud. For an overview, see this video:
Overview Video: Loading Data
Service Administrators and other users with appropriate provisioning can load datainto Oracle Essbase using Oracle Profitability and Cost Management Cloud. Files toload typically contain input data such as amounts to be allocated and driverinformation.
Note:
You can also open the Navigator, , and then select Data Management.For instructions, access help within Data Management or locate DataManagement documentation in the User section of Books in the Library(Using Oracle Profitability and Cost Management Cloud Library.
Chapter 8Loading Data into Essbase
8-3

The formats of files to load are the same as for Oracle Essbase AdministrationServices console:
• Text File data object(.txt) — IEssOlapFileObject.TYPE_TEXT
• Excel worksheet File data object(.xls) — IEssOlapFileObject.TYPE_EXCEL
For information about creating these files, see Understanding Data Loading andDimension Building in Oracle Essbase Database Administrator's Guide, particularly Data Sources that Do Not Need a Rules File.
The following videos show how to use Data Management to load data into OracleProfitability and Cost Management Cloud:
Tutorial Video: Loading Data Files Using Data Management Part 1
Tutorial Video: Loading Data Files Using Data Management Part 2
To load data into Essbase using Oracle Profitability and Cost Management Cloud:
1. Click , and then Database. Click the Data Load tab (Figure 1).
Figure 8-2 Data Load Screen
2. Indicate how to handle the data load:
• Optional: Select Clear Database Before Load to clear all data in the activecube of the application. To retain existing data, do not select this setting.
• Select whether to Add to Existing Values or Overwrite Existing Values.
3. In the Load Files area, select files to load. Use the Actions menu or the buttonsto perform the following tasks:
• Add Row or
button — Displays Browse buttons so you can select a data file or rule file toload
Chapter 8Loading Data into Essbase
8-4

• Delete Row or
button — Removes the selected row from the table of files to load
Note:
You can use the View menu to show, hide, and reorder columns in thetable and detach the table to float it in a separate window.
4. When files are selected, click Load to copy the files to the OLAP server and loaddata from the files into Essbase.
You can use the Job Library to track the progress of the load.
Example 8-1 Notes
At least the first error for each file in the load is logged and displayed in the JobLibrary. Where possible, multiple errors per file are logged. The error describes whichcolumn is wrong and in which record. An error is logged if the outline is empty or theloaded file is empty, locked, exceeds size limits (2 GB for data files, 64 KB for rulefiles), or if the data file contains an error. Files must be either text files or MicrosoftExcel files. File names must not exceed eight characters and should not containspaces or certain characters (including ,=.+;[]).
Restarting EssbaseSometimes calculations might take longer than expected or you may need to stop aprocess for another reason. The Job Library has a Stop button, but if Oracle Essbasehas control of the process, that button won't be active. In that case, ServiceAdministrators can stop and restart Essbase from within Oracle Profitability and CostManagement Cloud.
To stop and restart Essbase:
1. Communicate with users to be certain that nothing critical is running and to notifythem that Essbase is undergoing maintenance.
2. Click , and then Database. Click the Administration tab.
A warning is displayed. It states that all active processes and connections to theapplication will be unusable until the restart is completed. You are advised to notifyother users that there will be a disruption in service.
3. Click Restart to initiate the shutdown and restart.
Chapter 8Restarting Essbase
8-5

9Calculating an Application
Related Topics
• About Oracle Profitability and Cost Management Cloud CalculationsIf you have a Service Administrator or Power User role, you can calculate adeployed application in Oracle Profitability and Cost Management Cloud.
• Performing Basic Calculations Using the Navigator
About Oracle Profitability and Cost Management CloudCalculations
If you have a Service Administrator or Power User role, you can calculate a deployedapplication in Oracle Profitability and Cost Management Cloud.
Service Administrators and Power Users must perform calculations before Users andViewers can create or view analyses and reports. The topics in this section describehow calculations work in Oracle Profitability and Cost Management Cloud.
Basically, rules run and perform financial allocations according to how the rules are
defined. You can use the Navigator, , to perform basic one-to-one calculations. Forbasic calculations, you select a point of view (POV) to calculate and its rules areapplied to its own data.
For an overview of basic calculations using the Navigator, view the following video:
Video Overview: Calculation and Validation in Oracle Profitability and CostManagement Cloud
For a tutorial about performing basic calculations using the Navigator and validatingmodels, see this video:
Calculating and Validating Models in Oracle Profitability and Cost ManagementCloud
These topics describe important calculation concepts:
• Start with Dimensions
• Consider Allocations
• Analyze Calculation Workflow
Start with Dimensions
Application data stored in a database is organized by dimensions, which are datacategories used to organize data for retrieval and preservation of values. Dimensionsusually contain hierarchies of related members grouped within them. For example, a
9-1

Year dimension often includes members for each time period, such as Quarter andMonth.
Oracle Profitability and Cost Management Cloud includes the following dimensions:
• Business dimensions that reflect the business-specific elements of the application,such as departments, accounts, activities, customers, or products
• Point of View (POV) dimensions that identify a specific point of view or version ofthe application, such as year, scenario, period, and version
• Attribute dimensions that enable analysis based on the attributes or qualities ofdimension members, such as the size or color of products
• Alias dimensions (optional), used to assign alternate names, descriptions,languages, or other items
• System dimensions that are reserved for use by Oracle Profitability and CostManagement Cloud for system requirements
Oracle Profitability and Cost Management Cloud has two system dimensions:
• Rule dimension, that stores allocation instructions as Rule members for up to1000 rules:
• Balance dimension, that stores calculation inputs and outputs as Balancemembers:
Chapter 9About Oracle Profitability and Cost Management Cloud Calculations
9-2

When each rule runs, you can trace all the inputs and outputs and see how theybalance (Rule Balancing for Application Validation).
Consider Allocations
In Oracle Profitability and Cost Management Cloud, allocations control how costs andrevenues are distributed to specified accounts or elements throughout the application.The calculated results are assigned from a source to a destination as the funds flowthrough the application.
Allocations move data from one or more sources to many destinations based onallocation drivers. For example, you can allocate rent from the corporate cost center tobusiness function cost centers based on the percentage of square foot occupancy.
Rules define the calculation logic of Oracle Profitability and Cost Management Cloudapplications and enable them to reflect the cost assignments within the modeledsituations. Rules within rule sets run in the order of their sequence numbers within thatrule set. There are two types of rules, allocation rules and custom calculation rules.You can define an allocation source, destination, driver basis, and offset for eachallocation rule in a rule set.
Reciprocal calculations enable you to allocate data in a circular way among locationswith reciprocal relationships. For example, HR allocates expenses to IT and Finance,IT allocates to HR and Finance, and Finance allocates to HR and IT. These groupscan all have one-way relationships with other groups that do not allocate costs back tothe administrative groups.
Analyze Calculation Workflow
A look at calculation workflow can help you set up reports. All input arrives in theNoRule member of the Rule dimension. From there, rules assign funds to sources anddestinations depending on rule definitions. As rules run, adjustments and allocations inand out take place. Each pair of adjustments and allocations results in a zero sum tobalance the transaction. The difference between Allocation In and Allocation Outappears in the Remainder member of the Balance dimension. The Remainder memberprovides the input for each subsequent rule that runs.
These changes can be tracked by queries, reports, analysis views, Oracle Smart Viewfor Office, and in the Rule Balancing screen (Figure 1).
Chapter 9About Oracle Profitability and Cost Management Cloud Calculations
9-3

Figure 9-1 Rule Balancing Screen with Data
In the Rule Balancing screen, Rule dimension members are on the rows and Balancemembers are on the columns. As you read across a row, you can see funddistributions taken for that rule as it ran. The Oracle Profitability and Cost ManagementCloud calculation process captures where money came from and where it went, ruleby rule. The Rule Balancing screen shows summary amounts. With Smart Viewinstalled, you can click on a link in the Rule Balancing screen to drill down . Then, adhoc analysis in Smart View can help you show the flow of funds within each rule.
Data is captured in a multidimensional way that enables you to reveal detail in reportsas well as in Smart View. For more information about the Rule Balancing screen, see Rule Balancing for Application Validation. To learn about Smart View and FinancialReporting, visit the Library (Using Oracle Profitability and Cost Management CloudLibrary), then Books, and then see the User section.
Performing Basic Calculations Using the Navigator
Caution:
Before calculating an application, ensure that cost and revenue data havebeen loaded. Otherwise, the calculation uses an empty data set.
The global context, rule sets, and rules in Oracle Profitability and Cost ManagementCloud applications are specific to a single point of view (POV). This means that a ruleset or rule of the same name may exist in multiple POVs but each of the instances ofthat rule set or rule is a unique artifact and may have a unique definition. Running arule for a specific POV executes the definition of that rule set or rule as it exists in thatPOV. When you perform a basic calculation using the Navigator, you select a singlePOV with data and rules and run the calculation against it using its own rules.
To clear or calculate an Oracle Profitability and Cost Management Cloud applicationusing the Navigator:
1. Click , and then Calculation.
Chapter 9Performing Basic Calculations Using the Navigator
9-4

Figure 9-2 The Calculation Screen
2. In the Calculation screen, enter the POV information to calculate, such as Year,Period, and Scenario.
For a list of available POVs, click , and then Points of View.
3. Optional: Enter a Job Comment to display on the Job Library screen.
4. Optional: In the Processing Options group, select one or more actions toperform:
• Clear Calculated Data to clear all cells that could be updated by the rules inthe Processing Range options (selected by default); this also clears resultsfrom previously running the rule or rules that will run as part of this calculationjob
• Execute Calculation to run the rules specified in the Processing Rangeoptions (selected by default)
• Capture Essbase Debug Scripts to store engine-generated scripts for eachallocation or custom calculation rule included in a calculation (see AboutDebug Scripts later in this topic)
Chapter 9Performing Basic Calculations Using the Navigator
9-5

Note:
Capture Essbase Debug Scripts is intended for troubleshootingpurposes and can increase processing overhead. Avoid selectingthis setting without an appropriate reason to do so.
If Capture Essbase Debug Scripts is selected, the Job Details listindicates that selection on the Job Library screen.
• Optimize for Reporting to run the default aggregations on the Essbase cubewhen the calculation completes (About Optimizing for Reporting)
5. In the Processing Range group, indicate which rules to run:
• All Rules runs all enabled rules defined for the selected POV.
• Specify Rule Set Range runs all enabled rules in the rule set range definedby the First Rule Set Sequence Number text box and the Last Rule SetSequence Number text box, inclusive.
• Stop After Rule enables you to specify a stopping point for a calculation job.All rule sets and rules, up to and including the selected rule, will run and thecalculation will stop at that point.
• Run Single Rule runs a single rule as selected in the Rule Set Name andRule Name lists.
6. Click Run Now to run the calculations or clear data immediately. A confirmationmessage indicates that the job has started and identifies the assigned taskflow ID.
Caution:
Depending on the size and complexity of an application, this operationmay take a significant amount of time.
7. Monitor the progress of the calculation using the taskflow ID in the Job Libraryscreen.
Example 9-1 About Debug Scripts
Scripts are generated in the Outbox folder, which can be accessed using the FileExplorer (Transferring Files with the File Explorer).
The file name format for scripts is P+XX+RuleMemberName.txt, defined as follows:
• P = POV
• XX = last two digits of the selected POV member group ID
• RuleMemberName = Unique rule member name assigned to the particular rule
For example, a generated script may be named P99R0001.txt.
Each script file has a header with the following information:
• Application name
• POV
• Rule set name
Chapter 9Performing Basic Calculations Using the Navigator
9-6

• Rule name
• Rule sequence
• Number of iterations
Individual script files are compressed into a larger file. When uncompressed, they runin Essbase MAXL without editing. If custom calculation formulas are used, their debugscript files have the same name as the main script file, followed by an underscore andsequential number. For example, if a rule file script's file name is P5R0005.txt and ithas two custom calculation scripts, their names are P5R0005_1.txt andP5R0005_2.txt. The ZIP file containing these scripts isCalc_Debug_Scripts_<appName>_<JobId>zip.
Example 9-2 About Optimizing for Reporting
When Optimize for Reporting is selected, Oracle Profitability and Cost ManagementCloud runs aggregations on the Essbase cube when the calculation is complete. Thisimproves performance for queries, reports, and analytics. You can also run this settingby itself.
These aggregations are dropped at the beginning of each calculation to improvecalculation performance, so it is a good practice to select Optimize for Reporting onlyfor running a final calculation before querying data, performing analytics, or runningreports. For example, if you have three calculation jobs to run before you run reports,selecting this option before the first or second job adds unnecessary time to thecalculation without providing a benefit.
Other helpful practices are as follows:
• Optimize for Reporting is selected by default. Keep it selected unless you arerunning a single rule or a sequential series of several POVs and need to saveprocessing time.
• When running multiple concurrent calculation jobs, keep Optimize for Reportingselected for all jobs. Only the last to complete will perform the aggregation. Thisavoids redundant processing and prevents slow-down of jobs.
Chapter 9Performing Basic Calculations Using the Navigator
9-7

10Monitoring Oracle Profitability and CostManagement Cloud Job Status
Whether you are working in the Profitability Application Console or another task area,processes are displayed in the same Job Library. To view job status, see ViewingTasks in the Application Job Library.
10-1

11Working with Oracle Profitability and CostManagement Cloud Analytics Features
For an overview of these powerful features, see About the Oracle Profitability and CostManagement Cloud Analytics Features.
About the Oracle Profitability and Cost Management CloudAnalytics Features
Oracle Profitability and Cost Management Cloud offers a variety of features for viewingsets of data, defined using analysis views and queries, in charts and reports. ServiceAdministrators and Power Users can set up these tools for viewing by Users andViewers.
View this video for an overview of the Oracle Profitability and Cost Management Cloudanalytics features:
Overview Video: Analytics Features in Profitability and Cost Management Cloud
To display the analytics features, listed in Table 1, click Intelligence, , on theOracle Profitability and Cost Management Cloud Home page.
Table 11-1 Oracle Profitability and Cost Management Cloud Analytics Features
Icon Name Description Link
Dashboards Create or view chartsof values and trendsfor selecteddimensions
Working withDashboards
Intelligence Create or generateanalysis views, scatteranalysis graphs, profitcurve charts,allocation trace charts,queries, and keyperformanceindicators (KPIs):
Table 2
Reports Define or generatetables of query results
Working With OracleProfitability and CostManagement CloudFinancial Reports
11-1

Table 11-1 (Cont.) Oracle Profitability and Cost Management Cloud AnalyticsFeatures
Icon Name Description Link
Academy Overview and tutorialcontent about OracleProfitability and CostManagement Cloud
Note:
Academy content is available in a number of places and doesn't relate onlyto analytics.
The Intelligence icon, , accesses the following features (Table 2).
Table 11-2 Oracle Profitability and Cost Management Cloud IntelligenceAnalytics Features
Tab Description Link
, Analysis ViewsAnalysisviews providea way tolocate andsave sets ofdata drawnfrom thedatabasecube for theapplication.
Working with Analysis Views
, Scatter Analysis GraphScatteranalysisgraphs plotone valueagainstanother forthe samemember.
Working with Scatter Analysis Graphs
Chapter 11About the Oracle Profitability and Cost Management Cloud Analytics Features
11-2

Table 11-2 (Cont.) Oracle Profitability and Cost Management Cloud IntelligenceAnalytics Features
Tab Description Link
, Profit CurvesProfit curvesare useful forprofitabilityanalysis. Apopulationdimension,such asCustomers orProducts,displays alongthe x-axis indescendingorder by profityields.
Working with Profit Curves
, Trace AllocationsYou begin anallocationtrace byselecting aPOV andmodel view todefine a focalnode todisplayallocationsthat contributeto theselecteddimension ofthe focalnode.
About Tracing Allocations
, QueriesServiceAdministratorsand otherswith sufficientsecurityprovisioningcan definequeries togather dataformanagementreporting,segmentedprofitabilityanalysis, ruleanalysis, inputdataverification.You can runqueries fromtheIntelligencescreen.
Running Queries from the Intelligence Panel
Chapter 11About the Oracle Profitability and Cost Management Cloud Analytics Features
11-3

Table 11-2 (Cont.) Oracle Profitability and Cost Management Cloud IntelligenceAnalytics Features
Tab Description Link
, Key PerformanceIndicators
KeyPerformanceIndicators(KPIs) aredisplay tilesthat show onevalue for onedimension.For example,you mightshow netincome for acustomer forthe previousquarter.
Working with Key Performance Indicators
Working with Analysis ViewsSimilar to queries, analysis views provide a way to locate and save sets of data drawnfrom the database cube for the current application. You can specify dimensions andmembers to view. Once created, analysis views are displayed in a selection list. Youcan use them as basic data reports, as the basis for dashboards, and to build profitcurve charts. You can also export their data to Microsoft Excel for further processing.
You can run analysis views unless they contain restricted data. With appropriatesecurity provisioning, you also can create and edit analysis views.
To run, create, or edit an analysis view, click Intelligence, , and then .
Figure 11-1 Analysis Views Screen
Chapter 11Working with Analysis Views
11-4

As shown in Figure 1, the Analysis Views screen contains a list of analysis views andspace for optional descriptions. A check in the Enabled column indicates that ananalysis view is ready for use.
The Analysis Views screen contains the following controls: Create, Edit, Delete,Inspect, and Refresh. The name of each displays when you point to it. For icons anddescriptions, see Common Feature Controls.
The Actions menu offers two options:
• Copy -- Saves the selected view with a different name.
• Diagnose -- Displays the underlying query and performance information for you toview and save as a file.
Note:
The control functionality and Actions menu options are also availablethrough the Actions button, . You can also choose to add the selectedanalysis view to the Favorites list on the Home page.
Related Topics
• Creating and Editing Analysis Views
• Generating Analysis View Results
Creating and Editing Analysis ViewsTo create a new analysis view:
1. Display the Analysis Views screen (Figure 1).
2. Click Create, .
Note:
You can access this option only if your security provisioning allows it.
3. In the Create Analysis View screen, enter a name for the analysis view and anoptional description.
4. Select a Row Dimension, for example Customers, and then select a ColumnDimension, for example Accounts (Figure 1).
Chapter 11Working with Analysis Views
11-5

Figure 11-2 Create Analysis View Screen
5. Click Select a Member to select specific row or column dimension members:
• Select to any level of detail, for example Net Income, then Income FromOperations, and then Gross Profit.
• Select Member Function to use a default dimension member or select aformula to reference one or more members relative to the current selection(Using Member Functions).
Optionally, click fx to use a Selection Function (Figure 2).
Figure 11-3 Member Selector with Selection Function Options
6. Optional: Use the Data Slice tab to define the analysis view further, for exampleby including Products and selecting Bikes, but not Accessories.
Chapter 11Working with Analysis Views
11-6

Note:
If you don't specify a data slice, all dimensions that aren't rows orcolumns are used at the top level.
7. Optional: Use the Analysis Options tab to add more detail to the definition,especially concerning what displays on dashboards:
• You can select one or more Point of View Bar Dimensions for user input,such as Year or Period, or any other dimensions available for that analysisview.
Users can customize member selection with the POV bar.
• You can specify whether to use Generations or Levels for memberancestors, how many generations or levels to show for the row dimension,which row dimension attributes to use, what level of decimal precision to use,and whether or not to use aliases, if present.
Row dimension member's ancestors are displayed as additional columns inthe view.
• You can select from the following Row Sort Order and Column Sort Ordersettings to determine the order of rows and columns in the analysis view:
– Outline -- Their order within the database outline
– Alpha Ascending -- In alphabetical order from A to Z
– Alpha Descending -- In reverse alphabetical order from Z to A
You can sort rows and columns in different orders. This feature can be helpfulwhen using analysis views as simplified reports.
8. When the definition is complete, select Enabled on the Definition tab, and thenselect Save or Save and Close to add the new analysis view to the list.
To edit an existing analysis view, click at the end of the row. The Edit AnalysisView screen is displayed. You can edit and save the definition following the previoussteps used to create it.
You can also use to Copy an analysis view.
Select Diagnose in the menu to display an overview of queries and other structuralelements created by the definition. This diagnostic data can help you understand theanalysis view and edit it if results are not as expected.
To run an analysis view and generate data, see Generating Analysis View Results.
Related Topics
• Working with Analysis Views
Using Member FunctionsYou can use Member Functions to select the member defined for that dimension inPreferences (Setting User Preferences), or you can use a formula that references amember relative to the current one. The following figure shows the Member Functionlist for the Period dimension.
Chapter 11Working with Analysis Views
11-7

Figure 11-4 Member Functions for the Period Dimension
In the previous figure, Quarter to Date and Year to Date, and Current are self-explanatory and based on the date selected for this purpose. To set Current dates,see Editing an Application’s Description and Default Dimension Settings.
The Single... options select one member at the indicated level, counting back theindicated number from the current member at that level. For example, Single(-1)Level 0 provides data for June if the current month is July. Single(-1) Level1 providesdata for Q2 if the current month is July, since July is in the third calendar quarter.
The Multiple... options select all members in the indicated range, counting back fromthe current member at that level. For example, Multiple(-6) Level 0 retrieves trailing sixmonths data (for February through July, if the current month is July).
Generating Analysis View ResultsAnalysis views are similar to queries. With access to underlying data, you can run ananalysis view to create a table of results for the selected view definition. Then, you canuse the table to confirm or troubleshoot the definition, or you can use it for furtheranalysis in Microsoft Excel or other applications with compatible formats.
To generate analysis view results:
1. Display the Analysis Views screen (see the following figure).
2. Click Refresh, , and then click the Name of an analysis view.
Chapter 11Working with Analysis Views
11-8

Figure 11-5 Analysis View Results Table
In this case, the table of results shows net income, income from operations, and grossprofit for all customers and a set of customers categorized as Big Box.
With appropriate security provisioning, you can use the buttons and menus to performthe following operations in this table:
• Drag the right edge of each column to change the column width (or use theActions menu).
• Click each heading to sort the table.
• Use the Actions menu to change the font size.
• Use the View menu to hide and show columns and change column order.
• If a Point of View bar displays above the results table, you can click the link belowa label to select a member for that dimension to refine the results.
• Use to list additional dimensions not included in the results.
• Use the View menu or the Detach button to move the table to a separate windowand back to the main window.
• If a Point of View bar displays above the results table, you can click the link belowa label to select a member for that dimension.
• Click the Export... button to export the table to Microsoft Excel.
You can also apply filters to the table to show only data that meets certain criteria. Toapply filters:
1. Click Add Filter.
2. Select a dimension member.
3. Select a comparison operator.
4. Enter one or more values, depending on the selected operator.
5. Click OK to apply the filter.
You can create a filter for each member offered in the Add Filter list.
Chapter 11Working with Analysis Views
11-9

Related Topics
• Working with Analysis Views
Working with DashboardsDashboards in Oracle Profitability and Cost Management Cloud are sets of small-scalecharts that display values and trends. They are based on analysis views (Working withAnalysis Views). As with other analytics features, virtually all users can viewdashboards after they are defined by administrators and others with sufficient securityprovisioning.
Figure 11-6 A Four-cell Dashboard
Related Topics
• Creating Dashboards
• Displaying Dashboards
Creating DashboardsWorking with Dashboards describes Oracle Profitability and Cost Management Clouddashboards.
Chapter 11Working with Dashboards
11-10

Note:
For the URL dashboard component, only URLs from the following domainsare supported:
• ORACLE.COM
• ORACLECLOUD.COM
• ORACLEOUTSOURCING.COM
• ORACLEDEMOS.COM
• ORACLEADS.COM
To display the Dashboards screen:
1. On the Oracle Profitability and Cost Management Cloud Home page, click
Dashboards, .
2. Or, click Dashboards while viewing the Intelligence screen.
The Dashboards screen is displayed.
Figure 11-7 Dashboards Screen
The Dashboards screen lists and describes existing dashboards. To display one, clickits name.
Chapter 11Working with Dashboards
11-11
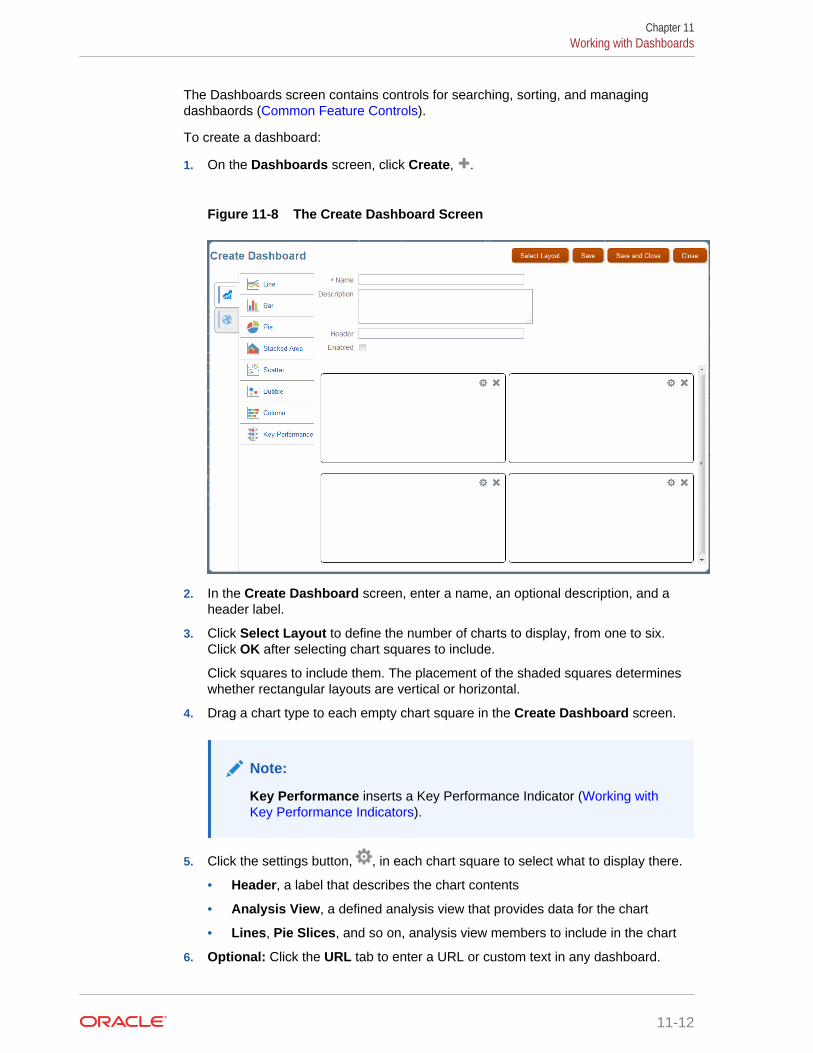
The Dashboards screen contains controls for searching, sorting, and managingdashbaords (Common Feature Controls).
To create a dashboard:
1. On the Dashboards screen, click Create, .
Figure 11-8 The Create Dashboard Screen
2. In the Create Dashboard screen, enter a name, an optional description, and aheader label.
3. Click Select Layout to define the number of charts to display, from one to six.Click OK after selecting chart squares to include.
Click squares to include them. The placement of the shaded squares determineswhether rectangular layouts are vertical or horizontal.
4. Drag a chart type to each empty chart square in the Create Dashboard screen.
Note:
Key Performance inserts a Key Performance Indicator (Working withKey Performance Indicators).
5. Click the settings button, , in each chart square to select what to display there.
• Header, a label that describes the chart contents
• Analysis View, a defined analysis view that provides data for the chart
• Lines, Pie Slices, and so on, analysis view members to include in the chart
6. Optional: Click the URL tab to enter a URL or custom text in any dashboard.
Chapter 11Working with Dashboards
11-12

Note:
The target URL must support being loaded as a frame by an outsideclient.
7. When all the dashboard charts are defined, select Enabled, and then click Saveor Save and Close.
The new dashboard is listed and ready for use.
To display a dashboard with the latest data, see Displaying Dashboards
To edit an existing dashboard, see Editing Dashboards.
Editing DashboardsCreating Dashboards describes how to display the Oracle Profitability and CostManagement Cloud Dashboards screen and create a dashboard.
To edit a dashboard:
1. Select a dashboards in the Dashboards screen.
2. Click Edit, .
3. In the Edit Dashboard screen, edit as you prefer. The procedure is essentially thesame as described in Creating Dashboards.
4. When edits are complete, select Enabled, and then click Save or Save andClose.
The edited dashboard is listed and ready for use.
To display a dashboard with the latest data, see Displaying Dashboards
Displaying DashboardsTo display a set of dashboards with the latest data:
1. On the Oracle Profitability and Cost Management Cloud Home page, click
Dashboards, .
2. Click Refresh, , and then click the Name of a dashboard to display thosedashboard charts with the latest data.
Working with Scatter Analysis GraphsScatter analysis graphs plot one value against another for the same member. Whenplotted for a number of members, you can identify trends and also determine if somemembers deviate strongly from those trends (Figure 1). The following graph of Profitagainst Revenue shows a strong linear correlation of these variables throughout therange of values.
Chapter 11Working with Scatter Analysis Graphs
11-13

Figure 11-9 A Scatter Analysis Graph of Profit Against Revenue
For illustrations of a scatter analysis graph definition and results, see Scatter AnalysisGraph Example.
Most users can generate scatter analysis graphs from existing definitions, but onlyadministrators and others with sufficient security provisioning can define scatteranalysis graphs.
Related Topics
• Defining Scatter Analysis Graphs
• Scatter Analysis Graph Example
• Generating Scatter Analysis Graphs
Defining Scatter Analysis GraphsWorking with Scatter Analysis Graphs describes scatter analysis graphs.
To define a scatter analysis graph:
1. On the Oracle Profitability and Cost Management Cloud Home page, click
Intelligence, , and then .
The Scatter Analysis screen is displayed, with controls for searching, sorting, andmanaging scatter analysis graphs (Common Feature Controls).
2. On the Scatter Analysis screen, click Create, .
Chapter 11Working with Scatter Analysis Graphs
11-14

Note:
You only see Create if your security provisioning enables you to use it.
3. In Create Scatter Analysis, enter the following:
• A Name for the scatter analysis graph
• An optional Description
• The Analysis View to provide data for the graph (Working with AnalysisViews)
• An X Axis Member to provide values to plot horizontally
• An optional X Axis Label for the horizontal axis
• A Y Axis Member to provide values to plot vertically
• An optional Y Axis Label for the vertical axis
Tip:
For ease of use, create descriptive names and labels to help otherusers analyze the scatter analysis graph.
4. When selections are complete, select Enabled, and then Save or Save andClose.
To open an existing scatter analysis graph definition for editing, select it and then click
Edit, .
In the Actions menu, you can also Copy the selected definition, or select Diagnose toview a detailed analysis of its contents.
To permanently delete a scatter analysis graph definition, select it and click Delete,
.
For an example of a scatter analysis graph definition and output, see Scatter AnalysisGraph Example
To generate a scatter analysis graph, see Generating Scatter Analysis Graphs.
Scatter Analysis Graph ExampleFigure 1 shows the definition for a scatter analysis graph.
Chapter 11Working with Scatter Analysis Graphs
11-15

Figure 11-10 Definition for a Scatter Analysis Graph
When you select and run this definition and apply a filter, the scatter analysis graphdisplays as shown in Figure 2. All data is included, but values are filtered to show onlyprofit-revenue pairs with net revenue greater than $120,000. The graph is quite linear,which suggests a strong relationship between net profit and net revenue. You can clickRun As Analysis View to display the graphed data in a table for further analysis.
Figure 11-11 A Filtered Scatter Analysis Graph of Profit Against Revenue
Chapter 11Working with Scatter Analysis Graphs
11-16

Generating Scatter Analysis GraphsWorking with Scatter Analysis Graphs describes scatter analysis graphs.
To generate a scatter analysis graph:
1. On the Home page, click Intelligence, , and then .
2. In the Scatter Analysis screen, click Refresh, , and then click the Name of anenabled definition.
Results display as shown in Scatter Analysis Graph Example.
If dimensions display in the Point of View bar, you can click the link beneath a nameand select a member. You can click + to select a member and then an operator andvalue or value range to restrict values for that member in the graph. Click to furthercontrol the display.
Working with Profit CurvesProfit curves are useful for profitability analysis. For example, a population dimension,such as Customers or Products, displays along the x-axis in descending order by profityields. With customers, the most profitable customer is at the far left and the leastprofitable at the far right. The y-axis shows cumulative values for the accountdimension, such as Profit. The most profitable customer's profit is the first y plot. Thesecond y plot is the second customer's profit added to the first, and so on.
The first part of the curve is the steepest and shows the largest gains in profit. As lessprofitable customers are added to the curve, it flattens. If profitability goes negative forthe least profitable customers, the curve moves downward.
Figure 11-12 Profit Curve of Net Income for All Products
Chapter 11Working with Profit Curves
11-17

You can click Category Analysis to show the amount contributed by each member ofthe selected category.
Figure 11-13 Profit Curve Category Analysis
Click Analysis Links, and then Run As Analysis View to run the underlying analysisview.
As with other Oracle Profitability and Cost Management Cloud analytics features,virtually all users can generate and view profit curves, but only administrators andothers with sufficient security provisioning can define them.
Related Topics
• Defining Profit Curves
• Generating Profit Curves
Defining Profit CurvesWorking with Profit Curves describes profit curves. For an example of a definition andresults, see Profit Curve Example.
To display the Profit Curves screen:
1. On the Oracle Profitability and Cost Management Cloud Home page, click
Intelligence, .
2. Click .
Chapter 11Working with Profit Curves
11-18

Figure 11-14 Profit Curves Screen
The Profit Curves screen contains the following controls: Create, Edit, Delete,Inspect, and Refresh. The name of each displays when you point to it. You can alsoSearch entered text and Sort selected columns. For control descriptions, see Common Feature Controls.
The Actions menu offers two options:
• Copy -- Saves the selected graph with a different name.
• Diagnose -- Displays underlying queries and performance information for you toview and save as a file.
Note:
The control functionality and Actions menu options are also availablethrough the Actions button, . You can also choose to add the selectedprofit curve to the Favorites list on the Home page.
To define a profit curve:
1. On the Home page, click Intelligence, , and then .
2. In the Profit Curves screen, click Create, .
Note:
You only see the Create option if your security provisioning enables youto use it.
Chapter 11Working with Profit Curves
11-19

3. In Create Profit Curve, enter the following:
• A Name for the profit curve
• An optional Description
• The Analysis View to provide data for the graph (Working with AnalysisViews)
• A Measure Member, a member of the analysis view column dimension; itsvalue is accumulated and plotted on the y-axis
The row dimension of the analysis view supplies the member plotted on the x-axis. For example, if the measure member is Net Profit and the x-axis memberis Customer, then the first symbol at the left shows where the Net Profit valueof the most profitable customer falls on the y-axis, the next symbol showswhere the Net Profit value of the most profitable customer added to the nextmost profitable customer falls on the chart, the third symbol shows the NetProfit sum of the first three most profitable customers, and so on.
• An optional X Axis Label for the horizontal axis
• An optional Y Axis Label for the vertical axis, usually Profit, Revenue, orsimilar
Tip:
For greatest ease of use, create descriptive names and labels tohelp other users analyze the profit curve.
4. When selections are complete, select Enabled, and then Save or Save andClose.
To edit an existing profit curve definition, select its row in the Profit Curves screen,click Edit, , and follow the previous steps.
To permanently delete a profit curve definition, select it and click Delete, .
Profit Curve Example
The following figure shows the definition for a profit curve.
Chapter 11Working with Profit Curves
11-20

Figure 11-15 Definition for a Profit Curve
When you select and run this definition, the profit curve displays as shown in Figure 1.Some customers contribute negatively so the Potential Profit is greater than the ActualProfit.
Click to further define the display. If attributes or member generations wereincluded in the underlying analysis view, you can click Category Analysis to select ananalysis category and narrow the focus interactively to show only a portion of thecategory. If you click Analysis Link and then Run As Analysis View, the grapheddata opens in a table for further analysis.
Generating Profit CurvesWorking with Profit Curves describes profit curves.
To generate a profit curve:
1. On the Home page, click Intelligence, , and then .
2. Click Refresh, , and then click the Name of an enabled definition..
Results display as shown in Figure 1. You can do the following to further define thecurve:
• If dimensions display in the Point of View bar, you can click the link below a nameand select a member.
• You can click + to select a member and then an operator and value or value rangeto restrict values for that member in the graph.
• You can click to view a list of other dimensions in the data application.
Running Queries from the Intelligence PanelService Administrators and others with sufficient security provisioning can definequeries to gather data for management reporting, segmented profitability analysis, rule
Chapter 11Running Queries from the Intelligence Panel
11-21

analysis, input data verification, and more. You can use queries to generate financialreports (Working With Oracle Profitability and Cost Management Cloud FinancialReports). You can also run queries from within the Intelligence panel to displayretrieved data in the form of tables. You can then export the tables for printing orfurther analysis.
Note:
You can use Oracle Smart View for Office as a convenient way to view datafrom a query. Once the data is in Smart View, you can use it as the startingpoint for further ad hoc analysis.
To run a query, install Oracle Smart View for Office as described in Getting Startedwith Oracle Enterprise Performance Management Cloud for Administrators, and thenfollow these steps:
1. On the Oracle Profitability and Cost Management Cloud Home page, click
Intelligence, , and then .
Figure 11-16 Queries Screen, Intelligence Panel
2. Select a query.
You can use the drop-down menu with column headings to sort the selectedcolumn in ascending or descending order.
Click Refresh, , and then click the query name to run the query. Connect toSmart View.
Query results display in Smart View for printing and further analysis.
Results have special formatting that makes them easier to interpret and present.For more information, see Formatting Query Results in Smart View.
Chapter 11Running Queries from the Intelligence Panel
11-22

3. Optional: Click Actions, and then Export Query Results to export the queryin .csv format, to import into spreadsheets and other compatible applications.
Note:
Export Query Results works for queries that return less than 5 millioncells.
You can enter a name for the file, indicate whether to export only Level 0 data (thelowest level data, such as Month for Period data), and specify a RoundingPrecision level (default is equal to two places). When you click OK, the file is sentto the File Explorer Outbox.
4. Optional: Click Actions, and then Diagnose to view the following information thatcan help you fine-tune the query for optimal performance:
• The actual MDX query produced by the selected query definition
• The query run time in seconds
• The number of cells returned by the query
In the Diagnose Query screen, you can click Refresh to view the latest informationfor the selected query. Click Save to File to save the information to result.txt inthe File Explorer Outbox.
5. Optional: To save the selected query to Favorites on your home page, click
Settings, and then click Add as Favorite. The query displays on the Homepage. You can run it directly from there.
Related Topics
• Managing Oracle Profitability and Cost Management Cloud Queries
Working with Key Performance IndicatorsKey Performance Indicators (KPIs) are display tiles that show one value for onedimension. For example, you might show net income for a customer for the previousquarter. The measured dimension, such as Customers, is called the populationdimension. Once a value is retrieved for a member of the population dimension, thatvalue can be treated in a number of ways (ranked, averaged, summed, and so on).You can also assign it to a score range with a label, such as Fair or Poor. You can usemember functions for comparison with previous single numbers (such as the previousquarter) or groups of members (the last three quarters). KPIs are most frequentlydisplayed with dashboards (Working with Dashboards). The following figure shows adashboard with six KPIs.
Chapter 11Working with Key Performance Indicators
11-23

Figure 11-17 Key Performance Indicators in a Dashboard
Related Topics
• Defining Key Performance Indicators
• Generating Key Performance Indicators
Defining Key Performance IndicatorsWorking with Key Performance Indicators describes Key Performance Indicators.
To display the Key Performance Indicators screen:
1. Click the Intelligence icon, .
2. Click the Key Performance Indicator tab, .
Chapter 11Working with Key Performance Indicators
11-24

Figure 11-18 Key Performance Indicators Screen
The Key Performance Indicators screen contains the following controls: Create,Edit, Delete, Inspect, and Refresh. The name of each displays when you point to it.You can also Search entered text and Sort selected columns. For controldescriptions, see Common Feature Controls.
The Actions menu offers two options:
• Copy -- Saves the selected graph with a different name.
• Diagnose -- Displays underlying queries and other information for you to view andsave as a file.
Note:
The control functionality and Actions menu options are also availablethrough the Actions button, .
To create a KPI:
1. On the Oracle Profitability and Cost Management Cloud Home page, click ,
and then click .
2. In the Key Performance Indicators screen, Figure 1, click Create.
Chapter 11Working with Key Performance Indicators
11-25

Figure 11-19 Create Key Performance Indicator
3. In the Base Definition tab, do the following:
• Enter a Name for the KPI.
A descriptive name is helpful, since it labels the KPI.
• Optional: Enter a Description.
• Select a Population Dimension, the thing that you want to measure.
The Population Dimension choice determines what a key performanceindicator can be ranked against.
• Select a Population Dimension Member to measure.
It can be a single member, such as one product or customer, or a group, suchas a type of retail outlet.
• Select a Computation Option, either Average or Sum.
This determines the final presentation of the selected measure if a multiperiodfunction is used in the Comparison tab (so that multiple values would bereturned).
4. Optional: Click the Data Slice tab to further identify the data point to be used forthe key performance indicator.
You can drill down and select a member from any or all of the displayeddimensions. For example, suppose you select Period, Q1, February, Any furtherdefinition elements you apply will be based on February data for the selectedPopulation Dimension Member.
For example, the following figure shows that the first three dimensions haveselections as shown and no other dimensions are selected.
Chapter 11Working with Key Performance Indicators
11-26

Figure 11-20 Data Slice Tab with Three Dimensions Selected
Note:
In this example, Period was set to Current using the Member Functionoption on the Member Selector screen. For more information aboutmember functions, see Using Member Functions.
5. Optional: Click Statistics to further define the Population Dimension Memberanalysis.
You can select from Rank, Average, Median, Quartile, or None to look at valuesdivided by that statistic. The statistical value for the Population Member displaysin the KPI tile.
6. Optional: Click Score Category to assign labels to ranges of values that canapply to the Population Member.
Click Add to add a Score Category Name, a Start Value, and a higher EndValue for the category. For example, the following figure shows possible profitlevels for customers. If the selected customer had a loss, the KPI tile shows"Needs Improvement".
Chapter 11Working with Key Performance Indicators
11-27

Figure 11-21 Example of Key Performance Indicator Category Definitions
7. Optional: Click Comparison to define a comparison of the current KPI value withone from another time period or year. You can choose a Value Comparison orPercentage Comparison.
If you select one of the comparison options, controls for Comparison Dimensionand Comparison Member open.
• For Comparison Dimension, select Period or Year.
• For Comparison Member, select a quarter (and month, if you prefer), or ayear, depending on the Comparison Dimension selection.
Note:
Alternatively, you can select Member Function to choose a periodor year relative to the current one (Using Member Functions).
8. Optional: Click Display Options to use aliases for dimension names and toinclude a symbol or label before or after the value displayed in the KPI tile.
For example, you could type $ in the Value Prefix box or € in the Value Suffixbox, depending on whether the value was in dollars or euros.
9. When settings are complete, click the Base Definition tab, and then selectEnabled.
10. Select Save and Close to display the Key Performance Indicators screen withthe new KPI.
11. To display the KPI, click its name in the Key Performance Indicators screen.
Generating Key Performance IndicatorsWorking with Key Performance Indicators describes Key Performance Indicators.
To display a KPI:
Chapter 11Working with Key Performance Indicators
11-28

1. Click the Intelligence icon, , and then click the Key Performance Indicator
tab, .
Figure 11-22 Key Performance Indicators Screen
Note:
You only see controls that your security provisioning entitles you to use,so the screen you see may look slightly different from the figure.
2. Click the name of a KPI to display it.
Setting User PreferencesYou can use the Preferences menu option to set a variety of general preferences andto define a set of dimension members to use as defaults. Then, when the MemberSelector offers User Preferences as an option, you can apply all these defaults atonce.
Tip:
Preferences settings are used as defaults in setting up and running featuresavailable through the Dashboards and Intelligence icons.
To set user preferences:
1. Click the Settings and Actions menu, , in the Oracle Profitability andCost Management Cloud screen header, and then select Preferences.
Chapter 11Setting User Preferences
11-29

2. Optional: In the General page of the Preferences screen, select a photo toupload to your Home page. It can be in one of these file formats: .JPG, .PNG,or .GIF.
The photo displays in the preview circle near the top of the page.
3. Optional: In the Time Zone list, select your time zone.
4. Optional: In the Language list, select the language for your user interface display.
5. Optional: Indicate whether to show dimension aliases in the user interfacescreens.
You can use the Default alias table, or select another from the Alias Table list.
6. Optional: Set default dimensions and members:
a. In the Preferences screen, click Dimensions.
b. Click Select a Member... next to a dimension in the list.
c. Use the Member Selector to select a dimension tab, drill down to the level youwant, and then select a member to use as a default for that dimension.
Note:
You can use the scroll arrows at the end of the dimension tabs todisplay hidden tabs, if present. Use to locate specific dimensionmembers.
d. Optional: Click next to Selections to remove one or all member selections
in that window. Or, click on the other side of the screen to filter selections,show dimension aliases, show the member count, or refresh the screen.
e. When your selection is complete, either click OK to save all current settings inthe Member Selector and close the window or click a tab for anotherdimension and select default members for it.
7. When all settings on both the General and Dimensions pages are complete, ClickSave. Otherwise, click Reset to restore original settings or click Close to exit thePreferences screen without saving the current settings.
Note:
After changing user preferences, log out of Oracle Profitability and CostManagement Cloud, and then log in again to activate the changes.
Working With Oracle Profitability and Cost ManagementCloud Financial Reports
With Oracle Profitability and Cost Management Cloud, you can run basic financialreports from queries displayed in the Intelligence area. These reports can be furtherrefined using Financial Reporting.
Chapter 11Working With Oracle Profitability and Cost Management Cloud Financial Reports
11-30

Service Administrators, Power Users, and other users with sufficient securityprovisioning can also define these reports for Users and Viewers to run. Becausereports defined using queries within Oracle Profitability and Cost Management Cloudare very basic and not formatted, it is recommended that you define reports directlywithin Financial Reporting.
Related Topics
• Defining Financial Reports within Oracle Profitability and Cost Management Cloud
• Defining Financial Reports within Financial Reporting
• Running Financial Reports
Defining Financial Reports within Oracle Profitability and CostManagement Cloud
Working With Oracle Profitability and Cost Management Cloud Financial Reportsdescribes Oracle Profitability and Cost Management Cloud financial reports.
To define financial reports:
1. On the Oracle Profitability and Cost Management Cloud Home page, click
Reports, .
2. Click Create;, .
3. In Create Reports, do the following:
• Enter a descriptive Report Name.
• Optional: Enter a Report Description, highly recommended forunderstanding report contents.
• Select a query to provide data for the report.
Note:
Click the link to select a query. You can use any query that has at least onedimension assigned to Row, at least one dimension assigned to Column, andone and only one dimension assigned to POV.
4. Click OK to create the report and add it to the Reports list.
To run the report, select it in the Reports list and then click Run (Running FinancialReports.
Defining Financial Reports within Financial ReportingFor an overview of using financial reports within Oracle Profitability and CostManagement Cloud, see Working With Oracle Profitability and Cost ManagementCloud Financial Reports.
This video shows how to define reports within Financial Reporting Web Studio:
Chapter 11Working With Oracle Profitability and Cost Management Cloud Financial Reports
11-31

Creating Reports with Financial Reporting Web Studio
To define financial reports within Financial Reporting or related products:
1. Click .
2. Click Reporting Web Studio to run the Financial Reporting web client.
3. Follow instructions in the Financial Reporting help to create and edit reports in therepository. This is the same repository mentioned in Running Financial Reports.
For more detailed instructions, see the Financial Reporting documentationavailable in Oracle Learning Library for Oracle Profitability and Cost ManagementCloud (Using Oracle Profitability and Cost Management Cloud Library.
Note:
To access the report repository directly, click , and then select ExploreRepository under Reporting.
Tip:
You can hide reports within the report repository. To do this, display therepository as described in the previous note. Then, right click a report, selectProperties, and then click Advanced. In the Advanced Properties screen,select Hidden item. To view hidden reports again, follow these steps andclear Hidden item.
Running Financial ReportsWorking With Oracle Profitability and Cost Management Cloud Financial Reportsdescribes Oracle Profitability and Cost Management Cloud financial reports.
Note:
Viewer and User roles do not by default have access to run FinancialReporting reports. The Administrator must grant permissions on the PCMapplication folder or on individual reports within that folder. Permissions canbe granted to the seeded Viewer and User roles, to native groups that areassigned to them, or to individual users, using the Edit Permissions option inExplore Repository. Only then will users with the Viewer or User roleprivileges be able to see and run the Financial Reporting reports in OracleProfitability and Cost Management Cloud.
Data Grants are necessary for users with Viewer and User roles to see thedata in the reports they run.
Chapter 11Working With Oracle Profitability and Cost Management Cloud Financial Reports
11-32

To run financial reports:
1. On the Oracle Profitability and Cost Management Cloud Home page, click
Reports, .
2. Select a report in the list.
3. Click Refresh, , to access the latest report definition and data, and then clickthe Actions button, .
4. Select the report format: Run as HTML or Run as PDF.
The report displays as illustrated in the following figure. Note that this report includesformatting applied using Financial Reporting and is displayed in PDF format.
To close the report, close its tab in your browser.
Figure 11-23 A Financial Report
Chapter 11Working With Oracle Profitability and Cost Management Cloud Financial Reports
11-33

12Managing Oracle Profitability and CostManagement Cloud Queries
You can use the Manage Queries task area to create and organize queries against anapplication database for a variety of purposes. You can use these queries formanagement reporting, segmented profitability analysis, rule analysis, input dataverification, and more. You can find data of interest without having to research the ruledefinitions or understand the system dimensions that control how calculated and inputdata is stored.
Queries can be saved and reused. They also can be exported and imported using thelifecycle management features of Oracle Profitability and Cost Management Cloud.
You can launch some predefined query integrations from the Rule Balancing screen.The launch data points are represented as blue hyperlinks in the Rule Balancing table.You can drill down further on input or allocation data. For example, you could drilldown into certain costs after a calculation runs, or to examine input data that was usedin the same run.
If any dimensions or dimension members are renamed or deleted, the queries thatreference those dimensions become invalid. The query validation screen validates allqueries, and displays an error message for any invalid queries.
Only administrators or other users with sufficient security provisioning can create, edit,or delete queries. Most users can run existing queries from the Intelligence panel:
• Creating Custom Smart View Queries in Management Ledger ProfitabilityApplications
• Running Queries from the Administer and Manage Menus
• Running Queries from the Intelligence Panel
• Editing and Deleting Custom Queries in Oracle Profitability and Cost ManagementCloud Applications
Related Topics
• Running Queries from the Intelligence Panel
Creating Custom Queries in ApplicationsManaging Oracle Profitability and Cost Management Cloud Queries describes OracleSmart View for Office queries and how they can help with analysis and reporting.
12-1

Note:
Before using queries, install Smart View . See "Available Clients" in GettingStarted with Oracle Enterprise Performance Management Cloud forAdministrators.
To create a query:
1. On the Home page, click , and then click Manage Queries.
The Manage Queries screen shows all queries available to you (Figure 1).
Figure 12-1 Queries Screen
2. Click or select Actions, and then Create Query.
The New Query wizard opens.
3. In Step 1 of 3: Description, enter the following information for the new query andselect Next:
• Select the Application to use for the query from the drop-down list.
• Enter a Query Name.
4. In Step 2 of 3: Program Context, select whether to use a program context (globalcontext, rule set context, or a rule) to define dimensions. For more informationabout contexts, see Working with Oracle Profitability and Cost Management CloudRules.
• If you selected Use Program Context?, enter POV information and then clickNext.
• If you did not select Use Program Context?, click Finish, and then skip tostep 6, later in this procedure.
5. If you select Use Program Context? and click Next, Step 3 of 3: Dimensions isdisplayed. Select which program context to use, and then select from any lists thatare presented. When selections are complete, click Finish.
Context options are the following:
Chapter 12Creating Custom Queries in Applications
12-2

• Use Global Context -- Applies the default dimensions selected for all rule setsand rules in the application
• Use Rule Set Context -- Applies default dimensions selectede for thespecified rule set (requires a rule set name)
• Use Rule -- Applies rule-specific dimension information; requires a rule setname, a rule name, and a rule component (Source, Destination, Driver, orOffset)
After you click Finish, the Manage Queries screen opens, including the newquery.
Select a query and complete the custom query definition as described in thefollowing steps.
6. Optional: On the Description tab, do the following if appropriate:
• Enter a Description for the query.
• Select Use Alias to display any assigned aliases for all dimensions in thequery.
• Select Suppress Missing to set the data suppression option for the first queryin Smart View, if required.
Note:
If you select Suppress Missing, the Smart View option is set onlyfor the first query run, not all queries. To set the option forsubsequent drills into the data, set the option manually in SmartView.
7. Click Dimensions to review and edit dimension selections (Figure 2).
By default, all dimensions in the application outline are displayed, except attributedimensions.
Note:
To display attribute dimensions, select Include Attribute Dimensionson the Dimensions tab.
Chapter 12Creating Custom Queries in Applications
12-3

Figure 12-2 Dimensions Tab of the Queries Definition Screen
8. A default Position is assigned to each dimension. To change the position, select adimension, open the Move To list, and then select the new position: Row,Column, or POV (Smart View POV).
9. Optional: Use Move Up and Move Down to change the position of a highlighteddimension in the query within its Position.
10. Optional: Select a dimension and use the Member Selection area to add ordelete members and change the column display.
The list displays all dimension members, including alternate hierarchies and theNoMember member. Because there are no restrictions on level, alternatehierarchy, shared or base members, you can select any member.
11. When the query definition is complete, click to save it.
To run, edit, or delete queries, see the following:
• Running Queries from the Administer and Manage Menus
Running Queries from the Intelligence Panel
• Editing and Deleting Custom Queries in Oracle Profitability and Cost ManagementCloud Applications
Running Queries from the Administer and Manage MenusThe topics in this section describe several ways to run queries and generate results inan Oracle Profitability and Cost Management Cloud application. To use these features,
you must be able to see Manage Queries and Rule Balancing when you click .
Also see Running Queries from the Intelligence Panel.
Chapter 12Running Queries from the Administer and Manage Menus
12-4

Running Custom Queries in Oracle Profitability and Cost Management CloudApplications
Note:
Creating Custom Queries in Applications describes how to create a query.
Before you run a query, the database must be deployed and calculated.
You can run queries and display the results in Oracle Smart View for Office for furtheranalysis, validation, and editing.
To run a query and launch it in Smart View from the Manage Queries screen:
1. On the Home page, click , and then click Manage Queries.
The Manage Queries screen is displayed, showing all queries your securityprovisioning enables you to view (Figure 1).
2. Select the query to run.
Click or select Actions, and then Execute Query.
Smart View opens with query results.
Results have special formatting that makes them easier to interpret and present.For more information, see Formatting Query Results in Smart View.
Running Queries from the Oracle Profitability and Cost Management Cloud RuleBalancing Screen
You can launch some predefined query integrations from the Rule Balancing screen.The launch points are represented as hyperlinks defined on data in the screen. Thehyperlinks in the columns represent values that were contributed through rulecalculations.
You can click the hyperlinks to display data in Smart View. There, you can analyzecalculations and determine whether areas may need to be repaired, and can exploredetails of any discrepancies or missing information.
To access queries through the Rule Balancing screen:
1. On the Home page, click , and then click Rule Balancing.
2. For most complete results, calculate the application before running the query.
3. In the Rule Balancing screen, enter POV data, click , and then select a ModelView.
4. In the Rule Balancing table, click a blue hyperlink (for example, for AllocationIn).
When you click the hyperlink, results display in Smart View for further analysis andreporting.
Chapter 12Running Queries from the Administer and Manage Menus
12-5

Figure 12-3 Query Results in Smart View for Activities Allocations In
These results have special formatting that makes them easier to interpret andpresent. For more information, see Formatting Query Results in Smart View.
5. Optional: To modify the current POV, on the POV_Linked_View pane, click thedown arrow beside any dimension listed for the current POV, and then click theellipsis (...) to open a Member Selector. Select any members that you want to
change, and then click Refresh, , to activate the POV change.
6. Review the results of the query.
7. Optional: To view a specific intersection, use the Zoom commands on the OracleEssbase tab to drill down or back up to a specific intersection.
Formatting Query Results in Smart ViewOracle Profitability and Cost Management Cloud displays results data within SmartView from the Rule Balancing screen, the Trace screen, and when running a query.By default, results display with special formatting that makes it easier to interpret andpresent data. For example, cell colors make it easier to tell editable cells from read-only cells.
Cell style options are global options, which apply to the entire current workbook,including any new worksheets added to the current workbook, and to any workbooksand worksheets that are created after global options are set. You can use the OracleSmart View for Office Options settings to change these defaults. Because cells maybelong to more than one type—a member cell can be both parent and child, forexample—you can also set the order of precedence for how cell styles are applied.
To specify a style:
1. In Smart View, select Options.
2. On the Cell Styles page, select PCM.
3. Expand the list of available cell types.
This enables you to view current cell type formatting.
4. Select a cell type.
Chapter 12Formatting Query Results in Smart View
12-6

5. Select Properties and specify a font, background color, or border.
You can set only one style per cell type. For example, you may set a backgroundstyle or a font style for Parent members, but you cannot set both a backgroundand font style for Parent members.
6. To reorder precedence of cell styles, use the Move Up and Move Down buttonsor drag and drop the cell styles.
7. Click OK. The setting takes effect after you refresh or perform a drill operation.
8. Optional: To revert cell styles or precedence to the default styles of OracleProfitability and Cost Management Cloud, click Reset.
9. Optional: To set your selections on this page as default settings, click the arrow inthe OK button, and then select Default Styles.
For more information, see “Cell Styles” in Working with Oracle Smart View for Office.
Editing and Deleting Custom Queries in Oracle Profitabilityand Cost Management Cloud Applications
Creating Custom Queries in Applications describes how to create custom queries inOracle Profitability and Cost Management Cloud applications.
To edit queries:
1. On the Home page, click , and then click Manage Queries.
The Manage Queries screen is displayed, showing all queries your securityprovisioning enables you to view (Figure 1).
2. Select a query and then use the Description and Dimension tabs of the QueriesDefinition area to refine the query (Creating Custom Queries in Applications).
3. When the query edits are complete, click to save the query.
To delete queries from within Oracle Profitability and Cost Management Cloudapplications:
1. Ensure that no other users need the query.
2. In the Manage Queries screen, select the query to delete and then click , orselect Actions, and then Delete Query.
3. Respond Yes to any confirmation prompts.
The selected query is removed from the list.
Chapter 12Editing and Deleting Custom Queries in Oracle Profitability and Cost Management Cloud Applications
12-7

13Working with Oracle Profitability and CostManagement Cloud System Reports
There are several ways to view and print data in Oracle Profitability and CostManagement Cloud applications:
• You can view internal data tables for validating the application; for example theRule Balancing and Model Validation screens. To create reports from thesetables, click a button and export them to a Microsoft Excel file (PerformingValidation Analysis for Oracle Profitability and Cost Management Cloud).
• You can create and view financial reports from the Intelligence panel (WorkingWith Oracle Profitability and Cost Management Cloud Financial Reports).
• You can generate preformatted system reports to see lists and descriptions of rulesets and rules or calculation statistics.
Tip:
For a list of system reports, see Generating Oracle Profitability and CostManagement Cloud System Reports.
Generating Oracle Profitability and Cost Management CloudSystem Reports
Oracle Profitability and Cost Management Cloud system reports show one of thefollowing for an open application:
• Program Documentation -- Rule sets and rules plus rule definitions (ProgramDocumentation Report Example)
• Dimension Statistics -- Number of dimension members, number of level 0members, and number of hierarchy levels for each dimension in the currentapplication (Dimension Statistics Report Example)
• Rule Data Validation -- Source and driver data targeted for each selected rule(Rule Data Validation Report Examples
Note:
If the intersection count is greater than 1000, only the first 100intersections are displayed. If either Source Data or Driver Data is notselected, that portion of the report is blank.
13-1

• Execution Statistics -- Runtime statistics collected for the selected calculation jobfollowing the end of the job (Execution Statistics Report Example )
To generate a system report:
1. On the Home page, click , and then click System Reports.
2. In the System Reports screen, select one of the following for each setting:
• Report Name -- Program Documentation, Dimension Statistics, Rule DataValidation, or Execution Statistics
• Output Type -- PDF (Adobe Portable Document Format), Microsoft EXCEL,Microsoft WORD, XML, or HTML
3. For Program Documentation and Execution Statistics reports, enter thefollowing in the Report Parameters area:
• Program Documentation -- POV information, whether to run a Detail Report,and whether to Show Member Aliases, if present, or member names
• Execution Statistics -- Job ID for a successfully completed job from the JobLibrary screen
For Rule Data Validation reports, enter the following:
• POV information
• Rule Set
• Rule
• Whether to generate a report of summary values only, or summary values anddata
• Whether to include source data, driver data, or both for the selected rule
Note:
Dimension Statistics reports do not require Report Parametersinformation.
4. Click Run to generate and display the report.
Program Documentation Report ExampleProgram Documentation reports describe every rule and rule set. The resultingsummary of calculation logic is useful for project documentation or as a tool foraudiitors.
Chapter 13Generating Oracle Profitability and Cost Management Cloud System Reports
13-2

Figure 13-1 Example of a Program Documentation Report
This report lists rule set name, rule name, rule type, rule number, whether the rule isenabled and uses a context, the sequence number of the rule, the execution mode,iteration, and description.
Dimension Statistics Report ExampleDimension Statistics reports show the number of dimension members, number of level0 members, and number of hierarchy levels for each dimension in the currentapplication. Potential values are possible mathematical combinations that might not allbe used.
Figure 13-2 Example of a Dimension Statistics Report
This report shows dimension name, dimension type, associated attribute dimensions,total number of members, number of level 0 members, hierarchy depth, and date andtime of last update.
Rule Data Validation Report ExamplesRule Data Validation reports help you verify that all required source and driver data isincluded for allocation rules and custom calculation rules in an Oracle Profitability andCost Management Cloud application. The report shows all of the intersections for the
Chapter 13Generating Oracle Profitability and Cost Management Cloud System Reports
13-3

selected rule’s source and driver as well as any rule and driver data totals and numberof total records. Alternatively, you can select just the total summary data.
Tip:
Running the detail on these reports can take a long time and produce a largereport. Try displaying the summary as a first step.
If the intersection count is greater than 1000, only the first 100 intersections aredisplayed. If either Source Data or Driver Data is not selected, that portion of the reportis blank.
Figure 1 shows total summary data for the selected rule’s source and dataintersections as well as data for each intersection. Cost Center accounts supplysource data. Source data is missing here.
Figure 13-3 Example of a Rule Data Validation Report with Summary andSource Data
Figure 2 shows the format of driver data for the Rule Data Validation report. Thisreport shows driver data intersection count and a list of driver intersections withvalues.
Chapter 13Generating Oracle Profitability and Cost Management Cloud System Reports
13-4

Figure 13-4 Part of a Rule Data Validation Report Showing Driver Data
Execution Statistics Report ExampleExecution Statistics reports show runtime statistics collected for the selected LedgerCalculation job type following the end of the job.
Figure 13-5 Example of an Execution Statistics Report
This report shows application name, application type, model and data POV names, jobID, job type, job status, the number of calculation threads, the start and end times,whether calculated data was cleared, whether the calculation ran, the execution type,the rule set range, whether debug scripts were captured, the user ID, rule set names,rule names and numbers, the iteration number, elapsed time, report generation time,thread number, potential sources, potential destinations, potential allocations, thenumber of calculation subrules that ran compared with the total, the number of scriptsthat ran compared with the total, and the number of cells updated.
Chapter 13Generating Oracle Profitability and Cost Management Cloud System Reports
13-5

Note:
Calculation Rules, the number of calculation subrules that ran for a rulecompared with the total, is only displayed for allocation rules where thedestination is the same as the source, but a different dimension is selected.Rules of this type are calculated with a different subrule for each distinctmember combination of the matched source dimensions in the sourcemember selection of the rule. For successful calculations, the number ofsubrules that ran is the same as the total number.
Chapter 13Generating Oracle Profitability and Cost Management Cloud System Reports
13-6

ABusiness Scenario: Streamlining YourGeneral Ledger with Oracle Profitabilityand Cost Management Cloud
This following topics in this section explain how to simplify an overburdened generalledger and streamline your financial close with Oracle Profitability and CostManagement Cloud:
• The Issue
• The Solution, and How It Works
• The Results
• Key Concepts
The IssueDifferent lines of business often have competing needs for related data. Managementexecutives and planners need quick financial answers for agile, fact-based decisionmaking. At the same time, accounting teams need streamlined general ledger andchart of account data for smooth financial closes and swift reactions to market andindustry shifts.
These divergent business needs are often handled in ways that cut efficiencies forboth sides. In trying to provide the data that executives need, accountants swell thegeneral ledger with operational and management details such as customer, product,channel, activity, and service dimensions as well as statutory GAAP figures. Otherdata is pulled into spreadsheets and shadow systems that are difficult to maintain andaccess. As general ledgers become more complex and bloated, financial work isbogged down. And, management and planning groups can still face a lack ofactionable information with cumbersome querying and reporting processes.
The Solution, and How It WorksYou can reverse ledger complexity while increasing efficiencies in both accounting andoperational data management. Leave the statutory data in the general ledger where itbelongs and move the purely operational data to Oracle Profitability and CostManagement Cloud
There are several ways to add structure and data to Oracle Profitability and CostManagement Cloud applications (Creating, Importing, and Exporting Applications inthe Profitability Application Console). See the following sections for more information:
• Create an application shell. Then, import specially formatted flat files containingdimension definitions (see Creating Applications with Dimensions from Flat Files).
• Add a previously exported application using a template file. Template files containdimensions, metadata, and other artifacts created by exporting templates from
A-1

existing Oracle Profitability and Cost Management Cloud applications (see Building Applications by Importing Template Files).
Once your general ledger and operational data is added to the system, you use theOracle Profitability and Cost Management Cloud rule designer to distribute fundsbetween funding sources and destinations using a simple interface.
Figure A-1 The Rule Definition Area
Use each tab to define a rule:
1. On Description, enter a rule name, optional description, sequence number, andother information that determines when and how the rule runs.
2. On Source, select dimension members that supply funds to allocate. You can alsospecify an amount or percentage to allocate and select a calculation segmentationmethod.
3. Destination determines the dimension members that will receive incoming funds.
4. Driver Basis indicates whether funds are allocated evenly or allocated with aformula in the specified dimension member.
5. Offset supports alternate locations to hold an increase that balances acorresponding decrease in the allocation source.
6. Use Rule Context to set up default members for new rules.
For details, see "Working with Oracle Profitability and Cost Management Cloud Rules"in Administering Oracle Profitability and Cost Management Cloud.
You can further refine the allocation process by creating rule sets, logical groupings ofrules that run together in a desired sequence. You can also define contexts, defaultsthat form the basis for new rules.
After you deploy the application and calculate the data, you can use the RuleBalancing screen to visually track the flow of allocations through the system. Live linksopen Oracle Smart View for Office for additional exploration and deeper analysis.
Appendix AThe Solution, and How It Works
A-2

Figure A-2 Rule Balancing Screen with Data
Allocation tracing provides a graphic view of the relationship among parts of anapplication.
Figure A-3 Trace Allocations Area with Nodes, Tracing Back
Together, rule balancing and allocation tracing help you validate application logic.
The ResultsWhen the application is complete, you can create and view a number of analytic chartsand reports whenever you need quick data:
Appendix AThe Results
A-3

Table A-1 Oracle Profitability and Cost Management Cloud IntelligenceAnalytics Features
Tab Description Link
, Analysis ViewsAnalysisviews providea way tolocate andsave sets ofdata drawnfrom thedatabasecube for theapplication.
Working with Analysis Views
, Scatter Analysis GraphScatteranalysisgraphs plotone valueagainstanother forthe samemember.
Working with Scatter Analysis Graphs
, Profit CurvesProfit curvesare useful forprofitabilityanalysis. Apopulationdimension,such asCustomers orProducts,displays alongthe x-axis indescendingorder by profityields.
Working with Profit Curves
Appendix AThe Results
A-4

Table A-1 (Cont.) Oracle Profitability and Cost Management Cloud IntelligenceAnalytics Features
Tab Description Link
, QueriesServiceAdministratorsand otherswith sufficientsecurityprovisioningcan definequeries togather dataformanagementreporting,segmentedprofitabilityanalysis, ruleanalysis, inputdataverification.You can runqueries fromtheIntelligencescreen.
Running Queries from the Intelligence Panel
, Key PerformanceIndicators
KeyPerformanceIndicators(KPIs) aredisplay tilesthat show onevalue for onedimension.For example,you mightshow netincome for acustomer forthe previousquarter.
Working with Key Performance Indicators
You can also create and run reports, and format them in Financial Reporting WebStudio (Working With Oracle Profitability and Cost Management Cloud FinancialReports).
Key ConceptsBringing operational data into Oracle Profitability and Cost Management Cloud offersthe following efficiencies:
• You unburden the general ledger, freeing it to perform its primary purpose ofstatutory GAAP reporting.
Appendix AKey Concepts
A-5

• Oracle Profitability and Cost Management Cloud is optimized to do the "heavylifting" of moving, categorizing, adjusting, aligning, aggregating, and allocatingfunds.
• Chart of account maintenance is minimized because you don't have to createentries in the general ledger to accommodate operational changes. You canrespond quickly to business, market, and industry changes by modifyingperformance ledger drivers in Oracle Profitability and Cost Management Cloud.
• It's not necessary to manipulate numbers in ledgers of record. Complextransformations and allocations are made in performance ledgers that reflect yourbest practices. This reduces trial balance activities, reconciliations, and datasource errors.
• You can close your general ledger faster since it is only performing consolidationsfor statutory reporting.
While the accounting burden lifts, management analysts can still report on granularlevels of data, such as product SKUs, for the analysis that they need for decision-making, and for profit and loss reporting, using:
• Increased transparency and auditability
• Better allocations and alignment
• What-if planning based on different scenarios
• Easy, code-free rule design
• Built-in tracing and balancing
For additional information on this subject, see the following video:
Streamlining Your General Ledger
Appendix AKey Concepts
A-6

BBusiness Scenario: IT FinancialManagement
The following topics discuss how you can use Oracle Profitability and CostManagement Cloud and the IT Costing and Chargeback Template to model financialdata and analyze IT as a business services provider.
IT Financial Management in EPM CloudOracle Enterprise Performance Management Cloud supports the dual role of a CIO intoday's organizations—both on the spending side to run the business, and on theinvesting side to grow and transform the business. By implementing customizedsolutions for Oracle Profitability and Cost Management Cloud and Projects andFinancials in Oracle Enterprise Planning and Budgeting Cloud, and integrating datafrom the General Ledger, IT Financial Management planning using EPM Cloudenables IT Finance Departments to be strategic partners with the business.
Using Oracle Profitability and Cost Management Cloud and the IT Costing andChargeback Template, you can model financial data and analyze IT as a businessservices provider. After defining the services your organization provides (using the ITService Catalog), the IT assets and resources in your organization (such as hardware,software, and people), and importing data from the General Ledger, you define rulesfor service costing and chargeback. This allows you to determine the cost of IToperations by linking assets to services. Modelling in this way helps you analyzecurrent costs and plan for future costs. If required for your business, you can allocateservice or overhead costs to projects or departments and determine the chargebackfor IT services or resources for each project or department.
You model the flow of data in Oracle Profitability and Cost Management Cloud usingManage Rules, where you define the rules for modifying and mapping the data. Usingdimensions that include Account, Entity, Projects, Resources, Service, and Consumer,modeling data allows you to:
• Allocate overheads to projects.
• Take General Ledger data and projects data and push it to resources or services.
• Take resource costs and push them to services (for example, how many serversdoes a service use?).
• Optionally, charge back the service costs to a consumer. (The model can eitherperform chargeback or showback.)
B-1

Business users can use Rule Balancing to review the rules and their impact on thedata. Click the Smart View links to see the details. The ability to perform step by stepvalidation of rules with access to details provides transparency and auditability. It givesyou access to the operational data outside of the General Ledger where you canmodel the data using pre-built analytics, without impacting the General Ledger.
After defining the rules, you can review more than ten reports provided with the ITCosting and Chargeback Template. Reports include:
• Bill of IT Services—Shows chargeback and charge rate and drivers. You canchoose whether to charge back to consuming organizations. If you chose toperform chargebacks, you can push the charges back to the General Ledger.
Appendix BIT Financial Management in EPM Cloud
B-2

• Service Costing—Shows the cost per supported user and project and resourceconsumption.
• Project Costing—Lets you analyze the costs for run versus build, and capitalexpenditures versus operating expenditures.
After modeling the IT costs and allocating costs in Oracle Profitability and CostManagement Cloud, push the data to Oracle Enterprise Planning and Budgeting Cloudusing Oracle Enterprise Data Management Cloud and perform further planning andanalysis in Financials and Projects.
In Financials, you can perform high level IT spend planning, by Services andApplications.
In Projects, you can perform more detailed project planning to plan by resource, andunderstand project costs and benefits before submitting plans for approval. You canthen compare the plan against what is actually spent and review variations anddeviations using IT Costing.
Appendix BIT Financial Management in EPM Cloud
B-3

Customize Projects for IT with custom forms, dashboards, drivers, and navigation flow.Add a custom dimension for Service, and share the members from the IT ServiceCatalog in Oracle Profitability and Cost Management Cloud.
Customize the navigation flow to suit your organization's requirements:
For example, this custom navigation flow in Projects provides a workflow for:
• Entering IT spends for services applications.
• Allocating IT spends to projects.
• Analyzing IT project costs and benefits.
• Performing chargeback planning.
• Reviewing IT Spends overview in a dashboard.
Enter IT spends for services applications in the data entry form:
Appendix BIT Financial Management in EPM Cloud
B-4

Allocate IT spends to projects:
You can also define project benefits.
Design custom dashboards for an overall view of IT spends and variance analysis:
Appendix BIT Financial Management in EPM Cloud
B-5

By importing data from the General Ledger, modeling and allocating costs in OracleProfitability and Cost Management Cloud, and then pushing the data to OracleEnterprise Planning and Budgeting Cloud using Oracle Enterprise Data ManagementCloud, you create an IT Financial Management system with pre-built analytics that iseasy to use, gives you transparency of results and auditability, helps you optimize ITinvestment decisions, and promotes partnership with the business.
Watch this overview video to learn more about IT Financial Management in EPMCloud.
Overview Video
Appendix BIT Financial Management in EPM Cloud
B-6

CEssbase Naming Conventions
Related Topics
• Generated Calculation Script Naming Conventions
• Essbase Naming Restrictions for Applications and Databases
• Essbase Naming Restrictions for Dimensions, Members, and Aliases
• Essbase Naming Conventions for Attribute Calculations Dimension
Generated Calculation Script Naming ConventionsWhen Oracle Profitability and Cost Management Cloud generates Essbase scripts, thescripts are automatically named using specific conventions. The driver calculationscripts and allocation calculation scripts are combined into one script per stage. Thescript name is created in the following format:
String scriptName = scriptSuffix + POV-identifier + Stage Order Number +“_” + index;
• The script Suffix is based on the type of script. The following table displays the listof suffixes.
Table C-1 Calculation Script Suffixes
Script Type Cost Layer Revenue Layer
Interstage Allocation “a” “r”
Intrastage Allocation “i” “t”
• The POV-identifier is based on the POV ID and may include up to three digits. Ascript is generated and identified for every POV.
• The Stage Order Number is the order number for the Source stage (for example,1, 2, 3, and so on).
• If multiple scripts are generated because of script splitting, the _index displays thenumerical sequence of the scripts for the same type, POV, Stage, and Layer,starting with 001, 002, and so on.
Sample Script Names
• a3682001.csc represents a calculation script for POV identifier 368, Source Stage2, and the cost layer.
• t4533002.csc represents an intrastage calculation script for POV identifier 453,Source Stage 3, and the revenue layer.
C-1
Essbase Naming Restrictions for Applications andDatabases
When creating names for applications and databases, enter the name in the case inwhich you want the word displayed. The application or database name is createdexactly as it is entered. If you enter the name as all capital letters (for instance,NEWAPP), Essbase does not automatically convert it to upper- and lowercase (forinstance, Newapp).
Note:
This list provides a partial set of the restrictions. For the complete list of allrestrictions, Oracle recommends that you refer to the Administering OracleAnalytics Cloud - Essbase:
The following naming restrictions apply when you are naming applications anddatabases:
• For non-Unicode-mode application and database names, use no more than 8bytes.
• For Unicode-mode application and database names, use no more than 30characters.
• Do not use spaces in the name.
• Do not use the following special characters in the name:
– * asterisks
– + plus signs
– \ backslashes
– ? question marks
– [] brackets
– " double quotation marks
– : colons
– ; semicolons
– , commas
– ‘ single quotation marks
– = equal signs
– / slashes
– > greater than signs
– tabs
– < less than signs
– | vertical bars
Appendix CEssbase Naming Restrictions for Applications and Databases
C-2

– . periods
• For aggregate storage databases only, do not use the following words asapplication or database names:
– DEFAULT
– LOG
– METADATA
– TEMP
Essbase Naming Restrictions for Dimensions, Members,and Aliases
When defining dimensional outlines, there are restricted characters that may not beused for naming dimensions, members and aliases. A list of the most commonrestricted characters is provided in this section; however, Oracle strongly suggests thatyou review the Essbase naming conventions described in the Administering OracleAnalytics Cloud - Essbase for a complete list.
Note:
This list provides a partial set of the restrictions. For the complete list of allrestrictions, Oracle recommends that you refer to the Administering OracleAnalytics Cloud - Essbase:
When naming dimensions, members and aliases, follow these naming restrictions:
• For non-Unicode-mode dimensions, members, or aliases, use no more than 80bytes.
• For Unicode-mode dimensions, members, or aliases, use no more than 80characters.
• Distinguish between upper and lower case only if case-sensitivity is enabled. Toenable case-sensitivity, see “Setting Outline Properties” in the AdministeringOracle Analytics Cloud - Essbase.
• Do not use HTML tags in dimension or member names, aliases, and descriptions.
• Do not use quotation marks, periods, brackets, backslashes, or tabs within aname.
Caution:
Brackets are permitted but not recommended in block storage outlinesbecause they cause errors when converting to aggregate storageoutlines.
• Duplicate member names or aliases are not allowed within the same dimension.
• Do not use the following characters to begin dimension or member names:
Appendix CEssbase Naming Restrictions for Dimensions, Members, and Aliases
C-3
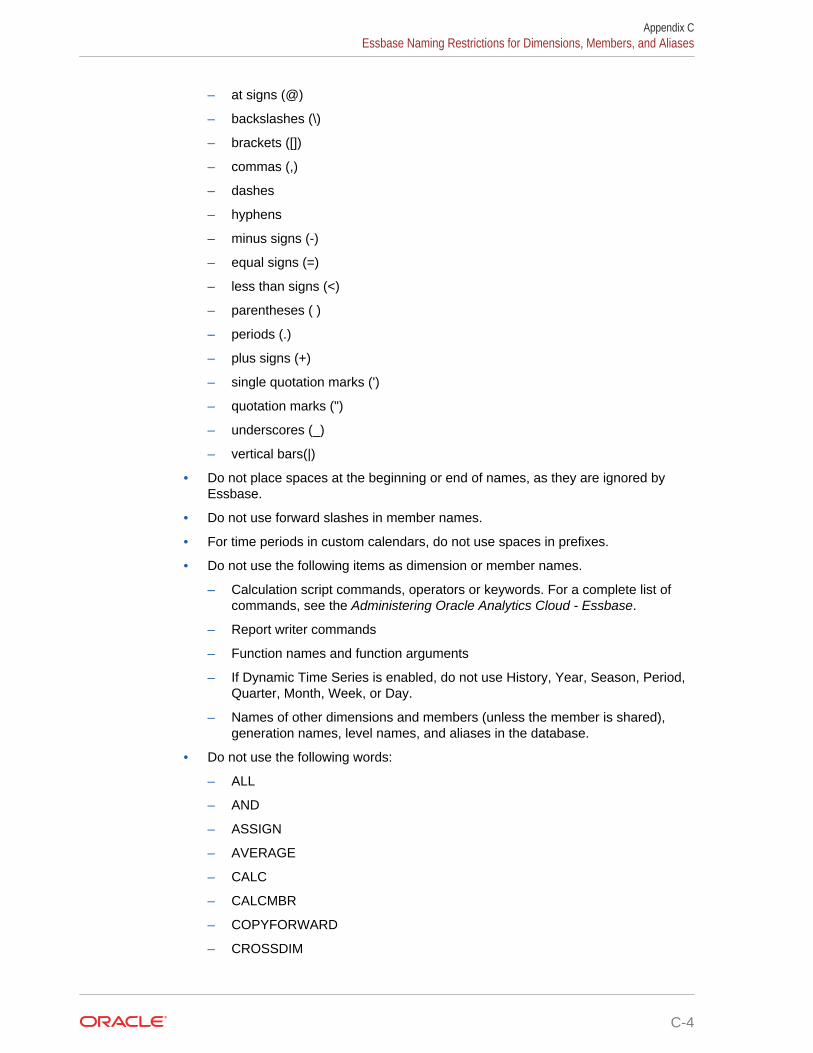
– at signs (@)
– backslashes (\)
– brackets ([])
– commas (,)
– dashes
– hyphens
– minus signs (-)
– equal signs (=)
– less than signs (<)
– parentheses ( )
– periods (.)
– plus signs (+)
– single quotation marks (')
– quotation marks (")
– underscores (_)
– vertical bars(|)
• Do not place spaces at the beginning or end of names, as they are ignored byEssbase.
• Do not use forward slashes in member names.
• For time periods in custom calendars, do not use spaces in prefixes.
• Do not use the following items as dimension or member names.
– Calculation script commands, operators or keywords. For a complete list ofcommands, see the Administering Oracle Analytics Cloud - Essbase.
– Report writer commands
– Function names and function arguments
– If Dynamic Time Series is enabled, do not use History, Year, Season, Period,Quarter, Month, Week, or Day.
– Names of other dimensions and members (unless the member is shared),generation names, level names, and aliases in the database.
• Do not use the following words:
– ALL
– AND
– ASSIGN
– AVERAGE
– CALC
– CALCMBR
– COPYFORWARD
– CROSSDIM
Appendix CEssbase Naming Restrictions for Dimensions, Members, and Aliases
C-4

– CURMBRNAME
– DIM
– DIMNAME
– DIV
– DYNAMIC
– EMPTYPARM
– EQ
– EQOP
– EXCEPT
– EXP
– EXPERROR
– FLOAT
– FUNCTION
– GE
– GEN
– GENRANGE
– GROUP
– GT
– ID
– IDERROR
– INTEGER
– LE
– LEVELRANGE
– LOOPBLOCK
– LOOPPARMS
– LT
– MBR
– MBRNAME
– MBRONLY
– MINUS
– MISSING
– MUL
– MULOP
– NE
– NON
– NONINPUT
– NOT
Appendix CEssbase Naming Restrictions for Dimensions, Members, and Aliases
C-5

– OR
– PAREN
– PARENPARM
– PERCENT
– PLUS
– RELOP
– SET
– SKIPBOTH
– SKIPMISSING
– SKIPNONE
– SKIPZERO
– TO
– TOLOCALRATE
– TRAILMISSING
– TRAILSUM
– UMINUS
– UPPER
– VARORXMBR
– XMBRONLY
– $$UNIVERSE$$
– #MISSING
– #MI
Essbase Naming Conventions for Attribute CalculationsDimension
The members that Essbase creates in the attribute calculations dimension (Sum,Count, Min, Max, and Avg) are not considered reserved words because you canchange these names in the attribute calculations dimension and then use the standardname in an attribute or standard dimension.
If the outline is tagged as a unique member outline, avoid using Sum, Count, Min,Max, and Avg as member names. For example, if you use Max in a standarddimension and then create an attribute dimension, in which Essbase creates the Maxmember in the attribute calculations dimension, Essbase detects a duplicate name andreturns the following error message:
"Analytic Server Error(1060115): Attribute Calculations dimension/membername already used."
If the outline is tagged as a duplicate member outline, and an attribute dimension (and,therefore, the attribute calculations dimension) exists before you use Sum, Count, Min,Max, and Avg as a base member, Essbase allows the duplicate name. However, if,
Appendix CEssbase Naming Conventions for Attribute Calculations Dimension
C-6
you use Sum, Count, Min, Max, and Avg as a base member before creating anattribute dimension, the duplicate name is not allowed.
Appendix CEssbase Naming Conventions for Attribute Calculations Dimension
C-7

DSyntax for Custom Calculation RuleFormulas
Related Topics
• About Custom Calculation Rule Formula Syntax
• Skipping Empty Tuples to Optimize Custom Calculations
About Custom Calculation Rule Formula SyntaxThe syntax, or format, for custom calculation rules is summarized as follows:
• The basic formula format is Result equals Formula, where Result and Formula areseparated by :=, so Result := Formula.
• The left side of the equation is the Result, a tuple that determines where customcalculated results are written.
Note:
A tuple is a comma-separated list of members enclosed in parentheses.
The tuple is an MDX specification of one or more members where no twomembers are in the same dimension. Only member names are allowed in the tupleexpression. Member functions are not supported for custom calculations. Dynamicand attribute members are not allowed in the Result. The Result must include asingle member from the Result dimension. It must be Level 0 and may be part of aLevel 0 tuple, such as ([STA1120],[Feb]). The Result dimension is defined in theTarget tab of the Rule Definition screen.
Note:
MDX is a joint specification of the XML for Analysis founding members.For more information about allowable MDX syntax, see the OracleEssbase Technical Reference.
• The right side of the equation is the Formula, a simple MDX numeric valueexpression. It includes the other members, tuples, or constants at any level andthe mathematical expression to perform. It must include at least one member fromthe Result dimension and may be Level 0, upper level, or a tuple.
D-1

Note:
Members on either side of the equation must be enclosed in squarebrackets, [ ].
Tuples must be enclosed in parentheses, ( ).
The Formula expression must end in a semicolon, ;.
The Formula can use the following:
– Constants: [STAT1120]:=1;
Note:
A constant can be a numeric constant such as 7. It can be anexpression that references values from other members in the resultdimension, and it can reference values expressed as member tuples.
– A mathematical operation: [STAT1114]:=([STAT1305],[Rule])*([STAT1307],[Rule]);
Note:
Mathematical operations must always include a Rule dimensionmember.
• Custom calculation rules support the following syntax formats for member names:
– No qualification: Only the member name is provided.
Example: [MemberName]
– Full qualification: The fully qualified name (FQN) for the member.
Example: [Dimension].[Gen2].[Gen3].[Gen4]...[MemberName]
Note:
For information about optimizing performance when defining customcalculation rules, see Skipping Empty Tuples to Optimize CustomCalculations.
Skipping Empty Tuples to Optimize Custom CalculationsData sets can be very sparse and calculating empty result sets can noticeably degradeperformance. To avoid calculating empty result sets, you can use theNONEMPTYTUPLE property clause in custom calculation formulas. UsingNONEMPTYTUPLE restricts where the system attempts to calculate. To set this up,
Appendix DSkipping Empty Tuples to Optimize Custom Calculations
D-2

you define a tuple that will only be calculated if it isn't empty. Then, you define a simplenumeric operation to be applied to the tuple.
Syntax
The syntax for using NONEMPTYTUPLE is as follows:
tuple := [NONEMPTYTUPLE (nonempty_member_list)] numeric_value_expression;
Where:
• tuple -- An MDX specification of one or more members, where no two memberscan be from the same dimension
• NONEMPTYTUPLE -- An optional property you can use to optimize calculationperformance. If used, then you must follow this literal property withnonempty_member_list.
• nonempty_member_list -- One or more comma-separated member names fromdifferent dimensions. A tuple must be present in numeric_value_expression.
• numeric_value_expression -- A simple MDX numeric value expression, such as anumber or an arithmetic operation
The expression must be on the right side of the equation. You must use onlyarithmetic operators. An error is returned if you use non-arithmetic operators suchas AND, OR, or IF.
For example:
[UnitCost] := NONEMPTYTUPLE ([TotalExpense], [NetBalance])([TotalExpense], [NetBalance]) / ([Units], [CostPool]);
This example says the following:
1. Look at the tuple ([TotalExpense], [NetBalance]).
2. If that tuple, or intersection, is not empty (that is, it contains a real value), thenperform the following operation:
Take the tuple ([TotalExpense], [NetBalance]) and divide it by the tuple([Units], [CostPool]) to yield UnitCost.
3. If the tuple is empty, skip it and evaluate the next instance.
Rules for Use
A tuple is a combination of members from some set of different dimensions, forexample:
([product2], [account5], customer3])
([myactivity], [yourdepartment])
The requirements for adding NONEMPTYTUPLE to the formula of Oracle Profitabilityand Cost Management Cloud custom calculation rules are as follows, where A, B, andC represent tuples:
• You can use NONEMPTYTUPLE only when a tuple has some value. Otherwise,the result could be unexpected. Suppose the following:
– A=B+C -- You can't use NONEMPTYTUPLE on either B or C. If B or C is missing,the result will be None, which is incorrect.
Appendix DSkipping Empty Tuples to Optimize Custom Calculations
D-3

Note:
To calculate A=B+C using NONEMPTYTUPLE, use two rules:
* Rule 1: A=A+B with NONEMPTYTUPLE on B
* Rule 2: A=A+C (or A=A-C) with NONEMPTYTUPLE on C
In this case, whenever the value for B is not missing, it will be addedto A; and whenever the value for C is not missing, it will be added toA.
– A=B-C -- You can't use NONEMPTYTUPLE on either B or C. If B or C is missing,the result will be None, which is incorrect (unless you use two rules asdescribed previously).
• You can use NONEMPTYTUPLE when the result is the same whether the tuple ismissing or not. Suppose the following:
– A=B -- You can use NONEMPTYTUPLE on B.
– A=B*C -- You can use NONEMPTYTUPLE on either B or C.
– A=B/C -- You can use NONEMPTYTUPLE on either B or C.
Note:
To summarize, you can safely use NONEMPTYTUPLE in multiplication ordivision operations. For addition or subtraction, you must evaluate its use foreach separate case to avoid unexpected results.
For more information about writing custom calculation rules, see About CustomCalculation Rule Formula Syntax and the documents referenced there.
Appendix DSkipping Empty Tuples to Optimize Custom Calculations
D-4