ADJUSTMENT OF HIGH-PRECISION FREQUENCY · Adjustment of High-Precision Frequency ... to methods of...
11
ADJUSTMENT OF HIGH-PRECISION FREQUENCY AND TIME STANDARDS BY JOHN M. SHACLL Reprinted from the PROCEEDINGS OF THE I.R.E. VOL. 38, NO. 1, JANUARY, 1950 PRINTED IN THE U.S.A.
Transcript of ADJUSTMENT OF HIGH-PRECISION FREQUENCY · Adjustment of High-Precision Frequency ... to methods of...
ADJUSTMENT OF HIGH-PRECISION FREQUENCY
AND TIME STANDARDS
BY
J O H N M. SHACLL
Reprinted from the PROCEEDINGS O F THE I.R.E. VOL. 38, NO. 1, JANUARY, 1950
PRINTED IN THE U.S.A.
6 PROCEEDINGS OF THE I.R.E.
Adjustment of High-Precision Frequency and T i m e Standards*
Summary-High-precision frequency and time standards are becoming more and more widely used in wdtny technical fields. The basic equipment used by the Central Radio Propagation Laboratory of the Na- tional Bureau of Standards in providing and broad- casting standard frequency and time signals is dis- cussed. Mention is made of the manner in which it is adjusted and the corrections which map be applied to make use of the ultimate accuracy that may be ex- pected in using these signals for measuring and cali- brating similar equipment. Several methods are given for checking the frequency of precision oscillators and precision clock performance. Suggestions are given as to methods of recording and evaluating performance data for such standards. Expected improvements in Constancy and accuracy and possible future changes in the types of standards used in physical time meas- urements are considered.
INTRODUCTION
IGH-PRECISION frequency and time standards are becoming more and more widely used in technical
rand scientific fields. Among their uses are: control sources for standard-frequency and time broadcasting; time standards for as- tronomical observatories; synchronization of master and slave stations for pulse navi- gation systems; investigation of long-dis- tance radio transmission phenomena by pulse techniques; as the heart of frequency synthesizers in large communications sys- tems; and in physical research laboratories for precise calibrations and measurements, such as time-rate phenomena and micro- ,wave spectroscopy.
While this paper deals primarily Nith the adjustment and performance of high-pre- cision frequency and time standards, many of the principles involved and techniques dis- cussed should prove helpful to those using the WWV frequencies or time signals in ad- justing or calibrating other high or medium precision equipment.
The accuracies presently required by 'some users of frequency and time services are approximately as shown in Table I.
H
TABLE I
ACCU- Service racy Sec/day
(fre- (time) quency)
Physical research
Monitoring stations
Radio broadcasting Astro-navigators 1 X 10" & 0.1
Iommercial communication 1 x 10"
Musical instruments 1 X10⁻⁴ Commercial power
Astronomers 1x10⁻⁸ +0.001
Surveyors 1x10- k0.01
distribution 1x10⁻³ (+s)
* Decimal classification: R214. Original manu-
t National Bureau of Standards. Washington, script received by the Institute, September 27. 1949.
9. c.
JOHN M. SHAULLt
Equipment and Methods in General Use A high-precision frequency standard may
be defined as one whose changes in frequency are less than 1 part in 108 per day. This de- gree of precision now requires continuous operation of the standard oscillator, with the control unit and other critical elements operating in a temperature-stabilized com- partment. Very careful shielding, filtering of battery supply leads, and use of buffer ani- plifier stages are also necessary, especially if more than one oscillator unit is operated at a single location. Such standards now gener- ally employ a G'I-cut quartz-crystal' operated in a bridge-stabilized oscillator circuit arrangement.*
A standard oscillator in wide use operates at 100 kc and has a multiposition switch for coarse frequency adjustments of approxi- mately 4 parts in 106 per step. A precision gear-driven capacitor with a drum dial ar- rangement of 5,000 dial divisions provides for a control of frequency to approximately 1 part in lo9 per division. A dial with such an expanded scale is of great advantage in niak- ing precise frequency adjustments and inter- pola tions.
A minimum of three standard oscillators is recommended for those installations re- quiring a reasonable maximuin of reliability and continuity of service. By intercomparing three standards locally, either once daily or continuously, short-time stability may be determined to a much higher order than pos- sible through radio transmission compari- sons. The most reliable standard may thus be determined and used to supply the de- sired need, with the other units available for standby duty.
For checking frequencies by the time- comparison method, and for supplying the desired audio frequencies and time intervals, each standard oscillator should be operated continuously, and two or more such oscil- lators should be provided with frequency- dividing and synchronous-clock equipments. The frequency dividers may be pulse count- ers, fractional frequency generators, locked oscillators, or multivibrators. The choice of type should be influenced by the number of output frequencies and wave form de- sired, simplicity of adjustment, and reli- ability of operation required. If seconds in- tervals are desired for laboratory use, a system similar to that used at WWV, where- in the pulse trains are generated electroni- cally and selected mechanically by a rotating cam, offers certain advantages. An alternate method is to divide the standard frequency down to 1 cps by counter methods, employ- ing an all-electronic system.
A continuously adjustable phase shifter
'W. P. Mason. "A new quartz crystal plate. designated the GT. which produces a very constant frequency over a wide temperature range." PROC. 1.R E. vol. 28 pp. 220-223. May 1940.
L: A. Meacham. YThe b;idges(abilizedoscillator." PROC. I.R.E., vol. 26, pp. 1278-1294; October, 1938.
January
of the polyphase electrostatic or electro- magnetic type is desirable in the divider chain, preferably a t the 1,000-cycle stage, to permit the clock or seconds signals to be synchronized. This device also provides a convenient means of measuring small daily differences in time kept by different stand- ard-oscilla tor clocks, including time signals received by radio. Measurements of time differences may be made by adjusting the phase shifter dial until the pulses coincide on an oscilloscope screen when alternately or siniultaneously connected.
Other methods for measuring and record- ing time differences may eniploy a spark chronograph, or a polyphase modulator and integrating phasenieter.3
A harmonic generator and niixer unit may be conveniently used in rapid fre- quency intercomparison. This device may be provided with two inputs and means to con- trol the inputs which feed into the crystal diode harmonic generators. The common output is connected to a radio receiver for counting the difference beats between two local standards. Two frequency multiplier units having outputs of 500 and 2,500 kc or other convenient frequencies, are reconi- mended to facilitate frequency measure- ments a t higher harmonics.
Standard Frequency and Time Broadciisfs from WWV
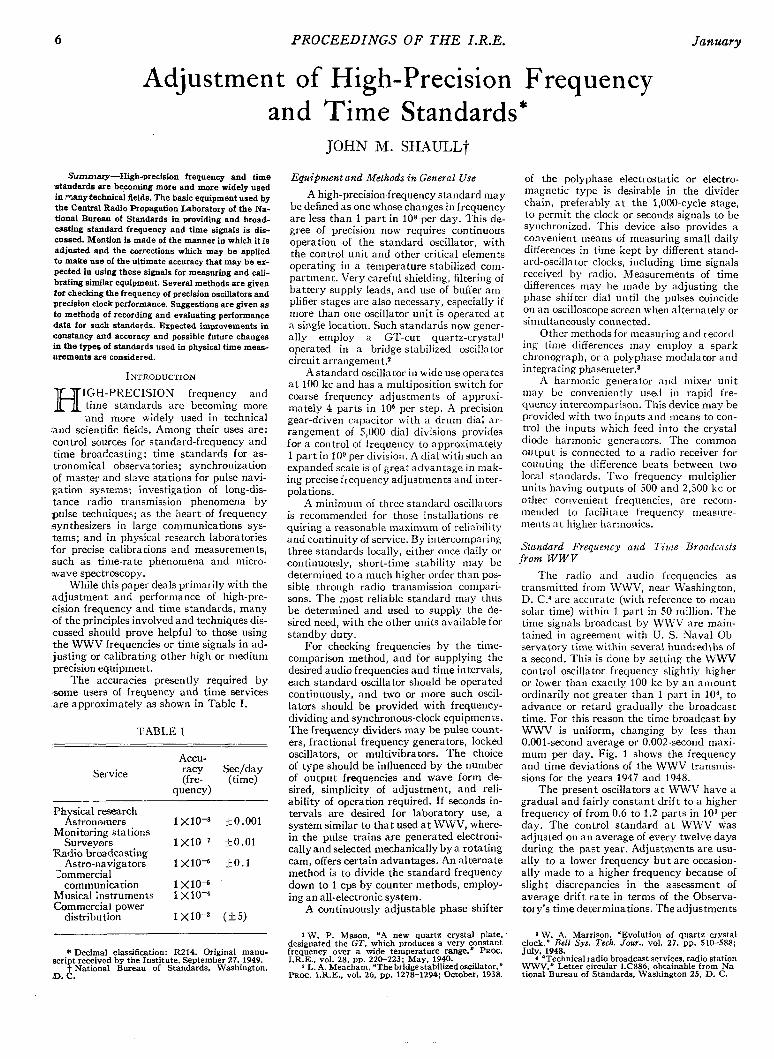
The radio and audio frequencies as transmitted from WWV, near Washington, D. C.4 are accurate (with reference to mean solar time) within 1 part in 50 million. The time signals broadcast by WWV are main- tained in agreement with U. S. Naval Ob- servatory time within several hundredths of a second. This is done by setting the WWV control oscillator frequency slightly higher or lower than exactly 100 kc by an amount ordinarily not greater than 1 part in lo8, to advance or retard gradually the broadcast time. For this reason the time broadcast by WWV is uniform, changing by less than 0.001-second average or 0.002-second maxi- mum per day. Fig. 1 shows the frequency and time deviations of the WWV transmis- sions for the years 1947 and 1948.
The present oscillators a t WWV have a gradual and fairly constant drift to a higher frequency of from 0.6 to 1.2 parts in 109 per day. The control standard a t WWV was adjusted on an average of every twelve days during the past year. Adjustments are usu- ally to a lower frequency but are occasion- ally made to a higher frequency because of slight discrepancies in the assessment of average drift rate in terms of the Observa- tory's time determinations. The adjustments
a W. A. Marrison. 'Evolution of quartz crystal clock," Bell Sys. Tech. Jour.. vol. 27. pp. 510488; July, 1948.
4 'Technical radio broadcast services, radio station WWV " Letter circular LC886 obtainable from Na- tional'Bureau of Standards, Wkshington 25. D. C.
1950 Shaull: High-Precision Frequency and Time Standards 7
Fig. I-Frequency and time deviations of WWV transmissions for 1947 and 1948
are usually made on Fridays between 9 and 10 A.M. EST. but may be made on any day of the week.
A second standard-frequency station WWVH, located in Maui, T. H., has been operating experimentally since November, 1948. The purposes of this station are to learn ways of improving coverage in areas not well served by WWV and to determine the feasibility of operating several standard- frequency stations in different parts of the
world on the same frequencies. At present, WWVH provides transmissions on 5, 10, and 15 Mc with carrier powers of 400 watts for each frequency. The carrier frequencies and modulation components are derived from primary frequency standards similar to those a t WWV. These oscillators are maintained in agreement with the WWV transmitted frequencies within 2 parts in 108 by means of time comparisons over 6-day periods.
The National Primary Standard of Frequency
The present primary standard of fre- quency consists of three precision frequency standards located a t the WWV transmitting site near Greenbelt, Md., and five located a t the National Bureau of Standards in the District of Columbia. These eight standards are automatically compared with each other and with Naval Observatory time deter- minations. The estimated or daily assigned frequencies, accurate to about 1 part in 108, are determined by a weighted extraFolation process in terms of the most reliable stand- ards. Corrected frequencies are evaluated, over 100-day intervals, in a manner ex- plained under “Interval-derived frequen- cies” and “Long-interval performance de- terminations” in terms of the Naval Ob- servatory time signals for three well-stabi- lized standard oscillators. The mean of these corrected values applied through the daily beat-frequency comparisons is adopted as the final daily corrected or “absolute” fre- quency for each standard. This value is ob- tained some 60 days later and is used as a guide in extrapolating the daily assigned frequencies so as to keep their corrections as small as possible. Agreement of the 100-day corrected frequencies computed separately in terms of each of the three interval-derived curves is generally within 2 parts in lo9. The principal limitation on the obtainable ac- curacy is thus evidently caused by the slight wanderings in the determinations of the earth’s mean rate of rotation.
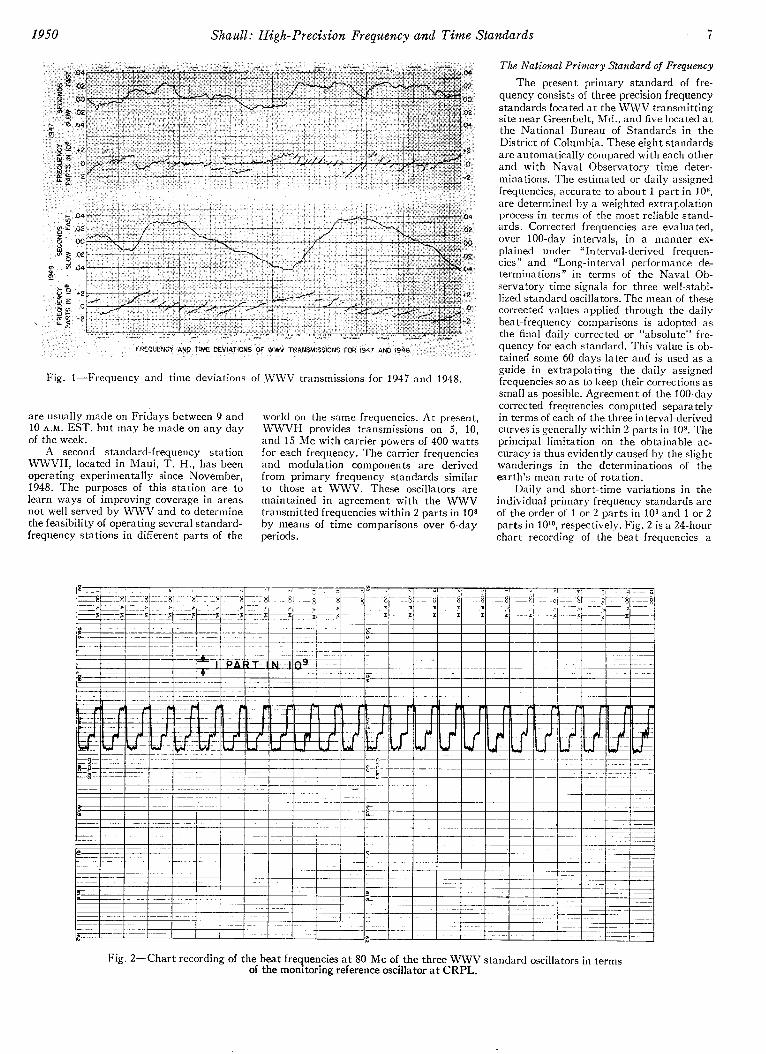
Daily and short-time variations in the individual primary frequency standards are of the order of 1 or 2 parts in 109 and 1 or 2 parts in 10’0, respectively. Fig. 2 is a 24-hour chart recording of the beat frequencies a
Fig. 2-Chart recording of the beat frequencies at 80 Mc of the three WWV standard oscillators in terms of the monitoring reference oscillator at CRPL.
8 PROCEEDINGS OF THE I.R.E. January
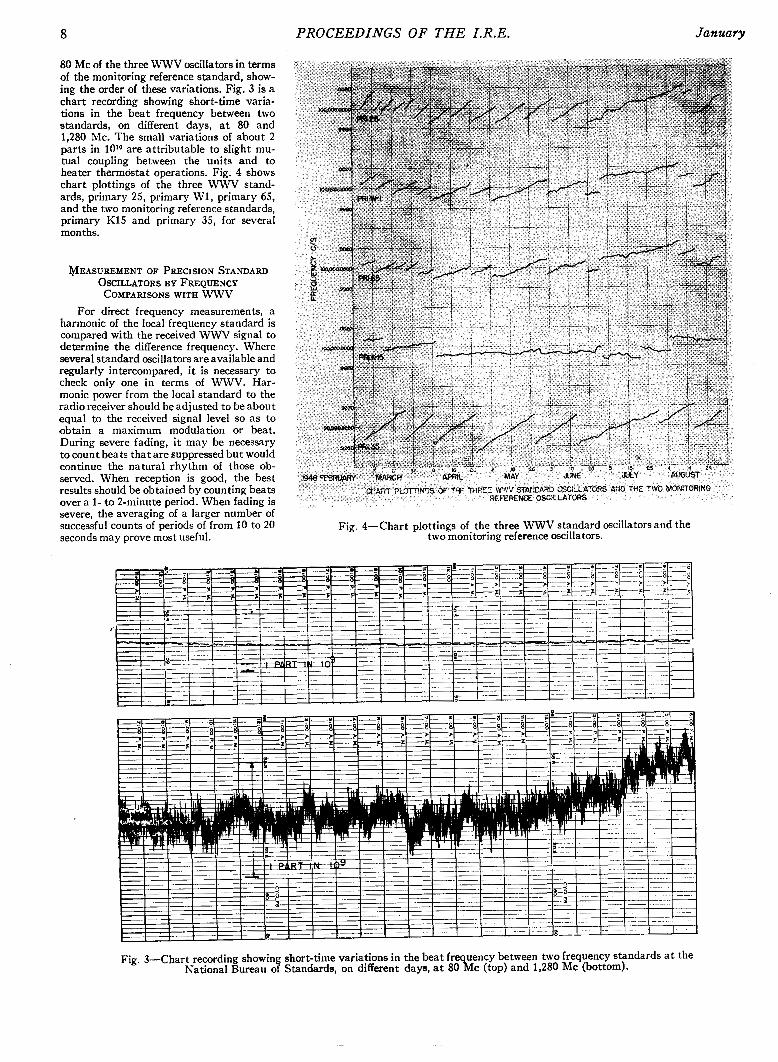
80 Mc of the three WWV oscillators in terms of the monitoring reference standard, show- ing the order of these variations. Fig. 3 is a chart recording showing short-time varia- tions in the beat frequency between two standards, on different days, at 80 and 1,280 Mc. The small variations of about 2 parts in 1Olo are attributable to slight mu- tual coupling between the units and to heater thermostat operations. Fig. 4 shows chart plottings of the three WWV stand- ards, primary 25, primary W1, primary 65, and the two monitoring reference standards, primary K15 and primary 35, for several months.
WEASUREMENT OF PRECISION STANDARD OSCILLATORS BY FREQUENCY COMPARISONS WITH WWV
For direct frequency measurements, a harmonic of the local frequency standard is compared with the received WWV signal to determine the difference frequency. Where several standard oscillators are available and regularly intercompared, i t is necessary to check only one in terms of WWV. Har- monic power from the local standard to the ra.dio receiver should be adjusted to be about equal to the received signal level so as to obtain a maximum modulation or beat. During severe fading, i t may be necessary to count beats that are suppressed but would continue the natural rhythm of those ob- served. When reception is good, the best results should be obtained by counting beats over a 1- to 2-minute period. When fading is severe, the averaging of a larger number of successful counts of periods of from 10 to 20 seconds may prove most useful.
Fig. 4-Chart plottings of the three WWV standard oscillatorsand the two monitoring reference oscillators.
Fig. 3-Chart recording showing short-time variations in the beat fre uency between two frequency standards a t the National Bureau of Standards, on different days, at 8 0 % ~ (top) and 1,280 Mc (bottom).
1950 Shaull: High-Precision Frequency and Time Standards 9
I ’ I 1 1 1 I I j - - - ~~
I I ! I I I
140 120 100 eo 6 0 40
I20 140 160
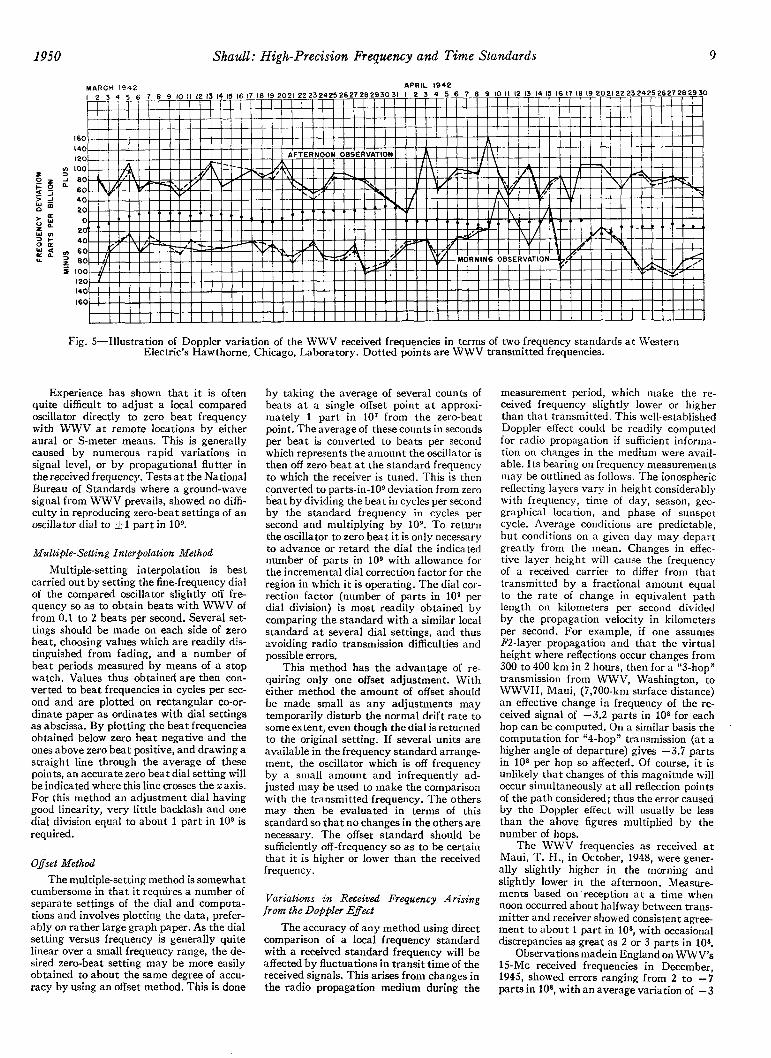
Fig. 5-Illustration of Doppler variation of the WWV received frequencies in terms of two frequency standards a t Western Electric’s Hawthorne, Chicago, Laboratory. Dotted points are WWV transmitted frequencies.
Experience has shown that i t is often quite difficult to adjust a local compared oscillator directly to zero beat frequency with WWV a t remote locations by either aural or S-meter means. This is generally caused by numerous rapid variations in signal level, or by propagational flutter in the received frequency. Tests a t the National Bureau of Standards where a ground-wave signal from WWV prevails, showed no diffi- culty in reproducing zero-beat settings of an oscillator dial to _+ 1 part in lo9.
Multiple-Setting Interpolation Method Multiple-setting interpolation is best
carried out by setting the fine-frequency dial of the compared oscillator slightly off fre- quency so as to obtain beats with WWV of from 0.1 to 2 beats per second. Several set- tings should be made on each side of zero beat, choosing values which are readily dis- tinguished from fading, and a number of beat periods measured by means of a stop watch. Values thus obtained are then con- verted to beat frequencies in cycles per sec- ond and are plotted on rectangular co-or- dinate paper as ordinates with dial settings as abscissa. By plotting the beat frequencies obtained below zero beat negative and the ones above zero beat positive, and drawing a straight line through the average of these points, an accurate zero beat dial setting will be indicated where this line crosses the x axis. For this method an adjustment dial having good linearity, very little backlash and one dial division equal to about 1 part in lo9 is required.
Offset Method The multiple-setting method is somewhat
cumbersome in that i t requires a number of separate settings of the dial and computa- tions and involves plotting the data, prefer- ably on rather large graph paper. As the dial setting versus frequency is generally quite linear over a small frequency range, the de- sired zero-beat setting may be more easily obtained to about the same degree of accu- racy by using an offset method. This is done
by taking the average of several counts of beats a t a single offset point a t approxi- mately 1 part in 107 from the zero-beat point. The average of these counts in seconds per beat is converted to beats per second which represents the amount the oscillator is then off zero beat a t the standard frequency to which the receiver is tuned. This is then converted to parts-in-lOg deviation from zero beat by dividing the beat in cycles per second by the standard frequency in cycles per second and multiplying by 109. To return the oscillator to zero beat i t is only necessary to advance or retard the dial the indicated number of parts in 109 with allowance for the incremental dial correction factor for the region in which i t is operating. The dial cor- rection factor (number of parts in 109 per dial division) is most readily obtained by comparing the standard with a similar local standard at several dial settings, and thus avoiding radio transmission difficulties and possible errors.
This method has the advantage of re- quiring only one offset adjustment. With either method the amount of offset should be made small as any adjustments may temporarily disturb the normal drift rate to some extent, even though the dial is returned to the original setting. If several units are available in the frequency standard arrange- ment, the oscillator which is off frequency by a small amount and infrequently ad- justed may be used to make the comparison with the transmitted frequency. The others may then be evaluated in terms of this standard so that no changes in the others are necessary. The offset standard should be sufficiently off -frequency so as to be certain that it is higher or lower than the received frequency.
Variations i n Received Frequency Arising from the Doppler Efect
The accuracy of any method using direct comparison of a local frequency standard with a received standard frequency will be affected by fluctuations in transit time of the received signals. This arises from changes in the radio propagation medium during the
measurement period, which make the re- ceived frequency slightly lower or higher than that transmitted. This well-established Doppler effect could be readily computed for radio propagation if sufficient informa- tion on changes in the medium were avail- able. Its bearing on frequency measurements may be outlined as follows. The ionospheric reflecting layers vary in height considerably with frequency, time of day, season, geo- graphical location, and phase of sunspor cycle. Average conditions are predictable, but conditions on a given day may depart greatly from the mean. Changes in effec- tive layer height will cause the frequency of a received carrier to differ from that transmitted by a fractional amount equal to the rate of change in equivalent path length on kilometers per second divided by the propagation velocity in kilometers per second. For example, if one assumes n - l a y e r propagation and that the virtual height where reflections occur changes from 300 to 400 km in 2 hours, then for a “3-hop” transmission from WWV, Washington, to WWVH, Maui, (7,700-km surface distance) an effective change in frequency of the re- ceived signal of -3.2 parts in lo8 for each hop can be computed. On a similar basis the computation for “4-hop” transmission (at a higher angle of departure) gives -3.7 parts in 108 per hop so affected. Of course, i t is unlikely that changes of this magnitude will occur simultaneously at all reflection points of the path considered; thus the error caused by the Doppler effect will usually be less than the above figures multiplied by the number of hops.
The WWV frequencies as received at Maui, T. H., in October, 1948, were gener- ally slightly higher in the morning and slightly lower in the afternoon. Measure- ments based on reception a t a time when noon occurred about halfway between trans- mitter and receiver showed consistent agree- ment to about 1 part in 108, with occasional discrepancies as great as 2 or 3 parts in 108.
Observations madein England on WWV’s 15-Mc received frequencies in December, 1945, showed errors ranging from 2 to -7 parts in 108, with an average variation of -3

10 PROCEEDINGS OF THE I.R.E. January
parts in 108 when compared with very stable primary frequency standards.6 Similar meas- urements reported by Booth and Gregory showed slightly greater variations6 Fig. 5 shows the variation in WWV’s 5-Mc received frequency at Western Electric’s Hawthorne, Chicago, Laboratory in terms of two pre- cision frequency standards. I t is evident that high-accuracy measurements of fre- quency in terms of WWV should be made when ionospheric layer heights are likely to be most stable, Le., with noon or midnight prevailing a t about halfway between trans- mitter and receiver locations. Long-distance north-south transmission may be expected to show greater variations in the morning and afternoon where all of the reflection points are subject to changing conditions a t the same time. Long-distance comparisons should, in most cases, prove most reliable when lower angles and fewer modes of propa- gation prevail. However, one should par- ticularly avoid use of a frequency and time where a dominant mode of transmission is very near the maximum usable frequency a t the propagation angle for any of the reflec- tion points, as the effective layer height changes very rapidly under these conditions. I t should be mentioned that errors other than those attributed to the Doppler effect were occasionally found psssibile.
Publications of the National Bureau of Standards are available which are useful in determining the optimum reception frequen- cies a t a given time and location.’*8
MEASUREMENT OF PRECISION STANDARD OSCILLATORS BY DAILY TIME
COMPARISONS WITH WWV
The average frequency of a standard oscillator may be determined by successively comparing the number of cycles generated (time kept by its synchronously-operated clock) with any sufficiently reliable time signals. If the standard’s drift rate or grad- ual change in frequency is assumed to be constant, its average frequency during the period will be the same as the instantaneous frequency for the center of the period con- sidered. Departures from a constant or uni- form frequency drift can be detected by this method only by successive determinations of frequency, and only then if the reference time source is known to be extremely accu- salte. When using time signals transmitted by radio over long distances (sky-wave prop- agation), slight errors will result because of variations in the time of transmission of as much as several milliseconds under adverse conditions. For this reason frequency deter- minations based on time comparisons of less than about two days may be in greater error than direct-frequency comparisons with transmitted standard frequencies.
5 H. V. Griffiths, “Doppler effect in propagation.’
8 C. F. Booth and G. Gregory, ‘ h e effect of Dop- Wireless Eng.. vol. 24. pp. 162-161. June, 1947.
pler’s principle on the comparison of standard fre- quencies over a transatlantic radio path,’ Post Ofice El- Eng Jour. vol. 40. pp. 153-158. January. 1948.
r’aIonospheric radio p~opapation,” Circular 462. issued June 25. 1948. available from Superintendent nf Documents. Government Printinn Office. Wash- &%n-25. D.%. (price $1.00: foreign-$1.25).
.Basic radio propagation predictions.” CRPL-D series monthly. three months in advance) available on subAption (price $1.00 yearly. foreign $1.25). from Superintendent of Documents. Government Printing
IntervatDerived Frequency Determinations The computation of average frequency
by time comparisons may be explained by the following equations:
tz - h f,” = fo - Tz - Ti
where fo is the nominal frequency of the os- cillator, Le., that frequency for which the frequency division ratios were chosen; t , , t z and TI, TZ represent the time indicated by the clock, and the correct time represented by the time signals respectively a t the be- ginning and end of the period beingaveraged.
Equation (1) is usually simplified in actual use by referring all measurements to days or multiples thereof and by using measured errors in time indicated by a crystal clock. For example, the average frequency of a 100-kc standard oscillator during interval Tis
where At1 and At2 are positive or negative errors in time at beginning and end of the measurement period. The value obtained represents the instantaneous frequency for the center of the period, if uniform drift is assumed, or the value for the entire period if no change in frequency during the entire period is assumed. Instantaneous departures from the average values are generally deter- mined by daily comparisons with other os- cillators, involving an averaging based on their predicted daily drifts. This is justified by the probability that the average of the drifts of a number of selected oscillators will be more nearly linear than the drift of any oneunit. .
Daily measurements of time differences or errors between standard clocks and time signals may be accomplished by adjustment of a calibrated phase shifter dial for pulse coincidence on an oscilloscope screen or by use of calibrated circular or linear sweeps on the oscilloscope. A recording chronograph may also be used to get a continuous record of the time differences of several standard clocks and time signals.
Clock Acceleration In order to determine the amount of time
a crystal clock will gain or lose over a long period i t is necessary to consider the effect of the change in frequency (and thus the change in rate of the clock) over the period. For very long intervals i t is even necessary to consider the change in the drift rate of the oscillator (change in the change of rate of the clock).
The time a crystal clock will indicate a t some future time TI a t t days distant is:
where at represents the “rate” term, btz the acceleration term, and ct3 the change in ac- celeration term.
The terms To and t are always positive. Coefficient ‘a’ may be positive or negative, and is the principal factor in determining the overall rate of the clock over short pe- riods. Coefficient ‘b’ isgenerally positive, and must be considered for periods of more than a few days. Coefficient ‘c’ is very small and is generally negative. I t may be neglected in all but very long-time computations.
The above equation may be more readily understood if times To, TI, Tz, etc., are con- sidered as marking off an absolute, continu- ous time scale, with the expression t+at+ bt2-flct3 marking off the distance covered by the clock on this time scale in t days. This may be recognized as the well-known equa- tion for linear motion. Usually t+at is com- bined and considered as the velocity term, but for horological purposes i t is more con- venient to keep these two terms separate. Horologists express the “rate” of a clock as the seconds gained or lost per day.
Fig. 6 shows the computed daily change in time of a crystal clock for a uniform daily change in frequency of 1 part in loD per day. The clocks are usually set slightly fast in such manner as to lose time, and become slightly slow as the oscillator passes through correct frequency. As the oscillator becomes high in frequency, this time is regained to approximately the original setting when the oscillator frequency is about 1 part in lo7 high. The oscillator is then adjusted low again and the cycle repeated, this adjust-
TI To + 1 + at 3- bt2 + d 3 (3)
FREQUENCY = 99,999.9900+ 1x10⁻⁹ PER DAY
TiME=To + o t t b t 2 o =RATE OF CLOCK AT
BEGINNING OF PERIOD
b = ACCELERATION OF CLOG$ PER DAY.
(ACCELERATION = FRACTIONAL DAILY CHANGE IN OSCILLATOR FREQENCY PER DAY.)
Fig. 6-Frequency-time graphs showing clock acceleration for a daily change of frequency of +1 part in lo9. M c e . Washington 25. D. C.
1950 Shaull: High-Precision Frequency and Time Standards 11
ment being required about once or twice per year to maintain frequency limits of + 1 part in lo7. Propagation Delay of T i m e Signals
Changes in the height of the ionosphere layers by which time signals or seconds pulses are received, or propagation by dif- ferent layers or numbers of hops on succes- sive measurement periods will introduce vari- able delay in the time of reception. The amount of time delay introduced by trans- mission time may be computed if the mode of transmission is known or assumed. This delay is nearly 1 millisecond per 186 miles of actual transmission path length. The differ- ence in reception time for signals propagated by various modes and going only one way around the earth is seldom greater than a few milliseconds. By observing the earliest consistently received pulses over a short period, this may be generally reduced to less than 1 millisecond.
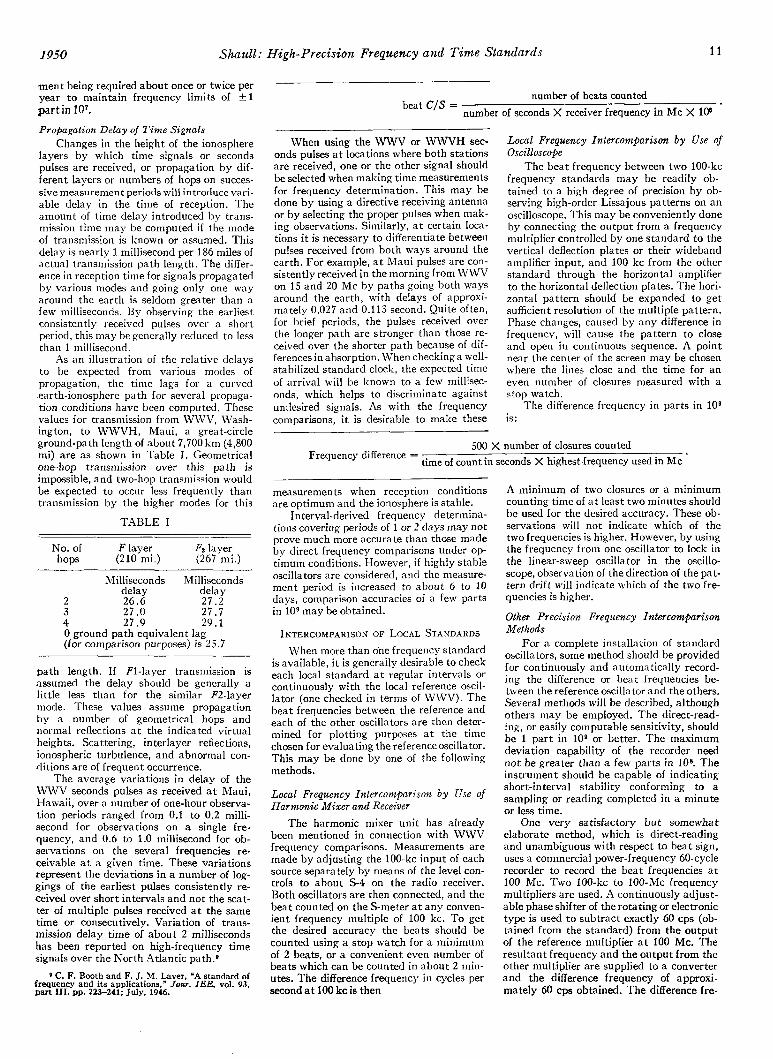
As an illustration of the relative delays to be expected from various modes of propagation, the time lags for a curved earth-ionosphere path for several propaga- tion conditions have been computed. These values for transmission from WWV, Wash- ington, to WWVH, Maui, a great-circle ground-path length of about 7,700 km (4,800 mi) are as shown in Table I. Geometrical one-hop transmission over this path is impossible, and two-hop transmission would be expected to occur less frequently than transmission by the higher modes for this
TABLE I
No. of F layer FZ layer hops (210 mi.) (267 mi.)
Milliseconds Milliseconds delay delay
2 26.6 27.2 3 27 .O 2 7 I 7 4 27.9 29.1 0 ground path equivalent lag (for comparison purposes) is 25.7
path length. If F1-layer transmission is assumed the delay should be generally a little less than for the similar F2-layer mode. These values assume propagation by a number of geometrical hops and normal reflections a t the indicated virtual heights. Scattering, interlayer reflections, ionospheric turbulence, and abnormal con- ditions are of frequent occurrence.
The average variations in delay of the WWV seconds pulses as received a t Maui, Hawaii, over a number of one-hour observa- tion periods ranged from 0.1 to 0.2 milli- second for observations on a single fre- quency, and 0.6 to 1.0 millisecond for ob- servations on the several frequencies re- ceivable a t a given time. These variations represent the deviations in a number of log- gings of the earliest pulses consistently re- ceived over short intervals and not the scat- ter of multiple pulses received a t the same time or consecutively. Variation of trans- mission delay time of about 2 milliseconds has been reported on high-frequency time signals over the North Atlantic path.9
9 C. F. Booth and F. J. M. Laver, "A standard of frequency and its applications." Jour. IEE. vol. 93. part 111, pp. 223-241; July, 1946.
number of beats counted number of seconds X receiver frequency in Mc X 1V heat C/S =
When using the WWV or WWVH sec- onds pulses at locations where both stations are received, one or the other signal should be selected when making time measurements for frequency determination. This may be done by using a directive receiving antenna or by selecting the proper pulses when mak- ing observations. Similarly, at certain loca- tions i t is necessary to differentiate between pulses received from both ways around the earth. For example, a t Maui pulses are con- sistently received in the morning from WWV on 15 and 20 Mc by paths going both ways around the earth, with delays of approxi- mately 0.027 and 0.113 second. Quite often, for brief periods, the pulses received over the longer path are stronger than those re- ceived over the shorter path because of dif- ferences in absorption. When checking a well- stabilized standard clock, the expected time of arrival will be known to a few millisec- onds, which helps to discriminate against undesired signals. As with the frequency comparisons, i t is desirable to make these
Local Frequency Intercomparison by Use of Oscilloscope
The beat frequency between two 100-kc frequency standards may be readily ob- tained to a high degree of precision by ob- serving high-order Lissajous patterns on an oscilloscope. This may be conveniently done by connecting the output from a frequency multiplier controlled by one standard to the vertical deflection plates or their wideband amplifier input, and 100 kc from the other standard through the horizontal amplifier to the horizontal deflection plates. The hori- zontal pattern should be expanded to get sufficient resolution of the multiple pattern. Phase changes, caused by any difference in frequency, will cause the pattern to close and open in continuous sequence. A point near the center of the screen may be chosen where the lines close and the time for an even number of closures measured with a stop watch.
The difference frequency in parts in lo9 is:
500 X number of closures counted time of count in seconds X highest frequency used in Mc Frequency difference =
measurements when reception conditions are optimum and the ionosphere is stable.
Interval-derived frequency determina- tions covering periods of 1 or 2 days may not prove much more accurate than those made by direct frequency comparisons under op- timum conditions. However, if highly stable oscillators are considered, and the measure- ment period is increased to about 6 to 10 days, comparison accuracies of a few parts in 109 may be obtained.
INTERCOMPARISON OF LOCAL STANDARDS When more than one frequency standard
is available, i t is generally desirable to check each local standard a t regular intervals or continuously with the local reference oscil- lator (one checked in terms of WWV). The beat frequencies between the reference and each of the other oscillators are then deter- mined for plotting purposes a t the time chosen for evaluating the reference oscillator. This may be done by one of the following methods.
Local Frequency Intercomparison b y Use of Harmonic Mixer and Receiver
The harmonic mixer unit has already been mentioned in connection with WWV frequency comparisons. Measurements are made by adjusting the 100-kc input of each source separately by means of the level con- trols to about S-4 on the radio receiver. Both oscillators are then connected, and the beat counted on the S-meter a t any conven- ient frequency multiple of 100 kc. To get the desired accuracy the beats should be counted using a stop watch for a minimum of 2 beats, or a convenient even number of beats which can be counted in about 2 min- utes. The difference frequency in cycles per second at 100 kc is then
A minimum of two closures or a minimum counting time of a t least two minutes should be used for the desired accuracy. These ob- servations will not indicate which of the two frequencies is higher. However, by using the frequency from one oscillator to lock in the linear-sweep oscillator in the oscillo- scope, observation of the direction of the pat- tern drift will indicate which of the two fre- quencies is higher.
Other Precision Frequency Intercomparison Methods
For a complete installation of standard oscillators, some method should be provided for continuously and automatically record- ing the difference or beat frequencies be- tween the reference oscillator and the others. Several methods will be described, although others may be employed. The direct-read- ing, or easily computable sensitivity, should be 1 part in 109 or better. The maximum deviation capability of the recorder need not be greater than a few parts in lo8. The instrument should be capable of indicating short-interval stability conforming to a sampling or reading completed in a minute or less time.
One very satisfactory but somewhat elaborate method, which is direct-reading and unambiguous with respect to beat sign, uses a commercial power-frequency 60-cycle recorder to record the beat frequencies at 100 Mc. Two 100-kc to 100-Mc frequency multipliers are used. A continuously adjust- able phase shifter of the rotating or electronic type is used to subtract exactly 60 cps (ob- tained from the standard) from the output of the reference multiplier a t 100 Mc. The resultant frequency and the output from the other multiplier are supplied to a converter and the difference frequency of approxi- mately 60 cps obtained. The difference fre-

12 PROCEEDINGS OF THE I.R.E. January
quency is amplified and supplied to the 58 to 62 cps frequency recorder so that the 60- cycle point represents zero difference fre- quency. This gives a continuous record of the difference frequency to a sensitivity of a few parts in 1010 with a range of +2 parts in 108. The other oscillators can be switched on successively in rotation to record the deviation of each one in terms of the refer- ence oscillator.
A variation of this method which is cur- rently used at National Bureau of Stand- ards is to set the reference oscillator approxi- mately 60 parts low in 100 million, which gives a recordable difference frequency without the use of the phase-shifting mech- anism. This method has the disadvantage of putting the reference off frequency by an amount making i t unusable for many pur- poses.
The difference frequency between two standard oscillators may be determined by accurately measuring the time required to complete one beat at the fundamental or a multiplied harmonic of each standard. A method for doing this has been described by H. B. Law, and is used by the British Post Office and the National Physical Lab- oratory for the comparison of precision fre- quency standards.10 A balanced phase dis- criminator is supplied with two 100-kc fre- quencies and arranged to trigger a counter chronometer a t the beginning and ending of one beat. The chronometer counts a conven- ient standard frequency (100 or 10 kc) and thus indicates the elapsed time of one beat. The instrument accuracy under ideal con- ditions is estimated to be 1 part in 10”.
Two electronic counter chronometers may be used in a number of ways to obtain accurate comparison data between standard oscillators. A general method uses one in- strument to count the difference or beat frequency between high harmonics of the two compared frequencies, while a second instrument counts cycles of appropriate standard frequency. One unit may be ad- justed to serve as a predetermined counter to stop the other unit after a definite count and thus increase the accuracy somewhat. This method of frequency measurement is very flexible and can be used to measure frequencies which fall outside the limits of other very sensitive measurement devices.
A very simple but accurate method of recording low beat frequencies such as ob- tained from the harmonic mixer and receiver comparison method is to use a recording milliammeter or recording oscillograph. The beats are then evaluated in terms of uniform chart speed or time markers recorded simul- taneously. This method offers comparative simplicity for temporary or experimental use, but is quite laborious where a number of readings are required over a long period of time.
RECORDING AND EVALUATION OF DATA The amount of statistical data taken on
each standard should be kept to the mini- mum necessary to determine the probable performance of each individual unit over a continuous period. The chief reason for
10 H. B. Law, ‘An tnspment for short-period fre- quency comparisons of great accuracy,” Jour. I E E vol. 94, part 111. pp. 3841: January, 1947.
taking such data on a number of standards is to determine the most suitable one for use, and to determine its short-time stability in terms of the other available standards. When such a standard is used to control standard-frequency transmissions or to make high-precision calibrations, i t should be monitored continuously against one or more similar standards.
As a result of experience gained in the operation of frequency-standard oscillators a t the National Bureau of Standards and in particular a t the WWVH, Maui, T. H., transmitting station, i t may be helpful to outline maintenance, procedures and tech- niques that have been developed and found useful in this work.
Logging and Plotting of Data
At the NBS it has been found necessary to keep a daily record which includes all frequency and time readings and measure- ments, as well as the final results of all com- putations of frequency and time. Changes in control standard, methods, or equipment are always noted. These data are conveniently kept in a record book having a number of ruled columns, or on specially prepared mineographed sheets carrying the desired notations for a particular installation.
The daily computed frequencies for each oscillator are plotted on continuous cross- section paper in a manner as shown in Fig. 4. These data are of considerable aid in studying the relative performance of the individual standards, and in graphically extrapolating predicted values during peri- ods when reception conditions do not permit making the daily frequency or time checks.
I t has been found desirable to keep peri- odic (weekly) instrument readings which include the readings of all battery chargers and power supplies, voltmeter readings on each switch position for the frequency stand- ards and frequency dividers, temperature readings of each standard’s oven where ap- plicable, and room temperature a t time of readings. These readings are useful in anti- cipating tube or equipment failure in that adjustment or repair can often be made be- fore complete breakdown occurs.
Adjustments in Frequency and Time
Periodic adjustments in frequency and time of each standard oscillator and time equipment are required to keep within the desired accuracy tolerance and to simplify the measuring and plotting requirements. The frequency and range of these adjust- ments are influenced considerably by the type of service and standard. For greatest constancy of drift rate and greatest ease in computation, frequency adjustments should be held to a minimum. For many uses the calculation of and allowance for the slight error in frequency or time presents no great difficulty. In other cases, where numerous measurements are being made and services given, it is helpful to establish high initial accuracy so as to eliminate corrections.
Where the working standard (one used or distributed) is held to very close accuracy tolerance, the continuity of service required will determine if the second or standby standard need be held to a similar close toler-
ance. If continuity of service is only of mod- erate importance, two equipments may be infrequently adjusted and only the working unit held within very precise limits. The OS-
cillator and time equipment least adjusted should be generally used as the reference or one by which frequency and time determina- tions are made with respect to WWV. For most purposes an adjustment of the working standard so as to hold its frequency within 1 or 2 parts in 108 of WWV’s average fre- quency should prove satisfactory, with the standby and spare oscillators being held to a frequency tolerance of 1 part in 107.
Daily phase shifter (time) adjustments may be made if time synchronization is de- sired, and these daily changes used in com- puting interval-derived frequencies. Allow- ance should be made for transmission time lag in setting or using the local time pulses, if extremely precise time synchronization is important.
Short-Interval Performance
High-precision standard-frequency os- cillators now in use have short-period sta- bilities (intervals of one minute or so) rang- ing from 1 part in log to 1 part in 10’0. In addition to the gradual ageing or drift, various causes will contribute to these short- time frequency fluctuations. Mechanical shock may cause an instantaneous effect through easing of stresses or displacements in the crystal unit or associated components. A slow recovery in frequency may or may not take place. A change in supply voltage produces an immediate effect followed by additional changes as thermal equilibrium is restored. Changes in load impedance will cause frequency variations unless proper decoupling is employed. Unless proper ther- mal lagging is provided for the crystal com- partment cyclic operations of its heaters will also causevariationsin the output frequency. The oscillator circuits must be protected from direct or electromagnetic mutual coupling to better than 100 db to reduce frequency “pulling” or tendency to syn- chronize. Other changes in frequency, often of unpredictable source, may be caused by imperfect connections, faulty components or erratic vacuum tubes. These causes of poor frequency stability can generally be eliminated only by a slow process of substi- tution and observation.
Where average frequencies are computed for periods of more than a few days, the daily values may be determined by calculating the departure of the reference standard from its average curve in terms of the other reli- able standards available. The daily values for the other standards may then be deter- mined by adding the daily beat frequencies for each standard to the computed value for the reference. The mean values of relative frequencies thus obtained represent a weighted extrapolation in terms of the se- lected group of reliable standards. Consid- erations involving three independent reli- able standards should give a relative daily accuracy within 2 parts in log. The inclusion of six or more standards, as is done in the CRPL primary standard of frequency, re- sults in a relative daily determination of performance of each standard oscillator to within 1 part in los. Very-short period or

1950 Shaull: High-Precision Frequency and Time Standards 13
“instantaneous” stability may be deter- mined by intercomparing pairs of standard oscillators by high-precision automatic re- cording equipment.
Long-Interval Performance Determinations
The determination of deviations over periods of months and years is complicated and obscured by the fact that the earth’s mean rate of rotation (even after applica- tion of a number of established corrections) is not uniform. Changes in the length of the apparent day as large as 4 or 5 milliseconds, equivalent to a frequency change of about 1 part in 20 million, are believed to have OC-
curred on several occasions within the last half-century. These changes occur a t rather irregular intervals and in varying amounts and are, as yet, unpredictable. They are evidenced by an accumulation of error in the earth’s observed angular position coni- pared with theoretically predictable astro- nomical events.
Smaller variations, with periods of sev- eral weeks to slightly more than a year, are noted when comparing the earth’s observed time with high-precision crystal clocks. Un- til very recently these variations were at- tributed almost entirely to clock discrepan- cies. Agreement of a number of precision clocks and technical improvements in meth- ods of observing and recording star transits indicate that the earth’s rate of rotation is subject to a number of more or less random small variations which add up to as much as several milliseconds per day a t times. The probable error of a single time determination in terms of a number of star sights is believed to be not greater than several milliseconds and such errors are not cumulative. Some of the time variations are caused by rather irregubr wanderings of the earth’s poles by as much as 30 feet with a principal compo- nent having a period of slightlymore thana year. Observational errors, caused by this variation in longitude (which would be zero a t the equator) amount to as much as +20 and 30 milliseconds at the Washington and Greenwich observatories, respectively. These variations may be corrected by applying re- sults of observations of latitude variation a t a number of locations and computing the equivalent changes in longitude. The intri- cacies of time determination in terms of the earth’s rate and the conversion from ob- served sidereal to mean solar time have been discussed by H. Spencer Jones, British Astronomer Royal.”
Another factor, although of no imme- diate concern in determining frequency, is the gradual slowing down of the earth’s rate of rotation, chiefly because of tidal friction. This deceleration over the past 2,000 years averages about 0.0016 second per day per century, which amounts to an accumulated time difference of 2 9 F seconds for a mean solar clock considered as having zero rate a t 1900 A.D., where T i s the number of centur- ies from 1900.’* At present the deceleration is estimated a t approximately 0.001 second/
11 H. Spencer Jones. “The measurement of time.” Endeavour vol. 4. pp. 123-130. October 1945.
u G. M. Clemence, ‘On the batem of‘astronomical constants.” Astronomical Jour.. vol. 53, pp. 169-179; May, 1948.
Fig. 7-Chart plottings illustrating graphical method of determining final or absolute frequencies.
day/century, which amounts to an average apparent increase in frequency of about 1 part in 108 per century for an absolutely constant oscillator if measured in terms of the earth’s rate of rotation.
The G T wire-supported crystals of the type widely used a t present have initial drift rates of 2 to 4 parts in IO8 per day for unaged units, and 1 to 2 parts in lo9 per day for units a year old. The drift varies approxi- mately inversely with time for several years, and may thus be predicted and allnwances made accordingly.
I n the primary standard of frequency of the National Bureau of Standards, three well-stabilized oscillators are evaluated over 100-day periods in terms of Naval Observa- tory time corrections. ’This is done as shown in Fig. 7. The dotted points for each day re- present the departures from the average curve in terms of the entire group of selected standards as explained previously. The dashed curve represents the average of 101 daily values including 50 before and 50 after the day plotted. These are computed each 10 days and connected by a smooth curve. The solid curve represents the 100-day inter- val-derived average frequency computed for each day. The final corrected frequency, for this standard only, is then the daily plotted value of the interval derived (solid) curve plus the algebraic departure of the daily assigned (dotted point) value from the daily average (dashed) curve. A displacement of more than 1 part in 108 between these two curves indicates that the daily drift rates should be reassessed and the dotted points replotted to bring the two curves more nearly into agreement.
For a 100-day averaging period the daily assigned curves must thus be extrapolated or guided on the basis of past performance for about 60 days in advance of the established average curves. For this reason, a temporary 20-day interval-derived curve is computed as an aid in systematically determining the daily assigned values. Users of the WWV time signal transmissions in the field for average frequency determinations thus have the advantage of the long averaging period applied to the WWV frequency determina- tions. They may, therefore, approach the full limit of accuracy (1 part in 50 million) by using these signals over intervals of 6 to 10 days to compute average frequencies without knowledge of the time or extent of WWV frequency adjustments. If these ad- justment data are known, accuracies several times this order are generally possible.
The corrected daily frequency for the reference oscillator is computed in terms of each of these three oscillators so evaluated by adding algebraically the respective daily beat differences to their corrected values. The mean of these computed frequencies is then taken as the final or “absolute” value of the reference for each day. Should one of the three values disagree excessively with the other two for explainable reasons, only two values are averaged. The values so computed generally agree within 1 or 2 parts in 109, which represents the residual error in the graphical method and the unpredictable random deviation of the daily assigned sam- pled values from the daily mean frequencies. The daily “absolute” frequencies for each of the other standards are obtained by alge- braically adding their daily beat differences
1 4 PROCEEDINGS O F THE I.R.E. January
!.O 4 0
3 W
z a I?
a Y
I-
W J
.s a 2 8
0
DRIVING CURRENT (!J A)
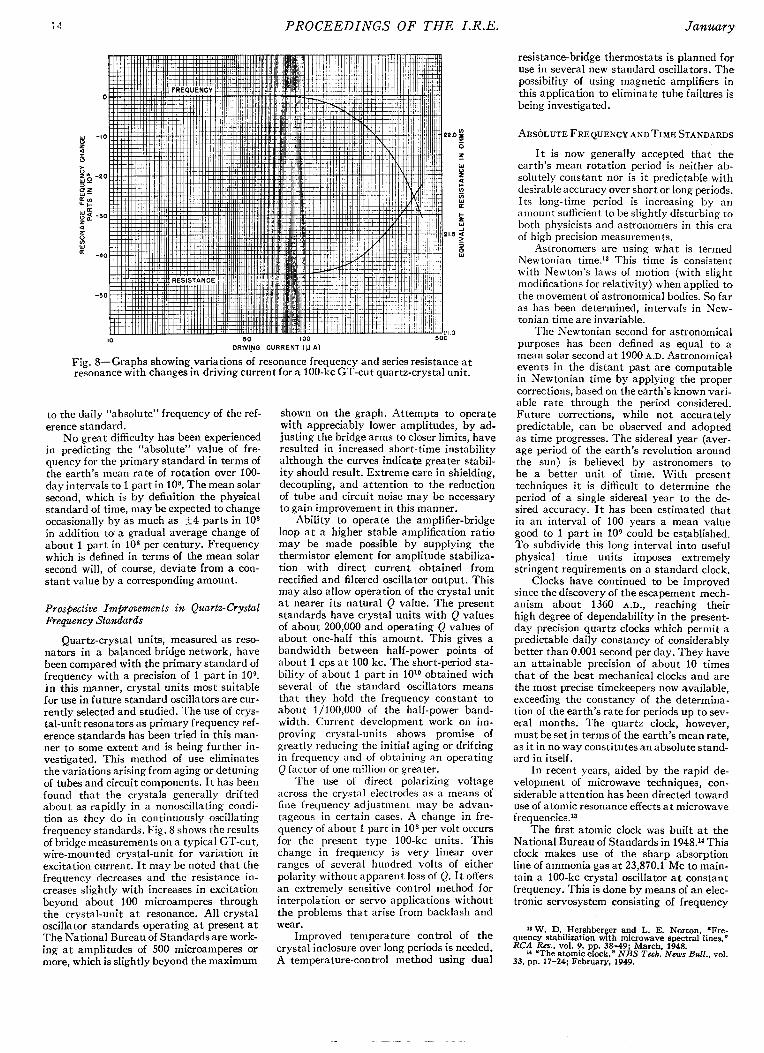
Fig. 8-Graphs showing variations of resonance frequency and series resistance a t resonance with changes in driving current for a 100-kc GT-cut quartz-crystal unit.
to the daily “absolute” frequency of the ref- erence standard.
No great difficulty has been experienced in predicting the “absolute” value of fre- quency for the primary standard in terms of the earth’s mean rate of rotation over 100- day intervals to 1 part in lo8. The mean solar second, which is by definition the physical standard of time, may be expected to change occasionally by as much as +4 parts in 108 in addition to a gradual average change of about 1 part in lo8 per century. Frequency which is defined in terms of the mean solar second will, of course, deviate from a con- stant value by a corresponding amount.
Prospective Improvements i n Quartz- Crystal Frequency Standards
Quartz-crystal units, measured as reso- nators in a balanced bridge network, have been compared with the primary standard of frequency with a precision of 1 part in lo9. in this manner, crystal units most suitable for use in future standard oscillators are cur- rently selected and studied. The use of crys- tal-unit resonators as primary frequency ref- erence standards has been tried in this man- ner to some extent and is being further in- vestigated. This method of use eliminates the variations arising from aging or detuning of tubes and circuit components. I t has been found that the crystals generally drifted about as rapidly in a nonoscillating condi- tion as they do in continuously oscillating frequency standards. Fig. 8 shows the results of bridge measurements on a typical GT-cut, wire-mounted crystal-unit for variation in excitation current. I t may be noted that the frequency decreases and the resistance in- creases slightly with increases in excitation beyond about 100 microamperes through the crystal-unit a t resonance. All crystal oscillator standards operating at present at The National Bureau of Standards are work- ing a t amplitudes of 500 microamperes or more, which is slightly beyond the maximum
shown on the graph. Attempts to operate with appreciably lower amplitudes, by ad- justing the bridge arms to closer limits, have resulted in increased short-time instability although the curves indicate greater stabil- ity should result. Extreme care in shielding, decoupling, and attention to the reduction of tube and circuit noise may be necessary to gain improvement in this manner.
Ability to operate the amplifier-bridge loop a t a higher stable amplification ratio may be made possible by supplying the thermistor element for amplitude stabiliza- tion with direct current obtained from rectified and filtered oscillator output. This may also allow operation of the crystal unit a t nearer its natural Q value. The present standards have crystal units with Q values of about 200,000 and operating Q values of about one-half this amount. This gives a bandwidth between half-power points of about 1 cps a t 100 kc. The short-period sta- bility of about 1 part in 1O‘O obtained with several of the standard oscillators means that they hold the frequency constant to about 1/100,000 of the half-power band- width. Current development work on im- proving crystal-units shows promise of greatly reducing the initial aging or drifting in frequency and of obtaining an operating Q factor of one million or greater.
The use of direct polarizing voltage across the crystal electrodes as a means of fine frequency adjustment may be advan- tageous in certain cases. A change in fre- quency of about 1 part in lo8 per volt occurs for the present type 100-kc units. This change in freqpency is very linear over ranges of several hundred volts of either polarity without apparent loss of Q. I t offers an extremely sensitive control method for interpolation or servo applications without the problems that arise from backlash and wear.
Improved temperature control of the crystal inclosure over long periods is needed. A temperature-control method using dual
resistance-bridge thermostats is planned for use in several new standard oscillators. The possibility of using magnetic amplifiers in this application to eliminate tube failures is being investigated.
ABSOLUTE FREQUENCY ANDTIME STANDARDS
I t is now generally accepted that the earth’s mean rotation period is neither ab- solutely constant nor is i t predictable with desirable accuracy over short or long periods. Its long-time period is increasing by an amount sufficient to be slightly disturbing to both physicists and astronomers in this era of high precision measurements.
Astronomers are using what is termed Newtonian time.13 This time is consistent with Newton’s laws of motion (with slight modifications for relativity) when applied to the movement of astronomical bodies. So far as has been determined, intervals in New- tonian time are invariable.
The Newtonian second for astronomical purposes has been defined as equal to a mean solar second at 1900 A.D. Astronomical events in the distant past are computable in Newtonian time by applying the proper corrections, based on the earth’s known vari- able rate through the period considered. Future corrections, while not accurately predictable, can be observed and adopted as time progresses. The sidereal year (aver- age period of the earth’s revolution around the sun) is believed by astronomers to be a better unit of time. With present techniques it is difficult to determine the period of a single sidereal year to the de- sired accuracy. I t has been estimated that in an interval of 100 years a mean value good to 1 part in lo9 could be established. To subdivide this long interval into useful physical time units imposes extremely stringent requirements on a standard clock.
Clocks have continued to be improved since the discovery of the escapement mech- anism about 1360 A.D., reaching their high degree of dependability in the present- day precision quartz clocks which permit a predictable daily constancy of considerably better than 0.001 second per day. They have an attainable precision of about 10 times that of the best mechanical clocks and are the most precise timekeepers now available, exceeding the constancy of the determina- tion of the earth’s rate for periods up to sev- eral months. The quartz clock, however, must be set in terms of the earth’s mean rate, as i t in no way constitutes an absolute stand- ard in itself.
In recent years, aided by the rapid de- velopment of microwave techniques, con- siderable attention has been directed toward use of atomic resonance effects a t microwave frequencies.’3
The first atomic clock was built at the National Bureau of Standards in 1948.14 This clock makes use of the sharp absorption line of ammonia gas a t 23,870.1 Mc to main- tain a 100-kc crystal oscillator a t constant frequency. This is done by means of an elec- tronic servosystem consisting of frequency
18 W. D. Hershberger and L. E. Norton ‘Fre- quency stabilization with microwave spectral’lines.” RCA Rev. vol. 9, pp. 38-49. March 1948
14 ‘The atomic clock.” N h S T e c h . ’ N ~ ; B d l . . vol. 33. PP. 17-24; February, 1949.
1950 Shaull: High-Precision Frequency and Time Standards 15
multipliers, auxiliary frequency-modulated search oscillator, and pulse discriminator circuits. The 100 kc is then divided down to audio frequencies in conventional manner and used to operate a synchronous-motor clock as a time standard. A constancy in fre- quency of 5 parts in lo8 has been obtained for periods of several days with this experi- mental clock when compared with WWV frequency standards. Improvement of this type of standard and the development of more constant types of atomic resonance controlled oscillators are to be expected.
I t is shown in the references cited that the sharpness of resonance within indivitl- ual oscillating molecules is extremely great. Because of collisions of molecules with each other and with the gas cell walls, and the Doppler broadening attributable to natural thermal agitation, the practical working Q of an ammonia gas absorption line ranges Ijc- tween 50,000 and 500,000. ‘This compares favorably with the Q of quartz crystals used in frequency standards which ranges from 100,000 to 1,000,000. I t is thus reasonable to hope that a constancy of 1 part in loy to 1 part in lo9 may be obtained by proper refine- ments in circuitry and technique. Whether or not this degree of constancy of absolute value can be maintained without or even with precise temperature and pressure regu- lation remains to be investigated.
Civil time will, no doubt, continue tobe defined in terms of the mean solar second, as would ordinary frequency designations. After about 2,000 years, if the earth con- tinues to slow down a t its present rate, the mean solar second would be about 1 part i n 3 million longer than at present and the ac- cumulated time difference between mean
solar time and Newtonian time would amount to about three hours.
CONCLUSIONS Frequency and time standards, using
high-precision quartz crystals, are now avail- able which are capable of supplying fre- quencies and time intervals constant to considerably better than 1 part in lo8 per day. I n order to achieve an accuracy ap- proaching this order, these standards must be frequently checked in terms of standard frequency or time broadcasts. -4n accuracy of 1 part in lo8 represents about the limit obtainable in terms of the earth’s mean rate of rotation over a 100-day period. Longer periods of averaging can not be expected to give greatly improved accuracy, because of the possibility of slight oscillator frequency deviations and uncertainties in the uniform- ity of the determinations of the earth’s mean rate.
By using ordinary zero beating methods, a remote frequency standard may be ad- justed within 1 part in lo7 to WWV’s re- ceived frequency. Special offset techniques permit this setting error to be reduced to less than 1 part in lo8. Changes in the radio propagation medium may cause the received frequency to differ from that transmitted by as much as several parts in 107. By averaging a number of determinations made when noon or midnight prevails about halfway be- tween transmitter and receiver, long-dis- tance frequency comparisons can generally he made with a precision of better than 1 part in 108.
I he intercomparison of two remote os- cillators, constant to 1 or 2 parts in iog per day, by means of transmitted time pulses
,.
from one or both of the standards, is possible to a precision of a few parts in log through comparisons of average frequencies over periods of 6 or more days.
The development of atomic or molecular- resonance standards of high constancy and absolute accuracy may greatly simplify the maintenance of precise frequency and time standards. The practical realization of such standards, which seems reasonably probable in the near future, will eliminate the neces- sity of making highly precise physical meas- urements in terms of the earth’s variable rate of rotation. Such a standard would supply a tneans of studying more precisely the motions of the earth and other astro- nomical bodies.
Considerable \vorlc is being done to im- prove the constancy of quartz-crystal fre- quency standards, especially with regard to aging or frequency drift and improved tem- perature control methods.
I t is probable that frequency and time standards, which have improved by a factor of ten or more per decade in the last thirty years, will continue to reach new orders of accuracy and constancy. Hoxvever, these im- provements in accuracy will probably be re- ferred to a new kind of stantlard, rather than to the mean solar second.
ACKNOWLEDGMENTS
The author wishes to acknon ledge his in- debtedness for the valuable advice and as- sistance of W. D. George, Chief of the High- Frequency Standards Section of the Na- tional Bureau of Standards, and the many suggestions of V. E. Hea ton and E. L. Hall of the same organization.